Article

Engineering Critical Assessment of IMO Type C Tanks: A Comparative Study of Shell and Solid Element Models

1
Department of Naval Architecture and Ocean Engineering, Seoul National University, Seoul 08826, Republic of Korea
2
Department of Manufacturing System and Design Engineering, Seoul National University of Science and Technology, Seoul 01811, Republic of Korea
3
Department of Mechanical Engineering, Pukyong National University, Busan 48513, Republic of Korea
4
Research Institute of Marine Systems Engineering, Department of Naval Architecture and Ocean Engineering, Seoul National University, Seoul 08826, Republic of Korea
*
Author to whom correspondence should be addressed.
J. Mar. Sci. Eng. 2025, 13(11), 2185; https://doi.org/10.3390/jmse13112185
Submission received: 30 September 2025 / Revised: 12 November 2025 / Accepted: 15 November 2025 / Published: 18 November 2025

Abstract

In the present study, an Engineering Critical Assessment (ECA) is conducted for an International Maritime Organisation (IMO) Type C liquefied CO2 (LCO2) cargo tank to evaluate the effect of finite element configuration on structural integrity in the presence of potential flaws. With the increasing demand for LCO2 carriers to support carbon capture, utilisation, and storage (CCUS), conventional stress-based design approaches outlined in the International Gas Carrier (IGC) Code have limitations because they neglect imperfections resulting from fabrication and material. To assess these flaws, the fracture mechanics-based ECA methodology, as prescribed by the BS 7910 standard, is applied to a bilobe IMO type C tank designed for cryogenic and pressurised conditions. The assessment integrates fracture toughness, stress intensity factor, and applied loads. Both the two-dimensional shell element model and the three-dimensional solid element model are developed and compared in terms of stress distribution, safety factor for fracture, and fatigue crack growth predictions. Results show that while shell models offer computational efficiency, solid models capture bending stresses and stress concentrations at geometric discontinuities more accurately, resulting in higher reliability in ECA outcomes. The comparative analysis highlights that the web and butt weld near the centre bulkhead are the most vulnerable regions, and fatigue crack growth is highly sensitive to input data, such as stress intensity factor range and fatigue crack growth laws. These findings provide practical guidance for applying ECA in bilobe LCO2 tank design and safety assessment.

1. Introduction

In response to global warming and climate change, reducing carbon emissions has become a critical priority across multiple sectors. Maritime transport accounts for approximately 3% of total global carbon dioxide (CO2) emissions [1], and the annual emissions increased from 889 to 974 million tonnes between 2019 and 2024, corresponding to an average growth rate of 1.8% [2]. To address this challenge, the International Maritime Organization (IMO) has adopted a strategy to achieve net-zero greenhouse gas (GHG) emissions from international shipping by 2050. As intermediate goals, the IMO set indicative checkpoints of at least 20% (striving for 30%) reduction by 2030 and at least 40% (striving for 80%) reduction by 2040 [3]. In line with these goals, Liquefied Natural Gas (LNG) carriers and LNG-fuelled vessels have been introduced as transitional solutions, while the use of hydrogen-based fuels such as ammonia and methanol is expected to expand in the future [4]. At the same time, marine transportation also plays an important role in Carbon Capture, Utilisation and Storage (CCUS), as liquefied CO2 should be delivered to offshore storage sites [5]. Consequently, the demand for liquefied CO2 carriers, as well as liquefied gas tanks for alternative fuels, is estimated to increase. The development of advanced liquefied gas tank technologies is therefore essential to support the transition toward net-zero GHG emissions in shipping.
The IMO adopted the International Code for the Construction and Equipment of Ships Carrying Liquefied Gases in Bulk (IGC Code) to ensure the safe transport of liquefied gases [6]. The IGC Code prescribes structural integrity assessment procedures for liquefied gas tanks, primarily based on allowable stress design, in which applied stresses are compared with stress limits derived from material resistance and safety factors. However, this approach assumes intact structures without imperfections, leaving no provision for evaluating potential flaws. With the trend toward larger liquefied gas tanks to improve transport efficiency, thicker plates and increased principal dimensions have introduced greater challenges in fabrication and inspection. For instance, post-weld heat treatment (PWHT), which is used to relieve residual stresses, is constrained by the physical limitations of furnace capacity. Similarly, non-destructive testing (NDT) becomes more complex in large structures due to difficulties in selecting test regions, while thicker plates increase uncertainty in inspection results. Consequently, there is a growing need to incorporate potential flaws into structural integrity assessments. To address this, fracture mechanics–based assessment procedures have been introduced as a complement to the traditional stress-based approach.
As a fracture mechanics-based assessment method, Engineering Critical Assessment (ECA) integrates fracture mechanics parameters that indicate crack severity with applied stress to evaluate the acceptability of potential defects. This approach considers material resistance, crack geometry, and loading conditions to provide a quantitative prediction of failure risk and to support design and maintenance strategies aimed at ensuring structural reliability. The ECA is increasingly applied to pressure vessels, ship structures, cryogenic tanks, and other systems where quantifying the safety margin of flaws under fatigue and ultimate loads is essential. Liquefied CO2 cargo tanks represent a typical example of such applications. For CO2 carriers, carbon dioxide must be transported in liquefied form to achieve sufficient storage efficiency. Since the triple point of CO2 lies above atmospheric pressure, pressurised vessels are required. In the IGC code, pressurised vessels requiring a design vapour pressure above 2 atm are classified as IMO type C independent tanks. Typically, small-scale CO2 ship cargos operate at −35 °C and 19 atm, while large-scale cargos operate at −55 °C and 8 atm. Both types demand higher design pressures compared with other marine cargo tanks, resulting in the use of thicker plates. For large cargo tanks, plate thickness can reach up to 50 mm. However, the IGC Code only specifies structural requirements up to 40 mm; therefore, the International Association of Classification Societies (IACS) has extended the safety standard to cover plate thicknesses up to 50 mm.
The requirements for these materials are specified in the UR W1 standard [7]. According to this standard, IMO type C independent tanks generally require post-weld stress relief heat treatment. As an alternative, this procedure may be waived if an ECA is performed and approved by either the IACS or recognised international standards. These ECA standards include those published by the British Standards Institution (BS 7910), EDF Energy (R6), and the American Petroleum Institute (API 579) [8,9,10].
Since the classification standard does not prescribe detailed analysis conditions, an appropriate and representative ECA setup must be carefully defined. In particular, the stress intensity factor (SIF), which quantifies the severity of a crack, is highly sensitive to the crack geometry and imperfections. Moreover, accurate evaluation requires consideration of stress distribution through the plate thickness, as the stress singularity at the crack tip is influenced by local variations. To reflect the different stress states of various structures in SIF calculations, ECA standards employ stress linearisation for membrane and bending components. These sectional stress distributions are typically obtained through numerical analysis, such as the finite element method (FEM). Although ship structures are inherently three-dimensional, plate-type two-dimensional (2D) shell elements are commonly employed in structural analysis because the in-plane dimensions are much larger than the thickness, making them effectively thin-walled structures. Since conventional structural integrity assessments are primarily based on applied stresses, shell element models are generally sufficient to capture structural behaviour under intact conditions. However, when potential flaws are to be considered, it becomes essential to determine the sectional stress distribution. In such cases, 2D shell elements have inherent limitations in accurately representing bending stresses, particularly in regions with geometric discontinuities where bending behaviour is dominant.
Several studies have applied Engineering Critical Assessment (ECA) to evaluate structural integrity, as summarised in Table 1. For example, Radu et al. (2020) conducted an ECA of weld joints in antenna tower structures according to the BS 7910 standard [11]. Rezaie et al. (2022) conducted an ECA of snake-laid pipelines using elastic–plastic finite element analysis [12], while He et al. (2023) applied ECA to monopile foundations of offshore wind turbines through the extended finite element method (XFEM) [13]. In these studies, structural analyses were conducted to calculate the stress intensity factor (SIF) using three-dimensional solid element models.
The application of Engineering Critical Assessment (ECA) in ship structures commonly utilises two-dimensional shell element models. This is evidenced by studies such as the short-term and long-term crack propagation analyses of an IMO Type B cargo tank (Seo et al., 2023) [14] and the crack propagation analysis of an IMO Type C liquefied hydrogen cargo tank (Kim et al., 2024) [15]. However, research focusing on liquefied CO2 (LCO2) systems reveals a research gap: while structural analysis of LCO2 tanks has been carried out based on the IGC Code (Kim et al., 2025) [16], ECA was not considered in that specific work. Recent ECA-based design studies for Type-C LCO2 tanks have highlighted a critical issue: the use of high-strength steels introduces fracture sensitivity due to ductile-to-brittle transition and limited regulatory coverage within the current IGC Code [17]. These findings demonstrated that fracture toughness requirements must be quantified to ensure sufficient safety margins when plate thickness and operating pressure increase. Furthermore, two key limitations exist in the existing research. First, although dynamic fracture behaviour in CO2 transport systems has been investigated in pipeline environments [18], these studies do not address fracture evaluation or crack stability under the specific loading conditions of liquefied gas tanks on ships. Additionally, existing research has primarily focused on conventional cylindrical Type C tanks, with limited attention paid to the bilobe-type configuration. This configuration introduces geometric discontinuities at the web and intersection regions, which can lead to stress concentration and potential fracture sensitivity.
Despite the increasing application of Engineering Critical Assessment (ECA) for welded liquefied gas tanks, the effect of finite element modelling strategy—particularly the choice between shell and solid element formulations—on the stress linearisation process and subsequent FAD-based fracture evaluation has not yet been quantitatively clarified. Shell models are widely adopted in practice due to their computational efficiency; however, their simplified representation of through-thickness stress may introduce bias when assessing fracture reliability in geometrically complex regions, such as bilobe intersections and welded joints. Therefore, the objective of this study is to provide a systematic comparison of shell and solid finite element formulations within the BS 7910-based ECA framework for a bilobe IMO Type-C LCO2 cargo tank. By quantifying the resulting differences in membrane and bending stresses, fracture ratio, load ratio, and safety factor, this work provides practical guidance on model selection and interpretation for assessing the structural integrity of emerging liquefied gas containment systems.
In the present study, a structural integrity assessment of a bilobe IMO Type C liquid CO2 tank is performed using the flaw assessment methodology (BS 7910) proposed by the British Standards Institution. The remainder of this paper is structured as follows. Section 2 provides the background of the study of the Engineering Critical Assessment (ECA) framework. Section 3 describes the finite element modelling methodology, stress linearisation procedure, and fracture and fatigue assessment approach. Section 4 presents the results of the stress comparison and Engineering Critical Assessment for the shell and solid element models. Section 5 discusses the interpretation of the assessment outcomes. Finally, Section 6 summarises the key findings and concludes the study.

2. Research Background

2.1. Engineering Critical Assessment (ECA)

It is widely recognised that potential flaws, such as cracks, are unavoidable predecessors of structural failure. Crack propagation generally proceeds through three stages: initiation, stable growth under service conditions, and final fracture. Fatigue crack growth and fracture toughness are critical material properties for evaluating structural safety under extreme and cyclic loading conditions. Fracture toughness characterises the resistance of materials to crack growth and unstable propagation under monotonic loading and is typically evaluated through the J-integral or the crack tip opening displacement (CTOD). For fatigue loading, crack growth behaviour is generally described by the Paris Law, which relates the crack growth rate to the applied cyclic load. These fracture mechanics parameters provide a framework for understanding stable crack growth and the conditions leading to final fracture. Engineering Critical Assessment (ECA) embeds fracture mechanics principles with structural analysis to evaluate the acceptability of potential defects. Unlike conventional structural analysis, which considers only applied stress as the assessment criterion, fracture mechanics incorporates crack characteristics as additional variables alongside loading conditions. By integrating material resistance, crack dimensions, and applied loads, ECA enables a quantitative assessment of failure risk and supports strategies for designing and maintaining reliable structures [19]. This methodology has been widely applied in pressure vessels, ship structures, cryogenic tanks, and other structures where quantifying safety margins against flaws under fatigue and extreme loading is essential.
Engineering Critical Assessment (ECA) is commonly performed using standards based on the Failure Assessment Diagram (FAD) methodology. Several internationally recognised fitness-for-service and flaw assessment procedures are based on the FAD. One of the earliest frameworks is the R6 method, originally developed for the British electric power industry, which provides both simplified closed-form FAD options and a more advanced elastic-plastic approach using the J-integral. The BS 7910, developed by the British Standards Institution (BSI), and the FITness-for-service NETwork (FITNET), established by the EU, extended the method to welded structures and general industrial applications. In parallel, the API 579 standard offers a broader ECA framework that covers various flaw types and includes an extensive library of stress intensity factor solutions. Although recent revisions of R6 and BS 7910 introduced approaches to account for crack-tip constraint effects, their applicability to complex welded geometries remains limited, and conservative assumptions are typically adopted in practice [19].

2.2. Failure Assessment Diagram (FAD)

Within fracture mechanics-based flaw assessment methods, the Engineering Critical Assessment (ECA) employs the Failure Assessment Diagram (FAD). The FAD is the most widely used to analyse the elastic-plastic fracture behaviour of structures [19]. While structures may fail due to fracture by potential cracks, plastic collapse under overload can also occur in the absence of cracks. Steel materials exhibit ductile-to-brittle transition (DBTT) behaviour, being ductile at room temperature but brittle at low temperatures. Since liquefied gas tanks in ships are subjected to both room and cryogenic temperatures during loading and unloading, flaw assessments should be performed using elastic-plastic fracture mechanics. The FAD provides a framework for evaluating structural safety by representing the interaction of applied load and crack severity on two axes, as shown in Figure 1. The vertical axis defines the fracture ratio (Kr), and the horizontal axis defines the load ratio (Lr). The structural limit, as expressed by the failure assessment line (FAL), represents the relationship between the applied load and crack severity, which is influenced by material properties and geometry. Although numerical structural analyses (e.g., finite element method) can define location-specific FALs by considering elastic–plastic material behaviour, such analyses are computationally expensive. As an alternative, conservative empirical FALs, which are independent of geometry, are provided in standards such as BS 7910, and can be derived from the tensile test data. The empirical FAL formula is shown in Equation (1) [8].
f L r = 1 + 1 2 L r 1 2 0.3 + 0.7 e μ L r 6 , f o r   L r 1 f L r = f 1 L r N 1 2 N , f o r   1 < L r < L r , m a x f L r = 0 , f o r   L r L r , m a x where μ = min 0.001 E σ Y , 0.6 N = 0.3 1 σ Y σ u
The fracture ratio (Kr) corresponds to crack severity and is obtained by normalising the stress intensity factor (KI) with respect to the fracture toughness (Kmat). KI quantifies the crack-tip singularity under remote loading and is typically evaluated for Mode I crack opening mode, which is induced by in-plane loading conditions. In the BS 7910 standard, KI is calculated using Equation (2), where load components (Pm, Pb, Qm, Qb) are decomposed and combined with stress magnification factors (kt, ktm, ktb, km) [8].
K I   =   Y σ π a Y σ   =   Y σ p + Y σ s Y σ p   =   M f w k t m M k m M m P m + k t b M k b M b P b + k m 1 P m Y σ s   =   M m Q m + M b Q b
The load ratio (Lr) corresponds to the severity of the applied load and is calculated by normalising the reference stress (σref) with the yield stress (σY). The reference stress is introduced particularly when the FAL is defined empirically, to account for geometry dependence effects. It is calculated using Equation (3), which reflects reductions in the effective section area due to the presence of cracks [8].
σ r e f   =   P b P b 2 + 9 P m 2 1 α 2 0.5 3 1 α 2 w h e r e α   =   a / B 1 + B / c , f o r   W 2 c + B α   =   a / B 2 c / W , f o r   W < 2 c + B
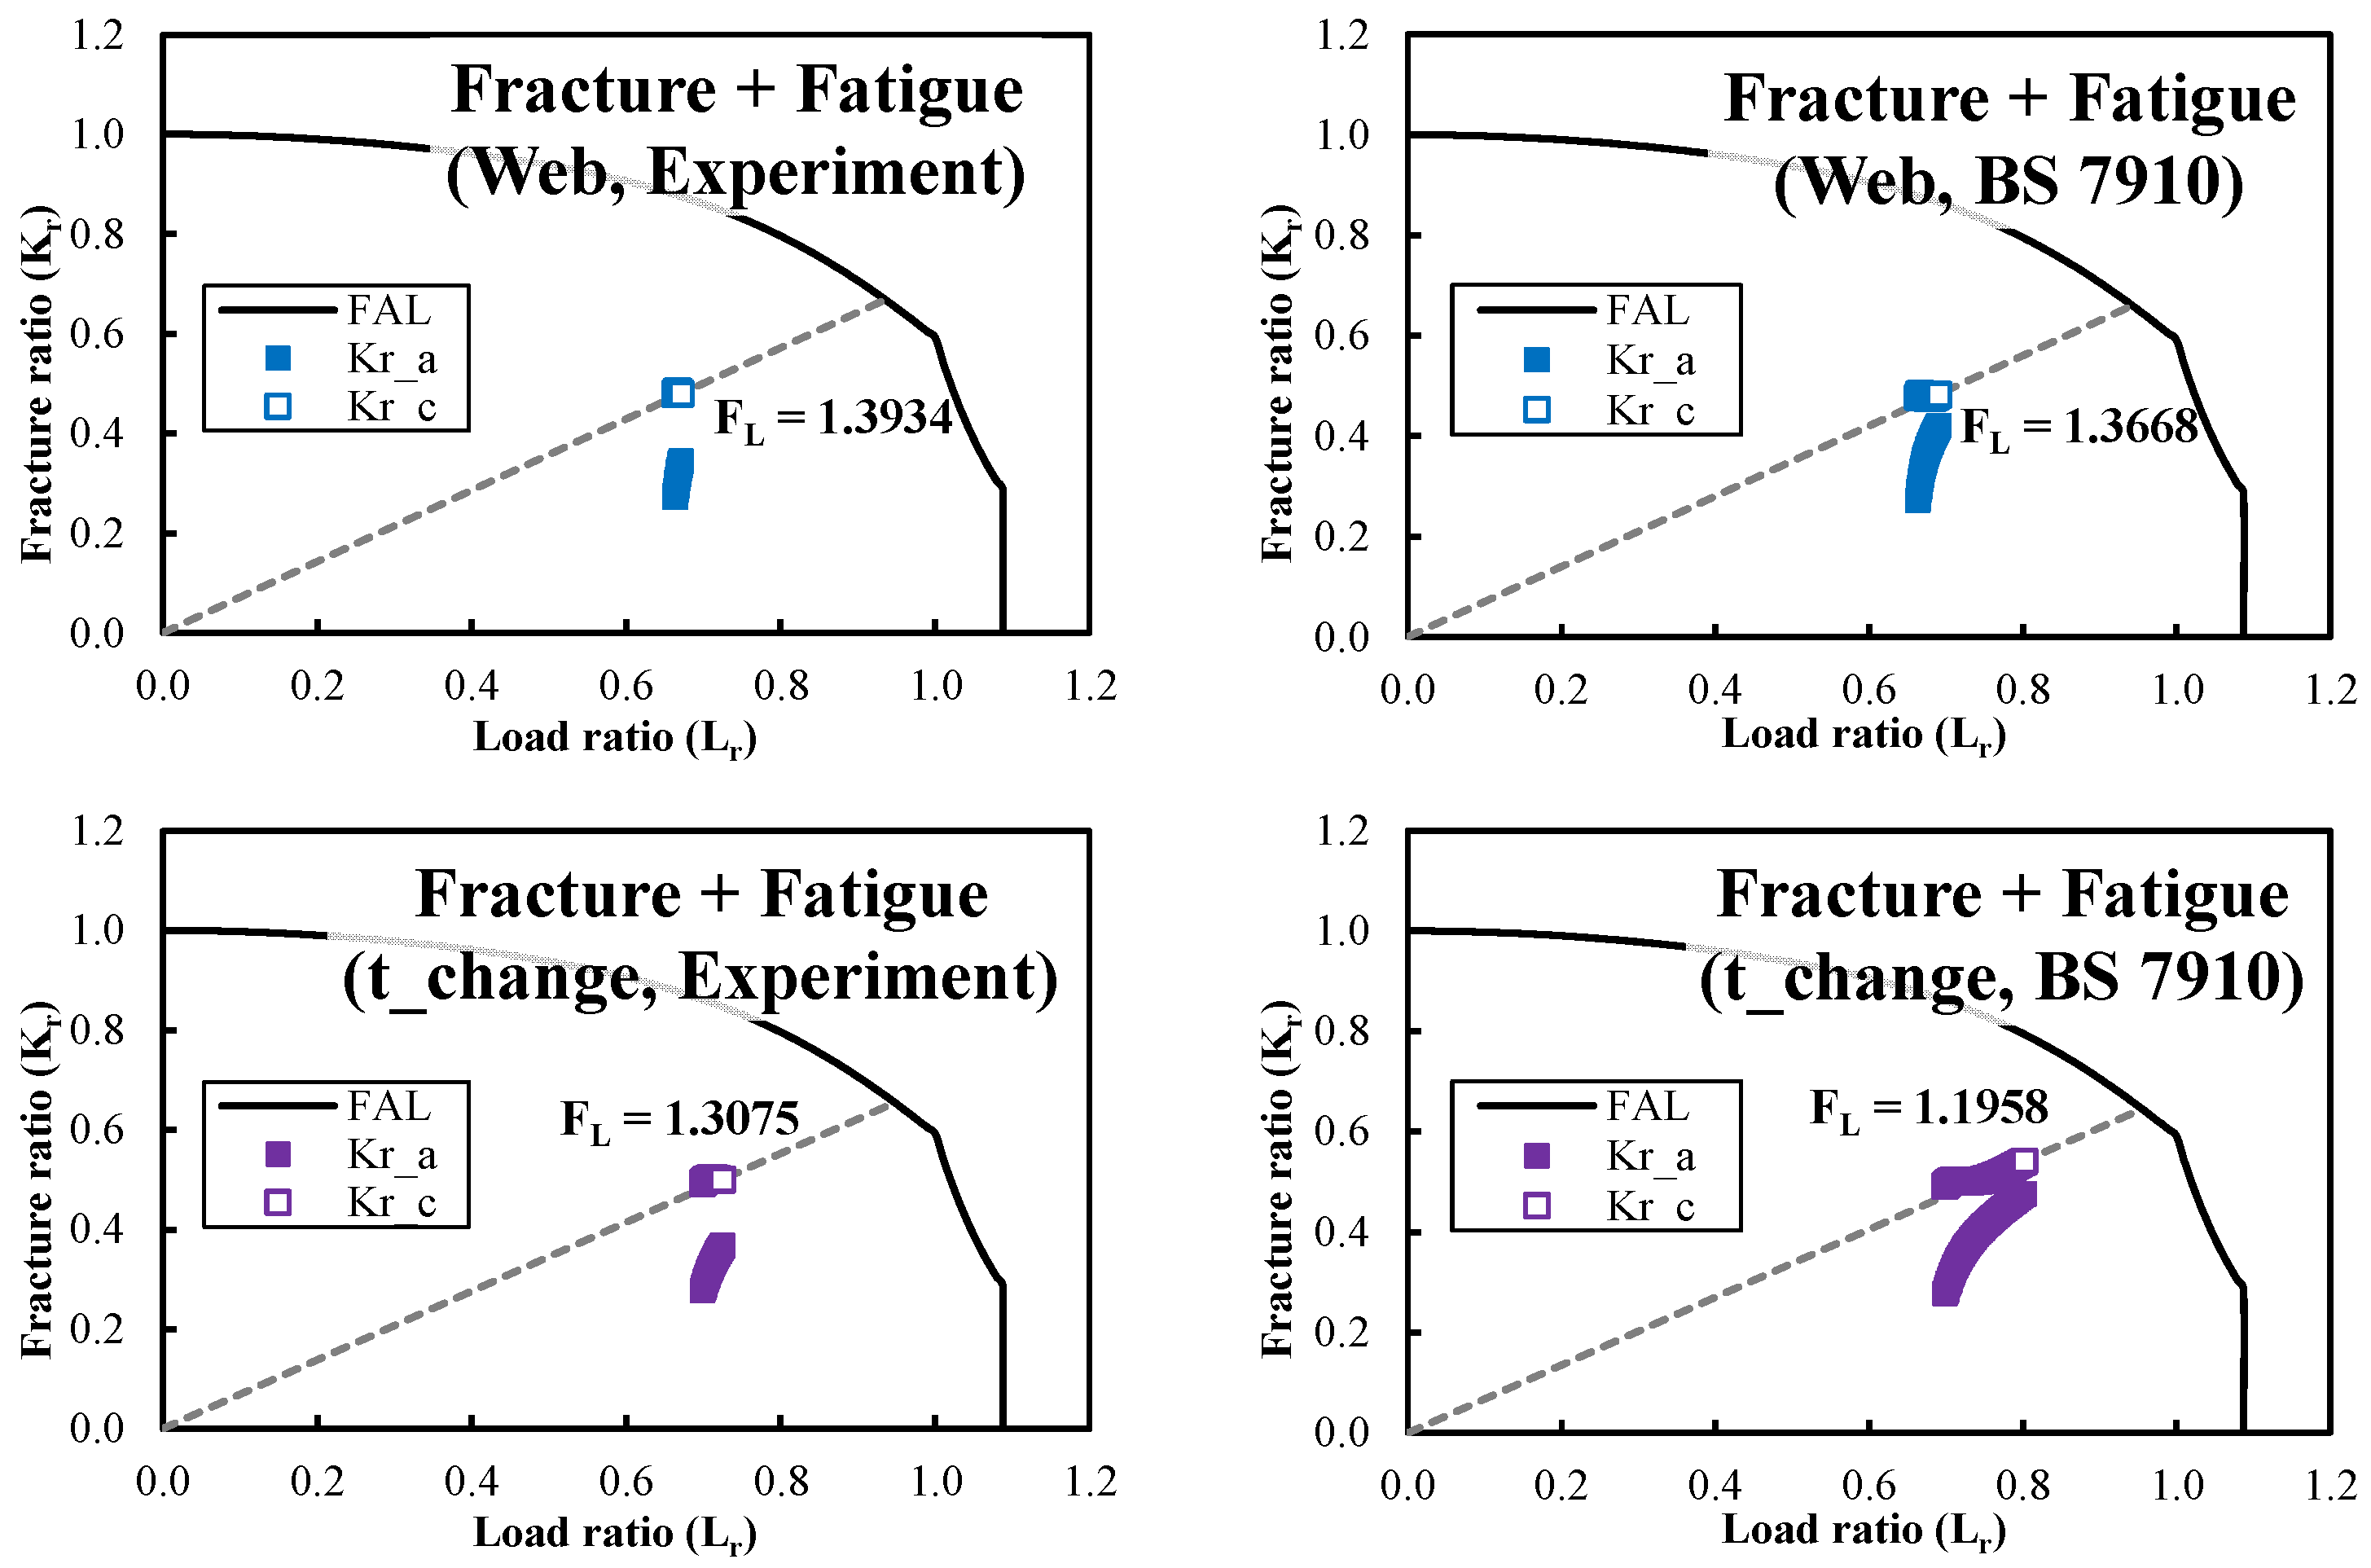
The mechanical behaviour of a flawed structure can be evaluated by the relative positions of the assessment point with respect to the failure assessment line (FAL), as illustrated in Figure 1. When the assessment point lies within the FAL, the structure is considered to be capable of sustaining the crack. In this case, the crack-related safety factor (FL) can be determined from the distance ratio between the assessment point (Pi) and the critical point (Pc). Conversely, if the assessment point falls outside the FAL, structural failure is expected. The governing failure mechanism can then be distinguished by the relative magnitudes of the fracture ratio (Kr) and load ratio (Lr): fracture dominates when Kr is critical, while plastic collapse occurs when Lr is critical. In the intermediate region, failure may occur through fracture followed by plastic deformation. This behaviour can be quantitatively characterised by defining the degree of the assessment point (ϑ). The safety factor and the degree are calculated using Equations (4) and (5), respectively.
F L = P c P i = K r , c r i t K r , a p p = L r , c r i t L r , a p p
θ = arctan K r , a p p L r , a p p = arctan K r , c r i t L r , c r i t
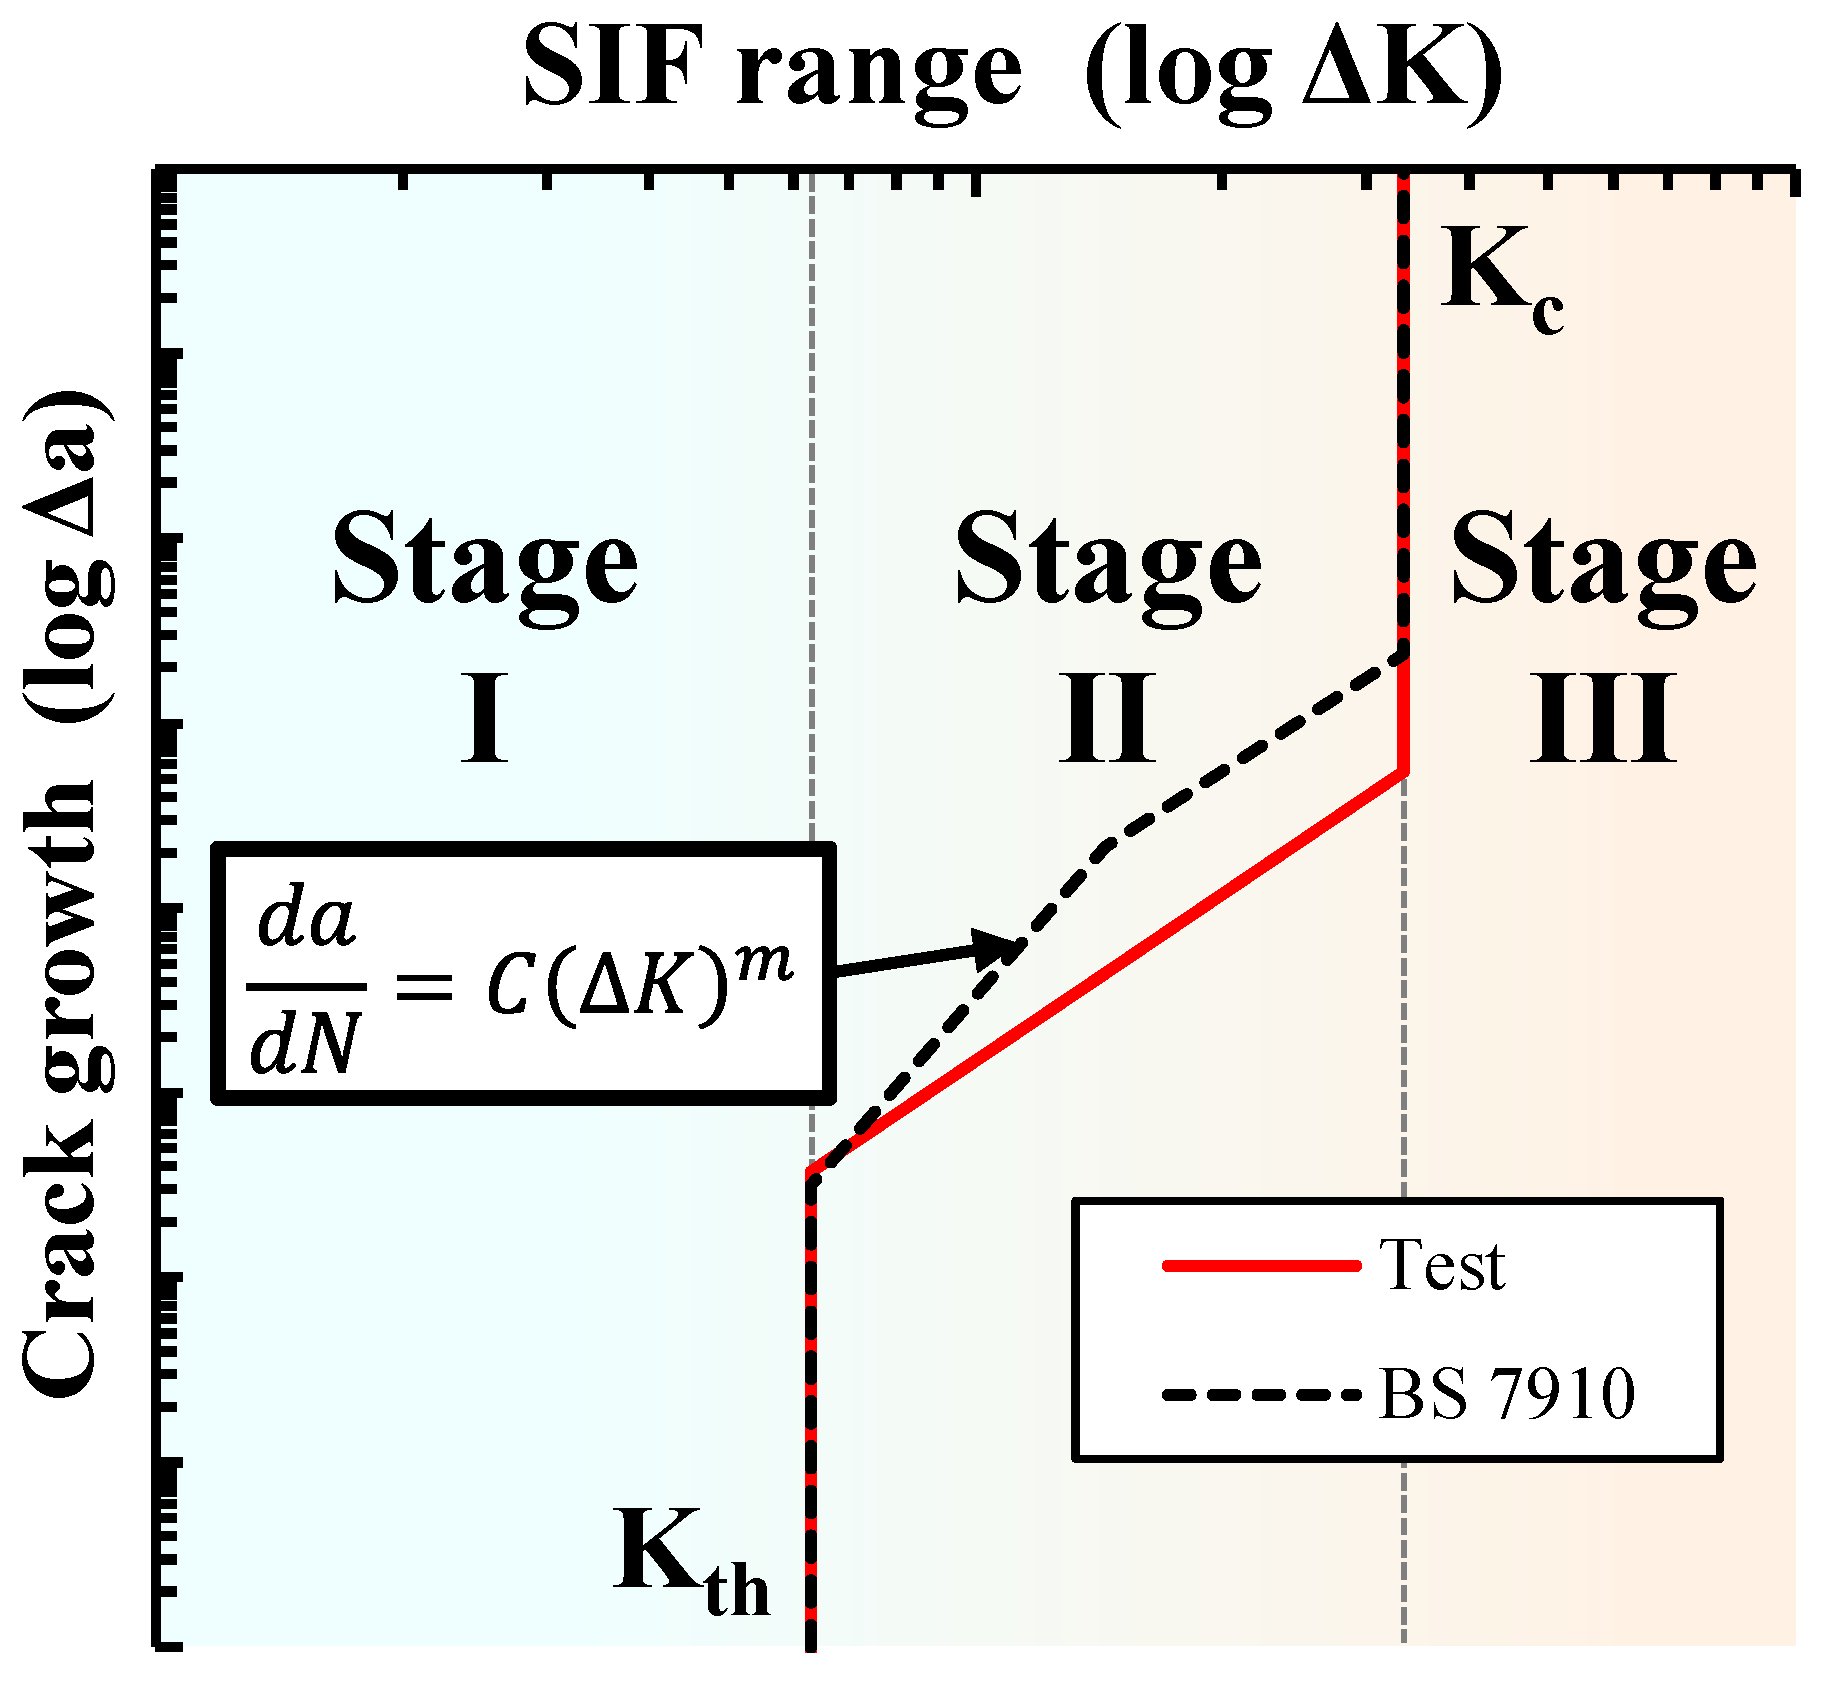
Fatigue damage in structures can be described as the growth of an initial crack to a critical size, ultimately leading to fracture. The crack growth rate (Δa) is expressed as a function of the stress intensity factor range (ΔKI). As illustrated in Figure 2, fatigue crack growth behaviour is generally divided into three stages. When ΔKI is below the threshold stress intensity factor (Kth), which defines the minimum condition for crack propagation, no crack growth occurs. When ΔKI exceeds the critical value (KIc or JIc), fracture occurs prior to significant crack growth. In the intermediate region, the crack growth rate follows an exponential relationship with ΔKI, commonly expressed by the Paris Law (Equation (6)), which appears as a straight line on a logarithmic plot [19].
d a d N = C Δ K m
The fatigue crack growth coefficients (C, m) vary with material and can be obtained either from standardised testing or from recommended values in ECA procedures. In this study, both experimental data from ASTM E647 tests and recommended values from the BS 7910 ECA standard were applied and compared [20,21].

2.3. Finite Element Configurations

The sectional stress distribution required for the ECA procedure in finite element analysis (FEA) depends on the configuration of integration points. Therefore, it is essential to understand the characteristics of shell and solid elements in order to analyse stress distribution at assessment locations. These characteristics are primarily determined by the underlying theoretical formulations, which define stress integration through the thickness. The proportion of stress components also varies with the type of applied loading, ultimately influencing the results of ECA.
Thin-walled structures are usually modelled with two-dimensional elements in structural analysis. When representing three-dimensional structures using two-dimensional surfaces, curved geometries must be included. Accordingly, shell elements are employed to simulate three-dimensional behaviour based on plate theories. Shell elements can be divided into thin and thick formulations. Thin shell elements are based on the Kirchhoff–Love plate theory, which is analogous to Euler–Bernoulli beam theory and neglects shear deformation through the thickness. In contrast, thick shell elements adopt the Reissner–Mindlin plate theory, which is analogous to Timoshenko beam theory and accounts for transverse shear deformation. In this formulation, cross-sections are assumed to rotate due to shear effects while maintaining planarity. In the finite element software ABAQUS 2019, general-purpose shell elements are based on the Reissner–Mindlin theory. Because plate theories explicitly include bending moments as external effects, both nodal forces and nodal moments are considered in shell elements. Furthermore, since thickness is treated as a stiffness parameter rather than as part of the geometry, shell elements offer advantages such as convenient design modifications and simplified modelling of thickness transition regions and cruciform joints in welded structures.
Solid elements, on the other hand, are three-dimensional volumetric elements based on continuum mechanics. In this formulation, only external forces are considered without explicit representation of nodal moments. Since thickness is represented as a true geometric dimension, solid elements enable accurate modelling of thickness variations and joint connections. However, design modifications require dimensional changes, which increase modelling costs and complexity compared with shell elements.

3. Research Methodology

The workflow for comparing Engineering Critical Assessment (ECA) results based on shell and solid element models is summarised in Figure 3.

3.1. Applied Structure

3.1.1. Tank Specification

For pressurised ship cargo tanks with a design pressure exceeding 2 atm, the IMO Type C configuration is applied. While Type C tanks are generally designed with a cylindrical shape, in this study, the liquefied CO2 (LCO2) tank is designed in a bilobe shape to enhance storage efficiency. The tank features a dome on the topside and a sump on the bottom side, enabling efficient and safe bunkering and maintenance. However, these attached structures introduce geometric discontinuities that cause local stress concentration. Additionally, the bilobe shape necessitates a Y-joint to connect two cylinders, which introduces an additional structural vulnerability.
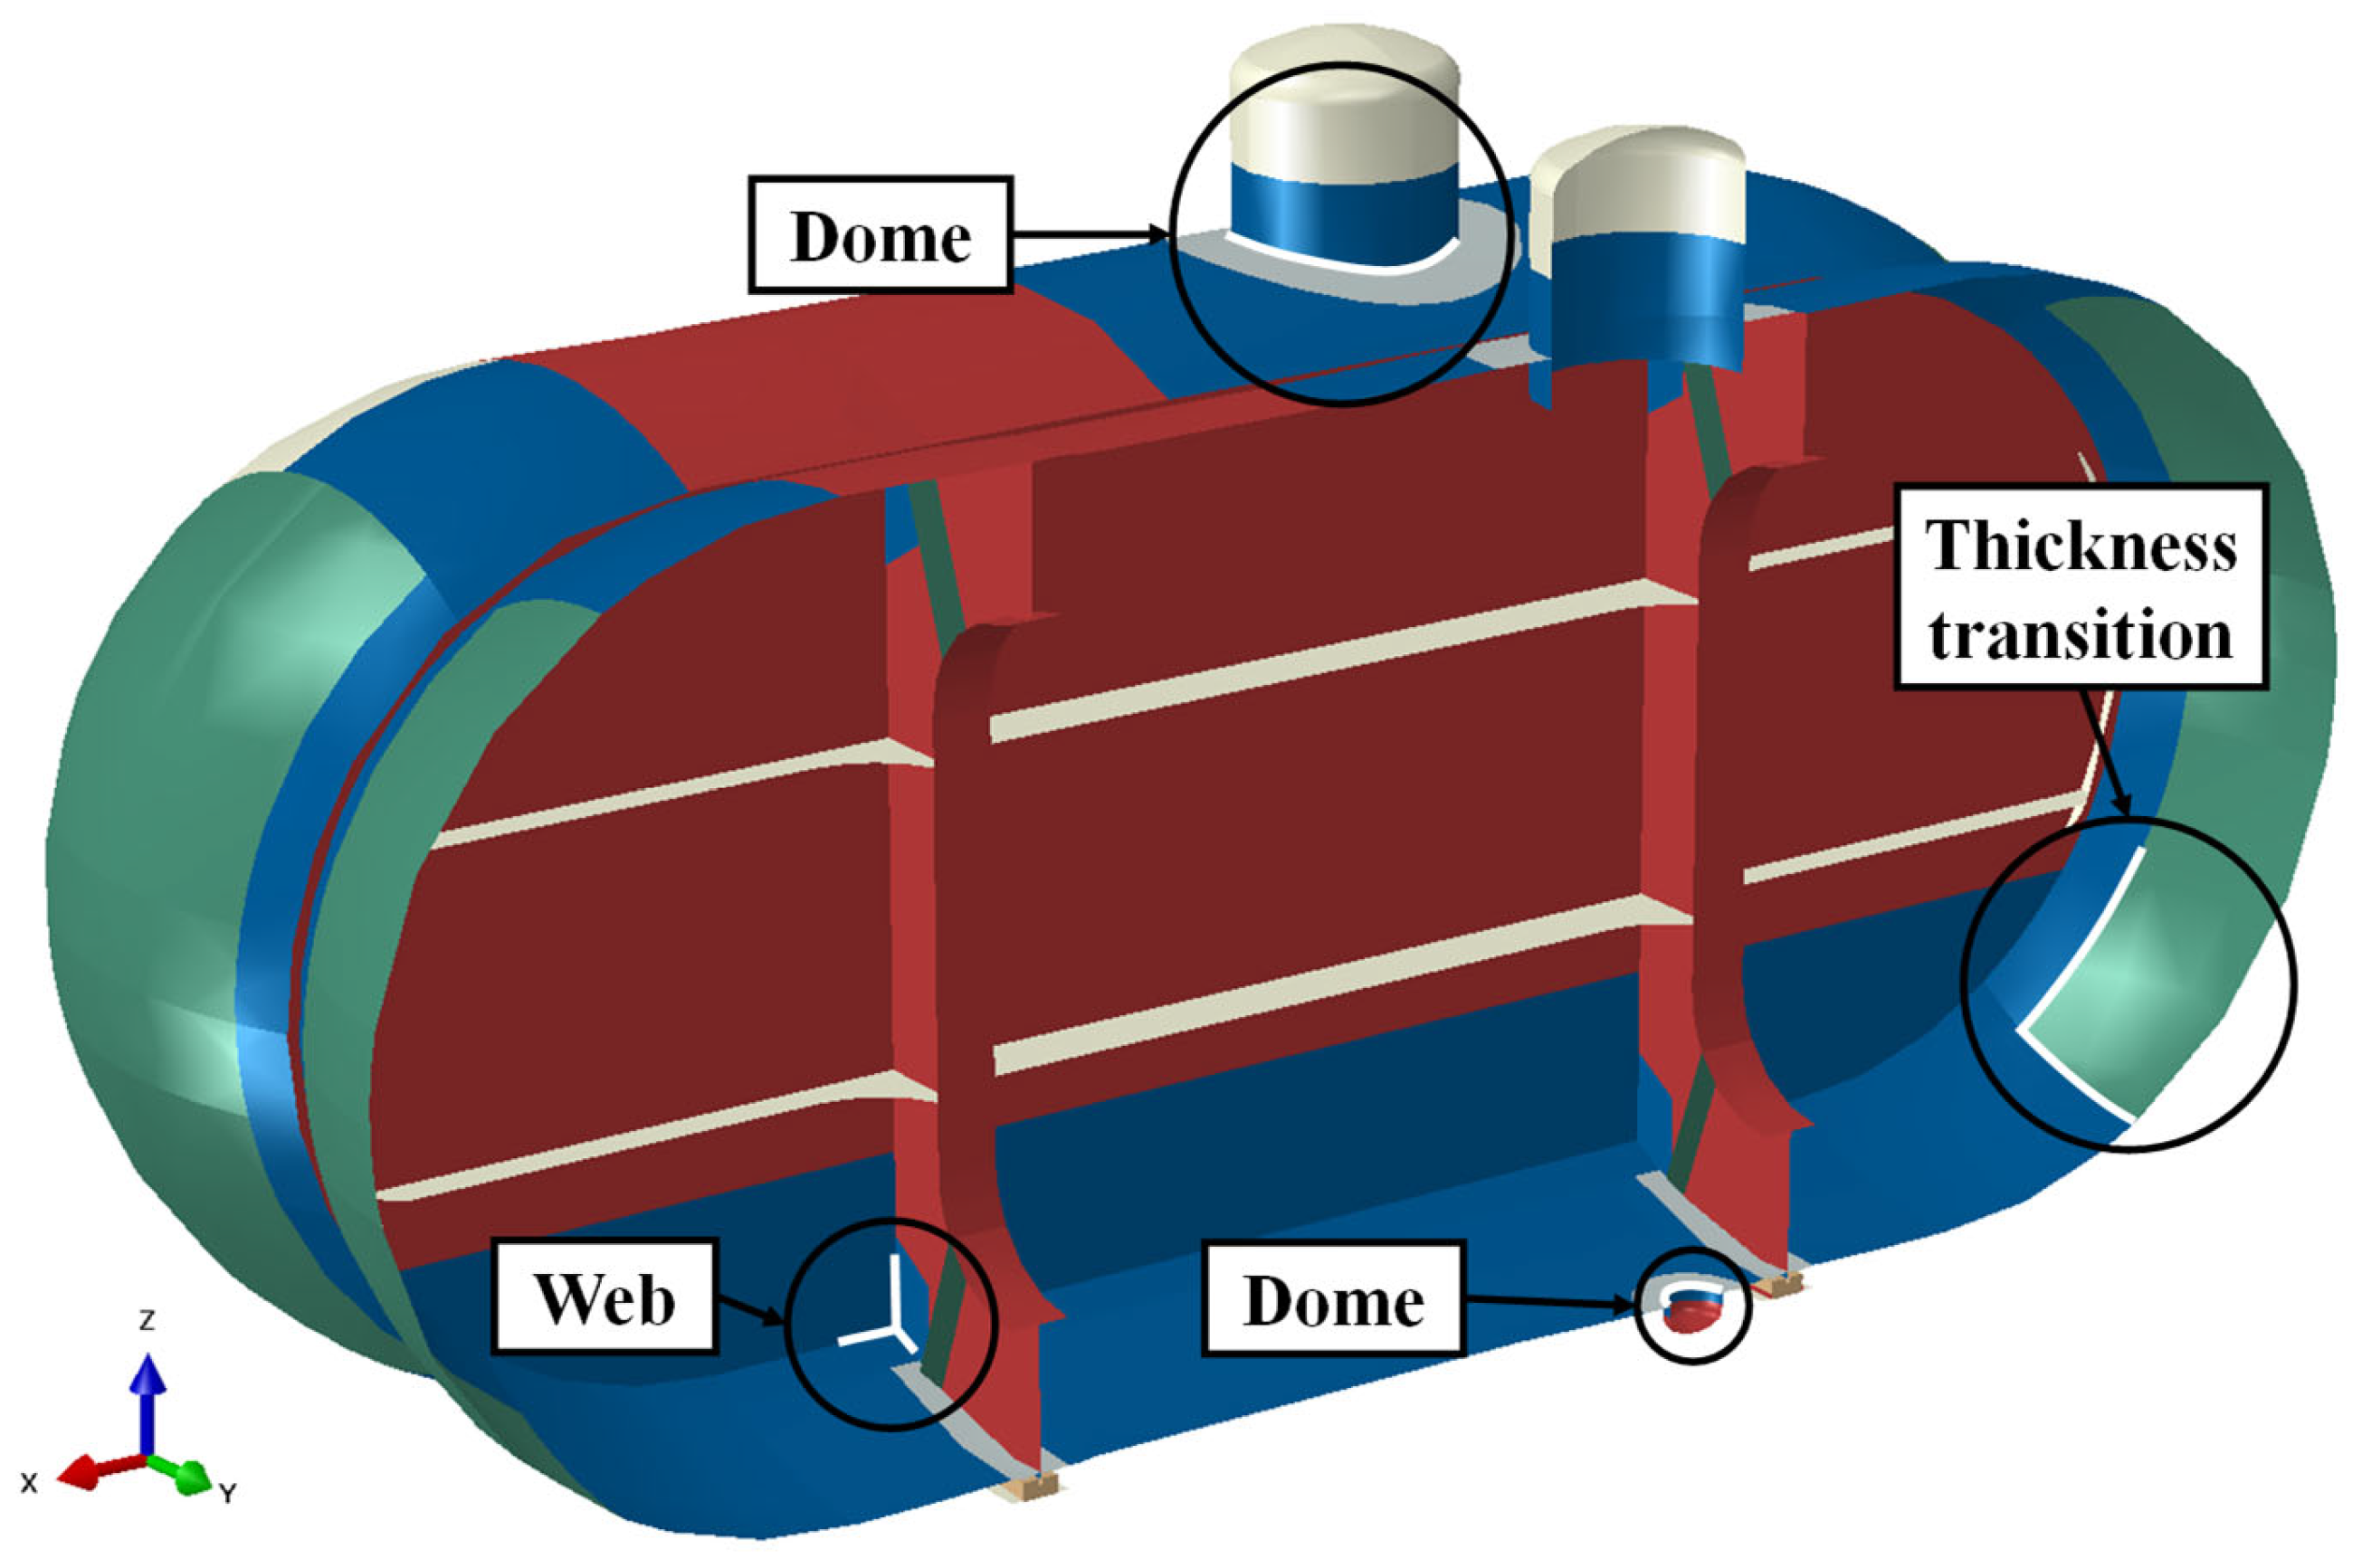
The target LCO2 tanks have a total volume of approximately 9800 m3, with an internal diameter of about 15.6 m and a length of 36 m The tank is supported longitudinally by two saddle structures. To accommodate thermal expansion and contraction, the forward support is designed as a sliding support, allowing axial movement. Internally, a bulkhead and webs are installed to provide self-supporting capacity and to reduce sloshing-induced loads, with stiffeners arranged to reinforce these structures. For the ECA, assessment locations are selected at the weld joints of the web, dome, and sump, as shown in Figure 4. In addition, regions with thickness transitions at welds are also considered assessment locations to account for the influence of geometric discontinuities.

3.1.2. Material Properties

The tank and its supports were fabricated from LTFH36 steel, with wood inserted between the tank and the saddle supports. The material properties of the steel and wood used in the structural analysis are summarised in Table 2.
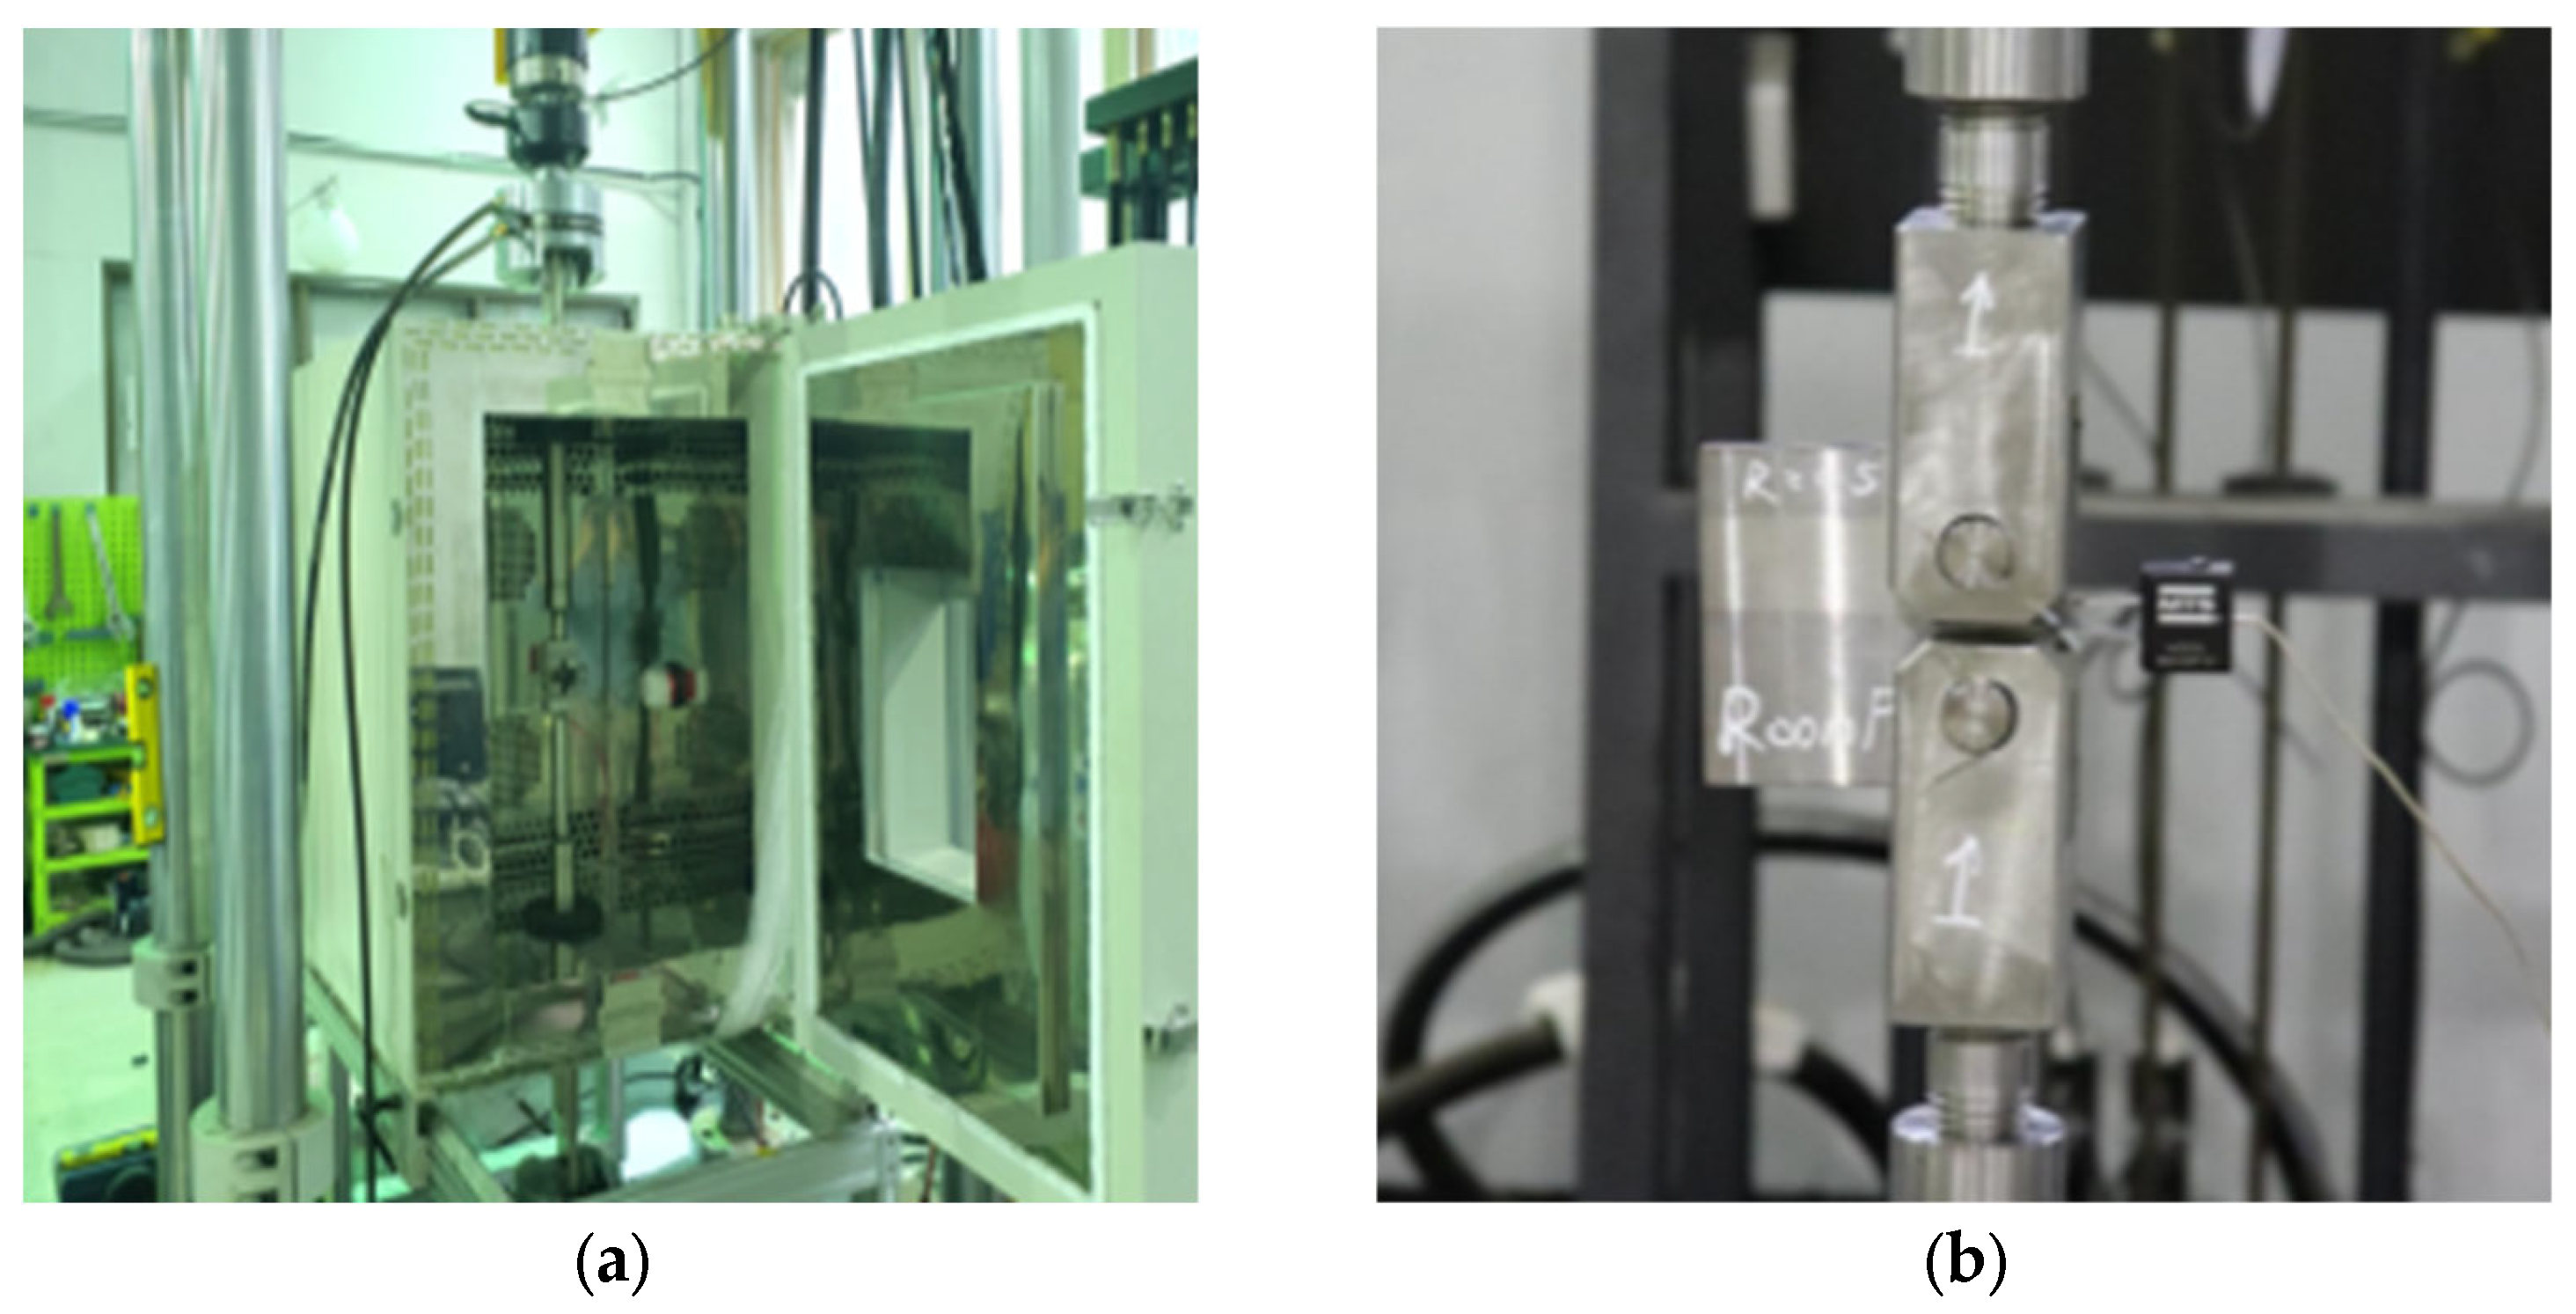
For conducting the Engineering Critical Assessment (ECA), fracture toughness and fatigue crack growth rate (FCGR) are essential material properties. Fracture toughness can be determined through standardised testing methods such as ASTM E1820, BS 7448, or ISO 12135 [22,23,24]. In this study, the fracture toughness of LTFH36 steel was determined in accordance with ASTM E1820, obtaining the J-integral. The FCGR of LTFH36 steel was determined in accordance with the ASTM E647 standard [25]. The ECA results, based on experimentally obtained data, were compared with those using the recommended FCGR data provided in the BS 7910 standard. The measured fracture toughness of LTFH36 was 333 MPa m , and the FCGR data are presented in Table 3. The test equipment and specimen is shown in Figure 5.
Accurate fracture toughness values are essential for the reliability of ECA, particularly in welded structures where local constraint and geometric discontinuities are pronounced. Recent studies have shown that the measure of toughness can vary significantly depending on specimen thickness and crack orientation, with reductions of up to approximately 70% reported in weld and heat-affected zones (HAZs) [26]. Such findings highlight material and weld-specific fracture toughness data when assessing LCO2 cargo tanks, where the bilobe web connections and associated welds act as stress concentration locations.

3.1.3. Loading Conditions

The loading components considered in the structural analysis of the gas tank include acceleration, pressure, and thermally induced loads. Acceleration can be categorised into static and dynamic components. Static acceleration corresponds to gravity (self-weight), whereas dynamic acceleration arises from ship motion. In this study, the three-dimensional components of dynamic acceleration were adopted from the recommended values in the IGC Code, which are defined at a probability level of 10−8 for the North Atlantic Sea. These values are calculated based on the principal dimensions of the cargo ship and the centre of gravity of the tank. The recommended formulae for calculating acceleration are provided in Equation (7), and the principal dimensions of the ship and tank are summarised in Table 4 [6].
a z = ± a 0 1 + 5.3 45 L 0 2 x L 0 + 0.05 2 0.6 C B 1.5 + 0.6 y K 1.5 B s 2 a y = ± a 0 0.6 + 2.5 x L 0 + 0.05 2 + K 1 + 0.6 K z B 2 a x = ± a 0 0.06 + A 2 0.25 A a 0 = 0.2 V L 0 + 34 600 / L 0 L 0 where a 0 = 0.2 V L + 34 600 L l A = ( 0.7 L 1200 + 5 z L ) 0.6 C B
The load cases for the fracture and fatigue assessments consist of three dynamic acceleration load cases during voyage (LC1–LC3) and one static load case during loading and unloading (LC4). In addition, an accident load case (LC5) was considered, corresponding to a collision scenario with inertial accelerations of 0.5 g in the forward direction and 0.25 g in the aft direction, as recommended by the IGC Code [6]. These load cases are presented in Table 5. In these load cases, the internal pressure (P0) and hydrostatic pressure were applied to the inner surface of the tank shell, while gravity and dynamic acceleration load components were introduced as body forces acting on both the tank shell and the supporting woods. In addition, thermal deformation due to the temperature difference was applied to the tank, excluding the supporting woods and saddles.
The characteristics of cyclic loading during the design life should be defined for fatigue assessment. For liquefied gas carriers, fatigue loading can generally be categorised into high-cycle fatigue (HCF) and low-cycle fatigue (LCF). HCF corresponds to the loading induced by ship motions under environmental conditions during voyages. In this study, the design life of the LCO2 carrier is assumed to be 20 years, corresponding to approximately 108 cycles when the zero-crossing frequency is taken as 1/7 Hz, as provided in Equation (8).
n d = ν 0 T d = 1 7 Hz × 20 × 365.25 × 24 × 3600   seconds = 10 7.955 10 8
Since fatigue loading on the tanks is negligible when the cargo is empty, a voyage factor, defined as the ratio of the loaded state, is assumed to be 0.5. Furthermore, because dynamic loads from the marine environment are absent when the ship is anchored, a harbour factor, defined as the ratio of the harbour state, is assumed to be 0.15. The load distribution during HCF is represented by a Weibull distribution with a shape parameter of 1. The total number of HCF loadings, without applying voyage and harbour factors, is 108. The corresponding probability density function and rank-size distribution are shown in Figure 6.
LCF, on the other hand, is associated with cargo loading and unloading operations in the harbour. The LCF load distribution is assumed to be constant, and the number of cycles depends on the operational schedule, which governs the average voyage period. In this study, the number of LCF cycles is assumed to be 1000, which is the minimum recommended value for a 20-year design life according to the IGC Code.

3.2. Finite Element Modelling

3.2.1. Shell and Solid Element

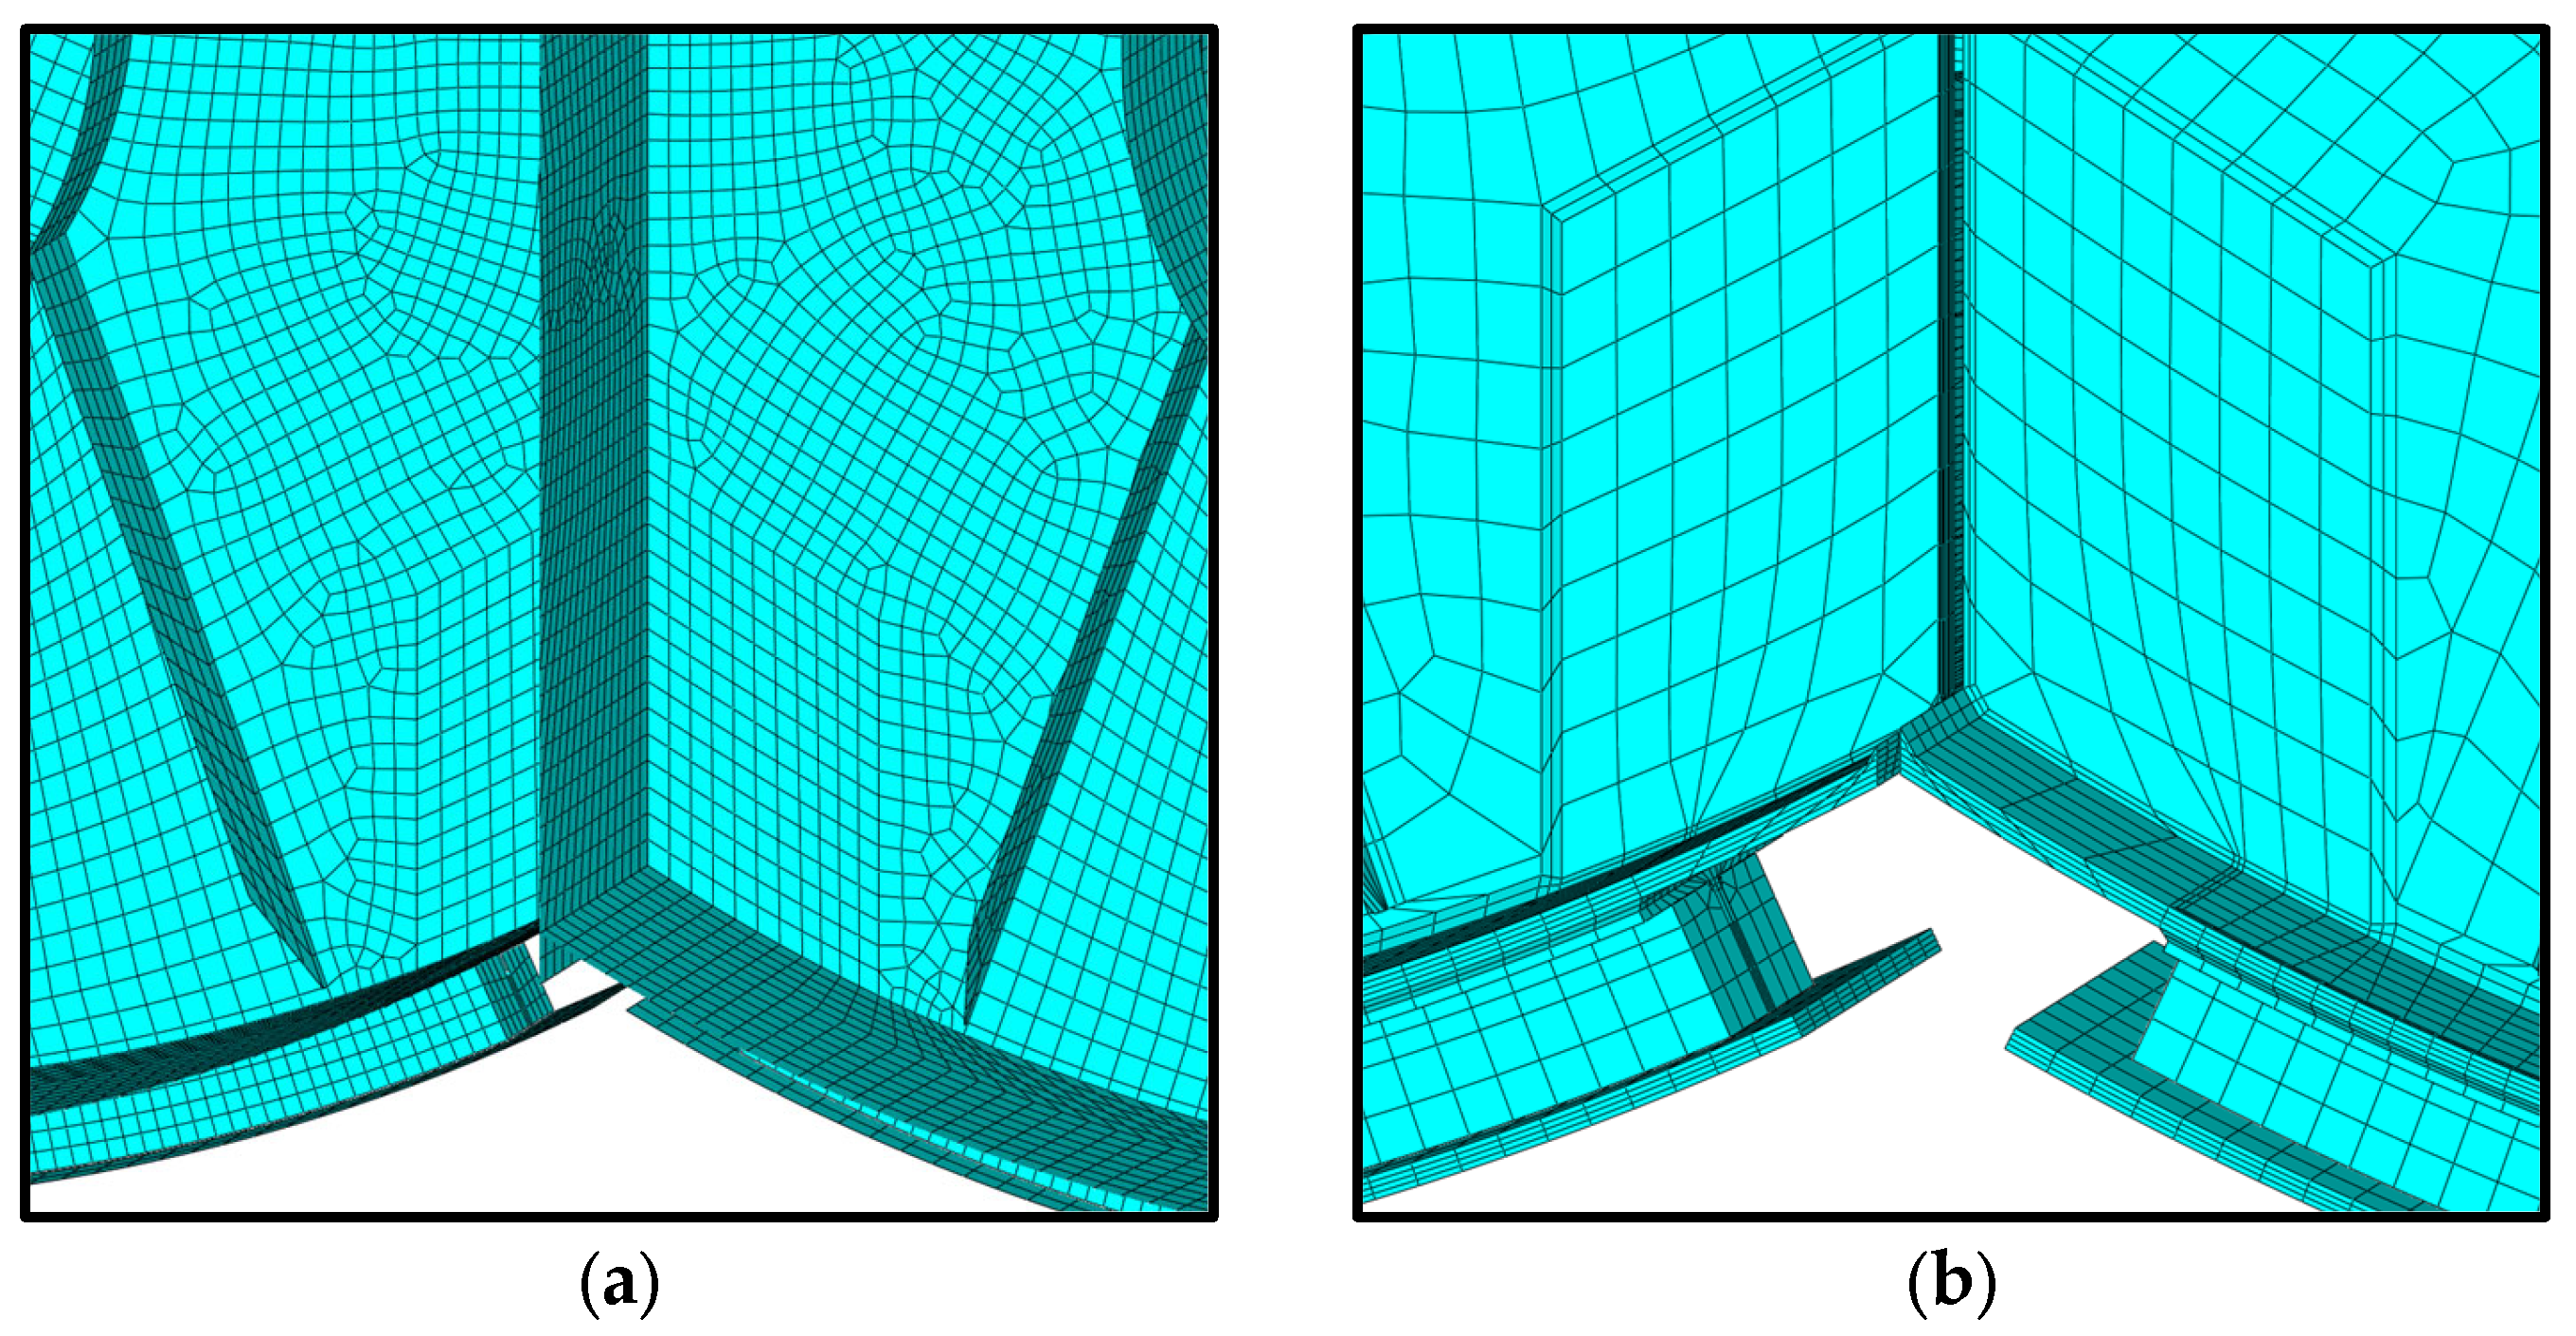
Based on the selected principal dimensions of the structures, the liquefied gas tank was modelled using both shell and solid elements for structural analysis. In this study, a nonlinear finite element analysis was performed using the structural analysis software Abaqus 2019, which is capable of accounting for large deformations, including contact between the tank and supports, as well as thermally induced deformation. For the shell element model, the S4R element was employed. This element is based on thick plate theory and uses reduced integration to prevent shear locking. Considering the maximum plate thickness (50 mm), the in-plane mesh size (width, length direction) is set to 150 mm, and five integration points were assigned through the thickness to compute forces and moments.
For the solid element model, the C3D8R element, a reduced-integration continuum element, is employed. Since plate thickness should be explicitly modelled in solid elements, weld beads are applied at thickness change regions and intersections, as shown in Figure 7. The mesh size in the width and length directions is also set to 150 mm, while the thickness direction is divided into four elements across the section. This configuration ensured that the number of integration points through the thickness in the shell model corresponds to the number of nodes in the solid model. The mesh layouts of both the shell and solid element models are illustrated in Figure 8.

3.2.2. Stress Linearisation

In accordance with BS 7910, where the load ratio and fracture ratio are defined in terms of the membrane (Pm, Qm) and bending (Pb, Qb) stress components (Equations (2) and (3)), the through-thickness stress distribution was linearised into membrane and bending stresses. The membrane stress corresponds to the mean stress across the thickness, and the bending stress represents the linearly varying component. For shell elements, the stresses at the bottom (SNEG, σbottom) and the top (SPOS, σtop) obtained from the structural analysis are utilised, and the membrane stress (Pm) and the bending stress (Pb) are calculated using Equation (9).
P m   =   σ b o t t o m + σ t o p 2 P b   =   σ b o t t o m σ t o p 2
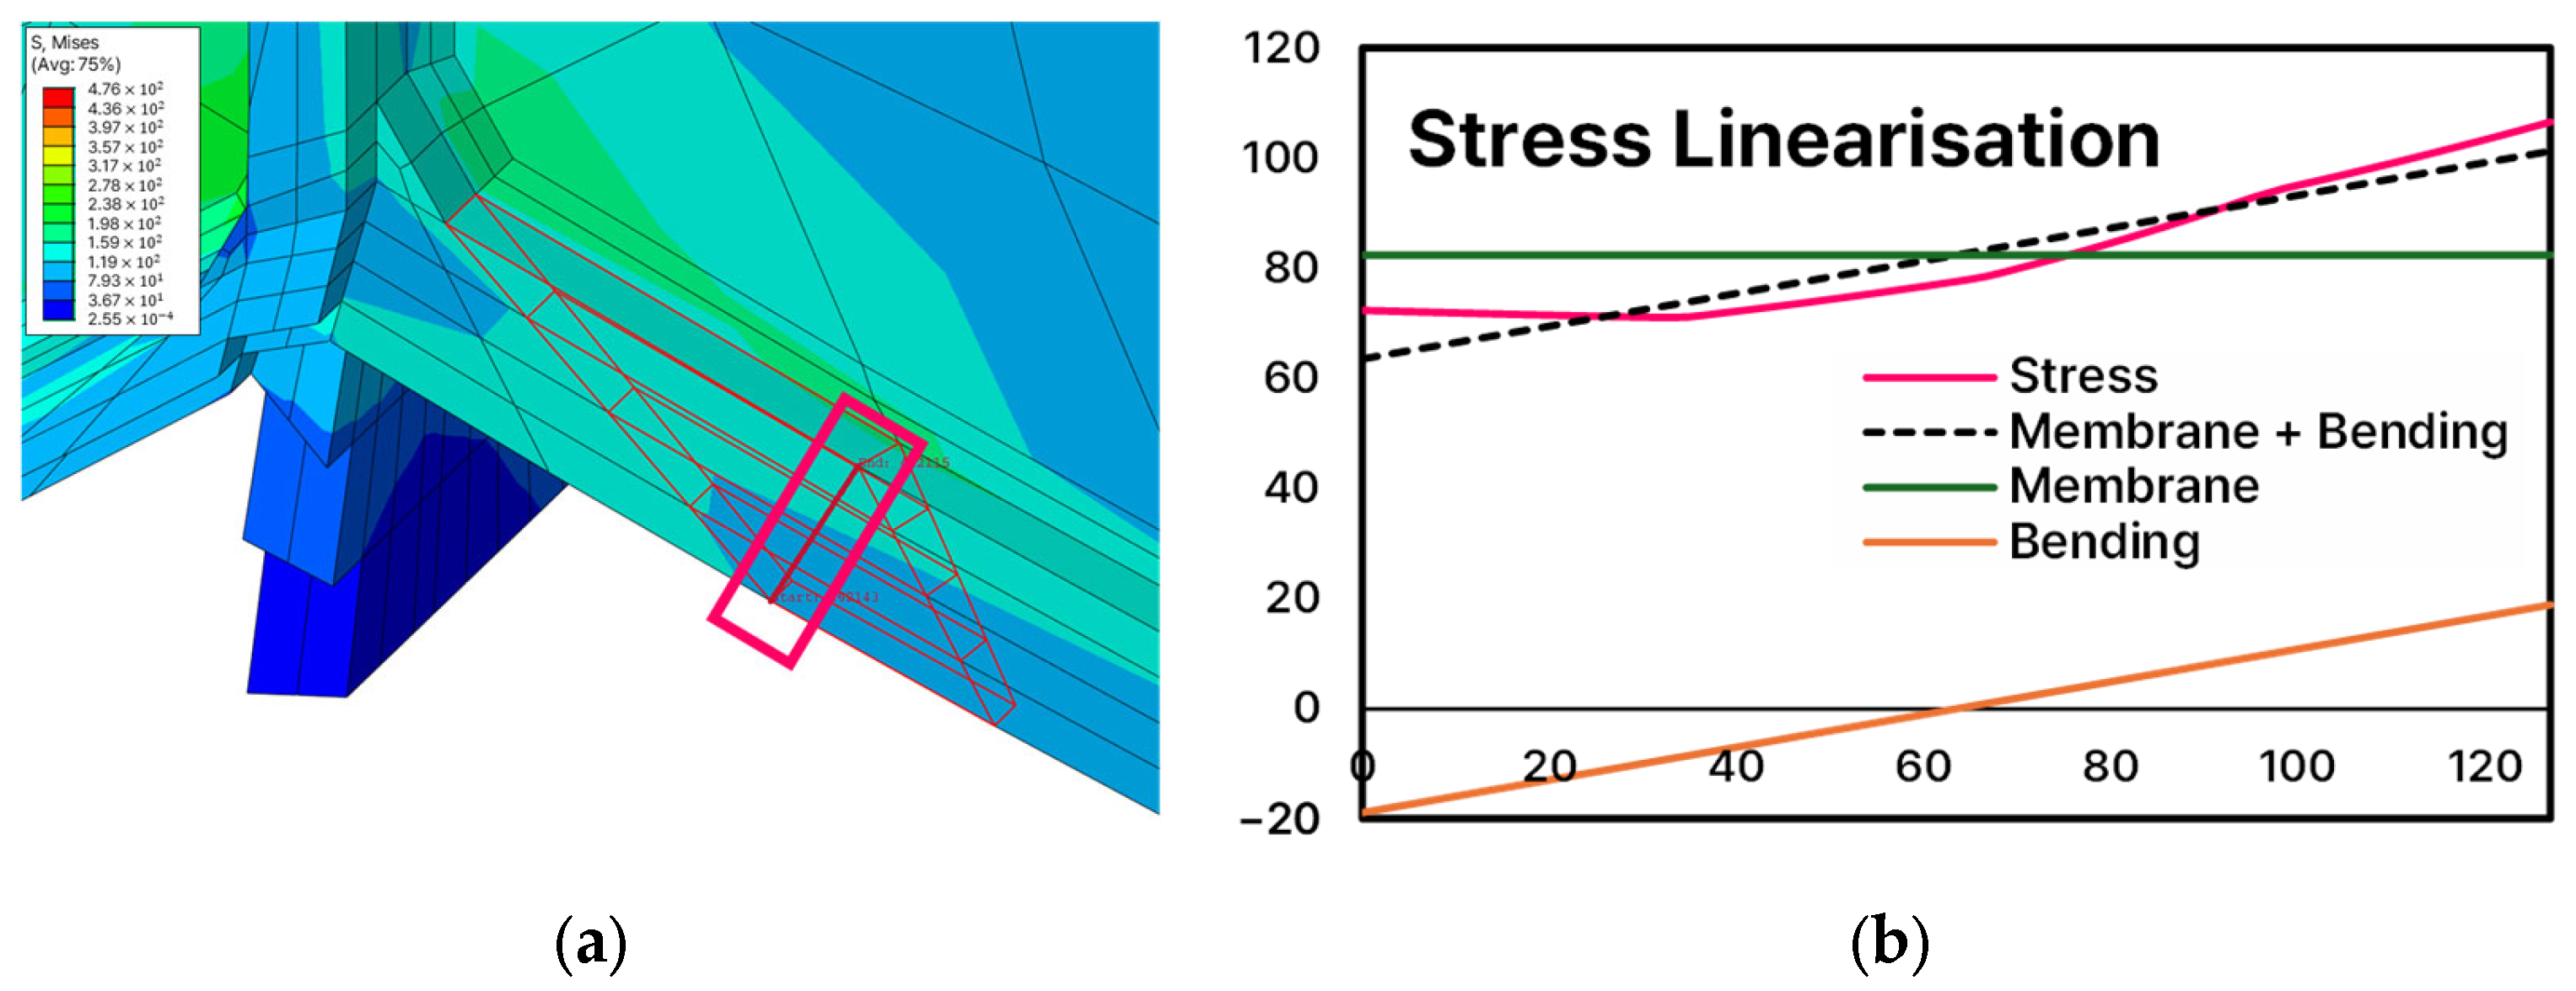
For solid elements, the target section for linearisation shall first be defined. If the section coincides with element edges, stresses can be calculated at (number of elements + 1) locations. Otherwise, when the section intersects element interiors, stresses at the corresponding positions must also be evaluated. In this study, stress linearisation is performed using the Abaqus structural analysis software. After defining the assessment path, it is divided into 40 locations where stresses were extracted. The stress distribution is then linearised by fitting a first-order polynomial. An example of stress linearisation for the solid element model is shown in Figure 9.

3.3. Engineering Critical Assessment

3.3.1. Flaw Characterisation

The flaw geometry adopted in this study is illustrated in Figure 10. Although the LCO2 tank is designed with a curved cylindrical geometry, it is assumed to be a flat plate because the thickness-to-diameter ratio (t/D) is less than 0.1. A surface flaw is considered, as it produces a higher stress intensity factor than an embedded flaw. The initial crack size can be determined by the detection capability of non-destructive testing (NDT). In this study, the initial dimensions were assumed to be a = 6 mm and 2c = 25 mm, corresponding to the minimum detectable size by ultrasonic testing (UT) as recommended in the BS 7910 standard.
For the shell element model, stress magnification factors at the weld toe and root are taken into account. The geometries of the butt weld and cruciform joint are shown in Figure 11, with the overall attachment length between weld toes defined as L = 80 mm.
Fabrication-induced imperfections caused by welding misalignment were also considered. Misalignment can be categorised as angular or axial, both of which introduce additional bending moments under axial loading. In this study, only butt joint misalignments are considered, as they are unavoidable in thickness transition regions. The types of misalignments at butt joints are shown in Figure 12, where the angular misalignment is assumed to be d = 5 mm and the axial misalignment e = 3 mm.

3.3.2. Fracture Assessment Methodology Using ECA

The fracture assessment by the Engineering Critical Assessment (ECA) is performed using an initial crack size of a = 6 mm and 2c = 25 mm. The applied loading conditions are defined at a probability level of 10−8 for the North Atlantic Sea, corresponding to load cases LC1–LC3 (dynamic) and LC4 (static). The assessment points are then plotted on the Failure Assessment Diagram (FAD), and the results of the shell and solid element models are evaluated and compared in terms of the safety factor (FL) and the ratio of Kr to Lr (ϑ).

3.3.3. Fatigue Assessment Methodology Using ECA

The fatigue assessment by the ECA is performed in two steps. First, the final crack dimensions (a, 2c) after fatigue loading are calculated. In this step, only the fatigue crack growth rate of the material is considered; fracture due to the stress intensity factor (SIF) exceeding the material resistance (Kmat) is not taken into account. If the final crack depth (af) exceeds half of the plate thickness (0.5t), the flaw is assessed as a through-thickness crack, which is regarded as unacceptable. The final crack depths obtained from the shell and solid element models are compared. To evaluate the influence of crack growth law data, both the recommended values from the BS 7910 standard and the experimental data are applied and compared.
Second, a fracture assessment is performed based on the final crack size. Since Kr primarily increases with crack length, while Lr slightly increases due to the reduction in sectional area, the assessment point shifts toward the failure assessment line (FAL). Thus, a structure deemed safe at the initial crack size may become unsafe at the final stage. The results of the shell and solid element models were evaluated and compared in terms of the safety factor (FL) and the ratio of Kr to Lr (ϑ).

4. Results

4.1. Stress Distribution

The structural analysis information of the shell element model with five integration points through the thickness and the solid element model with four elements through the thickness, both of which were used for the final structural integrity assessment, is summarised in Table 6. It was observed that although the solid element model involved approximately 2.78 times more elements, the computation time required was about 4.78 times longer.
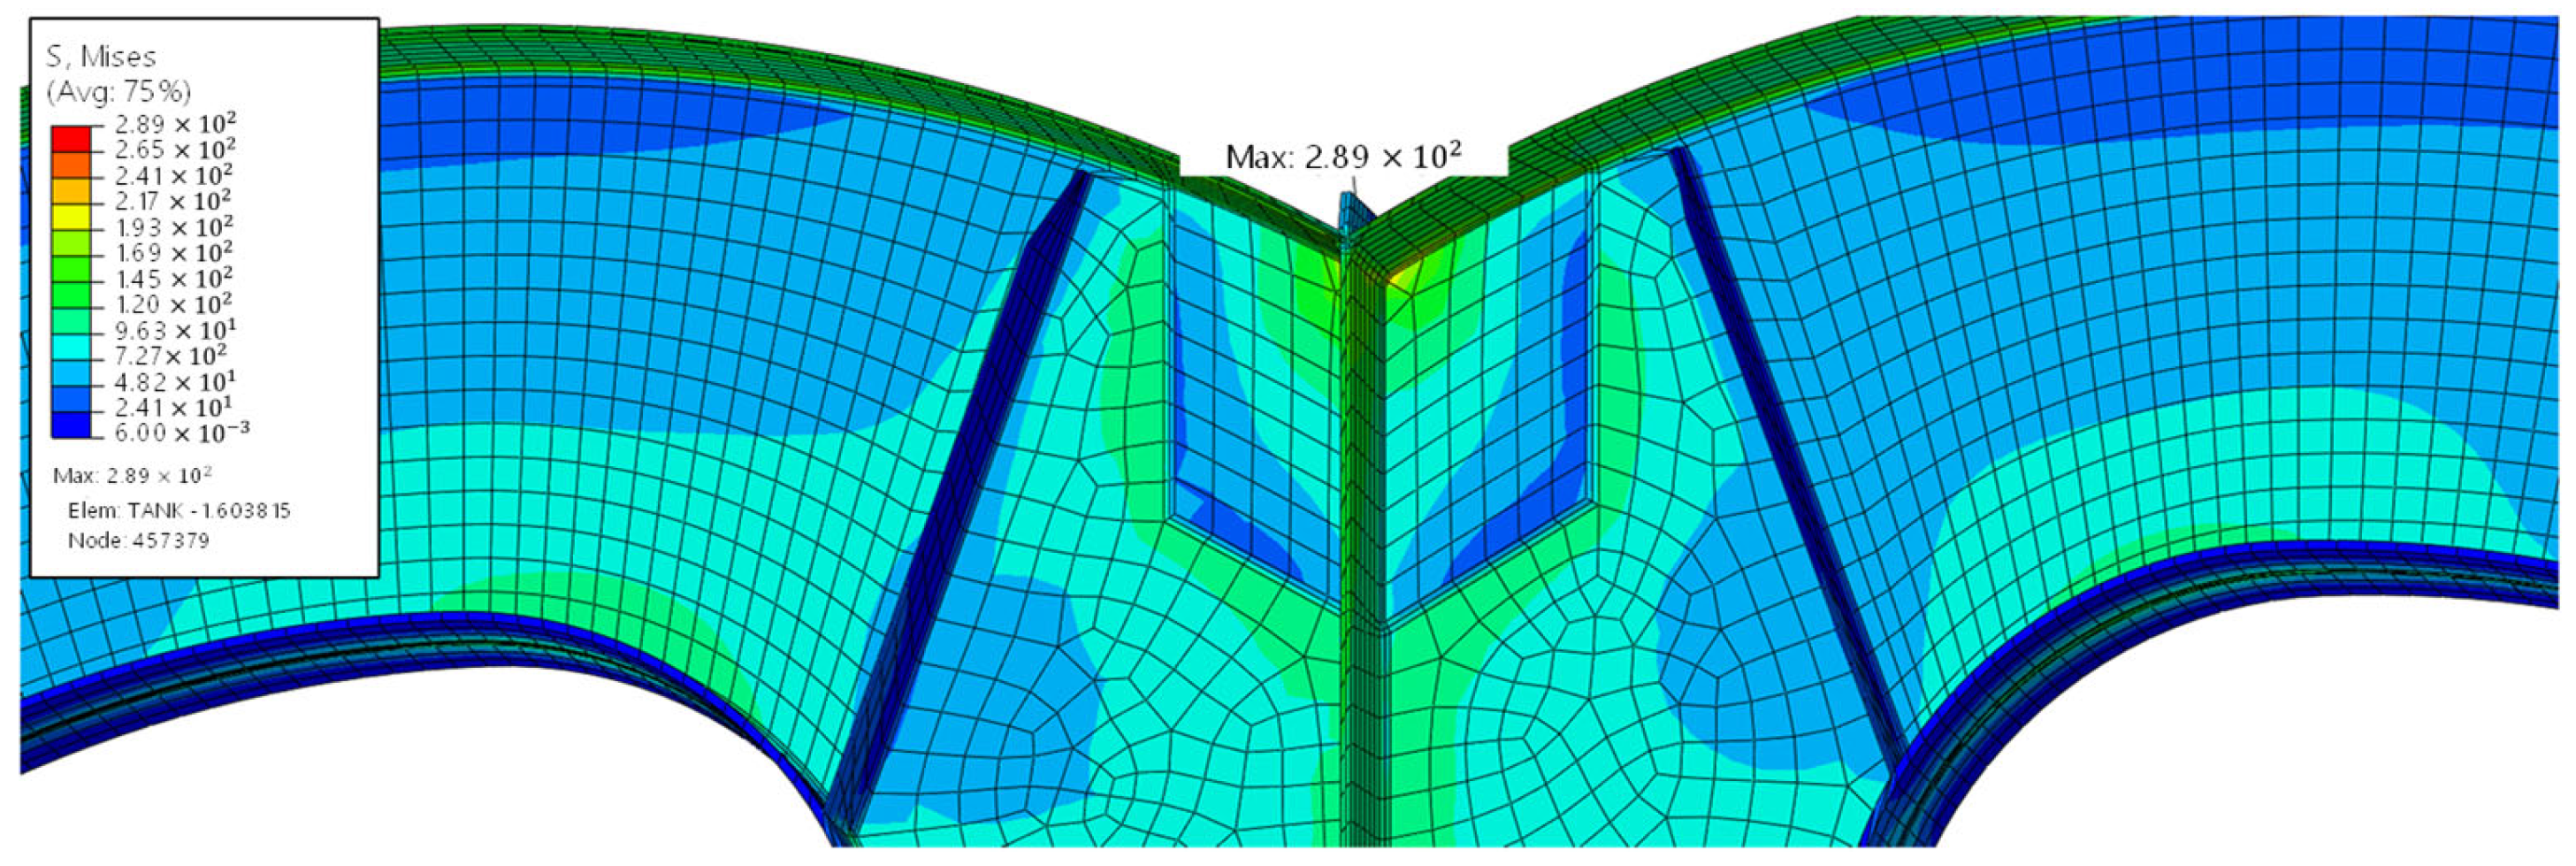
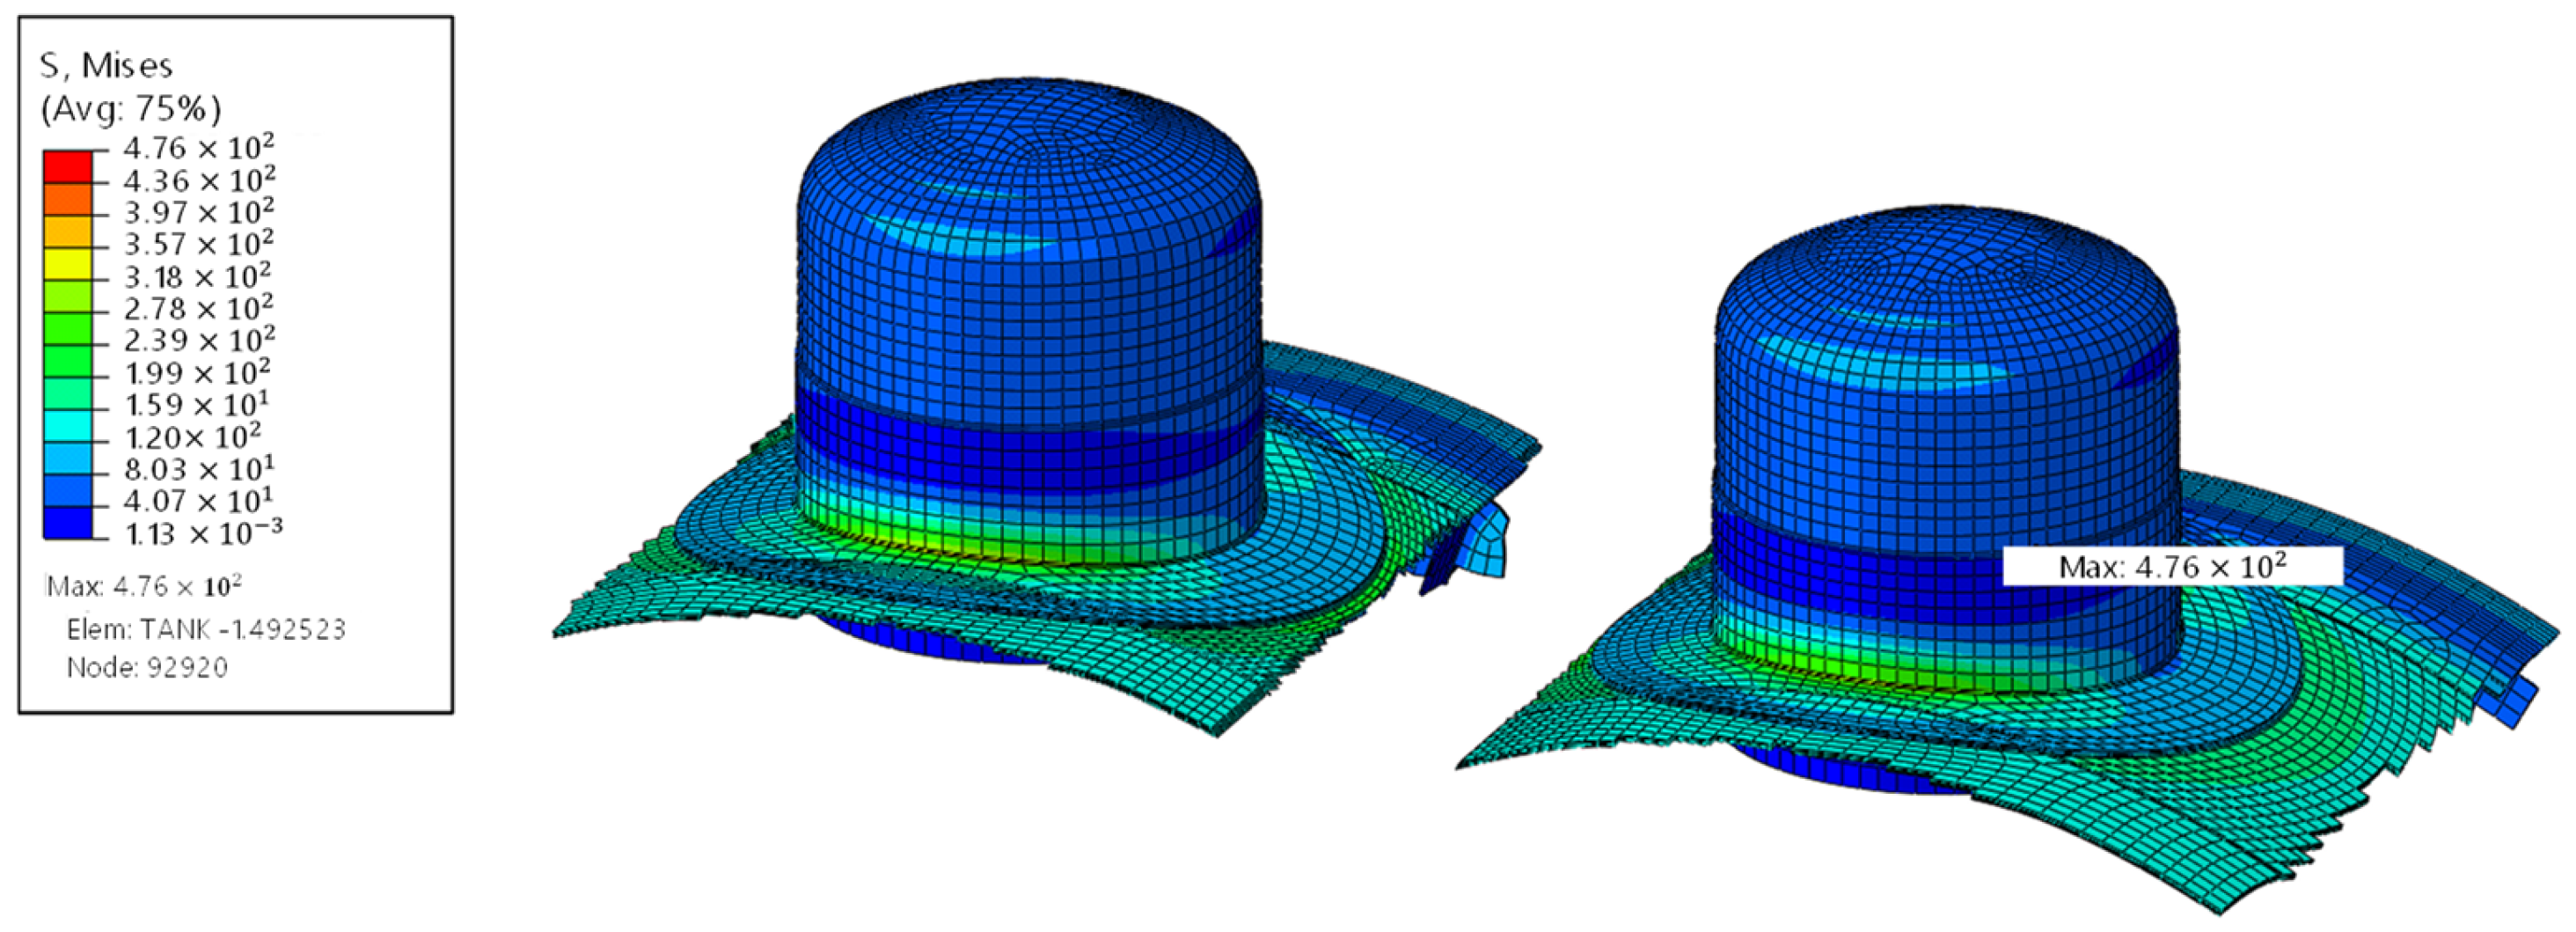
To examine the variation of stress components with thickness, the membrane and bending stresses of the shell and solid element models were calculated at three thickness locations (t = 30 mm, 40 mm, and 50 mm). The corresponding von Mises stress distributions are presented in Figure 13, Figure 14 and Figure 15. The results are summarised in Table 7, Table 8 and Table 9. However, the membrane and bending stresses were obtained by linearising the principal stresses through the thickness, rather than using the von Mises stress directly. The membrane stress component tended to be up to approximately 1.38 times higher in the shell element model as the thickness decreased. Although the bending stress in the shell element model was also higher, there was no clear trend observed for the bending stress component.

4.2. Fracture Assessment Results

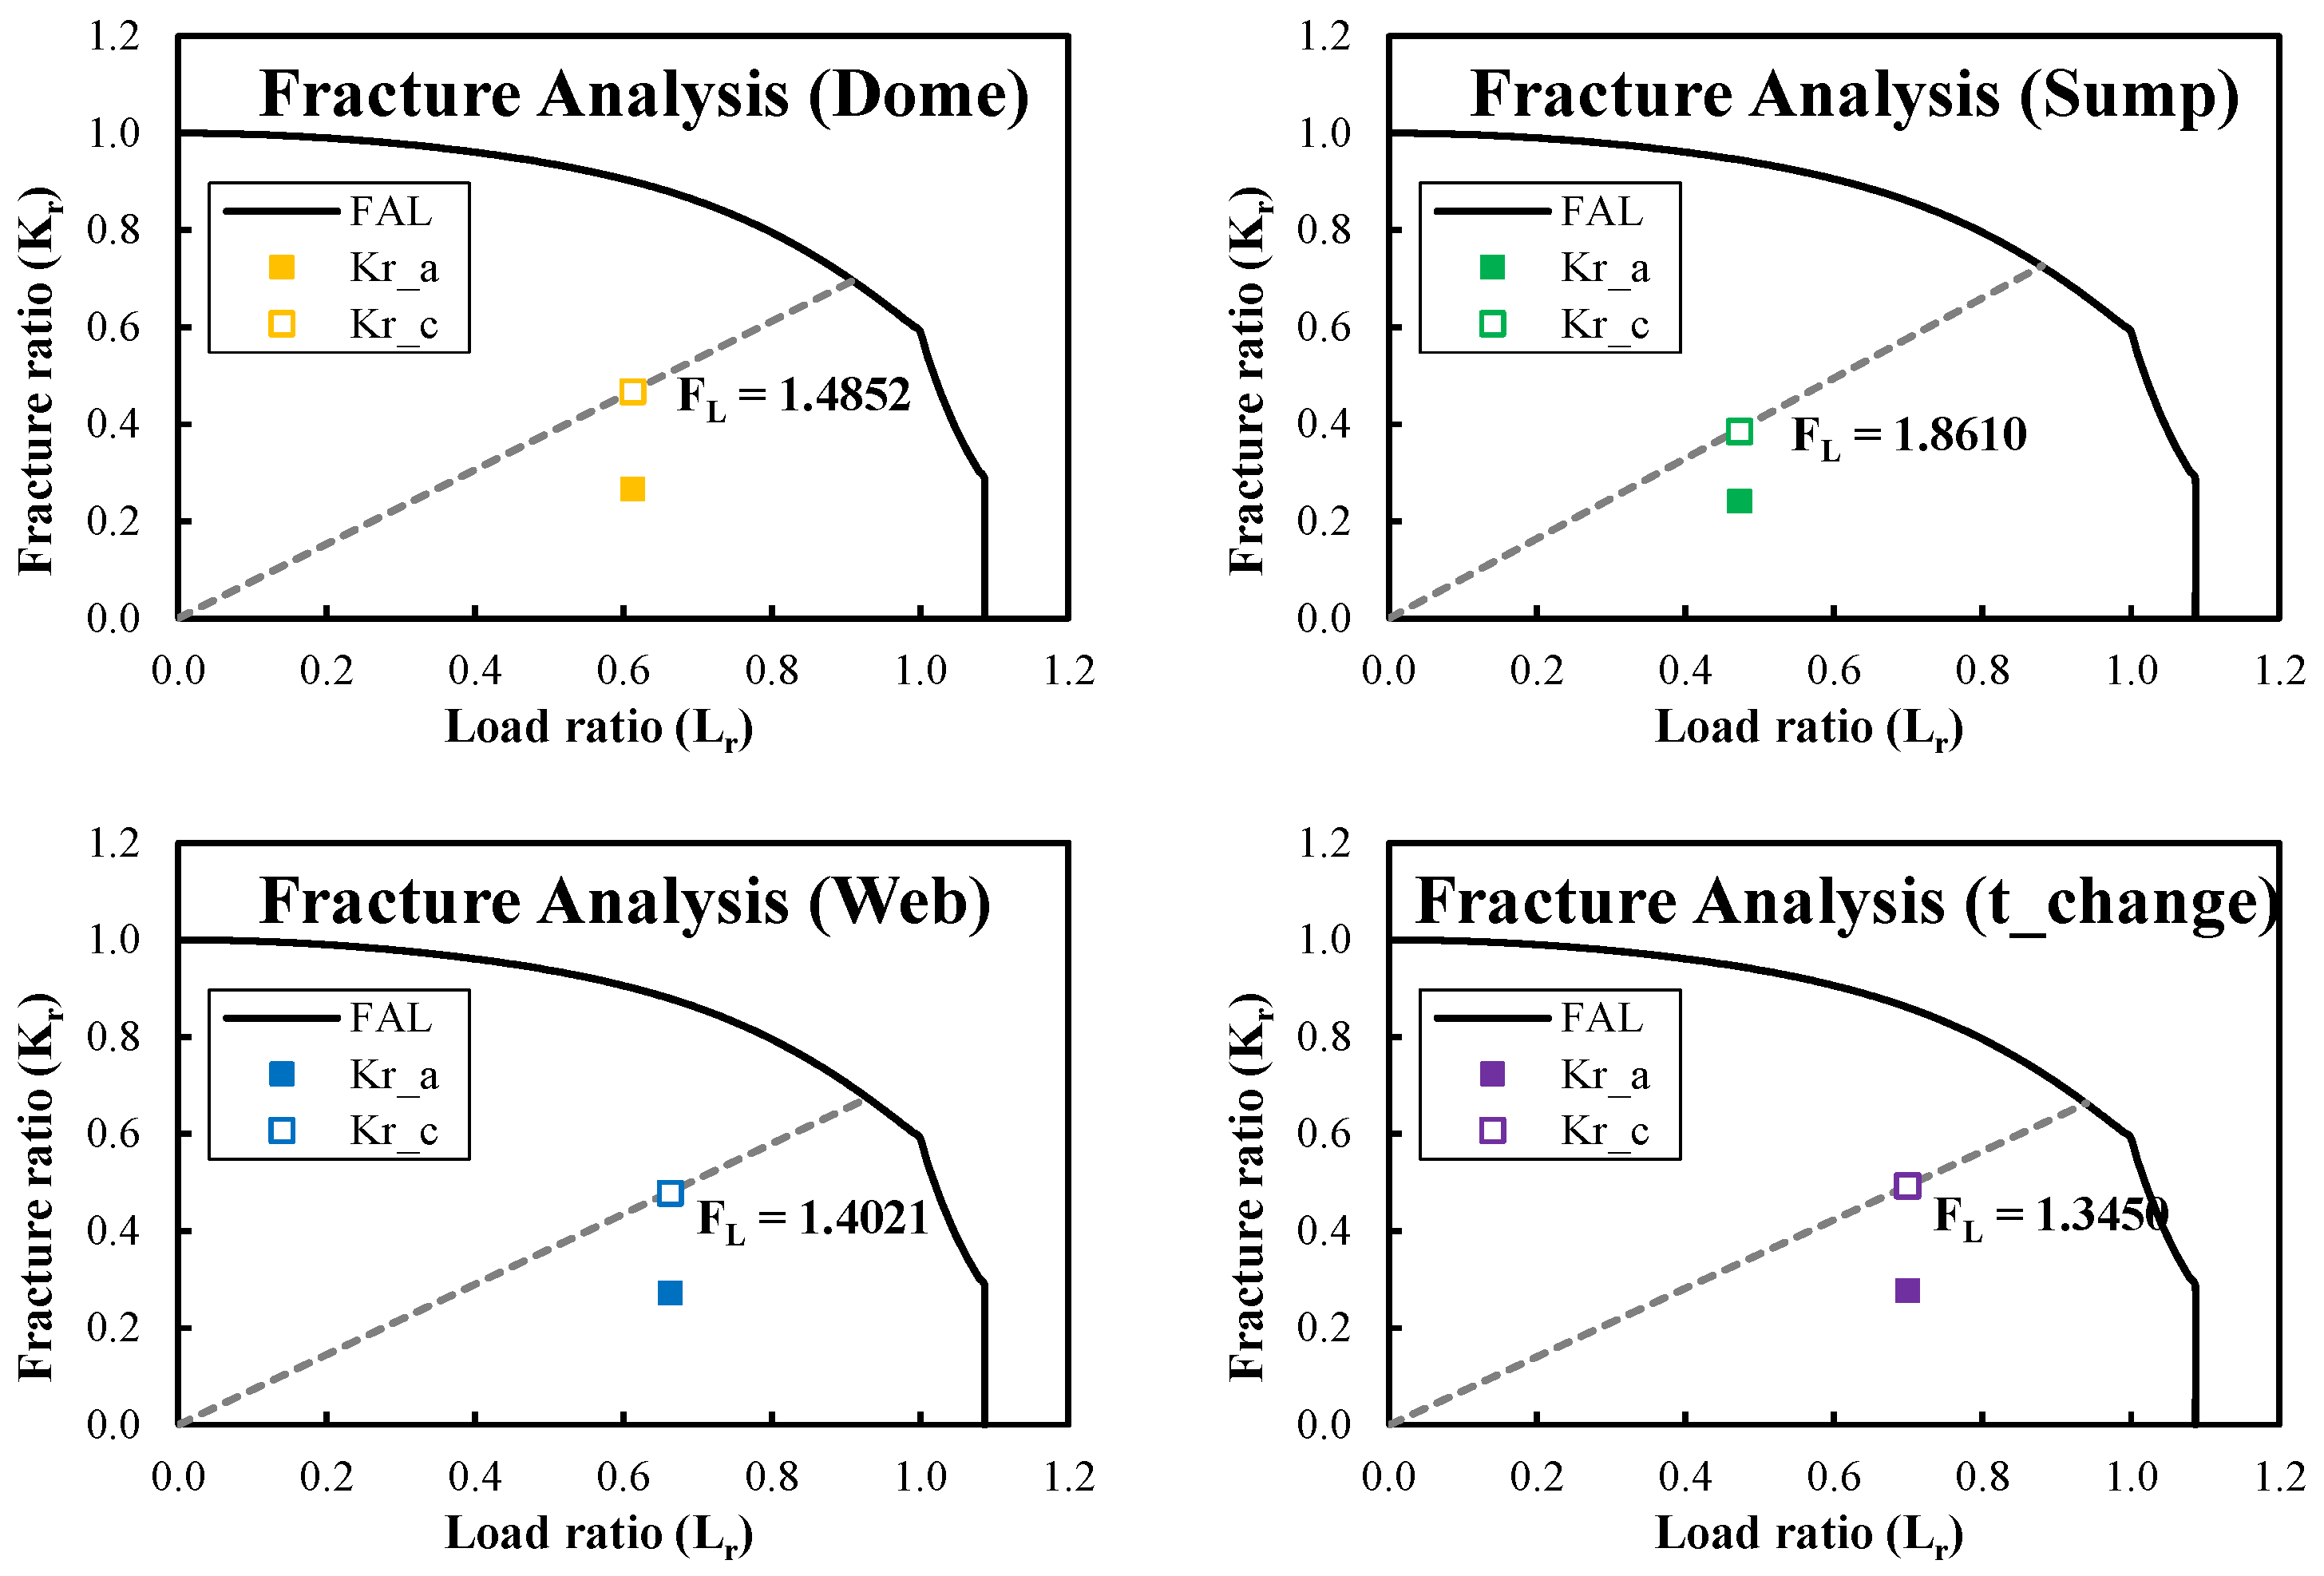
The results of the fracture assessment for three dynamic load cases (LC1–LC3) and one static load case (LC4) are presented in Figure 16. Among the assessed locations, the weld joint at the shell is identified as the most vulnerable, followed by the web.

4.3. Fatigue Assessment Results

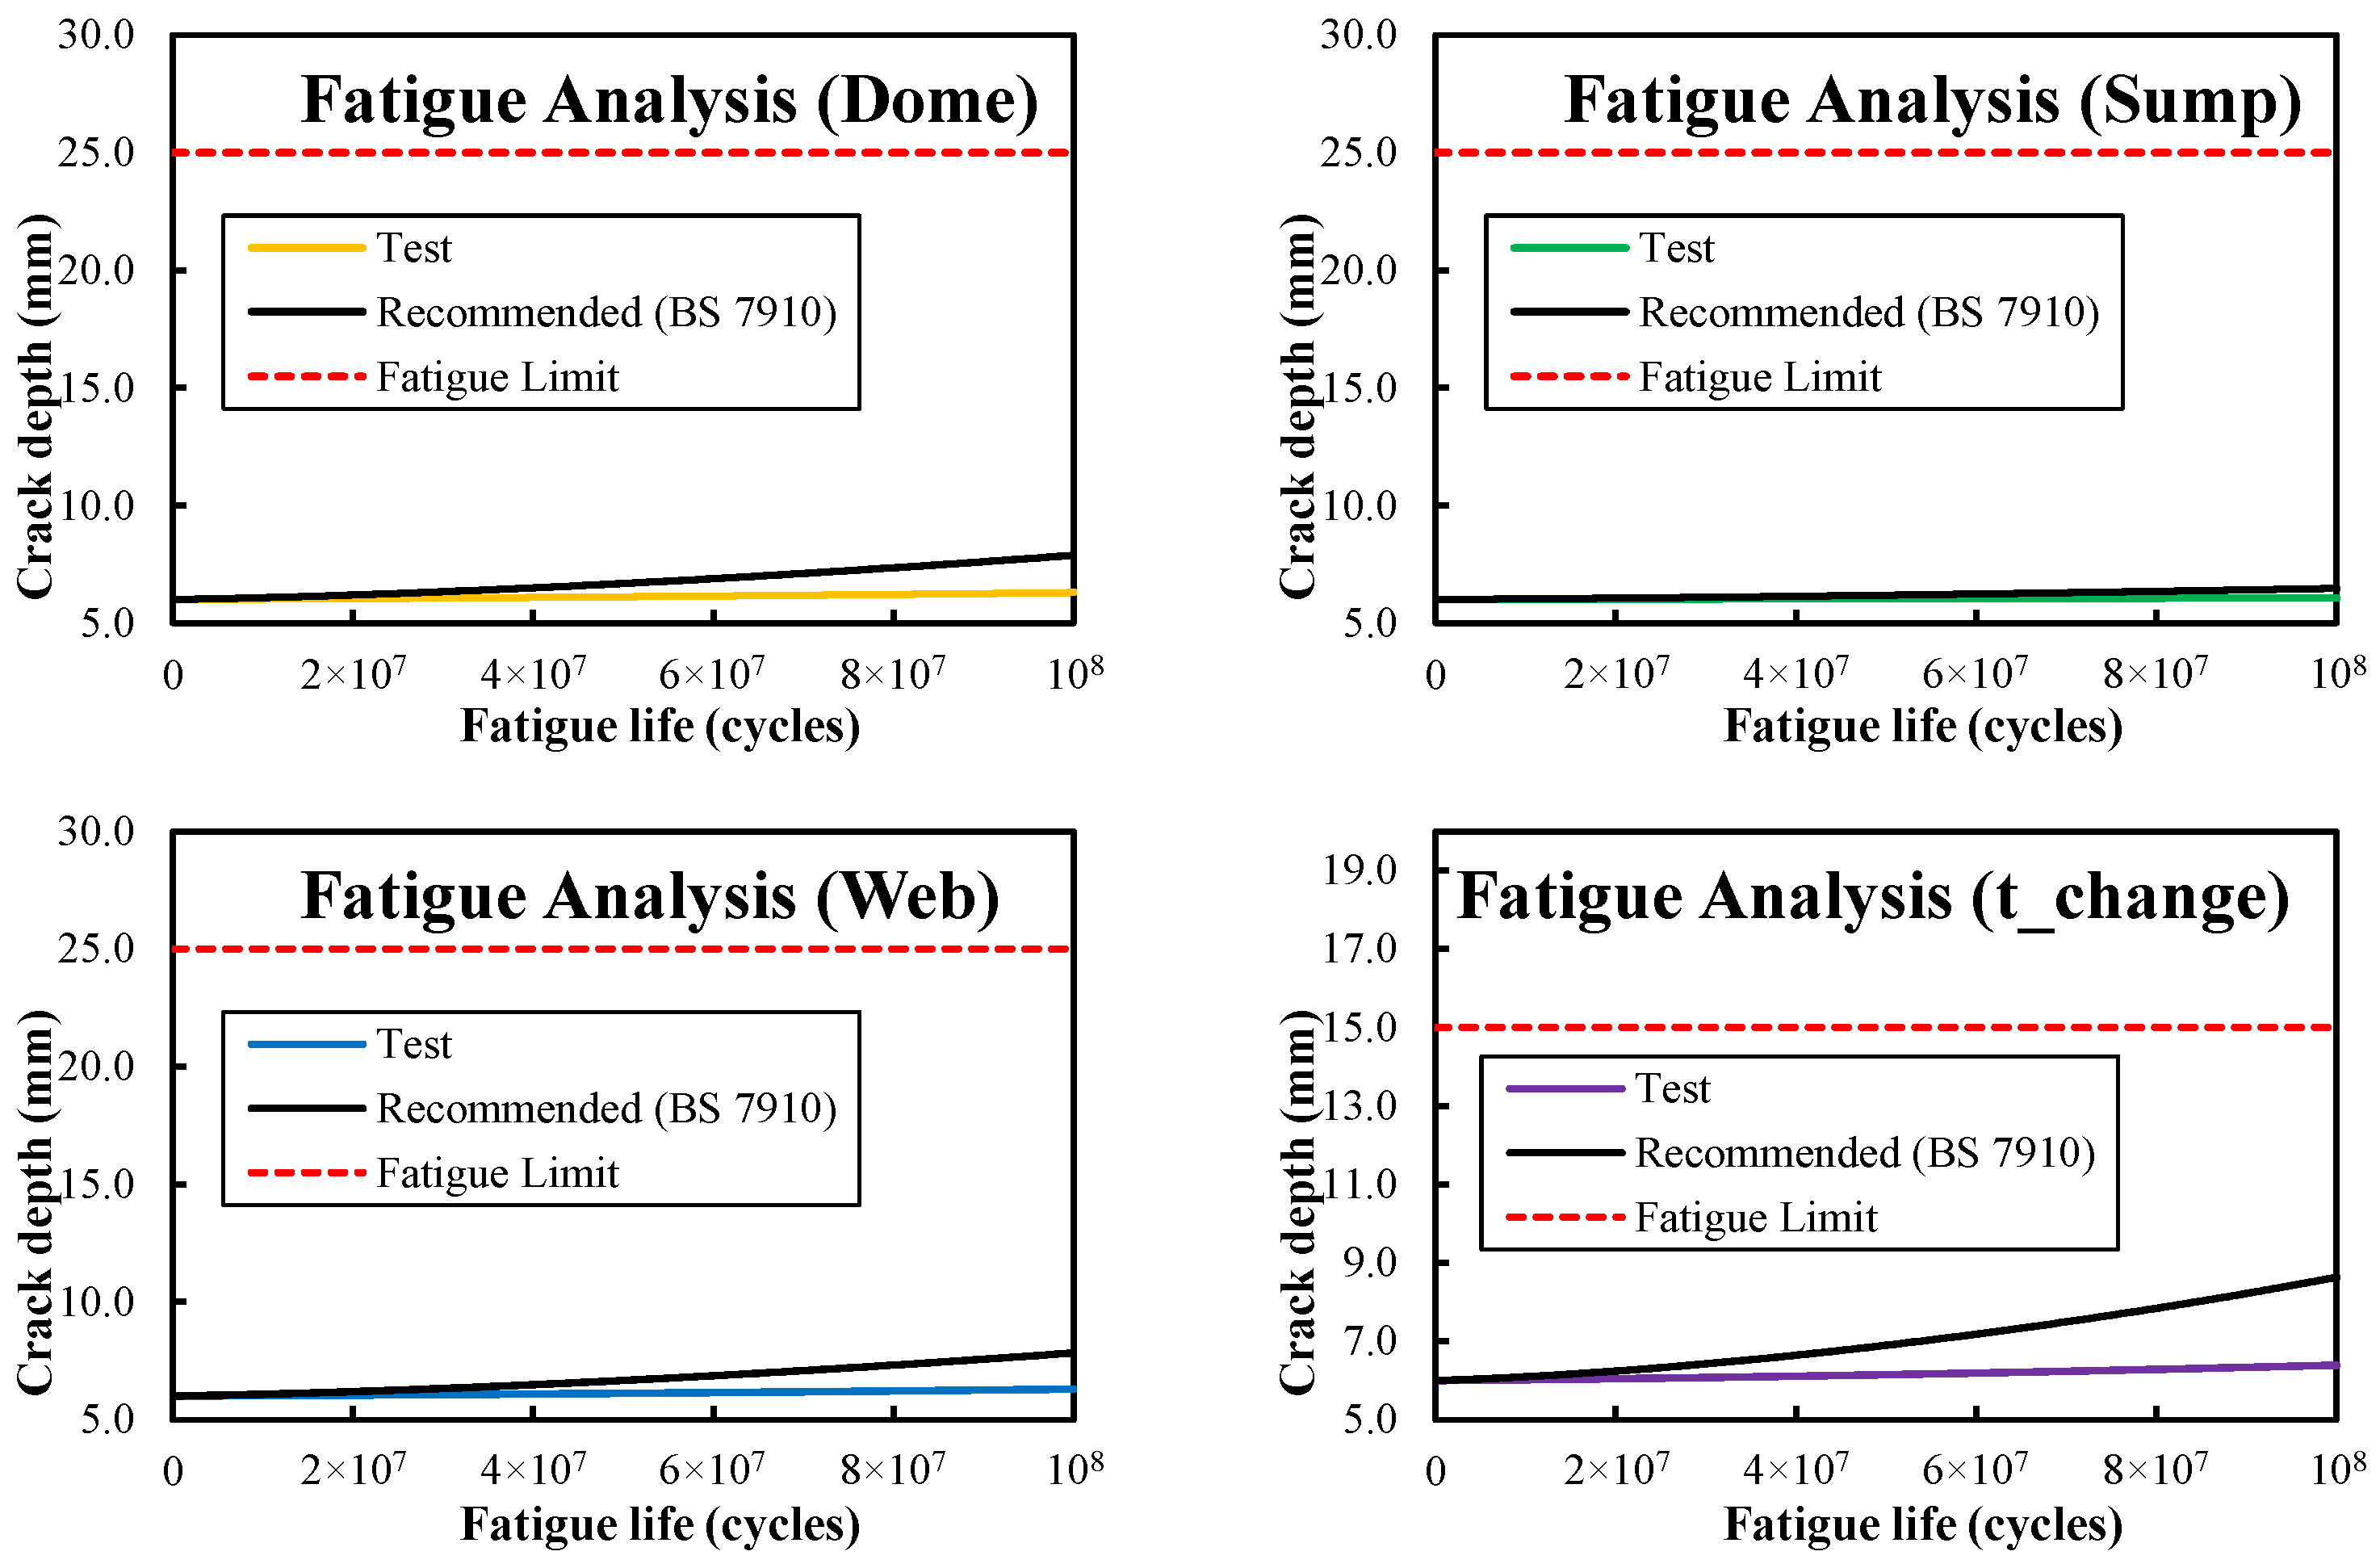
The fatigue assessment results based on the ECA, which utilised the BS 7910 standard, are presented in Figure 17. At all assessment locations, the final crack depth did not exceed 0.5t, which is assumed to represent through-thickness penetration. However, significant variations in the final crack depth were observed depending on the crack growth rate properties applied in the analysis. In the sump, a minimum difference of 5.71 times was observed, whereas in the web, the difference reached 6.62 times.
The fatigue assessment considering fracture, based on the ECA, is presented in Figure 18. The utilisation of fatigue crack growth rates derived from experiments indicated that the crack in the final state would not lead to failure. In the thickness transition region, when the crack growth rate recommended by the BS 7910 standard was applied, the enlarged crack did not result in fracture; however, the safety factor decreased from 1.3075 to 1.1958.
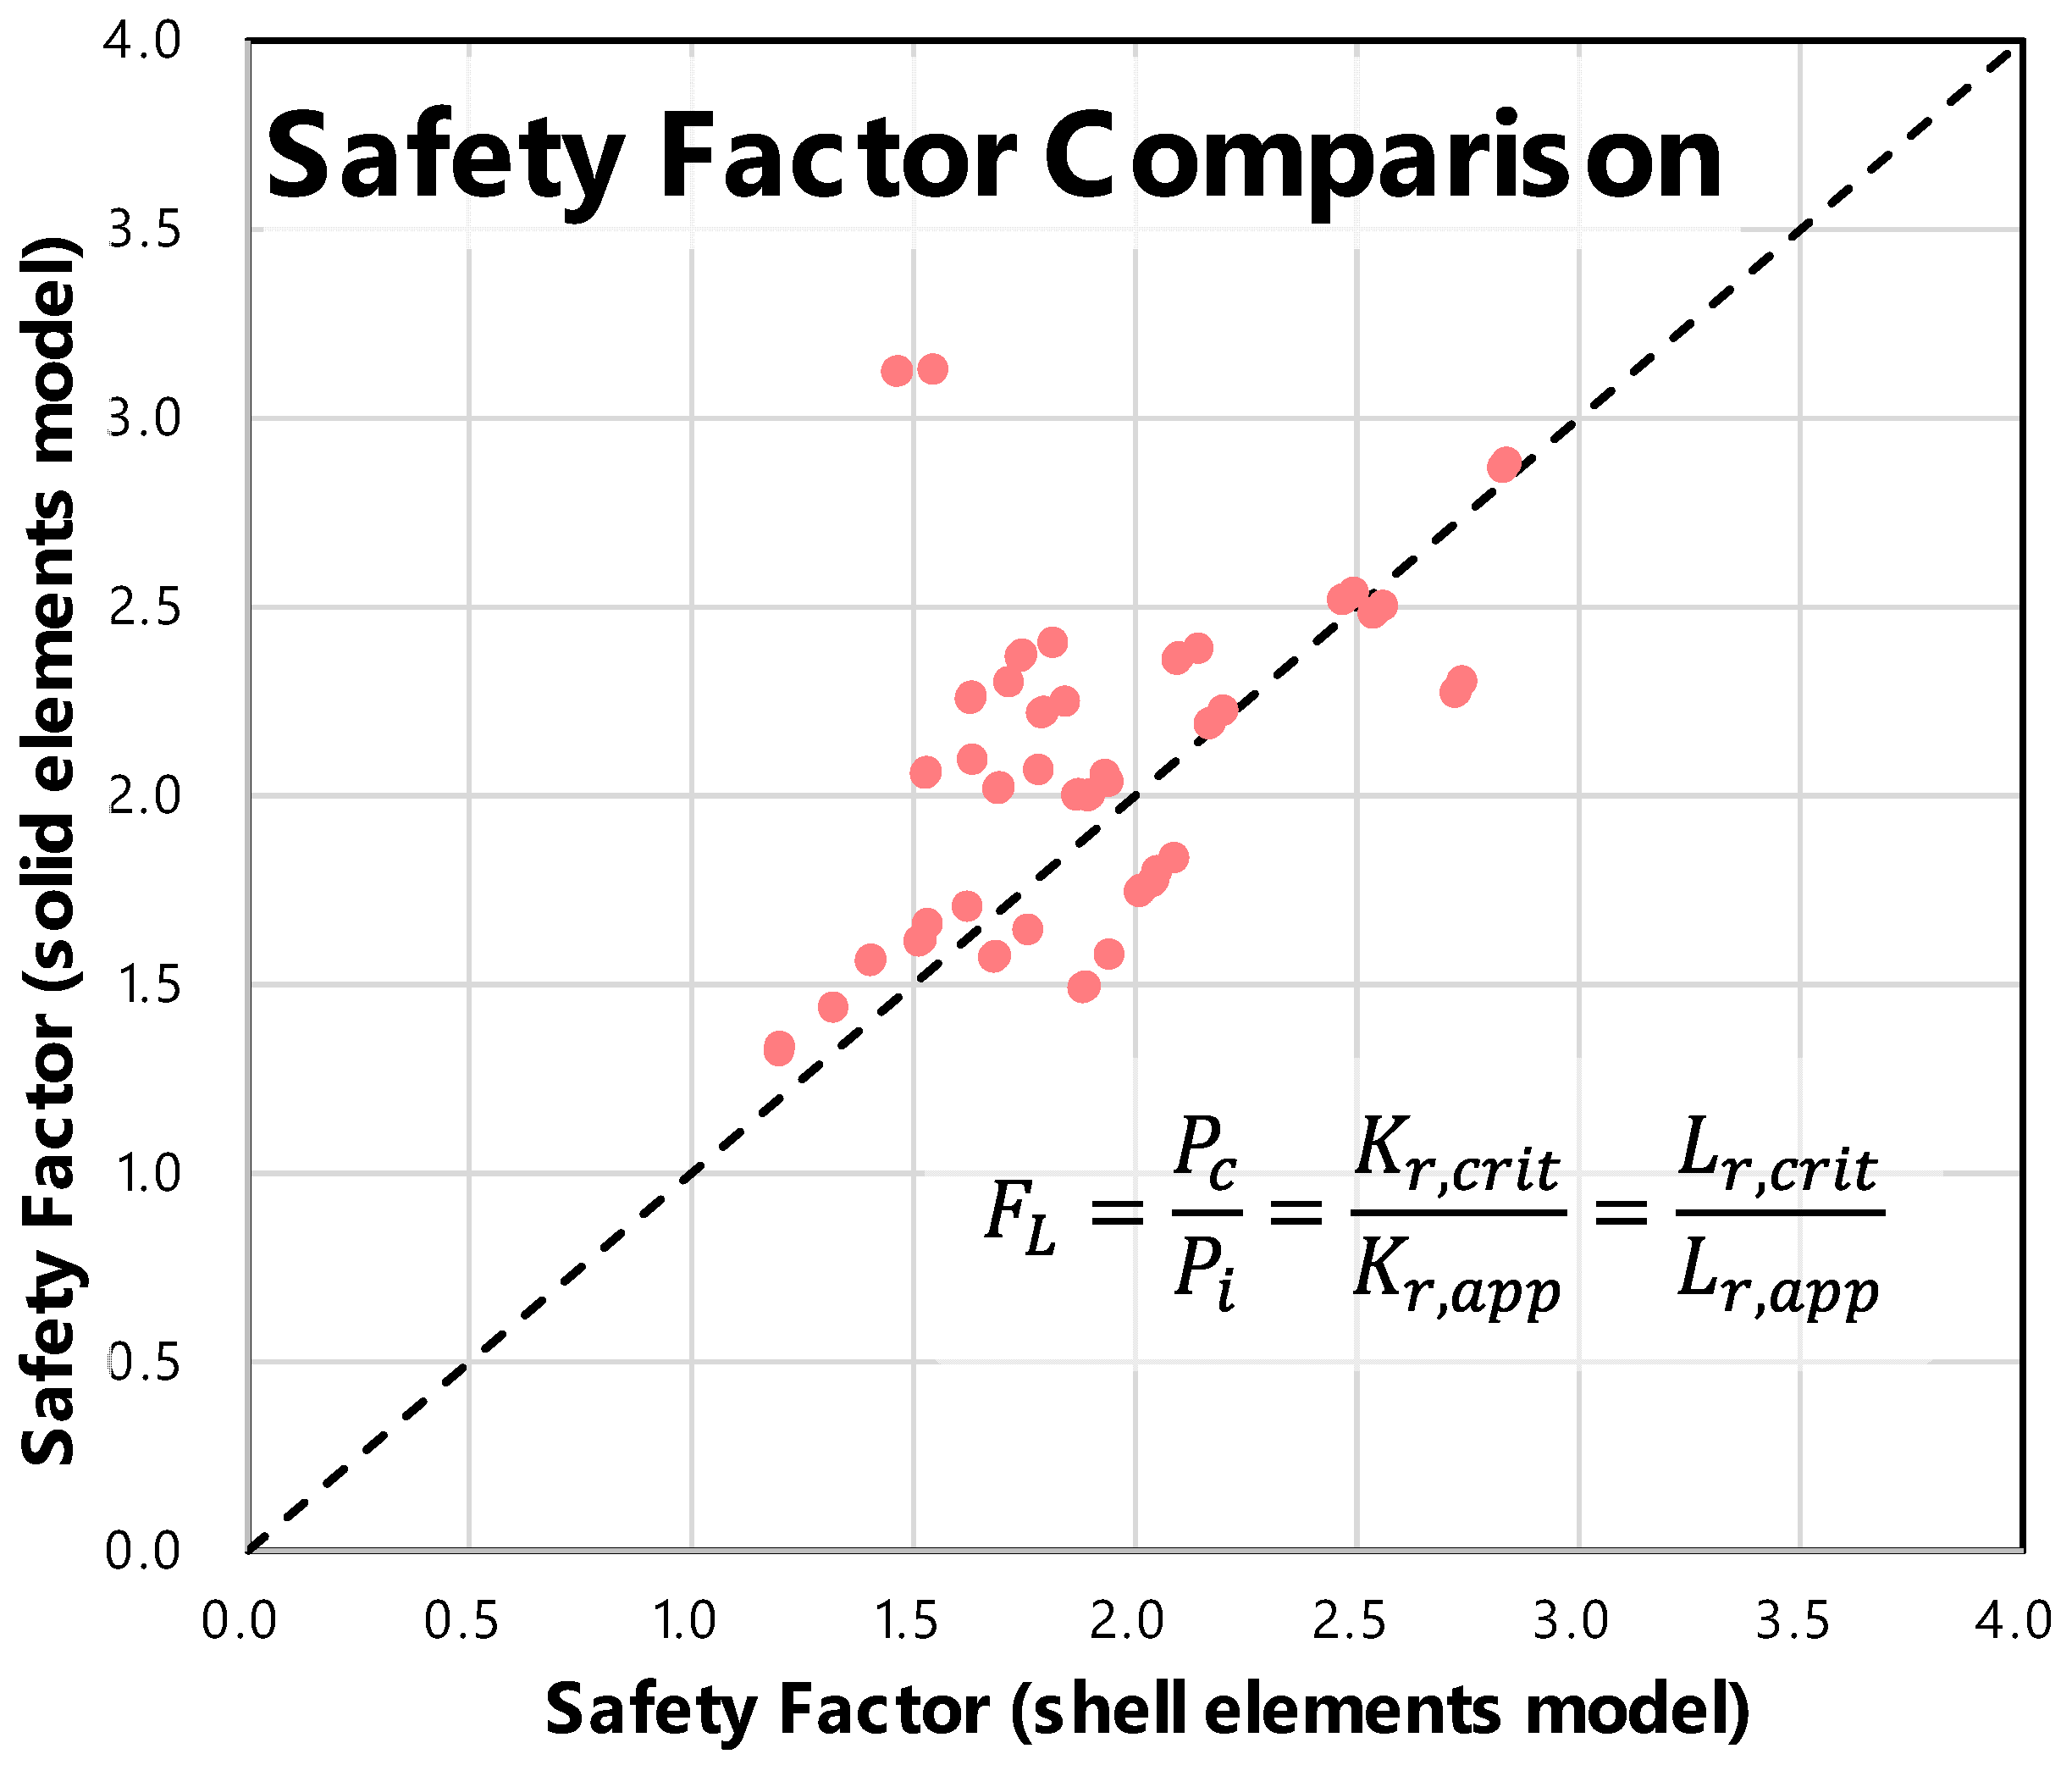
The safety factors calculated from the results were compared by plotting the values of the shell element model on the x-axis and those of the solid element model on the y-axis, as shown in Figure 19. The comparison showed that the safety factors of the solid element model were, on average, 1.12 times higher, with a maximum difference of 2.14 times. The coefficient of variation (Cov) was 0.088, and the correlation coefficient (r) was 0.482, indicating a moderate correlation.

5. Discussion

The comparison between shell and solid element models reveals a balance between computational efficiency and stress prediction accuracy. The shell model effectively captures global structural behaviour with low cost but tends to overestimate membrane stresses due to simplified through-thickness representation. In contrast, the solid model provides more realistic stress distributions, particularly near welds and geometric transitions, albeit with significantly higher computational demand. These differences lead to variations in the Failure Assessment Diagram, where the solid model yields lower Kr and Lr values, indicating that accurate local stress evaluation is crucial for ECA in complex regions. Fatigue analysis revealed that, while overall crack growth trends were consistent across modelling approaches, the final crack depth was highly sensitive to the choice of fatigue crack growth rate (FCGR) dataset, varying by up to a factor of eight. This highlights that material properties, especially fracture toughness and FCGR, exert a greater influence on life prediction than the selection between shell and solid modelling.
The higher fracture risk identified in the web and Y-joint regions is associated with the bilobe tank, where curvature transition and weld-induced discontinuities amplify stress gradients. The solid model captured these localised effects more clearly, implying that a hybrid modelling strategy would provide an effective and practical approach for ECA of bilobe type C tanks. The FCGR datasets used in this study inherently represent different confidence levels within the statistical distribution of crack growth behaviour. While the shell and solid models yielded consistent qualitative trends, the sensitivity of the assessment outcome to FCGR selection underscores the role of material-data uncertainty in operational reliability. Therefore, extending the current deterministic ECA framework toward a probabilistic assessment—incorporating the statistical scatter of FCGR and fracture toughness—would provide a more robust basis for evaluating structural integrity and service life. This is identified as an important direction for future work. Fatigue crack growth predictions are highly dependent on material-specific parameters, supporting the need to consider FCGR dataset variability [27]. While this study focuses on the comparative ECA methodology for liquefied gas tanks, the results are relevant to classification society certification practices, where ECA may be used as an alternative acceptance route to replace or relax PWHT requirements for plate thicknesses up to 50 mm.
In this study, the initial crack size and the fatigue crack growth rate were treated as fixed values, and uncertainties arising from geometric imperfections and load spectra were not considered. Future work may incorporate probabilistic Engineering Critical Assessment (ECA) to account for these uncertainties. Statistical modelling frameworks, such as the symmetric unimodal distribution–based approaches suggested in [28] or the realised PDF-based approach [29], offer a promising basis for extending the deterministic ECA methodology toward reliability-informed structural integrity assessment and digital–twin–based monitoring of LCO2 tanks. Moreover, low-temperature fracture toughness exhibits substantial statistical scatter, as demonstrated in recent compilations of cryogenic fracture data [30].
This analysis was performed for a fixed–sliding support configuration as defined in the tank’s original design. Since the sectional stress distribution—which is critical for stress linearisation in ECA—can vary depending on support and boundary conditions, future work may include a parametric evaluation of support schemes and boundary configurations to examine their influence on stress gradients and ECA results. In addition, the effect of tank supports subjected to high-cycle fatigue loading should also be considered in future assessments. The current assessment framework focuses on static and fatigue loading conditions. Incorporating vibration-induced stress effects represents a valuable direction for further development, particularly for evaluating structural integrity under dynamic operational environments. The reliability of the finite element models depends in part on the discretisation strategy; however, a comprehensive quantitative mesh sensitivity study was not conducted, as the primary objective of this work was to examine the comparative differences between shell and solid element formulations. To ensure the validity of this comparison, the same mesh sizing principles and stress linearisation procedures were applied consistently in both models, so that the relative trends observed remain robust.
For curved shell structures, particularly those containing geometric discontinuities such as bilobe web intersections and welded regions, local mesh refinement is necessary to accurately capture stress gradients and nonlinear deformations. Prior numerical studies recommend increasing element density in these curvature-transition regions to avoid underestimating local stress concentrations [31]. Nevertheless, the structural integrity assessment in this study is governed by the fracture ratio and load ratio, which are derived from the membrane and bending stress components. These linearised stress components are generally less sensitive to localised mesh variations than peak surface stresses. Thus, while local stress magnitudes may vary with refinement, the membrane–bending decomposition used for the Failure Assessment Diagram (FAD) remained stable between the two model types, reinforcing the reliability of the comparative conclusions drawn in this study.
The computational time difference between the shell and solid formulations is explicitly noted in the Results section. However, a definitive performance comparison based on the accuracy per unit of computational cost metric was not included. We recognise the importance of this metric for industrial adoption. Establishing absolute accuracy requires extensive experimental validation or a fully verified analytical solution, which was beyond the scope of this theoretical comparative study. Therefore, we propose to address this quantitative assessment in detail within a future work programme dedicated to experimental validation. The comparison of our simulation results focuses primarily on the internal consistency between the shell and solid finite element formulations. We recognise the absence of direct comparison with experimental verification or external scholarly findings. However, our Engineering Critical Assessment (ECA) framework and stress linearisation methodology rigorously comply with internationally recognised standards. This adherence ensures the methodological reliability of our approach. Obtaining external data that precisely matches our complex, specific geometry and loading conditions was not feasible; thus, validation relies on method compliance and demonstrating the systematic relative differences between the two modelling techniques.

6. Conclusions

In this study, an Engineering Critical Assessment was conducted for the bilobe IMO type C liquid CO2 tank, and the results obtained from the shell and solid element models were systematically compared. The findings of the study can be summarised as follows.
  • Accuracy and computational efficiency: The shell model required significantly fewer elements and reduced computation time, whereas the solid model increased computational cost by a factor of 4.78 to achieve improved local stress resolution.
  • Stress distribution and Kr, Lr distribution: Both models exhibited similar global stress behaviour, but the solid model captured sharper local stress gradients, influencing the membrane/bending stress components and subsequently the fracture ratio (Kr), load ratio (Lr), and safety factor (FL).
  • Fatigue and fracture assessment: While through-thickness crack growth was not predicted, the final crack depth showed sensitivity to FCGR datasets, indicating the importance of accurate crack growth and fracture toughness data for LCO2 tank steels (ex., LTFH36).
  • Characteristics by location: The web and welded intersections of the bilobe shell were consistently identified as critical locations due to geometric and weld-induced stress concentrations.
This study did not consider the effect of tank supports, which are subjected to high-cycle fatigue loading. Nevertheless, the comparative ECA procedure developed here provides valuable insights into the influence of finite element modelling approaches and is expected to serve as a reference for the structural analysis of liquefied gas tanks, particularly in welded regions. This study does not propose a new fracture assessment model; rather, its contribution lies in quantifying the model-form uncertainty associated with the shell and solid element formulations in ECA of bilobe LCO2 tanks. The results show that while shell models are efficient for global integrity assessment, solid models provide improved stress resolution in critical welded and geometrically discontinuous regions. These findings provide a scientific basis for selecting FE modelling complexity according to the assessment purpose, balancing computational cost and the required local accuracy.
Future work will focus on incorporating mesh sensitivity quantification and probabilistic ECA, to account for the statistical scatter of fracture toughness and fatigue crack growth rate data, thereby enabling reliability-based service-life evaluation. Lastly, it is considered necessary to perform more detailed three-dimensional finite element analyses [32], in which the boundary conditions and internal loads are modelled as realistically as possible, to enable a more in-depth investigation.

Author Contributions

Conceptualisation, D.I.K., Y.Y.L. and D.K.K.; methodology, D.I.K.; validation, D.I.K., Y.Y.L., N.-K.C. and J.-H.H.; formal analysis, D.I.K.; investigation, N.-K.C.; resources, D.K.K.; data curation, N.-K.C.; writing—original draft preparation, D.I.K., Y.Y.L. and D.K.K.; writing—review and editing, N.-K.C., J.-H.H. and D.K.K.; visualisation, D.I.K.; supervision, D.K.K.; project administration, D.K.K.; funding acquisition, D.K.K. All authors have read and agreed to the published version of the manuscript.

Funding

This research was supported by Korea Institute for Advancement of Technology (KIAT) grant funded by the Korea Government (MOTIE) (RS-2025-02263945, HRD Program for Industrial Innovation). This research was supported by the Lloyd’s Register Foundation (LRF, Grant No. CGY 100002). This research was a part of the project titled ‘Fostering Talent in Advanced Ship Blue Tech (RS-2025-02221147)’, funded by the Ministry of Oceans and Fisheries, Korea.

Data Availability Statement

The data are not publicly available due to commercial copyright.

Acknowledgments

The authors would like to express their sincere appreciation for the support provided by POSCO. Some parts of the contents are presented in the 35th International Ocean and Polar Engineering Conference (ISOPE2025), Goyang, Korea (https://onepetro.org/ISOPEIOPEC/proceedings-abstract/ISOPE25/ISOPE25/ISOPE-I-25-489/713052, accessed on 14 November 2025).

Conflicts of Interest

The authors declare no conflict of interest.

Nomenclatures

The symbols used in this manuscript are defined as follows:
SymbolDescriptionUnits
aFlaw heightmm
a0Function of V, L0 used in acceleration calculation
AFunction of z, L0, CB used in acceleration calculation
ax, ay, azMaximum dimensionless accelerations normalised by gravitational acceleration
BSection thicknessmm
BsGreatest moulded breadth of the shipm
CMaterial constant for crack growth relationship
CBBlock coefficient of the ship
cHalf flaw lengthmm
d a d N Fatigue crack growth ratemm/cycle
FLSafety factor defined by load ratio on FAD
fwFinite width correction factor
KRoll correction factor for acceleration calculation
KcCritical stress intensity factor MPa m
KIStress intensity factor for tensile load (mode I) MPa m
KmatMaterial fracture toughness MPa m
KrFracture ratio
KthStress intensity factor for fatigue crack growth threshold MPa m
kmStress intensity factor due to misalignment
ktbBending stress concentration factor
ktmMembrane stress concentration factor
LrLoad ratio
L0Length of the ship for scantlings
MBulging correction factor
MbBending stress intensity magnification factor for flaws
MmMembrane stress intensity magnification factor for flaws
MkbBending stress intensity magnification factor for welded joints
MkmMembrane stress intensity magnification factor for welded joints
mExponent in flaw growth law
NStrain hardening coefficient
ndNumber of total cyclescycle
PbPrimary bending stressMPa
PcCritical assessment point on FAD
PiInitial assessment point on FAD
PmPrimary membrane stressMPa
P0Design pressure of the tankMPa
QbSecondary bending stressMPa
QmSecondary membrane stressMPa
TcargoDesign temperature of the tank
TdDesign life in secondss
TroomRoom temperature (typically 40 °C)
VService speed of the shipknots
WStructure widthmm
xLongitudinal distance from midships to the centre of gravity of the tankm
YStress intensity correction factor
(Yσ)pPrimary stress intensity correction
(Yσ)sSecondary stress intensity correction
yTransverse distance from centreline to the centre of gravity of the tankm
zVertical distance from waterline to the centre of gravity of the tankm
α″Parameter used in calculation of collapse stresses
ΔKStress intensity factor range MPa m
ϑAssessment angle on the FAD°
μParameter for constructing FAL
σbottomStress at the bottom surface of the plateMPa
σrefReference stressMPa
σtopStress at the top surface of the plateMPa
σuTensile strengthMPa
σYYield stressMPa
υ0Average zero-crossing frequencyHz

References

  1. Deng, S.; Mi, Z. A review on carbon emissions of global shipping. Mar. Dev. 2023, 1, 4. [Google Scholar] [CrossRef]
  2. OECD. Maritime Transport CO2 Emissions. Available online: https://www.oecd.org/en/data/datasets/maritime-transport-co2-emissions.html (accessed on 20 July 2025).
  3. International Maritime Organization (IMO). 2023 IMO Strategy on Reduction of GHG Emissions from Ships; IMO Publishing: London, UK, 2023. [Google Scholar]
  4. BP. Energy Outlook: 2024 Edition. 2024. Available online: https://www.bp.com/en/global/corporate/energy-economics/energy-outlook.html (accessed on 11 October 2024).
  5. Al Baroudi, H.; Awoyomi, A.; Patchigolla, K.; Jonnalagadda, K.; Anthony, E.J. A review of large-scale CO2 shipping and marine emissions management for carbon capture, utilisation and storage. Appl. Energy 2021, 287, 116510. [Google Scholar] [CrossRef]
  6. International Maritime Organization (IMO). International Code of the Construction and Equipment of Ships Carrying Liquefied Gases in Bulk (IGC Code); IMO Publishing: London, UK, 2016. [Google Scholar]
  7. International Association of Classification Societies (IACS). UR W1: Material and Welding for Ships Carrying Liquefied Gases in Bulk and Ships Using Gases or Other Low-Flashpoint Fuels; International Association of Classification Societies: London, UK, 2021. [Google Scholar]
  8. BS 7910:2019; Guide to Methods for Assessing the Acceptability of Flaws in Metallic Structures. British Standards Institution: London, UK, 2019.
  9. EDF Energy. R6: Assessment of the Integrity of Structures Containing Defects; EDF Energy: Gloucester, UK, 2019. [Google Scholar]
  10. API 579-1/ASME FFS-1; Fitness-For-Service. American Petroleum Institute: Washington, DC, USA, 2021.
  11. Radu, D.; Sedmak, A.; Sedmak, S.; Li, W. Engineering critical assessment of steel shell structure elements welded joints under high cycle fatigue. Eng. Fail. Anal. 2020, 114, 104578. [Google Scholar] [CrossRef]
  12. Rezaie, Y.; Sharifi, S.M.H.; Rashed, G.R. Probabilistic fracture assessment of snake laid pipelines under high pressure/high temperature conditions by engineering critical assessment. Eng. Fract. Mech. 2022, 271, 108592. [Google Scholar] [CrossRef]
  13. He, M.; Pang, M.; Chen, N.Z. Engineering critical assessment (ECA) for monopile foundation of an offshore wind turbine subjected to pitting. Ocean Eng. 2023, 285, 115400. [Google Scholar] [CrossRef]
  14. Seo, J.H.; Park, K.S.; Cha, I.; Choung, J. Engineering Critical Assessement for an Independent Type-B LNG Cargo Tank. J. Soc. Nav. Archit. Korea 2023, 60, 213–221. [Google Scholar] [CrossRef]
  15. Kim, B.I.; Kim, K.T.; Islam, M.D.S. Development of Strength Evaluation Methodology for Independent IMO TYPE C Tank with LH2 Carriers. J. Ocean Eng. Technol. 2024, 38, 87–102. [Google Scholar] [CrossRef]
  16. Kim, J.; Park, K.S.; Cha, I.; Choung, J. Structural Integrity Assessments of an IMO Type C LCO2 Cargo Tank. J. Mar. Sci.Technol. 2025, 13, 1479. [Google Scholar] [CrossRef]
  17. Conti, F.; Aubert, J.-M. Engineering Critical Assessment for Alternative Materials to IGC Code for LCO2 Carriers Type-C Tanks. In Proceedings of the ASME 2024 43rd International Conference on Ocean, Offshore and Arctic Engineering, Singapore, 9–14 June 2024. [Google Scholar]
  18. Zhen, Y.; Cao, Y.; Li, F.; Li, W.; Wu, G. A Pressure Decompression Model-Based Finite Element Approach for Efficient Dynamic Fracture Analysis in CO2 Pipelines. Fatigue Fract. Eng. Mater. Struct. 2025, 48, 4245–4258. [Google Scholar] [CrossRef]
  19. Anderson, T.L. Fracture Mechanics: Fundamentals and Applications, 4th ed.; CRC Press: Boca Raton, FL, USA, 2017. [Google Scholar]
  20. Lin, Y.Y.; Jang, B.S.; Han, S.W.; Park, Y.H.; Hwang, J.; Kim, D.K. Cutting-edge insights: Crack growth rates in 9% Ni steel from room to cryogenic conditions influenced by crack closure and effective stress intensity factors. Eng. Fract. Mech. 2024, 301, 110014. [Google Scholar] [CrossRef]
  21. Lin, Y.Y.; Park, K.S.; Hwang, J.; Cho, N.K.; Kim, D.K. Advanced techniques for residual stress measurement and data processing in fatigue crack growth rate tests of FH36 and 9% Ni steel at cryogenic temperatures. Ocean Eng. 2025, 316, 119942. [Google Scholar] [CrossRef]
  22. ASTM E1820-2024; Standard Test Method for Measurement of Fracture Toughness. ASTM International: West Conshohocken, PA, USA, 2024.
  23. BS 7448-1:1991; Fracture Mechanics Toughness Tests—Method for Determination of KIC, Critical CTOD and Critical J Values of Metallic Materials. British Standards Institution: London, UK, 1991.
  24. ISO 12135:2021; Metallic Materials—Unified Method of Test for the Determination of Quasistatic Fracture Toughness. International Organization for Standardization: Geneva, Switzerland, 2021.
  25. ASTM E647-24; Standard Test Method for Measurement of Fatigue Crack Growth Rates. ASTM International: West Conshohocken, PA, USA, 2024.
  26. Lin, Y.Y.; Kim, Y.-J.; Cho, N.-K.; Hwang, J.H.; Park, K.-S.; Kim, D.I.; Mehmanparast, A.; Kim, D.K. Technical Recommendations for Metallic C(T) and SEN(B) Fracture Toughness Test Specimens: Data-driven Insights from Literature. Results Eng. 2025, 28, 108117. [Google Scholar] [CrossRef]
  27. Abul Kashem Mohammad, Y.; Mohammad, S. Recent developments and challenges in fracture mechanics–based fatigue life prediction. ASRC Procedia Glob. Perspect. Sci. Scholarsh. 2025, 1, 1202–1237. [Google Scholar] [CrossRef]
  28. Tukeev, D.L.; Afanaseva, O.V.; Tulyakov, T.F. Realization of Statistical Models Based on Symmetric Unimodal Distributions. Int. J. Eng. 2026, 39, 407–419. [Google Scholar] [CrossRef]
  29. Saifi, Q. Novel probabilistic crack growth assessment method: Based on the realised PDF law for growing cracks. Eng. Fract. Mech. 2022, 276, 108931. [Google Scholar] [CrossRef]
  30. Fan, X.; Chen, S.; Steingrimsson, B.; Xiong, Q.; Li, W.; Liaw, P.K. Dataset for Fracture and Impact Toughness of High-Entropy Alloys. Sci. Data 2023, 10, 37. [Google Scholar] [CrossRef] [PubMed]
  31. Kim, D.K.; Ban, I.; Poh, B.Y.; Shin, S.-C. A useful guide of effective mesh-size decision in predicting the ultimate strength of flat- and curved plates in compression. J. Ocean Eng. Sci. 2023, 8, 401–417. [Google Scholar] [CrossRef]
  32. Wang, Z.; Kong, W.; Wu, S.; Li, S.; Kim, D.K. A guidance of solid element application in predicting the ultimate strength of flat plates in compression. J. Ocean Eng. Sci. 2023, 10, 661–677. [Google Scholar] [CrossRef]
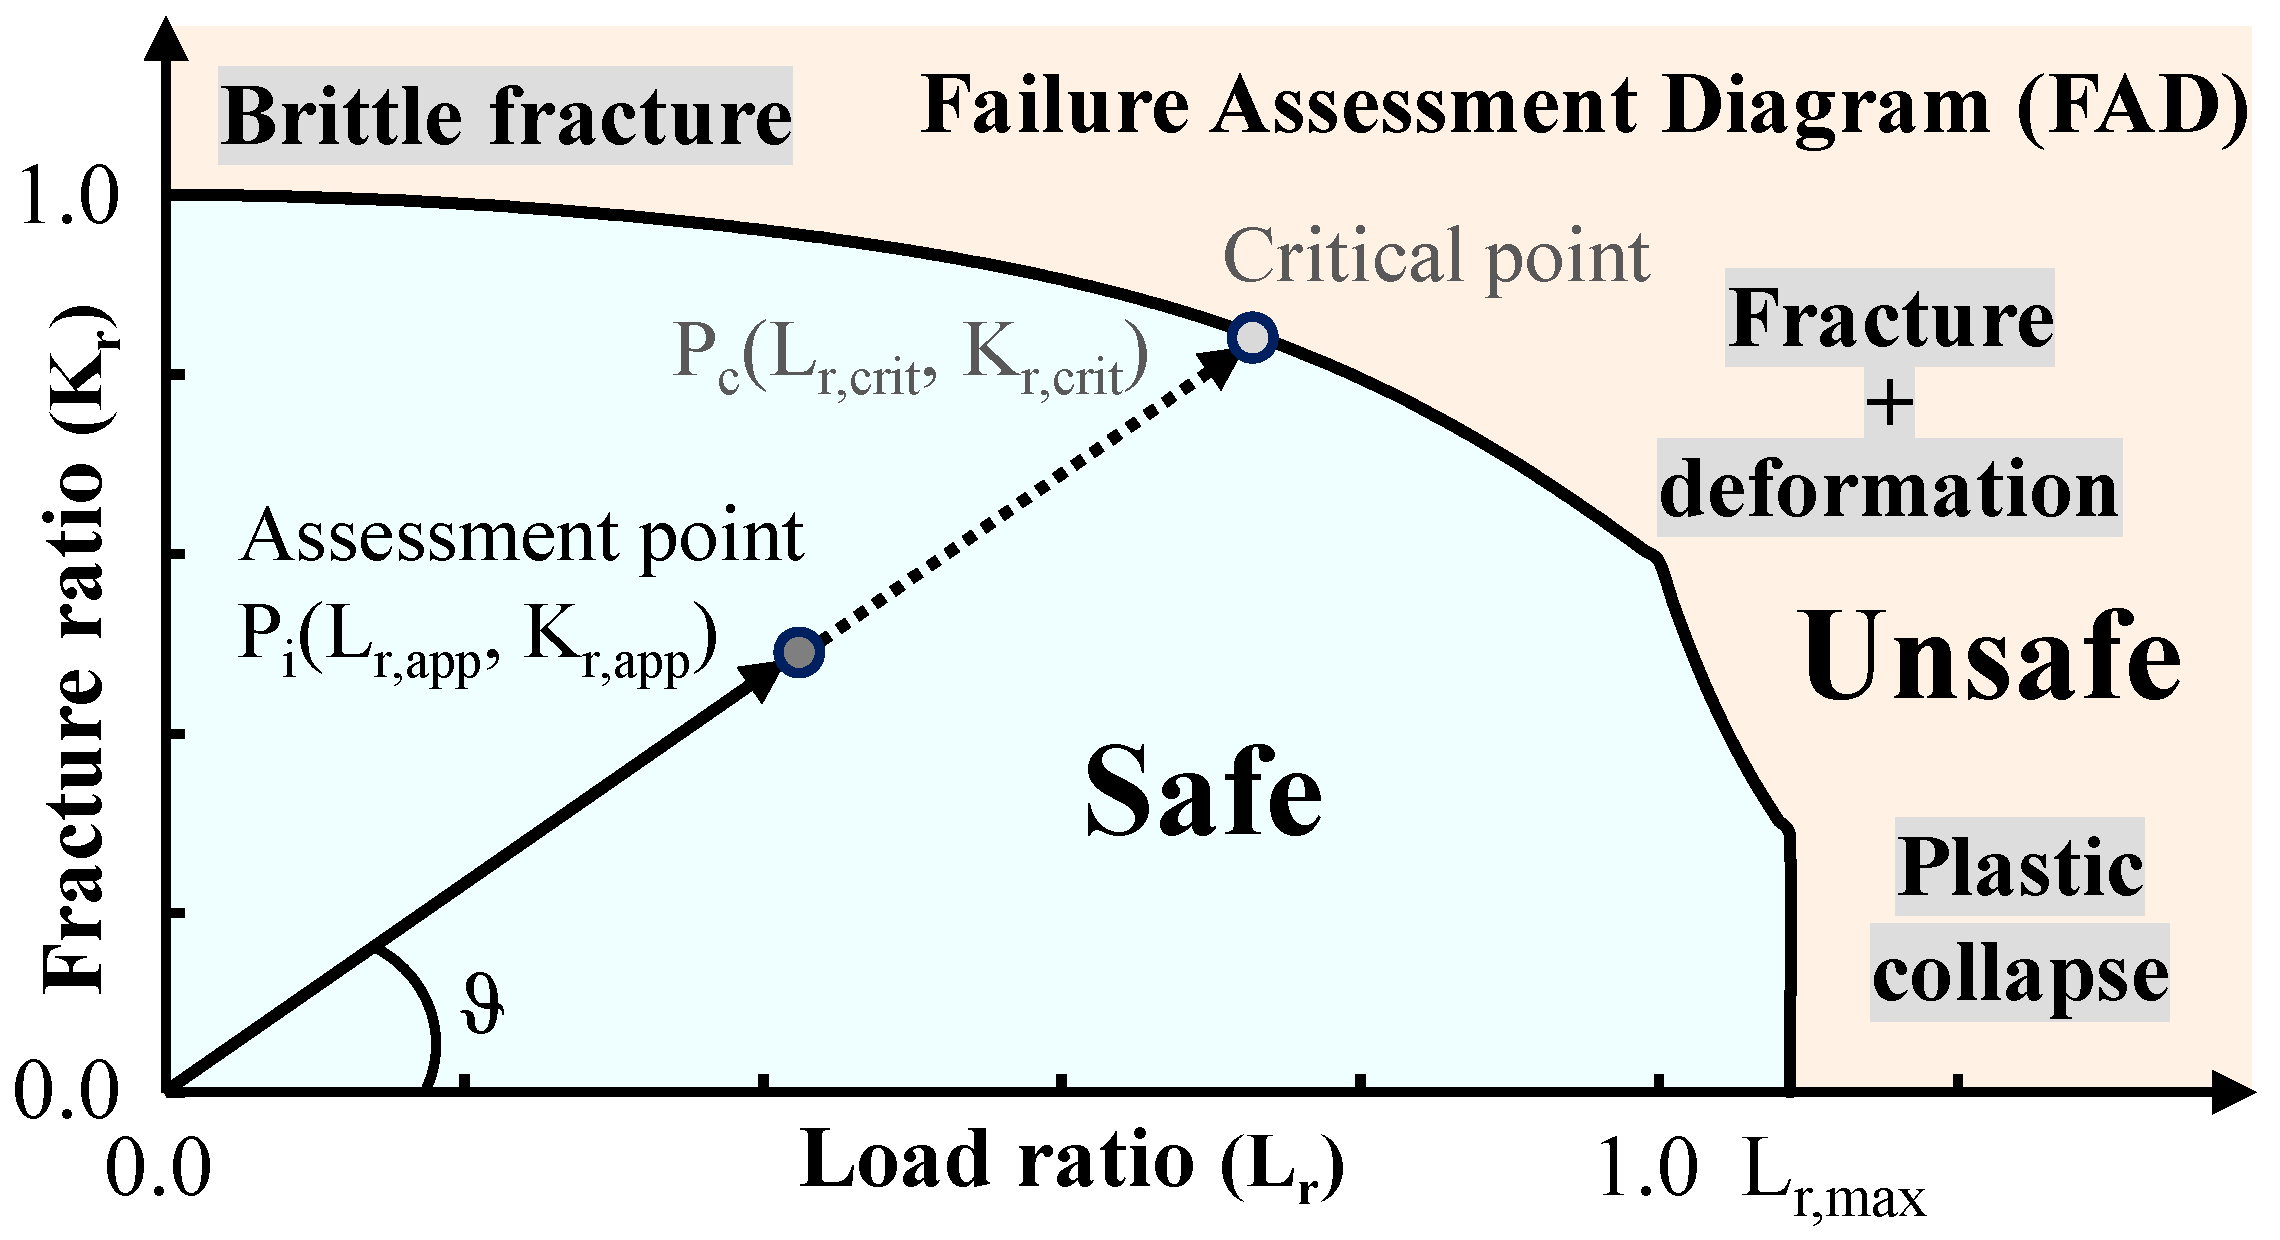
Figure 1. Configuration of the Failure Assessment Diagram (FAD).
Jmse 13 02185 g001
Figure 2. Fatigue crack growth behaviour.
Jmse 13 02185 g002
Figure 3. Flaw severity assessment procedure by Engineering Critical Assessment.
Jmse 13 02185 g003
Figure 4. Target structure and assessment locations.
Jmse 13 02185 g004
Figure 5. Test equipment and specimen. (a) Test equipment; (b) Test specimen for FCGR test.
Jmse 13 02185 g005
Figure 6. Probability density function and rank-size plot for the Weibull distribution.
Jmse 13 02185 g006
Figure 7. Geometries of weld beads in solid model.
Jmse 13 02185 g007
Figure 8. Mesh configurations of the shell and solid model. (a) Shell element model; (b) Solid element model.
Jmse 13 02185 g008
Figure 9. Stress linearisation for the solid element model. (a) Define assessment path; (b) Stress linearisation result.
Jmse 13 02185 g009
Figure 10. Geometry of surface flaw. The figure illustrates the plate dimensions W and B, the flaw with depth a and half length c, and the crack-front angle θ. The dashed line represents the neutral axis for bending.
Jmse 13 02185 g010
Figure 11. Geometries of weld joints. (a) Butt weld; (b) Cruciform joint. In both cases, z is the height measured from the weld, and L is the overall length from weld toe to weld toe.
Jmse 13 02185 g011
Figure 12. Misalignment in butt joints. (a) Axial misalignment, where B1, B2, and e represent the plate thicknesses and the axial misalignment, respectively; (b) Angular misalignment, where d, y, α and l represent the deviation from true circle, the peaking height, and the angular change due to misalignment.
Jmse 13 02185 g012
Figure 13. Von Mises stress distribution of tank side shell (t = 30 mm).
Jmse 13 02185 g013
Figure 14. Von Mises stress distribution of tank topside shell (t = 40 mm).
Jmse 13 02185 g014
Figure 15. Von Mises stress distribution of tank dome (t = 50 mm).
Jmse 13 02185 g015
Figure 16. The fracture assessment results from the ECA. The dashed lines indicate the extension of the assessment point used for calculating safety factors.
Jmse 13 02185 g016
Figure 17. The fatigue assessment results by the ECA.
Jmse 13 02185 g017
Figure 18. The fatigue assessment results combining the fracture by the ECA. The dashed lines indicate the extension of the assessment point used for calculating safety factors.
Jmse 13 02185 g018
Figure 19. Safety factor comparison of shell and solid element models.
Jmse 13 02185 g019
Table 1. Representative studies applying ECA to flaw acceptability analyses.
AuthorsStructureStress Intensity
Factor Calculation
FE
Analysis
Fracture
Assessment
Radu et al. [11]Antenna towerHandbook (BS 7910)SolidO
He et al. [13]Wind turbine monopileXFEMSolidO
Seo et al. [14]Type B (LNG)Handbook (BS 7910)ShellO
Kim et al. [15]Type C (LH2, single)Handbook (BS 7910)Shell-
Kim et al. [16]Type C (LCO2, single)Handbook (BS 7910)Shell-
Present studyType C (LCO2, bilobe)Handbook (BS 7910)Shell/SolidO
Table 2. Material properties of LFTH36 steel and wood.
Material PropertiesLTFH36Supporting Wood
Elastic Modulus (MPa)206,00030,000
Poisson Ratio0.30.4
Yield Stress (MPa)355-
Tensile Strength (MPa)490-
Density (kg/m3)78501300
Thermal Expansion
Coefficient (×10−6 °C)
128
Table 3. Fatigue crack growth data.
CurveThreshold
(N/mm3/2)
A (Mean + 2SD)m (Mean + 2SD)Transition
(N/mm3/2)
Stage AStage BStage AStage B
Recommended (Weld)632.10 × 10−171.19 × 10−125.102.88144
Experiment631.49 × 10−133.0-
Table 4. Principal dimensions of LCO2 carrier and gas tanks.
L0 (m)Bs (m)CBV (knot)x (m)y (m)z (m)
215.031.60.781453.50.02.8
Table 5. Load cases considered for structural analysis.
Load CaseInternal PressureStatic LoadingAccelerationTemperature
Longitudinal (x, LC1)P0hydrostatic pressure, gravity±axTcargo
Transverse
(y, LC2)
P0hydrostatic pressure, gravity±ayTcargo
Vertical
(z, LC3)
P0hydrostatic pressure, gravity±azTcargo
Static
(LC4)
-gravity-Troom
Collision
(LC5)
P0hydrostatic pressure, gravity+0.5 g, −0.25 gTcargo
Table 6. Summary of Structural Analysis of Shell and Solid Element Models.
Analysis InformationShell ElementSolid Element
Number of Elements372,9991,037,272
Number DOFs2,182,6743,314,808
CPU Time (s)34,681165,847
Table 7. Stress components for tank side shell (t = 30 mm).
Shell Element ModelSolid Element Model
Membrane (MPa)Bending (MPa)Membrane (MPa)Bending (MPa)
150.5163.5109.095.1
Table 8. Stress components for tank topside shell (t = 40 mm).
Shell Element ModelSolid Element Model
Membrane (MPa)Bending (MPa)Membrane (MPa)Bending (MPa)
266.096.7238.893.7
Table 9. Stress components for tank dome (t = 50 mm).
Shell Element ModelSolid Element Model
Membrane (MPa)Bending (MPa)Membrane (MPa)Bending (MPa)
328.7172.3314.5103.3
Disclaimer/Publisher’s Note: The statements, opinions and data contained in all publications are solely those of the individual author(s) and contributor(s) and not of MDPI and/or the editor(s). MDPI and/or the editor(s) disclaim responsibility for any injury to people or property resulting from any ideas, methods, instructions or products referred to in the content.