Article

From Resource Assessment to AEP Correction: Methodological Framework for Comparing HAWT and VAWT Offshore Systems

by
María Luisa Ruiz-Leo
1,
Isabel C. Gil-García
1 and
Ana Fernández-Guillamón
1,2,*
1
Faculty of Engineering, Distance University of Madrid (UDIMA), c/Coruña, Km 38500, 28400 Collado Villalba, Madrid, Spain
2
Department of Applied Mechanics and Projects Engineering, Universidad de Castilla–La Mancha, 02071 Albacete, Castilla–La Mancha, Spain
*
Author to whom correspondence should be addressed.
J. Mar. Sci. Eng. 2025, 13(11), 2183; https://doi.org/10.3390/jmse13112183
Submission received: 9 October 2025 / Revised: 4 November 2025 / Accepted: 14 November 2025 / Published: 18 November 2025
(This article belongs to the Section Ocean Engineering)

Abstract

The rapid expansion of offshore wind energy requires exploring alternative turbine architectures capable of operating efficiently in deep waters. While horizontal-axis wind turbines (HAWTs) dominate the current market, vertical-axis wind turbines (VAWTs) offer potential advantages in wake recovery, structural integration, and scalability on floating platforms. This work proposes a methodological framework to enable a fair and reproducible comparison between the two concepts. The approach begins with site selection through spatial exclusion criteria, followed by acquisition and validation of wind data over at least one year, including long-term correction with reanalysis datasets. Technical specifications of both HAWTs and VAWTs (power curves, thrust coefficients, and rotor geometries) are compiled to build consistent turbine models. Wind resource characterization is carried out using sectoral Weibull distributions, energy roses, and vertical wind profiles. Annual energy production (AEP) for HAWTs is estimated with WAsP, while VAWT performance requires geometric normalization to a common top-tip height and subsequent correction factors for air density, turbulence sensitivity, and wake recovery. Case studies demonstrate that corrected AEP values for VAWTs may exceed baseline WAsP estimates by 6–20%, narrowing the performance gap with HAWTs. The framework highlights uncertainties in wake modeling and calls for dedicated computational fluid dynamics (CFD) validation and pilot projects to confirm large-scale VAWT viability.

1. Introduction

Wind energy has emerged as a leading renewable energy source worldwide, driven by continuous technological advancements that have improved turbine efficiency and reduced generation costs [1,2]. Offshore wind power, in particular, has experienced remarkable growth, with global installed capacity exceeding 83 GW by the end of 2024 and maintaining an almost exponential trend. China leads the sector, accounting for nearly half of the global capacity, while Europe remains a major contributor [3], see Figure 1.
The development of offshore wind technology offers several advantages, such as access to stronger and more consistent wind resources and reduced visual impact compared to onshore installations. However, it also entails higher capital and operating expenditures, complex logistics, and challenges related to grid integration, which constrain large-scale deployment [4,5]. These challenges become even more critical in deep-water scenarios, where fixed-bottom foundations are no longer viable, prompting the need for floating solutions.
Horizontal-axis wind turbines (HAWTs) currently dominate the offshore sector due to their maturity and high efficiency, but they face significant limitations when deployed on floating platforms: higher center of gravity, yaw control requirements, and more complex maintenance strategies. In contrast, vertical-axis wind turbines (VAWTs) are re-emerging as a promising alternative for floating applications. Their simplified design, the absence of yaw mechanisms, and the possibility of locating heavy components near the waterline contribute to improved stability and potentially lower maintenance costs [6,7].
Recent research highlights that scaling turbines to the 10–30 MW range demands significant innovations in substructure design and survivability. Mass-optimized hull concepts, such as VolturnUS variants and other semi-submersible and spar designs, have been investigated for low-, medium-, and high-severity wave climates, showing different mass and mooring trade-offs as capacity grows [8]. At the turbine scale, nonlinear dynamic response under extreme wind events (e.g., annular typhoons) and the structural performance of 15 MW monopile and jacket foundations have been studied, indicating altered fatigue and extreme demand compared with smaller machines [9]. Ice resistance and interactions with substructures (e.g., jackets) have also been experimentally characterized, since ice loads can be critical in certain markets [10]. These technical challenges—wave-load-driven platform dynamics, extreme wind response, and ice interactions—must be considered together with aerodynamic and wake behavior when assessing the competitiveness of HAWT and VAWT floating concepts.
Floating VAWTs offer additional advantages, such as reduced wake effects (allowing for higher turbine density within a wind farm) and the potential for hybrid integration with wave energy converters, thereby increasing energy yield and reducing overall costs. Nevertheless, unresolved issues such as fatigue loads, mooring line tension, and accurate aero-hydrodynamic modeling remain significant barriers to widespread adoption [11,12]. This work addresses these issues by conducting a comparative analysis of offshore wind farms equipped with HAWTs and VAWTs under equivalent resource and design conditions. In addition to mean wind resource characterization, extreme weather events—including hurricanes, typhoons, and coupled wind–wave–current interactions—are increasingly recognized as critical factors for offshore wind farm design and long-term resource assessment. Recent research has quantified the hurricane risk to offshore wind turbines, highlighting that gusts and wind shear within hurricane eyewalls can exceed current IEC design standards [13]. Probabilistic and high-fidelity dynamic analyses have evaluated the structural response of 15 MW monopile and floating systems under annular typhoon conditions and coupled wind–wave–current loads, revealing complex nonlinear behaviors and potential instabilities [9,14]. These findings emphasize that resource evaluation and AEP estimation frameworks must evolve to integrate both average wind climatology and extreme-event risk, particularly for next-generation turbines designed for deep-water and high-severity environments. This work addresses these issues by conducting a comparative analysis of offshore wind farms equipped with HAWTs and VAWTs under equivalent resource and design conditions. Most previous offshore wind assessment frameworks are tailored to HAWTs and focus primarily on wind resource characterization and energy yield estimation using tools such as WAsP or WindPRO. These approaches do not address the geometrical and aerodynamic differences of VAWTs, nor do they provide a unified criterion for comparing their performance with that of HAWTs under equivalent exposure conditions.
This study introduces a comprehensive and reproducible framework that extends the conventional HAWT-based methodology by incorporating the following:
  • A top-tip height normalization procedure to ensure aerodynamic fairness between turbine types;
  • A correction methodology for VAWT AEP estimation, accounting for air density, turbulence, and wake recovery effects;
  • A validation path linking resource-level modeling (WAsP) with high-fidelity numerical simulations (CFD and coupled aero-hydro-servo-elastic analyses).
Compared with existing methodologies, this framework enables a direct, physics-consistent comparison between floating HAWT and VAWT concepts using a common resource basis, while maintaining compatibility with standard industry tools. Its advantages include greater transparency, traceability of assumptions, and extensibility towards next-generation floating wind systems.

2. State of the Art

The commercial deployment of floating wind turbines has so far focused primarily on HAWT designs, with several full-scale projects demonstrating technical and economic viability in intermediate-depth waters. The trend towards larger turbines (12–15 MW) aims to reduce the Levelized Cost of Energy (LCOE) through economies of scale, yet it introduces new structural and logistical challenges, particularly during installation and maintenance phases [5].
VAWTs, though historically less favored in onshore applications, are gaining attention in deep-water scenarios. Their inherent features (omnidirectional operation, lower wake impact, and the ability to place generators close to the waterline) make them well-suited for floating configurations [11,15]. Recent initiatives have explored diverse concepts:
  • NOVA Project: Proposed a floating VAWT with a V-shaped rotor designed to minimize aerodynamic overturning moments. The concept emphasized cost reduction through simplified structural design and improved stability [16,17].
  • DeepWind: Developed a 5 MW Darrieus-type floating turbine supported by a spar platform, validated through wind tunnel tests and a 1 kW prototype deployed in Denmark. Its distinctive features are the Troposkien-shaped rotor and bottom-mounted generator [18,19].
  • X-Rotor: Introduced a hybrid concept combining a primary V-shaped rotor and secondary horizontal-axis rotor to overcome the low rotational speed limitations of VAWTs. This design aims to reduce overall system costs by up to 32% and operation and mainteinance (O&M) costs by 55% [20,21].
  • GWind: Proposed a floating VAWT with fully coupled aero-hydro-elastic modeling to optimize dynamic responses under harsh offshore conditions [22].
  • SeaTwirl: A commercial initiative from Sweden that offers operational and pre-commercial prototypes ranging from 30 kW to multi-MW configurations. SeaTwirl’s design locates the generator near the waterline and emphasizes modularity and ease of maintenance [23].
Studies suggest that floating VAWTs can deliver competitive performance in deep-water settings, provided that key challenges (such as cyclic fatigue and mooring system optimization) are addressed [12,22]. Furthermore, the potential integration of VAWTs with other marine energy systems represents a promising pathway to maximize profitability and resource utilization [15]. Despite these advances, comprehensive comparative analyses of HAWT and VAWT configurations remain scarce. Most research focuses on individual concepts rather than holistic evaluations considering energy yield, wake effects, and structural loads. This gap motivates the present study, which aims to provide a robust, scenario-based comparison to support future offshore wind development strategies.

3. Materials and Methods

Figure 2 shows the general, operational, and reproducible methodology for comparing offshore wind farms based on HAWTs and VAWTs. The workflow covers all steps, from site selection to annual energy production (AEP) calculation and corrections specific to VAWTs.
The workflow can be summarized as follows:
  • Site selection (spatial and environmental constraints);
  • Acquisition and quality control of meteorological data (minimum duration, quality, and corrections);
  • Collection of turbine technical data (power and thrust curves and geometry);
  • Wind potential analysis (roses, Weibul fitting, and vertical profiles);
  • AEP calculation (it can be determined as a HAWT using WAsP with corrections or with a specific software that directly models the AEP of VAWTs).

3.1. Site Selection

The objective of this stage is to define a valid offshore study area and prepare geographical information system (GIS) layers for spatial filtering. The operational steps are as follows:
  • Gather planning layers and exclude restricted areas:
    • Protected areas (e.g., Natura 2000 and RAMSAR sites).
    • Navigation routes, submarine cables, and military or fishing zones.
    • Areas with unsuitable depth or seabed conditions (depending on floating/fixed technology).
  • If no “Maritime Spatial Planning Plan” exists, document the exclusion policy used (e.g., 2 km buffer from routes and 500 m from cables).
  • Generate an eligibility map (raster/vector) and shape-file with the final polygon of the selected area.
Recommended tools to complete this stage include any GIS software, such as QGIS or ArcGIS (for this paper, QGIS 3.42 was used).

3.2. Acquisition and Quality Control of Wind Data

At least 1 year of continuous in situ data is needed (preferably 2–3 years to reduce seasonal bias) for at least wind speed U and direction (10–60 min interval), temperature T, and pressure p (for air density).
The quality control (QC) of the data includes the following:
  • Removing outliers and missing spikes.
  • Marking periods with >10% data loss.
  • Comparing with reanalysis datasets (ERA5 and MERRA-2) using measure–correlate–predict (MCP) for long-term correction.
These data are usually in .csv format (timestamp, U, direction, T, and p) or NetCDF format for long series, as both of them are compatible with Windographer and WAsP.

3.3. Technical Data of Turbines (HAWT and VAWT)

For each turbine type (HAWT and VAWT), the following data should be collected:
  • Power curve P ( U ) (preferably following 0.5 m/s bins).
  • Thrust or power coefficient curve C T ( U ) or C P ( U ) .
  • Geometry: Rotor diameter/radius, rotor height (for VAWT), hub height, mass, and generator position.
This information can be found in the manufacturer data, technical papers, or QBlade/DMST-generated models. If no commercial data exist for VAWTs, the curves can be approximated via QBlade.

3.4. Wind Potential Analysis

The wind potential analysis includes determining the Weibull distribution and turbine intensity ( T I ). For both of them, energy roses (not only frequency) at the reference height are needed, considering a typical sectorization: from 12 to 24 sectors (30–15°).
  • The Weibull distribution is fitted by sector:
    f ( U ) = k A U A k 1 e ( U / A ) k
    with A being the scale factor and k the shape factor.
  • The turbulence intensity ( T I ) must be computed by bin and sector, producing TI maps for VAWT corrections.
From this analysis, the energy rose, Weibull tables, U ( z ) profiles, TI maps, and site files for WAsP are obtained.

3.5. Annual Energy Production Calculation

3.5.1. HAWT

The recommended procedure by the authors for estimating the AEP is based on using the tool WAsP and following the steps below:
  • Import wind atlas, orography, and roughness (offshore z 0 small).
  • Create WTG file with P ( U ) and C T ( U ) .
  • Define farm layout (coordinates and spacing).
  • Run a park calculation using a wake model (Jensen) and standard losses (electrical, availability, and blade soiling).
  • Export: Gross AEP per turbine, loss breakdown, and wake deficit maps.

3.5.2. VAWT (If No Direct Tool Is Available)

Two options are available:
  • Option A: Proxy in WAsP + Corrections
  • Build WTG file with VAWT P ( U ) curve (from experiments or DMST).
  • Compute baseline AEP VAWT , WAsP .
  • Apply correction factors f ρ , f T I , and f w a k e as detailed in Section 3.7.
  • Option B: Dedicated Model
  • Generate P ( U ) and C T ( U ) using QBlade, DMST, or CFD (OpenFOAM).
  • Apply wake models adjusted for VAWT (e.g., tuned Bastankhah parameters).
For either option, the general AEP equation (bin method) is
A E P = i P ( U i ) p ( U i ) 8760 ( 1 losses )

3.6. Geometric Normalization and Height Criterion for Fair Comparison

To ensure comparable exposure to the atmospheric boundary layer, we adopt a geometry-based normalization in which the maximum rotor elevation above mean sea level is equalized across concepts, rather than the hub height. Specifically,
H top HAWT H top VAWT H top ,
where H top is the highest point reached by the rotor. For HAWTs, H top = H hub HAWT + R HAWT , while for VAWTs (towerless), H top H base + H rot , VAWT , with H base close to the still water level for floating designs. This criterion aligns the portion of the atmospheric profile sampled by both machines and avoids unrealistic constraints on the VAWT hub position (which is typically near the waterline).
The rationale behind this is the following.
Equalizing hub height would implicitly penalize VAWTs by forcing an artificial tower, altering mass distribution and platform dynamics. Equalizing H top aligns the aerodynamic exposure while preserving concept-specific structural advantages (e.g., low center of gravity in VAWTs).
  • Rotor-Averaged Wind Speed Equivalence
The energy production with the rotor-averaged wind speed is evaluated as follows:
U ¯ = 1 A sw A sw U ( z ) d A ,
where A sw is the rotor-swept area and U ( z ) the vertical wind profile. Under a sector-wise power law U ( z ) = U ref ( z / z ref ) α and assuming horizontal homogeneity across the swept disk,
U ¯ = 1 H z min z max U ref z z ref α d z = U ref z ref α H · z α + 1 α + 1 | z min z max ,
where H = z max z min is the vertical extent of the rotor (for HAWT, z min / max = H hub HAWT R HAWT ; for VAWT, z min / max = H base 0 and H rot , VAWT ). By enforcing identical z max ( H top equalized), both machines integrate over comparable high-wind strata, enabling an unbiased AEP comparison when coupled with each technology’s power curve and wake model.
  • Consistency with Load and Wake Analyses
Equalizing H top preserves fair aerodynamic exposure while allowing concept-specific structural modeling (tower and yaw for HAWT; low-mounted drivetrain and omnidirectionality for VAWT). Wake calculations are then performed with concept-appropriate C T ( U ) and wake expansion parameters, as detailed in the methods (Section 3.7).
  • Implementation
  • Set a target H top (e.g., 120 m a.s.l.) and derive H hub HAWT = H top R HAWT .
  • Choose a VAWT rotor height H rot , VAWT such that H base + H rot , VAWT = H top (with H base 0 for floating configurations).
  • Compute sector-wise U ¯ for each concept using the same wind atlas and shear exponent α ; feed U ¯ (or the full bin distribution across z) into the energy model.
An example of this implementation can be found in Table 1.

3.7. Adjustment Methodology for VAWT Energy Yield

Since WAsP has been developed primarily for HAWTs, its direct application to VAWTs requires additional adjustments. The differences in aerodynamic behavior, wake dynamics, and turbulence sensitivity must be explicitly addressed to avoid systematic bias in the estimation of AEP. Following the approach outlined in recent studies [6,11,15,22], three correction factors were applied:
  • Air density correction ( f ρ ): Offshore air density may deviate from the reference value used in standard power curves due to variations in temperature and pressure. A correction proportional to ρ / ρ ref was applied, typically affecting AEP within ± 2 3 % [24].
  • Turbulence intensity correction ( f T I ): VAWTs respond differently to atmospheric turbulence compared to HAWTs. In high-turbulence regimes, dynamic stall phenomena may reduce performance, whereas at moderate TI levels some VAWT designs show robust or even improved efficiency [22]. A sensitivity coefficient β was introduced to scale deviations from the reference turbulence intensity T I 0 , leading to corrections in the range 4 % to + 1 % depending on site conditions.
  • Wake correction ( f w a k e ): Conventional wake models implemented in WAsP assume Gaussian or Jensen-type deficits calibrated for HAWTs [25]. VAWT wakes, however, recover faster and produce lower downstream deficits, especially in farm configurations [6,11]. A correction factor between + 5 % (conservative) and + 20 % (optimistic) was therefore applied to account for the mismatch between HAWT-based wake models and VAWT behavior.
The corrected AEP is then obtained as follows:
AEP corr = AEP WAsP × f ρ × f T I × f w a k e
where AEP WAsP is the gross energy production predicted by WAsP and the three factors represent the VAWT-specific adjustments.
This methodology allows the results obtained with WAsP to be used as a conservative baseline, while providing corrected values that reflect the expected performance of VAWTs more realistically under offshore conditions.
The multiplicative correction factors applied to the WAsP baseline (air density, turbulence sensitivity, and wake recovery) are based on (i) the reported sensitivity of VAWT aerodynamic performance to turbulence and dynamic stall in wind tunnel and numerical studies and (ii) experimental/numerical evidence that VAWT wakes often recover faster and present reduced velocity deficits compared with HAWT wakes in similar conditions. Representative experimental studies and numerical investigations indicate wake improvements ranging from a few percent up to tens of percent depending on rotor type, spacing, and inflow conditions [6,26]. Consequently, the scenario ranges used (conservative: +5% wake; base: +10% wake; and optimistic: +20% wake) are defensible as first-order estimates but must be validated for each rotor/layout via higher-fidelity tools.

4. Results

The comparative analysis focuses on a site located on the Atlantic margin of the Iberian Peninsula, characterized by annual mean wind speeds of approximately 9.5 m/s at 150 m a.s.l. and water depths exceeding 100 m. The area corresponds to the officially designated Maritime Spatial Planning (POEM) zones [27], ensuring alignment with real offshore wind development in Spain (Figure 3).

4.1. Wind Resource Characterization

The wind resource assessment was carried out using a dataset covering the period 2022–2023, provided by Vortex [29], which included hourly wind speed and direction measurements at 150 m above sea level. The WindowGrapher© program was used for descriptive statistical analysis. The raw data were filtered to remove outliers and periods of instrument downtime, following the procedures recommended in offshore wind resource assessment guidelines. After QC, the dataset was considered representative of long-term climatology when cross-checked against reanalysis products for the Iberian offshore region.
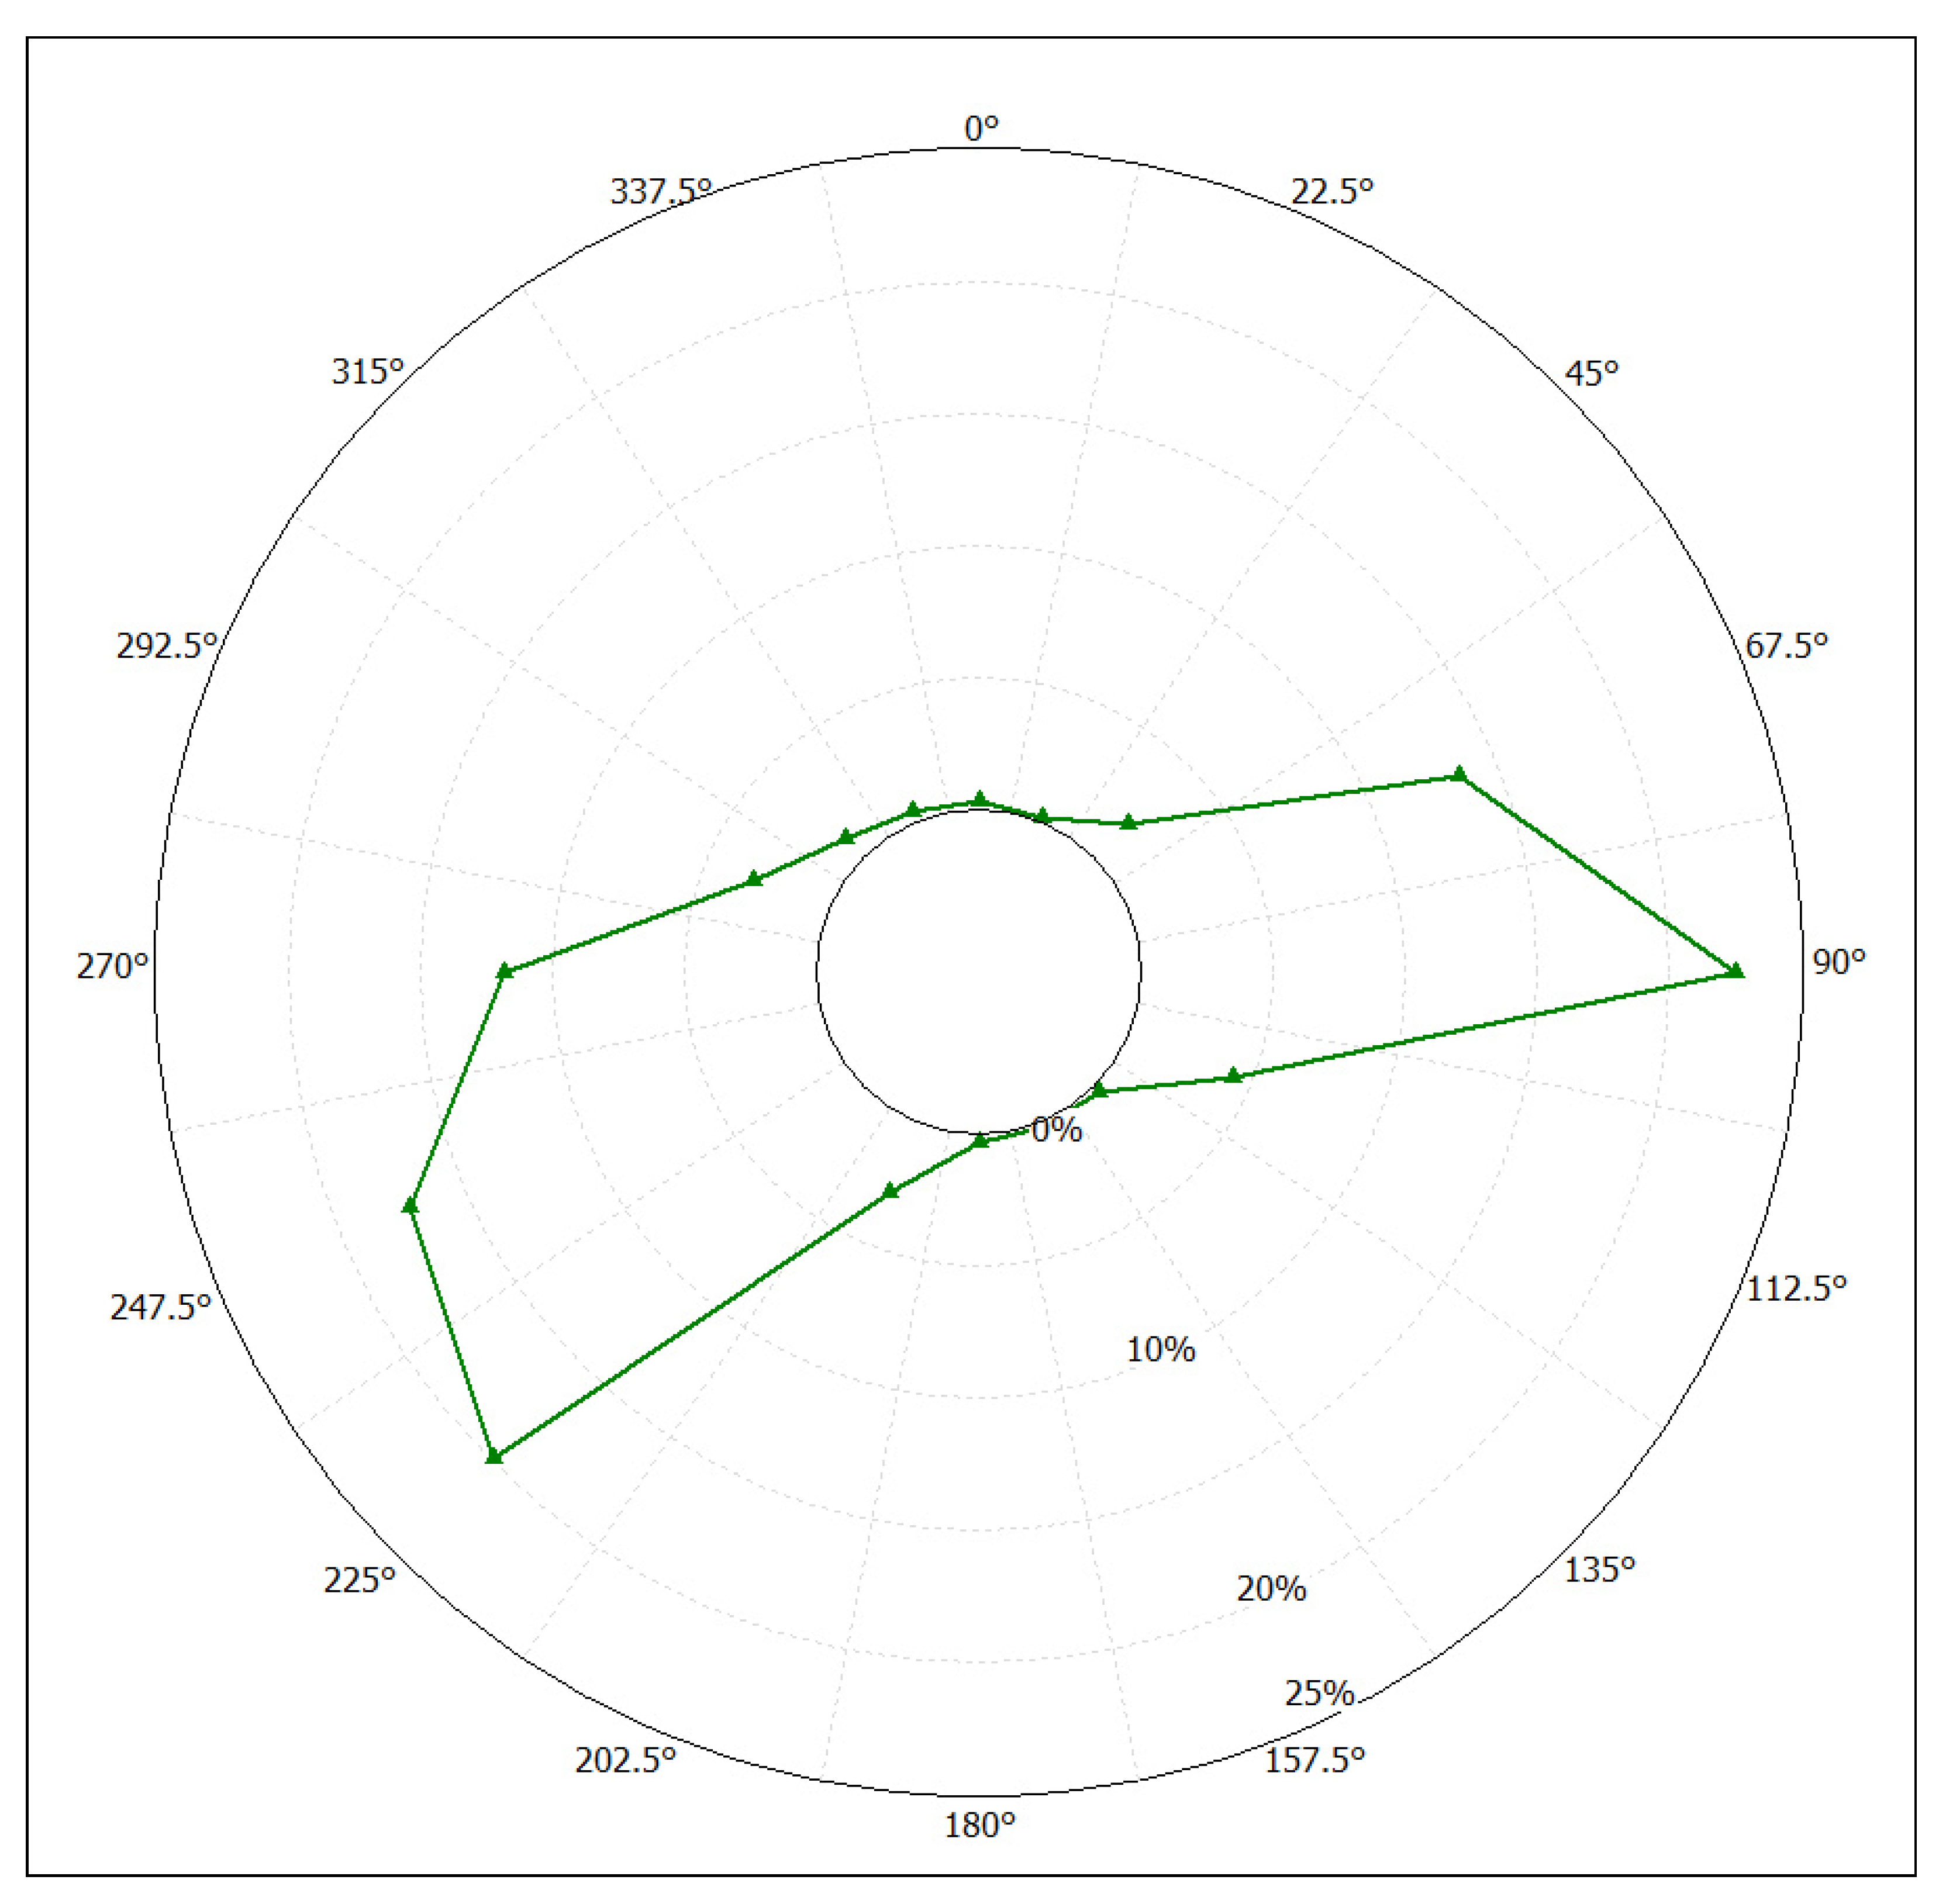
The directional distribution of the resource was first evaluated through the energy rose shown in Figure 4. The energy rose shows a markedly bidirectional wind regime at the offshore site, with maxima in the east (90°) and southwest (225–247.5°) directions, which together account for nearly half of the available wind energy. In contrast, the north and south sectors present practically zero contributions, indicating a clear channeling of offshore winds and reinforcing the presence of a dominant directional pattern. This behavior not only characterizes the energy distribution of the resource, but also determines the design of the offshore wind farm: to optimize capture and minimize wake losses, the wind turbines must be arranged in rows perpendicular to the directions of the greatest energy contribution, which, in this case, corresponds to north–south alignments (to take advantage of easterly winds) and northeast–southwest alignments (for southwesterly winds).
Figure 5 shows the distribution of wind speeds at 150 m at the offshore site, where the empirical data (green histogram) fit a Weibull distribution with parameters k = 2.042 and A = 9.004 m/s. The value of k reflects moderate variability in wind speeds, while A indicates a high mean near 9 m/s, typical of offshore sites with a high energy potential. The Weibull curve fits well in the 5–15 m/s range, where most events occur. With a mean wind speed close to 9 m/s, the site has a high energy potential; the distribution suggests that most of the time the wind is in the 6–12 m/s range, which coincides with the optimal operating zone for modern offshore wind turbines. The low occurrence of very low winds (<3 m/s) implies few hours without generation. The low frequency of extreme winds (>20 m/s) is positive, as it reduces the time the turbines need to be shut down for safety.
Overall, the wind resource characterization confirms that the selected site is representative of high-potential offshore wind locations in the Iberian Atlantic, with a robust prevailing regime, low turbulence, and high long-term energy availability.

4.2. Geometric Normalization Applied

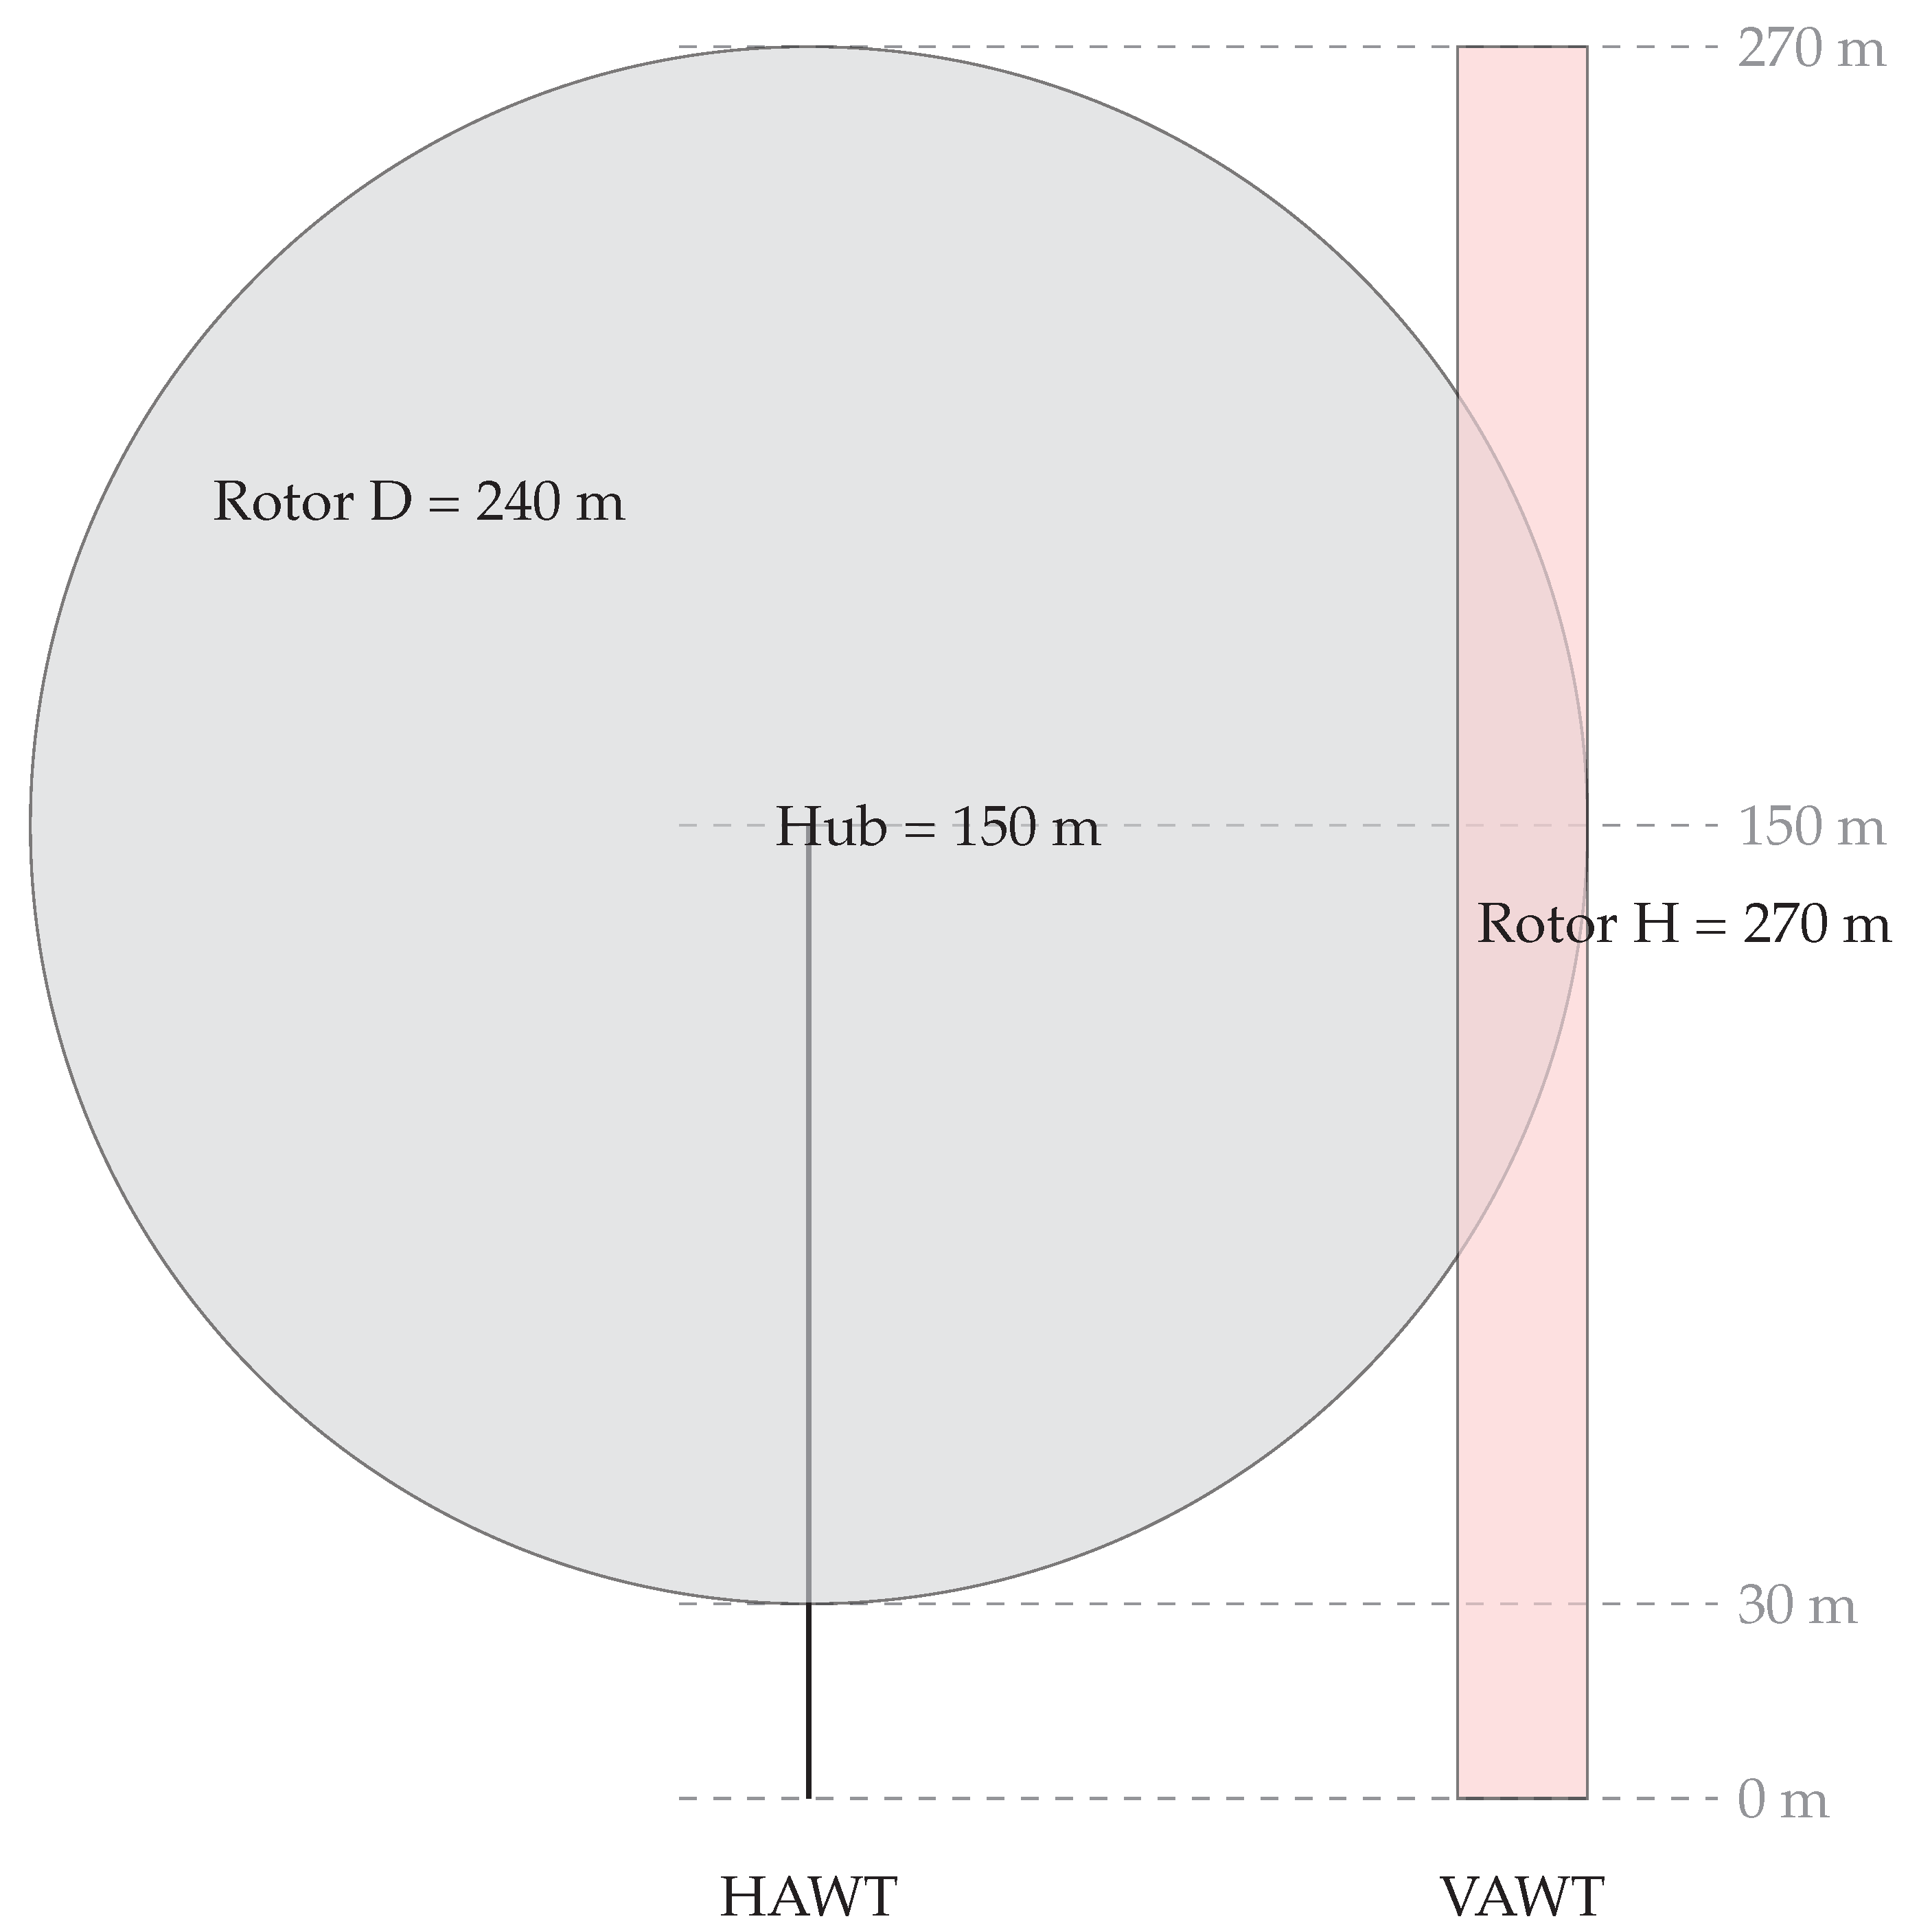
To ensure a fair comparison between technologies, the top-tip height ( H top ) was equalized to 270 m, see the summary in Table 2.
  • The HAWT was modeled with a rotor radius of 120 m, resulting in a hub height of 150 m.
  • The VAWT was modeled with a 270 m rotor height, starting near sea level.
Thus, both devices intercept the same vertical range of the wind profile, although with different swept-area distributions. Figure 6 illustrates this geometric normalization.

4.3. Annual Energy Production

After analyzing the site’s wind potential, the WAsP© program is used to calculate the energy produced. This is performed using wind data, wind turbine coordinates, and power curves obtained from the manufacturer’s data. Since the farm is located offshore, the terrain is rough, with no obstacles affecting the wind, allowing for higher speeds and optimal energy production. The wind turbines considered are IEA Wind 15 MW [30] for the HAWT and Sea Twirl 10 MW [31] for the VAWT. Two offshore wind farm designs are analyzed, both with a total capacity of 150 MW:
  • IEA Wind 15 MW (horizontal axis): 10 wind turbines.
  • SEA Twirl 10 MW (vertical axis): 15 wind turbines.
For HAWTs, they are distributed in three lines (perpendicular to the greatest energy contribution according to the energy rose) in a staggered pattern, maintaining a minimum distance of three rotor diameters between units in the same row and six diameters between rows. Using the power curve (based on the thrust coefficient and wind speed) and the air density at hub height (150 m), energy production is calculated, taking into account the wake effect, which is very low (<5%) thanks to the adequate separation between wind turbines. The net energy input to the grid is also estimated, considering losses due to maintenance, electrical transmission, and model inaccuracy, among others, applying an overall loss coefficient of 0.92, totaling 585 GWh/year (more details can be seen in Table 3).
For the VAWTs, the initial gross AEP estimated with WAsP was 578 GWh/year. Following the corrections explained in Section 3.7, combining these corrections yields a range of corrected AEP values:
  • Conservative scenario: ≈577 GWh (−0.2% relative to WAsP).
  • Base scenario: ≈617 GWh (+6.8%).
  • Optimistic scenario: ≈708 GWh (+22.6%).
Table 4 summarizes the assumptions and results.
These results suggest that while the baseline WAsP estimate (578 GWh) provides a conservative result, the corrected values highlight the potential for significant gains in net AEP due to faster wake recovery and reduced wake interactions characteristic of VAWTs. The range reflects current uncertainty in VAWT wake modeling, reinforcing the need for site-specific CFD validation and experimental campaigns.

5. Discussion and Conclusions

5.1. Comparative Performance of HAWTs and VAWTs

The case study demonstrates that both HAWTs and VAWTs can achieve competitive AEP when normalized to a common top-tip height. The HAWT configuration exhibited a slightly higher gross AEP due to its well-established aerodynamic efficiency and validated power curves, in line with previous offshore studies [24]. However, this advantage is partially offset by stronger wake interactions, which reduce farm-level performance, consistent with observations in large offshore wind farms [25].
In contrast, the VAWT configuration, while yielding lower single-turbine gross AEP, benefits from faster wake recovery and more homogeneous downstream flow fields. These characteristics allow for tighter spacing and improved overall farm density, in line with recent experimental and numerical findings [6,11]. Thus, although VAWTs are not yet commercially mature, their collective performance at the wind farm scale may rival or surpass that of HAWTs in certain deep-water scenarios.

5.2. Structural Integration and Platform Considerations

From a structural perspective, the HAWT concentrates mass and dynamic loads at hub height, which increases overturning moments on the floating substructure. This requires more sophisticated control strategies and robust platform design [24]. The VAWT, in contrast, places its heaviest components near the waterline, lowering the center of gravity and reducing structural demands. This alignment between turbine architecture and floating platform dynamics has been highlighted as a major advantage for future deep-water deployment [15,22].

5.3. Economic Implications

The AEP correction analysis indicates that VAWTs may achieve between 6 and 20% higher net production than the WAsP baseline due to reduced wake effects and site-specific turbulence response. Moreover, according to [6], the baseline LCOE for floating HAWTs remains lower given their maturity; these potential gains highlight a credible pathway for VAWTs to become competitive as technology scales up. Hybrid concepts, such as co-located wave energy converters, could further improve cost-effectiveness by leveraging the structural synergies of floating VAWTs [6].

5.4. Conclusions

Overall, this study shows the following:
  • HAWTs on semi-submersible platforms remain the reference solution for current commercial projects, with validated performance and lower technology risk.
  • VAWTs mounted on spar-type structures, while less mature, present significant advantages in terms of wake recovery, structural integration, and farm density.
  • Corrected AEP values suggest that VAWTs could reduce the performance gap with HAWTs, especially under high-density farm configurations in deep waters.
These findings support the view that VAWTs, though not yet ready for full-scale commercial deployment, represent a strategic alternative for deep-water offshore wind expansion.

5.5. Limitations and Future Work

Despite the promising results, several limitations must be acknowledged:
  • Wake modeling: The corrections applied are based on simplified factors; dedicated VAWT wake models (e.g., dynamic stall-coupled CFD) are required to validate farm-level interactions.
  • Platform–turbine dynamics: Coupled aero-hydro-servo-elastic simulations were not included, yet they are critical to assess fatigue loads and survivability.
  • Economic assessment: Future work should integrate detailed cost modeling of manufacturing, installation, and O&M strategies.
  • Experimental validation: Field-scale VAWT data remain scarce. Pilot projects and demonstration campaigns are essential to validate the numerical trends identified here.
  • Applicability and limitations of pendulum tip height normalization: The top-tip height equalization adopted in this work ensures comparable aerodynamic exposure between HAWTs and VAWTs and provides a defensible baseline for AEP comparison. Nevertheless, adopting the same maximum tip elevation does not imply equivalence in structural loading nor in platform stability. In practical floating designs, hub height, mass distribution, and rotor dynamics determine overturning moments, pitch/roll responses, and mooring loads; thus, a VAWT tuned to match the HAWT top-tip elevation may still yield substantially different static and fatigue loads due to its lower center of gravity and different aerodynamic load paths. Several studies on floating VAWT/HWT dynamics and on platform design stress that aerodynamic load distribution and platform response must be evaluated with detailed coupled analyses before drawing conclusions for platform sizing or certification [24]. Therefore, the top-tip normalization should be seen as a resource normalization (fairness in wind sampling) rather than a structural design prescription; its use is appropriate for fair AEP comparison but requires subsequent platform-level verification (coupled aero-hydro-servo-elastic simulations) to determine design and safety loads.
  • Need for fully coupled simulations: The present work does not include fully coupled aero-hydro-servo-elastic simulations. For floating systems, particularly under extreme sea states, the interaction between aerodynamic loads, platform motions, control system actions, and structural elasticity can produce nonlinear dynamic effects that significantly alter fatigue and extreme loads. Recent developments allow coupling aeroelastic solvers with CFD and hydro/motion modules (e.g., OpenFAST+OpenFOAM coupling and OWENS integrations), enabling high-fidelity assessment of floating VAWT performance and loads [32]. We therefore plan to extend this study with (i) single-turbine coupled case studies using OpenFAST + OpenFOAM (LES where feasible) to quantify the influence of platform motion on VAWT power and loads; (ii) sensitivity runs for extreme sea states (100-year storms) using nonlinear wave spectra and full mooring dynamics; and (iii) verification against scaled test data. These steps will allow us to move from resource-level comparisons to platform design recommendations.
  • Extreme-event characterization: Future extensions of this framework will incorporate extreme weather scenarios such as hurricanes, typhoons, and combined wind–wave–current interactions. These conditions are increasingly relevant for large-scale floating systems and can strongly influence turbine loads, energy availability, and long-term reliability. Probabilistic modeling and time-domain simulations under such events will be integrated to evaluate the coupled aerodynamic and hydrodynamic response, ensuring a more comprehensive assessment of energy yield and survivability.
Future research should therefore focus on (i) developing and validating dedicated VAWT wake models; (ii) investigating platform–turbine coupled dynamics at the multi-MW scale; (iii) exploring optimal farm layouts that leverage VAWT wake recovery; (iv) assessing the techno-economic potential of hybrid floating energy systems combining wind and wave resources; and (v) extending the methodology to include probabilistic extreme-event analysis for resilient offshore design.

Author Contributions

Conceptualization, A.F.-G., I.C.G.-G., and M.L.R.-L.; methodology, I.C.G.-G.; software, M.L.R.-L.; validation, A.F.-G., I.C.G.-G., and M.L.R.-L.; formal analysis, A.F.-G. and I.C.G.-G.; investigation, A.F.-G., I.C.G.-G., and M.L.R.-L.; resources, A.F.-G., I.C.G.-G., and M.L.R.-L.; data curation, M.L.R.-L.; writing—original draft preparation, A.F.-G., I.C.G.-G., and M.L.R.-L.; writing—review and editing, A.F.-G. and I.C.G.-G.; visualization, I.C.G.-G.; supervision, A.F.-G.; project administration, A.F.-G. and I.C.G.-G.; funding acquisition, A.F.-G. and I.C.G.-G. All authors have read and agreed to the published version of the manuscript.

Funding

This research received no external funding.

Data Availability Statement

Dataset available on request from the authors.

Conflicts of Interest

The authors declare no conflicts of interest.

References

  1. Gil-García, I.C.; Ramos-Escudero, A.; Ángel Molina-García; Fernández-Guillamón, A. GIS-based MCDM dual optimization approach for territorial-scale offshore wind power plants. J. Clean. Prod. 2023, 428, 139484. [Google Scholar] [CrossRef]
  2. Roga, S.; Bardhan, S.; Kumar, Y.; Dubey, S.K. Recent technology and challenges of wind energy generation: A review. Sustain. Energy Technol. Assessments 2022, 52, 102239. [Google Scholar] [CrossRef]
  3. Global Wind Report 2024. Technical Report, Global Wind Energy Council (GWEC). 2025. Available online: https://www.gwec.net/reports/globaloffshorewindreport (accessed on 20 May 2025).
  4. Su, X.; Wang, X.; Xu, W.; Yuan, L.; Xiong, C.; Chen, J. Offshore Wind Power: Progress of the Edge Tool, Which Can Promote Sustainable Energy Development. Sustainability 2024, 16, 7810. [Google Scholar] [CrossRef]
  5. Shields, M.; Beiter, P.; Nunemaker, J.; Cooperman, A.; Duffy, P. Impacts of turbine and plant upsizing on the levelized cost of energy for offshore wind. Appl. Energy 2021, 298, 117189. [Google Scholar] [CrossRef]
  6. Arredondo-Galeana, A.; Brennan, F. Floating Offshore Vertical Axis Wind Turbines: Opportunities, Challenges and Way Forward. Energies 2021, 14, 8000. [Google Scholar] [CrossRef]
  7. Cheng, Z.; Madsen, H.A.; Chai, W.; Gao, Z.; Moan, T. A comparison of extreme structural responses and fatigue damage of semi-submersible type floating horizontal and vertical axis wind turbines. Renew. Energy 2017, 108, 207–219. [Google Scholar] [CrossRef]
  8. Dagher, J.H.; Goupee, A.J.; Viselli, A.M. Optimized Floating Offshore Wind Turbine Substructure Design Trends for 10–30 MW Turbines in Low-, Medium-, and High-Severity Wave Environments. Designs 2024, 8, 72. [Google Scholar] [CrossRef]
  9. Ren, H.; Qiu, J.; Zhang, Y.; Liu, H.; Yang, J.; Ke, S. Nonlinear dynamic response analysis of 15 MW monopile offshore wind turbine under annular typhoon. Phys. Fluids 2025, 37, 087116. [Google Scholar] [CrossRef]
  10. Guan, X.; Yu, H.; Yuan, Y.; Kong, D.; Liu, B.; Tang, H. Study on structural dynamic response of offshore wind turbine under floating ice load. Sci. Rep. 2025, 15, 17050. [Google Scholar] [CrossRef]
  11. Ghigo, A.; Petracca, E.; Mangia, G.; Giorgi, G.; Bracco, G. Development of a floating Vertical Axis Wind Turbine for the Mediterranean Sea. J. Phys. Conf. Ser. 2024, 2745, 012008. [Google Scholar] [CrossRef]
  12. Borg, M.; Shires, A.; Collu, M. Offshore floating vertical axis wind turbines, dynamics modelling state of the art. Part I: Aerodynamics. Renew. Sustain. Energy Rev. 2014, 39, 1214–1225. [Google Scholar] [CrossRef]
  13. Worsnop, R.P.; Lundquist, J.K.; Bryan, G.H.; Damiani, R.; Musial, W. Gusts and shear within hurricane eyewalls can exceed offshore wind turbine design standards. Geophys. Res. Lett. 2017, 44, 6413–6420. [Google Scholar] [CrossRef]
  14. Li, W.; Ke, S.; Qian, K.; Ren, H. Instability mechanism and criterion of wind-wave co-generation structural system under typhoon-wave-current coupled action. Renew. Energy 2026, 256, 123888. [Google Scholar] [CrossRef]
  15. Cheng, Z.; Wen, T.R.; Ong, M.C.; Wang, K. Power performance and dynamic responses of a combined floating vertical axis wind turbine and wave energy converter concept. Energy 2019, 171, 190–204. [Google Scholar] [CrossRef]
  16. Collu, M.; Brennan, F.P.; Patel, M.H. Conceptual design of a floating support structure for an offshore vertical axis wind turbine: The lessons learnt. Ships Offshore Struct. 2014, 9, 3–21. [Google Scholar] [CrossRef]
  17. Shires, A. Development and Evaluation of an Aerodynamic Model for a Novel Vertical Axis Wind Turbine Concept. Energies 2013, 6, 2501–2520. [Google Scholar] [CrossRef]
  18. Paulsen, U.S.; Madsen, H.A.; Kragh, K.A.; Nielsen, P.H.; Baran, I.; Hattel, J.; Ritchie, E.; Leban, K.; Svendsen, H.; Berthelsen, P.A. DeepWind-from Idea to 5 MW Concept. Energy Procedia 2014, 53, 23–33. [Google Scholar] [CrossRef]
  19. Battisti, L.; Benini, E.; Brighenti, A.; Raciti Castelli, M.; Dell’Anna, S.; Dossena, V.; Persico, G.; Schmidt Paulsen, U.; Pedersen, T.F. Wind tunnel testing of the DeepWind demonstrator in design and tilted operating conditions. Energy 2016, 111, 484–497. [Google Scholar] [CrossRef]
  20. X-ROTOR: X-Shaped Radical Offshore Wind Turbine for Overall Cost of Energy Reduction, European Commission: Luxembourg, 2021. [CrossRef]
  21. McMorland, J.; Flannigan, C.; Carroll, J.; Collu, M.; McMillan, D.; Leithead, W.; Coraddu, A. A review of operations and maintenance modelling with considerations for novel wind turbine concepts. Renew. Sustain. Energy Rev. 2022, 165, 112581. [Google Scholar] [CrossRef]
  22. Cheng, Z.; Madsen, H.A.; Gao, Z.; Moan, T. A fully coupled method for numerical modeling and dynamic analysis of floating vertical axis wind turbines. Renew. Energy 2017, 107, 604–619. [Google Scholar] [CrossRef]
  23. SeaTwirl. Products–SeaTwirl. Available online: https://seatwirl.com/products/ (accessed on 25 February 2025).
  24. Myhr, A.; Bjerkseter, C.; Ågotnes, A.; Nygaard, T. Levelised cost of energy for offshore floating wind turbines in a life cycle perspective. Renew. Energy 2014, 66, 714–728. [Google Scholar] [CrossRef]
  25. Barthelmie, R.J.; Hansen, K.; Pryor, S.C. Quantifying the impact of wind turbine wakes on power output at offshore wind farms. J. Atmos. Ocean. Technol. 2010, 27, 1302–1317. [Google Scholar] [CrossRef]
  26. Talamalek, A.; Runacres, M.C.; De Troyer, T. Experimental investigation of the wake replenishment mechanisms of paired counter-rotating vertical-axis wind turbines. J. Wind. Eng. Ind. Aerodyn. 2024, 252, 105830. [Google Scholar] [CrossRef]
  27. BOE-A-2023-5704 Real Decreto 150/2023, de 28 de Febrero, por el que se Aprueban los Planes de Ordenación del Espacio Marítimo de las Cinco Demarcaciones Marinas Españolas. 2023. Available online: https://www.boe.es/buscar/doc.php?id=BOE-A-2023-5704 (accessed on 20 May 2025).
  28. Visor INFOMAR–MITECO, CEDEX. 2023. Available online: https://infomar.miteco.es/visor.html (accessed on 1 May 2025).
  29. Vortex FDC. Wind Resource Data for Wind Farm Developments. 2025. Available online: https://vortexfdc.com/ (accessed on 15 May 2025).
  30. Evan, G.; Rinker, J.; Sethuraman, L.; Zahle, F.; Anderson, B. Definition of the IEA 15-Megawatt Offshore Reference Wind; Technical Report NREL/TP-5000-75698; National Renewable Energy Laboratory: Golden, CO, USA, 2020. [Google Scholar]
  31. Ouro, P. SeaTwirl’s Wind Farm Layouts Analysis; SeaTwirl AB: Gothenburg, Sweden, 2022. [CrossRef]
  32. Campaña Alonso, G.; Martín-San-Román, R.; Méndez-López, B.; Benito-Cia, P.; Azcona-Armendáriz, J. OF2: Coupling OpenFAST and OpenFOAM for high-fidelity aero-hydro-servo-elastic FOWT simulations. Wind Energy Sci. 2023, 8, 1597–1611. [Google Scholar] [CrossRef]
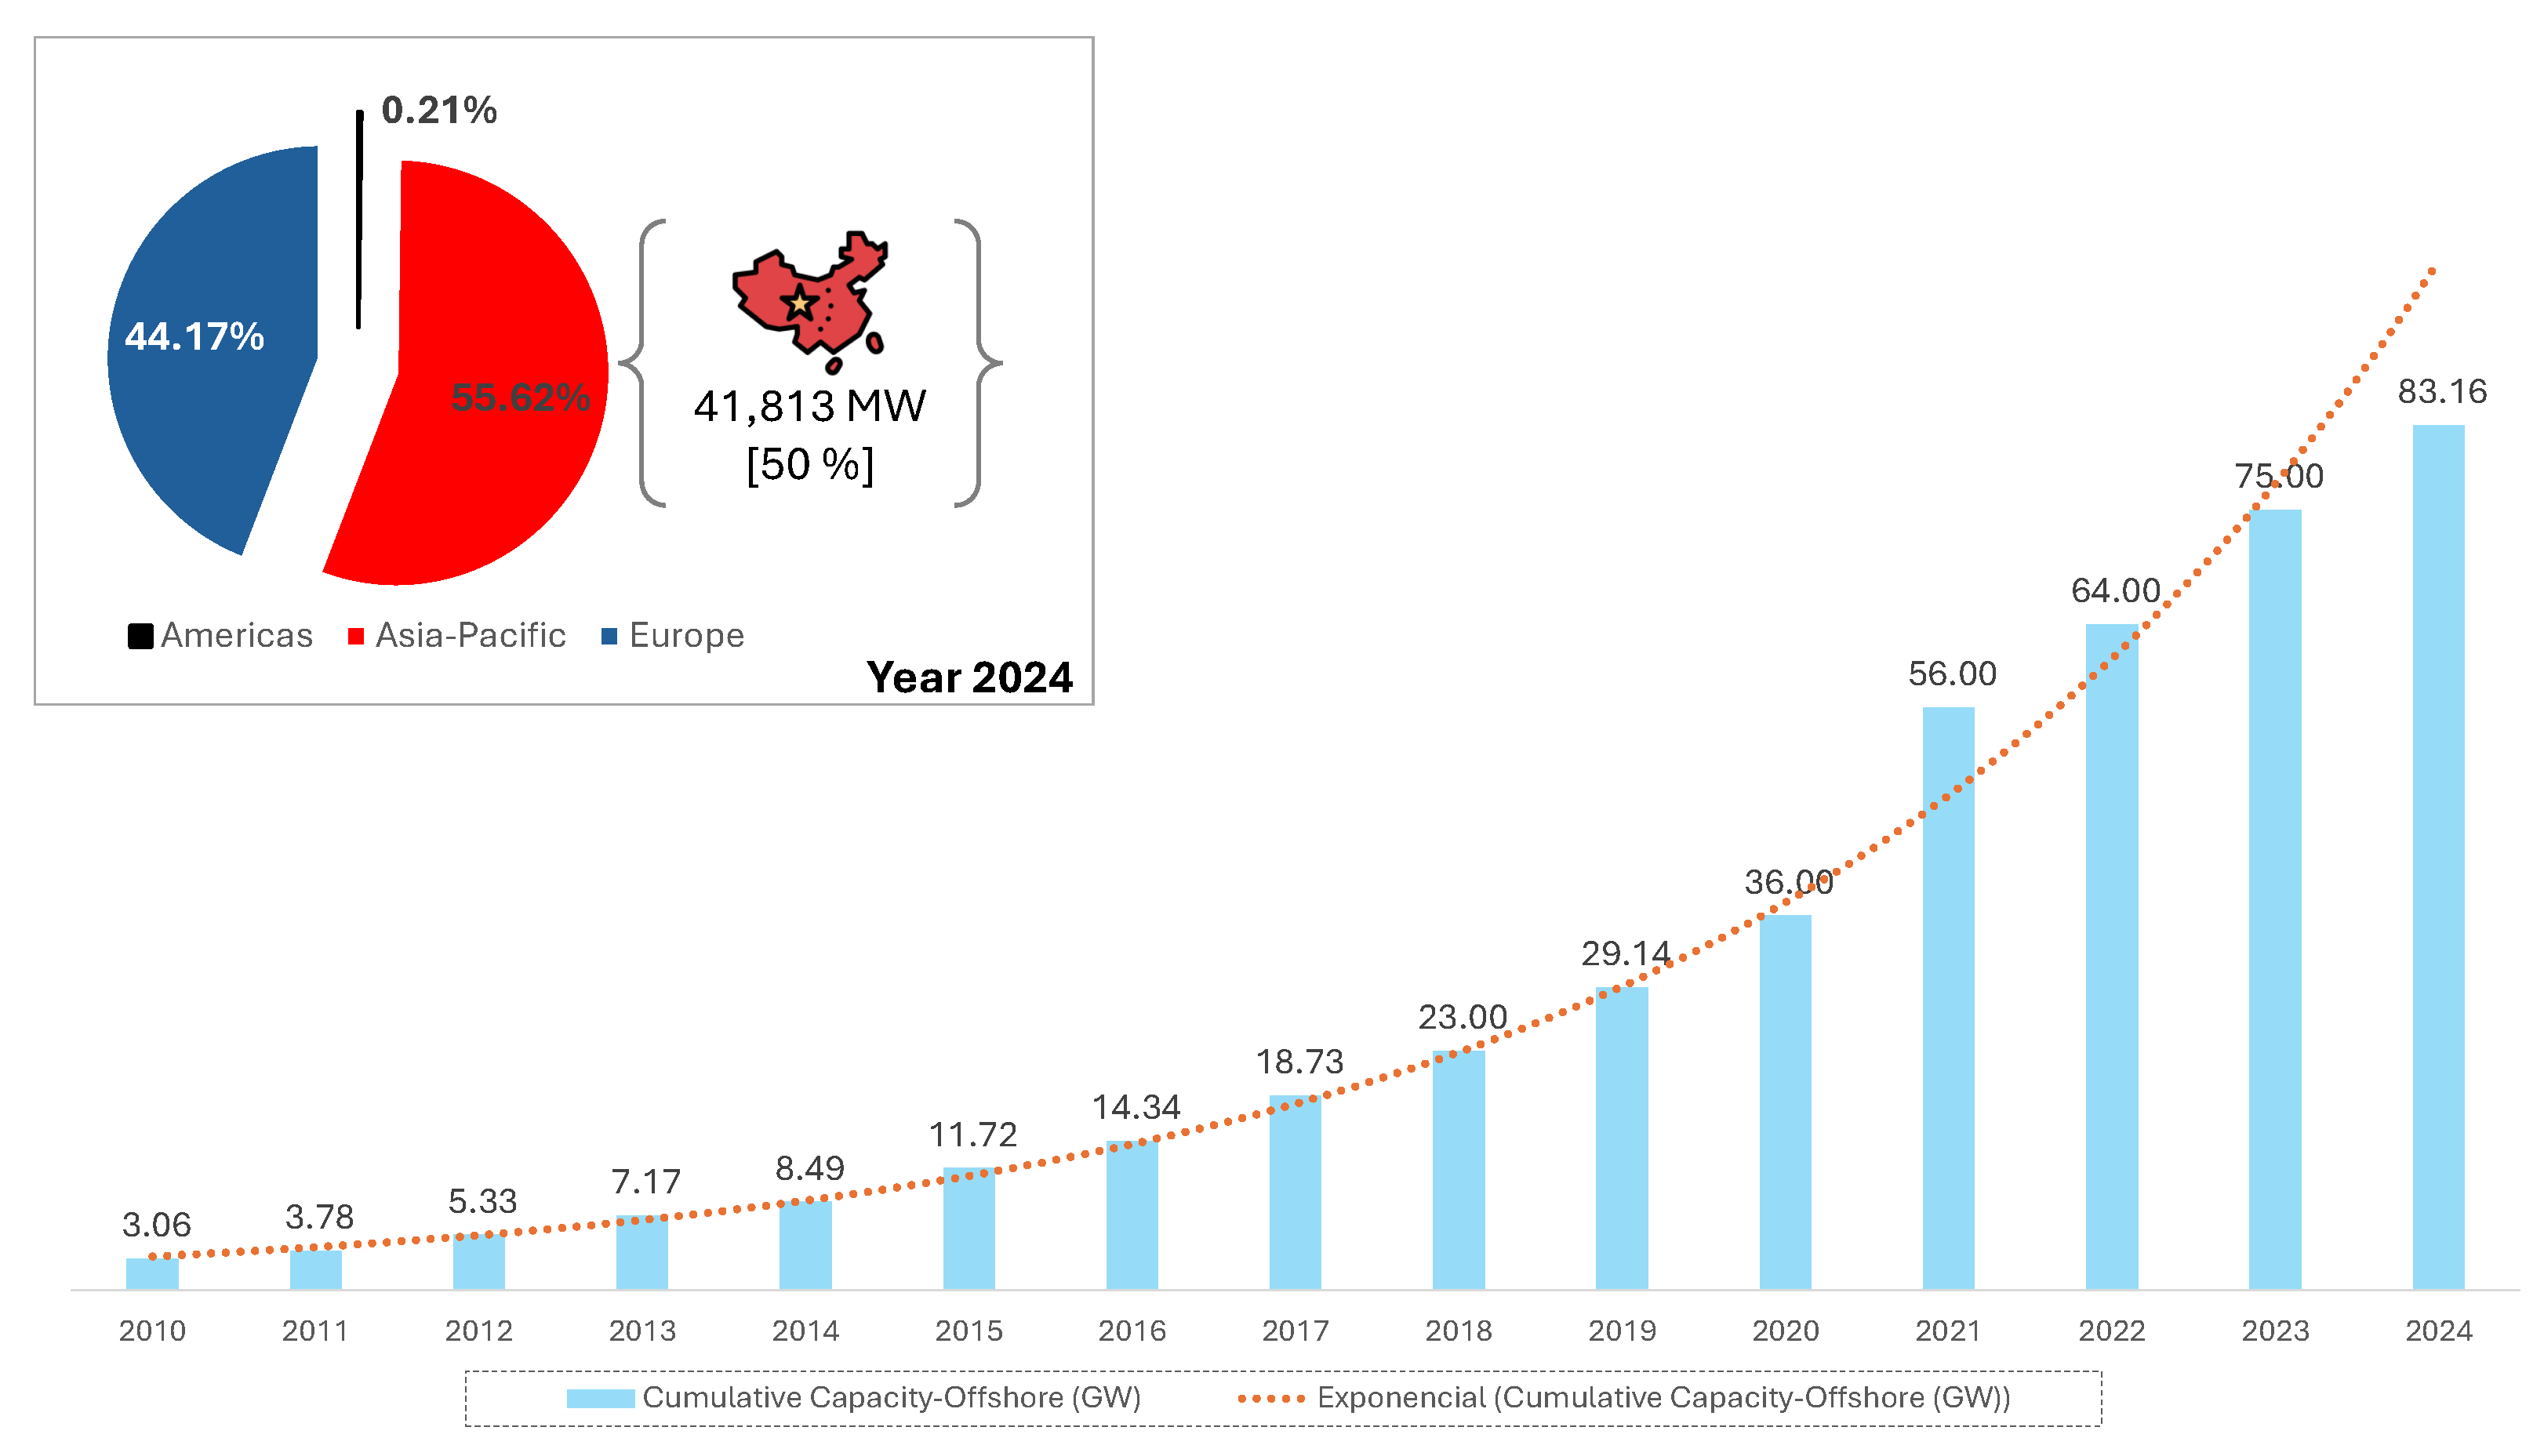
Figure 1. Evolution of offshore wind installed capacity (2010–2024). Continental analysis for 2024. Data source: [3]. Prepared by the authors.
Jmse 13 02183 g001
Figure 2. Workflow graphic. General, operational, and reproducible methodology for comparing offshore wind farms based on HAWTs and VAWTs. Prepared by the authors.
Jmse 13 02183 g002
Figure 3. Case study site located within POEM zones for offshore wind development in Spain. Own elaboration based on [28].
Jmse 13 02183 g003
Figure 4. Energy rose at the case study site at 150 m a.s.l.
Jmse 13 02183 g004
Figure 5. Sector-wise Weibull distribution fitted to the measurement campaign. (k: Shape parameter; A: Scale parameter).
Jmse 13 02183 g005
Figure 6. Geometric normalization for fair comparison: black indicates the HAWT with H hub = 150 m and D i a m e t e r = 240 m vs. red, which indicates the VAWT adjusted to the same top-tip height ( H top = 270 m).
Jmse 13 02183 g006
Table 1. Example of geometric parameters used for fair-height normalization.
HAWTVAWTRationale
H top [m]120120Equalized aerodynamic exposure
H hub [m]90≈0VAWT drivetrain near waterline
Rotor extent [m] 2 R HAWT = 60 H rot , VAWT = 120 Concept-specific swept geometry
Generator elevationNacelle at H hub Near waterlineO&M and center of gravity advantages (VAWT)
Table 2. Geometric parameters for fair-height normalization with H hub , HAWT = 150 m and rotor diameter D = 240 m.
HAWTVAWT
Hub height H hub [m]150≈0
Rotor diameter [m]240
Rotor radius R HAWT [m]120
Rotor swept range [m]30–2700–270
Top-tip height H top [m]270270
Generator elevationNacelle at hubNear waterline
Table 3. WAsP results for IEA Wind 15 MW technology.
ParameterIEA Wind 15 MW
TechnologyHorizontal axis
Hub height150 m
Rotor diameter240 m
Rated power (unit)15 MW
Number of turbines10
Installed power (wind farm)150 MW
Gross production644.760 GWh
Net production636.20 GWh
Wake losses1.33%
Energy delivered to grid585.31 GWh
Equivalent full-load hours3902.05 h
Capacity factor45%
Table 4. AEP corrections for SeaTwirl 10 MW VAWT relative to WAsP baseline.
Scenario f ρ [-] f TI [-] f wake [-]Total FactorAEP [GWh] Δ [%]
Conservative0.990.961.050.998577−0.2
Base0.990.981.101.067617+6.8
Optimistic1.011.011.201.224708+22.6
Disclaimer/Publisher’s Note: The statements, opinions and data contained in all publications are solely those of the individual author(s) and contributor(s) and not of MDPI and/or the editor(s). MDPI and/or the editor(s) disclaim responsibility for any injury to people or property resulting from any ideas, methods, instructions or products referred to in the content.