Article

Simulation Application of Computational Fluid Dynamics for the Variable Structure Underwater Vehicle

1
State Key Laboratory of Robotics and Intelligent Systems, Shenyang Institute of Automation, Chinese Academy of Sciences, Shenyang 110016, China
2
University of Chinese Academy of Sciences, Beijing 100049, China
3
Key Laboratory of Marine Robotics, Shenyang 110169, China
*
Author to whom correspondence should be addressed.
J. Mar. Sci. Eng. 2025, 13(11), 2175; https://doi.org/10.3390/jmse13112175
Submission received: 19 October 2025 / Revised: 4 November 2025 / Accepted: 15 November 2025 / Published: 17 November 2025
(This article belongs to the Special Issue Underwater Robots)

Abstract

Establishing accurate hydrodynamic models for underwater vehicles requires extensive motion and force data. However, acquiring such data through full-scale sea trials involves complex platforms, sensors, and control technologies, presenting significant constraints and substantial costs. Therefore, identifying reliable alternative approaches, such as Computational Fluid Dynamics (CFD) simulations, is essential for efficiently obtaining the requisite modeling data. This study employs CFD techniques to conduct simulations, specifically utilizing the overset mesh method to address the multi-degree-of-freedom motion of the vehicle. Concurrently, Circulating Water Channel (CWC) experiments were performed to obtain comparative data. The simulation results demonstrate strong agreement with the experimental measurements, validating the accuracy and reliability of CFD simulations in predicting the hydrodynamic characteristics of underwater vehicles. The findings indicate that the adopted CFD simulation methodology can provide a credible data foundation for hydrodynamic modeling of underwater vehicles, effectively overcoming the numerous limitations associated with sea trials.

1. Introduction

In the field of Underwater Vehicles (UV), stable motion control serves as the fundamental prerequisite for both observation and intervention vehicles [1]. Hydrodynamic components occupy a pivotal position in dynamic modeling and constitute the primary factors affecting control performance. Due to the complex hydrodynamic forces acting on vehicles during underwater motion, extensive high-fidelity motion and force data covering the anticipated operational envelope are essential for establishing reliable hydrodynamic models [2].
Traditionally, acquiring these critical data relies heavily on physical towing tank tests or self-propelled trials [3]. Moraes et al. elaborated on the application of Planar Motion Mechanism (PMM) methods to determine hydrodynamic coefficients for fully appended Autonomous Underwater Vehicle (AUV) operating near the water surface [4]. Guo et al. developed a six-degree-of-freedom PMM platform for measuring hydrodynamic coefficients of Remotely Operated Vehicle (ROV) [5]. However, collecting comprehensive and accurate hydrodynamic data from full-scale UV presents formidable practical challenges [6]. This process necessitates vehicle platforms equipped with precise maneuvering capabilities, multi-sensor data acquisition systems capable of underwater operation, advanced signal processing techniques to mitigate inherent noise in marine environments, and robust control systems to maintain prescribed trajectories and attitudes. These requirements impose substantial cost and technical barriers, rendering exhaustive experimental campaigns frequently prohibitive [7,8].
To address these limitations, Computational Fluid Dynamics (CFD) has emerged as a powerful alternative approach for characterizing hydrodynamic properties [9]. CFD methods can replicate motions conducted in towing tanks, planar motion mechanisms, and rotating arm facilities, providing detailed simulations of fluid flow around vehicles to compute hydrodynamic forces and moments corresponding to specific velocities, accelerations, and orientations within a virtual environment [10]. Mishra and Vengadesan employed CFD methods to calculate translational added mass for torpedo-shaped AUV [11]. Javanmard et al. utilized CFD approaches to determine added mass coefficients for translational, longitudinal, and lateral maneuvers of torpedo-shaped UV, validated through ellipsoid test cases [12]. De Barros et al. demonstrated that CFD methods provide superior coefficient predictions for large-angle-of-attack motions [7]. Shadlaghani and Mansoorzadeh conducted CFD simulations using the DARPA SUBOFF submarine model to perform steady maneuvers replicating towing experiments with drift angles, calculating six linear damping coefficients and unsteady flow fields (translational and rotational coefficients) for submarines [13]. Le and Hong simulated lift and drag forces of underwater gliders at various angles of attack and velocities in CFD environments [14]. Li et al. compared CFD methods with Circulating Water Channel (CWC) experiments for different velocities and wall distances [15]. Ardeshiri investigated hydrodynamic coefficients of SUBOFF based on oscillatory velocities through CFD [16]. Tariq et al. simulated oblique towing and rotating arm tests of SUBOFF via CFD to examine the effects of stern appendages [17]. Kang et al. adopted CFD methods to explore the influence of inter-vehicle distance on hydrodynamic performance in tandem AUV configurations [18]. Guo et al. investigated the nonlinear effects of drift angles on ROVs through both CFD and PMM approaches [15].
This simulation-based approach can provide the extensive datasets required for constructing complex hydrodynamic equations without necessitating comprehensive physical testing [19]. However, the validity of any model derived from CFD data fundamentally depends on the fidelity and reliability of the simulation results themselves. Inaccurate CFD predictions will inevitably lead to erroneous hydrodynamic models, potentially compromising vehicle performance and safety [20]. Therefore, ensuring the accuracy and robustness of the employed CFD methodology is not merely beneficial but imperative before simulation data can be reliably utilized for model construction or validation.
Mesh technology constitutes a critical factor influencing the accuracy and applicability of simulations for UV experiencing complex motions. Conventional mesh approaches often prove inadequate when addressing large-amplitude relative motions or intricate geometries.
The mesh strategy is a critical factor determining the accuracy and robustness of CFD simulations, especially for UV that experience complex and coupled multi-degree-of-freedom (multi-DOF) motions. Traditional single-domain or body-fitted meshes often face severe limitations when dealing with large-amplitude attitude changes, relative body motions, or intricate geometric configurations. These challenges can lead to mesh distortion, loss of solution accuracy, and even numerical divergence. Therefore, there is a growing need for CFD modeling approaches that remain stable and accurate under strongly coupled motion conditions and are adaptable to complex or variable geometries of underwater vehicles.
To overcome this challenge and enhance simulation accuracy in dynamic scenarios, overset mesh techniques have gained increasing attention [20]. This method employs multiple component grids that overlap and communicate through interpolation, enabling regions surrounding moving bodies to move independently within the background mesh, thereby significantly improving computational efficiency and solution fidelity for moving-body problems. Xu et al. utilized an overset mesh to analyze vehicle performance under different towing speeds [21], while Li et al. compared hydrodynamic performance at various attack and drift angles using overset mesh and PMM methods [22].
In this context, we have developed a CFD modeling framework tailored to the multi-degree-of-freedom coupling and complex geometric characteristics of Variable-Structure Underwater Vehicle (VSUV). We detail the construction of an overset mesh CFD framework specifically designed for VSUV maneuvering analysis. Critically, to ensure the reliability of simulation data obtained through this approach, a series of corresponding experiments was conducted in a circulating water channel. The acquired physical measurements serve as benchmarks for validating CFD predictions. Through the combination of simulation and experimental validation, this study aims to demonstrate the feasibility of using overset mesh CFD as a reliable tool for generating high-quality hydrodynamic data, establishing its effectiveness and reliability in the development and modeling of underwater vehicles with complex geometries and multi-DOF coupling.

2. Underwater Vehicle Mechanism

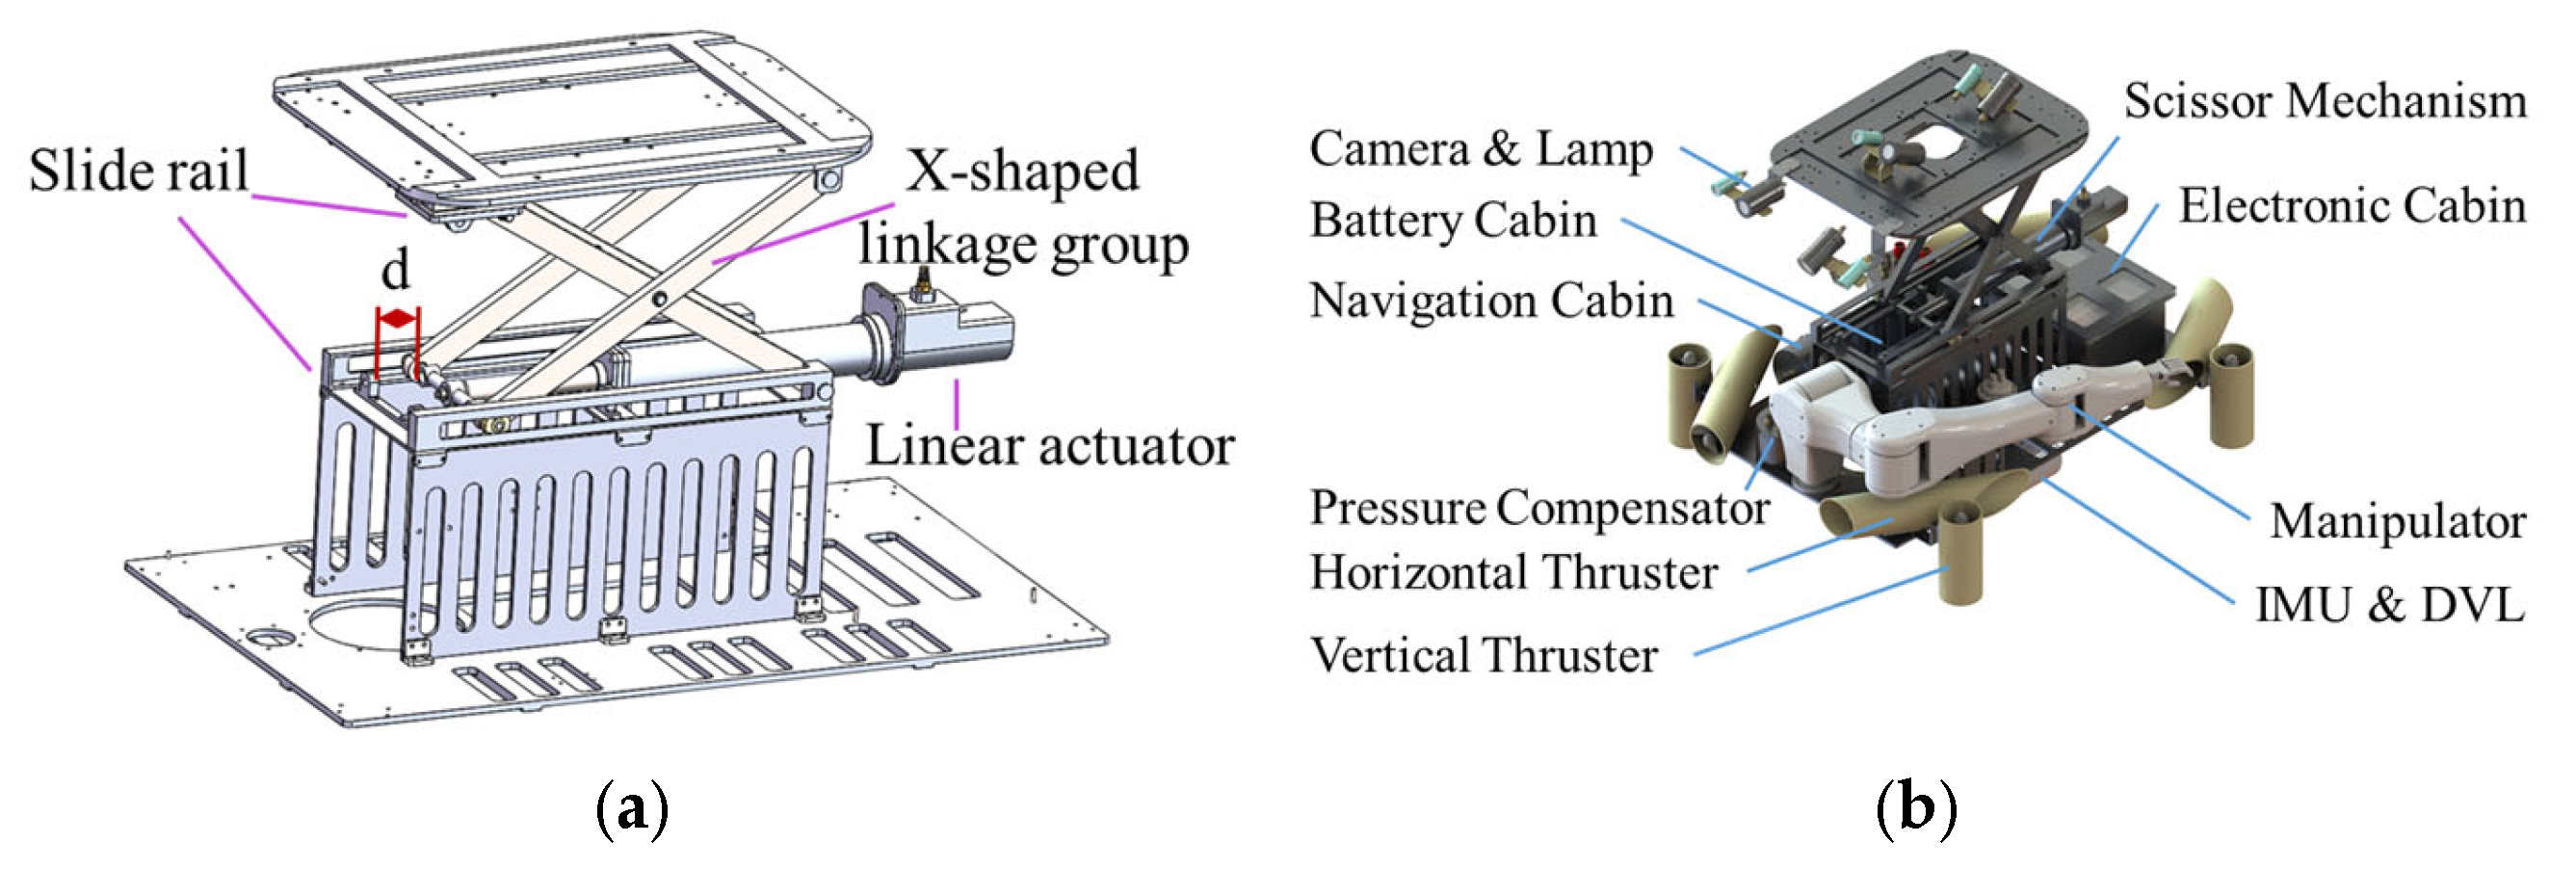
Figure 1 illustrates the 3D schematic and overall dimensions of the Variable-Structure Underwater Vehicle (VSUV) developed by the Shenyang Institute of Automation [23,24]. The vehicle consists of upper and lower sections connected by a scissor mechanism, as shown in Figure 2a. A linear actuator drives the linkage assembly to generate relative motion between the two sections, enabling structural deformation quantified by the deformation parameter d. When the scissor mechanism is fully retracted (d = 0), the entire vehicle is enclosed by external buoyant materials and operates similarly to an AUV, capable of fast cruising missions. Although streamlined, its shape differs from that of a conventional torpedo-type AUV. As the scissor mechanism extends (d > 0), the structural change increases vehicle stability with larger d values. In this configuration, the internal frame becomes exposed to water, allowing the vehicle to function as an open-frame underwater vehicle suitable for manipulation tasks. Regardless of the configuration, the vehicle’s hydrodynamic performance can be simulated using CFD methods.
As illustrated in Figure 2b, the vehicle is equipped with an HD camera and illumination system for environmental observation and recording. An Inertial Measurement Unit (IMU) and Doppler Velocity Log (DVL) are integrated to acquire motion and attitude data. The propulsion system comprises four horizontal and four vertical thrusters arranged in a vectored configuration, providing redundant degrees of freedom to ensure vehicle agility and maneuverability. This configuration enables arbitrary turning within a specified range, vertical ascent and descent, and fine attitude adjustment during hovering operations. The structural design allows modification of geometric parameters and mass distribution through the scissor mechanism, facilitating stable navigation or manipulation across diverse environments. This architecture endows the vehicle with multi-mission capability, flexibility, and environmental adaptability.
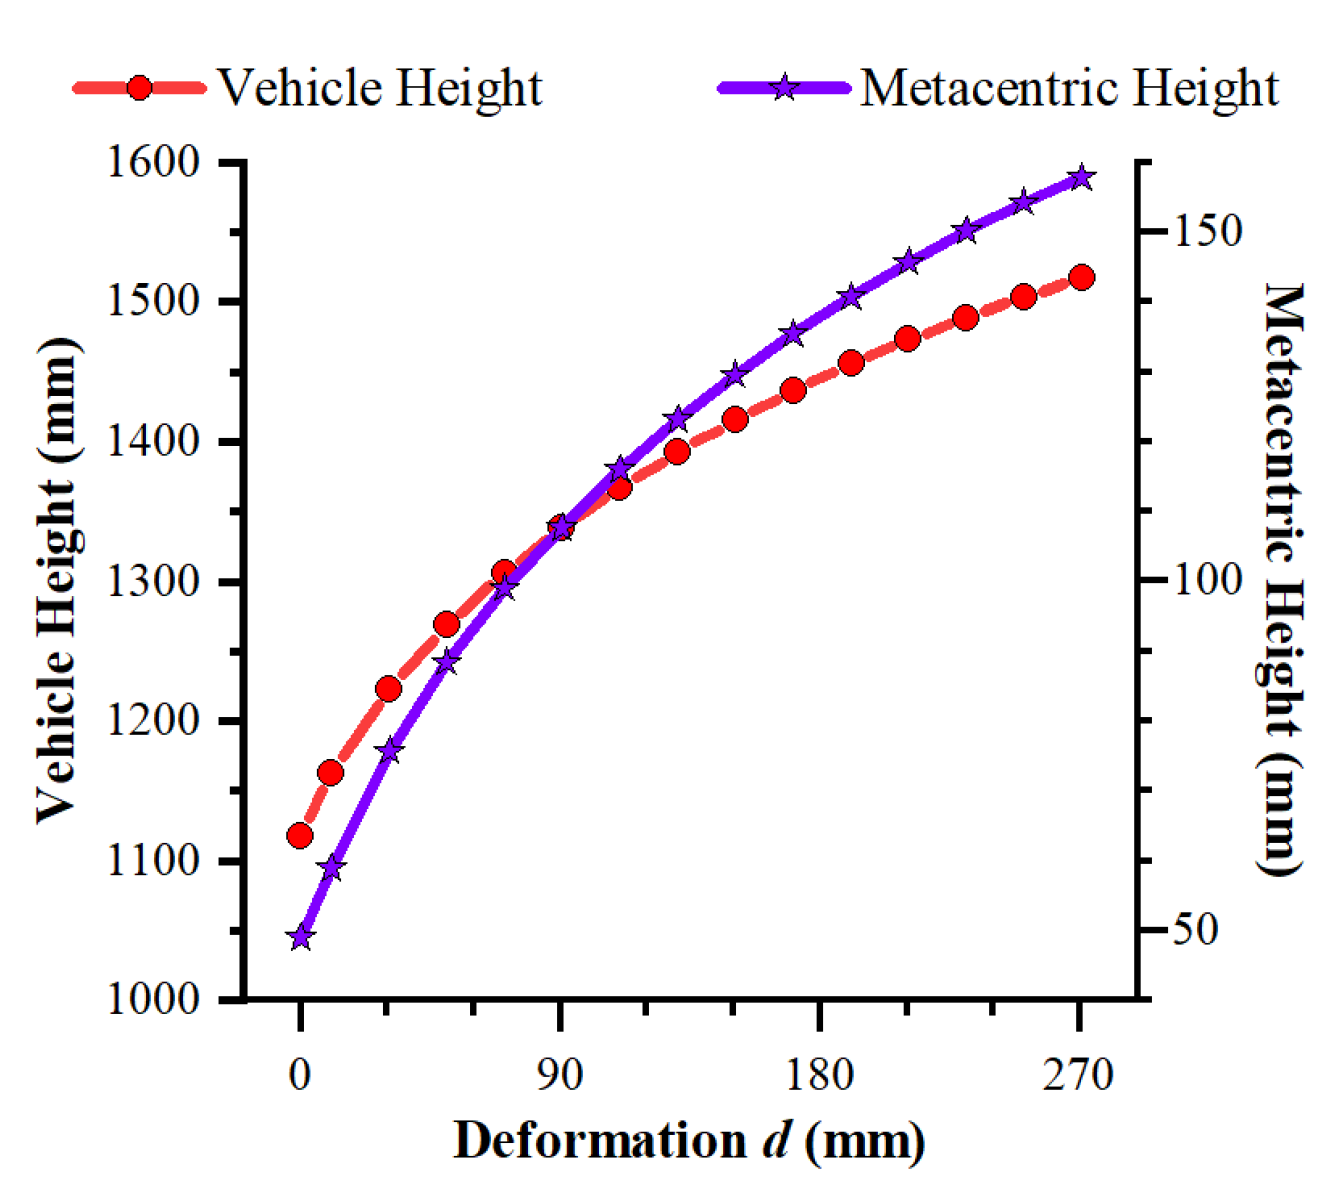
When the deformation parameter d varies, the hydrostatic properties of the vehicle change accordingly. The body-fixed coordinate system origin is defined at the Center Of Gravity (COG) when d = 0, with the x-axis oriented forward, y-axis toward starboard, and z-axis pointing vertically downward. Figure 3 illustrates variations in geometric parameters and mass distribution as the scissor mechanism actuates, with d increasing from 0 to its maximum value of 272 mm. The black curve indicates that the COG position in the XZ plane (body frame) translates from (0, 0) to (−36.2, −206.64) during extension. The purple curve shows that the Center Of Buoyancy (COB) in the XZ plane shifts from (51, −50) to (37, −364), where both COG and COB remain in the XZ plane (yG = yB = 0). As shown in Figure 4, the red dotted curve demonstrates that vehicle height increases from 1118 mm to 1518 mm with increasing d, while the green dotted curve shows that metacentric height increases from 49 mm to 157 mm. These precise geometric properties provide essential data for subsequent control design. The figures clearly demonstrate that metacentric height progressively increases during extension, consequently enhancing the restoring moment under disturbances or during motion, thereby improving vehicle stability.

3. CFD Simulation Strategy

CFD offers significant advantages by eliminating the dependence on physical facilities and equipment required for experimental testing. Its cost-effectiveness and efficiency make it a widely adopted tool in UV research, encompassing theoretical exploration, design development, and validation. The International Towing Tank Conference (ITTC) reported in 2002 that CFD accuracy is influenced by multiple factors, with turbulence model selection and mesh quality being paramount [25]. Mesh quality is specifically manifested in boundary layer thickness and spatial grid distribution.

3.1. Parallel Meshing

Mesh type selection is the primary consideration in grid generation. Commonly used meshes are classified as structured or unstructured. Structured meshes, typically hexahedral, exhibit excellent orthogonality and regularity, yielding high computational efficiency and accuracy. However, generating structured meshes for complex geometries such as AUVs with multiple appendages or open-frame ROVs is extremely challenging, time-consuming, and error-prone, representing a fundamental limitation of this approach.
Unstructured meshes lack explicit topological patterns but offer superior geometric adaptability for complex models, providing flexibility in generation methods. This versatility comes at the cost of reduced computational accuracy and efficiency compared to structured meshes. Common unstructured mesh types include Tetrahedral Mesher, Polyhedral Mesher, and Trimmed Mesher. Tetrahedral meshes are most prevalent, offering strong adaptability but requiring excessive cell counts, resulting in slower computation and lower accuracy. Trimmed cell and polyhedral meshes represent emerging approaches that significantly reduce cell count while improving computational speed and accuracy, with trimmed meshes demonstrating superior performance [26].
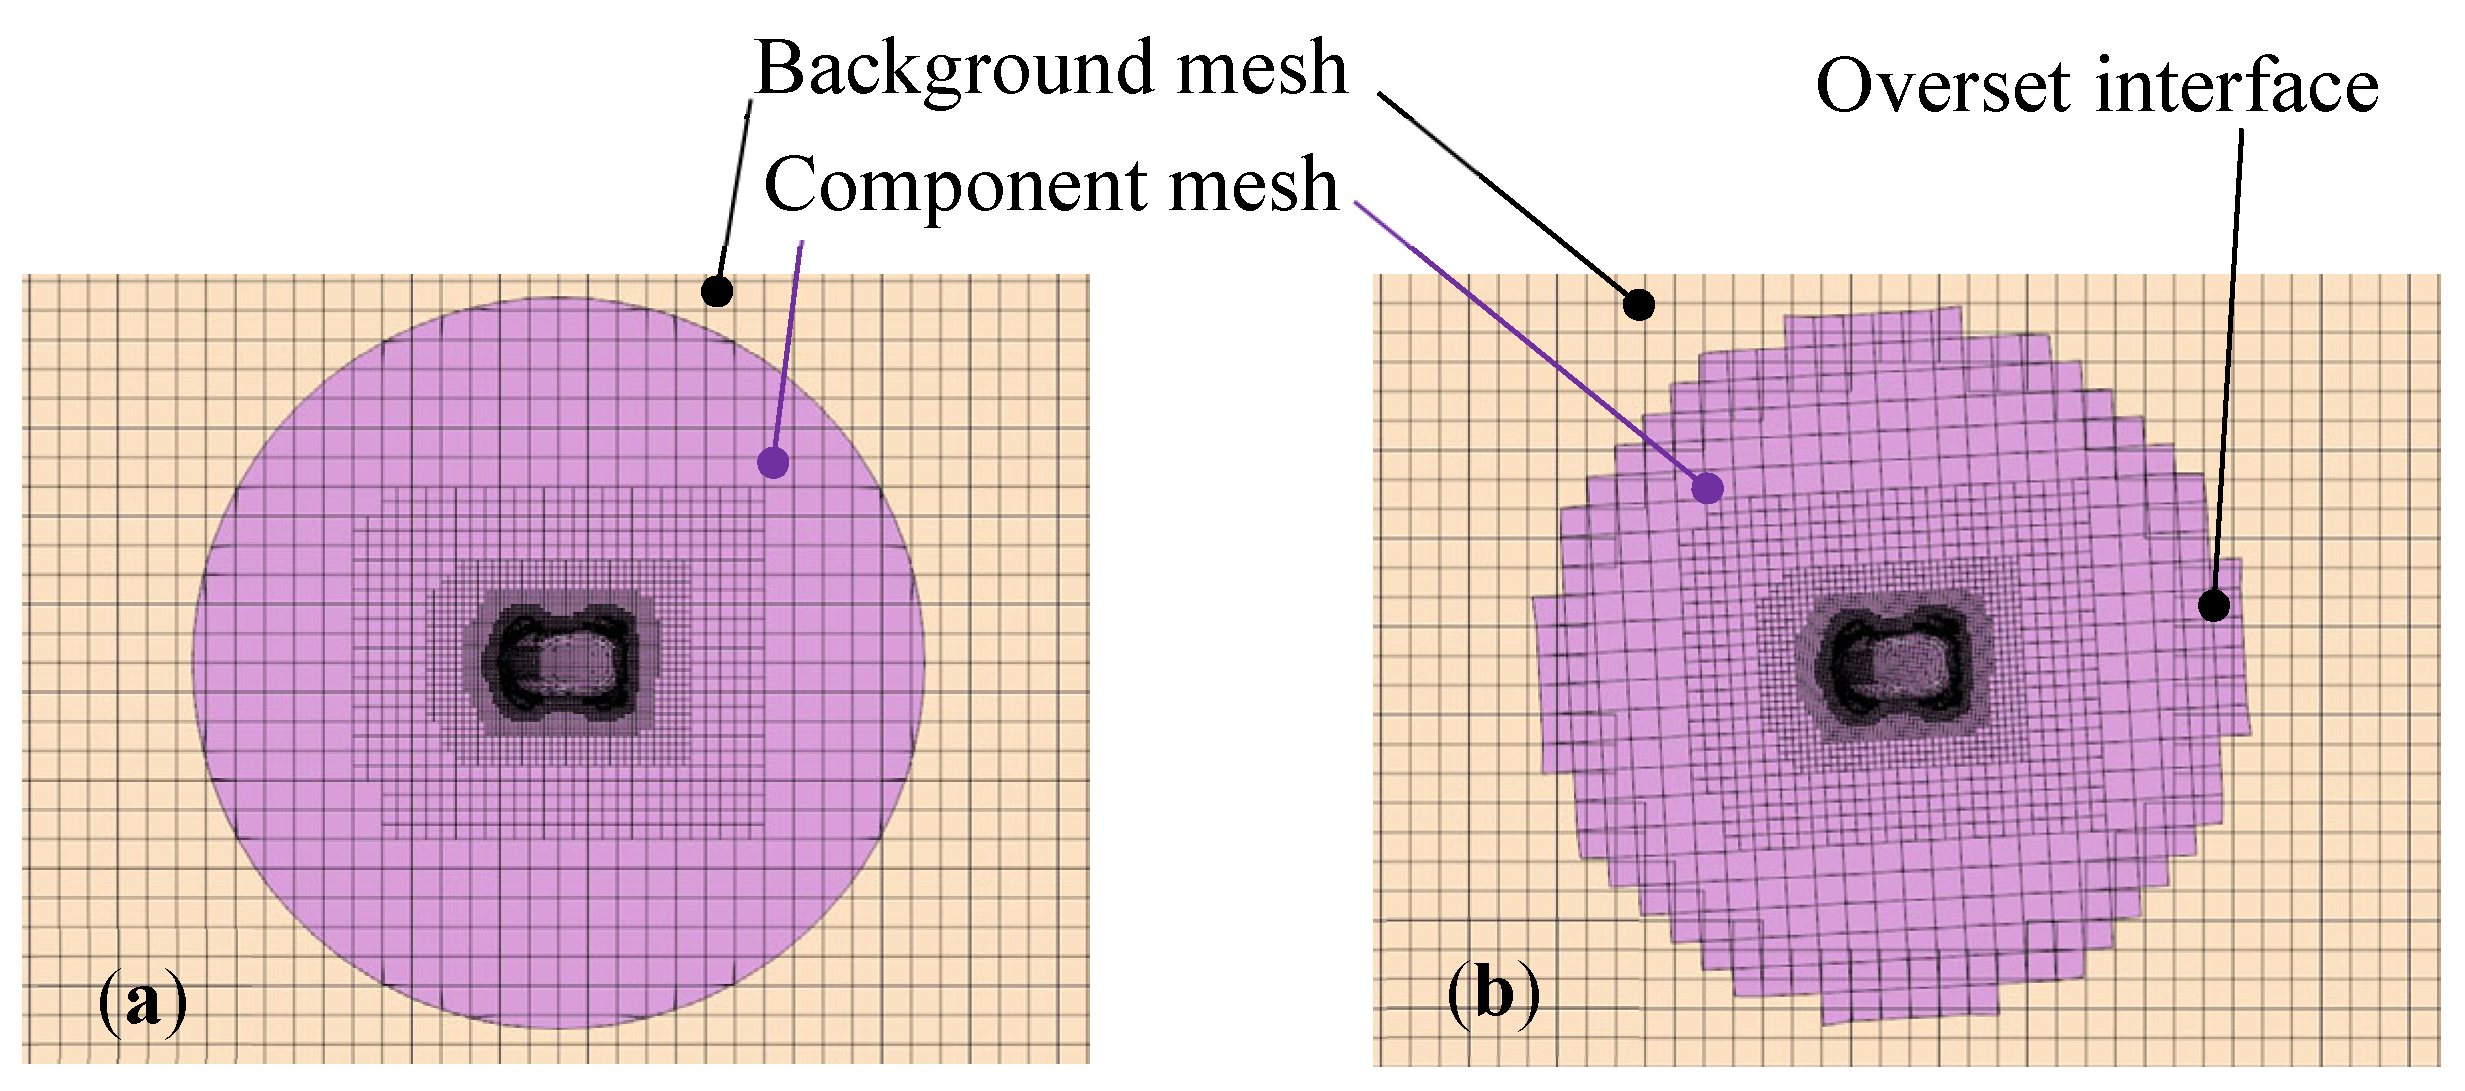
STAR-CCM+ provides multiple meshing tools. Considering the characteristics of various mesh types, Trimmed Mesher were selected for this study. For multi-degree-of-freedom vehicle motion, conventional dynamic meshing techniques often produce negative cell volumes [27]. Overset mesh technology offers an effective solution for handling complex motions. As illustrated in Figure 5, Overset meshes comprise overlapping background and component meshes that communicate through overset interfaces, establishing connectivity for data transfer to complete flow field solutions. This technique eliminates concerns about negative volumes caused by local mesh deformation and reconstruction, enabling large-amplitude motion while maintaining mesh quality.

3.2. Boundary Layer Configuration

In hydrodynamics, the flow around UV surfaces is governed by turbulent boundary layers, making appropriate near-wall mesh resolution essential for accurate turbulence modeling. Due to viscous effects, fluid velocity is zero at the wall and increases rapidly in the wall-normal direction until reaching the free-stream value, as shown in Figure 6. The boundary layer is defined as the thin region where the velocity rises from zero to 99% of the free-stream velocity.
Turbulent boundary layers generally consist of near-wall viscous and buffer regions, where viscosity strongly affects momentum exchange, and an outer region dominated by turbulent shear stress. Accurate mesh resolution across these regions is critical to capture velocity gradients and ensure reliable prediction of hydrodynamic forces.
A finer boundary layer mesh can capture more flow details and improve computational accuracy; however, it also leads to a significant increase in mesh count and computational cost. The boundary layer mesh is typically generated by specifying three key parameters: the first layer thickness, the number of prism layers, and the total boundary layer thickness.
The Reynolds number (Re) is determined based on fluid properties and vehicle dimensions. This value guides the selection of subsequent parameters, such as y+. The Reynolds number is defined as follows:
R e = ρ U L μ
The Re is computed using the fluid density (ρ), free stream velocity (U), characteristic length of the geometry (L), and dynamic viscosity (µ). For fully developed turbulent flow over a flat plate, the skin friction coefficient ( c f ) is estimated using an empirical correlation, expressed as follows:
c f = [ 2 log 10 ( R e ) 0.65 ] 2.3
The wall shear stress ( τ w ) is derived from the c f :
τ w = 1 2 ρ U 2 c f
The friction velocity ( u τ ) can then be calculated from τ w
u τ = τ w ρ
The first call height ( y H ) can then be determined as follows:
y H = 2 y + μ u τ ρ
where y + is the dimensionless wall distance, which is used to guide the sizing of boundary layer meshes.
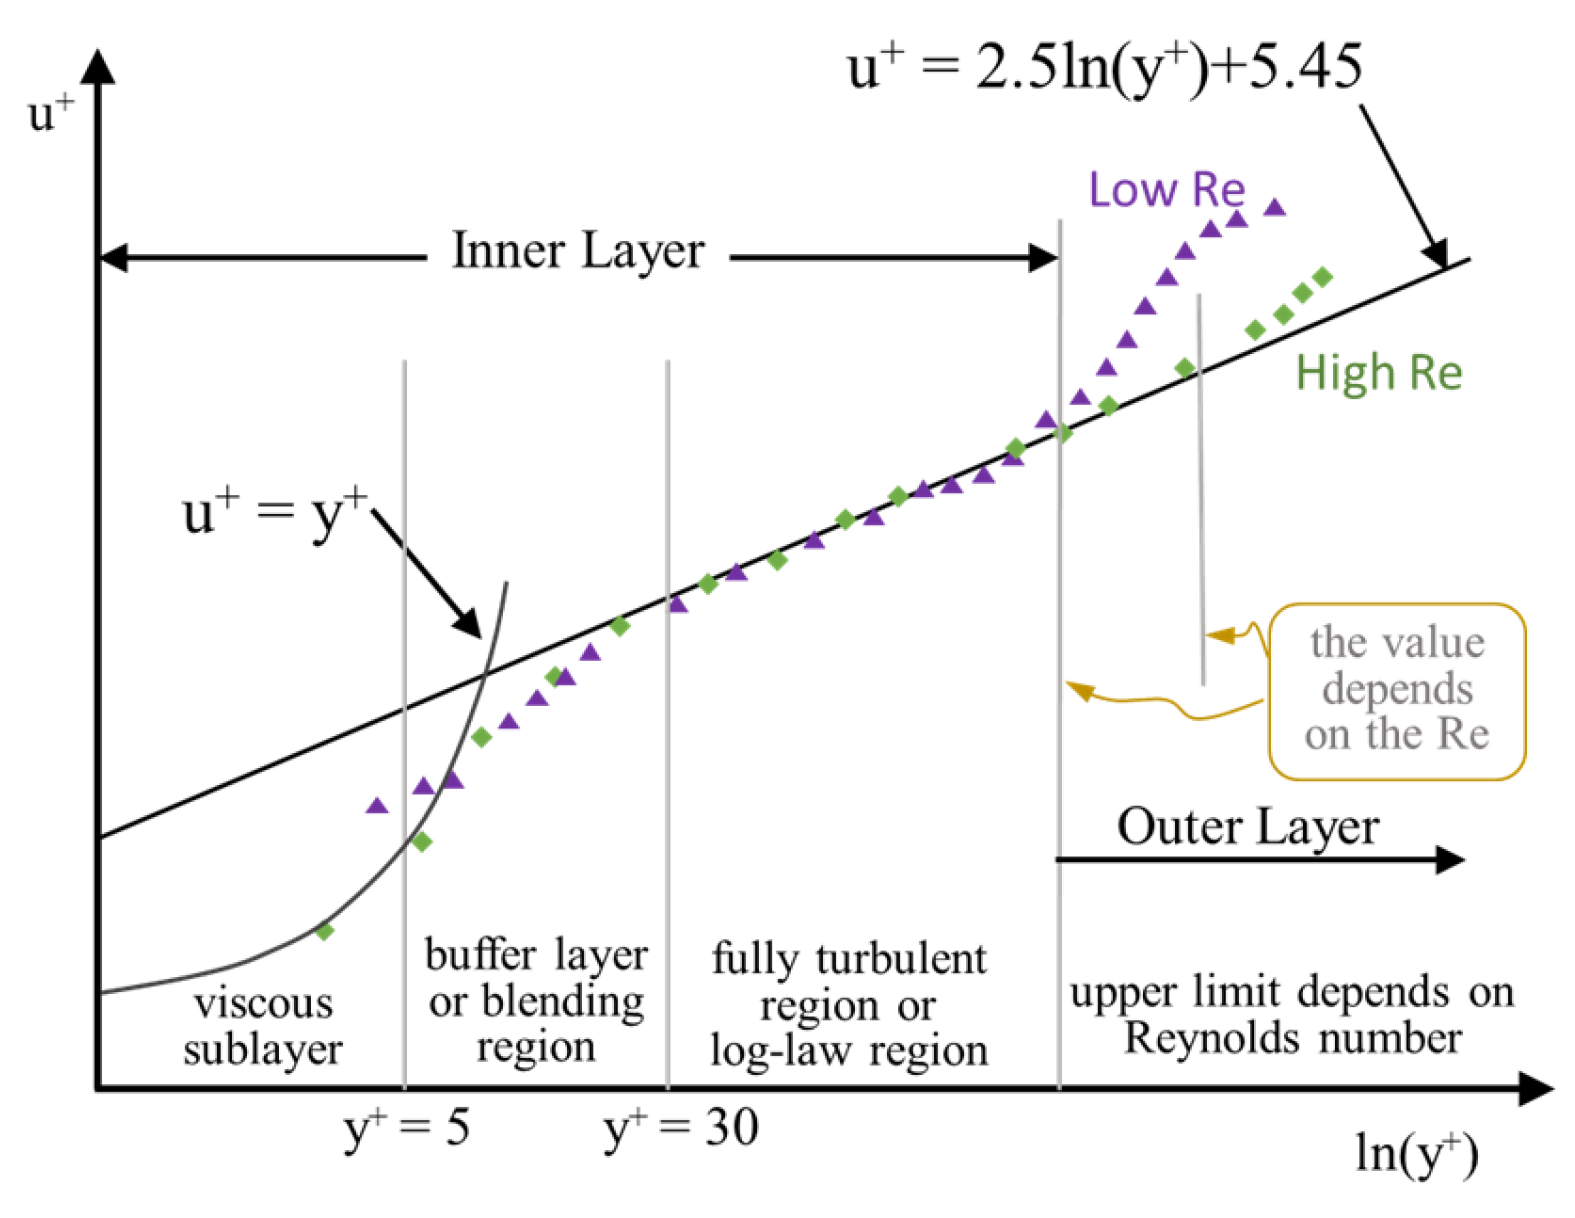
As shown in Figure 7, it represents the relationship between the dimensionless velocity, u + , and the dimensionless wall distance, y + . Typically, y + ranges from 5 to 150, with the appropriate value determined based on the Re and the selected turbulence model.
The boundary layer thickness δ99 was estimated using empirical correlations.
δ 99 = 0.38 L R e L 1 / 5 R e > 5 × 10 5
The boundary layer thickness is related to the thickness of the first boundary layer:
δ 99 = y H 1 r N 1 r
where N denotes the number of prism layers, r represents the growth ratio, which could be computed using the Newton–Raphson root-finding method [28]. These parameters were subsequently applied in STAR-CCM+ to construct the boundary layer mesh.

3.3. Turbulence Model

The k–ω turbulence model is a classical approach where k denotes the turbulence kinetic energy and ω the specific dissipation rate. Among its various enhanced versions, the SST k–ω model is most widely used for drag prediction. It combines the near-wall accuracy of the k–ω model with the free-shear robustness of the k–ε model. By accounting for turbulent shear stress in the eddy viscosity formulation, the SST model better predicts flows with strong adverse pressure gradients and separation [28]. Therefore, it was selected as the turbulence closure model in this study to evaluate the drag forces and moments acting on the vehicle.
The SST model achieves proper transport behavior through a limiter applied to the eddy viscosity formulation. In this framework, the turbulent viscosity is defined as:
μ t = ρ k min α ω , α 1 S F 2
where α* represents the damping coefficient for turbulent viscosity. For the high Reynolds number regime considered in this study, it could be made α* = 1. S denotes the strain rate magnitude, and F2 is the blending function:
F 2 = tanh Φ 2 2 Φ 2 = max 2 k 0.09 ω y , 500 μ ρ y 2 ω
where y is the distance to the next surface.
Implementation of the SST k–ω model enables accurate resolution of the flow field within the vehicle boundary layer. The model exhibits strong predictive performance while maintaining computational efficiency, thereby producing more physically reasonable simulation results.

3.4. Grid Independence Verification

The mesh density and quality directly determine the accuracy and convergence of the discretized equations. Increasing the number of grid nodes generally enhances computational accuracy [29]. However, unlimited mesh refinement is impractical in engineering applications due to prohibitive computational costs or even infeasibility. Therefore, to ensure computational accuracy while maintaining reasonable computational expense, a grid independence verification must be conducted. This procedure involves comparing results obtained from different mesh resolutions to confirm that the numerical solution no longer exhibits significant dependence on mesh density. Without achieving grid independence, variations in results arising from changes in turbulence models or boundary conditions may merely reflect mesh-induced artifacts rather than genuine physical phenomena [30].
Using the vehicle’s straight-line forward motion as a representative case, the drag force was employed as the target physical parameter for grid independence assessment. The independence criterion was validated by examining the convergence characteristics of the computed drag force across progressively refined mesh resolutions.
For boundary layer mesh generation, a prism layer mesh generator was employed to construct the boundary layer mesh on the vehicle wall surface. Mesh independence was verified by adjusting the y + value, number of prism layers, and minimum wall mesh size. Based on previous experience, y + values were set to 20, 30, and 60; the number of prism layers was varied among 5, 10, and 15; and the minimum wall mesh sizes were set to 8 mm and 12.5 mm. These parameters were combined to create 14 mesh schemes, as detailed in Table A1 in Appendix A.1, with the remaining parameters determined through calculation.
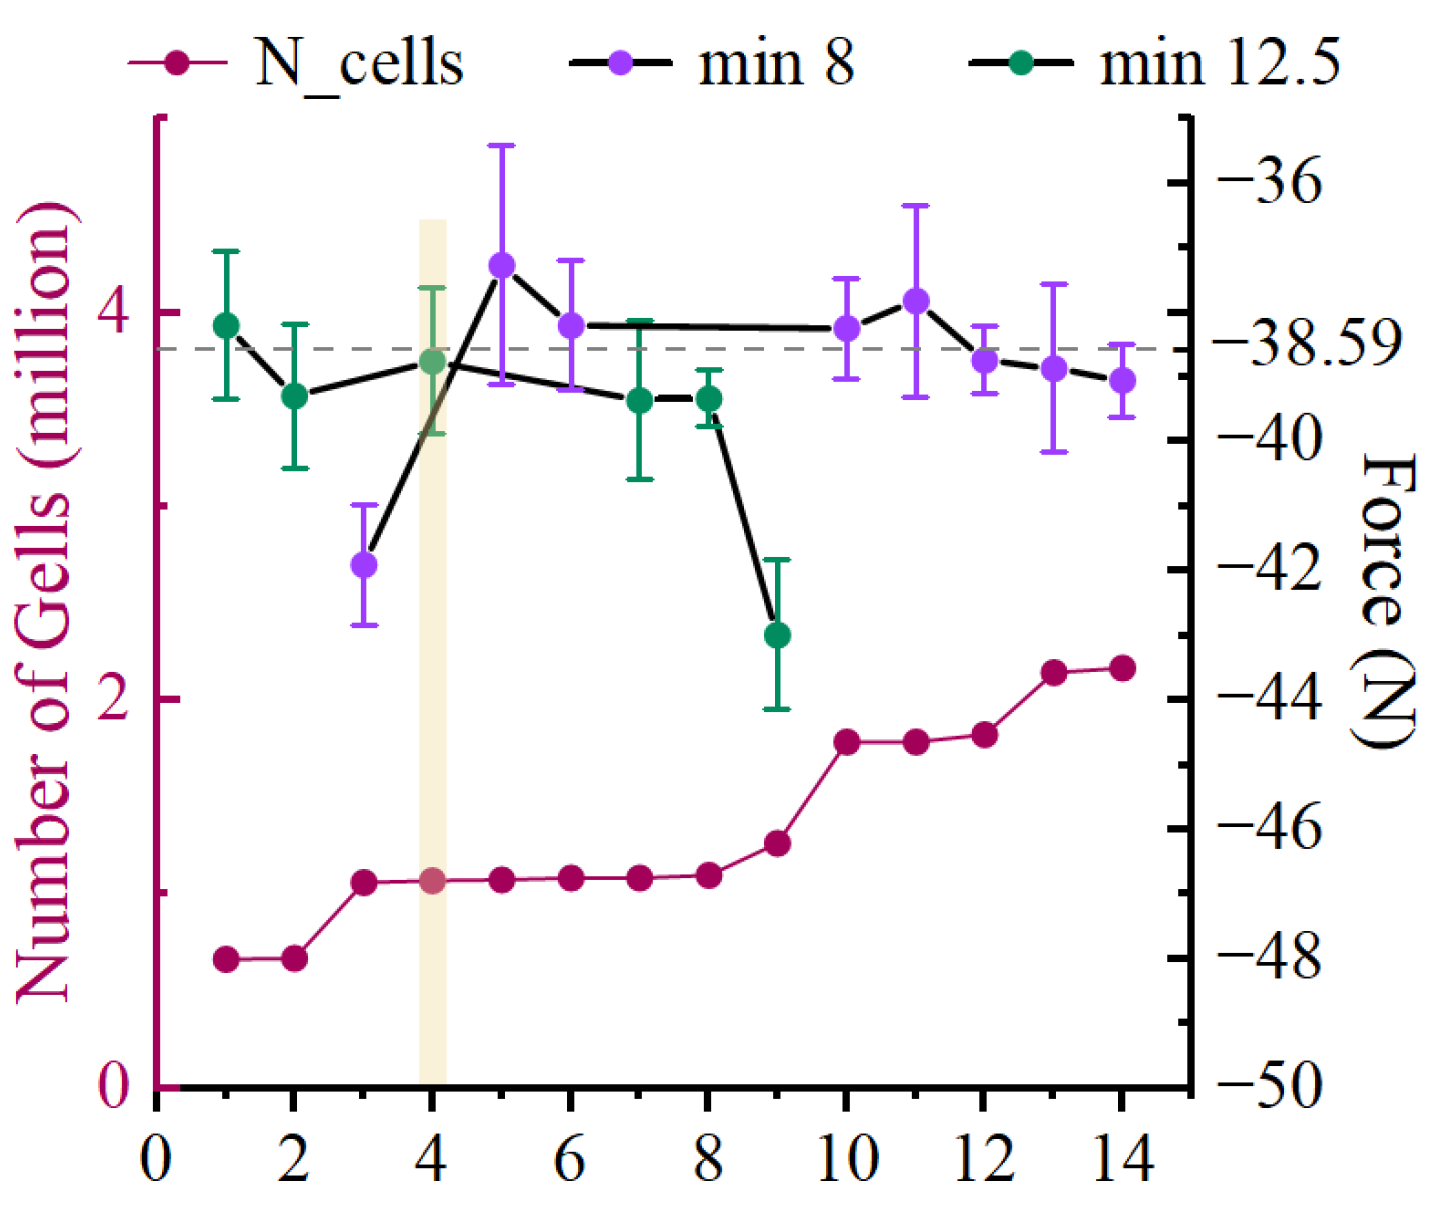
Figure 8 presents the variations in mesh count and drag force across the 14 schemes, where the horizontal axis represents the scheme number, the red dotted line indicates the mesh count, the green dotted line represents the mean drag and standard deviation for a minimum wall size of 12.5 mm, and the purple dotted line represents those for 8 mm. Analysis reveals that, for a given minimum wall size, the drag force increases gradually with mesh count. Under identical conditions, schemes with an 8 mm minimum wall size exhibit relatively lower drag values. Schemes No.3 and No.9 show significantly different drag values compared to other combinations and are considered anomalous. The remaining 12 schemes demonstrate closely aligned drag values with errors below 3%, indicating mesh independence. The mean drag value of −38.59 from these 12 schemes was taken as the reference value. Considering the criteria of minimizing mesh count, achieving drag values close to the reference, and maintaining small simulation standard deviations, Scheme No.4 was selected as the optimal boundary layer mesh configuration.
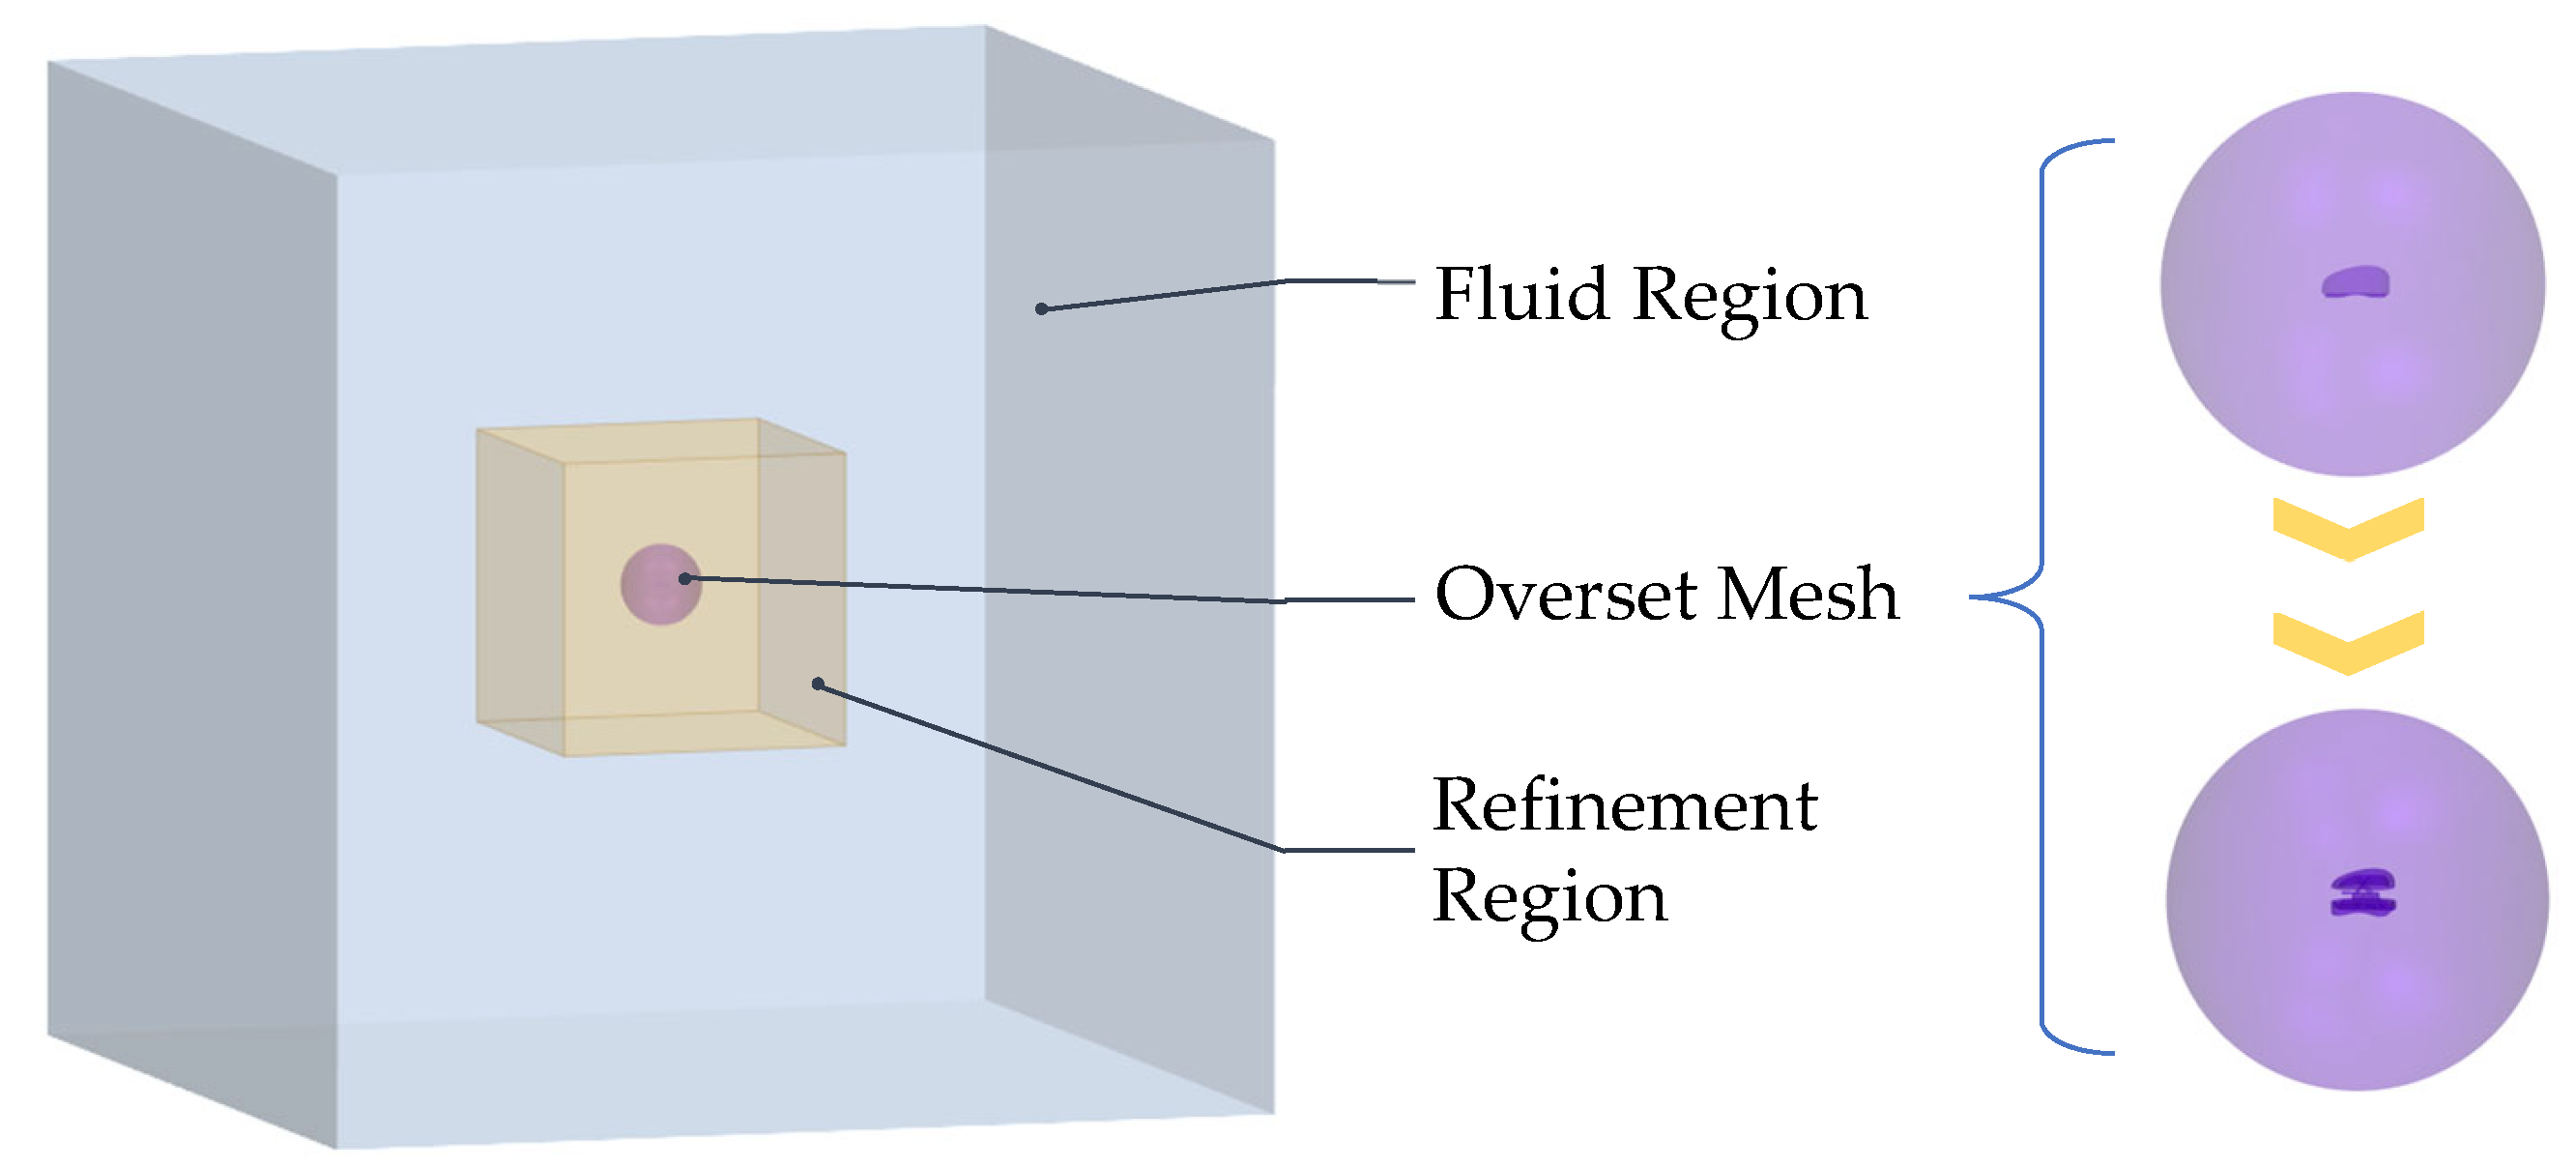
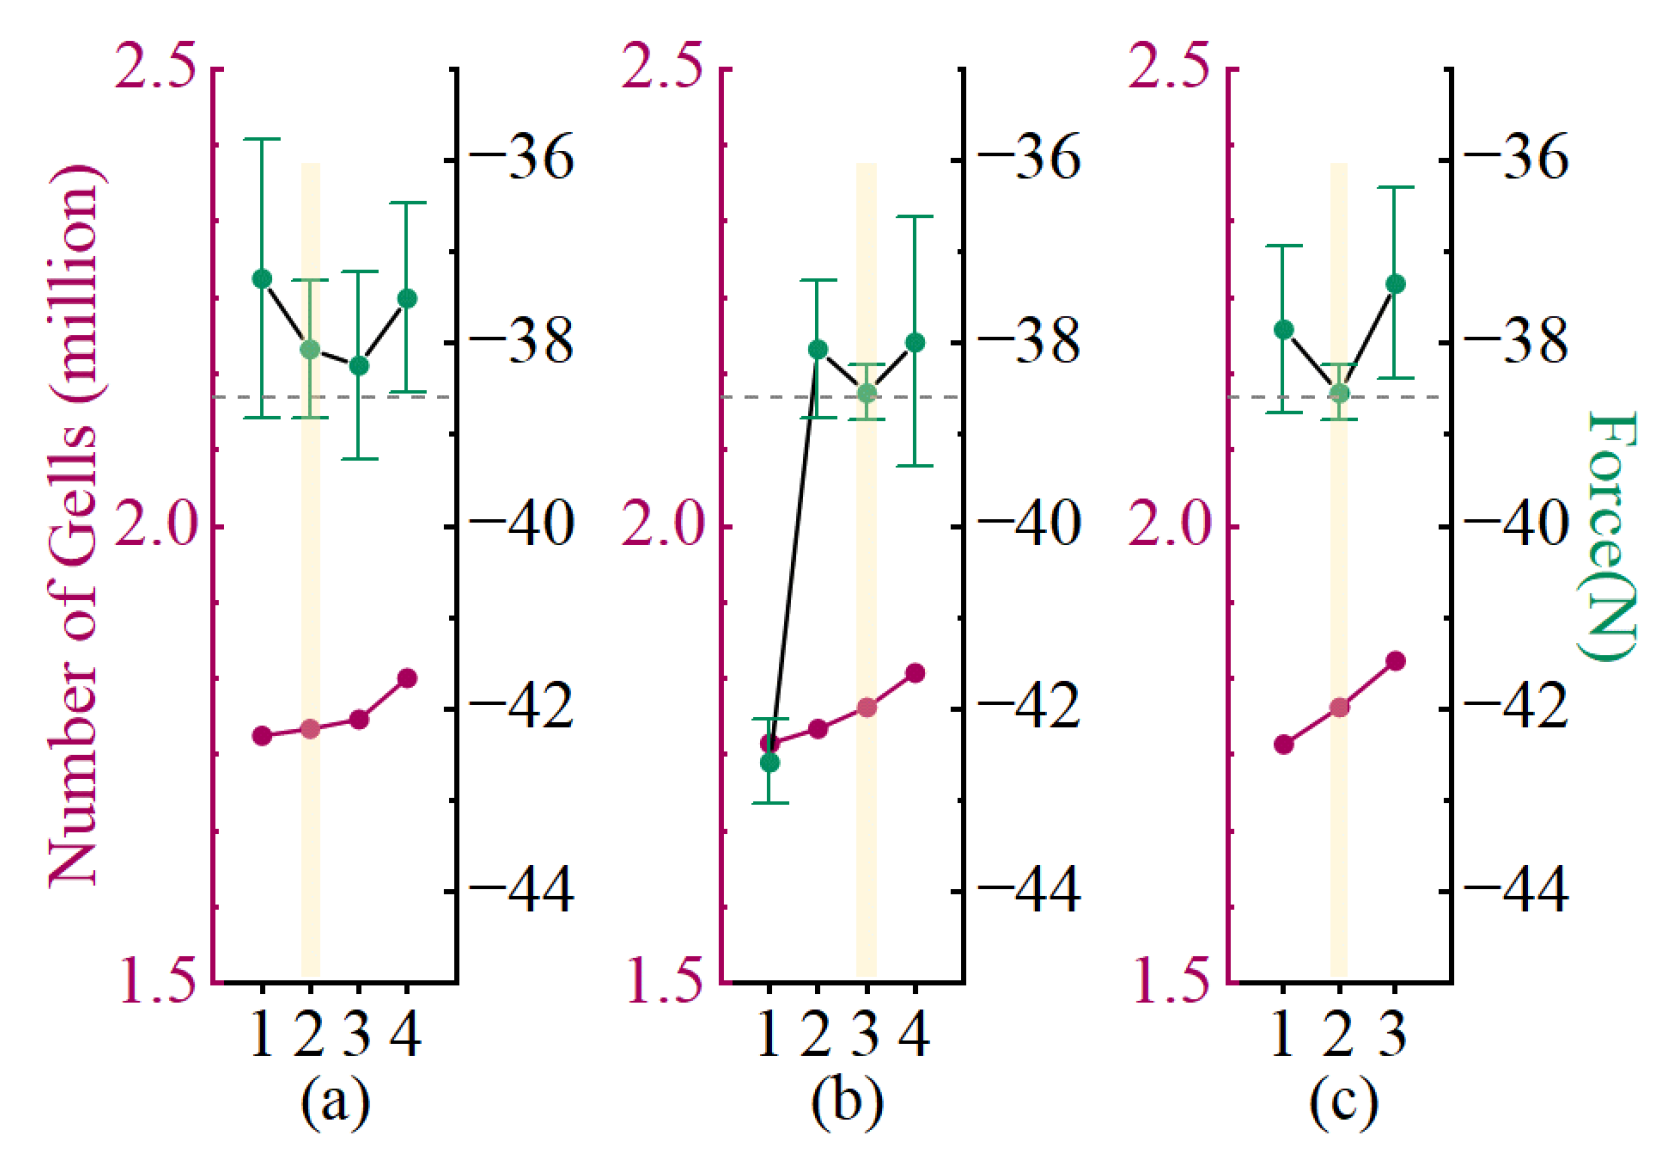
After establishing the boundary layer mesh configuration, the computational domain size was identified as another critical factor influencing the total mesh count. The regions affecting mesh quantity primarily include the flow domain, refinement region, and overset mesh region (As shown in Figure 9. A control variable method was employed to sequentially adjust the dimensions of each region for mesh independence analysis and verification. The refinement zone dimensions were adjusted first. Considering the six-degree-of-freedom motion requirements of the vehicle, the refinement zone was configured as a cube with edge lengths of 8 m, 10 m, 12 m, and 16 m, respectively. Table A2 in Appendix A.2 presents the mesh counts and drag values for different dimensions, while Figure 10a demonstrates that the total mesh count increases with edge length. Following the criteria of enhancing computational efficiency, maintaining mean drag values close to the reference, and achieving smaller standard deviations, an edge length of 10 m was selected for the refinement zone. Similarly, the overset region was defined as a sphere with a diameter of 7 m (as shown in Figure 10b), and the flow domain was set as a cube with an edge length of 40 m (as shown in Figure 10c). Through comprehensive comparison, this regional combination was determined to be the optimal mesh configuration scheme.
In summary, based on independent verification of both the boundary layer mesh and computational domain dimensions, a mesh configuration was obtained that achieves an optimal balance between computational accuracy and cost.

4. Comparison Between Simulation and Experiment

4.1. Simulation Results

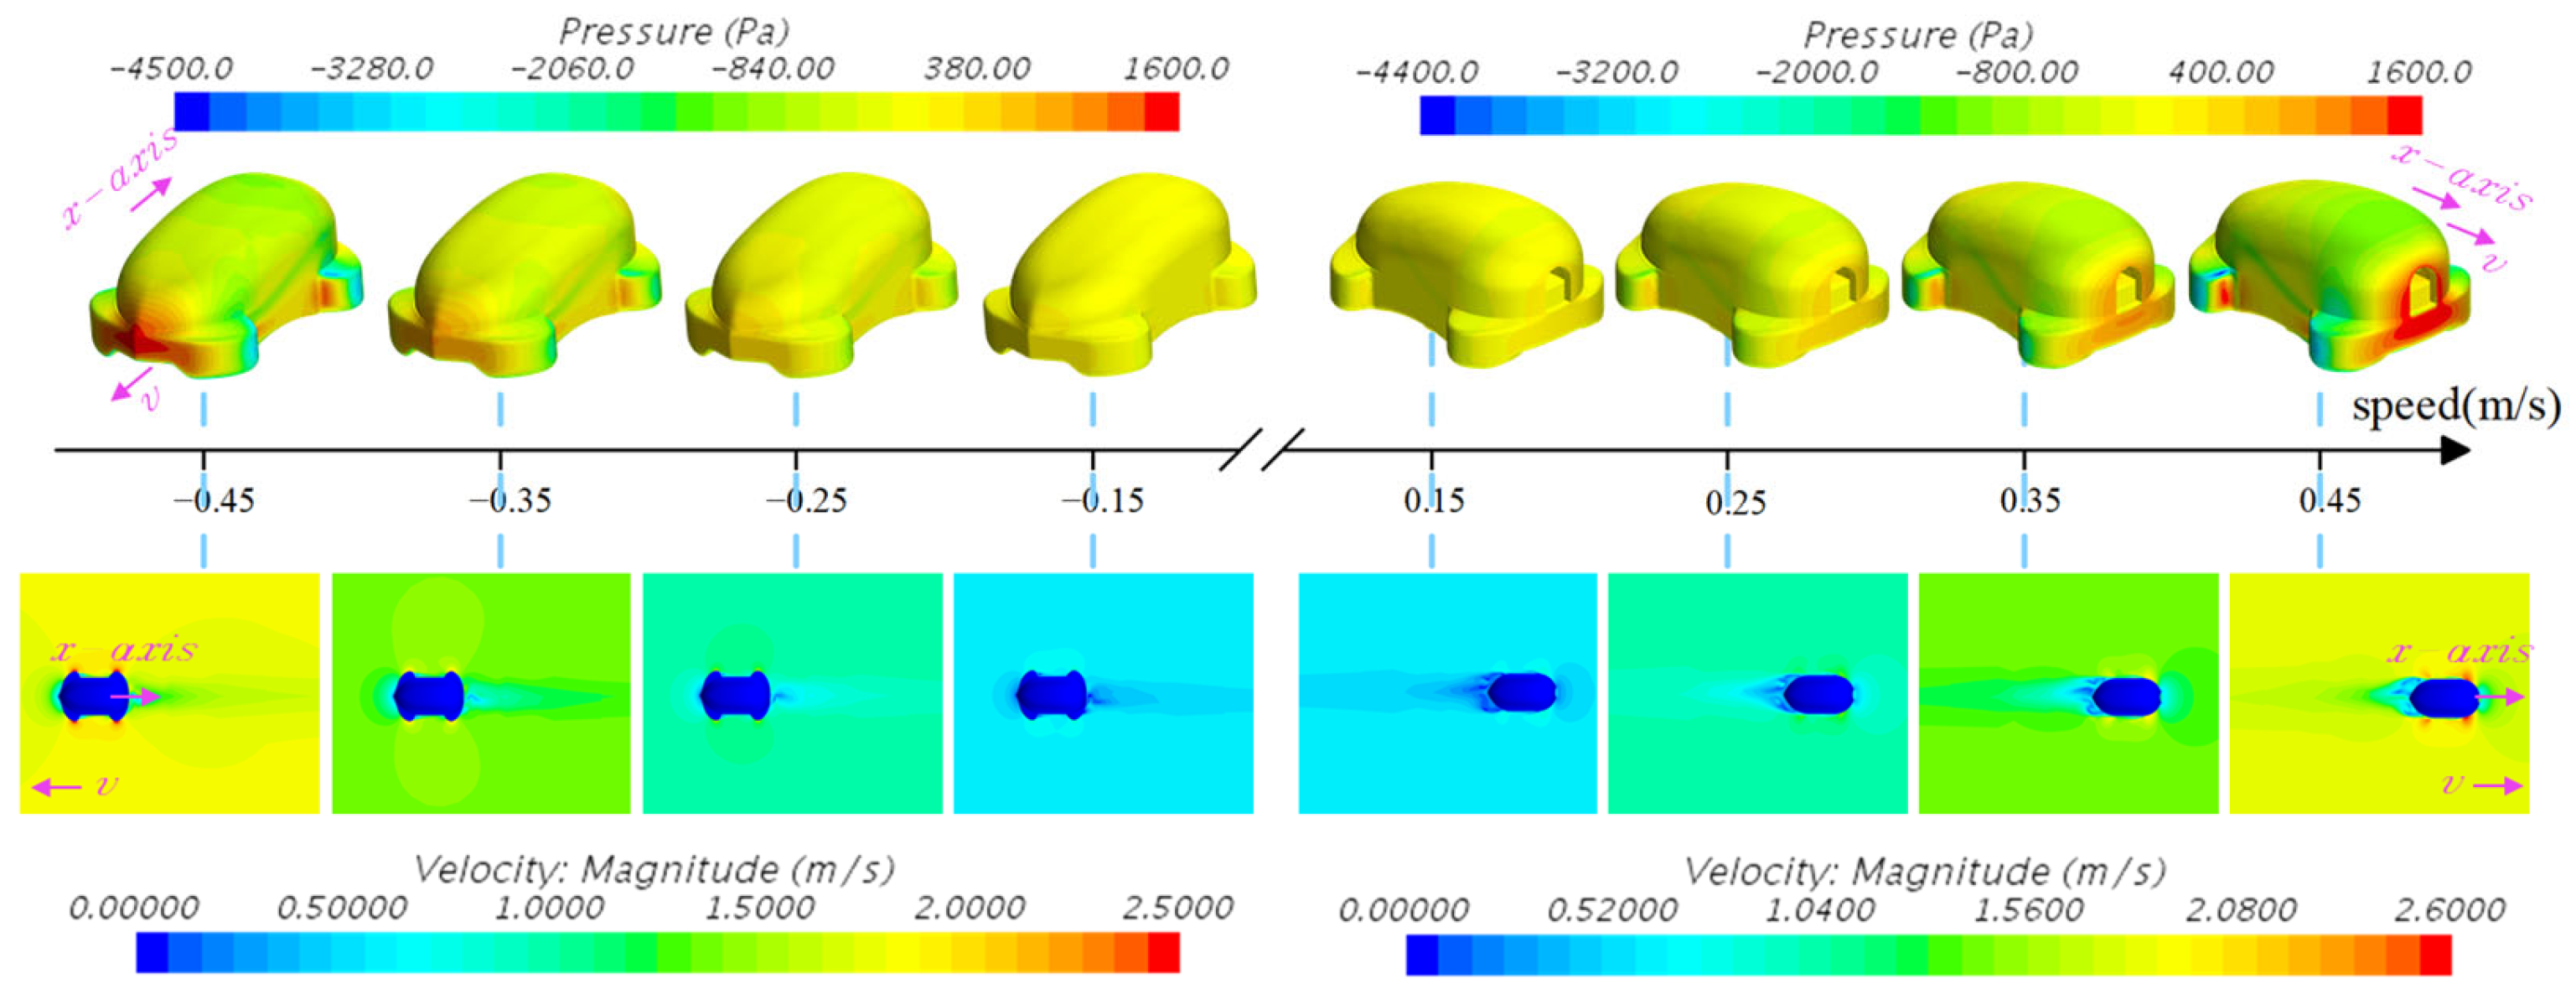
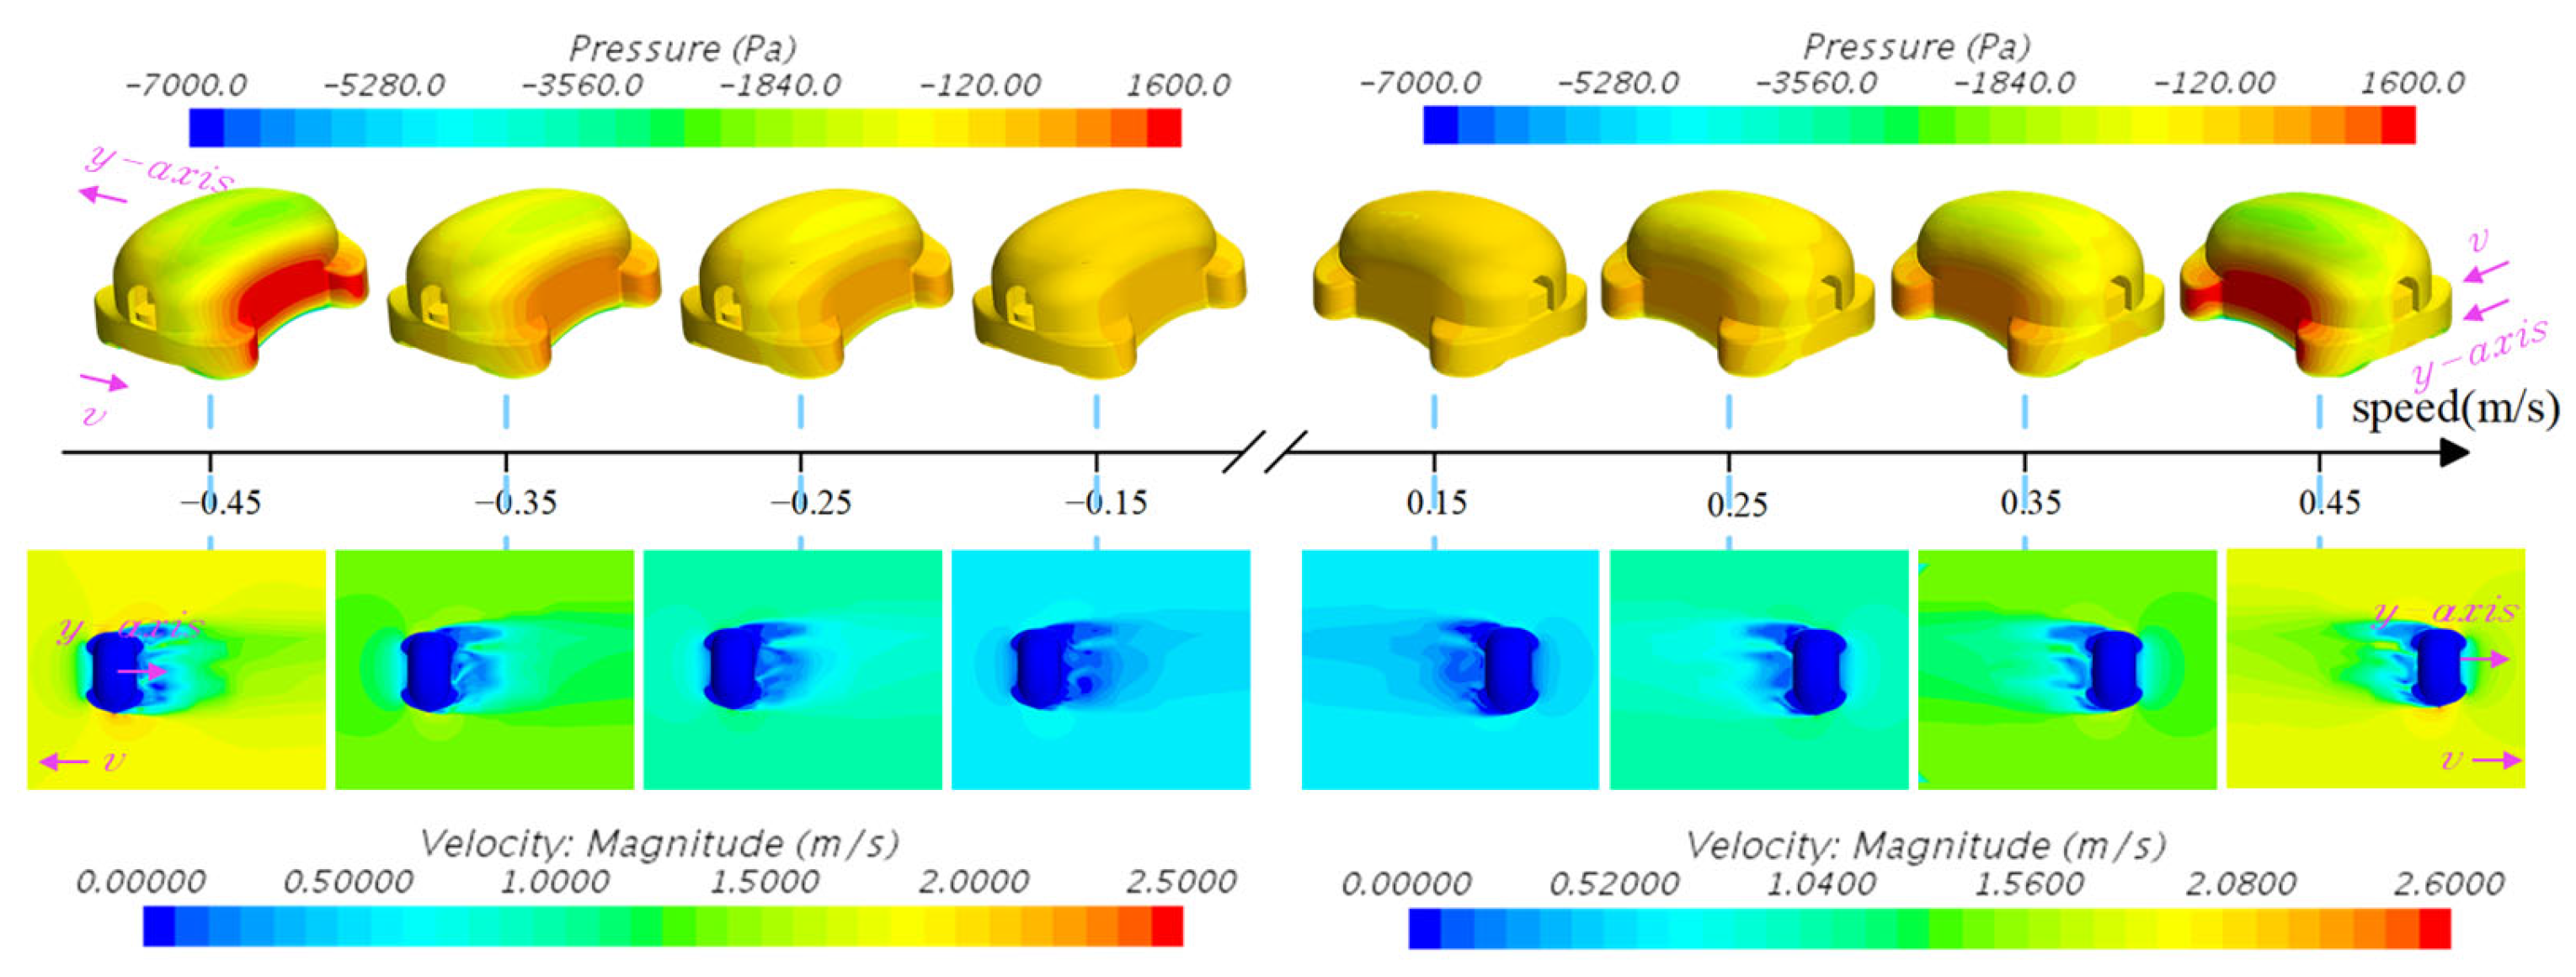
The simulation generated pressure distributions and velocity flow fields during vehicle motion, along with force and moment data. Based on classical motion postures and practical operational requirements, three motion modes were established: surge, sway, and oblique motion (combining surge and sway). The velocity range was set from 0 to 0.45 m/s with increments of 0.05 m/s for each simulation run. For demonstration purposes, four representative velocity states are presented for each motion mode:
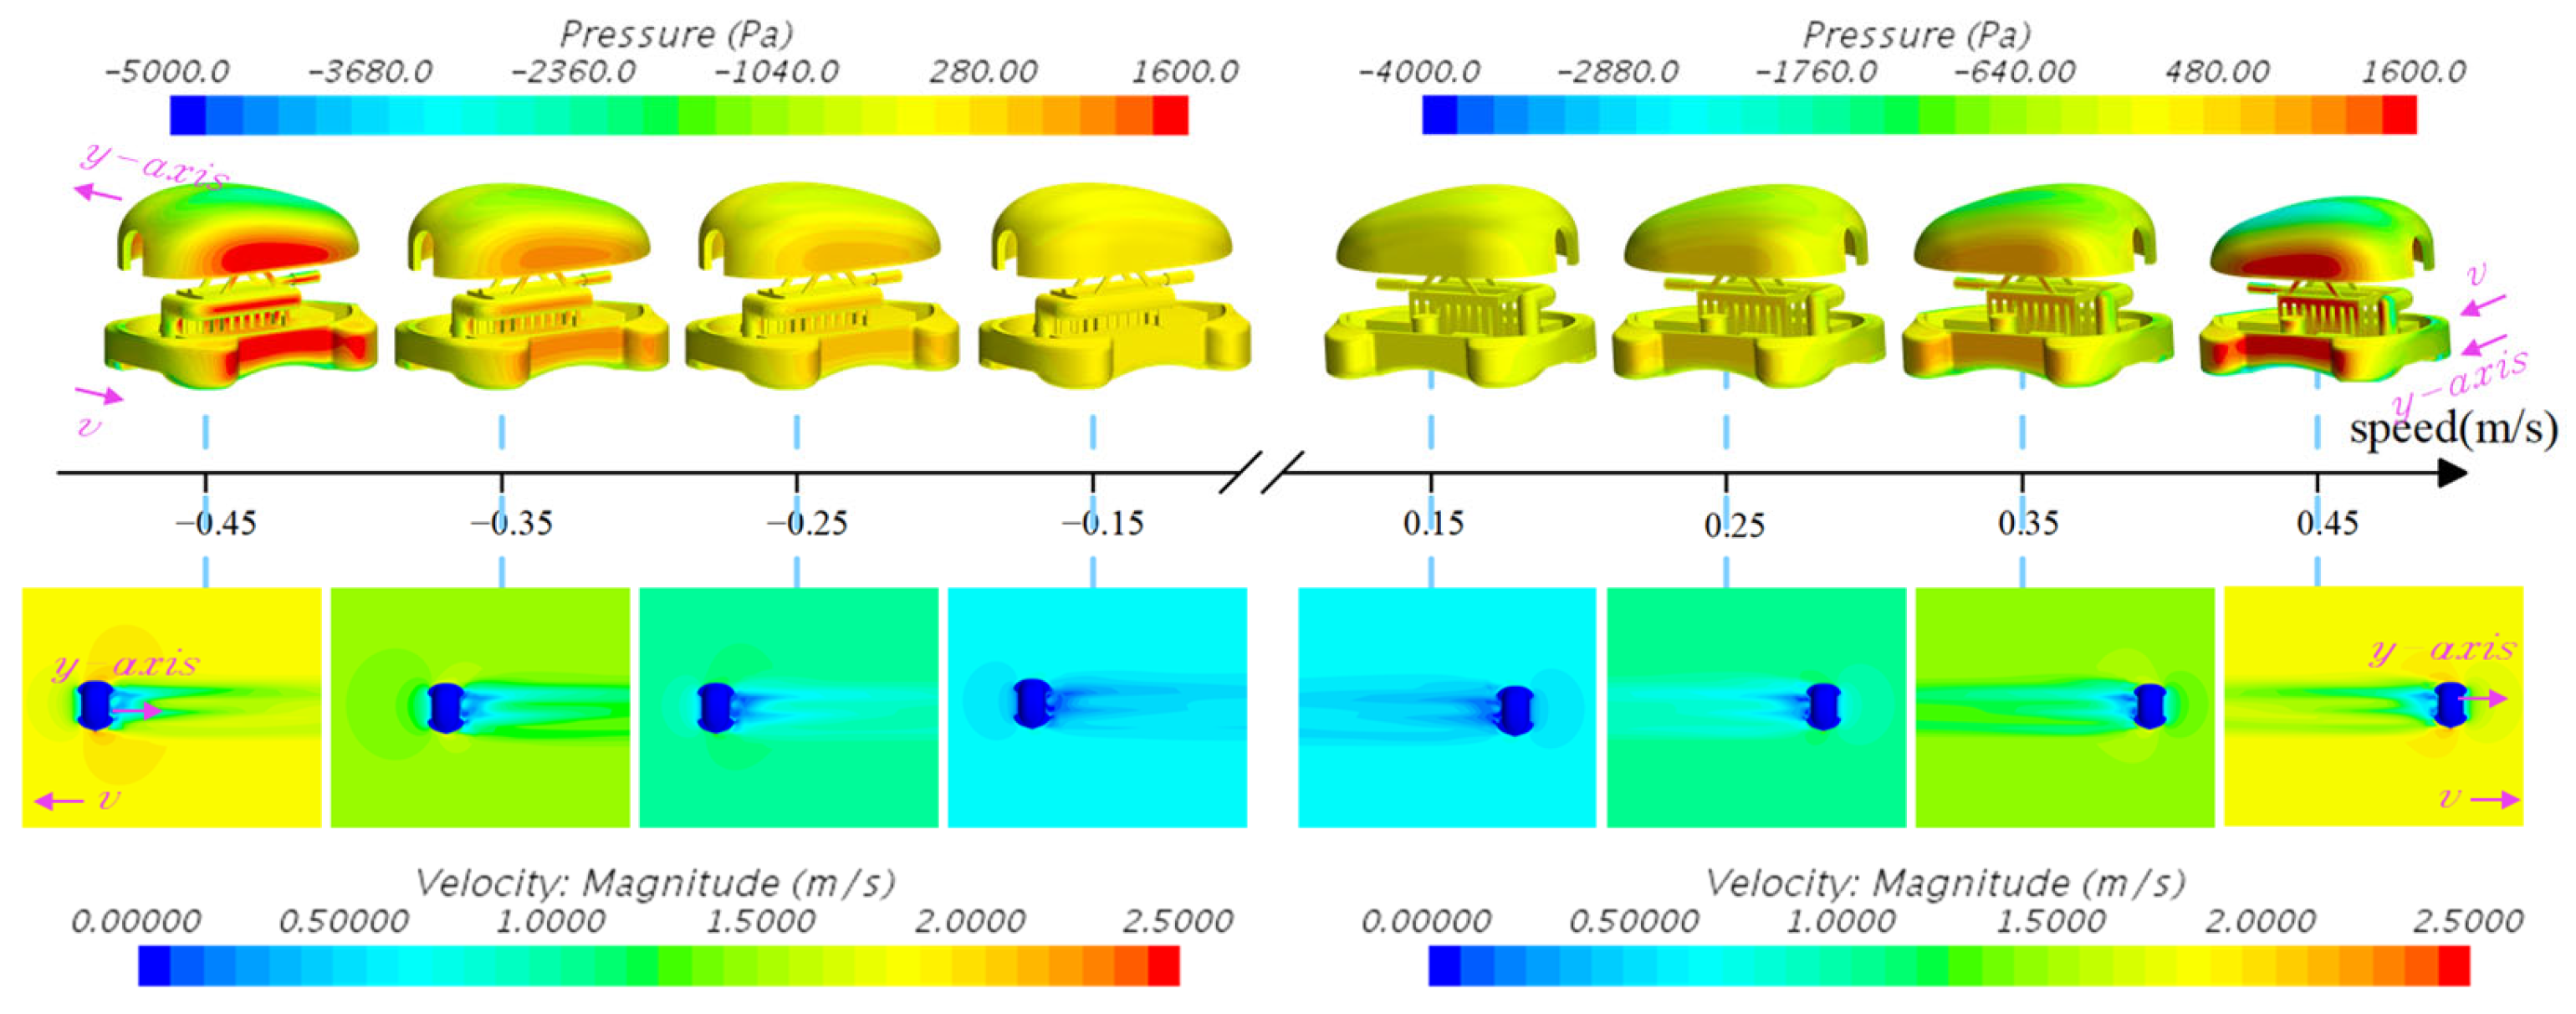
(a). As shown in Figure 11, at a deformation of d = 272 mm, the vehicle translates along the x-axis of the body-fixed coordinate system. The upper panel shows the pressure distribution on the vehicle surface, with red regions denoting high-pressure zones primarily located at the leading edges. The lower panel displays the velocity flow field, illustrating the surrounding water flow patterns.
(b). As shown in Figure 12, at a deformation of d = 272 mm, the vehicle translates along the y-axis of the body-fixed coordinate system. In this configuration, the lateral surface of the vehicle faces the incoming flow. Due to the vehicle’s geometric characteristics, the larger frontal area results in increased hydrodynamic drag at the same velocity.
(c). As shown in Figure 13, at a deformation of d = 272 mm, the vehicle performs oblique motion along the z-axis. The left panel illustrates translation at a −30° angle in the negative z-direction, while the right panel presents translation at a +30° angle in the positive z-direction.
(d). As shown in Figure 14, at a deformation of d = 0 mm, the vehicle translates forward and backward along the x-axis of the body-fixed coordinate system.
(e). As shown in Figure 15, at a deformation of d = 0 mm, the vehicle translates forward and backward along the y-axis of the body-fixed coordinate system.
(f). As shown in Figure 16, at a deformation of d = 0 mm, the left panel shows the vehicle translating at a −30° oblique angle along the z-axis, while the right panel depicts translation at +30°.
When d = 0 mm, the upper and lower sections contract to a closed configuration, yielding a more streamlined profile. Compared with the open-frame configuration at d ≠ 0 mm, the velocity field exhibits a comparatively smaller disturbance to the surrounding flow, suggesting a corresponding reduction in hydrodynamic drag. The pressure distributions and velocity flow fields obtained from the simulations are consistent with expectations. However, to validate the reliability and accuracy of the CFD method, comparative experiments in a circulating water channel are required.

4.2. Experimental Validation in the Circulating Water Channel

Grid independence ensures that mesh resolution no longer dominates numerical error, but it does not guarantee correctness; thus, comparison with experimental data or analytical solutions is required to validate the computational model.
Harbin Engineering University, an ITTC member, operates a circulating water channel equipped for resistance, propulsion, maneuvering, and open-water propeller tests, providing a platform for precise determination of hydrodynamic coefficients.
To assess the hydrodynamic model, two representative deformation states (maximum and minimum) were selected, and 1:4 scale vehicle models were fabricated according to similarity theory. In the CWC experiments, the influence of scaling effects and Reynolds number differences was considered. The flow velocity was adjusted to ensure that the Reynolds number of the scaled model remained dynamically similar to that of the full-scale vehicle, thereby minimizing the impact of scaling on the comparative results. For each configuration, six motion conditions were tested, with six independent repeats conducted at each test speed.
The experimental setup (Figure 17) consisted of a strut system with an upper fixed section and a rudder-shaped lower section to minimize turbulence induced by the strut. A 6-DOF force sensor linked the bracket and the vehicle, ensuring strict alignment between the sensor coordinate frame and the body-fixed coordinate system.

4.3. Comparison

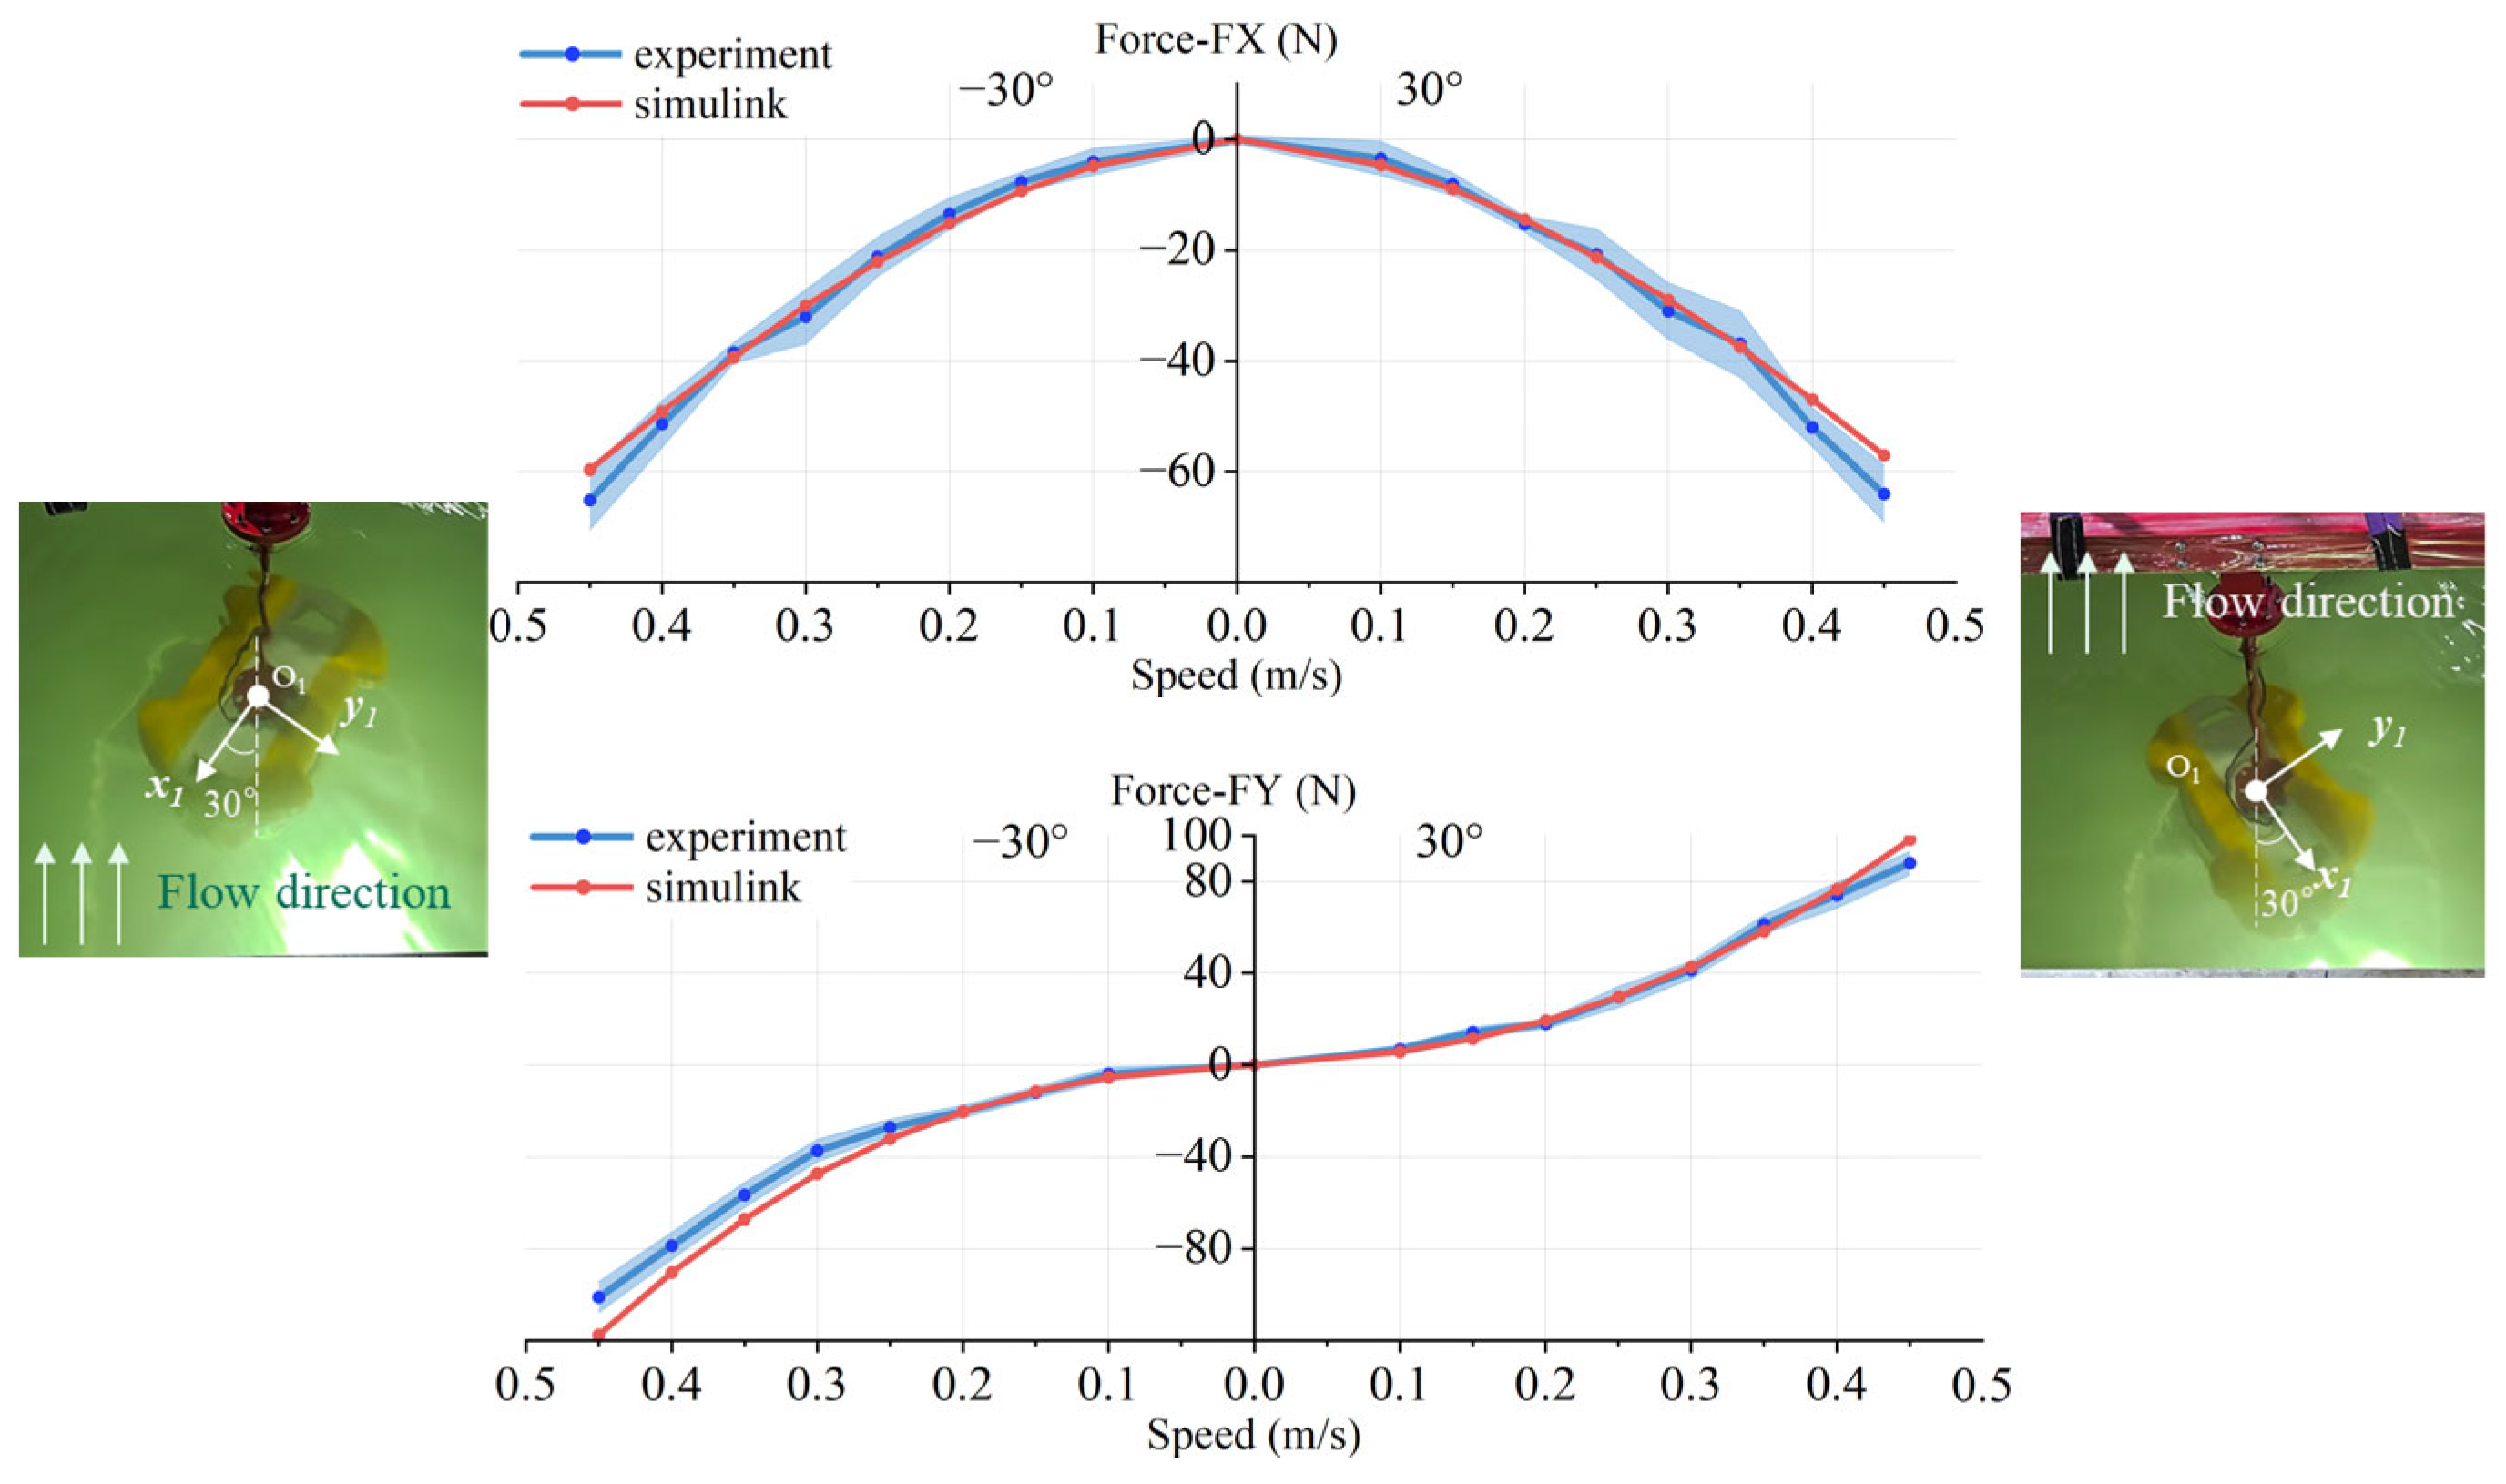
A comprehensive comparison was conducted between the CFD-based numerical results and the CWC experiments to assess simulation accuracy. In the plot, the x-axis denotes the flow velocity (corresponding to the VSUV motion speed), and the y-axis represents the hydrodynamic drag experienced by the vehicle. The red dotted curve corresponds to Simulink predictions, the blue dotted curve to the averaged experimental measurements, and the light-blue band illustrates the data dispersion represented as one standard deviation. The detailed results are as follows:
(a). Figure 18 shows the vehicle in uniform rectilinear motion along the positive and negative x-axis directions at d = 272 mm.
(b). Figure 19 shows the vehicle in uniform rectilinear motion along the positive and negative y-axis directions at d = 272 mm.
(c). Figure 20 shows the vehicle in Oblique motion of the vehicle after rotating ±30° about the z-axis, d = 272 mm.
(d). Figure 21 shows the vehicle in uniform rectilinear motion along the positive and negative x-axis directions at d = 0 mm.
(e). Figure 22 shows the vehicle in uniform rectilinear motion along the positive and negative x-axis directions at d = 0 mm.
(f). Figure 23 shows the vehicle in Oblique motion of the vehicle after rotating ±30° about the z-axis, d = 0 mm.
To validate the CFD-simplified model, experimental data are benchmarked against simulation results. The simulated values predominantly fall within the standard deviation of the experimental mean. Deviations beyond this range can be attributed to scale effects from model-prototype dimensional differences and wall-confinement effects in the test channel, both of which are unavoidable in physical experiments. As flow velocity increases from 0.1 m/s to 0.45 m/s, the simulated and experimental drag curves exhibit consistent trends. The agreement in both magnitude and trend confirms the validity and reliability of the model.
The measured forces were non-dimensionalized to drag coefficients CD:
C D   =   F 0 . 5 ρ U 2 A  
The absolute error E_abs and normalized relative error E_rel were defined as:
E _ a b s = F C F D , i F E X P , i
E _ r e l = C D , C F D , i C D , E X P , i C D , E X P , i × 100 %
These definitions were applied to evaluate the differences between CFD predictions and averaged CWC experimental measurements at each velocity condition.
The normalized mean absolute error (MAE) and mean absolute percentage error (MAPE) are defined as follows:
  M A E = 1 N i = 1 N E _ a b s i
M A P E = 1 N i = 1 N E _ r e l i
The results are summarized as follows:
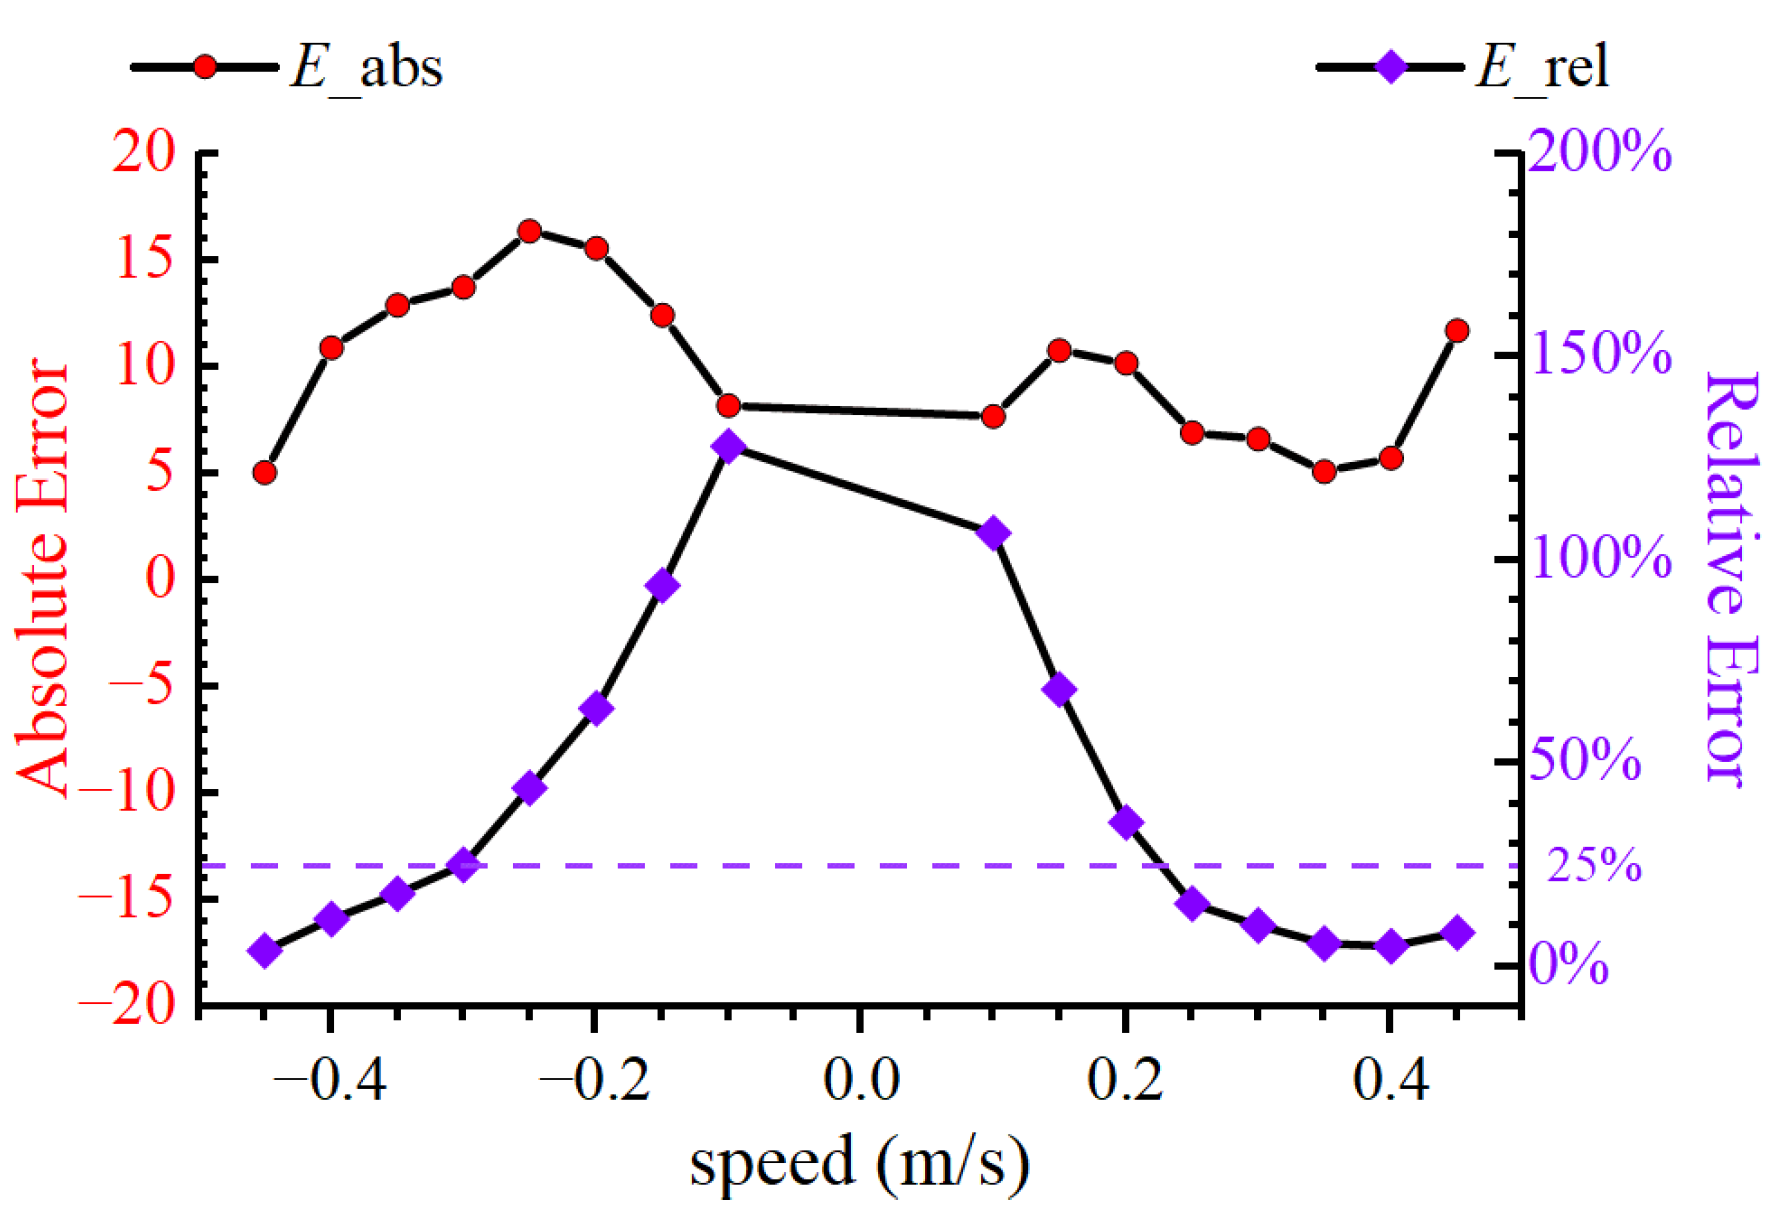
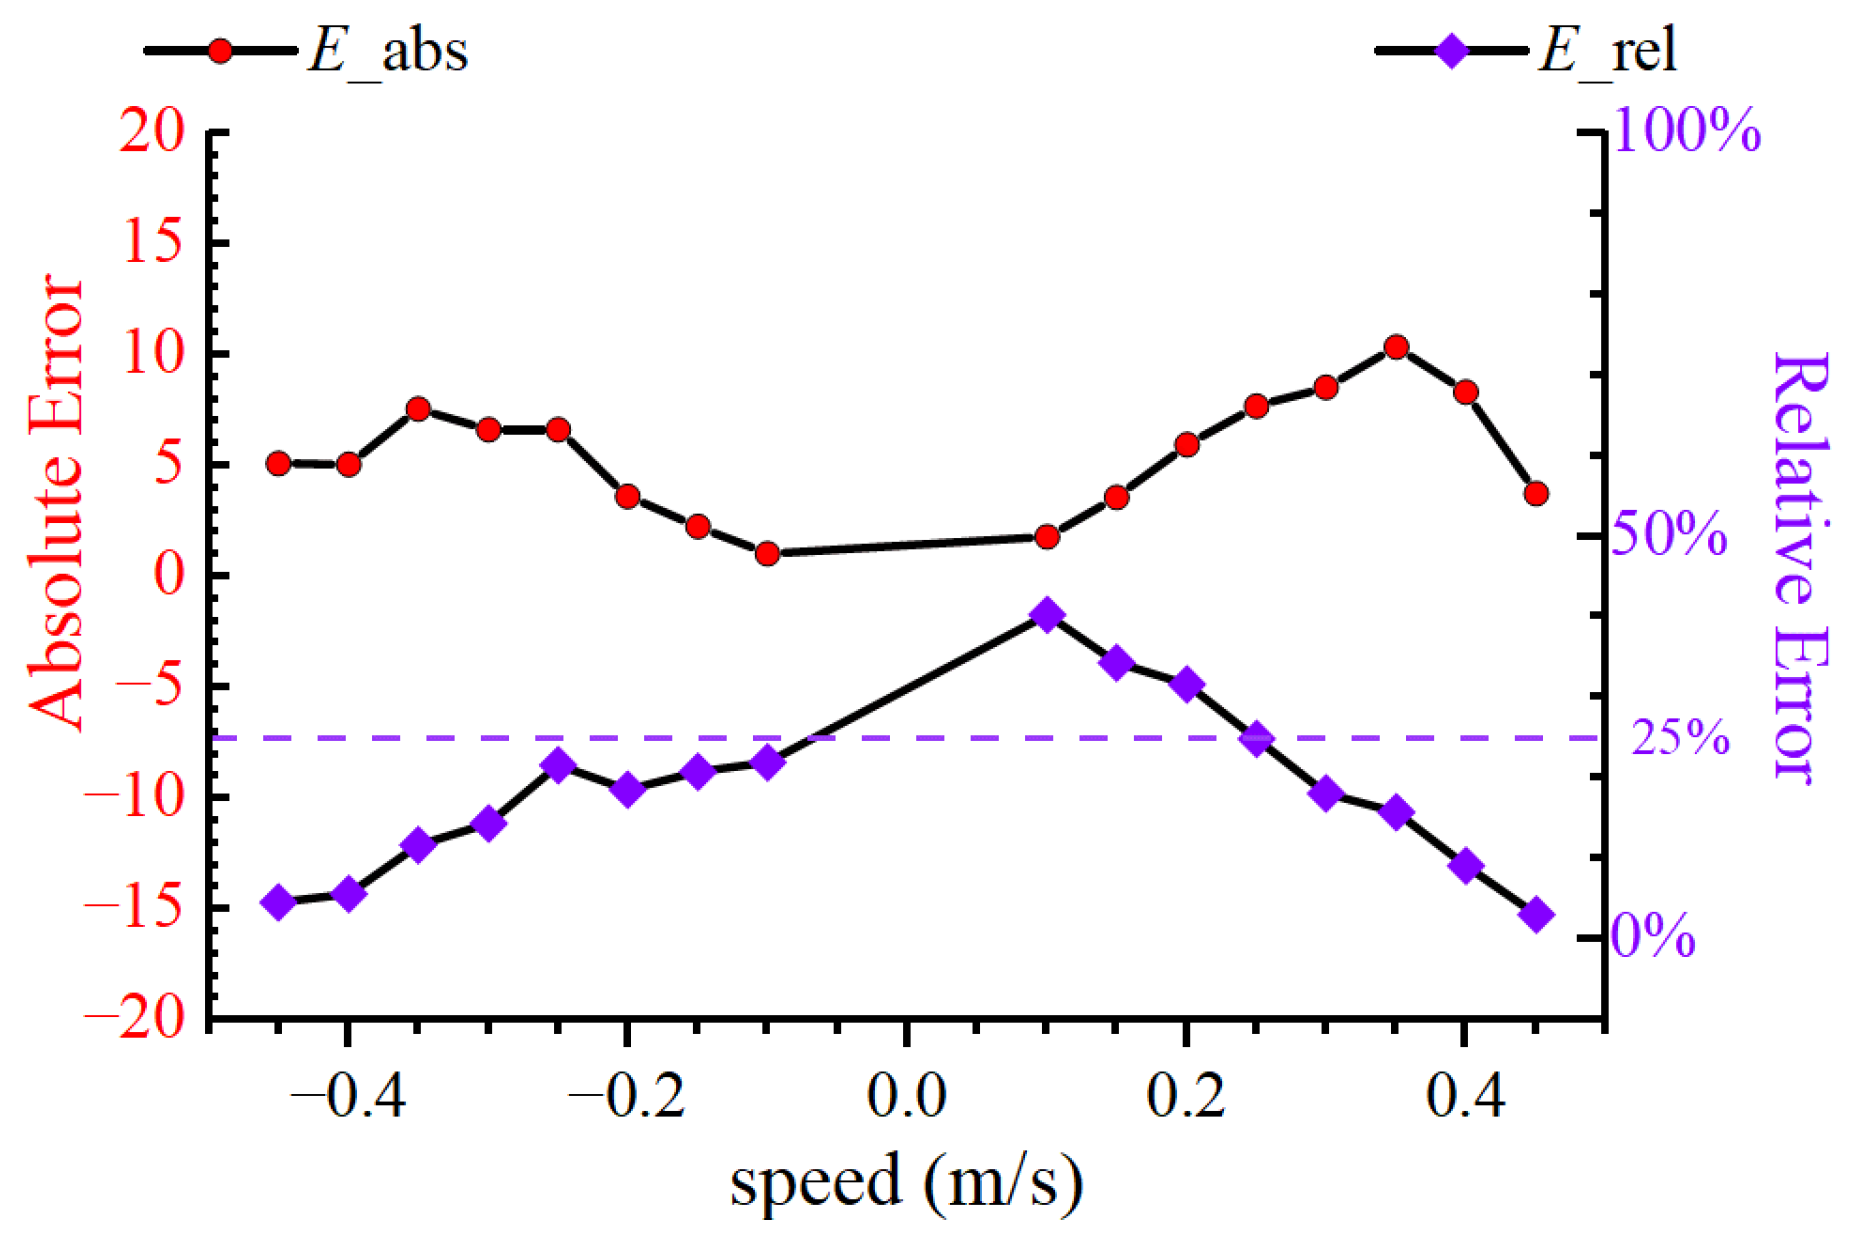
(a) At d = 272 mm, the VSUV moves steadily along the x-axis in both positive and negative directions. As shown in Figure 24, the purple dotted line shows the E_rel of the drag force FX. As the velocity decreases, the E_rel because the drag force becomes very small, which amplifies the calculated value in Equation (12); thus, the E_rel is less meaningful at low speeds. The corresponding E_abs (red dotted line) remains within the range of 5–15 N, with an MAE of 9.99 N. Considering both errors, the difference between CFD and CWC results is acceptable, indicating that the CFD predictions are reliable. When only data with E_rel below 25% are considered, the MAPE is 9.89%.
(b) At d = 272 mm, the VSUV translates along the y-axis. As shown in Figure 25, the E_abs and E_rel of the hydrodynamic force FY are presented. The MAE is 5.5 N. Similarly to the previous case, the E_rel becomes meaningless at very low velocities because the drag force is small and the normalization amplifies the relative deviation. Therefore, only data points with E_rel below 25% are considered (the same criterion applies hereinafter). Under this condition, the MAPE is 14.7%.
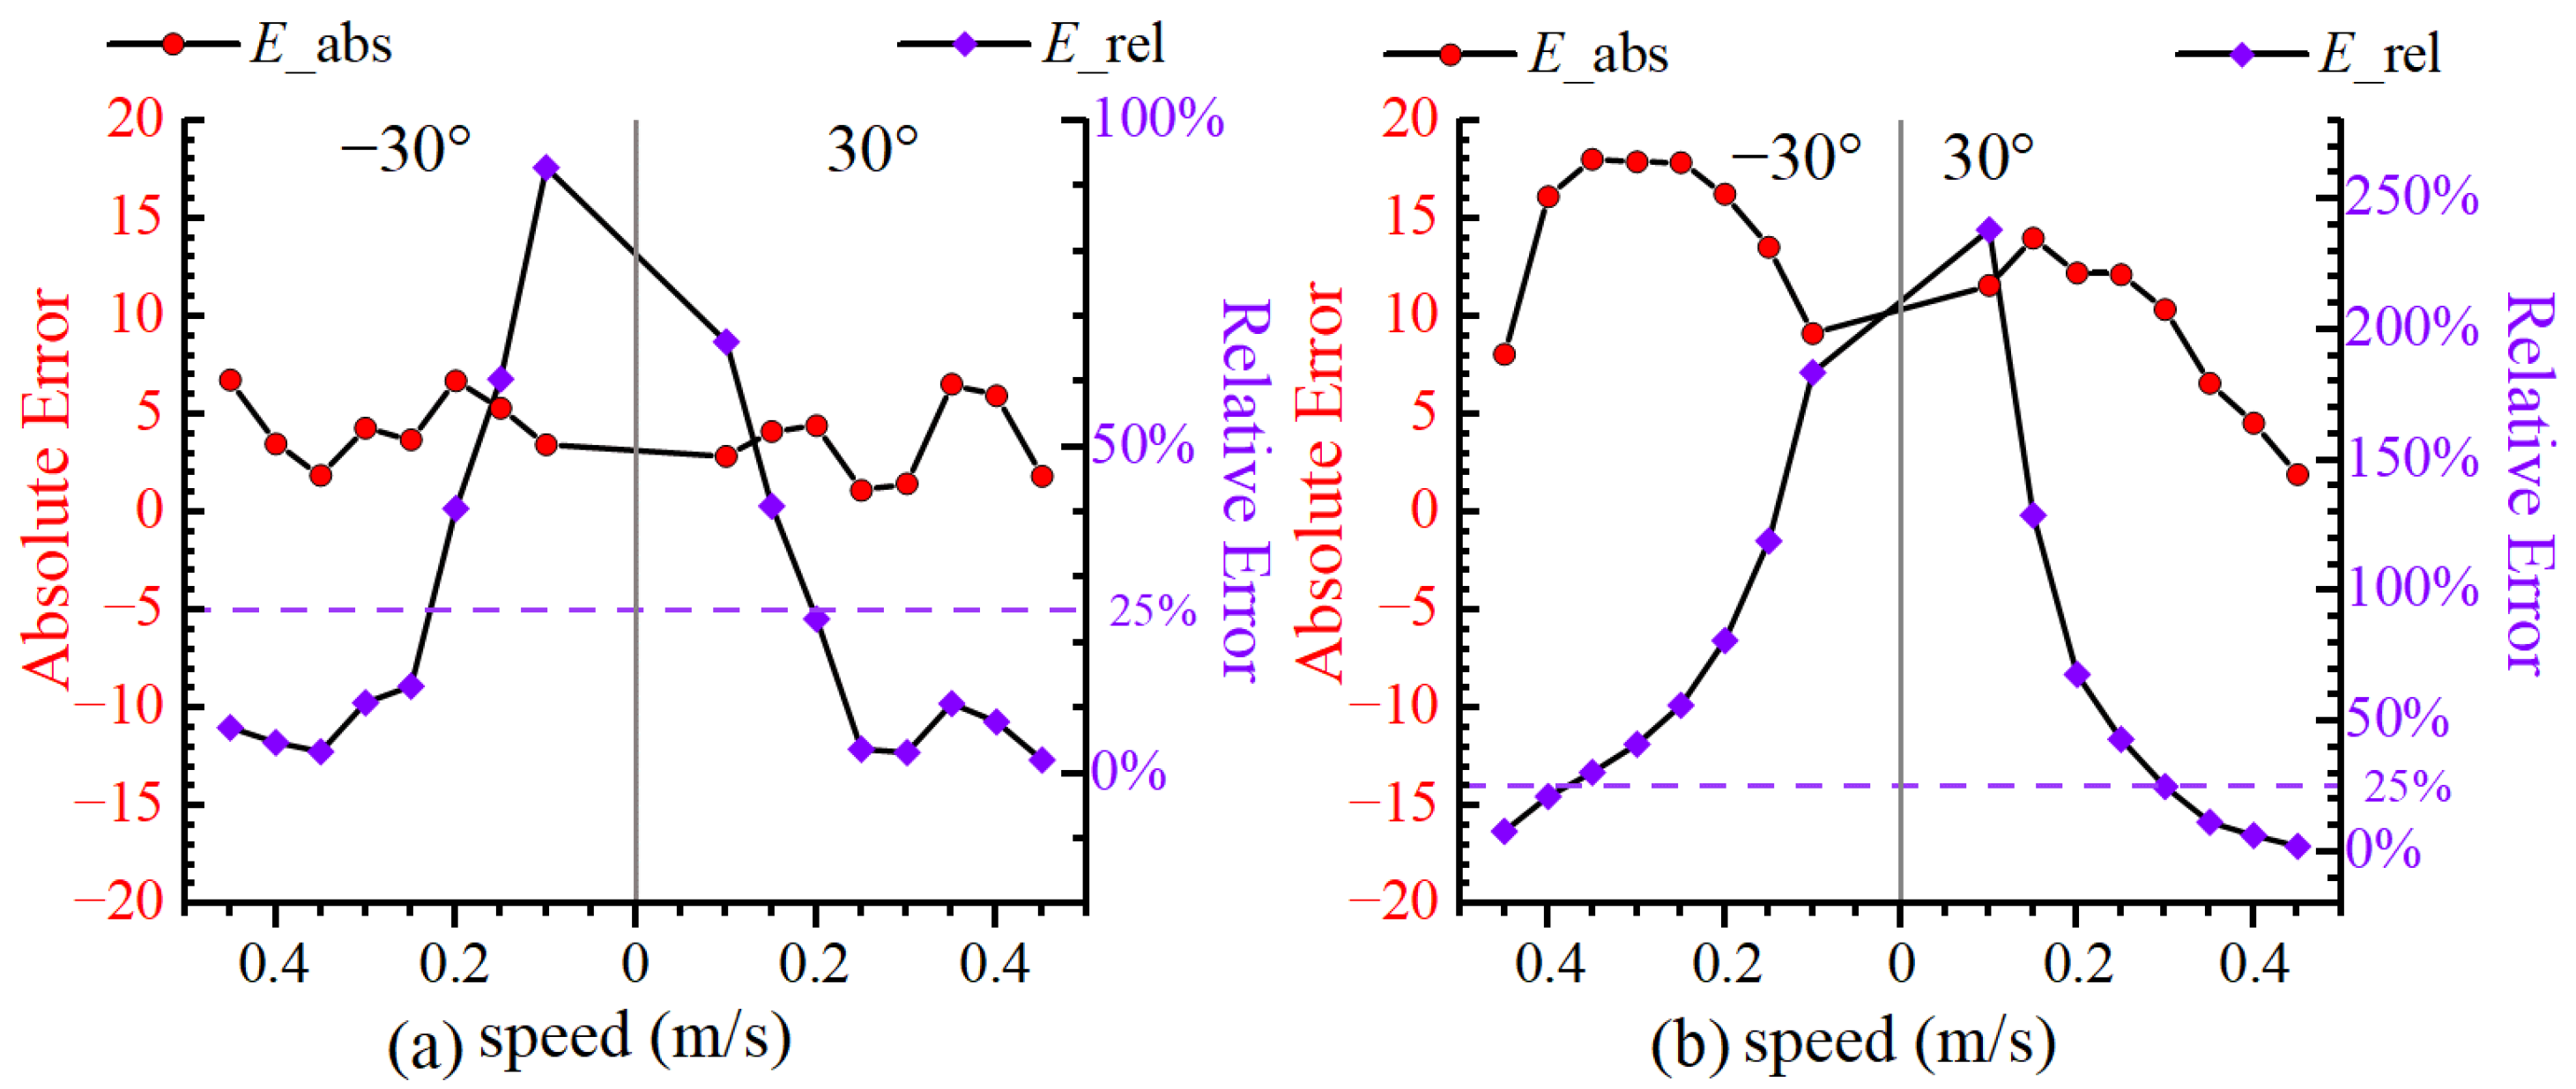
(c) At d = 272 mm, the VSUV moves obliquely at a 30° drift angle. As shown in Figure 26, the E_abs and E_rel of the hydrodynamic forces FX and FY are presented. The MAE and MAPE of FX are 3.99 N and 8.27%, respectively, while those of FY are 11.87 N and 9.85%, respectively.
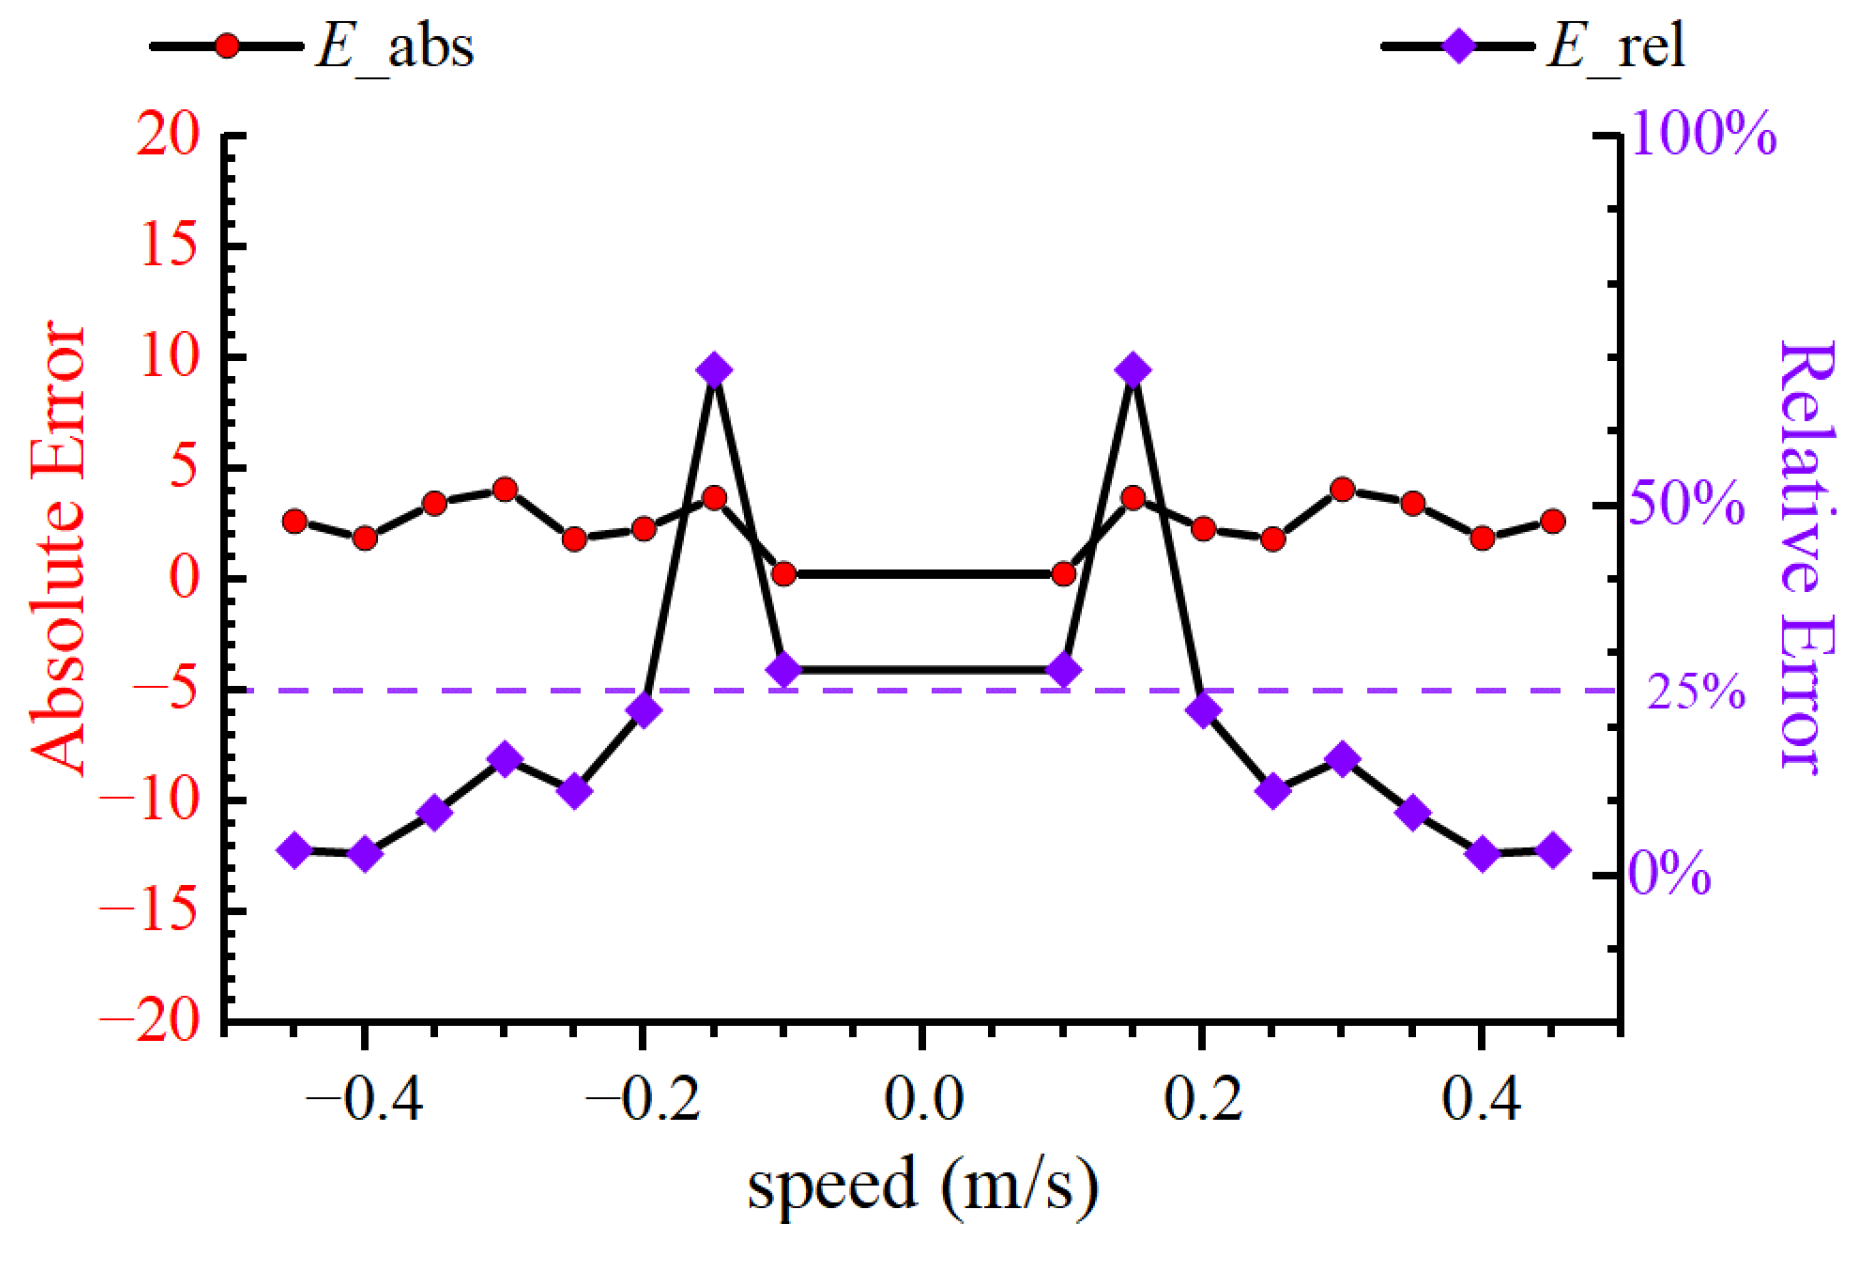
(d) At d = 0 mm, the VSUV moves steadily along the x-axis in both forward and backward directions. As shown in Figure 27, the E_abs and E_rel of the hydrodynamic drag force FX are presented. The calculated MAE and MAPE are 3.81 N and 8.17%, respectively.
(e) At d = 0 mm, the VSUV moves steadily along the x-axis in both forward and backward directions. As shown in Figure 28, the E_abs and E_rel of the hydrodynamic drag force FY are presented. The calculated MAE and MAPE are 2.52 N and 10.79%, respectively.
(f) At d = 0 mm, the VSUV moves obliquely at a 30° drift angle. As shown in Figure 29, the E_abs and E_rel of the hydrodynamic forces FX and FY are presented. The MAE and MAPE of FX are 2.11 N and 8.49%, respectively, while those of FY are 4.92 N and 11.18%, respectively.
According to the analysis of cases (a)–(f), the results indicate that the MAPE increases with larger deformation amplitudes (d). This trend can be attributed to the increasing geometric complexity of the VSUV as d grows, which induces more intricate flow separations, stronger vortex interactions, and enhanced hydrodynamic instability. Consequently, the discrepancies between CFD predictions and experimental measurements become more pronounced. In addition, both the MAE and MAPE of FY are consistently higher than those of FX, suggesting that hydrodynamic resistance can be predicted more accurately when the frontal area exposed to the incoming flow is smaller. The reduced exposed surface helps stabilize the flow field, thereby lowering the prediction uncertainty.
Overall, the MAPE values are around 10%, which is generally considered an acceptable range for comparisons between CFD simulations and physical experiments involving complex boundary conditions. Such deviations are reasonable given the inevitable uncertainties in CWC testing, including tank-wall effects, scale effects, and sensor inaccuracies.

5. Conclusions

This paper presents a detailed exposition of key parameter configuration strategies for CFD simulations of the VSUV. The study emphasizes the advantages of the overlapping grid method in accurately modeling the multi-degree-of-freedom coupled motion of the vehicle, which effectively captures complex flow features. Through grid independence verification, critical meshing parameters for the complex geometric configuration have been systematically determined, achieving an optimal balance between computational accuracy and cost while avoiding unnecessary computational resource expenditure.
Subsequently, validation experiments were conducted using a scaled-model vehicle in a recirculating water tank. Comparative analysis between experimentally measured drag force data and CFD numerical results revealed high consistency in drag variation trends. Although certain discrepancies exist in the numerical values, these deviations fall within acceptable limits when considering inherent experimental factors such as model scale effects and water tank wall constraints.
Although the present validation primarily focuses on simplified single-DOF motions, the same CFD framework and numerical settings are directly applicable to coupled multi-DOF cases. The reliability demonstrated under the verified conditions provides a solid foundation for extending the simulations to more complex motion scenarios, thereby confirming the effectiveness and robustness of the proposed overlapping-grid-based CFD strategy. This methodology offers a practical and reliable approach for the hydrodynamic modeling, performance prediction, and design optimization of underwater vehicles, demonstrating substantial potential for engineering applications. While this study mainly validates steady-state conditions, the adopted CFD framework inherently accommodates unsteady and fully coupled motions, providing the basis for future extension to transient simulations.

Author Contributions

Conceptualization, X.L. and Q.Z.; methodology, X.L.; validation, D.L. and Y.W.; resources, Q.T.; data curation, D.L.; writing—original draft preparation, X.L.; writing—review and editing, X.W.; visualization, X.L.; supervision, X.W.; project administration, Q.T.; funding acquisition, Y.W. All authors have read and agreed to the published version of the manuscript.

Funding

This research was funded by the Youth Innovation Promotion Association, Chinese Academy of Sciences (No. 2023208); the Fundamental Research Program of Shenyang Institute of Automation, Chinese Academy of Sciences (Grant No. E4290203); and the United Foundation for Dalian Institute of Chemical Physics, Chinese Academy of Sciences and Shenyang Institute of Automation, Chinese Academy of Sciences (Grant No. DICP&SIA UN202403).

Data Availability Statement

The data presented in this study are available on request from the authors.

Conflicts of Interest

The authors declare no conflicts of interest.

Appendix A

Appendix A.1

This table summarizes the boundary layer mesh configurations employed in the grid independence study. The table presents the prescribed dimensional parameters for each refinement scheme, along with the derived geometric specifications, total grid count, and the corresponding target physical quantities.
Table A1. Grid Independence Verification for the Boundary Layer.
No.y+Boundary LayerMinimum Surface Size (mm)Number of CellsForce (N)
Layer NumberFirst Cell Height (mm)Growth RateTotalBackground MeshComponent MeshMeanSD
13052.711.59min 12.50.667570.51390.15367−38.21.14
22052.711.59min 12.50.672670.5190.15367−39.291.11
36055.421.22min 81.065270.91160.15367−41.90.93
460155.421min 12.51.073070.91940.15367−38.751.13
53052.711.59min 81.078070.92440.15367−37.271.84
62051.811.82min 81.085670.9320.15367−38.21.01
730152.71.01min 12.51.087470.93380.15367−39.361.23
820151.811.06min 12.51.098670.9450.15367−39.330.43
930202.711min 12.51.265671.1120.15367−42.981.17
1060155.421min 81.788371.63470.15367−38.250.77
1130152.71.01min 81.788671.6350.15367−37.821.48
1220151.811.06min 81.826571.67290.15367−38.740.52
1330202.711min 82.145671.9920.15367−38.861.31
1420201.811.02min 82.168972.01530.15367−39.050.56

Appendix A.2

This table summarizes the flow domain mesh configurations employed in the grid independence study. The table presents the dimensional parameters of the computational grids, the corresponding total element count, and the resulting target physical quantities for each refinement scheme.
Table A2. Grid Independence Verification for the Flow Domain.
(a) Grid Independence Verification of Refinement Mesh
No.Overset Mesh.
Region ((m))
Refinement Region (m)Flow Domain (m)Mesh Number (million)Force(N)
TotalBackground MeshComponent MeshMeanSD
148401.77081.63470.1361−37.31.53
2410401.778911.63470.14421−38.060.75
3412401.788371.63470.15367−38.251.03
4416401.834241.63470.19954−37.511.04
(b) Grid Independence Verification of Component Mesh
No.Overset Mesh.
Region ((m))
Refinement Region (m)Flow Domain (m)Mesh Number (million)Force(N)
TotalBackground MeshComponent MeshMeanSD
1310401.762111.61790.14421−42.580.46
2410401.778911.63470.14421−38.0650.808
3710401.801711.65750.14421−38.550.3
41010401.839321.64450.19482−37.991.36
(c) Grid Independence Verification of Background Mesh
No.Overset Mesh.
Region ((m))
Refinement Region (m)Flow Domain (m)Mesh Number (million)Force(N)
TotalBackground MeshComponent MeshMeanSD
1710351.761891.65750.10439−37.850.915
2710401.801711.65750.14421−38.550.3
3710451.852321.65750.19482−37.351.05

References

  1. Keymasi-Khalaji, A.; Haghjoo, M. Passivity-based stabilizing controller for an underwater robot. Ocean Eng. 2024, 302, 117656. [Google Scholar] [CrossRef]
  2. Rath, B.N.; Subudhi, B. A robust model predictive path following controller for an Autonomous Underwater Vehicle. Ocean Eng. 2022, 244, 110265. [Google Scholar] [CrossRef]
  3. Lin, Y.-H.; Tseng, S.-H.; Chen, Y.-H. The experimental study on maneuvering derivatives of a submerged body SUBOFF by implementing the Planar Motion Mechanism tests. Ocean Eng. 2018, 170, 120–135. [Google Scholar] [CrossRef]
  4. De Moraes, C.C.; Faltinsen, O.M.; Esperança, P.T.T.; Sphaier, S.H.; Lugni, C. Free-surface interaction of a fully appendaged AUV: An experimental study using the Planar Motion Mechanism method for calculating hydrodynamic coefficients. Ocean Eng. 2025, 324, 120670. [Google Scholar] [CrossRef]
  5. Guo, R.; Zan, Y.; Luo, X.; Ma, X.; Xu, T.; Han, D.; Li, D.; Bai, X. Evaluation of hydrodynamic coefficients and sensitivity analysis of a work-class remotely operated vehicle using planar motion mechanism tests. Ocean Eng. 2024, 312, 119037. [Google Scholar] [CrossRef]
  6. Joonyoung, K.; Kihun, K.; Choi, H.S.; Woojae, S.; Kyu-Yeul, L. Estimation of hydrodynamic coefficients for an AUV using nonlinear observers. IEEE J. Ocean. Eng. 2002, 27, 830–840. [Google Scholar] [CrossRef]
  7. De Barros, E.A.; Pascoal, A.; de Sa, E. AUV dynamics: Modelling and parameter estimation using analytical, semi-empirical, and CFD methods. IFAC Proc. Vol. 2004, 37, 369–376. [Google Scholar] [CrossRef]
  8. Fang, M.-C.; Wang, S.-M.; Mu-Chen, W.; Lin, Y.-H. Applying the self-tuning fuzzy control with the image detection technique on the obstacle-avoidance for autonomous underwater vehicles. Ocean Eng. 2015, 93, 11–24. [Google Scholar] [CrossRef]
  9. Liu, J.; Yu, F.; He, B.; Yan, T. Hydrodynamic numerical simulation and prediction of bionic fish based on computational fluid dynamics and multilayer perceptron. Eng. Appl. Comput. Fluid Mech. 2022, 16, 858–878. [Google Scholar] [CrossRef]
  10. Li, Z.; Tao, J.; Sun, H.; Luo, Y.; Ding, L.; Deng, Z. Hydrodynamic calculation and analysis of a complex-shaped underwater robot based on computational fluid dynamics and prototype test. Adv. Mech. Eng. 2017, 9. [Google Scholar] [CrossRef]
  11. Mishra, V.; Vengadesan, S.; Bhattacharya, S. Translational Added Mass of Axisymmetric Underwater Vehicles with Forward Speed Using Computational Fluid Dynamics. J. Ship Res. 2011, 55, 185–195. [Google Scholar] [CrossRef]
  12. Javanmard, E.; Mansoorzadeh, S.; Mehr, J.A. A new CFD method for determination of translational added mass coefficients of an underwater vehicle. Ocean Eng. 2020, 215, 107857. [Google Scholar] [CrossRef]
  13. Shad, A.; Mansoorzadeh, S. Calculation of Linear Damping Coefficients by Numerical Simulation of Steady State Experiments. J. Appl. Fluid Mech. 2016, 9, 653–660. [Google Scholar] [CrossRef]
  14. Le, T.-L.; Hong, D.-T. Computational Fluid Dynamics Study of the Hydrodynamic Characteristics of a Torpedo-Shaped Underwater Glider. Fluids 2021, 6, 252. [Google Scholar] [CrossRef]
  15. Guo, R.; Zan, Y.; Han, D.; Li, Z.; Huang, F.; Sun, Y.; Sun, N. Flow memory effect on viscous hydrodynamic loads of a remotely operated vehicle undergoing drift motions. Appl. Ocean Res. 2025, 155, 104461. [Google Scholar] [CrossRef]
  16. Ardeshiri, S.; Hossein Mousavizadegan, S. An efficient method to calculate the maneuvering coefficient of underwater vehicles. Ocean Eng. 2022, 266, 113168. [Google Scholar] [CrossRef]
  17. Tariq, M.A.; Mahmood, Z.M.; Qureshi, M.A.; Khan, N.; Javaid, M.J.; Hussain, B. CFD-based study of appendages design for dynamic stability of underwater vehicle. J. Mar. Sci. Technol. 2025, 30, 658–676. [Google Scholar] [CrossRef]
  18. Kang, S.; Yu, J.; Zhang, J.; Hu, F.; Jin, Q. Research on accurate modeling of hydrodynamic interaction forces on AUVs operating in tandem. Ocean Eng. 2022, 251, 111125. [Google Scholar] [CrossRef]
  19. Li, X.; Zhang, D.; Zhao, M.; Wang, X.; Shen, Y. Hydrodynamic Analysis and Drag-Reduction Design of an Unmanned Underwater Vehicle Based on Computational Fluid Dynamics. J. Mar. Sci. Eng. 2024, 12, 1388. [Google Scholar] [CrossRef]
  20. Zhou, H.; Wei, Z.; Hu, W. Hydrodynamic performance and maneuverability design for a compound eVTOL configuration based unmanned aerial underwater vehicle. Ocean Eng. 2025, 319, 120210. [Google Scholar] [CrossRef]
  21. Xu, S.; Wu, J.; Lv, H.; Ma, C.; Yang, X.; Wang, H.; Dou, Y. Numerical simulation and hydrodynamics analysis of a tethered underwater robot with control equipment. J. Mar. Sci. Technol. 2022, 27, 368–382. [Google Scholar] [CrossRef]
  22. Li, X.; Zhao, M.; Zhao, F.; Yuan, Q.; Ge, T. Study on hydrodynamic performance of Heavier-than-water AUV with overlapping grid method. Ocean Syst. Eng. 2014, 4, 1–19. [Google Scholar] [CrossRef]
  23. Tian, Q.; Li, S.; Yang, L.; Shao, S.; Zhang, B.; Gao, Y.; Shuai, M. Robots in Torch Relay at the Beijing 2022 Olympic and Paralympic Winter Games. Robot 2022, 44, 513–521. [Google Scholar] [CrossRef]
  24. Wang, Y.; Tian, Q.; Lu, Y.; Li, S.; Li, Z.; Zhang, Q.; Liu, X. The New Robots for Underwater Torch Relay at the Beijing 2022 Winter Olympic Games. Robot 2022, 44, 538–545. [Google Scholar] [CrossRef]
  25. ITTC. Uncertainty Analysis in CFD: Verification and Validation—Methodology and Procedures. In ITTC—Quality Manual, Procedure 7.5-03-01-01, Rev. 01; ITTC: Zürich, Switzerland, 2002. [Google Scholar]
  26. Chandar, D.; Boppana, B.; Kumar, V. A Comparative Study of Different Overset Grid Solvers Between OpenFOAM, StarCCM+ and Ansys-Fluent. In Proceedings of the 2018 AIAA Aerospace Sciences Meeting, Kissimmee, FL, USA, 8–12 January 2018. [Google Scholar]
  27. Wu, J.; Xu, S.; Liao, H.; Ma, C.; Yang, X.; Wang, H.; Zhang, T.; Han, X. Maneuverability and Hydrodynamics of a Tethered Underwater Robot Based on Mixing Grid Technique. J. Mar. Sci. Eng. 2021, 9, 561. [Google Scholar] [CrossRef]
  28. Wikipedia. Geometric Series. Wikimedia Foundation, Inc., San Francisco, CA, USA. 2021. Available online: https://en.wikipedia.org/wiki/Geometric_series (accessed on 18 October 2025).
  29. Klein, R.I. Star formation with 3-D adaptive mesh refinement: The collapse and fragmentation of molecular clouds. J. Comput. Appl. Math. 1999, 109, 123–152. [Google Scholar] [CrossRef]
  30. Almohammadi, K.M.; Ingham, D.B.; Ma, L.; Pourkashan, M. Computational fluid dynamics (CFD) mesh independency techniques for a straight blade vertical axis wind turbine. Energy 2013, 58, 483–493. [Google Scholar] [CrossRef]
Figure 1. Dimensions of the Variable-Structure Underwater Vehicle (VSUV)VSUV.
Jmse 13 02175 g001
Figure 2. Internal Structure Diagram of the VSUV: (a) Scissor Mechanism, (b) Equipment Configuration.
Jmse 13 02175 g002
Figure 3. Position variations in COG and COB during scissor mechanism deployment.
Jmse 13 02175 g003
Figure 4. Relationship between vehicle height, metacentric height, and deformation parameter.
Jmse 13 02175 g004
Figure 5. Overset mesh Diagram (a) Initial State (b) Motion State: Includes Background mesh, Component mesh, and Overset interface.
Jmse 13 02175 g005
Figure 6. Schematic of the velocity boundary layer.
Jmse 13 02175 g006
Figure 7. A sketch of developed turbulent boundary layer in dimensionless coordinates u + and y + .
Jmse 13 02175 g007
Figure 8. Grid Independence Verification of Boundary Layer Mesh.
Jmse 13 02175 g008
Figure 9. Schematic diagram of the flow field.
Jmse 13 02175 g009
Figure 10. Grid Independence Verification of Computational Domain: (a) Refinement Mesh, (b) Component Mesh, (c) Background Mesh.
Jmse 13 02175 g010
Figure 11. Pressure distribution and flow velocity field around the vehicle during x-axis translation in the carrier coordinate system (d = 272 mm).
Jmse 13 02175 g011
Figure 12. Pressure distribution and flow velocity field around the vehicle during y-axis translation in the carrier coordinate system (d = 272 mm).
Jmse 13 02175 g012
Figure 13. Pressure and velocity distributions for the vehicle translating at ±30° relative to the z-axis (d = 272 mm).
Jmse 13 02175 g013
Figure 14. Pressure distribution and flow velocity field around the vehicle during x-axis translation in the carrier coordinate system (d = 0 mm).
Jmse 13 02175 g014
Figure 15. Pressure distribution and flow velocity field around the vehicle during y-axis translation in the carrier coordinate system (d = 0 mm).
Jmse 13 02175 g015
Figure 16. Pressure and velocity distributions for the vehicle translating at ±30° relative to the z-axis (d = 0 mm).
Jmse 13 02175 g016
Figure 17. CWC Experiment System. (a) Experimental Setup. Includes the configuration of the vehicle and force sensors in the experiment (b) Data acquisition system for force sensors. (c) CWC water flow speed measurement and control system.
Jmse 13 02175 g017
Figure 18. Hydrodynamic drag FX acting on the VSUV during motion along the x-axis (d = 272 mm).
Jmse 13 02175 g018
Figure 19. Hydrodynamic drag FY acting on the VSUV during motion along the y-axis (d = 272 mm).
Jmse 13 02175 g019
Figure 20. Hydrodynamic drag components FX and FY acting on the VSUV during oblique motion (d = 272 mm).
Jmse 13 02175 g020
Figure 21. Hydrodynamic drag FX acting on the VSUV during motion along the x-axis (d = 0 mm).
Jmse 13 02175 g021
Figure 22. Hydrodynamic drag FY acting on the VSUV during motion along the y-axis (d = 0 mm).
Jmse 13 02175 g022
Figure 23. Hydrodynamic drag components FX and FY acting on the VSUV during oblique motion (d = 0 mm).
Jmse 13 02175 g023
Figure 24. The E_abs and E_rel of the hydrodynamic drag FX at d = 272 mm.
Jmse 13 02175 g024
Figure 25. The E_abs and E_rel of the hydrodynamic drag FY at d = 272 mm.
Jmse 13 02175 g025
Figure 26. The E_abs and E_rel of the hydrodynamic forces when the VSUV moves at a 30° drift angle (d = 272 mm): (a) force FX; (b) force FY.
Jmse 13 02175 g026
Figure 27. The E_abs and E_rel of the hydrodynamic drag FX at d = 0 mm.
Jmse 13 02175 g027
Figure 28. The E_abs and E_rel of the hydrodynamic drag FY at d = 0 mm.
Jmse 13 02175 g028
Figure 29. The E_abs and E_rel of the hydrodynamic forces when the VSUV moves at a 30° drift angle (d = 0 mm): (a) force FX; (b) force FY.
Jmse 13 02175 g029
Disclaimer/Publisher’s Note: The statements, opinions and data contained in all publications are solely those of the individual author(s) and contributor(s) and not of MDPI and/or the editor(s). MDPI and/or the editor(s) disclaim responsibility for any injury to people or property resulting from any ideas, methods, instructions or products referred to in the content.