Article

Performance Improvement of a Multiple Linear Regression-Based Storm Surge Height Prediction Model Using Data Resampling Techniques

1
Division of Civil and Environmental Engineering, College of Engineering, Konkuk University, 120 Neungdong-ro, Gwangjin-gu, Seoul 05029, Republic of Korea
2
Asia Infrastructure Research Center, Konkuk University, 120 Neungdong-ro, Gwangjin-gu, Seoul 05029, Republic of Korea
*
Author to whom correspondence should be addressed.
J. Mar. Sci. Eng. 2025, 13(11), 2173; https://doi.org/10.3390/jmse13112173
Submission received: 19 September 2025 / Revised: 30 October 2025 / Accepted: 14 November 2025 / Published: 17 November 2025
(This article belongs to the Section Marine Environmental Science)

Abstract

Storm surges present a major hazard to coastal areas worldwide, a risk that is further amplified by ongoing sea-level rise associated with climate warming. The purpose of this study is to enhance the prediction performance of a storm surge height model by incorporating data resampling techniques into a multiple linear regression framework. Typhoon-related predictors, such as location and intensity-related parameters, were used to estimate observed storm surge heights at eleven tide gauge stations in southeastern Korea. To address the data imbalance inherent in storm surge height distributions, we applied combinations of over- and under-sampling methods across various threshold levels and evaluated them using four statistical metrics: root mean square error (RMSE), mean absolute error (MAE), mean squared error (MSE), and the coefficient of determination (R2). The results demonstrate that both threshold selection and sampling configuration significantly influence model accuracy. In particular, station-specific sampling strategies improved R2 values by up to 0.46, even without modifying the regression model itself, underscoring the effectiveness of data-level balancing. These findings highlight that adaptive resampling strategies—tailored to local surge characteristics and data distribution—can serve as a powerful tool for improving regression-based coastal hazard prediction models.

1. Introduction

From a coastal engineering perspective, sea level refers to the height of the sea surface relative to a defined vertical datum (e.g., mean sea level or local tidal datum) [1]. An increase in sea level can cause coastal inundation hazards in nearshore areas [2]. Sea level can be classified into components such as astronomical tide, meteorological tide (commonly referred to as storm surge), mean sea level, and other residual factors [1,3,4,5,6]. Among these components, the astronomical tide and mean sea level can be calculated with high accuracy, while other residual factors only have a minor influence on the overall sea level height. In contrast, storm surge exhibits large variability, can significantly elevate the sea surface, and remains difficult to predict. Because the predictive performance of storm surge strongly affects the overall accuracy of sea-level prediction, developing a highly reliable storm surge prediction model is essential for mitigating coastal inundation hazards.
Storm surge refers to an abnormal increase in sea level primarily caused by meteorological conditions, particularly strong winds and low atmospheric pressure [1]. It is often associated with tropical cyclones, as these systems simultaneously produce intense winds and significant pressure drops [7,8,9]. Globally, coastal inundation caused by storm surges associated with typhoons has resulted in severe damage to coastal regions. In particular, the Korean coastline is highly vulnerable to storm surges generated by typhoons, which have repeatedly caused severe loss of life and property. Major events since 2000 clearly illustrate the magnitude of this threat. For instance, Typhoon Rusa (2002; year of occurrence) produced up to 1.5 m of surge along the southern coast, resulting in over 200 fatalities and approximately KRW 5 trillion in damages [10]. Typhoon Maemi (2003) generated surges of about 2 m in Masan and Busan, inundating urban areas and crippling port facilities, with more than 130 deaths of missing persons reported [11]. Typhoon Bolaven (2012) caused surges of about 1.5 m along the west coast, accompanied by widespread blackouts and structural damage [12]. Typhoon Chaba (2016) led to severe urban flooding in Ulsan and Busan as storm surges coincided with river backflow [13,14]. Most recently, Typhoon Hinnamnor (2022) triggered record-breaking storm surges in Pohang, flooding thousands of buildings and inflicting economic losses on the order of several trillion KRW [15]. These recurring surge-related disasters along the entire Korean coastline demonstrate the high vulnerability of coastal regions. Therefore, it is necessary to develop a storm surge prediction model that accounts for typhoon characteristics.
Traditionally, numerical models have been used for the precise prediction of storm surge heights (hereafter, SSHs). However, recent studies [16,17,18,19,20,21] have consistently demonstrated that data-driven statistical models utilizing regression techniques are more suitable and effective for storm surge forecasting. Tadesse et al. (2020) [16] clearly showed the superior predictive performance of regression models on a global scale. Through extensive validation using 882 tide gauge stations worldwide, their regression model achieved excellent performance in mid-latitude regions, with a correlation coefficient of 0.79 and an RMSE of 75 cm. This result highlights the intrinsic strength of regression techniques in accurately predicting continuous surge heights. Even more noteworthy is their predictive capability for extreme events. In the same study, the data-driven regression model achieved correlation coefficients of 0.51 in mid-latitudes and 0.29 in tropical regions for extreme storm surge events exceeding the 95th percentile, substantially outperforming the existing Global Tide and Surge Reanalysis (GTSR) numerical model, which yielded 0.44 and 0.20, respectively. In a study conducted in Queensland, Australia, Matters (2019) [22] demonstrated that the random forest regression model achieved a correlation coefficient of 0.991 and was successfully implemented in an operational forecasting system with a 72 h prediction capability. Similarly, Tian et al. (2024) [17] highlighted that machine learning regression models offer considerable advantages over traditional numerical models in terms of flexibility, accuracy, and computational efficiency, while high-resolution numerical models require substantial computational resources and long simulation times. Regression models enable rapid predictions after a single training phase, as evidenced by their successful applications in operational systems. Moreover, Tian et al. (2024) [17] noted that these models can capture nonlinear interactions between typhoon characteristics and storm surge magnitudes, thereby overcoming oversimplifications of traditional linear methods. Furthermore, regression techniques should not be regarded as mere “black-box” models. Prior studies [16,17] demonstrated that regression approaches can provide predictor importance with physical interpretability. For example, sea-level pressure was identified as the most influential predictor at 65% of the stations, followed by meridional wind speed (12%) and sea surface temperature (10%), findings consistent with physical reasoning. Lastly, regression-based models demonstrated their applicability across a wide range of spatial scales, from regional to global. For instance, Ayyad et al. (2022) [18] focused on the New York metropolitan area, Sadler et al. (2018) [19] on Norfolk, Virginia, and Sun and Pan (2023) [20] on the coastal region of Hong Kong—all supporting the versatility of regression-based approaches for storm surge prediction.
Building on these advancements, Yang and Lee (2025) [21] developed a multiple linear regression (MLR)-based predictive model focusing on the southeastern coastline of Korea, employing typhoon characteristics such as location and intensity as predictors, and observed SSHs as the predictand. They enhanced model performance through threshold-based data classification according to both the distance between typhoon centers and observation sites and the magnitude of surge height, demonstrating substantial predictive skill for extreme events at Masan (SSH > 0.2 m, R2 = 0.82) and Gwangyang (within 500 km distance, R2 = 0.57). However, they also reported limitations in regional predictive performance, suggesting the need for future studies to explore different model-fitting approaches and data processing methods (e.g., data sampling techniques).
To improve the performance of a statistical model or to expand its applicability, three main approaches can be considered. The first approach involves modifying the input variables, which includes adding new predictors that may influence the dependent variable, assigning weights to input variables according to their relative importance on the dependent variable, or removing variables with low explanatory power. The second approach focuses on modifying the data, such as changing the data sources of the input or dependent variables or applying data preprocessing techniques, including data sampling methods. The third approach involves changing the model structure, which refers to adopting different statistical techniques for model development, such as linear regression, nonlinear regression, or deep learning-based methods. Each of these approaches has its own advantages and limitations. Since linear regression is the simplest modeling approach and also serves as the fundamental building block of deep learning models, this study focused not on improving model performance through advanced modeling techniques but rather on evaluating the potential for performance enhancement through data preprocessing, particularly the application of data sampling techniques.
Building upon our previous work (Yang and Lee (2025) [21]), the present study addresses a critical yet underexplored issue in data-driven hydrological modeling—specifically, the influence of data sampling strategies on model performance. In particular, we investigate how different combinations of over-sampling and under-sampling techniques affect the predictive accuracy of MLR-based SSH prediction models. The overall methodology of this study is depicted in Figure 1. We first identify an appropriate SSH threshold by evaluating regression accuracy under varying threshold values, and then, we assess the performance of nine sampling combinations under the selected condition. These eight sampling techniques are classified into three over-sampling methods—(1) RandomOverSampler (ROS), (2) SMOTE (Synthetic Minority Over-sampling Technique), and (3) BorderlineSMOTE (Border)—and five under-sampling methods—(1) RandomUnderSampler (RUS), (2) NearMiss, (3) TomekLinks (Tomek), (4) EditedNearestNeighbours (ENN), and (5) ClusterCentroids (Centroids). This study highlights the central role of data-level balancing in advancing regression-based approaches for coastal hazard prediction.

2. Data and Methodology

The research area, data, and MLP approach employed in this study are identical to those described by Yang and Lee (2025) [21] so that the effect of data sampling on model performance can be properly evaluated. As detailed explanations are provided in that study, only a brief description is presented here.

2.1. Research Area

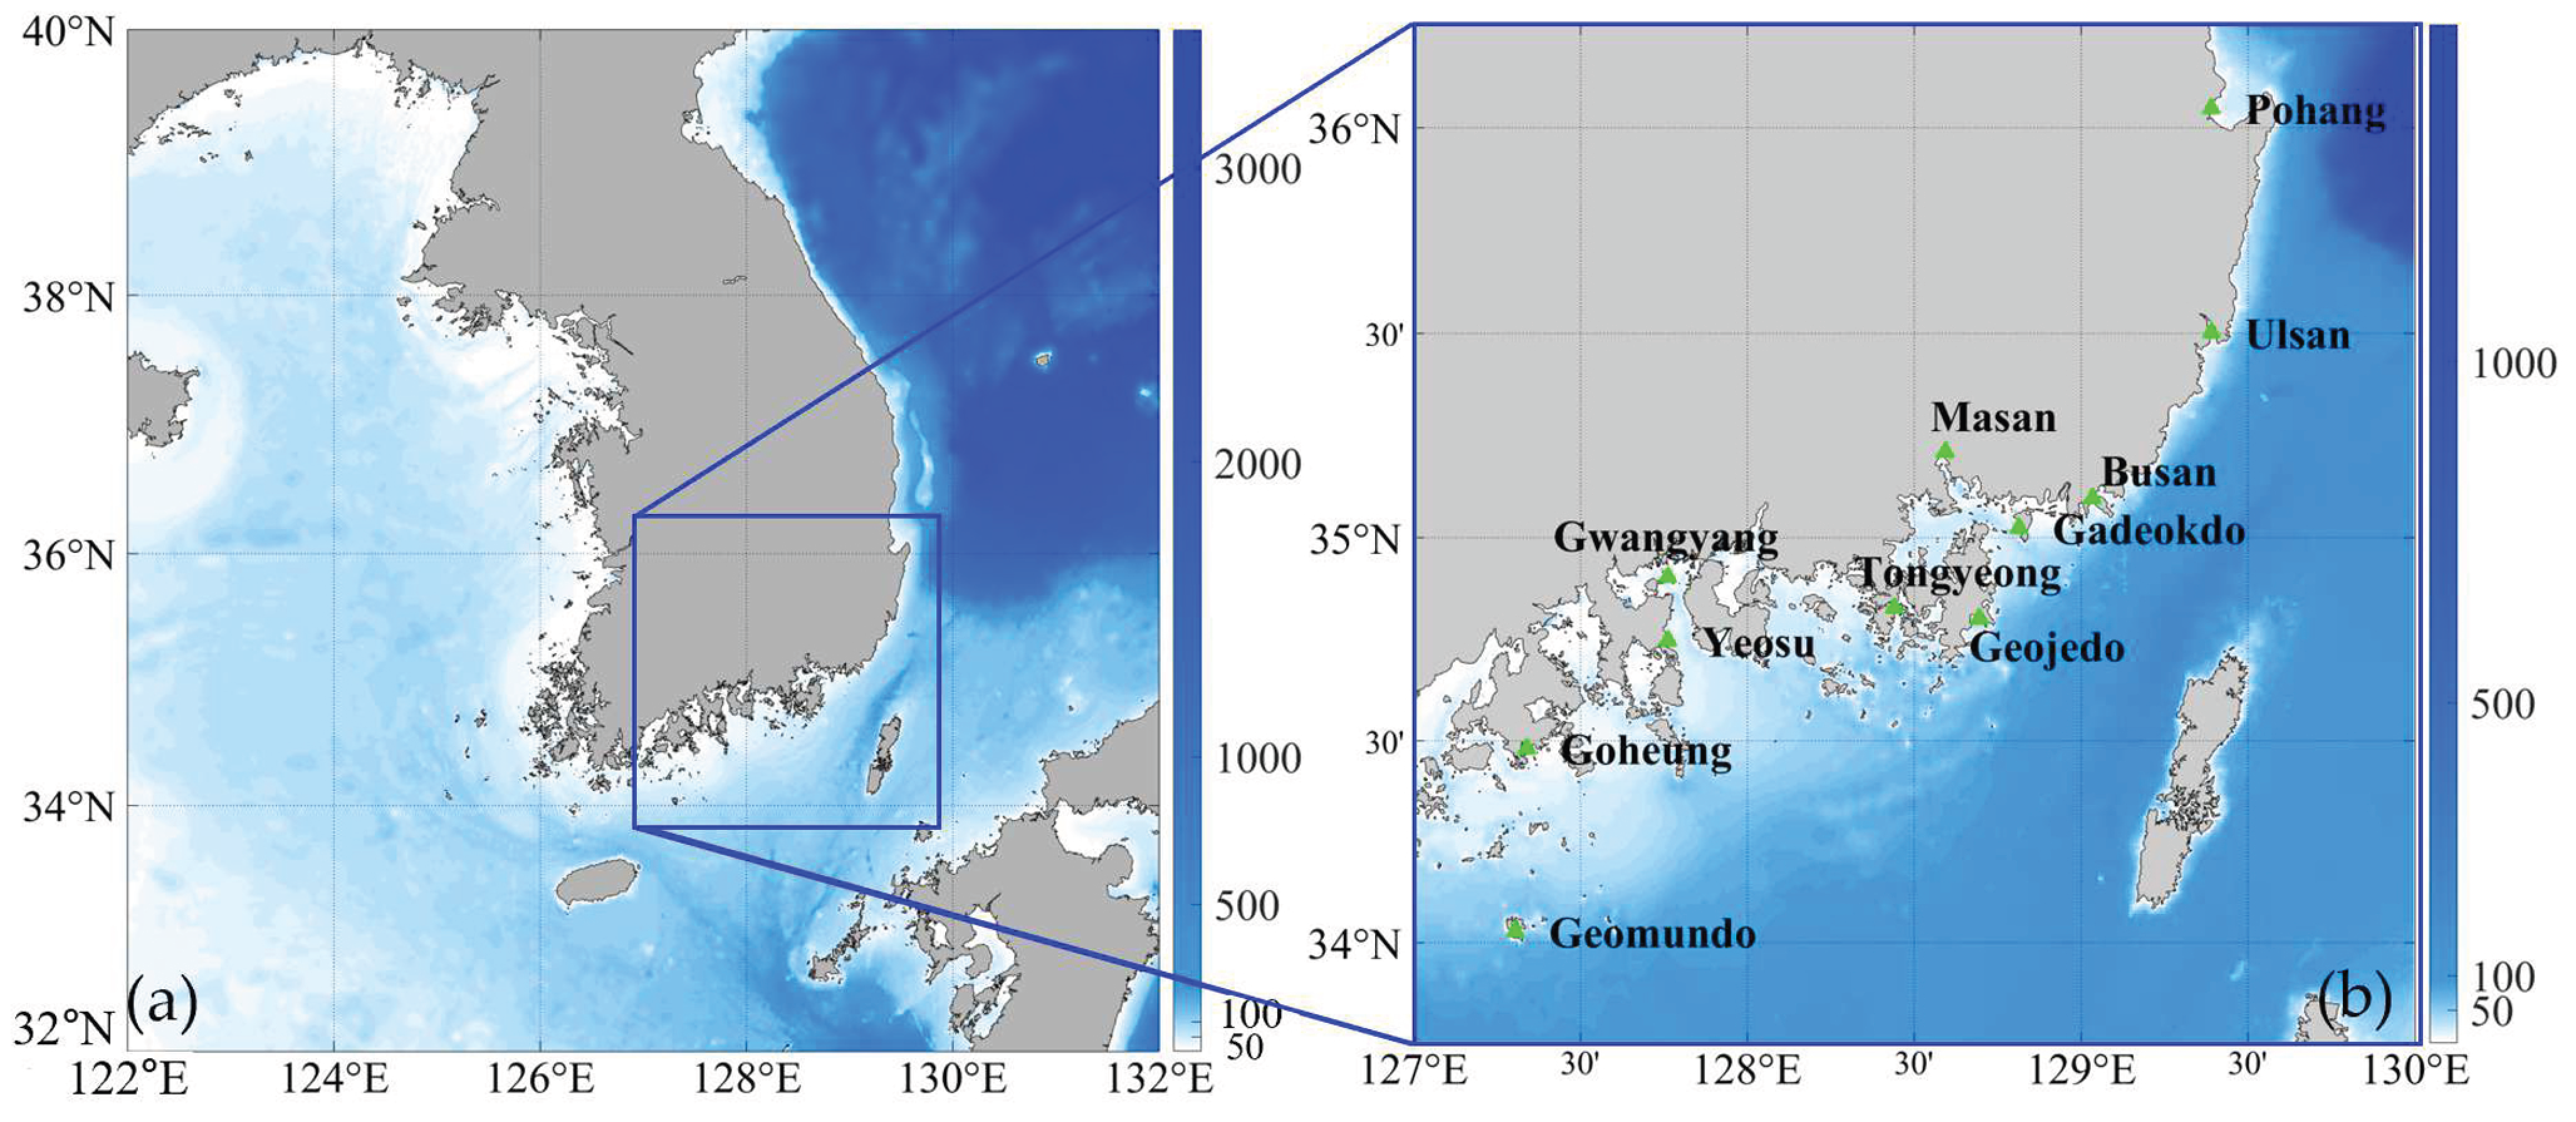
The area of interest in this study covers the southeastern coast of the Korean Peninsula (Figure 2a), a region frequently affected by typhoon-induced storm surges and characterized by complex coastal topography with relatively limited tidal and wave effects. Eleven tide-gauge stations—Geomundo, Goheung, Yeosu, Gwangyang, Tongyeong, Masan, Gejedo, Gadoekdo, Busan, Ulsan, and Pohang—were chosen as target sites for improving the model (Figure 2b and Table 1).

2.2. Data

2.2.1. Predictors

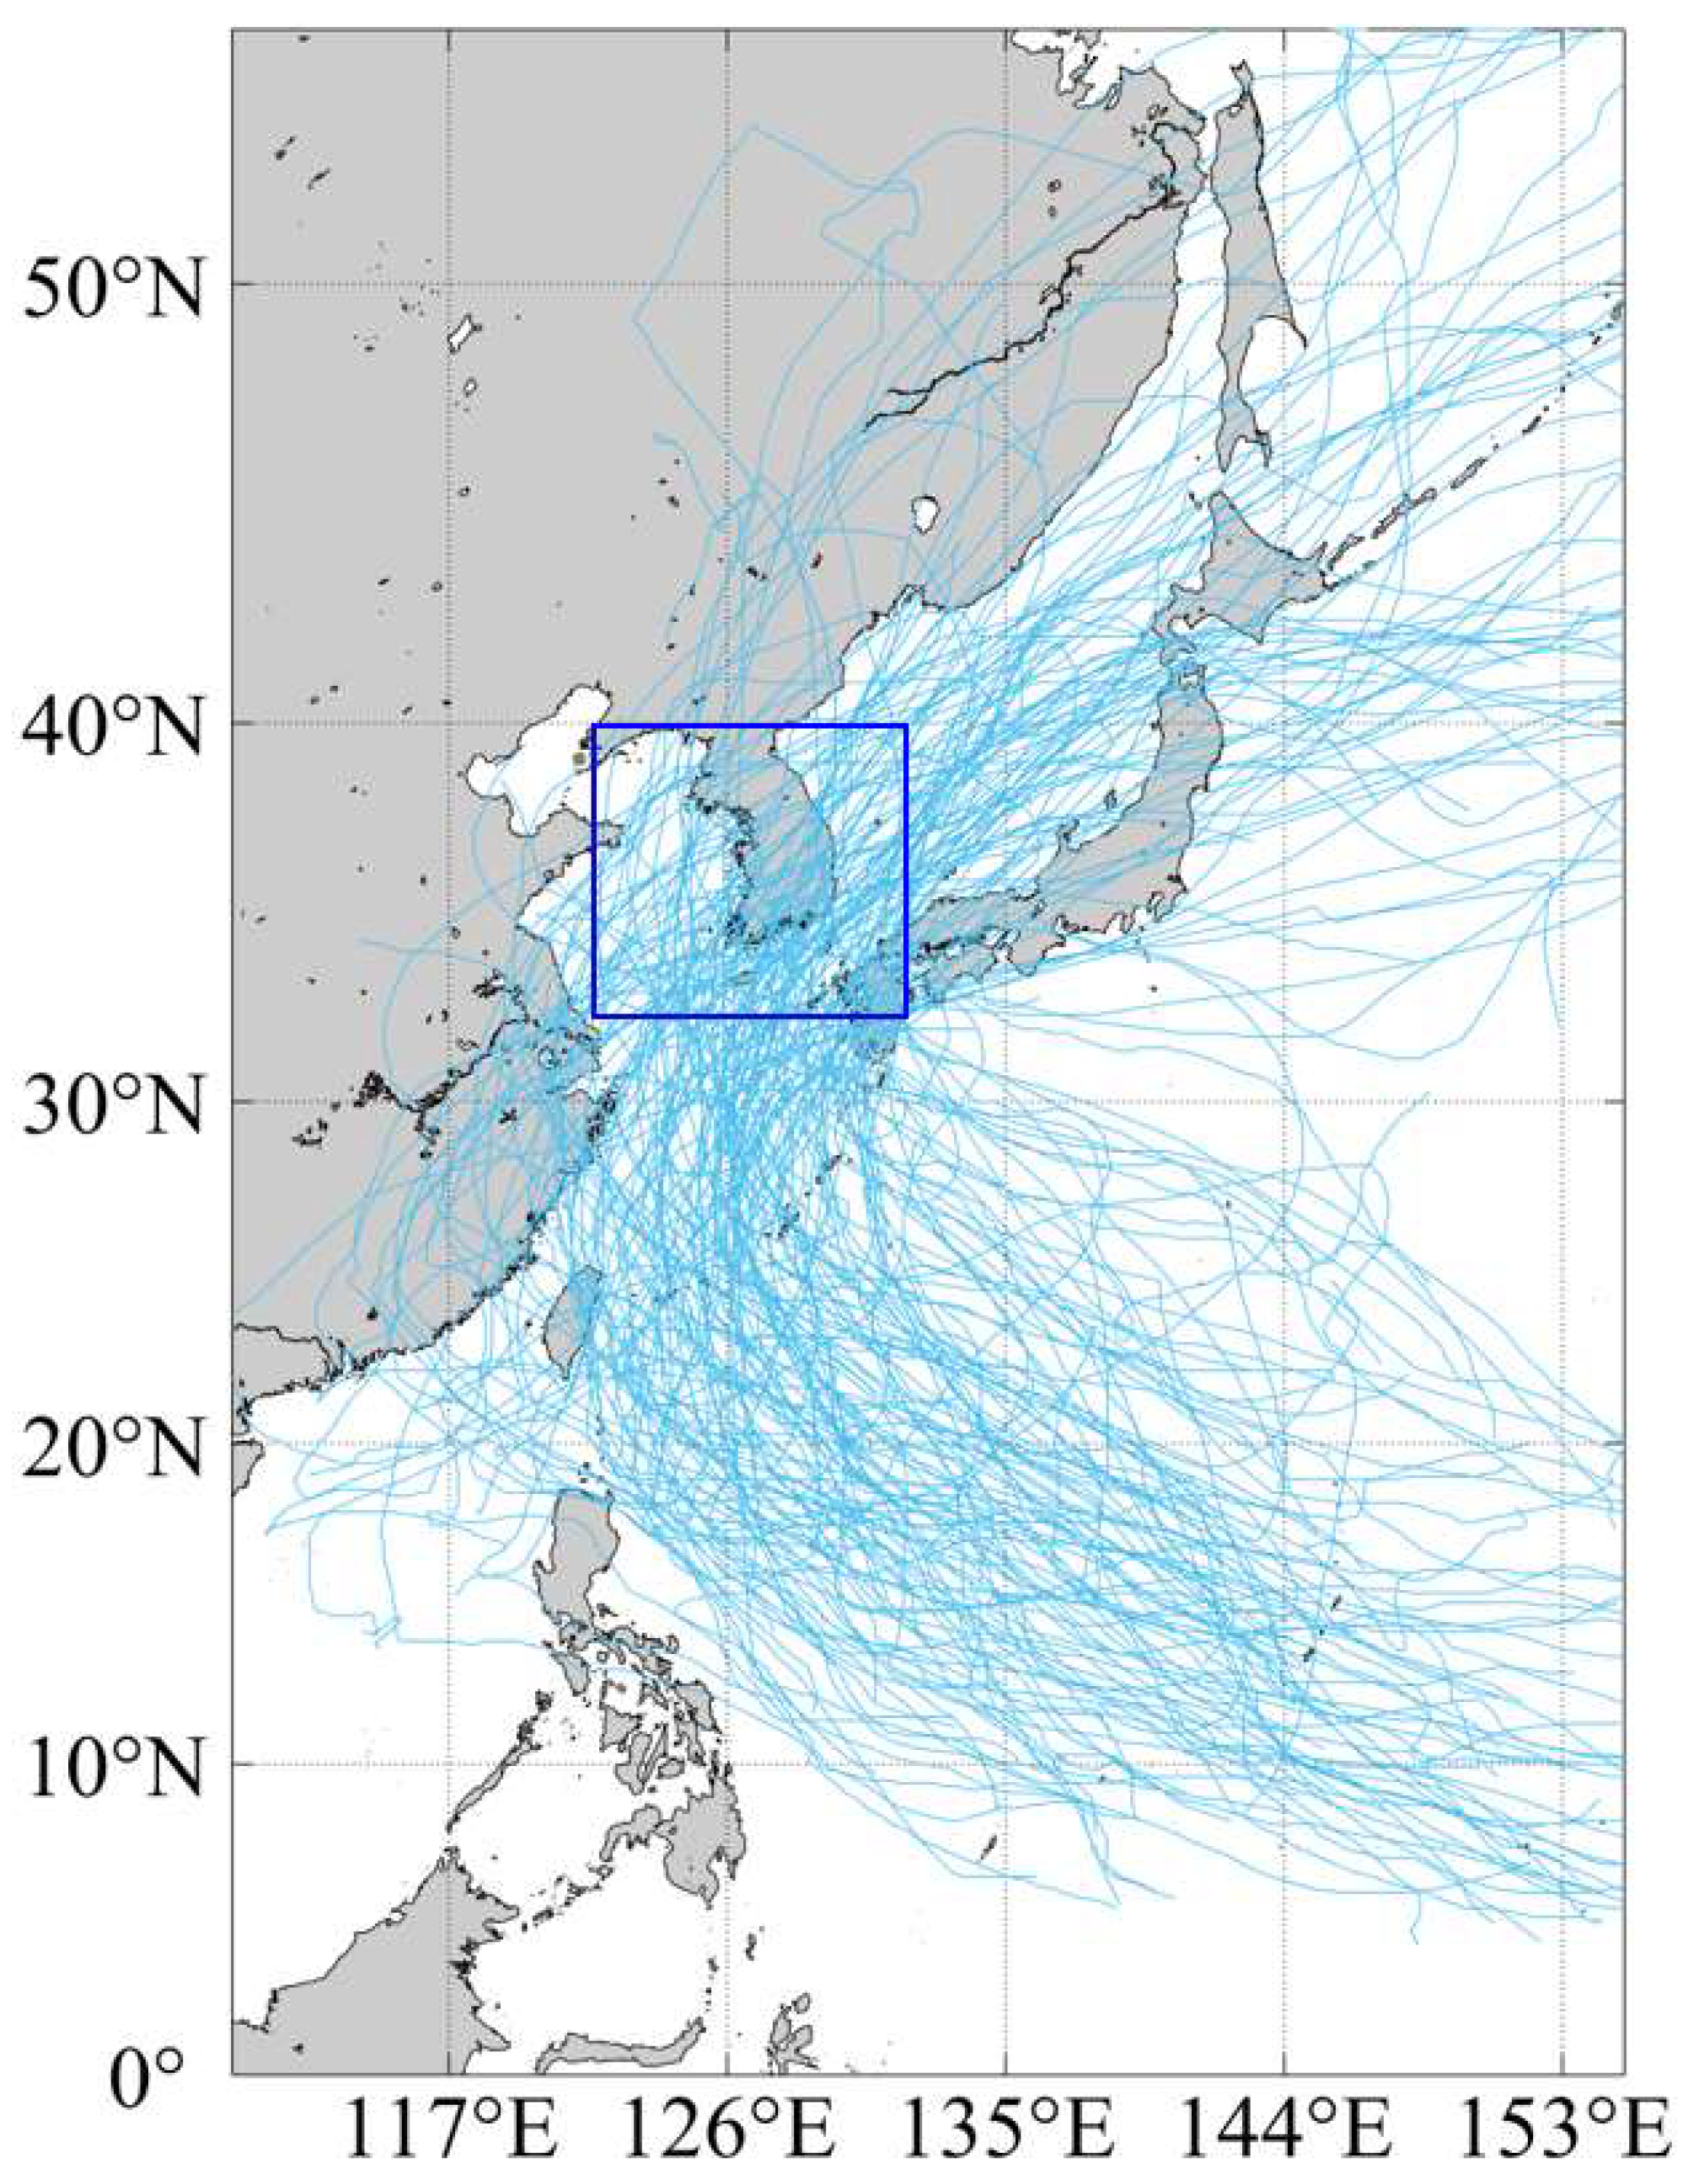
The IBTrACS dataset [23], developed by NOAA/NCEI to unify regional datasets from RSMCs and TCWCs, was used to obtain typhoon track information. A total of 155 typhoons that traversed the geographical region bounded by latitudes 32° N to 40° N and longitudes 122° E to 132° E during the period 1979 to 2020 were defined as affecting the Korean Peninsula (the blue solid rectangle in Figure 3 and Table A1). Independent variables for the multiple linear regression model for predicting SSH were selected from the “TOKYO” dataset (typhoon records for the Northwest Pacific provided by the Japan Meteorological Agency) within IBTrACS. It includes typhoon location information represented by latitude and longitude, as well as typhoon intensity expressed by wind speed and central pressure. From these data, the authors derived additional variables—such as typhoon translation speed, the distance between the typhoon center and the target site, and the approach angle of the typhoon relative to the target site—which were used as input variables for the model.

2.2.2. Predictand

The observed SSHs used in this study were calculated from eleven tidal observation stations on the southeastern shoreline of the Korean Peninsula, maintained by the Korea Hydrographic and Oceanographic Agency [24]. The data have an hourly temporal resolution and have undergone quality control procedures, including gap filling and outlier removal. SSHs were calculated from the raw water level records at each station by subtracting the astronomical tidal constituents and the yearly mean sea level. The astronomical tidal components were calculated using the default settings of T_tide MATLAB R2025a toolbox [25].

2.3. Multiple Linear Regression Technique

This study employed a multiple linear regression framework (Equation (1)) to model SSHs using typhoon characteristics as predictors. To ensure statistical validity, the dataset was subjected to preprocessing, in which missing values and negative SSHs were excluded, as the latter correspond to “negative” or “reverse” surges, which are phenomena generated by mechanisms opposite to those of typical storm surges [26,27,28]:
Y = β 0 + β 1 X 1 + β 2 X 2 + + β n X n
where Y is the predictand, X i   i = 1 ,   ,   n denotes the predictors, and β i denotes the coefficients derived using the least squares method.
In this study, we adopted the event-based data splitting approach, which demonstrated the best predictive performance in our previous work [21]. This method groups the dataset for each typhoon case and randomly allocates the events into training and testing groups according to a 7:3 ratio.
Prior to model development, each explanatory variable was normalized by applying the z-score method to ensure numerical stability and comparability across predictors. Variance inflation factors (VIFs) were calculated for all candidate variables to assess potential multicollinearity. Only those with VIF values less than 5 were retained to minimize redundancy and enhance model interpretability. In addition, the statistical significance of each predictor was evaluated using two-sided p-values, and only variables with p-values below 0.05 were included in the final model to ensure the robustness of the estimated regression coefficients.
Data preprocessing, model construction, and performance evaluation were all carried out using Python 3.9. The complete source files and associated datasets are provided in the Supplementary Materials to ensure transparency and reproducibility.

2.4. Data Sampling Technique—Over-Sampling

In imbalanced datasets, the minority class is often underrepresented compared to the majority class, leading to biased predictions that favor the majority class [29]. A representative approach to address this issue is over-sampling, which artificially increases the number of minority-class samples to balance the class distribution, either by simple replication or by generating synthetic samples [30]. This method has the advantage of mitigating imbalance without data loss; however, simple replication can increase the risk of overfitting, while synthetic generation may introduce noise or unrealistic samples. In this study, three over-sampling techniques are considered: (1) RandomOverSampler, (2) SMOTE, and (3) BorderlineSMOTE.
RandomOverSampler (ROS) [31] balances the dataset by randomly replicating minority-class samples. It is simple to implement, computationally inexpensive, and preserves the original data distribution with minimal distortion. However, since identical samples are repeatedly used, it can increase the likelihood of overfitting to specific instances.
The Synthetic Minority Over-Sampling Technique (SMOTE) [32,33,34] generates new synthetic samples by interpolating between minority-class samples and their k-nearest neighbors. Unlike simple replication, this method creates new data points, thereby reducing the risk of overfitting and improving classifier generalization around the decision boundary. As one of the most widely used synthetic over-sampling methods, SMOTE has shown significant effectiveness. Nonetheless, synthetic samples may extend beyond the true feature space or introduce noise, and distance-based calculations may become distorted in sparse datasets.
BorderlineSMOTE (Border) [34] is a variant of SMOTE that focuses on minority samples located near the boundary of the majority class (i.e., in “danger” regions). By generating synthetic samples around these boundary instances, it enhances the classifier’s ability to learn decision boundaries, improves prediction performance in regions prone to misclassification, and responds more sensitively to the actual distribution. However, when boundary identification is ambiguous or noise levels are high, it may lead to the excessive generation of misleading samples and increased computational complexity.

2.5. Data Sampling Technique—Under-Sampling

Under-sampling is a technique used to mitigate the problem of class imbalance by removing or reducing majority-class samples to balance them with the minority class. This approach has the advantage of reducing the size of the training dataset, thereby improving computational efficiency and directly addressing imbalance. However, random or excessive removal of samples may result in the loss of important distributional information [35]. In this study, five representative under-sampling methods were applied: (1) RandomUnderSampler, (2) NearMiss, (3) TomekLinks, (4) Edited Nearest Neighbours, and (5) ClusterCentroids.
RandomUnderSampler (RUS) [31] balances the dataset by randomly eliminating the majority-class samples. It is simple, easy to implement, and computationally efficient but may cause the loss of critical information due to random removal.
NearMiss [36] is a distance-based sampling method that selects the majority-class samples closest to the minority class. NearMiss-1 selects the majority samples with the smallest average distance to minority instances, NearMiss-2 selects those with the largest average distance, and NearMiss-3 selects the nearest majority samples for each minority instance. This approach is effective for preserving decision boundaries, although it may increase data sparsity.
TomekLinks (Tomek) [37] identifies pairs of nearest neighbors from different classes (Tomek pairs) and removes the majority-class sample in each pair. This method refines class boundaries and helps eliminate noise and overlapping samples.
Edited Nearest Neighbours (ENN) [38] examines each sample’s k-nearest neighbours and removes majority-class samples that disagree with the majority of their neighbors. This approach effectively reduces noise near decision boundaries, enhances data consistency, and can improve classifier performance.
ClusterCentroids (Centroids) [35] applies K-means clustering to the majority-class samples and replaces them with the cluster centroids. This method preserves representative information rather than removing data at random, thereby maintaining the overall distribution while improving training efficiency.

2.6. Objective Functions

The predictive performance of the MLR models was objectively evaluated using four widely employed statistical metrics: mean absolute error (MAE), mean squared error (MSE), root mean square error (RMSE), and the coefficient of determination (R2).
MAE quantifies the average absolute deviation between prediction and observation, irrespective of error direction. It is given by the following:
M A E = 1 n Σ i = 1 n O i S i
where O i , S i , and n denote the observed and predicted values and the number of samples, respectively. A smaller MAE reflects improved model performance. Owing to its simplicity, MAE is widely used as it explicitly represents the average error of prediction in the target variable’s original scale.
MSE quantifies the mean of the squared differences between observed and predicted values, and it is expressed as
M S E = 1 n Σ i = 1 n O i S i 2
Because residuals are squared, larger errors are penalized more heavily than smaller ones, making MSE particularly affected by outliers. It functions as a conventional regression analysis metric applied to evaluate model calibration and performance differences.
RMSE is expressed as the square root of the MSE:
R M S E = 1 n Σ i = 1 n O i S i 2
Unlike MSE, RMSE expresses prediction errors in the same units as the observed variable, which helps in understanding and practically assessing model performance. Smaller RMSE values correspond to higher predictive accuracy.
R2 measures the proportion of variance in the observed data that is explained by the model, and it is calculated as
R 2 = Σ i = 1 n O i O ¯ S i S ¯ Σ i = 1 n O i O ¯ 2 Σ i = 1 n S i S ¯ 2 2
where O ¯ refers to the average of observed values, and S ¯ refers to that of predicted values. R2 ranges from 0 to 1, where larger values indicate a better fit of the model. In most applications, R2 values above 0.5 are regarded as acceptable [27,28,39].

3. Results

3.1. Effect of SSH Threshold Selection on Model Performance Under Over- and Under-Sampling Schemes

Table 2 presents the test R2 value of models under varying SSH thresholds with under-/over-sampling strategies. For each SSH threshold, under-sampling was applied to the observations within the low-SSH interval (SSH ≤ threshold), and over-sampling was applied to those within the high-SSH interval (SSH > threshold). The “Total” row represents the R2 value derived from regression using the combined dataset from all stations. To isolate the effect of threshold-based sampling alone, all models employed the random sampling method for both under- and over-sampling techniques (ROS and RUS).
As shown in Table 2, the model performance generally improved with increasing SSH thresholds. At threshold values of 0.35 and 0.4, the regression models exhibited relatively high predictive skill, achieving R2 values greater than 0.6 at nearly all stations except for Yeosu. Notably, the model achieved its highest overall R2 (0.6255) when the threshold was set to 0.4. However, a threshold of 0.35 was selected as the optimal value for further analysis, considering the balance between performance and data distribution. A higher threshold, such as 0.4, resulted in an insufficient number of high-SSH observations, which increased the risk of overfitting due to excessive over-sampling.
While the proportion of high-SSH samples above the 0.35 m threshold was relatively small (≈0.7% of the total dataset), this level provided the most stable sampling balance for model training. Lower thresholds (e.g., 0.3 m) included too many low-energy observations, weakening the regression’s sensitivity to surge-related variability, whereas higher thresholds (e.g., 0.4 m) further reduced the number of high-SSH samples (≈0.4%) and led to unstable model behavior due to excessive over-sampling. In particular, stations with very limited high-SSH data, such as Goheung (only 7 out of 1090 samples above 0.4 m), exhibited signs of overfitting, resulting in abnormally high R2 values (up to 0.9687). Therefore, the 0.35 m threshold was selected as a compromise that minimized sampling bias and ensured consistent predictive performance across stations.
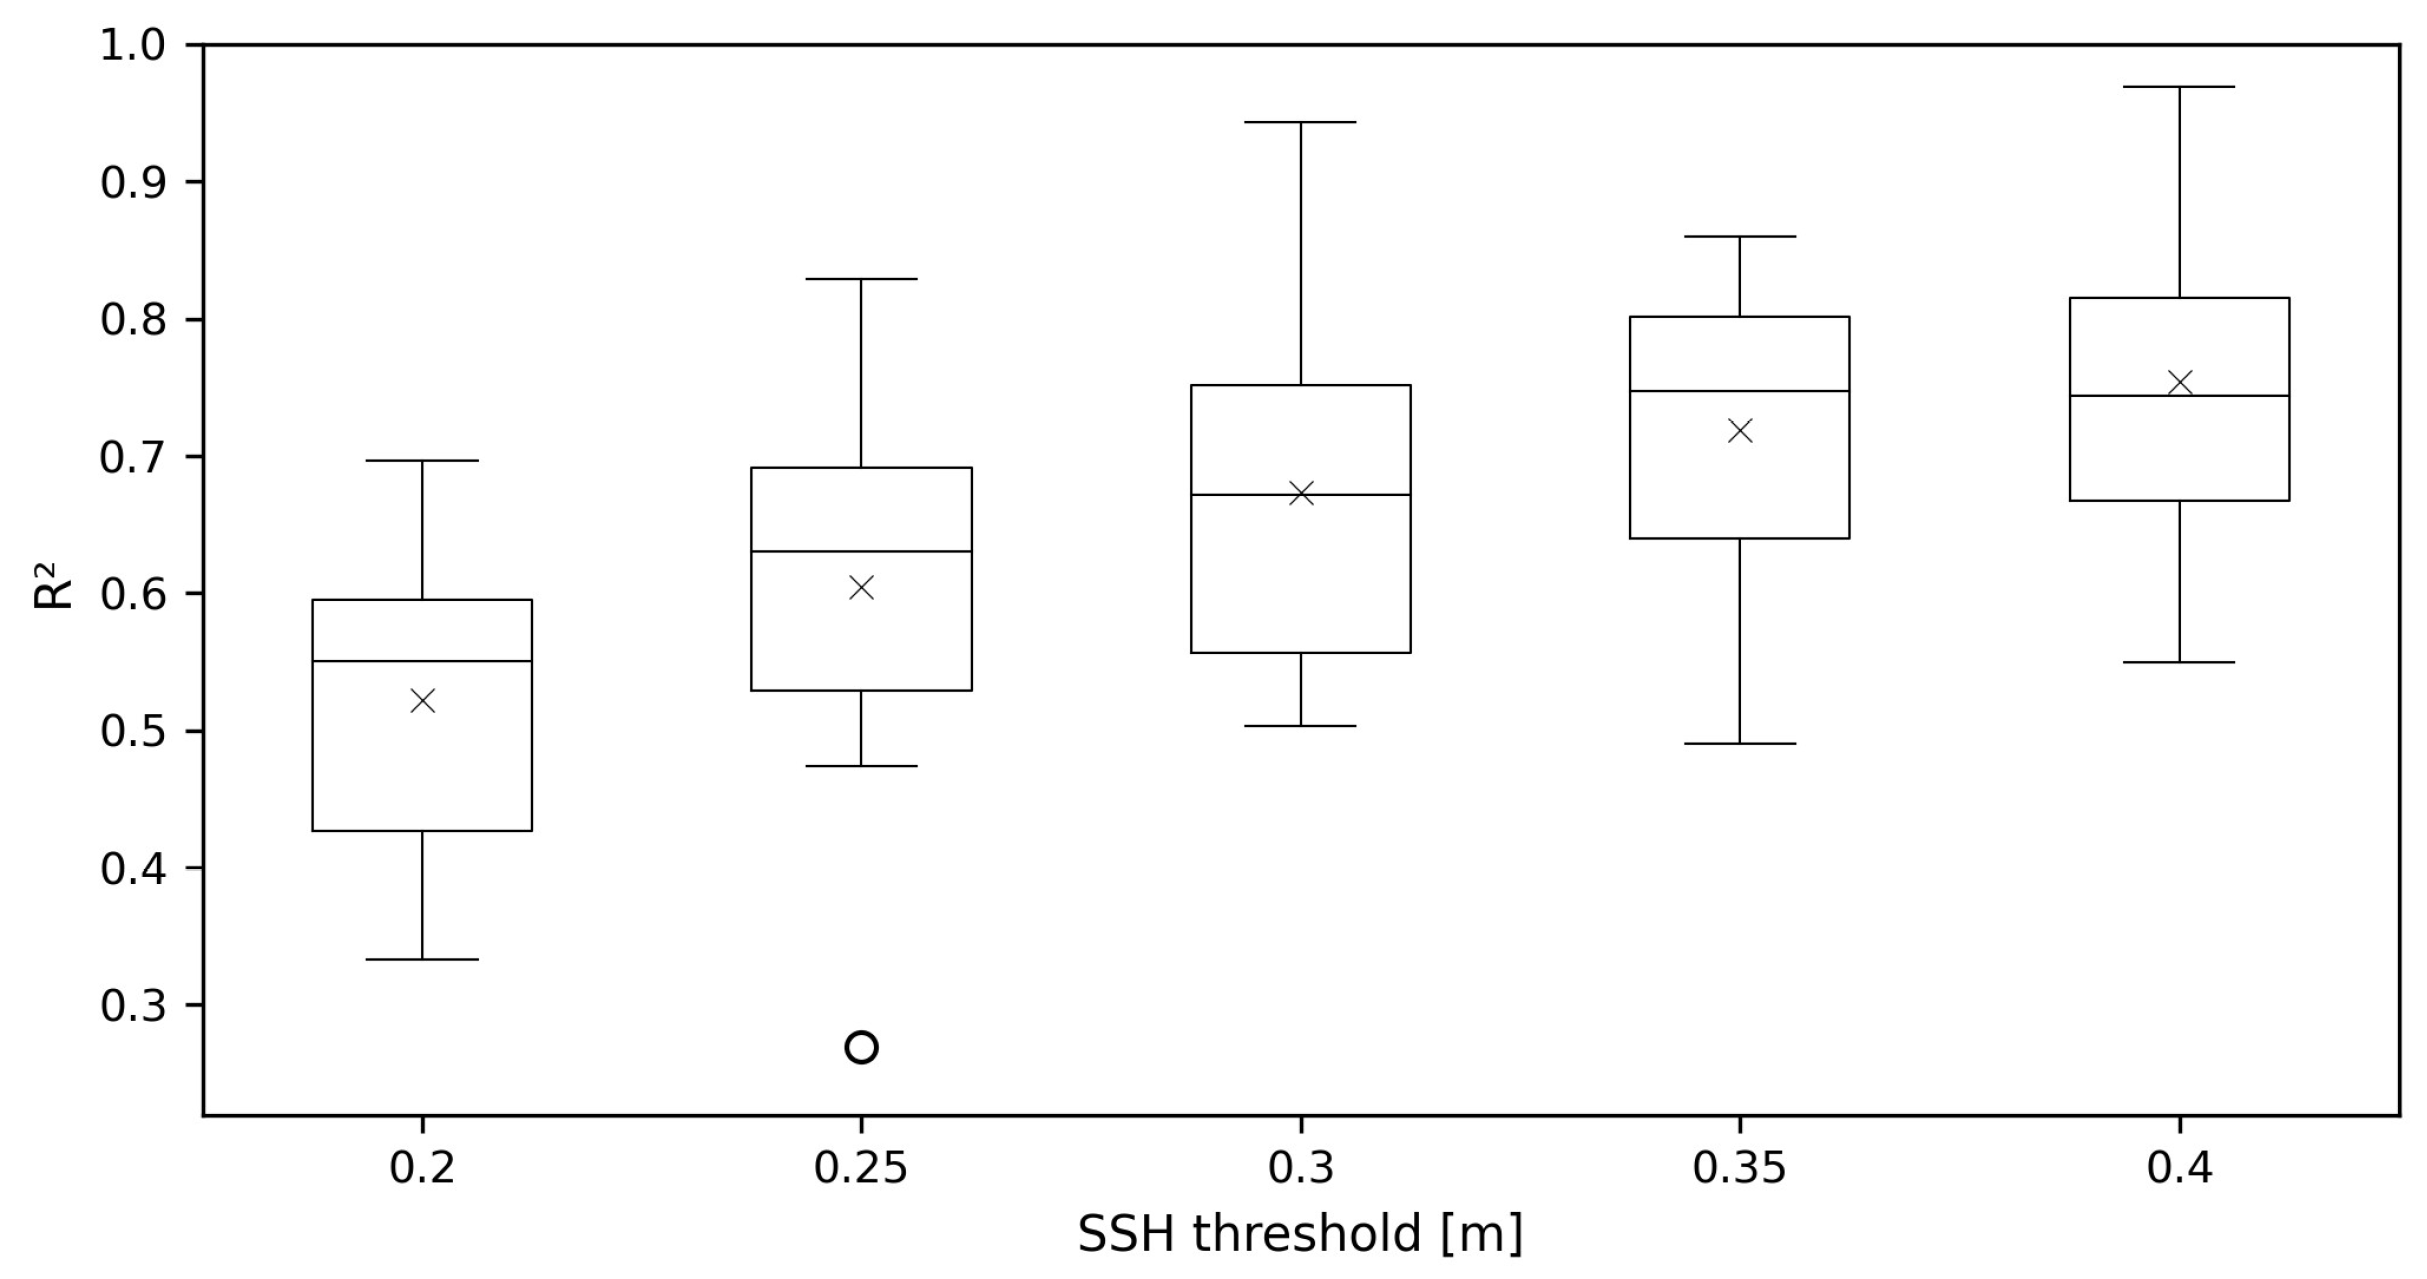
The boxplots in Figure 4 further clarify the physical reason for the observed trend. At low SSH thresholds (≤0.25 m), the model performance is highly variable, as reflected by the wide interquartile range and occasional low-R2 outliers. This is primarily because these samples correspond to quiescent sea states where meteorological forcing is weak and the relationship between surge height, wind stress, and pressure gradients becomes less linear. As the threshold increases, the spread of R2 values narrows, and the median rises, indicating that the inclusion of more energetic events enhances the statistical representation of physically driven surges. When SSH exceeds approximately 0.3 m, the system response becomes more dominated by wind and pressure forcing, yielding more consistent predictive skill across stations. However, excessively high thresholds (e.g., 0.4 m) reduce the number of high-SSH samples and may introduce artificial variance through over-sampling, emphasizing the need for a balanced threshold selection.
Figure 5 displays the regression results at the selected threshold of 0.35 for each station. The scatter plots of observed versus predicted SSHs indicate generally strong agreement, though with some variations across stations. In the combined dataset (Figure 5i), a noticeable discontinuity is observed near the threshold value (0.35), reflecting the structural break between under- and over-sampled data. However, this discontinuity is less evident when examining individual stations (Figure 5a–k), suggesting that the effect is more prominent in the aggregated data.
In some stations (e.g., Geojedo, Gwangyang, Masan), the number of training samples appears visibly reduced due to the filtering of potentially uninformative or noisy observations during the under-sampling process. While this led to sparse scatter patterns in some plots, the retained data points contributed to more stable and interpretable regression outcomes by mitigating the influence of extreme or clustered low-SSH samples.
Notably, the application of threshold-based under-/over-sampling strategies alone led to substantial performance gains compared to the optimal results reported in previous studies [31] without applying data preprocessing (data sampling). Across most stations, the R2 values increased by 0.04 (Masan, Geomundo) to as high as 0.46 (Ulsan) solely due to data-level balancing without modifying the underlying regression structure. Significant improvements were also observed in Gadeokdo (+0.25), Geojedo (+0.19), Pohang (+0.22), and Goheung (+0.31), emphasizing the critical role of sample distribution in enhancing predictive accuracy for SSH modeling.

3.2. Effects of Over-/Under-Sampling Schemes at a Fixed SSH Threshold

In this section, the SSH threshold was fixed at 0.35 based on the finding in Section 3.1, where it was identified as the most appropriate value balancing model accuracy and data distribution. To further improve regression performance, various combinations of over- and under-sampling techniques were applied under this threshold condition, as summarized in Table 3.
Table 3 provides the test R2 values obtained using nine different sampling combinations across all stations. The over-sampling methods included Random, Border, and SMOTE, while under-sampling methods consisted of Centroids, ENN, NearMiss, Random, and Tomek. For each station, the performance of the multiple linear regression model trained with each sampling pair was evaluated, and the best-performing combination was identified by the highest R2 in each row.
Notably, some stations such as Geojedo (R2 = 0.9599) and Ulsan (R2 = 0.8712) exhibited remarkably high performance using Random over-sampling with Centroid and ENN under-sampling, respectively. Conversely, stations like Yeosu, which had relatively low baseline R2 values in Section 3.1, still showed modest improvement across all sampling schemes, with the best result at SMOTE-ENN (R2 = 0.5908).
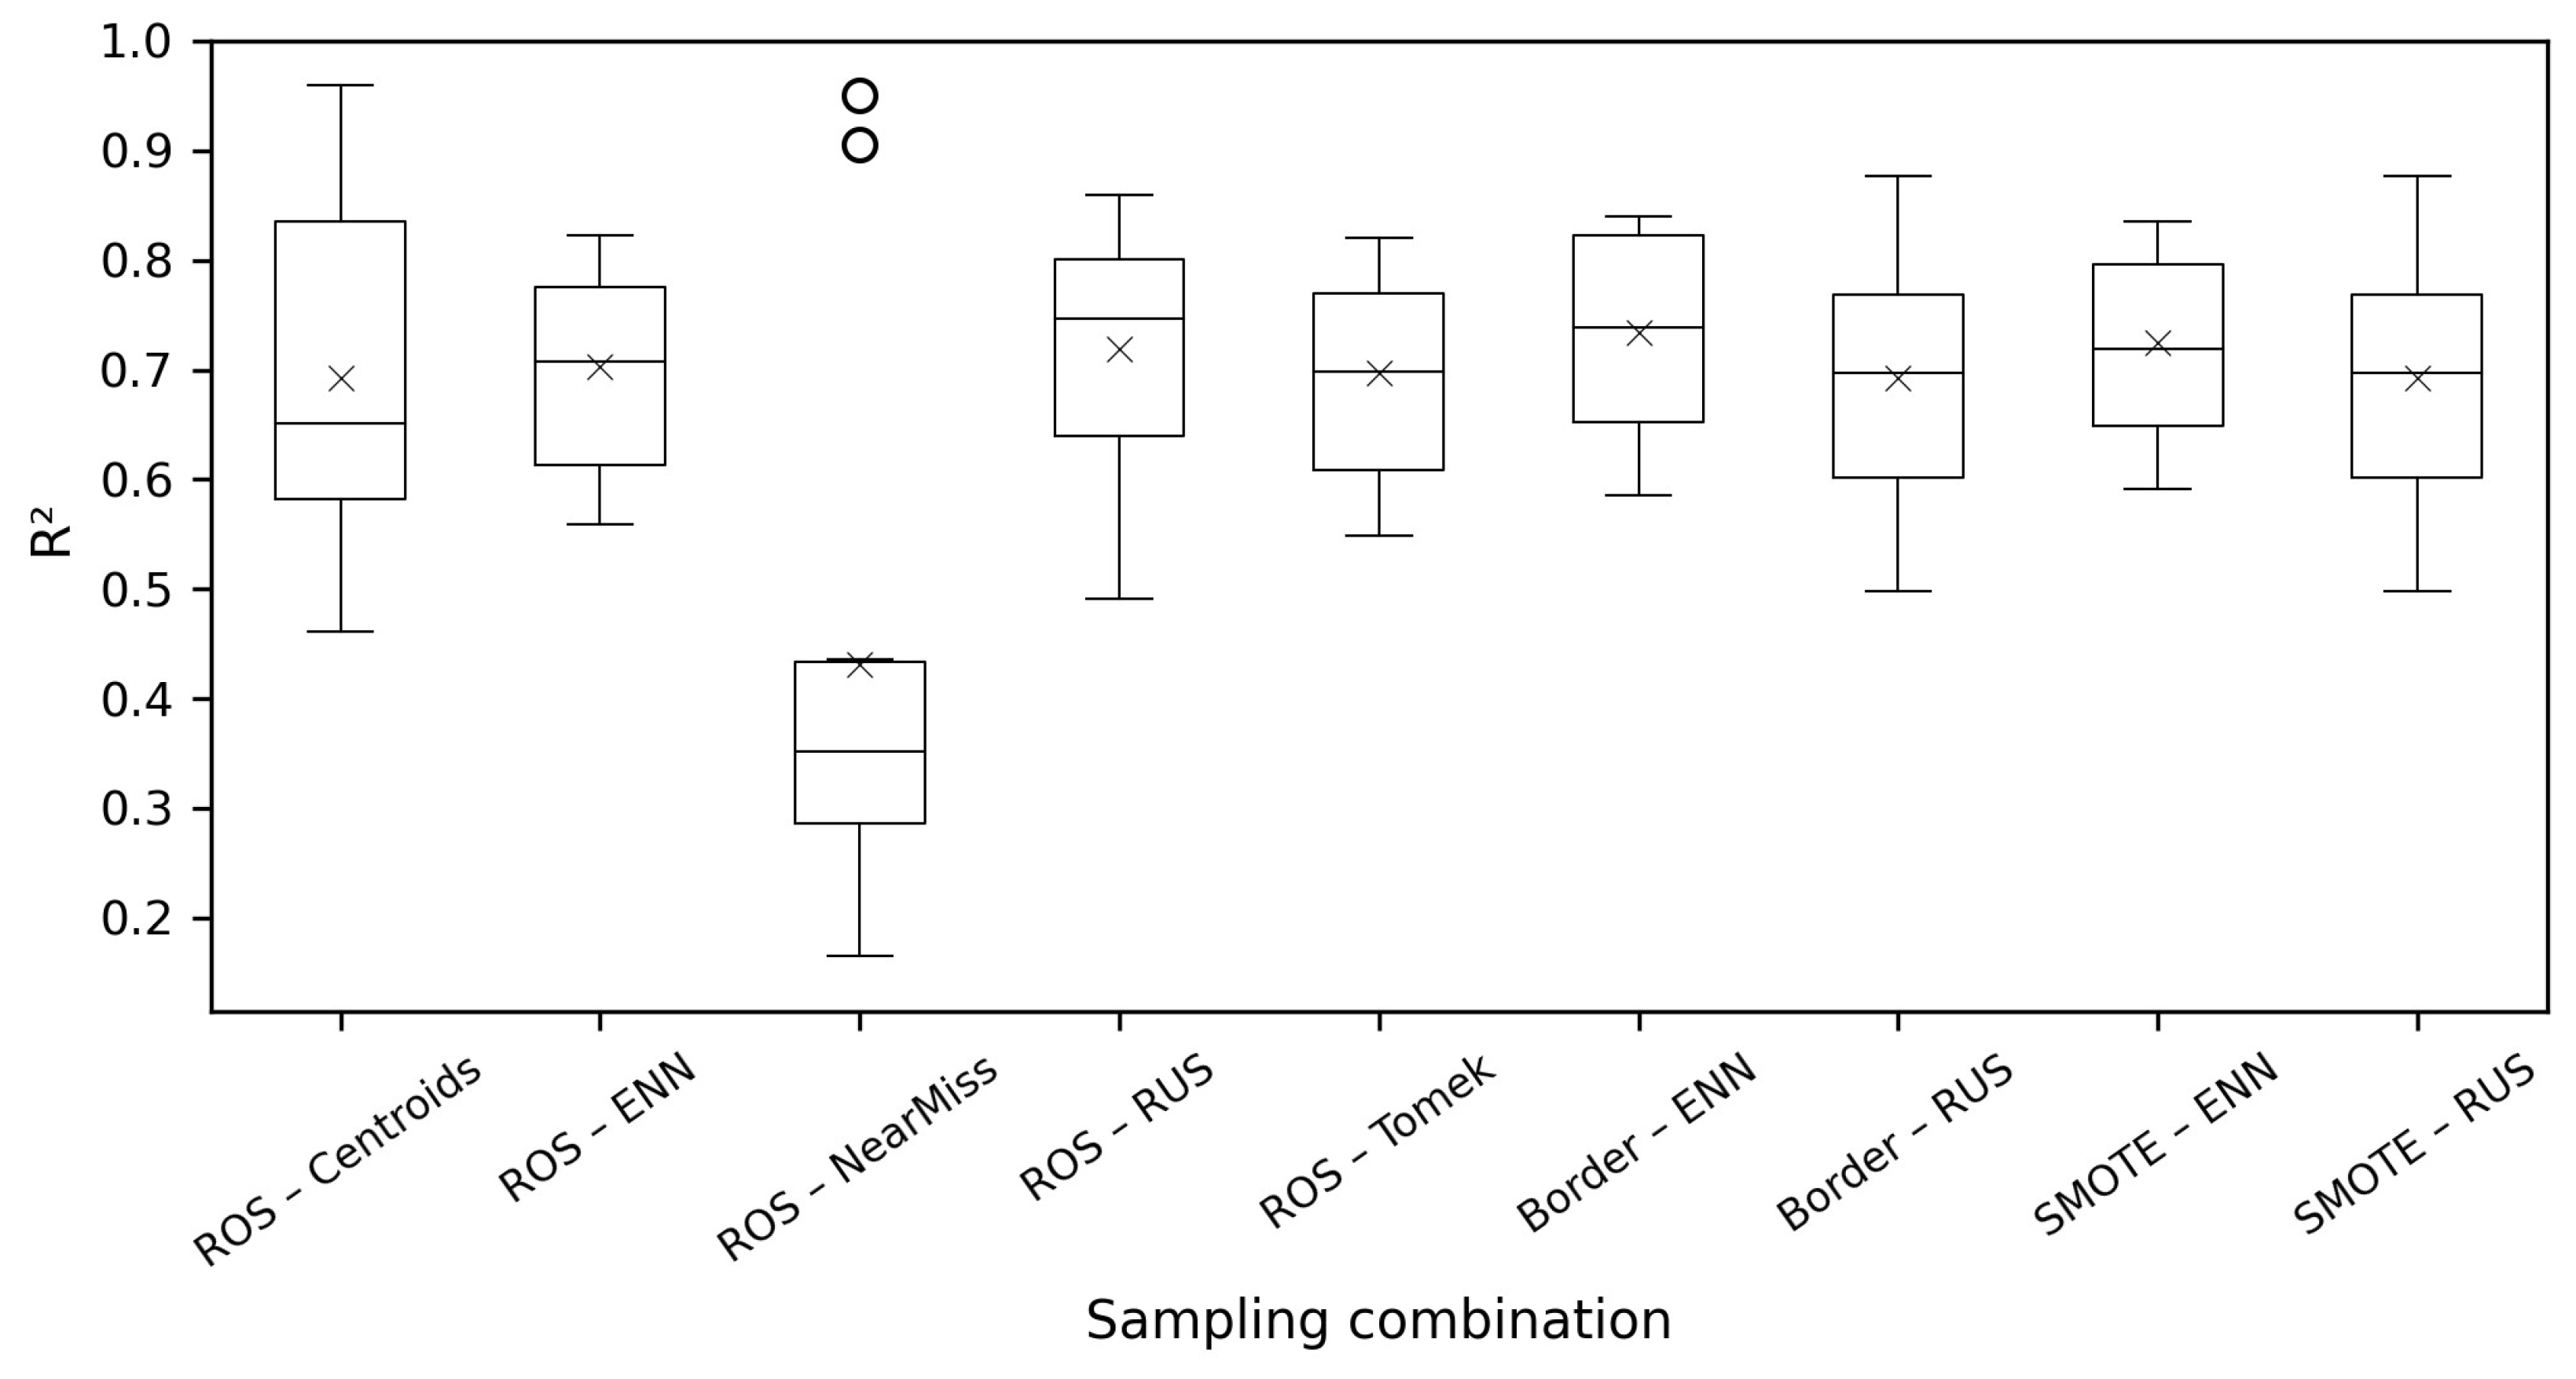
The statistical comparison in Figure 6 summarizes the overall influence of sampling combinations on model performance. Combinations that preserve representative data structures, such as Random over-sampling with Centroids or ENN under-sampling, yield higher and more stable R2 values, whereas aggressive under-sampling methods like NearMiss reduce the diversity of extreme-event samples and degrade performance. SMOTE-based combinations moderately improve model skill by enriching rare high-SSH cases. These results quantitatively demonstrate that sampling strategies maintaining a balanced representation of both frequent and rare surge conditions achieve more physically consistent regression behavior, a pattern that is further visualized in Figure 7.
Figure 7 illustrates scatter plots comparing predicted and observed SSHs under nine different combinations of over- and under-sampling techniques. Each subplot (a–i) corresponds to a distinct pairing of sampling strategies applied at a fixed SSH threshold of 0.35. The combinations include the following: (a) Random–Centroids, (b) Random–ENN, (c) Random–NearMiss, (d) Random–Random, (e) Random–Tomek Links, (f) Border–ENN, (g) Border–Random, (h) SMOTE–ENN, and (i) SMOTE–Random.
Distinct data distribution patterns can be observed across the sampling configurations. In panels (a), (d), (g), and (i)—all of which use Centroids or Random under-sampling—a noticeable sparsity of points is evident around the threshold value (SSH ≈ 0.35). This reflects the nature of aggressive under-sampling techniques (Centroids or Random), which tend to remove borderline or less-representative samples near the decision boundary in order to balance class distributions.
In contrast, panels (b), (e), (f), and (h)—which involve ENN or Tomek Links under-sampling—exhibit smoother transitions across the threshold without a sharp data discontinuity. These methods are designed to retain boundary-adjacent samples or to refine class separation by eliminating ambiguous instances, resulting in a more continuous distribution. Furthermore, in (f) Border–ENN and (h) SMOTE–ENN, there is a sharp concentration of synthetic points in the higher SSH range. This tapering shape at extreme predicted values is a typical artifact of over-sampling techniques like Border and SMOTE, which generate new samples in sparsely populated minority regions. While such methods enhance model exposure to rare events, they may also introduce artificial patterns that alter regression characteristics near the extremes.
These results highlight that not only the choice of threshold but also the specific sampling combination can significantly impact model behavior—particularly around critical regions of the SSH distribution.
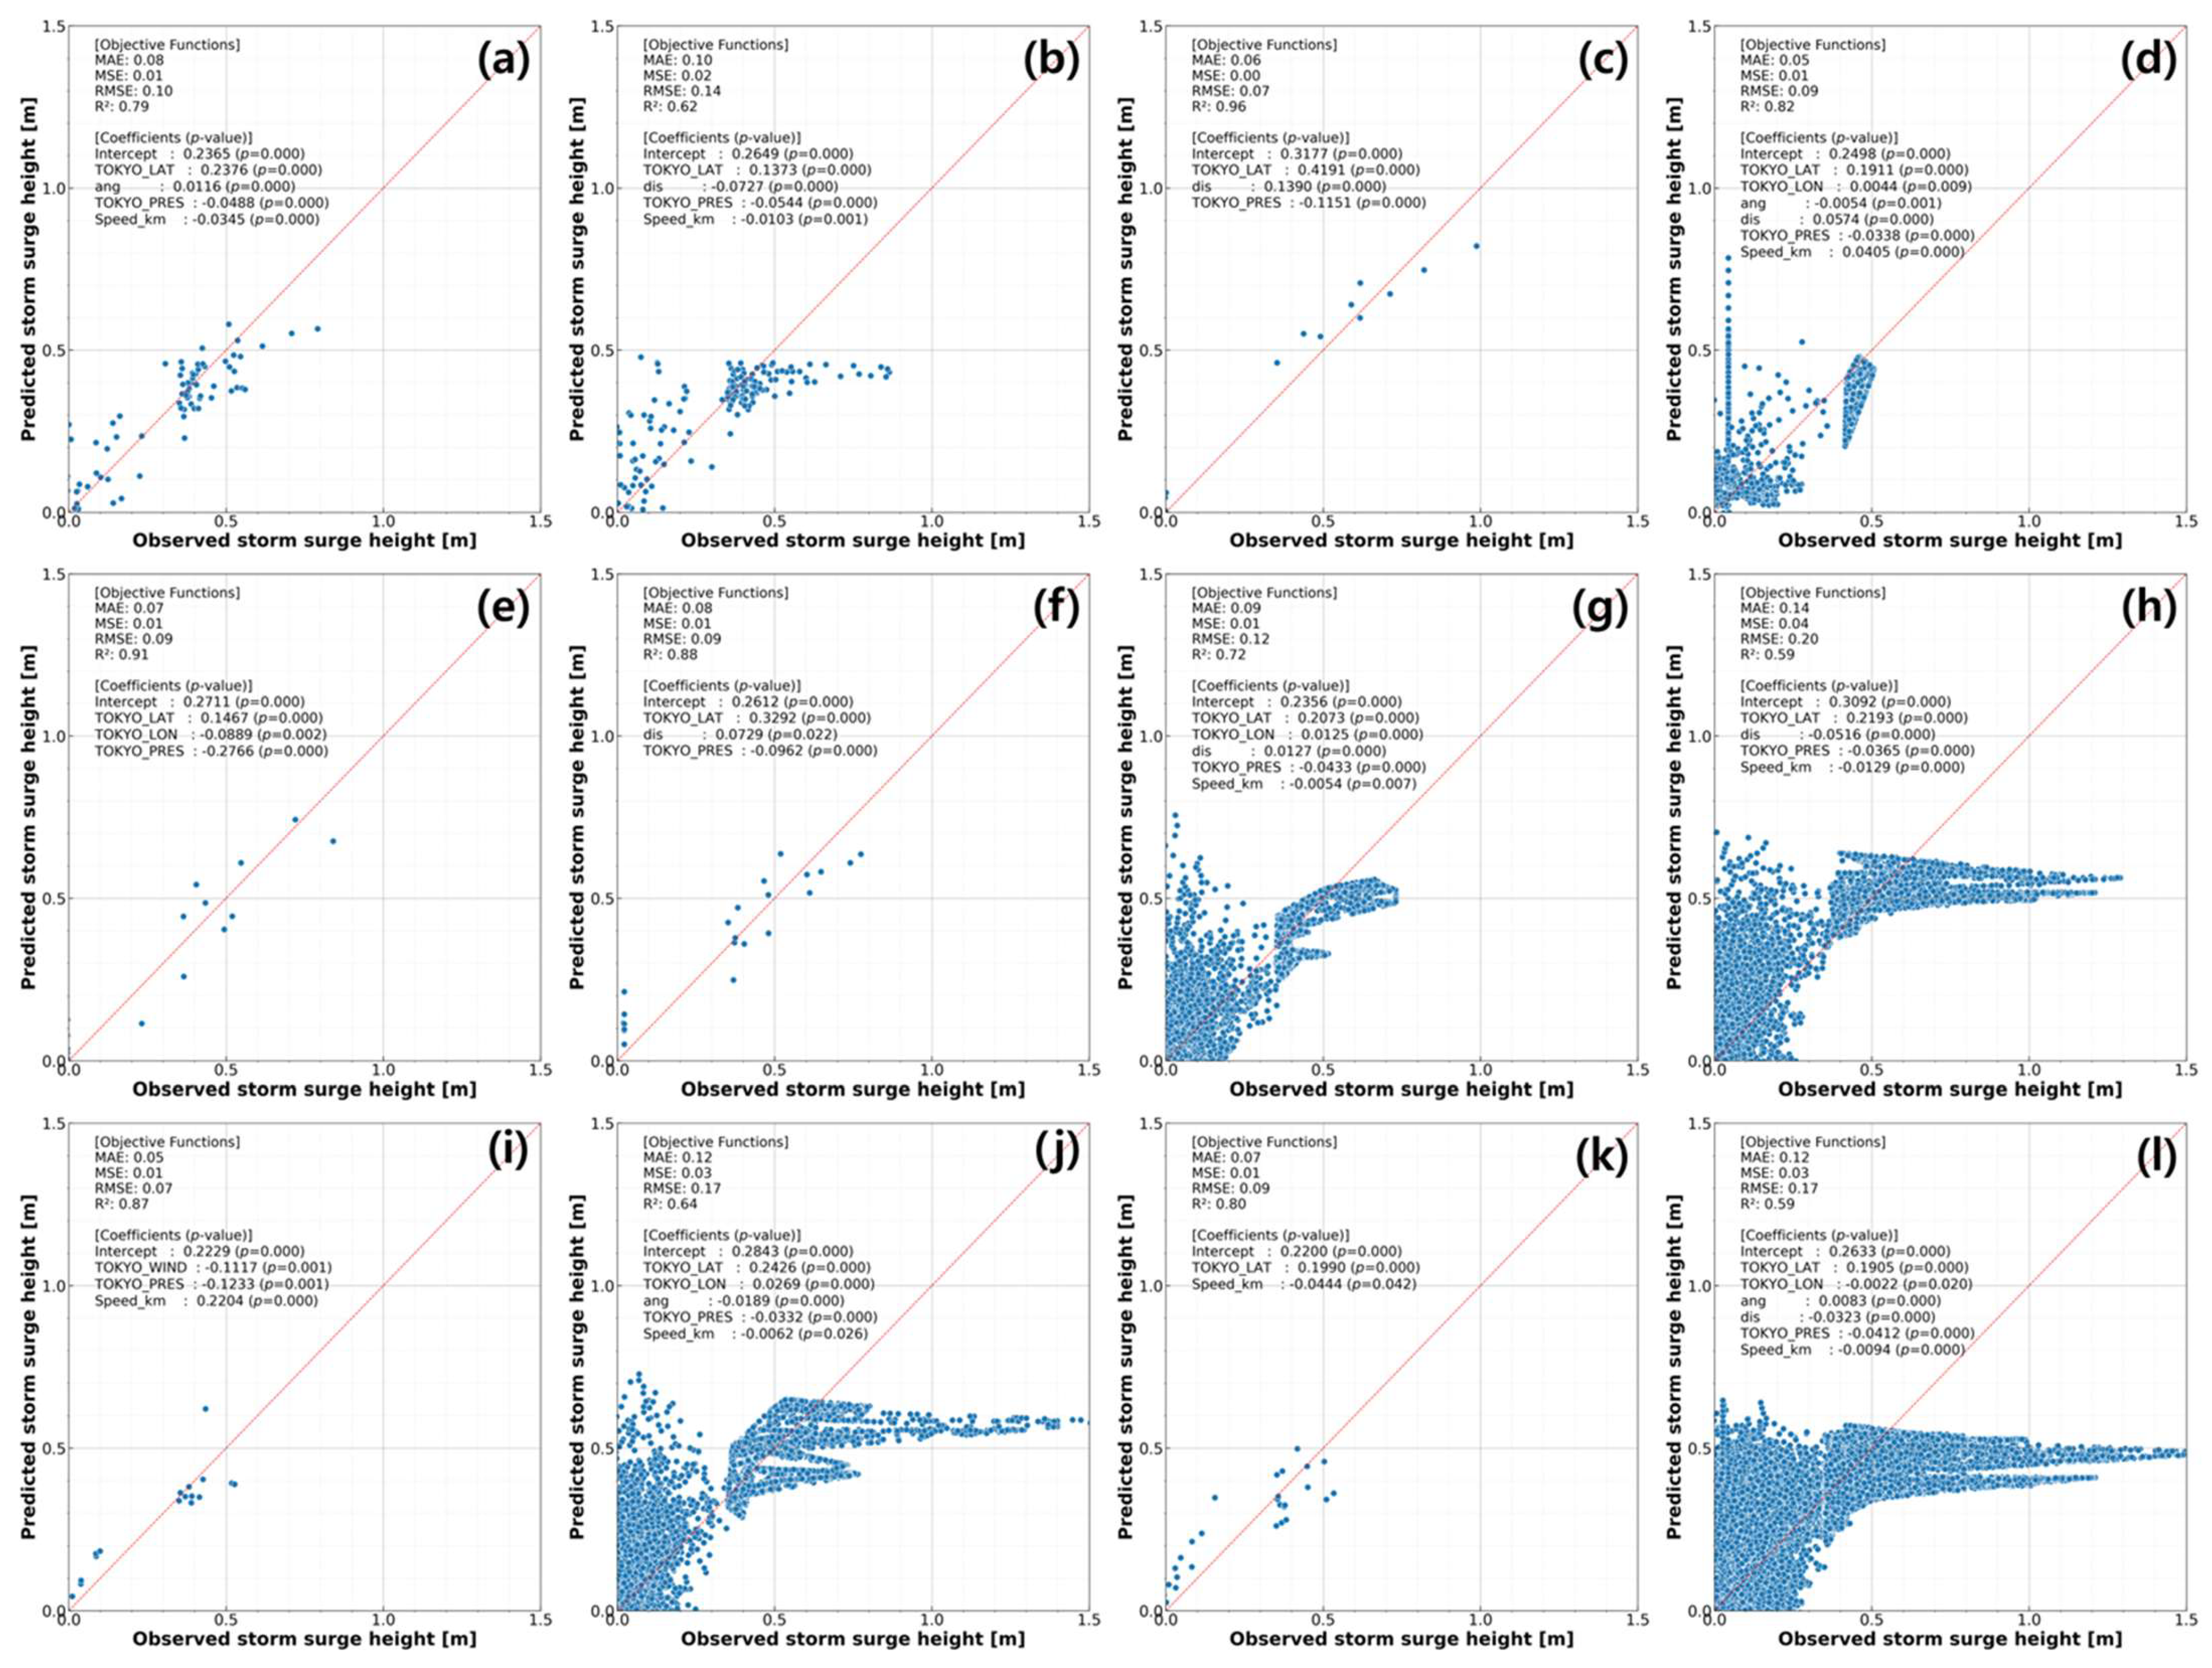
Figure 8 presents scatter plots of predicted versus observed SSHs for each tide gauge station using the optimal combination of over- and under-sampling techniques, selected based on the highest test R2 values from Table 3. The diversity of configurations ranging from Random-Centroids to SMOTE–ENN highlights the station-specific nature of SSH data distributions and the necessity of adapting sampling strategies to local characteristics. For instance, Geojedo (Figure 8c) and Pohang (Figure 8k) achieved their best performance using Random–Centroids, which effectively preserved informative low-SSH observations while enhancing sensitivity in higher ranges. In contrast, Yeosu (Figure 8h) and Tongyeong (Figure 8j) benefited from SMOTE–ENN, where synthetic minority sampling likely mitigated data sparsity in the high-SSH regime.
Compared to the baseline strategy in Section 3.1 (Random–Random with a fixed threshold of 0.35), the tailored configurations led to notable improvements in regression accuracy. For example, Ulsan’s R2 increased from 0.8600 to 0.8712, and Pohang’s increased from 0.7500 to 0.7984, even though the model structure remained unchanged. These results reaffirm that proper data-level balancing is a critical determinant of regression performance in SSH prediction. Although some panels (e.g., Figure 8h,j) still exhibit synthetic sampling artifacts near the threshold, the overall model fit is significantly enhanced through station-specific sampling optimization. This underscores that sampling configuration is not merely a preprocessing choice but a strategic modeling decision in threshold-sensitive hydrological prediction tasks.

4. Discussion

The results of this study underscore the critical role of data-level balancing in enhancing the accuracy of SSH prediction models. Across the eleven tide-gauge stations, the application of tailored over- and under-sampling strategies consistently improved model performance, particularly in terms of R2. Unlike the uniform baseline configuration (Random–Random) applied to all stations in Section 3.1, the station-specific optimization approach in Section 3.2 revealed that no single combination performed best across all cases. Instead, the optimal configuration varied depending on the local characteristics of SSH distributions and the relative frequency of extreme surge events.
This heterogeneity in sampling effectiveness can be attributed to spatial variations in SSH distributions. Some stations, such as Yeosu and Tongyeong, exhibited significant class imbalance due to the limited number of high-SSH events, for which synthetic minority over-sampling techniques like SMOTE were effective in filling sparsely populated upper ranges. In contrast, stations with well-distributed low-SSH events or relatively stable physical dynamics, including Geojedo and Pohang, benefited from centroid-based under-sampling, which helped preserve representative samples while reducing redundancy and noise.
The effectiveness of these sampling strategies is further evidenced by the substantial performance gains achieved without altering the underlying regression model structure. For instance, at Ulsan, the R2 increased from 0.8600 to 0.8712, and at Pohang, it increased from 0.7500 to 0.7984 solely through optimized data balancing. These results suggest that data-level sampling is not merely a preparatory step but a strategic design element in regression-based hydrological modeling. Although certain sampling configurations, such as SMOTE–ENN, produced synthetic concentration patterns or discontinuities near the SSH threshold, the overall model fit was significantly improved through targeted design. Collectively, these findings indicate that appropriate sample composition can serve as a key determinant of predictive accuracy in threshold-sensitive regression models.
While the proposed sampling approach demonstrates clear performance improvements, several limitations should be acknowledged. First, the reliance on synthetic sample generation, such as SMOTE and BorderlineSMOTE, introduces a potential risk of overfitting, particularly in regions with very few high-SSH events. Although these synthetic samples are beneficial for model training, they may distort the true physical distribution of extreme surge events. In addition, certain aggressive under-sampling techniques, including RandomUnderSampler and ClusterCentroids, may inadvertently remove important borderline cases, thereby reducing model sensitivity near the threshold boundary. Second, the study focused on static, station-wise optimization using the “fixed” threshold (SSH = 0.35), which was identified as the most effective threshold value based on the experimental results. While this facilitated controlled analysis, real-world storm surge systems are often dynamic and spatially correlated. Therefore, extending the framework to account for spatiotemporal generalization—for instance, by developing regionalized or adaptive data sampling strategies—would enhance its applicability in operational forecasting. An adaptive thresholding mechanism that responds to changes in baseline surge conditions or data density could further improve robustness and transferability.

5. Conclusions

This study investigated the effects of data preprocessing—specifically storm surge height (SSH) threshold-based over- and under-sampling strategies—on the performance of multiple linear regression models for predicting SSH. By systematically varying the SSH threshold and sampling combinations, the analysis revealed that both the choice of the threshold and the configuration of sampling techniques significantly influenced model accuracy across stations.
The results demonstrated that applying a station-specific sampling strategy led to substantial improvements in predictive performance, with R2 values increasing by up to 0.46 compared with the baseline configuration. These enhancements were achieved without altering the underlying regression structure, underscoring the effectiveness of data-level balancing in threshold-sensitive prediction tasks. Moreover, the optimal sampling combination differed among stations, highlighting the importance of adapting data preprocessing methods to local surge conditions.
Overall, this study shows that appropriate sample composition—guided by informed threshold selection and tailored sampling design—can serve as one of the determinants of predictive accuracy in SSH modeling. These findings provide practical insights for improving regression-based hydrological forecasting systems through strategic data-level interventions.
In future work, we plan to evaluate the effect of various model structures (e.g., nonlinear regression, random forest) and the modification of input variables (e.g., adding parameters that reflect topographic characteristics) on improving model performance. Through this, we aim to identify the most effective approach for further enhancing the predictive capability of the storm surge model.

Supplementary Materials

The following supporting information can be downloaded at: https://www.mdpi.com/article/10.3390/jmse13112173/s1.

Author Contributions

Conceptualization, J.-A.Y. and Y.L.; methodology, J. Yang and Y. Lee; software, Y.L.; validation, Y.L.; formal analysis, Y.L.; investigation, J.-A.Y. and Y.L.; resources, J.-A.Y. and Y.L.; data curation, J.-A.Y. and Y.L.; writing—original draft preparation, J.-A.Y. and Y.L.; writing—review and editing, J.-A.Y. and Y.L.; visualization, J.-A.Y. and Y.L.; supervision, J.-A.Y.; funding acquisition, J.-A.Y. and Y.L. All authors have read and agreed to the published version of the manuscript.

Funding

This research was funded by the Ministry of Science and ICT of the Republic of Korea (grant No. 2022R1C1C2009205), and it was supported by the Basic Science Research Program through the National Research Foundation of Korea (NRF), funded by the Ministry of Education (RS-2023-00249996).

Data Availability Statement

All data and code used in the manuscript are openly available at the Zenodo repository: https://doi.org/10.5281/zenodo.17156709. The repository titled “Storm surge resampling framework code and data” contains all datasets and code necessary to reproduce the results presented in this manuscript.

Acknowledgments

Special thanks to Eunhyeok Hur for his support in compiling the References and Abbreviations.

Conflicts of Interest

The authors declare no conflicts of interest. The funders had no role in the design of the study; in the collection, analyses, or interpretation of data; in the writing of the manuscript; or in the decision to publish the results.

Abbreviations

The following abbreviations are used in this manuscript:
BorderBorderline SMOTE;
CentroidsCluster Centroids;
ENNEdited Nearest Neighbours;
GTSRGlobal Tide and Surge Reanalysis;
IBTrACSInternational Best Track Archive for Climate Stewardship;
MAEMean Absolute Error;
MLRMultiple Linear Regression;
MSEMean Squared Error;
NCEINational Centers for Environmental Information;
NOAANational Oceanic and Atmospheric Administration;
R2Coefficient of Determination;
RMSERoot Mean Square Error;
ROSRandom Over Sampler;
RSMCRegional Specialized Meteorological Centre;
RUSRandom Under Sampler;
SMOTESynthetic Minority Over-Sampling Technique;
SSHStorm Surge Height;
TCWCTropical Cyclone Warning Center;
TomekTomek Links.

Appendix A

Table A1. Lists of typhoons that affected Korea and were defined as such based on their passage through the region from 32° N to 40° N and from 122° E to 132° E.
No.Typhoon NamePminUmaxTyphoon Lifetime
1IRVING95875197987~1979820
2JUDY980501979815~1979827
3KEN991431979830~1979910
4IDA996NaN198075~1980715
5NORRIS1002NaN1980823~1980831
6ORCHID96770198091~1980916
7IKE1006NaN198167~1981617
8JUNE990451981615~1981626
9OGDEN983NaN1981726~198181
10AGNES970551981825~198196
11CLARA1004NaN1981913~1981102
12CECIL97555198281~1982819
13ELLIS955701982817~198294
14FORREST968701983916~1983930
15ALEX1004NaN1984628~198476
16HOLLY965701984812~1984823
17GERALD1002NaN1984814~1984824
18JUNE1002NaN1984825~198493
19HAL996NaN1985611~1985628
20JEFF992451985718~198583
21KIT970701985730~1985817
22LEE98060198588~1985816
23ODESSA985551985819~198592
24PAT965701985824~198592
25BRENDAN980701985925~1985108
26NANCY994451986618~1986627
27VERA960701986813~198692
28ABBY996NaN198699~1986924
29THELMA96078198776~1987718
30ALEX994NaN1987721~198782
31DINAH940851987819~198793
32ELLIS990401989618~1989625
33JUDY970651989720~1989729
34VERA1002NaN1989911~1989919
35OFELIA996NaN1990615~1990626
36ROBYN992401990629~1990714
37ABE996NaN1990822~199093
38CAITLIN945801991718~1991730
39GLADYS975501991813~1991824
40UNNAMED994351991821~1991831
41KINNA96570199198~1991916
42MIREILLE935951991913~1991101
43JANIS965701992730~1992813
44IRVING994401992730~199285
45KENT98050199283~1992820
46POLLY1000NaN1992823~199294
47TED992451992914~1992927
48OFELIA990401993724~1993729
49PERCY980551993725~199381
50ROBYN945851993730~1993814
51YANCY955751993827~199397
52RUSS1004NaN199462~1994612
53WALT992401994711~1994728
54BRENDAN992451994725~199483
55DOUG985481994730~1994813
56ELLIE97065199483~1994819
57FRED1004NaN1994812~1994826
58SETH975551994930~19941016
59FAYE950751995712~1995725
60JANIS990NaN1995817~1995830
61RYAN985601995914~1995925
62EVE980601996710~1996727
63KIRK960751996728~1996818
64PETER975601997615~199774
65TINA975601997721~1997810
66OLIWA970651997828~1997919
67YANNI975551998924~1998102
68NEIL980501999722~1999728
69OLGA975601999726~199985
70PAUL992351999731~199989
71RACHEL1000NaN199985~1999811
72SAM1004NaN1999817~1999827
73WENDY1006NaN1999829~199997
74ZIA990401999911~1999917
75ANN994381999914~1999920
76BART940851999917~1999929
77DAN1012NaN1999101~19991012
78KAI-TAK99435200072~2000712
79BOLAVEN985402000719~200082
80BILIS1001NaN2000817~2000827
81PRAPIROON965702000824~200094
82SAOMAI970602000831~2000919
83XANGSANE1003NaN20001024~2000112
84CHEBI1000NaN2001619~2001625
85RAMMASUN965652002626~200277
86NAKRI996NaN200277~2002713
87FENGSHEN980502002713~2002728
88RUSA960702002822~200293
89KUJIRA1000NaN200348~2003425
90SOUDELOR97560200367~2003624
91MAEMI93590200394~2003916
92MINDULLE984452004621~200475
93NAMTHEUN996402004724~200483
94MEGI970652004813~2004822
95CHABA955802004817~200495
96SONGDA945752004826~2004910
97MEARI975602004918~2004102
98MATSA998NaN2005729~200589
99NABI955752005828~200599
100KHANUN1000NaN200595~2005913
101CHANCHU996NaN200657~2006519
102EWINIAR975602006629~2006712
103WUKONG980452006812~2006821
104SHANSHAN95080200699~2006919
105MAN-YI95570200776~2007723
106USAGI960802007727~200784
107PABUK995NaN200784~2007815
108NARI960752007911~2007918
109WIPHA1005NaN2007914~2007920
110KROSA1010NaN2007101~20071014
111KALMAEGI994NaN2008711~2008724
112LINFA998NaN2009613~2009630
113MORAKOT998NaN200982~2009813
114DIANMU98550201086~2010813
115KOMPASU970702010827~201096
116MALOU992502010831~2010910
117MERANTI1003NaN201096~2010914
118MEARI980552011620~2011627
119MUIFA973632011726~2011815
120KULAP1012NaN201195~2011911
121KHANUN991432012713~2012720
122DAMREY965702012727~201284
123TEMBIN980552012817~201291
124BOLAVEN960652012818~201291
125SANBA940852012910~2012918
126LEEPI1002NaN2013616~2013623
127DANAS965652013101~2013109
128NEOGURI97550201472~2014713
129MATMO994NaN2014716~2014726
130NAKRI980502014727~201484
131FUNG-WONG998352014917~2014925
132VONGFONG975602014101~20141016
133CHAN-HOM973582015629~2015713
134HALOLA99445201576~2015726
135SOUDELOR998352015729~2015812
136GONI945852015813~2015830
137NAMTHEUN994452016830~201695
138MERANTI1004NaN201698~2016917
139CHABA965702016924~2016107
140NANMADOL98555201771~201778
141PRAPIROON965602018627~201875
142JONGDARI992452018723~201884
143LEEPI998402018810~2018815
144SOULIK963732018815~2018830
145KONG-REY975652018927~2018107
146DANAS985432019714~2019723
147FRANCISCO97565201981~2019811
148LINGLING963732019830~2019912
149TAPAH975602019917~2019923
150MITAG988502019924~2019105
151HAGUPIT996NaN2020730~2020812
152JANGMI99640202086~2020814
153BAVI950852020820~2020829
154MAYSAK950802020826~202097
155HAISHEN945852020830~2020910

References

  1. Muis, S.; Verlaan, M.; Winsemius, H.C.; Aerts, J.C.; Ward, P.J. A global reanalysis of storm surges and extreme sea levels. Nat. Commun. 2016, 7, 11969. [Google Scholar] [CrossRef]
  2. IPCC. Climate Change 2021: The Physical Science Basis. Contribution of Working Group I to the Sixth Assessment Report of the Intergovernmental Panel on Climate Change; Cambridge University Press: Cambridge, UK; New York, NY, USA, 2021; pp. 1–2391. [Google Scholar]
  3. Papadopoulos, N.; Gikas, V. Combined Coastal Sea Level Estimation Considering Astronomical Tide and Storm Surge Effects: Model Development and Its Application in Thermaikos Gulf, Greece. J. Mar. Sci. Eng. 2023, 11, 2033. [Google Scholar] [CrossRef]
  4. Antunes, C.; Lemos, G. A probabilistic approach to combine sea level rise, tide and storm surge into representative return periods of extreme total water levels: Application to the Portuguese coastal areas. Estuar. Coast. Shelf Sci. 2025, 313, 109060. [Google Scholar] [CrossRef]
  5. Palmer, K.; Watson, C.S.; Power, H.E.; Hunter, J.R. Quantifying the Mean Sea Level, Tide, and Surge Contributions to Changing Coastal High Water Levels. J. Geophys. Res. Ocean. 2024, 129, e2023JC020737. [Google Scholar] [CrossRef]
  6. Goring, D.G.; Stephens, S.A.; Bell, R.G.; Pearson, C.P. Estimation of Extreme Sea Levels in a Tide-Dominated Environment Using Short Data Records. J. Waterw. Port Coast. Ocean. Eng. 2011, 137, 150–159. [Google Scholar] [CrossRef]
  7. Yang, J.-A.; Kim, S.; Mori, N.; Mase, H. Bias correction of simulated storm surge height considering coastline complexity. Hydrol. Res. Lett. 2017, 11, 121–127. [Google Scholar] [CrossRef]
  8. Yang, J.-A.; Kim, S.; Mori, N.; Mase, H. Assessment of long-term impact of storm surges around the Korean Peninsula based on a large ensemble of climate projections. Coast. Eng. 2018, 142, 1–8. [Google Scholar] [CrossRef]
  9. Yang, J.-A.; Kim, S.; Son, S.; Mori, N.; Mase, H. Correction to: Assessment of uncertainties in projecting future changes to extreme storm surge height depending on future SST and greenhouse gas concentration scenarios. Clim. Chang. 2020, 162, 443–444. [Google Scholar] [CrossRef]
  10. Kim, H.-S.; Lee, S.-W. Storm Surge Caused by the Typhoon “Maemi” in Kwangyang Bay in 2003. J. Korea. Soc. Ocean 2004, 9, 119–129. [Google Scholar]
  11. National Disaster Information Center. Typhoon Maemi’s Damage. Available online: https://web.archive.org/web/20150924093447/http://www.safekorea.go.kr/dmtd/contents/room/ldstr/DmgReco.jsp?q_menuid=&q_largClmy=3 (accessed on 17 September 2025).
  12. Seo, S.N.; Kim, S.I. Storm Surges in West Coast of Korea by Typhoon Bolaven (1215). J. Korean Soc. Coast. Ocean Eng. 2014, 26, 41–48. [Google Scholar] [CrossRef]
  13. Munhwa Broadcasting Corporation. Available online: https://imnews.imbc.com/replay/2016/nw1500/article/4133688_30224.html#:~:text=%EB%8B%AB%EA%B8%B0 (accessed on 17 September 2025). (In Korean).
  14. Yonhap News Agency. Available online: https://science.ytn.co.kr/program/view.php?mcd=0082&key=2020090711443611297#:~:text=%EB%B9%84%EA%B3%B5%EC%8B%9D%20%EA%B8%B0%EB%A1%9D%EC%9D%B4%EC%A7%80%EB%A7%8C%2C%20%EC%A0%9C%EC%A3%BC%20%EC%82%B0%EA%B0%84%EC%97%90%20%ED%95%98%EB%A3%A8,1%2C000mm%EC%9D%98%20%ED%8F%AD%EC%9A%B0%EA%B0%80%20%EC%B2%98%EC%9D%8C%20%EA%B4%80%EC%B8%A1%EB%90%90%EC%8A%B5%EB%8B%88%EB%8B%A4 (accessed on 17 September 2025). (In Korean).
  15. National Fire Agency. Available online: https://www.nfa.go.kr/nfa/news/disasterNews/;jsessionid=nCcZd2oihNduR2POx2RrAiWG.nfa12?boardId=bbs_0000000000001896&mode=view&cntId=161424 (accessed on 17 September 2025).
  16. Tadesse, M.; Wahl, T.; Cid, A. Data-Driven Modeling of Global Storm Surges. Front. Mar. Sci. 2020, 7, 260. [Google Scholar] [CrossRef]
  17. Tian, Q.; Luo, W.; Tian, Y.; Gao, H.; Guo, L.; Jiang, Y. Prediction of storm surge in the Pearl River Estuary based on data-driven model. Front. Mar. Sci. 2024, 11, 1390364. [Google Scholar] [CrossRef]
  18. Ayyad, M.; Hajj, M.R.; Marsooli, R. Machine learning-based assessment of storm surge in the New York metropolitan area. Sci. Rep. 2022, 12, 19215. [Google Scholar] [CrossRef] [PubMed]
  19. Sadler, J.M.; Goodall, J.L.; Morsy, M.M.; Spencer, K. Modeling urban coastal flood severity from crowd-sourced flood reports using Poisson regression and Random Forest. J. Hydrol. 2018, 559, 43–55. [Google Scholar] [CrossRef]
  20. Sun, K.; Pan, J. Model of Storm Surge Maximum Water Level Increase in a Coastal Area Using Ensemble Machine Learning and Explicable Algorithm. Earth Space Sci. 2023, 10, e2023EA003243. [Google Scholar] [CrossRef]
  21. Yang, J.-A.; Lee, Y. Development of a Storm Surge Prediction Model Using Typhoon Characteristics and Multiple Linear Regression. J. Mar. Sci. Eng. 2025, 13, 1655. [Google Scholar] [CrossRef]
  22. Metters, D. (Ed.) Machine Learning to Forecast Storm Surge. Forum of Operational Oceanography, Melbourne. Available online: https://www.researchgate.net/publication/336779021_Machine_learning_to_forecast_storm_surge (accessed on 12 October 2019).
  23. Lee, Y.; Jung, C.; Kim, S. Spatial distribution of soil moisture estimates using a multiple linear regression model and Korean geostationary satellite (COMS) data. Agric. Water Manag. 2019, 213, 580–593. [Google Scholar] [CrossRef]
  24. Korea Hydrographic and Oceanographic Agency. Available online: https://www.khoa.go.kr (accessed on 25 July 2025).
  25. Pawlowicz, R.; Beardsley, B.; Lentz, S. Classical tidal harmonic analysis including error estimates in MATLAB using T-TIDE. Comput. Geosci. 2002, 28, 929–937. [Google Scholar] [CrossRef]
  26. Jensen, C.; Mahavadi, T.; Schade, N.H.; Hache, I.; Kruschke, T. Negative Storm Surges in the Elbe Estuary-Large-Scale Meteorological Conditions and Future Climate Change. Atmosphere 2022, 13, 1634. [Google Scholar] [CrossRef]
  27. Dinápoli, M.G.; Simionato, C.G.; Alonso, G.; Bodnariuk, N.; Saurral, R. Negative storm surges in the Río de la Plata Estuary: Mechanisms, variability, trends and linkage with the Continental Shelf dynamics. Estuar. Coast. Shelf Sci. 2024, 305, 108844. [Google Scholar] [CrossRef]
  28. Kutner, M.H.; Nachtsheim, C.J.; Neter, J. Applied Linear Statistical Models, 5th ed.; McGraw-Hill: Irwin, ID, USA; New York, NY, USA, 2004. [Google Scholar]
  29. He, H.; Garcia, E.A. Learning from imbalanced data. IEEE Tras. Knowl. Data Eng. 2009, 21, 1263–1284. [Google Scholar]
  30. Fernández, A.; García, S.; Galar, M.; Prati, R.C.; Krawczyk, B.; Herrera, F. Learning from Imbalanced Data Sets; Springer: Cham, Switzerland, 2018. [Google Scholar]
  31. Batista, G.E.; Prati, R.C.; Monard, M.C. A study of the behavior of several methods for balancing machine learning training data. ACM SIGKDD Explor. Newsl. 2004, 6, 20–29. [Google Scholar] [CrossRef]
  32. Chawla, N.V.; Bowyer, K.W.; Hall, L.O.; Kegelmeyer, W.P. SMOTE: Synthetic minority over-sampling technique. J. Artif. Intell. Res. 2002, 16, 321–357. [Google Scholar] [CrossRef]
  33. Douzas, G.; Bacao, F.; Last, F. Improving imbalanced learning through a heuristic oversampling method based on k-means and SMOTE. Inf. Sci. 2018, 465, 1–20. [Google Scholar] [CrossRef]
  34. Han, H.; Wang, W.-Y.; Mao, B.-H. (Eds.) Borderline-SMOTE: A new over-sampling method in imbalanced data sets learning. In International Conference on Intelligent Computing; Springer: Berlin/Heidelberg, Germany, 2005. [Google Scholar]
  35. LemaÃŽtre, G.; Nogueira, F.; Aridas, C.K. Imbalanced-learn: A python toolbox to tackle the curse of imbalanced datasets in machine learning. J. Mach. Learn. Res. 2017, 18, 1–5. [Google Scholar]
  36. Mani, I.; Zhang, I. (Eds.) kNN approach to unbalanced data distributions: A case study involving information extraction. In Proceedings of the Workshop on Learning from Imbalanced Datasets; ICML: Washington, UT, USA, 2003. [Google Scholar]
  37. Tomek, I. Two modifications of CNN. IEEE Trans. Syst. Man Cybern. 1976, SMC-6, 769–772. [Google Scholar]
  38. Wilson, D.L. Asymptotic properties of nearest neighbor rules using edited data. IEEE Trans. Syst. Man Cybern. 1972, SMC-2, 408–421. [Google Scholar] [CrossRef]
  39. Santhi, C.; Arnold, J.G.; Williams, J.R.; Dugas, W.A.; Srinivasan, R.; Hauck, L.M. Validation of the swat model on a large rwer basin with point and nonpoint sources 1. J. Am. Water Resour. Assoc. 2001, 37, 1169–1188. [Google Scholar] [CrossRef]
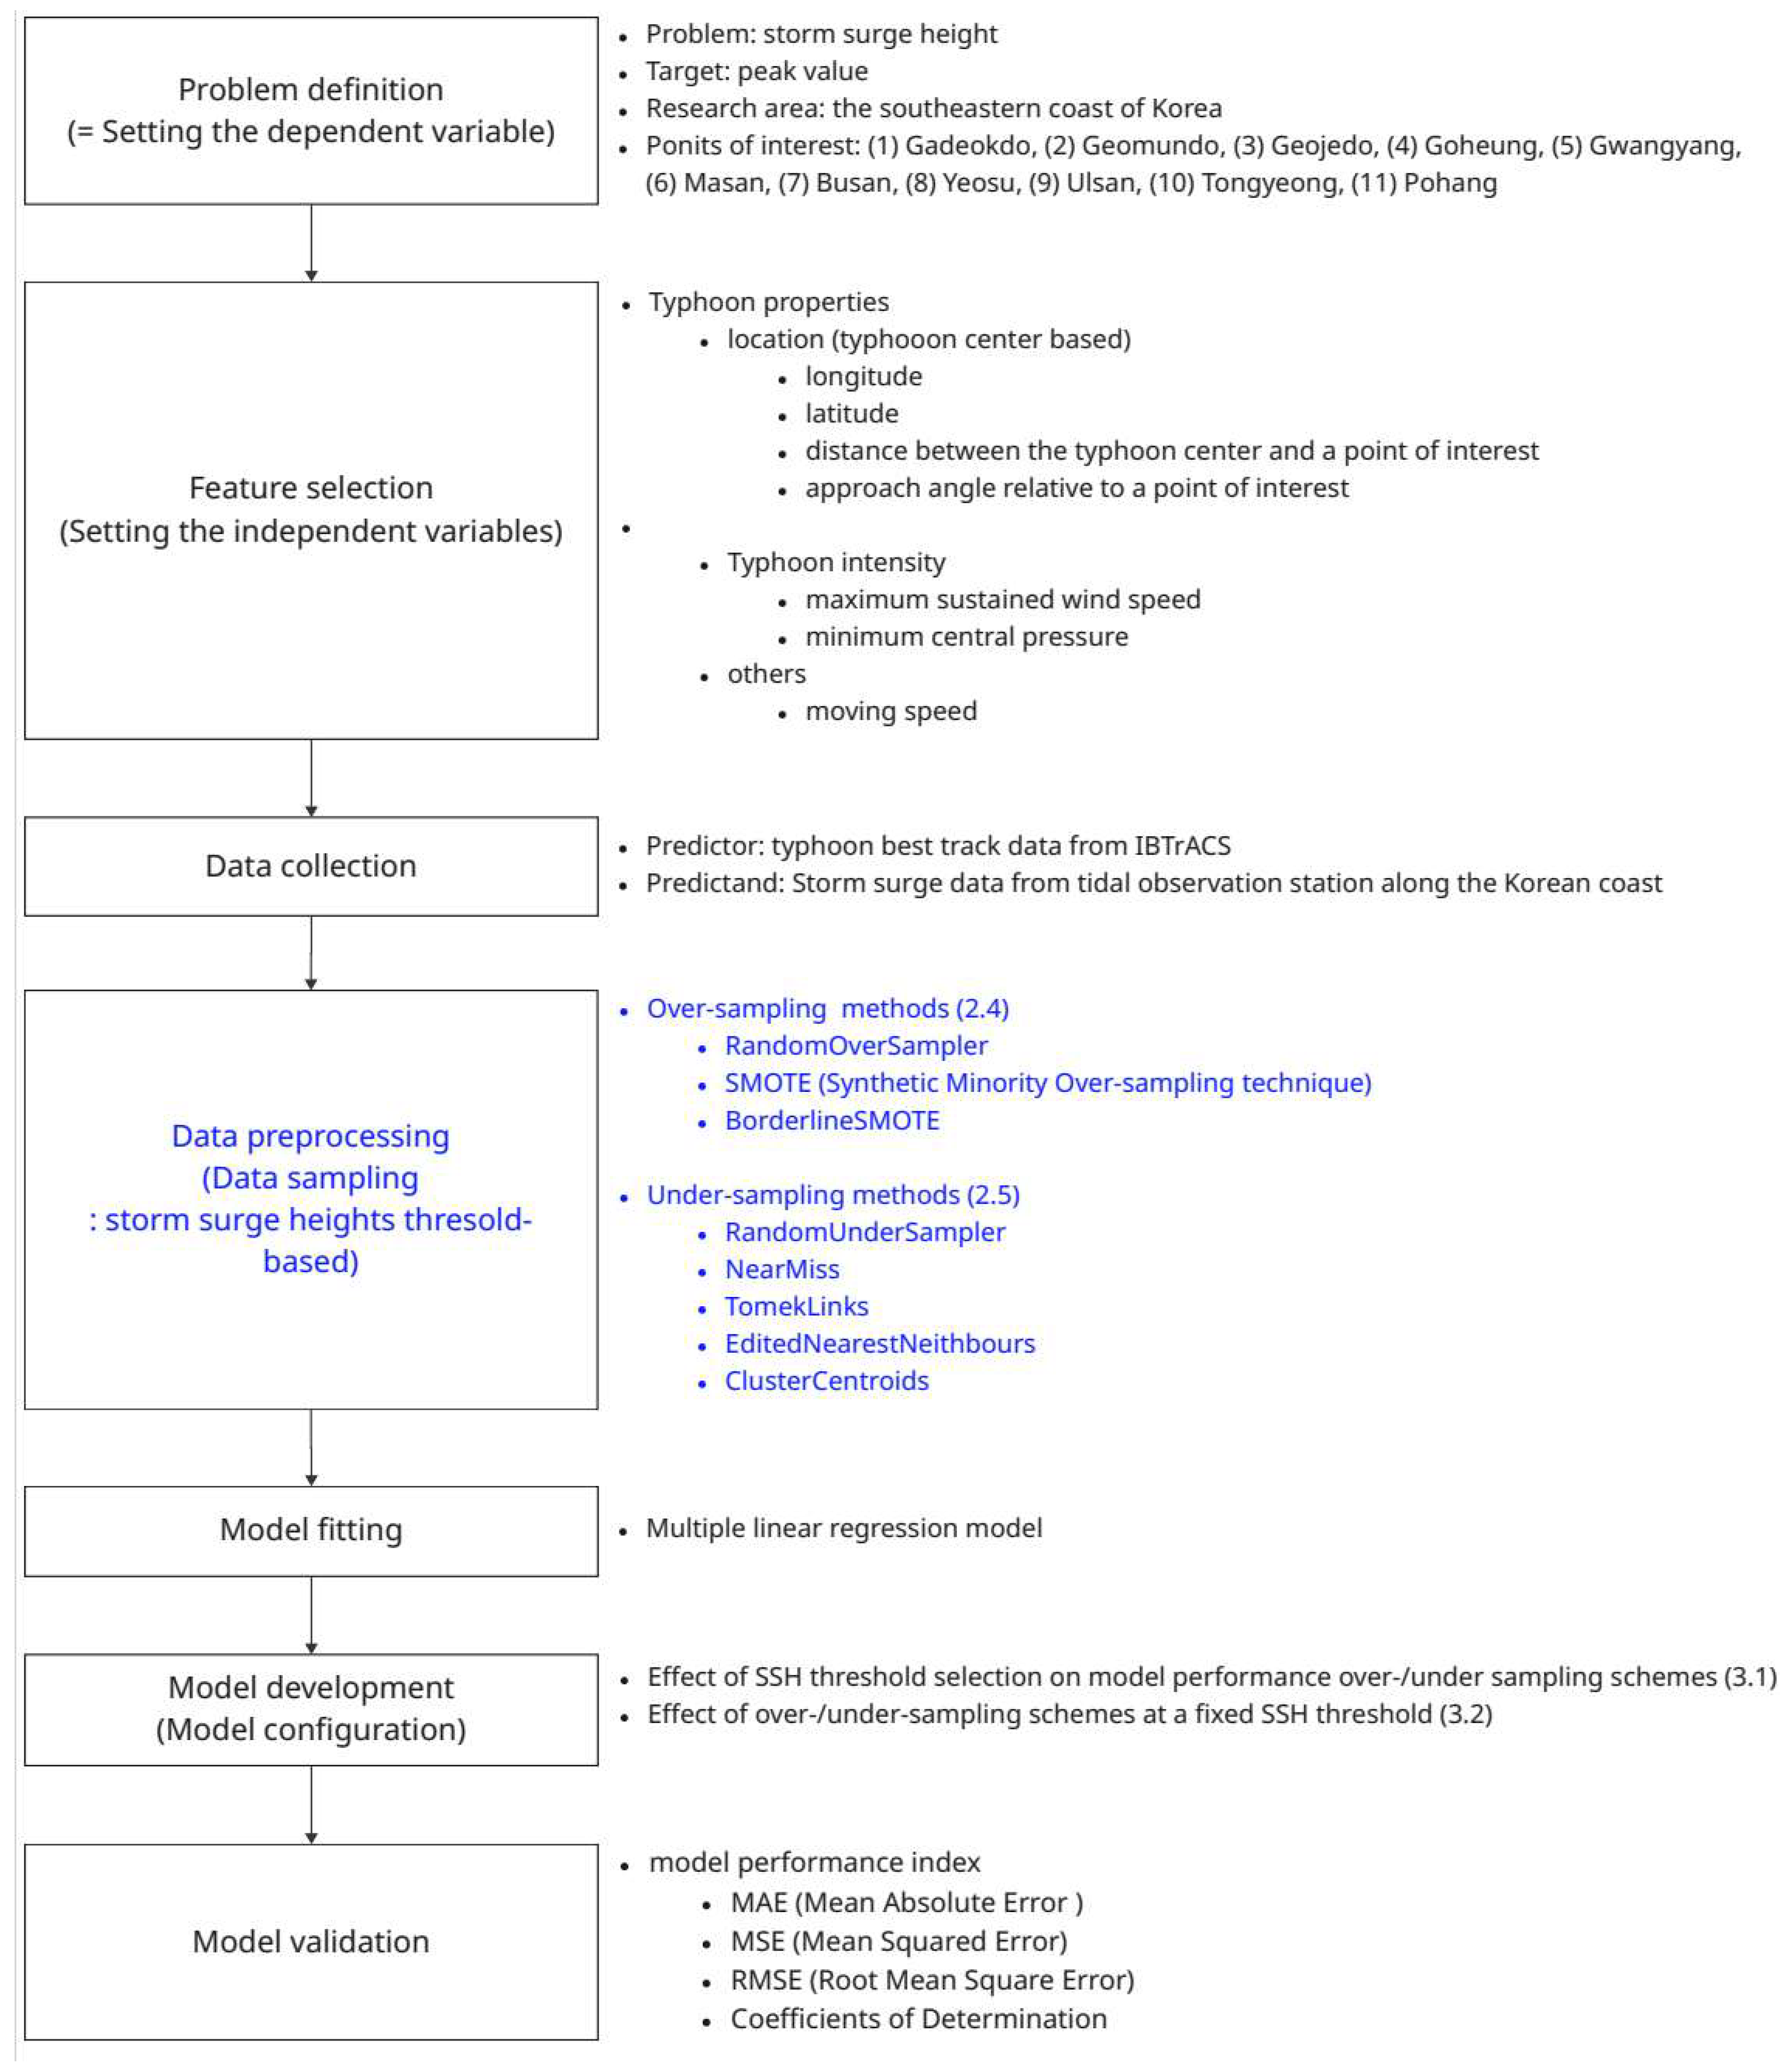
Figure 1. Workflow of the present study. The blue text highlights the unique features of this study compared with the previous study [21].
Jmse 13 02173 g001
Figure 2. (a) Study area; (b) location of tide gauge stations within the study area (from [21]).
Jmse 13 02173 g002
Figure 3. Typhoon tracks that passed through the region bounded by latitudes 32°N to 40° and longitudes 122°E to 132°E (the blue rectangular area) during the period from 1979 to 2020 were defined as those that affecting the Korean Peninsula (from [21]).
Jmse 13 02173 g003
Figure 4. Boxplots of the test R2 values for regression models under varying storm-surge-height (SSH) thresholds using random sampling methods (ROS and RUS). The boxes show the distribution of model performance across all stations, where the central line indicates the median, the “×” marks the mean value, and the whiskers represent the 1.5 × IQR range.
Jmse 13 02173 g004
Figure 5. Scatter plots illustrating model performance for each tidal station. Panels represent the following stations: (a) Gadeokdo, (b) Geomundo, (c) Geojedo, (d) Goheung, (e) Gwangyang, (f) Masan, (g) Busan, (h) Yeosu, (i) Ulsan, (j) Tongyeong, (k) Pohang, and (l) Total (combined dataset from all stations).
Jmse 13 02173 g005
Figure 6. Boxplots of the test R2 values for models trained using nine different combinations of over- and under-sampling techniques. Each box represents the distribution of model performance across all stations for a given sampling combination, where the central line denotes the median, the “×” indicates the mean value, and the whiskers correspond to the 1.5 × IQR range. The open circles represent outliers beyond the whisker range.
Jmse 13 02173 g006
Figure 7. Scatter plots of predicted versus observed storm surge heights under different combinations of over- and under-sampling techniques: (a) Random/Centroids, (b) Random/ENN, (c) Random/NearMiss, (d) Random/Random, (e) Random/Tomek Links, (f) Border/ENN, (g) Border/Random, (h) SMOTE ENN, and (i) SMOTE/Random.
Jmse 13 02173 g007
Figure 8. Scatter plots of predicted versus observed storm surge heights using the best-performing combination of over- and under-sampling techniques for each station. The sampling combinations used are as follows: (a) Gadeokdo–Random/Random, (b) Geomundo–Random/Random, (c) Geojedo–Random/Centroids, (d) Goheung–Border/ENN, (e) Gwangyang–Random/NearMiss, (f) Masan–Border/Random, (g) Busan–Border/ENN, (h) Yeosu–SMOTE/ENN, (i) Ulsan–Random/Centroids, (j) Tongyeong–SMOTE/ENN, (k) Pohang–Random/Centroids, and (l) Total (all stations combined)–SMOTE/ENN.
Jmse 13 02173 g008
Table 1. Coordinates of the designated points.
Point NameLongitude [°]Latitude [°]
Geomundo127.30888934.02833
Goheung127.34277834.48111
Yeosu129.38722235.50194
Gwangyang127.75472234.90361
Tongyeong128.43472234.82778
Masan128.58888935.21
Geojedo128.69916734.80139
Gadeokdo128.81083335.02417
Busan129.03527835.09639
Ulsan127.76583334.74722
Pohang129.38388936.04722
Table 2. Test R2 values of models under varying storm surge height (SSH) thresholds with under- and over-sampling strategies. The “Total” row represents the R2 value derived using the combined dataset from all stations.
StationStorm Surge Height Threshold [m]
0.20.250.30.350.4
Geomundo0.39270.47410.55260.62460.6164
Goheung0.55590.64640.94350.65560.9687
Yeosu0.3920.51640.5610.49050.5494
Gwangyang0.64420.82930.6990.80830.7436
Tongyeong0.46030.54240.50360.59850.6365
Masan0.3330.26950.85620.85970.8457
Geojedo0.69670.75850.57120.77750.698
Gadeokdo0.55020.59870.67160.79420.7854
Busan0.52950.63070.7130.69010.7799
Ulsan0.63430.66930.54890.85930.7388
Pohang0.55120.71370.79040.74690.9318
Total0.43550.49650.57080.58080.6255
Table 3. R2 values of models by combinations of over- and under-sampling techniques. The R2 value reported in the “Total” row corresponds to the model trained on the combined dataset across all stations.
StationSampling Techniques (Over Sampling Technique–Under Sampling Technique)
ROS–CentroidsROS–ENNROS–NearMissROS–RUSROS–TomekBorder–ENN Border–RUS SMOTE–ENNSMOTE–RUS
Geomundo0.53680.59560.27180.62460.58470.62020.59600.60780.5960
Goheung0.66410.76920.43060.65560.76670.82350.65520.78920.6552
Yeosu0.46110.55950.21250.49050.54890.58490.49770.59080.4977
Gwangyang0.89600.82260.90590.80830.81990.84000.73600.83570.7360
Tongyeong0.52340.59790.16490.59850.58790.64040.58130.64130.5813
Masan0.63290.78170.43530.85970.77240.82170.87700.80270.8770
Geojedo0.95990.81960.95100.77750.81670.83870.60820.83500.6082
Gadeokdo0.62760.70760.29980.79420.69780.73880.78600.71880.7860
Busan0.65130.69830.39900.69010.69100.72100.69740.71610.6974
Ulsan0.87120.62880.35180.85930.62830.66470.82660.65710.8266
Pohang0.79840.75340.32240.74690.75100.77900.75090.78010.7509
Total0.48940.56140.08020.58080.55340.56910.56810.58700.5681
Disclaimer/Publisher’s Note: The statements, opinions and data contained in all publications are solely those of the individual author(s) and contributor(s) and not of MDPI and/or the editor(s). MDPI and/or the editor(s) disclaim responsibility for any injury to people or property resulting from any ideas, methods, instructions or products referred to in the content.