Article

Vulnerability of Black Sea Mesozooplankton to Anthropogenic and Climate Forcing

1
Ecology and Marine Biology Department, National Institute for Marine Research and Development “Grigore Antipa”, 300 Mamaia Blvd., 900581 Constanta, Romania
2
Chemical Oceanography and Marine Pollution Department, National Institute for Marine Research and Development “Grigore Antipa”, 300 Mamaia Blvd., 900581 Constanta, Romania
*
Author to whom correspondence should be addressed.
J. Mar. Sci. Eng. 2025, 13(11), 2151; https://doi.org/10.3390/jmse13112151
Submission received: 6 October 2025 / Revised: 11 November 2025 / Accepted: 12 November 2025 / Published: 13 November 2025
(This article belongs to the Section Marine Biology)

Abstract

Mesozooplankton are pivotal for Black Sea food webs, yet they are highly vulnerable to hydrographic variability, eutrophication, and human pressures. This study analysed mesozooplankton dynamics along the Romanian coast (2013–2020) across three sectors (north, central, and south) and two distinct periods (cold and warm seasons), integrating Abundance–Biomass Comparison (ABC) curves with Fuzzy Cognitive Mapping (FCM). Results revealed a clear disturbance gradient: the Danube-influenced north supported high abundances of small-bodied taxa; the central sector maintained the most resilient and functionally diverse assemblages; and the southern sector showed chronic degradation with Noctiluca scintillans dominance. ABC curves quantified disturbance, with curve convergence in the north and near overlap in the south during summer, while FCM highlighted network simplification and reduced functional redundancy. Climate scenario simulations projected further declines in cladocerans and meroplankton under warming and freshening, whereas copepods showed relative resilience. Collectively, the findings demonstrate progressive simplification of mesozooplankton and declining energy transfer efficiency, underscoring the need to integrate zooplankton-based indicators into Black Sea monitoring and management frameworks.

1. Introduction

Mesozooplankton, the 0.2–20 mm size fraction of zooplankton [1], play a fundamental role in marine pelagic ecosystems by transferring energy and organic matter from primary producers to higher trophic levels, including small pelagic fish, jellyfish, seabirds, and marine mammals [1,2,3]. This group encompasses both holoplanktonic taxa (e.g., copepods, cladocerans) and meroplanktonic forms (e.g., larval stages of benthic invertebrates and fish), which collectively contribute to essential ecosystem processes such as nutrient recycling, grazing regulation, and carbon export through vertical migration [1,3,4]. Their rapid life cycles, sensitivity to environmental fluctuations, and wide ecological niches make mesozooplankton reliable indicators of ecosystem variability and disturbance [2,3,5,6,7,8,9].
In marine monitoring frameworks, particularly under the EU Marine Strategy Framework Directive (MSFD) and Water Framework Directive (WFD), zooplankton has gained recognition as a key indicator for assessing Good Environmental Status. Community-level metrics of zooplankton abundance, biomass, and functional composition provide valuable insights into food web integrity (Descriptor 4) and eutrophication status (Descriptor 5). Beyond these established links, zooplankton also hold substantial relevance for Descriptor 1 (Biodiversity) and Descriptor 2 (Non-indigenous Species) of MSFD. Their high sensitivity to environmental fluctuations, short generation times, and central position in food webs make them reliable indicators of ecosystem responses to both natural and anthropogenic pressures [2,3,5,6,7,8,9]. Variations in species diversity and community composition can reflect broader biodiversity trends, while the occurrence of non-indigenous taxa can serve as early warning signals of ecological imbalance and biological invasion. Emphasising these cross-descriptor roles enhances the integration of zooplankton-based indicators into ecosystem-based assessments and supports a more holistic understanding of marine environmental status and management needs.
The Black Sea, a semi-enclosed basin with restricted exchange with the global ocean, presents a unique natural laboratory for studying planktonic community dynamics. Its pronounced vertical stratification—an oxic surface layer overlying a deep anoxic zone—combined with strong freshwater inflows and nutrient inputs from major rivers such as the Danube, generates sharp environmental gradients in salinity, temperature, and nutrient availability [10,11,12]. These gradients, amplified by human-induced pressures such as eutrophication, pollution, and coastal development [6,13,14,15,16,17,18,19,20], have a strong influence on mesozooplankton structure and productivity. Understanding how mesozooplankton respond to these spatial and temporal variations is essential for evaluating the ecological status of the basin and anticipating climate-driven changes in the pelagic domain [3,5,21].
Despite extensive regional monitoring, integrative analyses that combine structural community indicators with systemic modelling approaches remain scarce for the Black Sea. Few studies have jointly assessed mesozooplankton disturbance patterns alongside simulations of environmental drivers and climate scenarios [22,23,24,25]. Addressing this gap, the present study analyses eight years (2013–2020) of mesozooplankton data from the Romanian Black Sea coast to (i) assess spatial and cold and warm changes in community structure and disturbance levels using Abundance-Biomass Comparison (ABC) curves, (ii) explore causal relationships between functional groups and environmental variables through Fuzzy Cognitive Mapping (FCM), and (iii) simulate potential responses to climate-induced shifts in temperature and salinity.
By integrating quantitative and cognitive modelling approaches, this research provides a novel, ecosystem-based framework for evaluating multiple stressors in coastal planktonic systems. The results contribute to improving indicator-based assessments within the MSFD context, particularly under Descriptor 4 (Food Webs) and Descriptor 5 (Eutrophication), and enhance understanding of the processes shaping mesozooplankton communities—critical sentinels of marine ecosystem functioning and resilience.

2. Materials and Methods

2.1. Study Area and Sampling Design

This study was conducted along the Romanian Black Sea coastline, covering a latitudinal (north–south) gradient subdivided into three distinct sectors: North (N), Central (C), and South (S) (Figure 1). These sectors were delineated based on latitude and the degree of natural vs. anthropogenic influence. The northern sector is characterised by strong hydrological and nutrient input from the Danube River, resulting in dynamic salinity regimes and elevated primary productivity [12].
The central sector includes the Constanța metropolitan area and port complex and therefore experiences notable anthropogenic influence from urban, industrial, and maritime activities, although its offshore waters maintain relatively stable physicochemical conditions [26]. The southern sector is likewise subject to multiple human pressures, including coastal urbanisation, industrial discharges, shipping traffic, and intensive tourism [14,15,18,27]. Freshening along the Romanian Black Sea coast is driven by the Danube River discharge, which lowers surface salinity to 10–14‰ in the northern sector, compared with 16–18‰ in the central and southern areas. This represents a north–south salinity gradient of about 6–8‰, depending on seasonal discharge and mixing intensity [28,29,30].
Sampling was carried out across all three sectors over eight years (2013–2020) to capture interannual variability. Data were seasonally grouped into two main periods: the cold season (typically winter–spring: November to April) and the warm season (summer–autumn: May to October) [8,9,31]. This approach allowed for the analysis of shifts between the cold and warm seasons in mesozooplankton structure and environmental conditions.

2.2. Sampling and Analysis

At each station, concurrent sampling of environmental parameters and biological communities was conducted to enable an integrated characterisation of ecosystem structure and functioning. A total of 533 mesozooplankton samples and 388 water samples for the analysis of physicochemical parameters were collected from 45 monitoring stations, encompassing all sectors of the Romanian Black Sea coast. These samples were distributed across the northern, central, and southern sectors, as detailed in Table 1, which summarises the sampling effort by year and season. The difference between the number of mesozooplankton (n = 533) and hydrochemical (n = 388) samples reflects the depth-stratified sampling design applied to the biological component. Mesozooplankton were collected from discrete depth layers using vertical hauls of a plankton net to capture vertical variability in community composition. Hydrochemical parameters were measured only in surface waters. For subsequent analyses, mesozooplankton data from individual depth layers were depth-integrated to obtain a representative profile of the entire water column and to ensure comparability with surface environmental variables, which exert a major influence on upper-layer plankton productivity in the study area.
Mesozooplankton samples were collected using standard vertical tows with a 150 μm mesh Juday plankton net, conducted from different depth strata depending on local bathymetry, to ensure representation of the entire water column. For subsequent analysis, data from the various depth layers were integrated to obtain depth-composite values for each station. Each haul was performed vertically at a constant retrieval speed (~0.5 m/s) to ensure representative sampling across the water column. The volume of filtered water was estimated using a calibrated flowmeter mounted at the net mouth [32].
Samples were preserved in seawater with a final formaldehyde concentration of approximately 4%, using a commercially pre-buffered formaldehyde solution to prevent acidification and maintain the morphological integrity of planktonic organisms. This concentration and procedure are standard for mesozooplankton preservation and ensure reliable long-term sample stability. In the laboratory, mesozooplankton were identified under an Olympus SZX10 stereomicroscope to the lowest practicable taxonomic level. Abundance was calculated and standardised as individuals per cubic metre (ind/m3). Biomass was estimated from species abundance using individual wet weights from Petipa [33], yielding calculated wet biomass values. All biomass values were expressed as milligrams per cubic metre (mg/m3) [32].
For ecological analysis, mesozooplankton taxa were assigned to five size classes based on their characteristic body length ranges to support abundance–biomass comparisons (ABC curves). The classification was size-based, while functional group identity (e.g., copepods, cladocerans, meroplankton, other groups, non-fodder) was considered separately for ecological interpretation. Copepoda, including representatives of Calanoida, Cyclopoida, and Harpacticoida, generally occupied the small to medium size classes (0.5–2 mm). Cladocera comprised typical coastal genera such as Penilia, Evadne, Pleopis, and Pseudevadne, which mainly belonged to the small size class (<1 mm) and contributed more to abundance than to biomass. Meroplankton included larval stages of benthic invertebrates and fish, spanning a broad size range depending on developmental stage. The heterotrophic dinoflagellate N. scintillans was considered as the non-fodder component due to its distinctive trophic mode and large cell size relative to most mesozooplankton. Finally, an “other groups” category included Chaetognatha (several millimetres to >1 cm) and Appendicularia (1–2 mm). This size-based classification follows approaches commonly applied in ecological assessments of Black Sea mesozooplankton [7,8,9,31,34] and provides a robust basis for interpreting ABC curves.
Temperature and salinity were measured using a combination of classical and modern approaches, including reversible thermometers and a CastAway CTD multiparameter probe (SonTek CastAway-CTD, San Diego, CA, USA). Dissolved oxygen concentrations were determined by the Winkler titration method, following standard oceanographic procedures, while dissolved nutrient concentrations were analysed according to standardised seawater protocols [35], employing spectrophotometric methods widely validated in marine chemistry laboratories.
For nitrates, we applied the reduction method of Mullin and Riley (1955) [36], in which nitrate is converted to nitrite with hydrazine sulphate, then diazotised with sulphanilamide in acidic solution. The resulting compound couples with N-(1-naphthyl)ethylenediamine dihydrochloride to form an azo dye, whose intensity was measured spectrophotometrically. Ammonium was quantified using the indophenol blue method [35], where ammonia reacts with hypochlorite under alkaline conditions to form monochloramine, which in the presence of phenol, nitroprusside, and excess hypochlorite produces a stable blue complex.
Phosphates were determined via the molybdenum blue reaction [35], in which phosphate ions form a phosphomolybdenum complex that is subsequently reduced to an intensely blue compound; absorbance was read at 885 nm. A similar procedure was applied for silicates, which react with ammonium molybdate to form a silicomolybdenum complex that, when reduced with ascorbic acid, yields a blue-coloured product measurable at 810 nm.

2.3. Data Analysis

Variability was examined in Statistica software version 14.0.1 [37] using variability plots, which displayed the range, mean values, and individual data points across sectors and seasons. Boxplots were also generated in Statistica software version 14.0.1 [37] to illustrate the variability of mesozooplankton group abundance and biomass across sectors and seasons. Abundance and biomass were analysed separately to distinguish between the numerical dominance of small-bodied taxa and biomass contributions of larger-bodied forms.
Spatial and cold–warm season variations in mesozooplankton abundance and biomass were analysed by sector and season using species-level data. Mean values were log-transformed and visualised as shaded plots in PRIMER 7 [38] to highlight gradients and dominance patterns across sectors and seasons.
To test for differences in environmental variables and mesozooplankton parameters among cold and warm seasons and sectors, an ANOSIM (Analysis of Similarities) was performed using the PRIMER v7 software [38]. The analysis was based on Bray–Curtis similarity matrices calculated from the environmental variables and from mesozooplankton abundance and biomass data. The ANOSIM R statistic ranges from −1 to 1, where values close to 1 indicate strong separation between groups, values near 0 indicate little to no separation, and negative values indicate greater dissimilarity within groups than between groups (i.e., reversed structure). Statistical significance was assessed using 999 permutations.
The Abundance–Biomass Comparison (ABC) method was applied to evaluate levels of ecological disturbance in mesozooplankton. Within PRIMER 7 [38], taxa were ranked in descending order of biomass, and cumulative dominance curves for both abundance and biomass were generated on a shared scale (0–100%). In systems with low disturbance, biomass is concentrated in a few large-bodied, long-lived species, resulting in the biomass curve lying above the abundance curve [39]. By contrast, in disturbed systems dominated by opportunistic small-bodied taxa, the curves converge or even cross, reflecting a shift in community structure.
For this study, ABC curves were constructed in PRIMER [38] separately for each sector (north, central, south) and each season (cold and warm) for the total zooplankton abundance and biomass. The software calculated cumulative dominance values and produced standardised plots, enabling direct visual comparison of disturbance gradients between spatial sectors and warm and cold seasons. This approach provided a robust and objective assessment of community conditions under varying environmental and anthropogenic stress regimes. To complement the graphical interpretation, PRIMER also computes the W-statistic, which quantifies the degree of separation between biomass and abundance curves. Positive W-values indicate communities dominated by large-bodied taxa (low disturbance), values near zero reflect transitional states (moderate disturbance), and negative values reveal dominance by small-bodied taxa (high disturbance) [40,41].
Before analysis, data normality and homogeneity of variance were evaluated using the Shapiro–Wilk test. As is typical for ecological datasets, several variables deviated from normality due to ecologically meaningful outliers such as bloom events or episodic nutrient inputs. These values were retained because they reflect genuine ecosystem responses rather than measurement errors.
Pearson’s correlation was applied to quantify the direction and strength of relationships between environmental parameters and mesozooplankton metrics. This method was chosen to preserve effect magnitude, as Fuzzy Cognitive Mapping (FCM) requires continuous, weighted relationships that represent the intensity of interactions among variables. The correlations were used exploratorily to guide model construction rather than for hypothesis testing; hence, Type I error correction was not required.
To investigate functional relationships between environmental drivers and mesozooplankton groups, FCM was implemented as a semi-quantitative modelling tool in Mental Modeller. Separate cold and warm season models included mesozooplankton and major environmental variables (e.g., temperature, salinity, oxygen, nitrate, nitrite, ammonia). Relationships (edges) were established based on significant correlations (Pearson’s r, p < 0.05) and expert knowledge, with each assigned a sign (positive or negative) and a weight between −1 and +1 to indicate interaction strength [22,23,42,43,44]. The resulting networks provided insights into the structure and seasonal dynamics of the mesozooplankton community under varying environmental conditions.
To ensure robustness, only correlations consistent with ecological knowledge and validated through expert consensus were retained in the final FCM network. This procedure minimised the inclusion of spurious relationships and emphasised biologically meaningful connections.
Redundancy Analysis (RDA) was used to examine the relationships between mesozooplankton functional groups and environmental variables across seasons and sectors. Analyses were performed in STATISTICA 14, and significance was tested using Wilks’ λ and Chi-square (χ2) statistics. Separate RDAs were run for the northern, central, and southern sectors during the cold and warm seasons. The results, expressed as canonical correlations and explained variance, quantified the strength of environmental control and were compared with FCM outputs to ensure consistency between statistical and causal models.
To evaluate the potential impact of future environmental changes, particularly those associated with climate change, three hypothetical scenarios were simulated for the warm season using the scenario analysis tool in Mental Modeller. These scenarios were developed based on Intergovernmental Panel on Climate Change (IPCC) projections for the Black Sea region (IPCC WGII, 2014) [45] and focused on variations in sea surface temperature and salinity (Table 2).
Each scenario simulated the relative response of mesozooplankton groups (e.g., increase, decrease, no change) based on the structure of the seasonal FCM. These qualitative simulations were used to forecast vulnerabilities in community structure and assess the functional implications for coastal food webs.

3. Results

3.1. Hydrographic and Nutrient Conditions

Pronounced hydrographic variability was evident between cold and warm seasons across all Romanian coastal sectors (Table 3). Temperature ranged from 6 to 10 °C in winter to 20–26 °C in summer, with the steepest gradients in the central and southern areas under stronger stratification. Salinity remained relatively stable in winter (15–17‰) but decreased in summer, particularly in the north (<14‰) under Danube influence, while the central and southern sectors showed slightly higher yet still reduced values (Table 3).
Dissolved oxygen concentrations were elevated in winter–spring (>300 µM) and declined in summer (250–300 µM), especially in the south, reflecting stratified and productive conditions. Nutrient patterns showed clear seasonality: mean silicate and phosphate concentrations were higher in winter due to enhanced riverine inputs, whereas nitrate concentrations were generally higher during the warm season across all sectors, with particularly elevated values in the northern and central regions. This pattern likely reflects enhanced remineralisation, local regeneration processes, and anthropogenic inputs during summer. Reduced nitrogen forms (NH4+, NO2) increased in summer, particularly in the north, indicating contributions from Danube inflows and benthic release under hypoxic conditions (Table 3).
Hydrographic and nutrient parameters thus revealed strong seasonal contrasts, driven mainly by riverine influence in the north and anthropogenic pressures in the south.

3.2. Mesozooplankton Community and Spatial–Seasonal Patterns

N. scintillans was recorded in all sectors, with notable differences between the cold and warm seasons and spatial variability (Figure 2). Cold-season levels were consistently reduced across all regions, while during the warm season, N. scintillans exhibited a pronounced increase along the entire coast, with maximum abundance and biomass recorded in the northern sector. The observed seasonal pattern indicates that N. scintillans proliferation is stimulated by elevated temperatures and nutrient enrichment during summer, particularly in the northern region influenced by riverine inputs and stratified conditions that enhance localised eutrophication processes.
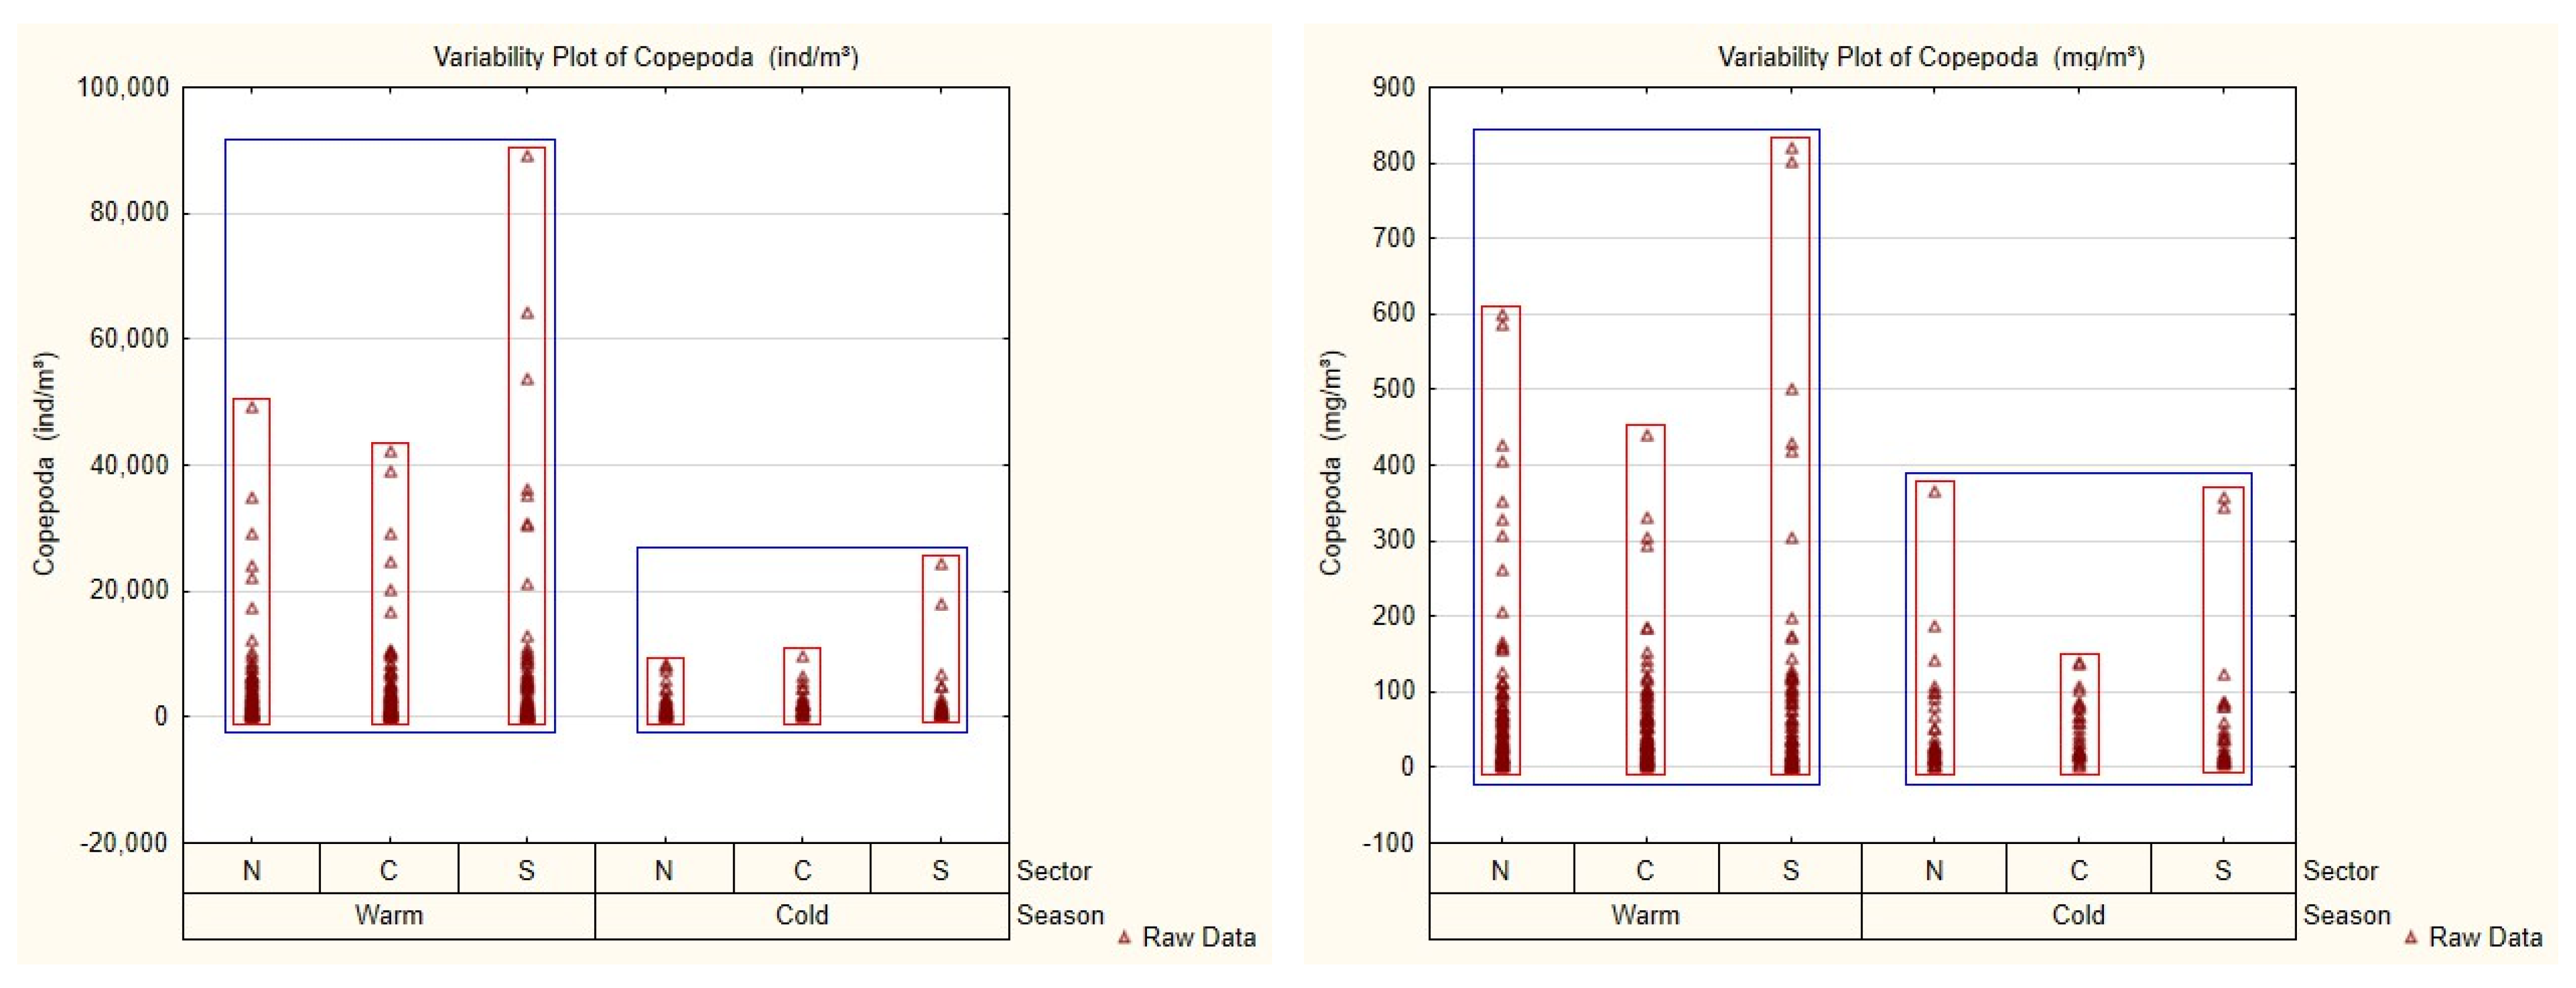
Copepoda dominated the mesozooplankton community throughout the study area, showing clear seasonal and spatial variability (Figure 3). During the warm season, copepod abundance and biomass reached their highest levels across, with maximum values recorded in the southern sector, followed by the north and central sectors. This pattern indicates favourable thermal and trophic conditions that support high copepod productivity in summer. In contrast, cold-season values were consistently lower, reflecting reduced primary productivity and weaker water column stratification. Despite these seasonal differences, copepods remained the principal component of the mesozooplankton community in all sectors, contributing substantially to total abundance and biomass.
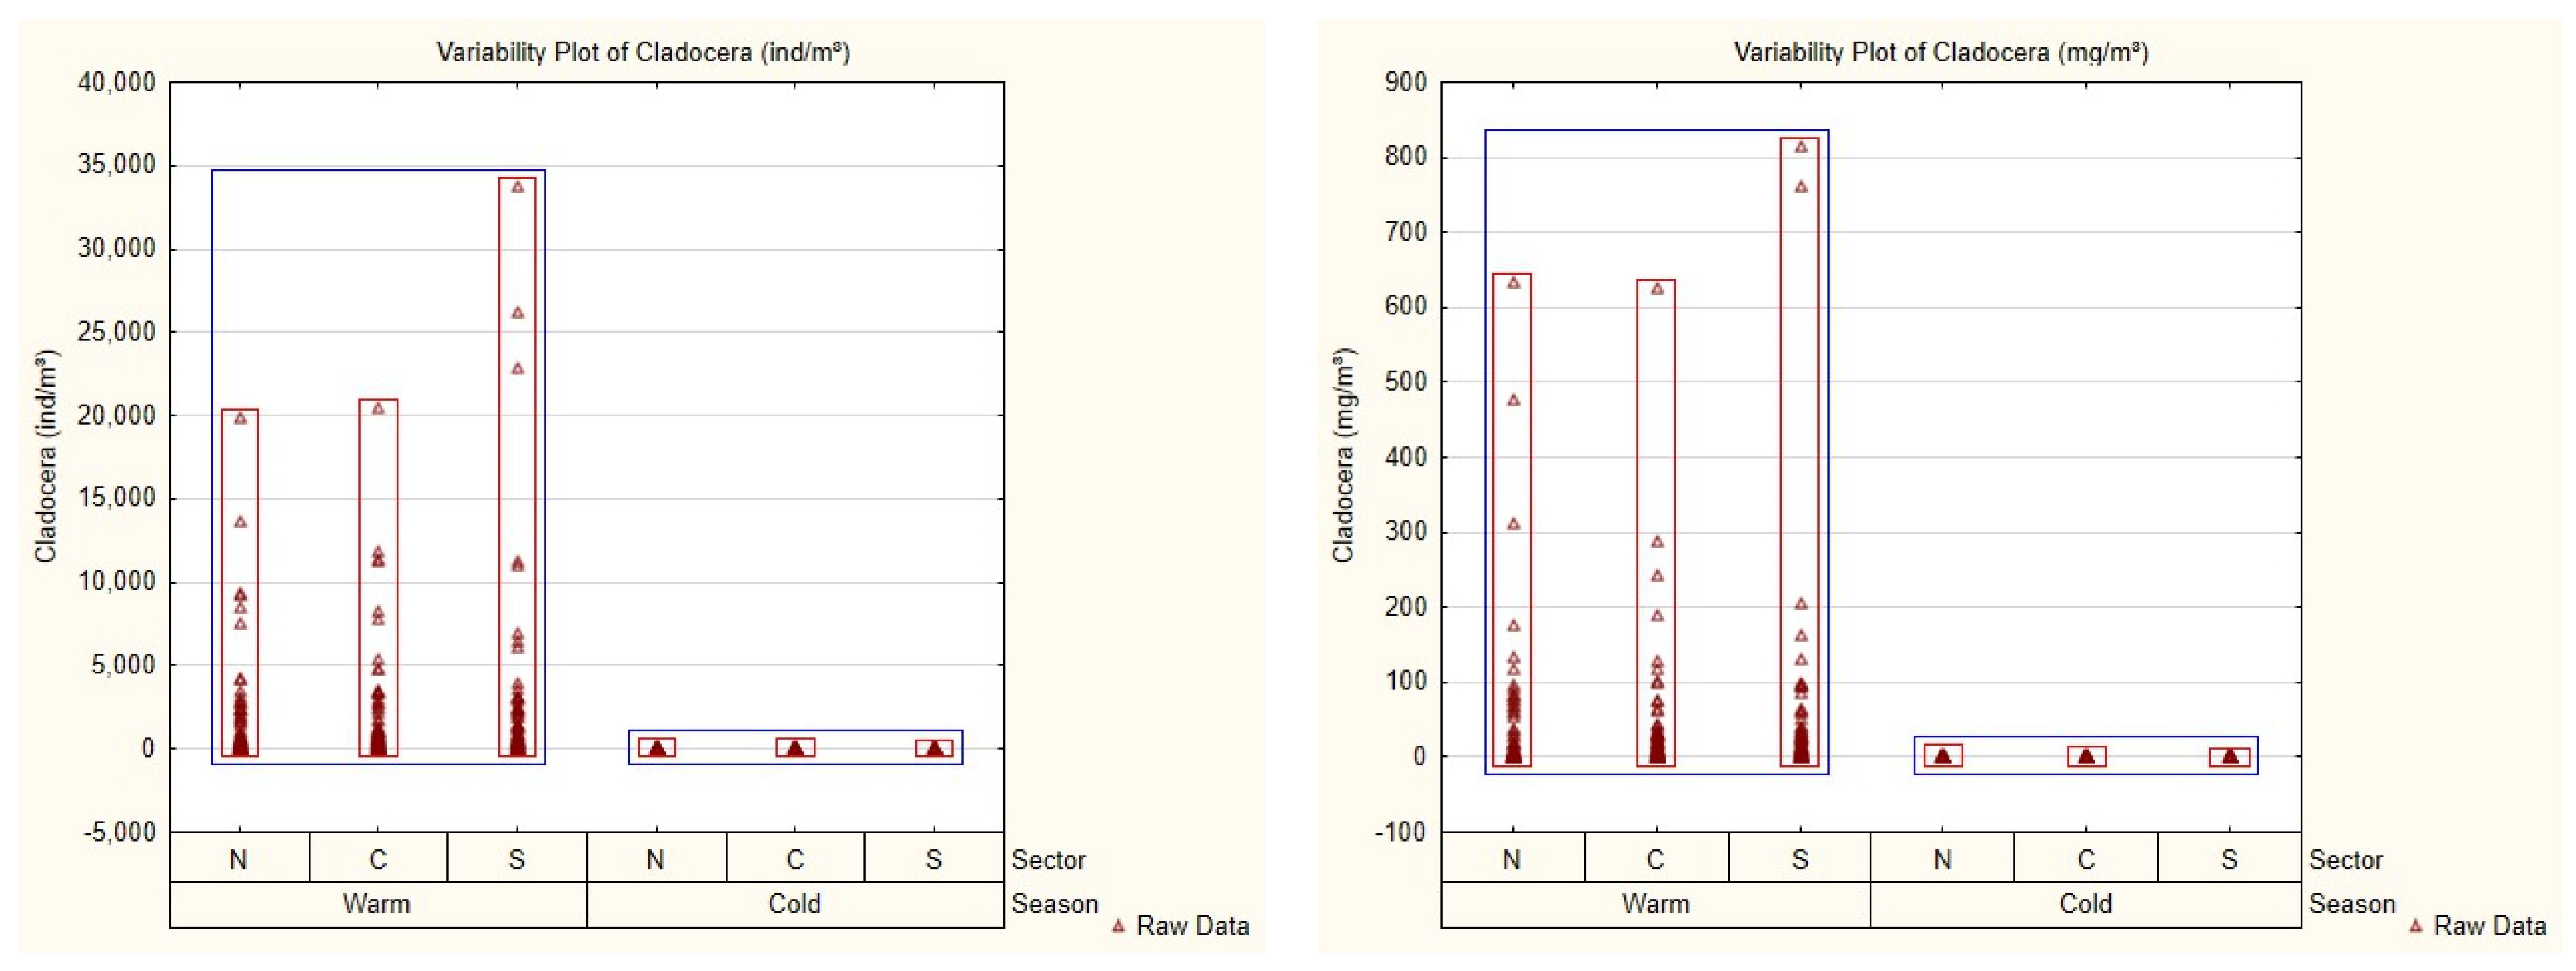
Cladocera were scarce during the cold season, with very low abundances recorded across all sectors (Figure 4). In contrast, their abundance increased markedly during the warm season, when they became a substantial component of the mesozooplankton assemblage (Figure 4). Peak abundances were observed in the southern sector, while moderate values occurred in the central and northern sectors. Despite their contribution to overall abundance, the biomass of these organisms remained comparatively modest, reflecting their small body size. This expansion during the warm season indicates cladoceran opportunism under stratified conditions [46].
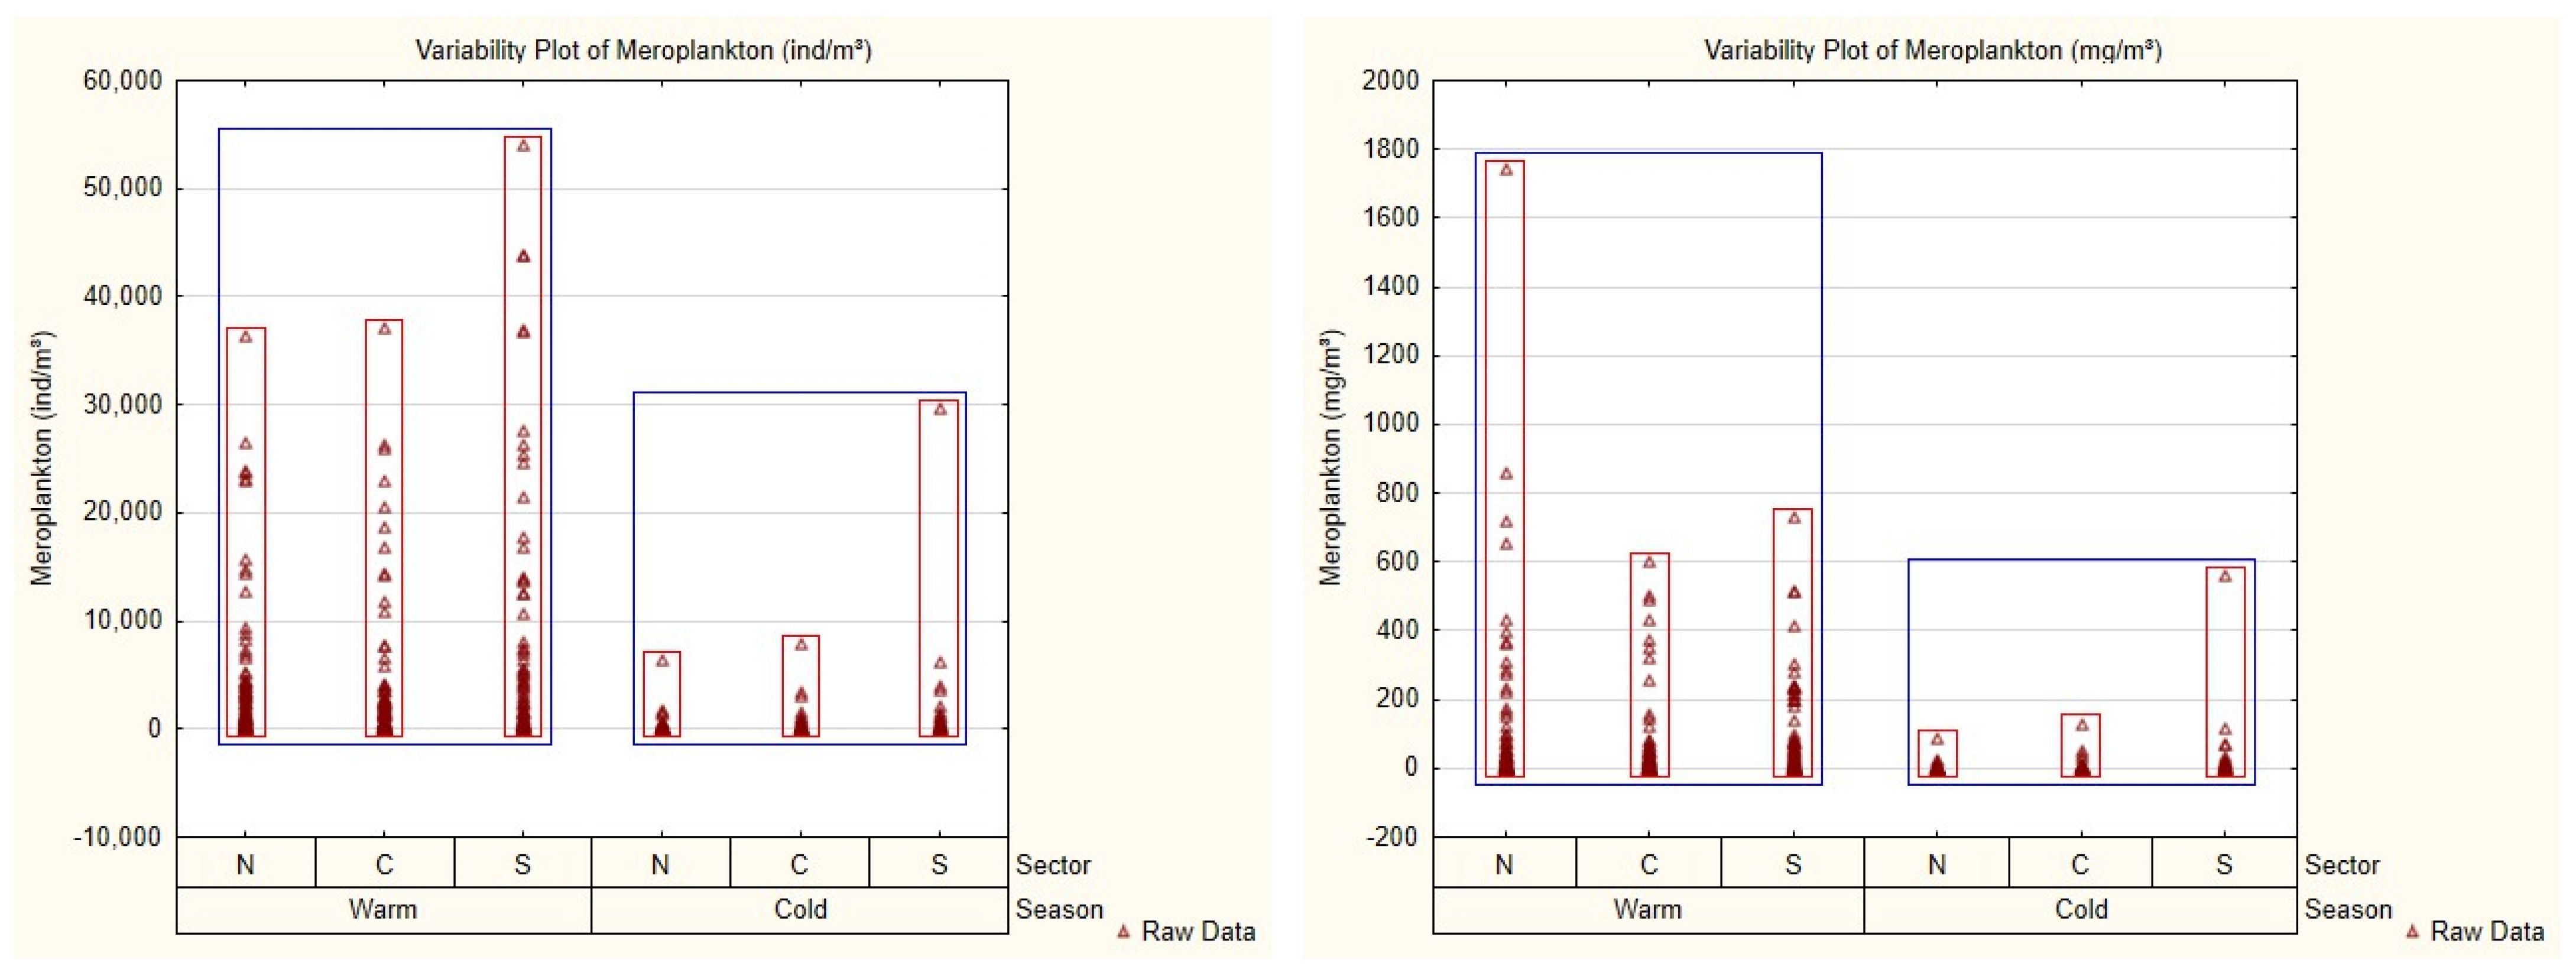
Meroplankton contributed significantly during the warm season, especially in southern and central waters (Figure 5). Their presence indicated active benthic–pelagic coupling during winter–spring mixing. In the cold season, both abundance and biomass decreased substantially (Figure 5). The decline was most pronounced in the northern and central sectors, suggesting reduced larval survival and recruitment under stressful hydrographic regimes and anthropogenic influence.
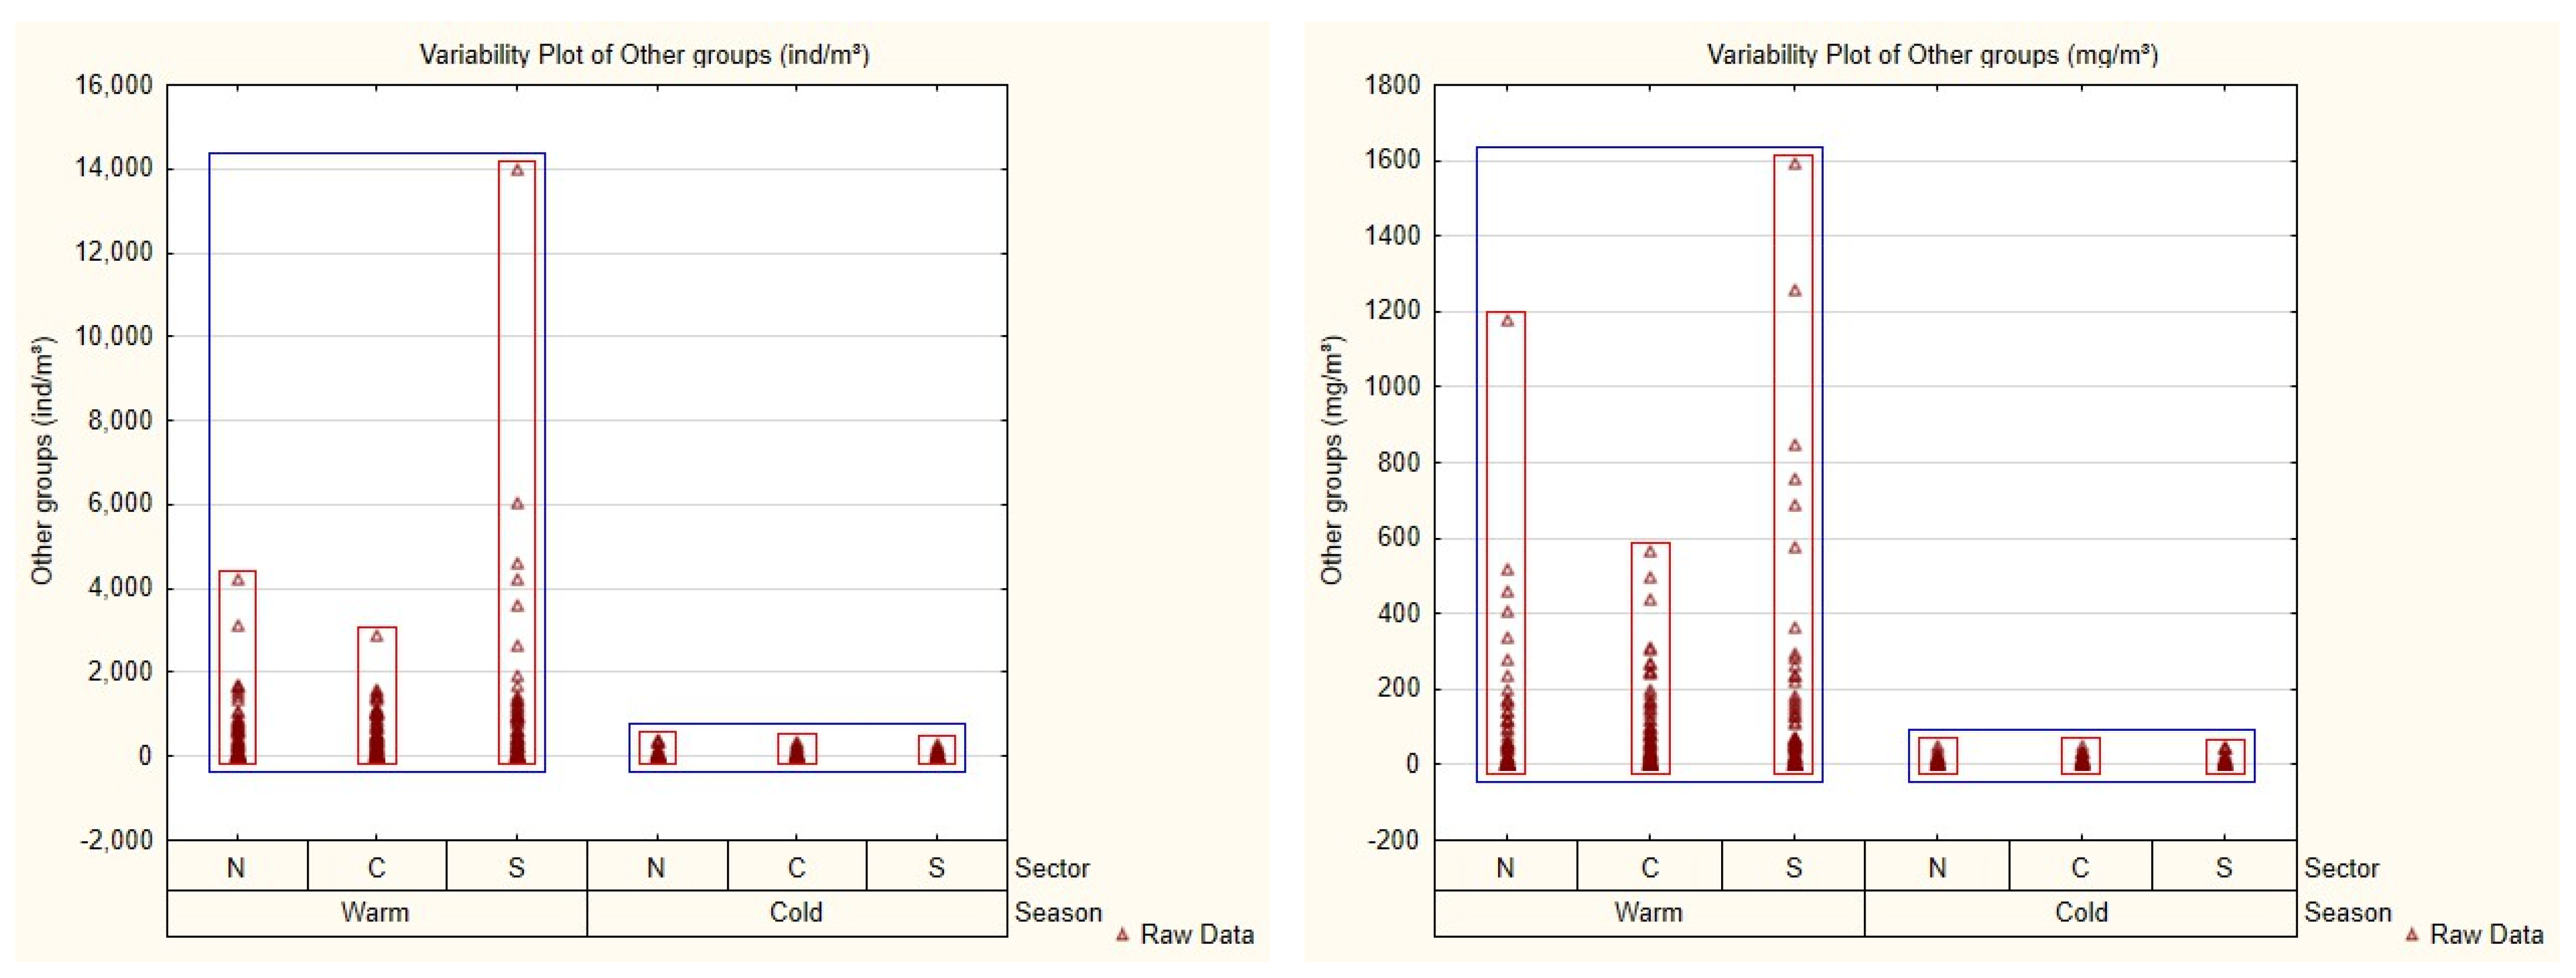
Other mesozooplankton taxa contributed only marginally to community structure (Figure 6). During the warm season, both abundance and biomass were markedly higher, with maximum values recorded in the southern sector. These peaks reflect favourable trophic conditions and elevated productivity during summer, when stratification promotes the development of diverse mesozooplankton assemblages. In contrast, cold-season values were consistently low throughout the study area, indicating reduced activity and limited recruitment of these groups under less favourable thermal and trophic conditions. Although they contributed less to total abundance, these taxa play an important functional role in trophic transfer and energy flux within the pelagic food web.
In addition to the variability plots, boxplots depicting the cold and warm season and sectoral distribution of mesozooplankton functional groups were generated to further illustrate the observed patterns (Figure S1). Figure S2 show the relative abundance and biomass of mesozooplankton groups across sectors and seasons. N. scintillans, dominated both metrics, especially in the northern and central sectors during the cold season. The southern sector showed higher contributions from copepods and meroplankton. In the warm season, non-fodder taxa remained prevalent, but group composition became more balanced, reflecting seasonal restructuring of the community along the north–south gradient.
ANOSIM analysis revealed significant differences in environmental variables and mesozooplankton metrics between seasons and sectors. The effect of the cold and warm seasons was pronounced (Global R = 0.298, p = 0.001), indicating moderate but consistent reorganisation of environmental and biological conditions between these two phases. The sectoral effect was weaker (Global R = 0.033, p = 0.001), suggesting limited but detectable spatial differentiation along the Romanian Black Sea sectors (Figure 7). The analysis statistically confirms that differences between the cold and warm seasons were more pronounced than spatial differences among sectors.

3.3. Abundance-Biomass Comparison (ABC) Curves

Mesozooplankton community patterns showed strong seasonal and spatial variation across the Romanian Black Sea sectors (Figure 8). N. scintillans was the dominant component overall, particularly in the southern and central sectors.
During the cold season, N. scintillans contributed most to both abundance and biomass, indicating its ability to maintain high standing stocks under nutrient-rich winter conditions. In the southern sector, the community was more diversified, with higher shares of copepods (e.g., Acartia clausi, Oithona spp.) and meroplanktonic larvae (Balanus, Polychaeta).
In the warm season, N. scintillans remained dominant in abundance but its biomass share decreased slightly. At the same time, meroplankton, cladocerans (Penilia avirostris, Evadne spinifera), and other large-bodied taxa (such as chaetognaths and appendicularians) became more prominent, especially in the southern and northern sectors.
Overall, these seasonal changes indicate a shift from winter assemblages dominated by N. scintillans toward more functionally diverse summer communities, where multiple groups contributed to total abundance and biomass.
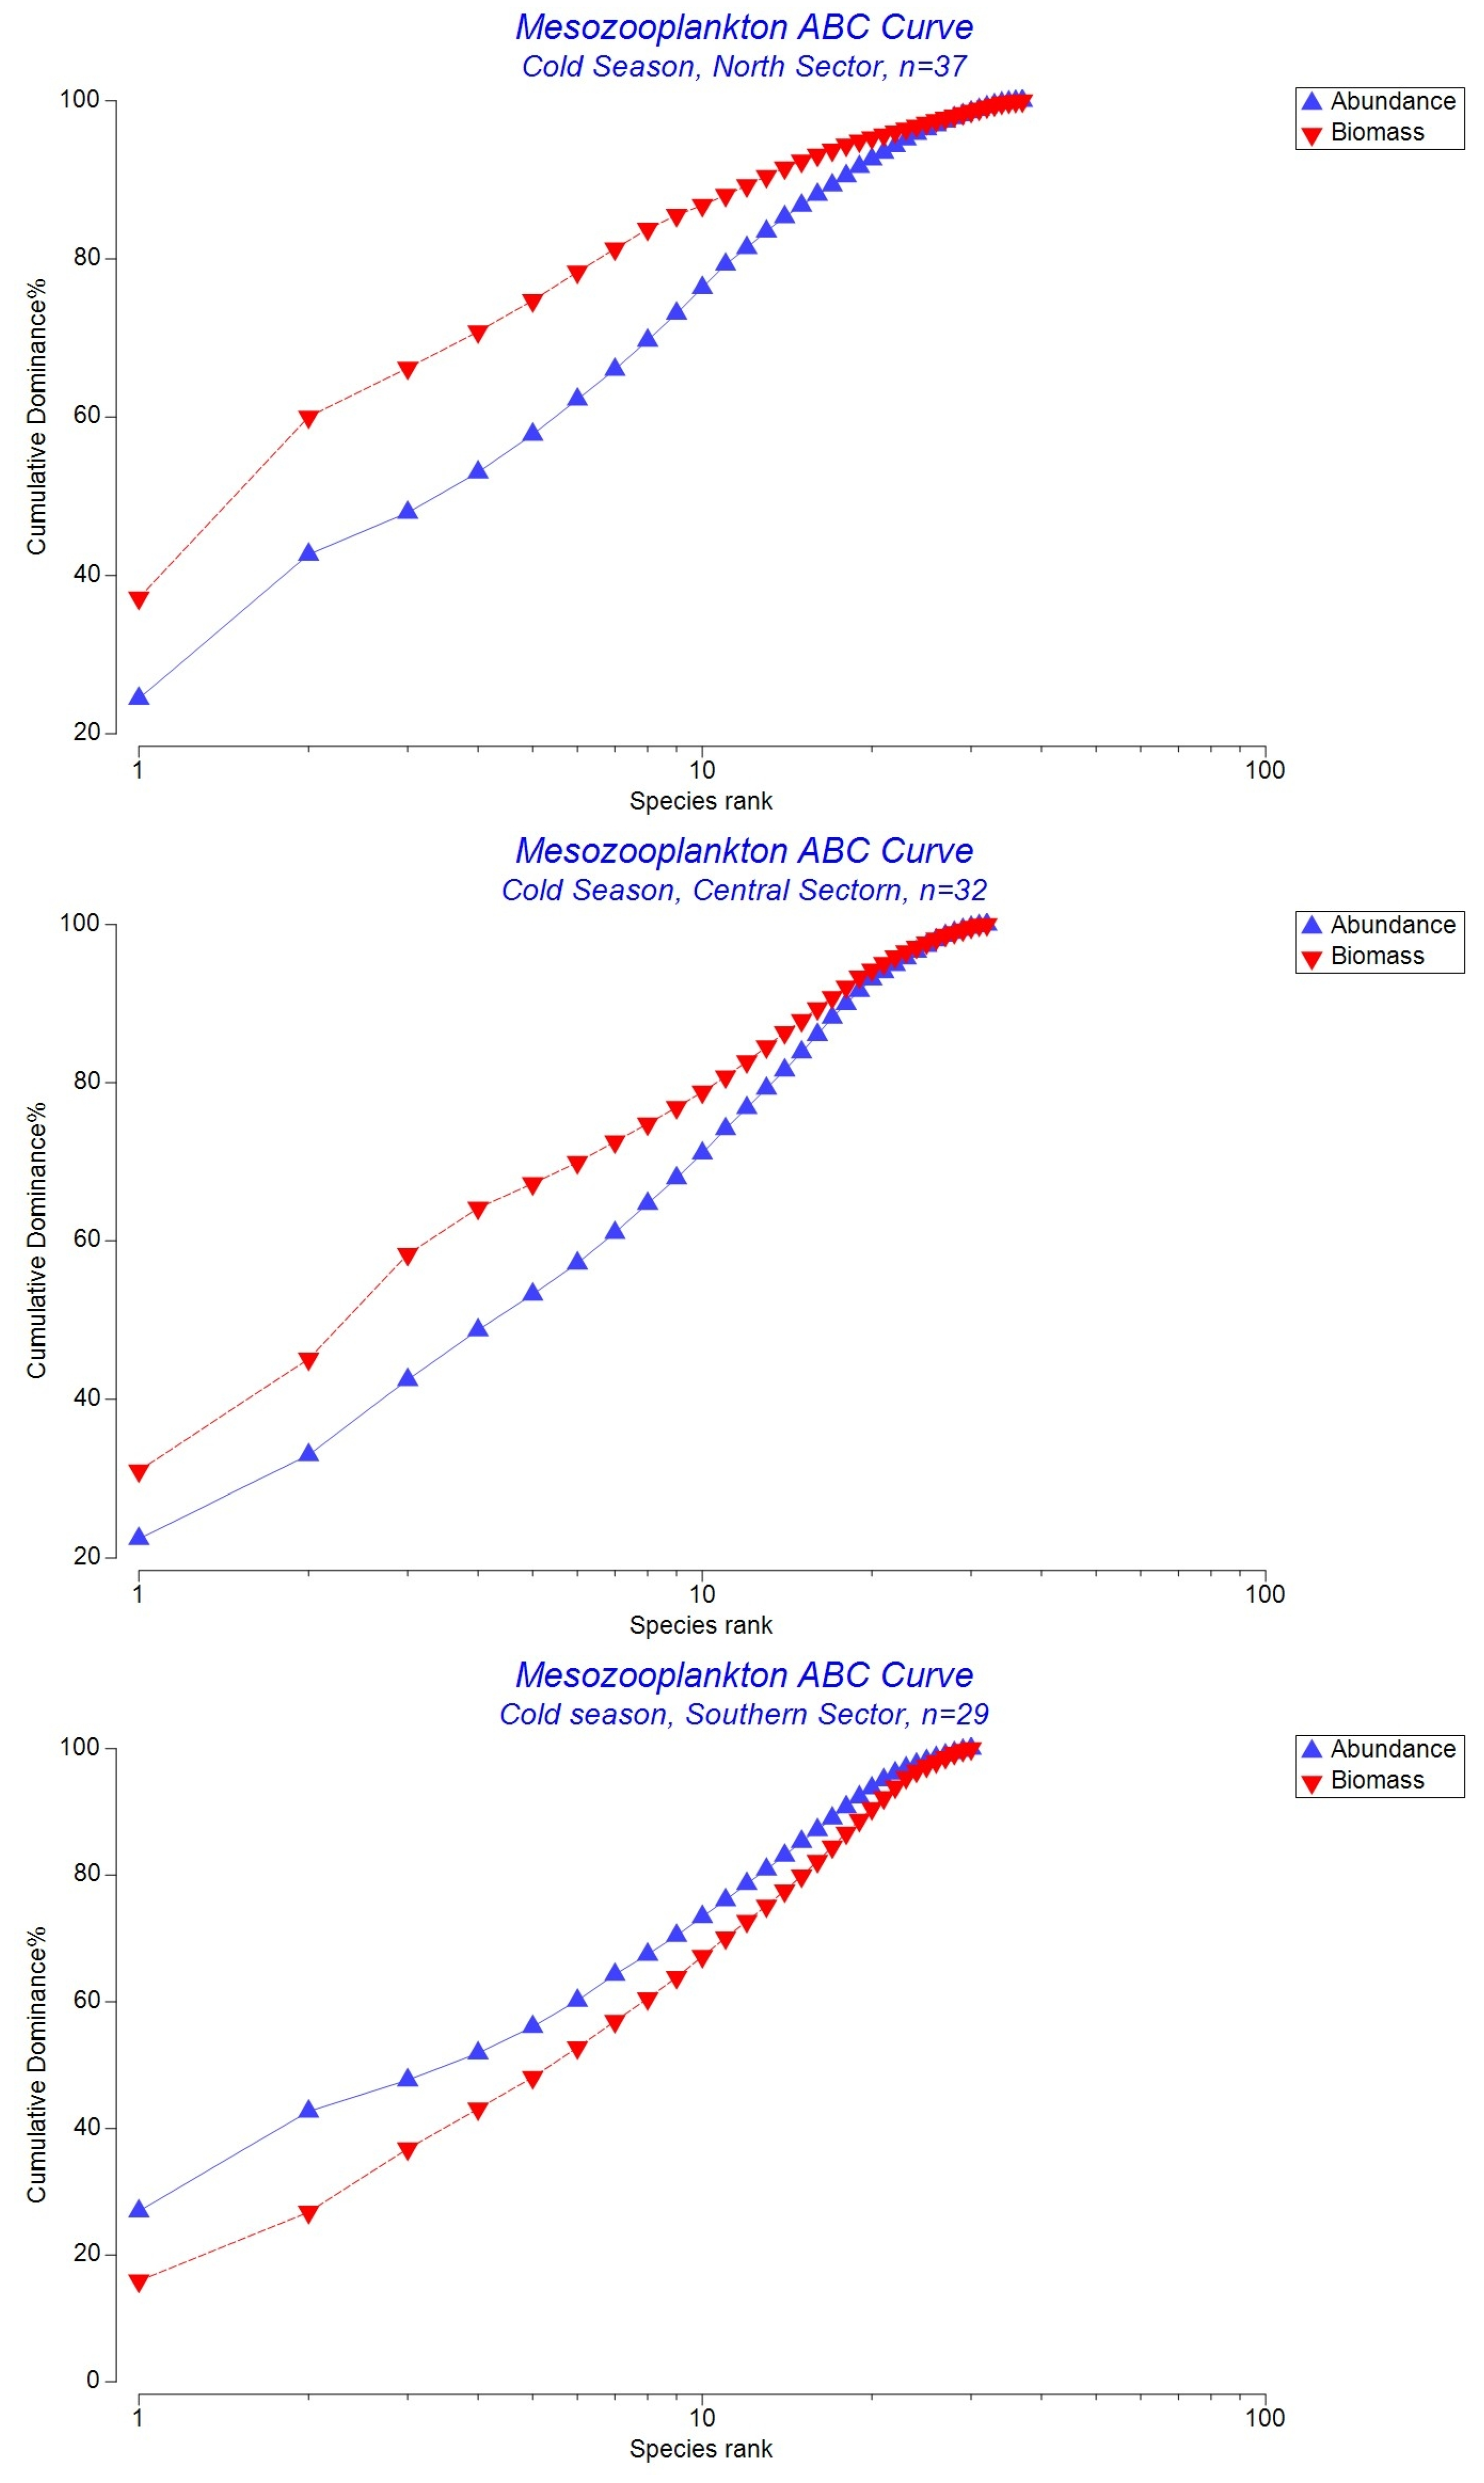
During the cold season, the ABC curves highlighted distinct patterns of community structure across the three sectors (Figure 9). The northern sector exhibited a clear separation between the biomass and abundance curves, with biomass dominance throughout most of the species’ rank, indicating a relatively stable and undisturbed community structure. Although small-bodied taxa, particularly copepodites, were numerically dominant, biomass was primarily supported by larger or more robust species, reflecting a well-balanced assemblage in which biomass contributions were not concentrated in a few opportunistic taxa. In low-disturbance conditions, larger taxa such as C. euxinus and Chaetognata concentrate most of the community biomass, resulting in the biomass curve lying above the abundance curve. Conversely, in stations affected by eutrophic or anthropogenic influences, small-bodied Copepoda, Cladocera, and bloom-forming taxa such as N. scintillans dominate numerically, causing the abundance curve to shift above the biomass curve. These patterns reflect the sensitivity of mesozooplankton size structure to environmental stress and trophic enrichment, consistent with the ABC framework.
In the central sector, the ABC curves showed a moderate separation, with the biomass curve remaining above the abundance curve across most of the species’ rank. This pattern suggests an intermediate level of community organisation, where larger-bodied copepods and meroplankton contributed substantially to total biomass, maintaining structural balance despite signs of mild disturbance.
In the southern sector, the ABC curve revealed the dominance of the abundance curve over the biomass curve, indicating a disturbed community structure. This configuration is characteristic of environments under sustained stress, where small-bodied and opportunistic species proliferate while larger, slow-growing taxa become less influential.
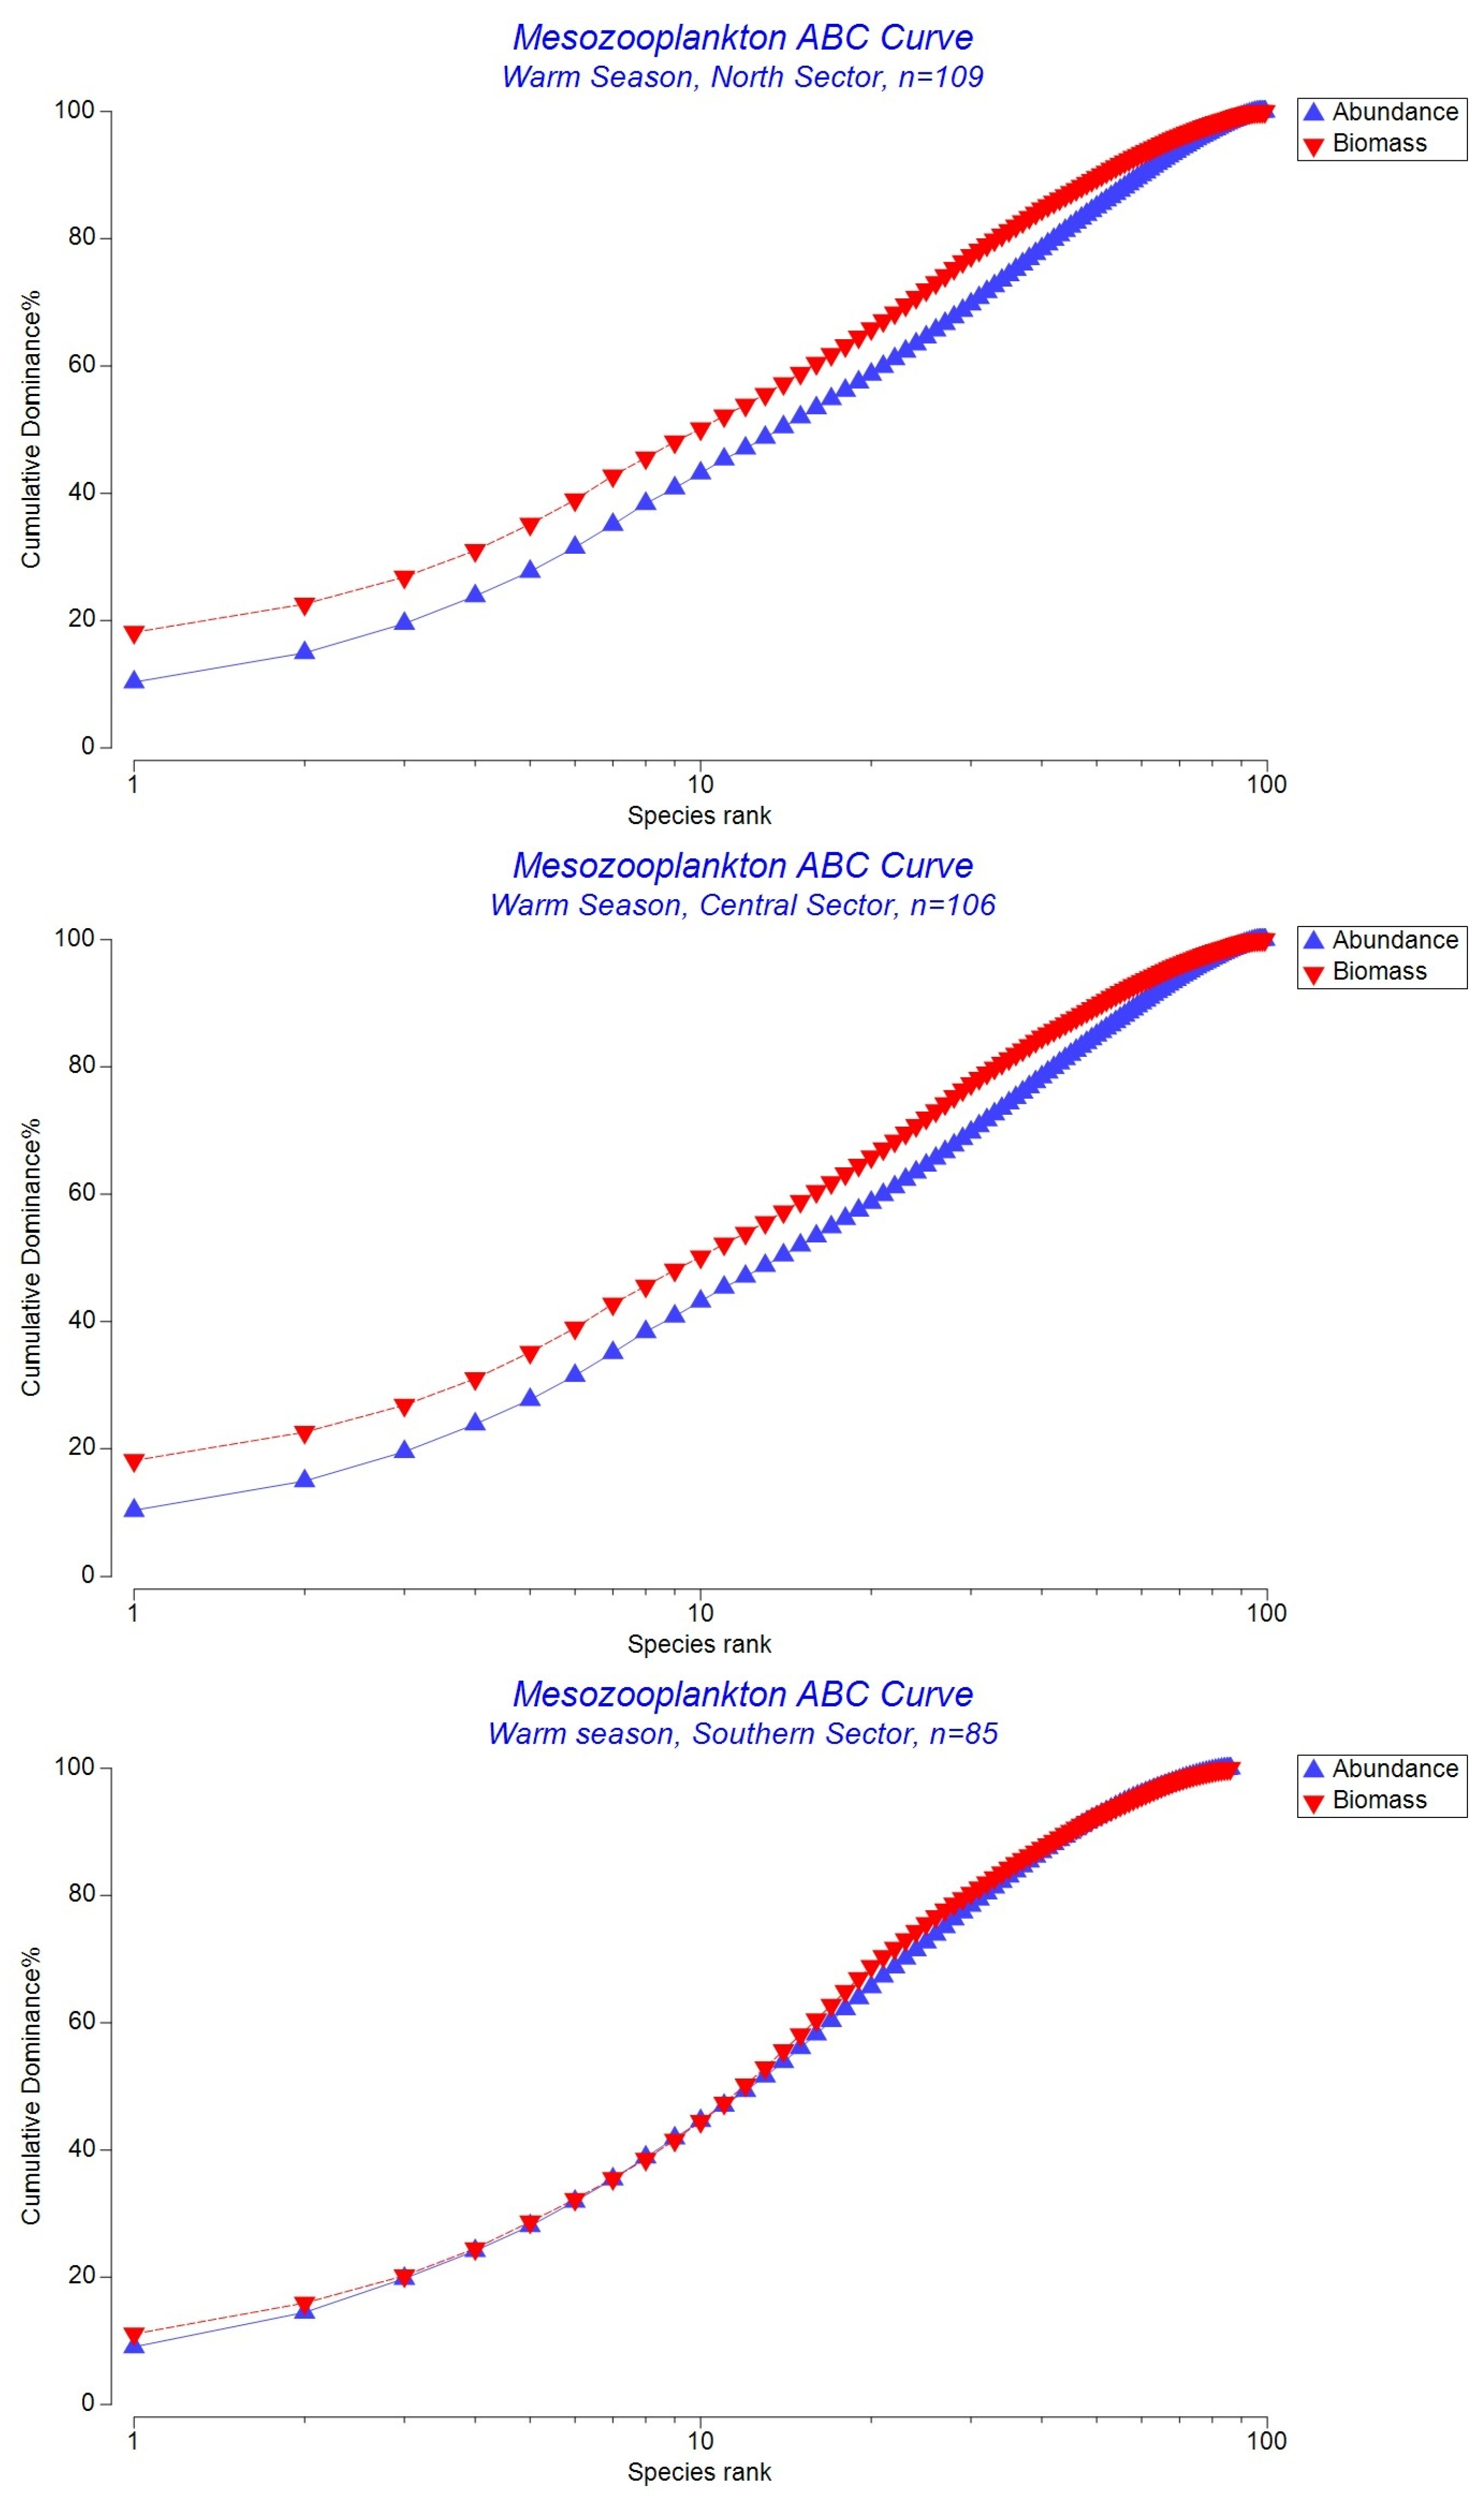
During the warm season, the ABC curves indicated a general trend toward community simplification and increasing disturbance across all sectors (Figure 10). In the northern sector, the biomass curve remained consistently above the abundance curve, showing that larger taxa continued to contribute to community structure despite stressors such as higher temperatures, stratification, and freshwater inputs. Although some narrowing of the gap was evident compared to winter, the assemblage preserved a relatively structured composition. In the central sector, the ABC curves showed a narrower separation than in winter, reflecting mild stress associated with seasonal stratification and increased summer productivity that favoured smaller-bodied taxa. Nevertheless, the biomass curve remained consistently higher than the abundance curve, indicating that larger organisms still sustained biomass dominance. In the southern sector, the ABC curves showed biomass and abundance nearly overlapping, in some cases approaching convergence. This pattern reflected substantial disturbance, with the community increasingly dominated by opportunistic species such as N. scintillans. The reduced contribution of larger taxa was associated with comparatively low biomass values, indicating weaker community organisation and reduced energy transfer efficiency.
Abundance–Biomass Comparison (ABC) analysis highlighted clear spatial and seasonal differences in community condition (Table 4).
The interpretation of community condition considered both the W-values and the qualitative separation between biomass and abundance curves, as curve patterns provide complementary information on dominance and disturbance beyond the numerical index.
During the cold season, the northern sector showed a relatively stable community (W = 0.119), with small-bodied taxa numerically dominant but larger species still contributing notably to biomass. The central sector exhibited a slightly lower W in value (0.102), suggesting a comparable, moderately disturbed community where biomass remained concentrated in copepods and meroplankton. In the southern sector, the biomass and abundance curves converged (W = –0.102), indicating a shift toward more opportunistic dominance and marginally higher disturbance relative to the other zones.
In the warm season, disturbance signals increased slightly across all sectors. The northern and central sectors maintained low positive W values (0.088), reflecting moderate disturbance but retention of a relatively balanced community structure. The southern sector displayed nearly overlapping curves (W = 0.016), consistent with disturbance intensity and reduced community stability. Overall, W values across sectors remained within a narrow range, indicating only subtle spatial differences in disturbance level rather than statistically significant contrasts.

3.4. Fuzzy Cognitive Mapping (FCM) of Mesozooplankton–Environment Interactions

During the cold season, the cognitive maps revealed a cohesive and positively structured set of relationships between environmental variables and mesozooplankton groups across all sectors (Figure 11, Table S1), reflecting a more stable ecological context with relatively fewer stressors.
In the northern sector, FCM analysis revealed strong negative associations between meroplankton and nutrient concentrations, particularly nitrate and silicate, indicating that elevated riverine inputs from the Danube are associated with reduced meroplankton abundance, likely due to increased turbidity and transient deterioration of pelagic conditions that limit benthic–pelagic coupling and larval recruitment during winter–spring. Copepoda showed moderate responses to ammonium enrichment, while N. scintillans correlated positively with temperature and nitrate, reflecting their tendency to occur under nutrient-rich, warmer conditions.
The central sector exhibited the most interconnected network, with Cladocera, Copepoda, and meroplankton all influenced by temperature, nitrate, and salinity. This pattern indicates a structurally balanced community supported by stable hydrographic conditions and moderate nutrient enrichment, consistent with the sector’s intermediate disturbance regime.
In the southern sector, copepod abundance was negatively correlated with temperature but positively associated with silicate concentrations, suggesting that cooler, nutrient-enriched conditions supported higher copepod densities. Cladocerans showed a positive correlation with nitrate (NO3), indicating a response to nutrient availability during colder months. Network connectivity remained relatively weak, reflecting lower trophic integration compared with the northern and central sectors.
Overall, cold-season FCMs highlighted temperature and nitrate as the primary drivers shaping mesozooplankton structure, with increasing complexity from south to north along the Romanian coast.
RDA confirmed the FCM patterns (R = 0.87–0.96; p < 0.01), showing nutrients as key drivers of mesozooplankton structure (Table S2). In the north, nutrients and temperature gradients strongly structured the community under Danube influence, whereas the central sector maintained balanced conditions supporting community stability. In contrast, the southern sector displayed reduced structural complexity, highlighting the influence of temperature and nutrient-related variables on mesozooplankton composition during the cold season.
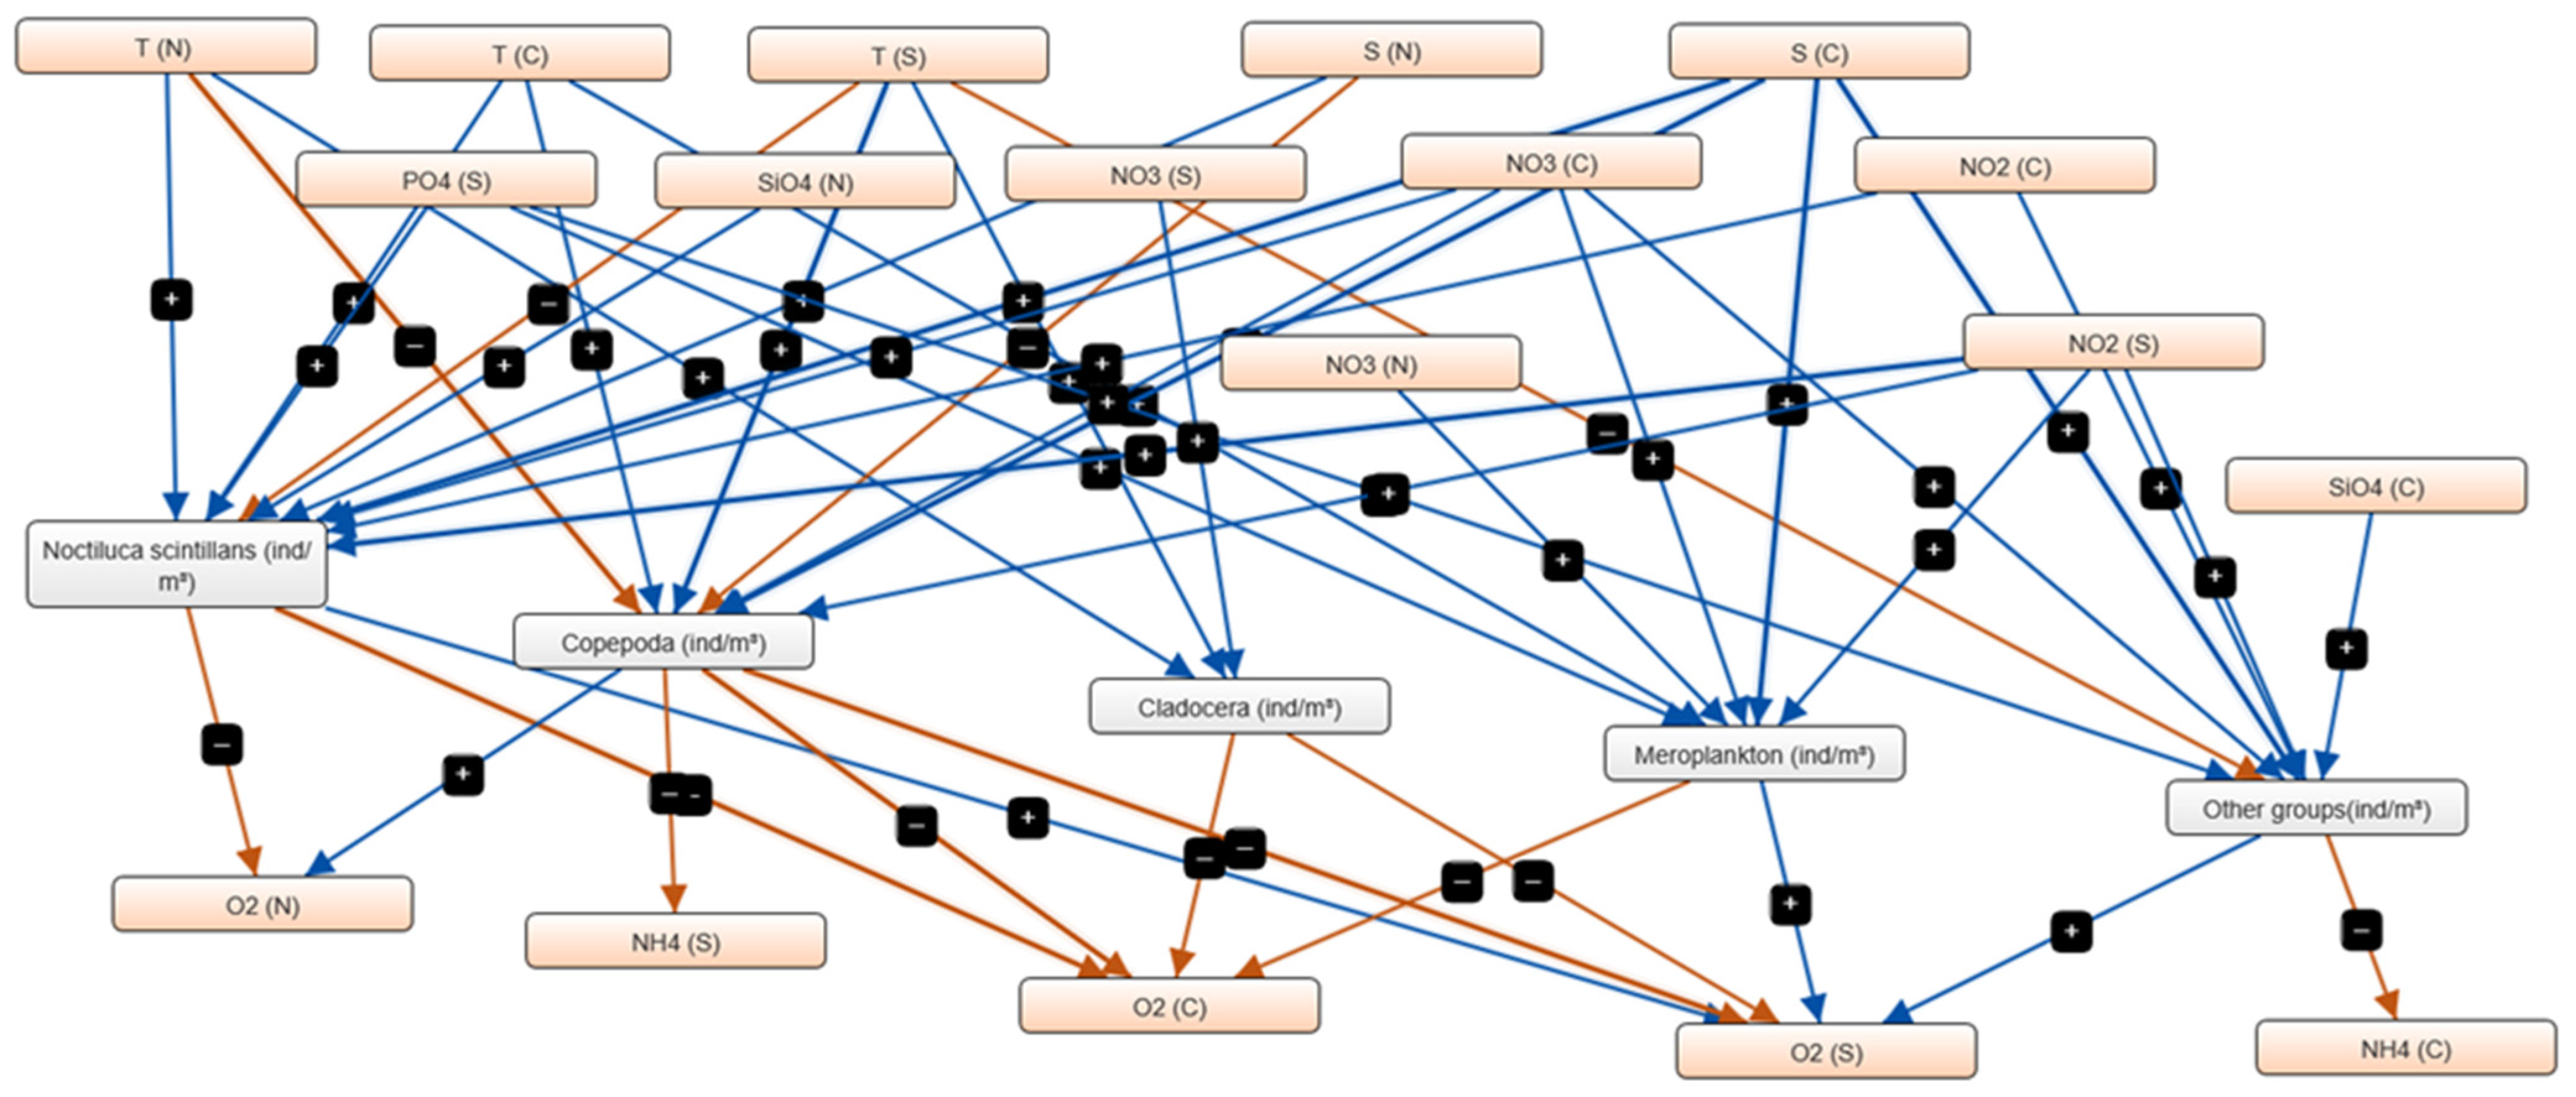
In the warm season, the FCM networks became increasingly fragmented and polarised, dominated by a rise in negative correlations and declining influence of key mesozooplankton groups, reflecting intensification of environmental stressors (Figure 12, Table S1).
In the northern sector, Copepoda exhibited significant negative correlations with both temperature and salinity, suggesting that their abundance increased under cooler and less saline conditions typically associated with freshwater influence and moderate nutrient enrichment. In contrast, Cladocera showed a positive correlation with temperature, indicating that their occurrence increased under warmer conditions, likely reflecting their preference for more productive, thermally stratified environments.
In the central sector, copepods showed a negative correlation with dissolved oxygen and an inverse relationship with temperature and salinity, indicating reduced abundance under warmer, oxygen-poor conditions. Overall, these patterns suggest that copepods are sensitive to thermal and salinity stress, while cladocerans tend to proliferate under warmer, more eutrophic conditions.
In the southern sector during the warm season, N. scintillans showed a positive correlation with nitrite (NO2), suggesting an association with nutrient regeneration processes and moderate eutrophic conditions. Its abundance also increased with higher oxygen levels, indicating tolerance to well-mixed, oxygenated environments. The “other taxa” category exhibited positive correlations with oxygen, phosphate (PO4), and nitrite (NO2), reflecting a preference for nutrient-rich and oxygenated conditions that support secondary productivity. Overall, these relationships highlight the influence of nutrient availability and water column mixing on the composition and abundance of dominant mesozooplankton groups in the southern sector during the warm season.
RDA results were consistent with FCM patterns, confirming spatial contrasts in mesozooplankton–environment relationships (Table S3). In the northern sector, the ordination reflected the influence of freshwater input and nutrient enrichment, where Copepoda were associated with cooler, less saline waters and Cladocera responded positively to warmer, more productive conditions. The central sector displayed a more balanced structure, shaped by the combined effects of temperature, oxygen, and phosphate. In contrast, the southern sector showed a stronger coupling with salinity and oxygen, indicating a shift toward marine-controlled and functionally simplified assemblages.

3.5. Climate Change Scenario Simulations

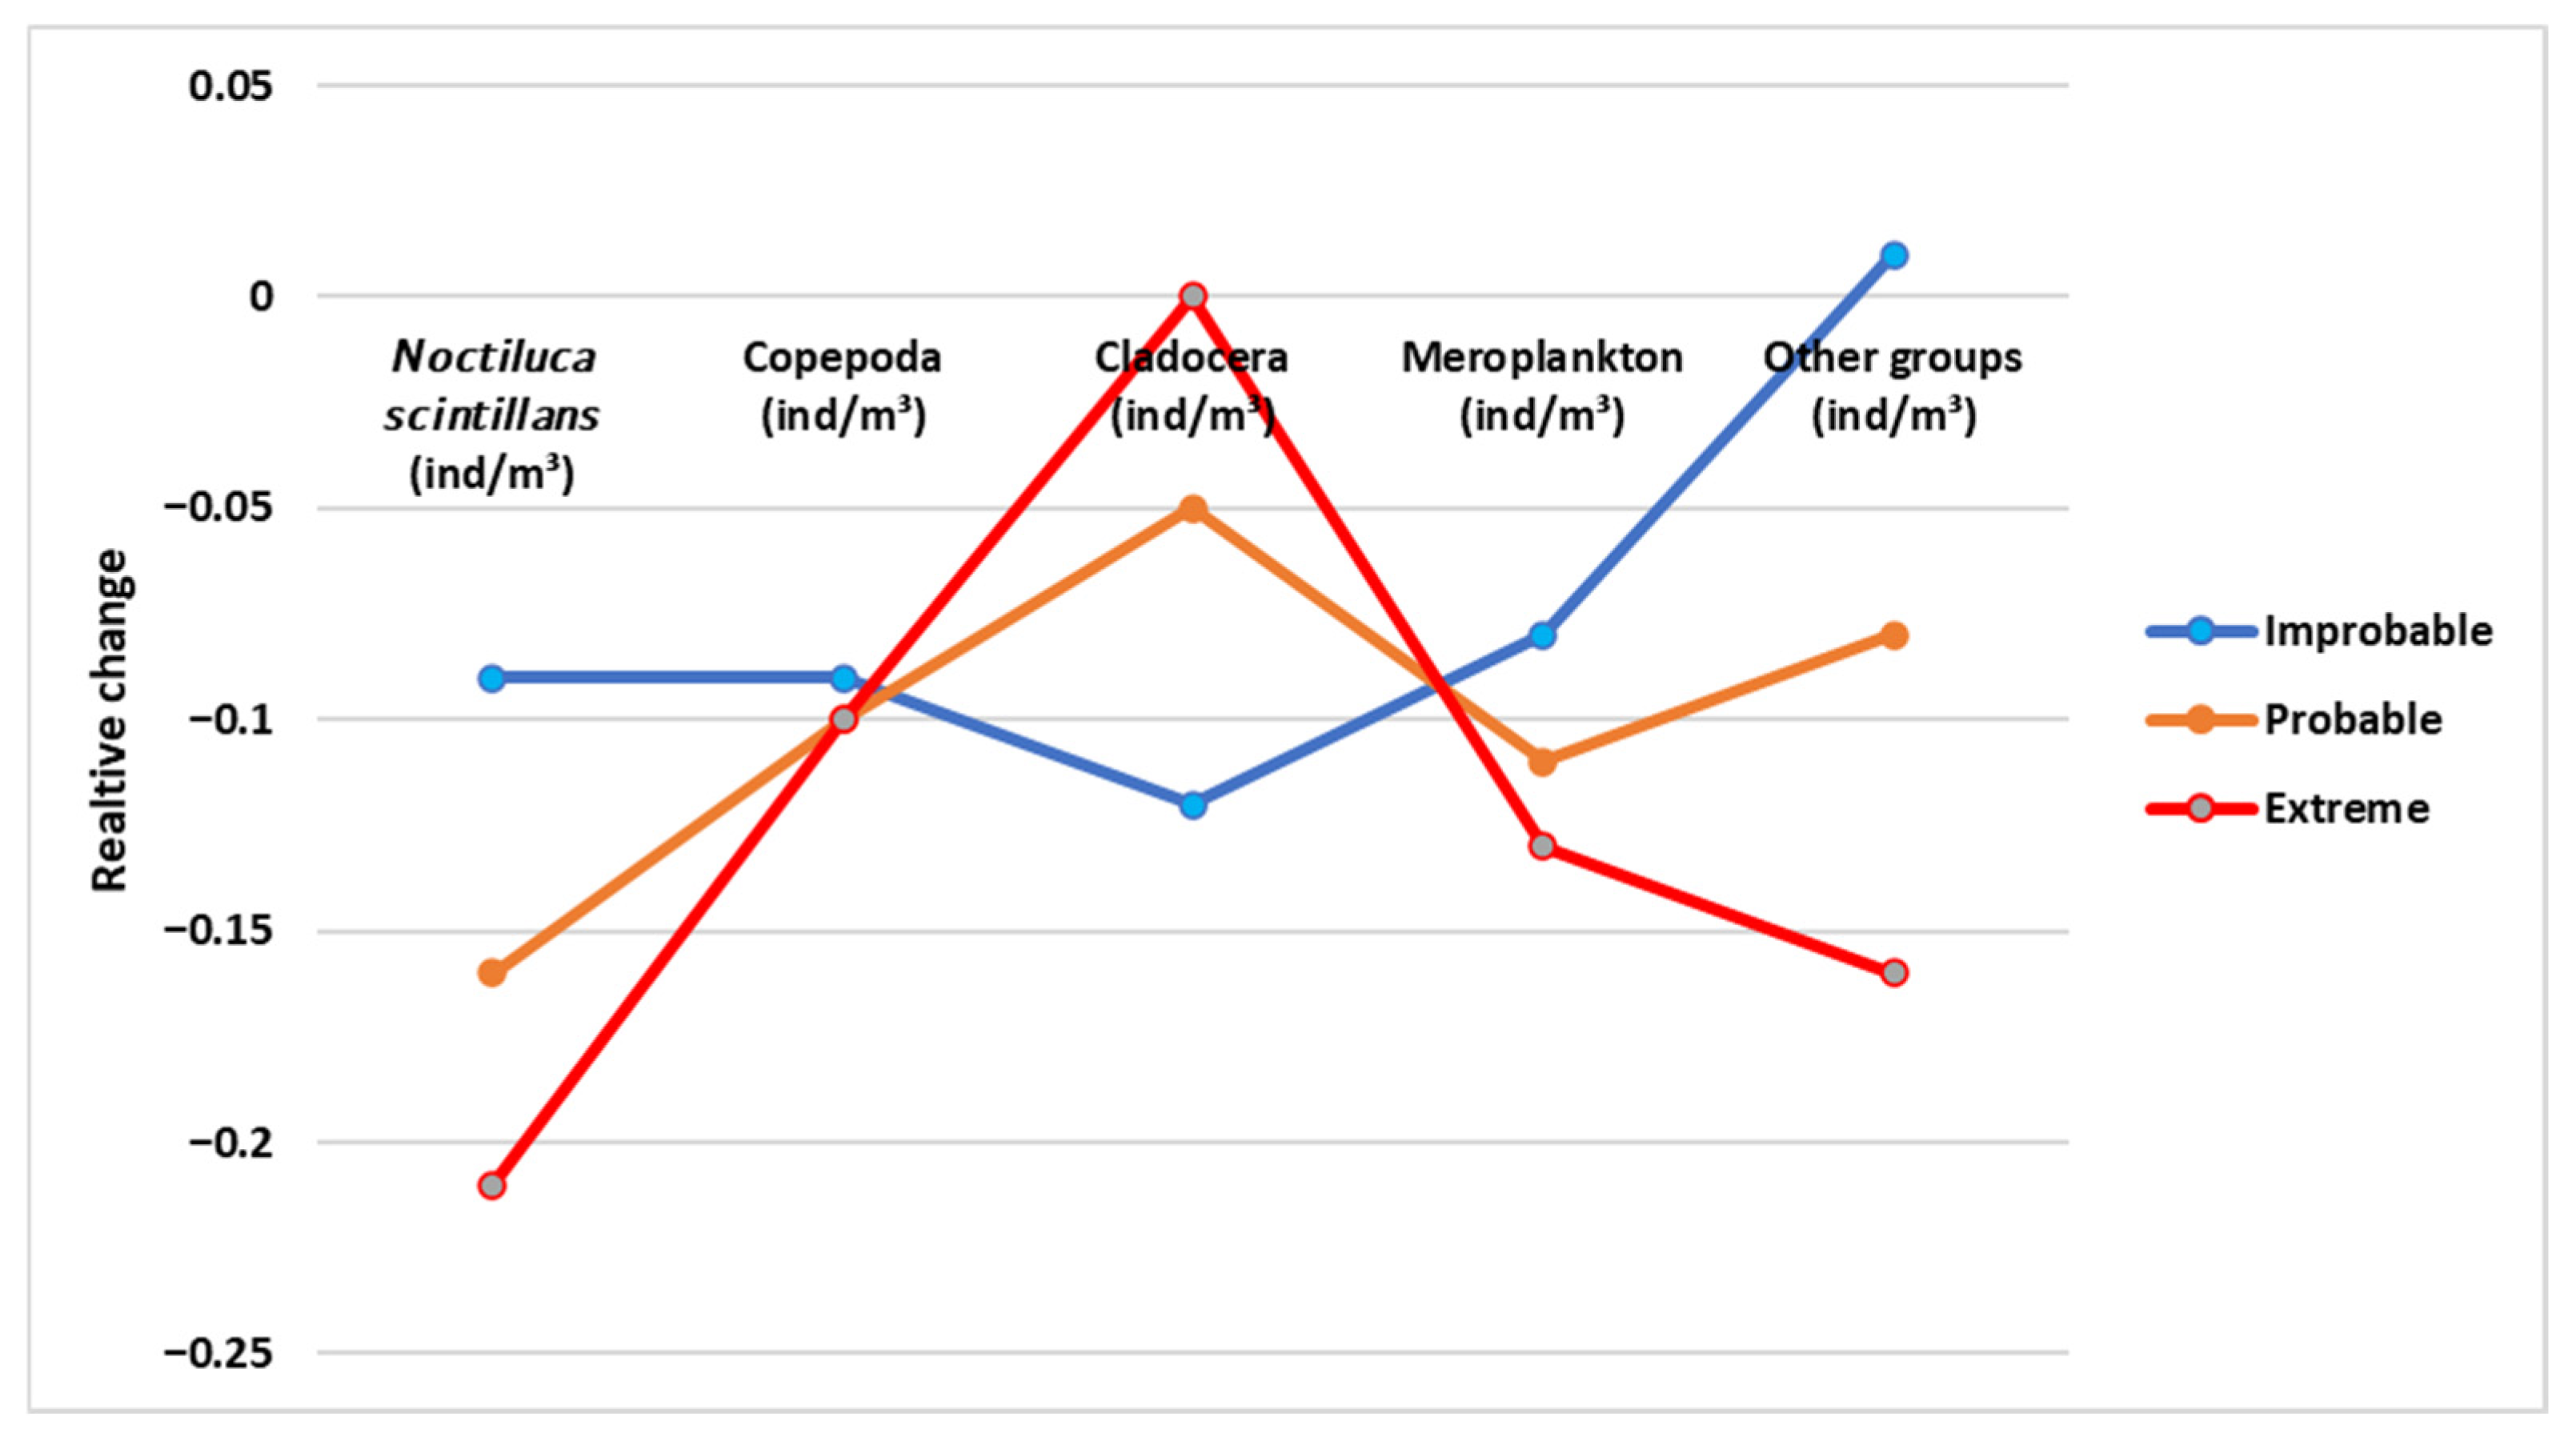
The climate change scenario simulations, based on projected variations in temperature and salinity, provide critical insight into the potential long-term impacts of environmental change on mesozooplankton communities along the Romanian Black Sea coast. Using the FCM framework and Mental Modeller’s scenario testing interface, three scenarios were explored: improbable (decrease in temperature, increase in salinity), probable (increase in temperature, decrease in salinity), and extreme (strong increase in temperature, strong decrease in salinity).
Across all three sectors, the simulations revealed consistent patterns of sensitivity among mesozooplankton (Figure 13). The “extreme” scenario, which IPCC projections for the region under high-emissions pathways [45], resulted in the greatest overall decline in mesozooplankton abundance and biomass. The most pronounced decreases were observed in N. scintillans and the “Other groups” category, both of which showed strong negative deviations from baseline values. Meroplankton also declined moderately, while Copepoda experienced smaller reductions. In contrast, Cladocera exhibited little to no decline, even showing a slight increase under the most severe conditions, suggesting a comparatively stable response.
The “probable” scenario, representing a moderate increase in temperature and mild salinity reduction, also had negative effects—especially in the southern sector. Elevated temperatures and reduced salinity promote stratification and eutrophication, processes that lead to oxygen depletion in bottom waters and compressed vertical niches for plankton [17,47]. Under this scenario, Copepoda demonstrate moderate resilience, maintaining relative stability compared to other groups. This is in line with their physiological tolerance and trophic flexibility, which allow them to adapt to variable environmental conditions [5].
The “improbable” scenario, with decreased temperature and increased salinity, was associated with the smallest change in mesozooplankton community structure. In fact, under this scenario, some recovery in biomass and diversity was observed—particularly in the central and northern sectors. These results suggest that cooler, more saline waters could act as buffering conditions that mitigate eutrophication and improve oxygen conditions, supporting a more balanced plankton community [48]. However, such a scenario is unlikely under current climate trajectories and thus primarily serves as a baseline for resilience.

4. Discussion

4.1. Spatial–Seasonal Differentiation of Mesozooplankton Communities

Mesozooplankton along the Romanian Black Sea coast exhibited pronounced spatial and cold and warm season differentiation, shaped by hydrographic forcing, nutrient inputs, and anthropogenic pressures. A clear north–south gradient emerged, with the Danube-influenced north displaying variable but productive conditions, the central sector maintaining relative stability, and the southern coast showing chronic ecological degradation.
In the northern sector, strong Danube discharge supported high mesozooplankton abundances dominated by small-bodied Copepoda and meroplankton. This configuration reflects nutrient enrichment, stimulating primary productivity and favouring opportunistic, fast-reproducing taxa with limited biomass accumulation. Similar dynamics occur in other river-affected seas, where eutrophication promotes small zooplankton dominance and fluctuating community structures [8,31,49,50,51,52,53,54].
The central sector hosted the most balanced assemblages. High abundance and biomass during winter, coupled with moderate summer stress, indicate that stable hydrographic conditions and moderate nutrient enrichment provide buffering capacity, allowing trophic integrity to persist through seasonal changes. This state is typical of mid-shelf transition zones that mediate between disturbed coastal and more stable offshore ecosystems [6,9,55].
In contrast, the southern sector exhibited persistent degradation, typified by recurrent dominance of N. scintillans—an established indicator of eutrophication and organic enrichment [56,57,58,59]. Its proliferation coincided with reduced Copepoda and meroplankton biomass, signalling weakened trophic efficiency. The replacement of crustacean zooplankton by gelatinous zooplankton typically indicates eutrophication and hypoxic stress in semi-enclosed basins [34,60,61,62].

4.2. Community Disturbance and Abundance–Biomass (ABC) Patterns

Abundance–Biomass Comparison (ABC) patterns and W-values revealed moderate disturbance across sectors, with small but consistent spatial contrasts. Following PRIMER-E guidelines [38], positive W-values denote undisturbed communities, negative values indicate disturbed systems, and values near zero reflect moderate disturbance.
During the cold season, the northern (W = 0.119) and central sectors (W = 0.102) exhibited positive W-values, indicating relatively structured mesozooplankton where biomass dominance reflected stable, low-disturbance conditions maintained by large-bodied taxa. In contrast, the southern sector (W = –0.102) showed a negative W-value, with abundance exceeding biomass. This pattern suggests a disturbed community dominated by small, opportunistic species, consistent with higher anthropogenic pressure and reduced structural complexity.
In the warm season, W-values declined across all sectors, indicating intensified disturbance under stratified, oxygen-depleted conditions. In the northern sector (W = 0.088), smaller taxa gained numerical dominance, while the southern sector (W = 0.016) showed near-overlapping curves, characteristic of eutrophic, hypoxic systems dominated by N. scintillans [57,58,59,63,64,65,66].
These results confirm a persistent disturbance gradient, with the central sector retaining structural integrity, the north experiencing fluctuating stress–recovery dynamics driven by Danube input, and the south reflecting sustained ecological impairment. Seasonal stratification and nutrient regeneration amplify this imbalance, whereas winter mixing supports partial recovery.

4.3. Environmental Drivers and Network Connectivity

FCM provided a causal framework for interpreting environmental controls on mesozooplankton dynamics. During winter, the central sector displayed the most balanced and connected interaction network, with Cladocera and meroplankton linked to nitrate and nitrite, reflecting efficient use of nutrient pulses during mixing [67,68]. The northern sector showed strong meroplankton–nitrate relationships consistent with Danube-driven enrichment and enhanced benthic–pelagic coupling [69,70,71,72]. In the southern sector, Copepoda exhibited a negative correlation with temperature and a positive association with silicate (SiO4), suggesting that their abundance increased under cooler, silica-rich conditions likely linked to enhanced diatom productivity or episodic upwelling events. These findings indicate that copepod dynamics in this area are strongly influenced by local hydrographic variability rather than by thermal stratification alone. Cladocera, by contrast, showed a positive relationship with nitrate (NO3), reflecting their capacity to exploit nutrient-enriched, phytoplankton-rich environments typical of eutrophic coastal waters. Together, these patterns suggest that nutrient availability and productivity gradients play a key role in shaping mesozooplankton structure in the southern sector, modulating the balance between copepod-dominated and cladoceran-dominated assemblages under variable hydrographic regimes [60,73].
In summer, networks simplified markedly across all sectors, especially in the south, where negative interactions increased and functional redundancy declined. The disappearance of Cladocera and meroplankton from key network positions indicates diminished adaptive capacity under the combined influence of warming, stratification, and oxygen depletion [68,74].
The convergence of ABC and FCM results underscores a consistent ecological trajectory: the central sector maintains the highest structural and functional integrity, the north remains highly variable yet resilient, and the south experiences chronic stress and low redundancy. This alignment of structural and functional indicators highlights the cumulative influence of anthropogenic and climate-sensitive stressors along the Romanian coast.

4.4. Climate Change Scenarios and System Sensitivity

Scenario simulations revealed the vulnerability of mesozooplankton communities to projected changes in temperature and salinity.
Under the extreme scenario, representing high-emission IPCC trajectories, total mesozooplankton abundance and biomass declined sharply, with the strongest numerical reductions observed in N. scintillans and the “Other groups” category. Meroplankton showed moderate declines, while Copepoda decreased slightly and Cladocera remained relatively stable. This suggests that extreme warming and freshening disproportionately affect gelatinous and opportunistic taxa, reshaping functional composition. Although Cladocera and Meroplankton were identified in FCM analyses as sensitive to temperature and salinity changes, their vulnerability is primarily ecological rather than numerical, reflecting high sensitivity to environmental stress rather than steep abundance loss.
The probable scenario, with moderate warming and mild salinity decline, produced notable effects in the southern sector, where local eutrophication and hypoxia amplify climate pressures. The improbable scenario, characterised by cooler, more saline waters, showed partial community recovery, particularly in the north and central sectors, consistent with improved oxygenation and nutrient balance during colder periods [10,75].
Collectively, the simulations indicate a trajectory of progressive simplification and functional erosion, especially in the southern waters. The central sector retains buffering capacity under moderate change, while the south—already under chronic anthropogenic influence—is projected to experience the strongest synergistic impacts of warming, stratification, and nutrient loading. These findings highlight the importance of integrated assessment frameworks for anticipating ecosystem responses under climate change.

4.5. Body Size as an Indicator of Environmental and Ecosystem Change

Body size offers a sensitive proxy for ecosystem alteration. The dominance of small-bodied Copepoda and Cladocera during the warm season, coupled with reduced contributions from meroplankton and N. scintillans, aligns with the “temperature–size rule,” which predicts smaller organism size under warmer, nutrient-enriched, and hypoxic conditions [76,77,78]. In coastal and semi-enclosed seas, such shifts are amplified by eutrophication and stratification, favouring opportunistic species and diminishing the role of larger, energy-demanding taxa [77,79,80,81].
This miniaturisation enhances short-term persistence but reduces trophic efficiency and system resilience. Smaller organisms transfer less carbon to higher trophic levels, weakening energy flow and food-web connectivity [77,82,83]. The observed size reduction along the Romanian coast thus signals both metabolic adjustment and ecological degradation, reinforcing body size as a practical indicator for detecting cumulative environmental and climatic stress.

4.6. Implications for Ecosystem-Based Management and Limitations

The integrated evidence from community structure, ABC trends, network connectivity, and scenario testing demonstrates a progressive weakening of food-web functions, particularly in the southern coastal sector. This trend likely reflects the cumulative effects of anthropogenic and climatic stressors that have reshaped trophic interactions and reduced system resilience [27,84].
The increasing dominance of small-sized copepods and other opportunistic taxa, combined with diminished predator–prey coupling, suggests a shift toward a simplified food-web configuration with lower energy transfer efficiency [85,86,87,88]. Network analyses reveal weakened connectivity among functional groups, indicating a decline in trophic redundancy and an increased vulnerability to perturbations. Such changes are consistent with previous observations along the Romanian coast, where nutrient enrichment, coastal engineering, and temperature anomalies have collectively altered plankton dynamics [25,34,89].
Under projected climate scenarios, further disruptions in energy flow may occur, reinforcing the need for ecosystem-based management approaches. Integrating functional indicators such as ABC metrics and network-derived connectivity indices into monitoring programmes could provide early warnings of food-web degradation in the Black Sea.
Within the framework of the EU Marine Strategy Framework Directive (MSFD), these results are directly relevant to Descriptor 4 (Food webs) and Descriptor 5 (Eutrophication). The combined use of W-statistics from ABC and connectivity metrics from FCM offers a robust diagnostic approach for evaluating Good Environmental Status (GES).
Despite its scope, this study has limitations. Temporal coverage was uneven across years, and environmental data was limited to hydrographic and nutrient parameters, excluding pollutants and invasive species. The climate scenarios were simplified to temperature and salinity changes, capturing key tendencies but not the full complexity of Black Sea hydrography. Expanding future assessments to include additional stressors, longer time series, and transboundary monitoring will strengthen predictive capacity and inform ecosystem-based management strategies.

5. Conclusions

This study provides an integrated assessment of mesozooplankton dynamics along the Romanian Black Sea coast, combining community structure, abundance–biomass comparisons, and fuzzy cognitive mapping. The results reveal pronounced spatial and seasonal contrasts driven by hydrographic variability, nutrient enrichment, and local anthropogenic pressures. The northern sector, strongly influenced by Danube inputs, supported high abundances of small-bodied plankton, while the central sector maintained relatively balanced communities with higher resilience. In contrast, the southern sector exhibited persistent degradation, with N. scintillans dominance and loss of functional redundancy.
ABC curve analyses quantified disturbance levels through W-statistics, highlighting a north–south gradient that intensified during the warm season. FCM analyses further demonstrated the mechanistic links between environmental drivers and mesozooplankton groups, while climate scenario testing indicated future simplification of community networks under warming and freshening conditions.
Given the pivotal role of mesozooplankton as the main food source for pelagic fish and early life stages of demersal species, the documented decline in functional diversity and connectivity has direct implications for trophic transfer efficiency and fishery recruitment. These findings demonstrate that current conditions fall short of Good Environmental Status under the MSFD Descriptor 4 and underscore the need to incorporate mesozooplankton-based indicators into regional monitoring and ecosystem-based management frameworks, ecological status, and support adaptive, ecosystem-based management in the Black Sea.

Supplementary Materials

The following supporting information can be downloaded at: https://www.mdpi.com/article/10.3390/jmse13112151/s1, Figure S1. Boxplots showing variations in mesozooplankton functional groups across the three sectors and seasons in the Romanian Black Sea waters. Figure S2. Relative contributions (%) of major mesozooplankton functional groups across the northern (N), central (C), and southern (S) sectors of the Romanian Black Sea during the cold and warm seasons. Table S1. Pearson correlation coefficients (r) between mesozooplankton functional groups and environmental parameters by season (warm and cold). Red values indicate significant correlations (p < 0.05). Table S2. Redundancy Analysis (RDA) results for the cold season. Table S3. Redundancy Analysis (RDA) results for the warm season.

Author Contributions

Conceptualization, E.B. and L.L.; methodology, E.B.; software, E.B. and L.L.; validation, E.B. and L.L.; formal analysis, E.B. and L.L.; investigation, E.B. and L.L.; resources, E.B. and L.L.; data curation, E.B. and L.L.; writing—original draft preparation, E.B. and L.L.; writing—review and editing, E.B. and L.L.; visualisation, E.B. and L.L.; supervision, E.B. and L.L.; project administration, E.B. and L.L.; funding acquisition, E.B. and L.L. All authors have read and agreed to the published version of the manuscript.

Funding

This research was supported by the Nucleu Programme SMART-BLUE 2023–2026, funded by the Ministry of Research, Innovation and Digitization (grant no. 33N/2023, project codes PN23230201 and PN23230103), as well as by the GES4SEAS project (Achieving Good Environmental Status for Maintaining Ecosystem Services by Assessing Integrated Impacts of Cumulative Pressures), funded by the European Union under the Horizon Europe programme (grant agreement no. 101059877).

Data Availability Statement

Data belong to the National Institute for Marine Research and Development “Grigore Antipa”—NIMRD and can be accessed by the requirement to http://www.nodc.ro/data_policy_nimrd.php (accessed on 1 October 2025).

Conflicts of Interest

The authors declare no conflicts of interest. The funders had no role in the design of the study; in the collection, analyses, or interpretation of data; in the writing of the manuscript; or in the decision to publish the results.

Abbreviations

The following abbreviations are used in this manuscript:
ABCAbundance–Biomass Comparison
ANOSIMAnalysis of similarity
FCMFuzzy Cognitive Mapping
RDARedundancy Analysis
MSFDMarine Strategy Framework Directive
NNorth
CCentral
SSouth
PRIMERPlymouth Routines in Multivariate Ecological Research
IPCCIntergovernmental Panel on Climate Change
GESGood Environmental Status
K-K-selected species

References

  1. Harris, R.; Wiebe, P.; Lenz, J.; Skjoldal, H.R.; Huntley, M. ICES Zooplankton Methodology Manual; Elsevier: Amsterdam, The Netherlands, 2000. [Google Scholar]
  2. Lomartire, S.; Marques, J.C.; Gonçalves, A.M.M. The Key Role of Zooplankton in Ecosystem Services: A Perspective of Interaction between Zooplankton and Fish Recruitment. Ecol. Indic. 2021, 129, 107867. [Google Scholar] [CrossRef]
  3. Richardson, A.J. In Hot Water: Zooplankton and Climate Change. ICES J. Mar. Sci. 2008, 65, 279–295. [Google Scholar] [CrossRef]
  4. Litchman, E.; Ohman, M.D.; Kiørboe, T. Trait-Based Approaches to Zooplankton Communities. J. Plankton Res. 2013, 35, 473–484. [Google Scholar] [CrossRef]
  5. Hays, G.; Richardson, A.; Robinson, C. Climate Change and Marine Plankton. Trends Ecol. Evol. 2005, 20, 337–344. [Google Scholar] [CrossRef] [PubMed]
  6. Bisinicu, E.; Lazǎr, L. Assessing the Black Sea Mesozooplankton Community Following the Nova Kakhovka Dam Breach. J. Mar. Sci. Eng. 2025, 13, 67. [Google Scholar] [CrossRef]
  7. Bisinicu, E.; Harcota, G.E. Baseline Assessment of Black Sea Food Web Integrity Using a Zooplankton-Based Approach Under the Marine Strategy Framework Directive. J. Mar. Sci. Eng. 2025, 13, 713. [Google Scholar] [CrossRef]
  8. Bișinicu, E.; Lazăr, L.; Timofte, F. Dynamics of Zooplankton along the Romanian Black Sea Coastline: Temporal Variation, Community Structure, and Environmental Drivers. Diversity 2023, 15, 1024. [Google Scholar] [CrossRef]
  9. Bisinicu, E.; Lazar, L. Exploring Mesozooplankton Insights by Assessing the Ecological Status of Black Sea Waters Under the Marine Strategy Framework Directive. Oceans 2024, 5, 923–950. [Google Scholar] [CrossRef]
  10. Zaitsev, Y. An Introduction to the Black Sea Ecology; Smil Edition and Publishing Agency: Odessa, Ukraine, 2008. [Google Scholar]
  11. Zaitsev, Y.P.; Alexandrov, B.G.; Berlinsky, N.A.; Zenetos, A. Seas around Europe: The Black Sea: An Oxygen-Poor Sea. In Europe’s Biodiversity: Biogeographical Regions and Seas; European Environment Agency (EEA): Copenhagen, Denmark, 2002. [Google Scholar]
  12. Lazar, L.; Boicenco, L.; Moncheva, S. Impact of the Rivers on the Black Sea Ecosystem; Lazăr, L., Boicenco, L., Moncheva, S., Eds.; CD Press: Constanța, Romania, 2021. [Google Scholar]
  13. Coatu, V.; Ţigănuş, D.; Oros, A.; Lazăr, L. Analysis of Hazardous Substance Contamination of the Marine Ecosystem in the Romanian Black Sea Coast, Part of the Marine Strategy Framework Directive (2008/56/EEC) Implementation. Cercet. Mar. Rech. Mar. 2013, 43, 174–186. [Google Scholar]
  14. Ristea, E.; Pârvulescu, O.C.; Lavric, V.; Oros, A. Assessment of Heavy Metal Contamination of Seawater and Sediments Along the Romanian Black Sea Coast: Spatial Distribution and Environmental Implications. Sustainability 2025, 17, 2586. [Google Scholar] [CrossRef]
  15. Oros, A.; Coatu, V.; Damir, N.; Danilov, D.; Ristea, E. Recent Findings on the Pollution Levels in the Romanian Black Sea Ecosystem: Implications for Achieving Good Environmental Status (GES) Under the Marine Strategy Framework Directive (Directive 2008/56/EC). Sustainability 2024, 16, 9785. [Google Scholar] [CrossRef]
  16. Cociasu, A.; Varga, L.; Lazar, L.; Vasiliu, D. Recent Data Concerning the Evolution of the Eutrophication Level Indicators in Romanian Seawater. J. Environ. Prot. Ecol. 2009, 10, 701–730. [Google Scholar]
  17. Ristea, E.; Bisinicu, E.; Lavric, V.; Parvulescu, O.C.; Lazar, L. A Long-Term Perspective of Seasonal Shifts in Nutrient Dynamics and Eutrophication in the Romanian Black Sea Coast. Sustainability 2025, 17, 1090. [Google Scholar] [CrossRef]
  18. Cîndescu, A.-C.; Petrișoaia, S.; Marin, D.; Buga, L.; Sirbu, G.; Spinu, A. The Variability of the Beach Morphology and the Evolution of the Shoreline in the Strongly Anthropized Sector of Eforie North, the Romanian Coast of the Black Sea. Cercet. Mar. Rech. Mar. 2024, 53, 6–18. [Google Scholar] [CrossRef]
  19. Cîndescu, A.-C.; Petrișoaia, S.; Buga, L.; Spînu, A. Morphological Dynamics Of An Engineered Coastline: A Case Study From Constanța, Black Sea Coast Of Romania. Cercet. Mar. Rech. Mar. 2025, 55, 91–108. [Google Scholar] [CrossRef]
  20. Vespremeanu, E.; Golumbeanu, M. The Black Sea; Springer International Publishing: Cham, Switzerland, 2018. [Google Scholar]
  21. Vereshchaka, A. Navigating the Zooplankton Realm: Oceans of Diversity Beneath the Sea Surface. Diversity 2024, 16, 717. [Google Scholar] [CrossRef]
  22. Bișinicu, E.; Boicenco, L.; Pantea, E.; Timofte, F.; Lazăr, L.; Vlas, O. Qualitative Model of the Causal Interactions between Phytoplankton, Zooplankton, and Environmental Factors in the Romanian Black Sea. Phycology 2024, 4, 168–189. [Google Scholar] [CrossRef]
  23. Lazar, L.; Boicenco, L.; Pantea, E.; Timofte, F.; Vlas, O.; Bișinicu, E. Modeling Dynamic Processes in the Black Sea Pelagic Habitat—Causal Connections between Abiotic and Biotic Factors in Two Climate Change Scenarios. Sustainability 2024, 16, 1849. [Google Scholar] [CrossRef]
  24. Özesmi, U.; Özesmi, S.L. Ecological Models Based on People’s Knowledge: A Multi-Step Fuzzy Cognitive Mapping Approach. Ecol. Model. 2004, 176, 43–64. [Google Scholar] [CrossRef]
  25. Anninsky, B.E.; Finenko, G.A.; Kideys, A.E.; Datsyk, N.A. Environmental Control on Macro- and Mesozooplankton Biomass off Sevastopol Bay: A 20-Year Analysis. Mar. Env. Res. 2025, 211, 107447. [Google Scholar] [CrossRef]
  26. Lazăr, L. (Ed.) ANEMONE Deliverable 2.1. Anthropogenic Pressures and Impacts on the Black Sea Coastal Ecosystem; CD Press: Constanța, Romania, 2021. [Google Scholar]
  27. Lazar, L.; Spanu, A.; Boicenco, L.; Oros, A.; Damir, N.; Bisinicu, E.; Abaza, V.; Filimon, A.; Harcota, G.; Marin, O.; et al. Methodology for Prioritizing Marine Environmental Pressures under Various Management Scenarios in the Black Sea. Front. Mar. Sci. 2024, 11, 1388877. [Google Scholar] [CrossRef]
  28. Korshenko, E.; Panasenkova, I.; Osadchiev, A.; Belyakova, P.; Fomin, V. Synoptic and Seasonal Variability of Small River Plumes in the Northeastern Part of the Black Sea. Water 2023, 15, 721. [Google Scholar] [CrossRef]
  29. Grégoire, M.; Alvera-Azcaráte, A.; Buga, L.; Capet, A.; Constantin, S.; D’ortenzio, F.; Doxaran, D.; Faugeras, Y.; Garcia-Espriu, A.; Golumbeanu, M.; et al. Monitoring Black Sea Environmental Changes from Space: New Products for Altimetry, Ocean Colour and Salinity. Potentialities and Requirements for a Dedicated in-Situ Observing System. Front. Mar. Sci. 2023, 9, 998970. [Google Scholar] [CrossRef]
  30. Cozzi, S.; Ibáñez, C.; Lazar, L.; Raimbault, P.; Giani, M. Flow Regime and Nutrient-Loading Trends from the Largest South European Watersheds: Implications for the Productivity of Mediterranean and Black Sea’s Coastal Areas. Water 2019, 11, 1. [Google Scholar] [CrossRef]
  31. Bisinicu, E.; Harcota, G.E.; Lazar, L. Interactions between Environmental Factors and the Mesozooplankton Community from the Romanian Black Sea Waters. Turk. J. Zool. 2023, 47, 202–215. [Google Scholar] [CrossRef]
  32. Alexandrov, B.; Arashkevich, E.; Gubanova, A.; Korshenko, A. Manual for Mesozooplankton Sampling and Analysis in the Black Sea Monitoring; Black Sea Commission: Istanbul, Turkey, 2014. [Google Scholar]
  33. Petipa, T.S. On the Mean Weight of the Principle Forms of Zooplankton in the Black Sea. Sevast. Biol. Stn. 1957, 9, 39–57. [Google Scholar]
  34. Shiganova, T.A.; Kazmin, A.S. Variability of Mesozooplankton, Abiotic Factors and Ecological Status of Marine Environment in the North-Eastern Part of the Black Sea. Mar. Env. Res. 2024, 202, 106805. [Google Scholar] [CrossRef]
  35. Grasshoff, K.; Kremling, K.; Ehrhardt, M. Methods of Seawater Analysis, 3rd ed.; Grasshoff, K., Kremling, K., Ehrhardt, M., Eds.; Willey-VCH: Weinheim, Germany, 1999. [Google Scholar]
  36. Mullin, J.B.; Riley, J.P. The Spectrophotometric Determination of Nitrate in Natural Waters, with Particular Reference to Sea-Water. Anal. Chim. Acta 1955, 12, 464–480. [Google Scholar] [CrossRef]
  37. TIBCO Software, Inc. TIBCO Statistica, Version 14.0.1.25; TIBCO Software, Inc.: Palo Alto, CA, USA, 2023.
  38. Clarke, K.R.; Warwick, R.M. Change in Marine Communities: An Approach to Statistical Analysis, 3rd ed.; PRIMER-E: Plymouth, UK, 2014. [Google Scholar]
  39. Warwick, R.M.; Clarke, K.R. Relearning the ABC: Taxonomic changes and abundance/biomass relationships in disturbed benthic communities. Mar. Biol. 1994, 118, 739–744. [Google Scholar] [CrossRef]
  40. Cai, W.; Meng, W.; Liu, L.; Lin, K. Evaluation of the Ecological Status with Benthic Indices in the Coastal System: The Case of Bohai Bay (China). Front. Env. Sci. Eng. 2014, 8, 737–746. [Google Scholar] [CrossRef]
  41. Di Lorenzo, T.; Fiasca, B.; Di Cicco, M.; Vaccarelli, I.; Tabilio Di Camillo, A.; Crisante, S.; Galassi, D.M.P. Effectiveness of Biomass/Abundance Comparison (ABC) Models in Assessing the Response of Hyporheic Assemblages to Ammonium Contamination. Water 2022, 14, 2934. [Google Scholar] [CrossRef]
  42. Gray, S.A.; Zanre, E.; Gray, S.R.J. Fuzzy Cognitive Maps for Applied Sciences and Engineering; Springer: Berlin/Heidelberg, Germany, 2014; Volume 54, pp. 29–49. [Google Scholar] [CrossRef]
  43. Leclerc, G. iModeler Manual: A Quick Guide for Fuzzy Cognitive Modelling. EcoAdapt Working Paper Series N2. 2014. Available online: https://agritrop.cirad.fr/583310/1/ID583310.pdf (accessed on 1 October 2025).
  44. Gray, S.A.; Gray, S.; Cox, L.J.; Henly-Shepard, S. Mental Modeler: A Fuzzy-Logic Cognitive Mapping Modeling Tool for Adaptive Environmental Management. In Proceedings of the 2013 46th Hawaii International Conference on System Sciences, Maui, HI, USA, 7–10 January 2013; pp. 965–973. [Google Scholar]
  45. IPCC. Climate Change 2014: Synthesis Report. Contribution of Working Groups I, II and III to the Fifth Assessment Report of the Intergovernmental Panel on Climate Change; IPCC: Geneva, Switzerland, 2014. [Google Scholar]
  46. Yildiz, İ. Cladoceran Species and Their Population Abundance across the Black Sea from West to East during Summer 2020. J. Nat. Hist. 2025, 59, 271–283. [Google Scholar] [CrossRef]
  47. Weinstock, J.B.; Vargas, L.; Collin, R. Zooplankton Abundance Reflects Oxygen Concentration and Dissolved Organic Matter in a Seasonally Hypoxic Estuary. J. Mar. Sci. Eng. 2022, 10, 427. [Google Scholar] [CrossRef]
  48. O’Neill, B.C.; Carter, T.R.; Ebi, K.; Harrison, P.A.; Kemp-Benedict, E.; Kok, K.; Kriegler, E.; Preston, B.L.; Riahi, K.; Sillmann, J.; et al. Achievements and Needs for the Climate Change Scenario Framework. Nat. Clim. Change 2020, 10, 1074–1084. [Google Scholar] [CrossRef]
  49. Sharples, J.; Middelburg, J.J.; Fennel, K.; Jickells, T.D. What Proportion of Riverine Nutrients Reaches the Open Ocean? Glob. Biogeochem. Cycles 2017, 31, 39–58. [Google Scholar] [CrossRef]
  50. Gao, L.; Li, D.J.; Ding, P.X. Variation of Nutrients in Response to the Highly Dynamic Suspended Particulate Matter in the Changjiang (Yangtze River) Plume. Cont. Shelf Res. 2008, 28, 2393–2403. [Google Scholar] [CrossRef]
  51. Berg, G.M.; Glibert, P.M.; Jorgensen, N.O.G.; Balode, M.; Purina, I. Variability in Inorganic and Organic Nitrogen Uptake Associated with Riverine Nutrient Input in the Gulf of Riga, Baltic Sea. Estuaries 2007, 24, 204. [Google Scholar] [CrossRef]
  52. Seitzinger, S.P.; Mayorga, E.; Bouwman, A.F.; Kroeze, C.; Beusen, A.H.W.; Billen, G.; Van Drecht, G.; Dumont, E.; Fekete, B.M.; Garnier, J.; et al. Global River Nutrient Export: A Scenario Analysis of Past and Future Trends. Glob. Biogeochem. Cycles 2010, 24, GB0A08. [Google Scholar] [CrossRef]
  53. Chen, X.; Cui, Z.; Zhang, Y.; Zhang, X.; Chen, J.; Wei, Y. Contrasting effects of river inflow and seawater intrusion on zooplankton community structure in Jiaozhou bay, the Yellow Sea. Mar. Environ. Res. 2023, 192, 106194. [Google Scholar] [CrossRef]
  54. Wang, X.; Chen, Y.; Yuan, Q.; Xing, X.; Hu, B.; Gan, J.; Zheng, Y.; Liu, Y. Effect of River Damming on Nutrient Transport and Transformation and Its Countermeasures. Front. Mar. Sci. 2022, 9, 1078216. [Google Scholar] [CrossRef]
  55. Arashkevich, E.G.; Stefanova, K.; Bandelj, V.; Siokou, I.; Terbiyik Kurt, T.; Ak Orek, Y.; Timofte, F.; Timonin, A.; Solidoro, C. Mesozooplankton in the Open Black Sea: Regional and Seasonal Characteristics. J. Mar. Syst. 2014, 135, 81–96. [Google Scholar] [CrossRef]
  56. Türkoǧlu, M.; Koray, T. Phytoplankton Species’ Succession and Nutrients in the Southern Black Sea (Bay of Sinop). Turk. J. Bot. 2002, 26, 235–252. [Google Scholar]
  57. Turkoglu, M. Red Tides of the Dinoflagellate Noctiluca Scintillans Associated with Eutrophication in the Sea of Marmara (the Dardanelles, Turkey). Oceanologia 2013, 55, 709–732. [Google Scholar] [CrossRef]
  58. Kopuz, U.; Feyzioglu, A.M.; Valente, A. An Unusual Red-Tide Event of Noctiluca Scintillans (Macartney) in the Southeastern Black Sea. Turk. J. Fish. Aquat. Sci. 2014, 14, 261–268. [Google Scholar] [CrossRef]
  59. Aytan, U.; Senturk, Y. Dynamics of Noctiluca Scintillans (Macartney) Kofoid & Swezy and Its Contribution to Mesozooplankton in the Southeastern Black Sea. Aquat. Sci. Eng. 2018, 33, 84–89. [Google Scholar] [CrossRef]
  60. Kideys, A.E. Ecology: Fall and Rise of the Black Sea Ecosystem. Science 2002, 297, 1482–1484. [Google Scholar] [CrossRef]
  61. Daskalov, G.M.; Grishin, A.N.; Rodionov, S.; Mihneva, V. Trophic Cascades Triggered by Overfishing Reveal Possible Mechanisms of Ecosystem Regime Shifts. Proc. Natl. Acad. Sci. USA 2007, 104, 10518–10523. [Google Scholar] [CrossRef] [PubMed]
  62. Daskalov, G.M.; Boicenco, L.; Grishin, A.N.; Lazar, L.; Mihneva, V.; Shlyakhov, V.A.; Zengin, M. Architecture of Collapse: Regime Shift and Recovery in an Hierarchically Structured Marine Ecosystem. Glob. Change Biol. 2017, 23, 1486–1498. [Google Scholar] [CrossRef] [PubMed]
  63. Elbrächter, M.; Qi, Z. Aspects of Noctiluca (Dinophyceae) Population Dynamics, Physiological Ecology of Harmful Algal Blooms; Anderson, D.M., Cembella, A.D., Hallegraeff, G.M., Eds.; Springer: Berlin/Heidelberg, Germany, 1998. [Google Scholar]
  64. Piontkovski, S.A.; Serikova, I.M.; Evstigneev, V.P.; Prusova, I.Y.; Zagorodnaya, Y.A.; Al-Hashmi, K.A.; Al-Abri, N.M. Seasonal Blooms of the Dinoflagellate Algae Noctiluca Scintillans: Regional and Global Scale Aspects. Reg. Stud. Mar. Sci. 2021, 44, 101771. [Google Scholar] [CrossRef]
  65. Nikishina, A.B.; Drits, A.V.; Vasilyeva, Y.V.; Timonin, A.G.; Solovyev, K.A.; Ratkova, T.N.; Sergeeva, V.M. Role of the Noctiluca Scintillans Population in the Trophic Dynamics of the Black Sea Plankton over the Spring Period. Oceanology 2011, 51, 1029–1039. [Google Scholar] [CrossRef]
  66. Ollevier, A.; Mortelmans, J.; Aubert, A.; Deneudt, K.; Vandegehuchte, M.B. Noctiluca Scintillans: Dynamics, Size Measurements and Relationships With Small Soft-Bodied Plankton in the Belgian Part of the North Sea. Front. Mar. Sci. 2021, 8, 777999. [Google Scholar] [CrossRef]
  67. Mee, L.; Friedrich, J.; Gomoiu, M. Restoring the Black Sea in Times of Uncertainty. Oceanography 2012, 18, 100–111. [Google Scholar] [CrossRef]
  68. McQuatters-Gollop, A.; Mee, L.D.; Raitsos, D.E.; Shapiro, G.I. Non-Linearities, Regime Shifts and Recovery: The Recent Influence of Climate on Black Sea Chlorophyll. J. Mar. Syst. 2008, 74, 649–658. [Google Scholar] [CrossRef]
  69. Yunev, O.A.; Moncheva, S.; Carstensen, J. Long-Term Variability of Vertical Chlorophyll a and Nitrate Profiles in the Open Black Sea: Eutrophication and Climate Change. Mar. Ecol. Prog. Ser. 2005, 294, 95–107. [Google Scholar] [CrossRef]
  70. Moncheva, S.; Gotsis-Skretas, O.; Pagou, K.; Krastev, A. Phytoplankton Blooms in Black Sea and Mediterranean Coastal Ecosystems Subjected to Anthropogenic Eutrophication: Similarities and Differences. Estuar. Coast. Shelf Sci. 2001, 53, 281–295. [Google Scholar] [CrossRef]
  71. Moncheva, S.; Dontcheva, V.; Shtereva, G.; Kamburska, L.; Malej, A.; Gorinstein, S. Application of Eutrophication Indices for Assessment of the Bulgarian Black Sea Coastal Ecosystem Ecological Quality. Water Sci. Technol. 2002, 46, 19–28. [Google Scholar] [CrossRef] [PubMed]
  72. Gerakaris, V.; Varkitzi, I.; Orlando-Bonaca, M.; Kikaki, K.; Mozetič, P.; Lardi, P.I.; Francé, J. Benthic-pelagic coupling of marine primary producers under different natural and human-induced pressures’ regimes. Front. Mar. Sci. 2022, 9, 909927. [Google Scholar] [CrossRef]
  73. Oguz, T.; Velikova, V. Abrupt Transition of the Northwestern Black Sea Shelf Ecosystem from a Eutrophic to an Alternative Pristine State. Mar. Ecol. Prog. Ser. 2010, 405, 231–242. [Google Scholar] [CrossRef]
  74. McQuatters-Gollop, A.; Gilbert, A.J.; Mee, L.D.; Vermaat, J.E.; Artioli, Y.; Humborg, C.; Wulff, F. How Well Do Ecosystem Indicators Communicate the Effects of Anthropogenic Eutrophication? Estuar. Coast. Shelf Sci. 2009, 82, 583–596. [Google Scholar] [CrossRef]
  75. Zaitsev, Y. Recent Changes in the Trophic Structure of the Black Sea. Fish. Ocean. 1992, 1, 180–189. [Google Scholar] [CrossRef]
  76. Adler, G.; Jespersen, P. Variations saisonnières chez quelques Copépodes planctoniques marins. In Meddelelser fra Kommissionen for Havundersøgelser; Serie: Plankton; C.A. Reitzel: Copenhague, Denmark, 1920; Volume 2, pp. 1–20. [Google Scholar]
  77. Evans, F. An Investigation into the Relationship of Sea Temperature and Food Supply to the Size of the Planktonic Copepod Temora Longicornis Müller in the North Sea. Estuar. Coast. Shelf Sci. 1981, 13, 145–158. [Google Scholar] [CrossRef]
  78. Uye, S.I. Resting Egg Production as a Life History Strategy of Marine Planktonic Copepods. Bull. Mar. Sci. 1985, 37, 440–449. [Google Scholar]
  79. Belmonte, G.; Vaglio, I.; Rubino, F.; Alabiso, G. Zooplankton Composition along the Confinement Gradient of the Taranto Sea System (Ionian Sea, South-Eastern Italy). J. Mar. Syst. 2013, 128, 222–238. [Google Scholar] [CrossRef]
  80. Horne, C.R.; Hirst, A.G.; Atkinson, D. A Synthesis of Major Environmental-Body Size Clines of the Sexes within Arthropod Species. Oecologia 2019, 190, 343–353. [Google Scholar] [CrossRef]
  81. Brun, P.; Payne, M.R.; Kiørboe, T. Trait Biogeography of Marine Copepods—An Analysis across Scales. Ecol. Lett. 2016, 19, 1403–1413. [Google Scholar] [CrossRef]
  82. Benedetti, F.; Vogt, M.; Elizondo, U.H.; Righetti, D.; Zimmermann, N.E.; Gruber, N. Major Restructuring of Marine Plankton Assemblages under Global Warming. Nat. Commun. 2021, 12, 5226. [Google Scholar] [CrossRef] [PubMed]
  83. Atkinson, A.; Lilley, M.K.S.; Hirst, A.G.; McEvoy, A.J.; Tarran, G.A.; Widdicombe, C.; Fileman, E.S.; Woodward, E.M.S.; Schmidt, K.; Smyth, T.J.; et al. Increasing Nutrient Stress Reduces the Efficiency of Energy Transfer through Planktonic Size Spectra. Limnol. Ocean. 2021, 66, 422–437. [Google Scholar] [CrossRef]
  84. Lazar, L.; Rodino, S.; Pop, R.; Tiller, R.; D’Haese, N.; Viaene, P.; De Kok, J.-L. Sustainable Development Scenarios in the Danube Delta—A Pilot Methodology for Decision Makers. Water 2022, 14, 3484. [Google Scholar] [CrossRef]
  85. Bisinicu, E.; Harcota, G.E.; Lazǎr, L.; Niţǎ, V.; Țotoiu, A.; Ţiganov, G. Fish Abundance and Mesozooplankton Resource: A Study on Sprattus Sprattus (Linnaeus, 1758) (Actinopterygii: Clupeidae) in the Romanian Black Sea Waters. Acta Zool. Bulg. 2024, 76, 215–224. [Google Scholar] [CrossRef]
  86. D’Alelio, D.; Montresor, M.; Mazzocchi, M.G.; Margiotta, F.; Sarno, D.; Ribeira d’Alcalà, M. Plankton Food-Webs: To What Extent Can They Be Simplified? Adv. Ocean. Limnol. 2016, 7. [Google Scholar] [CrossRef]
  87. Smith, W.; Steinberg, D.; Bronk, D.; Tang, K. Marine Plankton Food Webs and Climate Change; William & Mary VIMS: Gloucester Point, VA, USA, 2008; pp. 1–4. [Google Scholar]
  88. Maciej Gliwicz, Z. On the Different Nature of Top-down and Bottom-up Effects in Pelagic Food Webs. Freshw. Biol. 2002, 47, 2296–2312. [Google Scholar] [CrossRef]
  89. Crise, A.; Kaberi, H.; Ruiz, J.; Zatsepin, A.; Arashkevich, E.; Giani, M.; Karageorgis, A.P.; Prieto, L.; Pantazi, M.; Gonzalez-Fernandez, D.; et al. A MSFD Complementary Approach for the Assessment of Pressures, Knowledge and Data Gaps in Southern European Seas: The PERSEUS Experience. Mar. Pollut. Bull. 2015, 95, 28–39. [Google Scholar] [CrossRef] [PubMed]
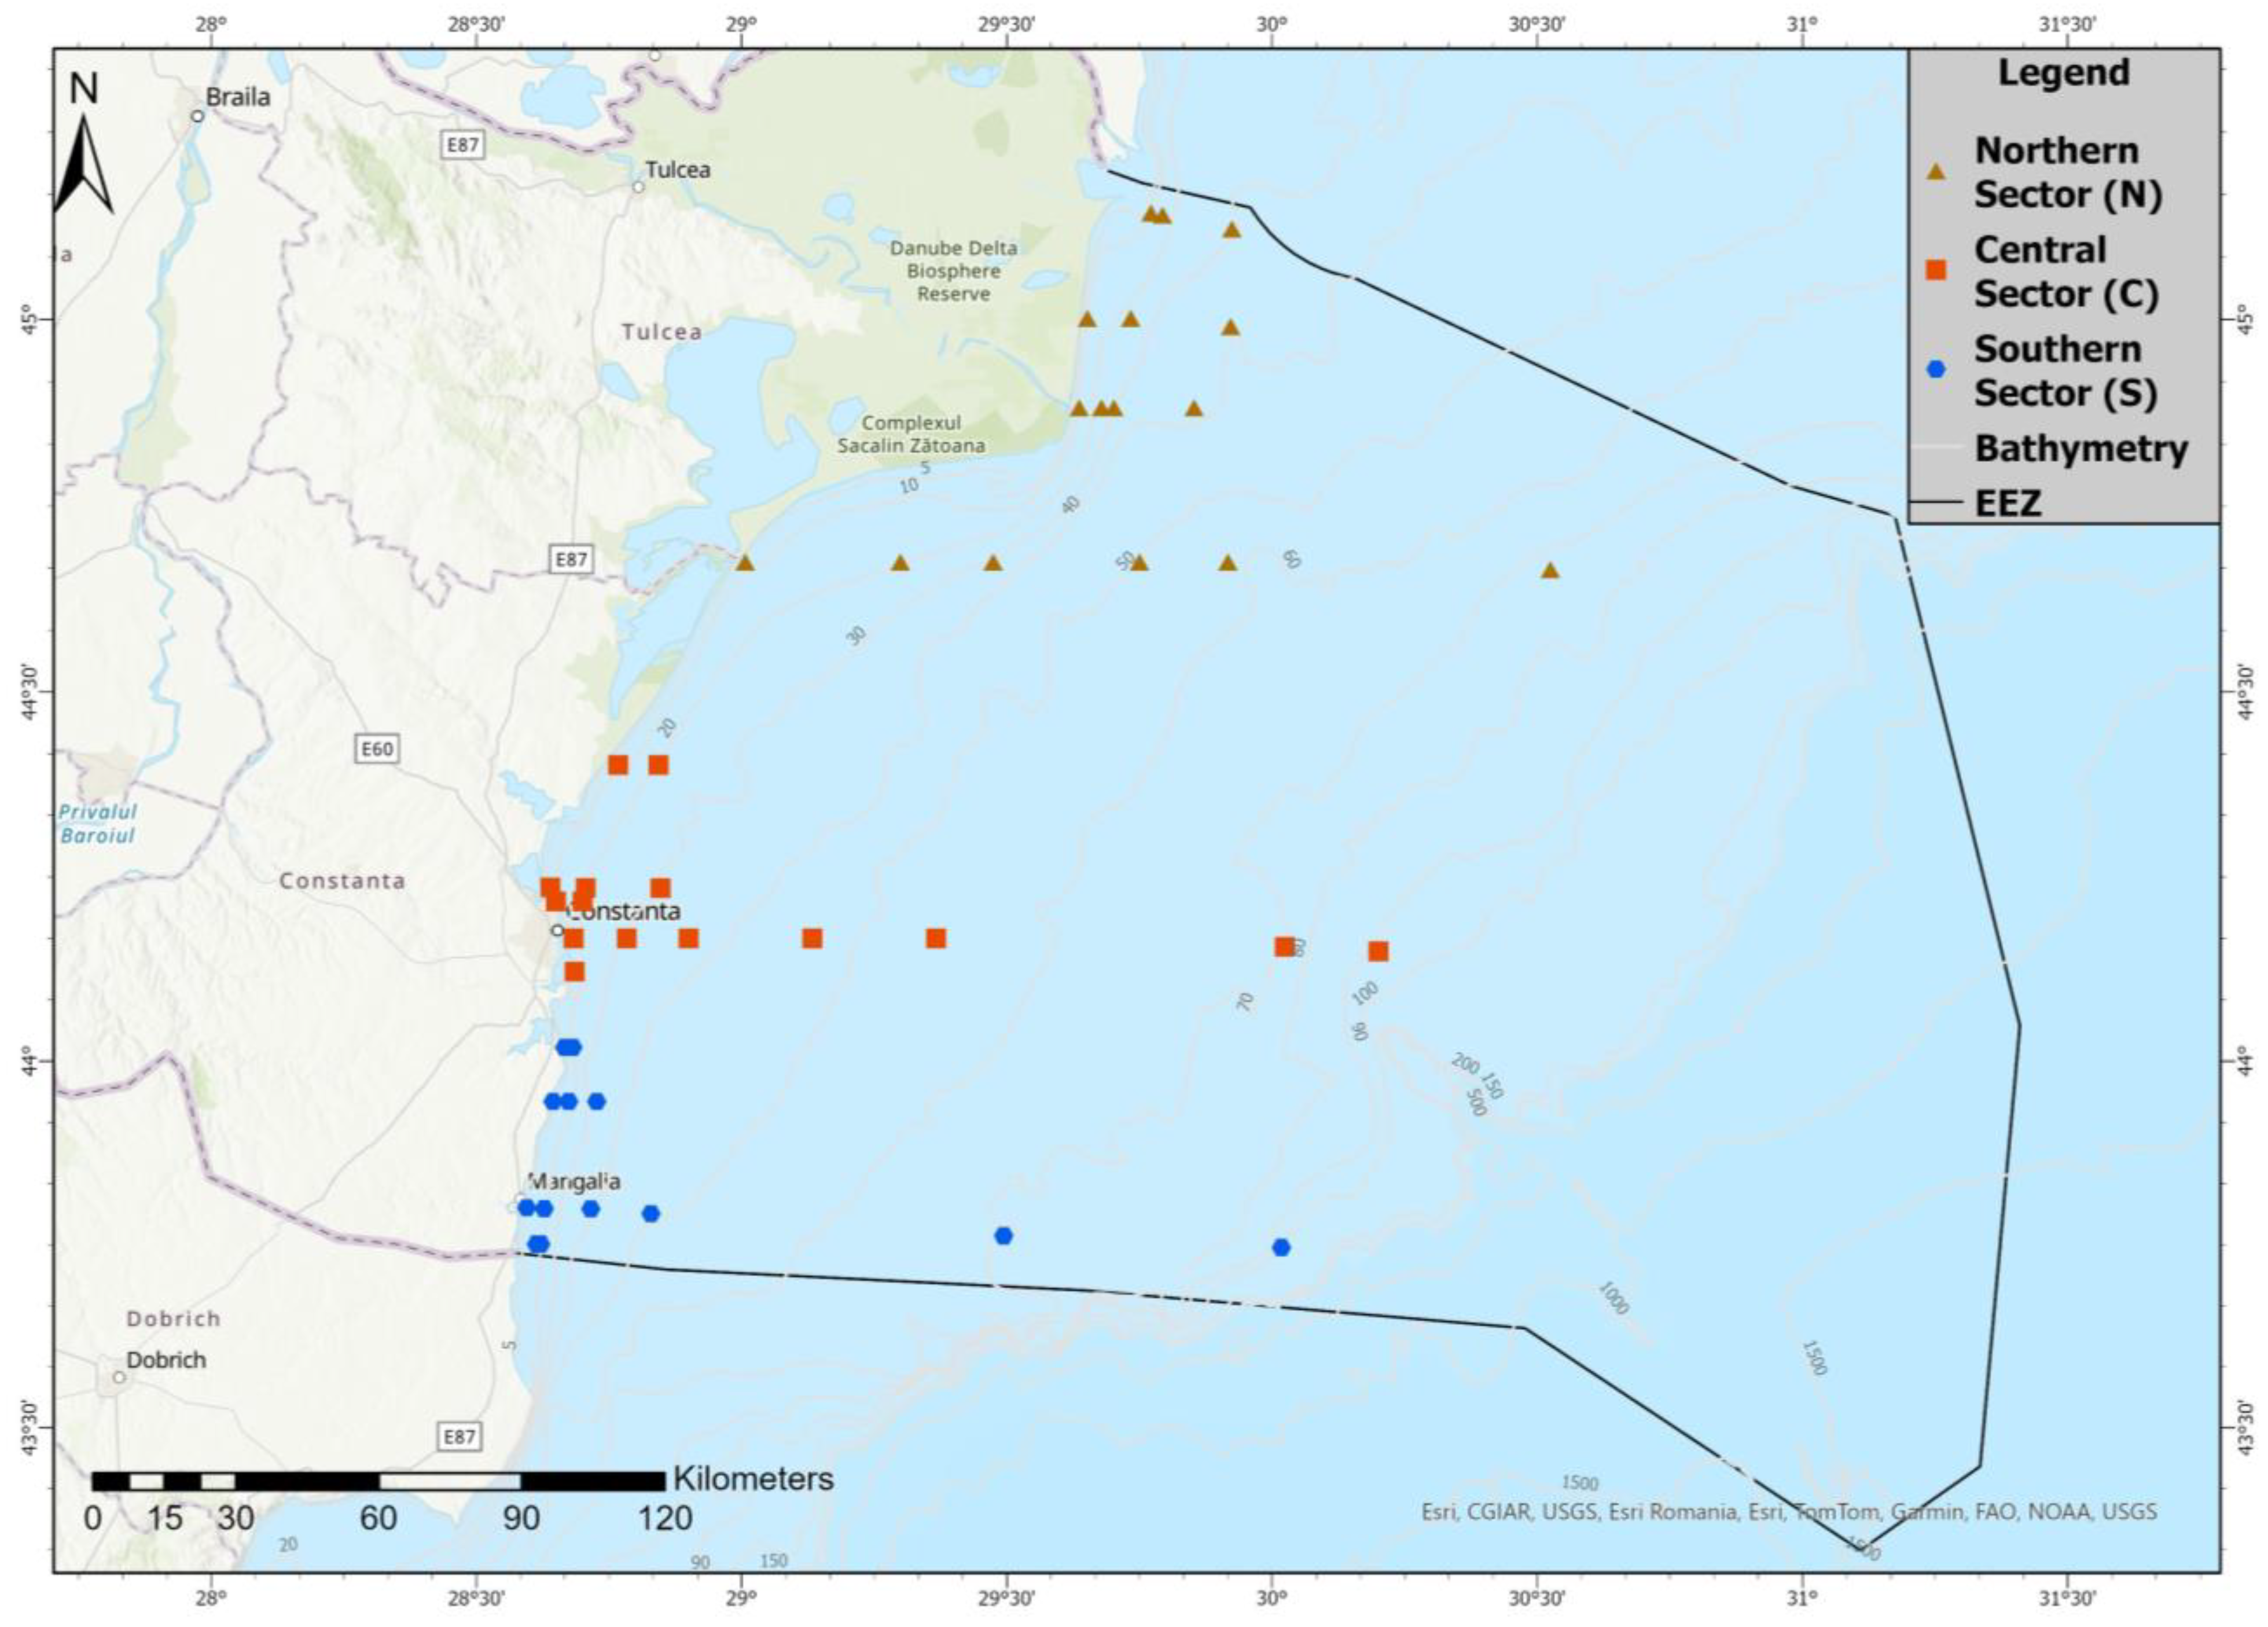
Figure 1. Sampling stations along the Romanian Black Sea coast, grouped by sector: Northern (triangles), Central (squares), and Southern (circles).
Jmse 13 02151 g001
Figure 2. Spatial and temporal variability in the abundance and biomass of Noctiluca scintillans along the Romanian Black Sea coast, grouped by sectors and seasons.
Jmse 13 02151 g002
Figure 3. Spatial and temporal variability in the abundance and biomass of Copepoda along the Romanian Black Sea coast, grouped by sectors and seasons.
Jmse 13 02151 g003
Figure 4. Spatial and temporal variability in the abundance and biomass of Cladocera along the Romanian Black Sea coast, grouped by sectors and seasons.
Jmse 13 02151 g004
Figure 5. Spatial and temporal variability in the abundance and biomass of meropankton along the Romanian Black Sea coast, grouped by sectors and seasons.
Jmse 13 02151 g005
Figure 6. Spatial and temporal variability the abundance and biomass of other groups along the Romanian Black Sea coast, grouped by sectors and seasons.
Jmse 13 02151 g006
Figure 7. ANOSIM R values showing differences in mesozooplankton structure between the cold and warm seasons and across sectors.
Jmse 13 02151 g007
Figure 8. Average abundance (top) and biomass (bottom) of dominant mesozooplankton taxa along the Romanian Black Sea waters, grouped by sectors and seasons.
Jmse 13 02151 g008
Figure 9. ABC curves for mesozooplankton in the cold season across the three Romanian Black Sea sectors.
Jmse 13 02151 g009
Figure 10. ABC curves for mesozooplankton in the warm season across the three Romanian Black Sea sectors.
Jmse 13 02151 g010
Figure 11. Fuzzy Cognitive Map (FCM) of hydrographic–nutrient interactions with mesozooplankton during the cold season by sector in the Romanian Black Sea (blue arrows—positive correlations, orange arrows—negative correlations).
Jmse 13 02151 g011
Figure 12. Fuzzy Cognitive Map (FCM) of hydrographic–nutrient interactions with mesozooplankton during the warm season by sector in the Romanian Black Sea (blue arrows—positive correlations, orange arrows—negative correlations).
Jmse 13 02151 g012
Figure 13. Projected relative changes in mesozooplankton groups under different climate forcing scenarios in the Romanian Black Sea.
Jmse 13 02151 g013
Table 1. Number of samples collected by season, sector, and year along the Romanian Black Sea coast (2013–2020).
SeasonSector20132014201520162017201820192020Total
ColdN-14-1112---37
C-13-514---32
S-11-135---29
WarmN1214166616141599
C17161467211015106
S1811126-13121385
Table 2. Climate change scenarios used in Fuzzy Cognitive Mapping simulations for the Romanian Black Sea coast.
ScenarioTemperatureSalinityEcological Context
Improbable↓ (cooling)↑ (increase)Unlikely regional cooling; stronger marine influence.
Probable↑ (warming)↓ (decrease)Most likely outcome: warming with reduced freshwater retention.
Extreme↑↑ (strong warming)↓↓ (strong decrease)High-emissions trajectory; intensified freshwater inflow, stratification, and eutrophication risk.
Table 3. Hydrographic and nutrient parameters in the three coastal sectors of the Romanian Black Sea—Seasonal mean ± Standard Deviation.
SectorSeasonT
(°C)
S
(‰)
O2
(µM)
PO4
(µM)
SiO4
(µM)
NO2
(µM)
NO3
(µM)
NH4
(µM)
NCold8.07 ± 2.1714.59 ± 3.74345.72 ± 26.750.56 ± 0.5332.49 ± 27.700.90 ± 1.315.22 ± 4.464.99 ± 4.67
CCold9.37 ± 1.9817.05 ± 1.66316.74 ± 26.810.27 ± 0.2334.23 ± 39.150.30 ± 0.183.85 ± 4.315.91 ± 11.03
SCold8.99 ± 1.3316.57 ± 1.17327.52 ± 35.600.18 ± 0.1720.17 ± 17.200.45 ± 0.232.59 ± 2.066.54 ± 5.05
NWarm21.35 ± 2.9812.33 ± 5.04335.94 ± 54.680.47 ± 0.4617.15 ± 19.712.62 ± 6.747.20 ± 8.098.65 ± 8.61
CWarm22.53 ± 2.8915.30 ± 2.78310.98 ± 52.500.25 ± 0.315.08 ± 3.901.90 ± 4.584.68 ± 7.198.36 ± 7.47
SWarm21.85 ± 2.9815.09 ± 3.04295.79 ± 44.450.31 ± 0.324.92 ± 4.522.64 ± 6.214.89 ± 9.667.98 ± 8.06
Table 4. Summary of ABC curve outcomes and W statistics by sector and season.
SectorSeasonW ValueEcological Interpretation
NCold0.119Relatively stable community. Biomass dominance indicates good structural integrity, though small taxa remain numerous.
CCold0.102Moderately stable community. Biomass above abundance, but smaller W suggests slightly higher stress than in the northern sector.
SCold–0.102Disturbed community. Abundance exceeds biomass, indicating dominance of small, opportunistic taxa and loss of structural complexity.
NWarm0.088Weak stability. Biomass slightly exceeds abundance; the community retains some structure, but stress begins to increase under summer conditions.
CWarm0.088Weak stability. Narrow biomass–abundance gap; balanced contributions of small opportunists and larger species.
SWarm0.016Transitional toward disturbance. The convergence of abundance and biomass curves suggests declining structural stability and a shift toward opportunistic, stress-tolerant taxa.
Disclaimer/Publisher’s Note: The statements, opinions and data contained in all publications are solely those of the individual author(s) and contributor(s) and not of MDPI and/or the editor(s). MDPI and/or the editor(s) disclaim responsibility for any injury to people or property resulting from any ideas, methods, instructions or products referred to in the content.