1. Introduction
Recent advancements in coastal engineering have emphasized significant developments in the construction of breakwaters and similar structures. These endeavors aim to stabilize coasts [
1,
2,
3] or to safeguard ports to meet navigational demands [
4]. Among various types of breakwaters, traditional rubble mound breakwaters have been extensively employed worldwide due to their capability to dissipate wave energy, relative structural simplicity, and the ease of construction using rubble and large concrete blocks.
A rubble mound breakwater is a type of coastal structure composed of multiple layers of quarried rock or concrete armor units, with larger stones on the outer layers to dissipate wave energy and smaller core materials providing structural stability. The main body of a rubble mound breakwater constitutes an underwater slope, consequently making slip failure a prevalent failure mode. Such failures typically develop within the core or along its interface with the armor layer when the effective shear stress transmitted between sediment particles exceeds a critical limit on a potential slip plane. The behavior of submerged slopes differs from that of emerged slopes, as they are not only subjected to gravitational load but also to complex hydrodynamic environments. In addition to submarine earthquakes, wave impacts, seawater erosion, and seabed liquefaction are also significant factors contributing to the instability of underwater slopes [
5]. Consequently, the assessment of the stability of the breakwater–seabed system in actual ocean environments is more complex and thus crucial for structural design and disaster prevention.
An important part of the overall design of rubble mound breakwater is designing armor units massive enough to withstand the wave-induced loads. The direct assessment of hydrodynamic forces on individual armor units has historically been challenging, primarily due to the highly turbulent and multidirectional flow through the interstitial voids of the armor layer. In response to this complexity, recent research has undertaken steps to enhance the fundamental understanding of the hydrodynamics within breakwater armor layers, leading to improved analytical and numerical modeling capabilities. Latham et al. [
6] illustrated a range of DEM and FEMDEM methods being developed for coastal engineers with special reference to armor stability and breakage. Van den Bosch et al. [
7] investigated the hydraulic stability of single-layer, interlocking armor units on low-crested and submerged breakwaters in hydraulic model tests. Van Gent and Van Der Werf [
8] investigated the stability of rock toe structures of rubble mound breakwaters based on model tests. Then, Douglas et al. [
9] conducted a series of experimental tests in a wave flume at the National Research Council of Canada to study the hydrodynamics of breakwater armor layers.
Meanwhile, extensive research has been devoted to the dynamic behavior of soils surrounding breakwaters, primarily involving analytical approximations, numerical simulations, or laboratory flume experiments. Ulker et al. [
10] applied the Finite Element Method to simulate the behavior of the seabed-breakwater system, investigating the dynamic resonant wave response and instability in the vicinity of the caisson breakwater. Muttray et al. [
11] carried out a two-dimensional hydraulic model test to investigate the stability of single-layer armor units on submerged breakwaters under wave action. Ye et al. [
12] employed the PORO-WSSI comprehensive method to examine the dynamics and stability of breakwaters subjected to tsunami wave forces. Rafiei et al. [
13] adopted a numerical model to simulate the coupling of waves, seabed, and structure, and discussed the influence of different coupling modes on seabed stability analysis. Celli et al. [
14] evaluated the reaction of soil to pressure on the seabed induced by waves and emphasized the influence of toe berm dimension on the stability of rubble mound breakwater. Diwedar et al. [
15] performed physical model experiments to analyze the influence of main wave parameters on the stability of breakwater armor layers and utilized precise digital cameras to record the movement of individual stones, thereby assessing the extent of damage to the armor layer. Mata and van Gent [
16] conducted numerical simulations on the interaction between waves and rock-armored rubble mound breakwaters, examining the influence of slope angle, berms in the seaward slope, protruding crest walls, curved parapets, and wave steepness on wave overtopping. Díaz-Carrasco et al. [
17] conducted physical experiments to investigate the reflection patterns of waves on rubble mound breakwaters. Based on their findings, they proposed an improved and more accurate formula for estimating the reflection coefficient of rubble mound breakwaters.
The above-mentioned research on rubble mound breakwaters primarily focuses on seabed liquefaction, the stability of armor layer blocks, scouring, and wave behaviors such as overtopping and reflection. In contrast, there has been relatively less investigation into the risk of shear failure of the entire breakwater under extremal wave action. Moreover, existing analytical methods often focus on studying the stress and strain of a local part or a specific sub-component of the breakwater to infer and calculate their stability [
13,
14,
15]. However, this approach lacks comprehensiveness, making it challenging to determine the precise location of the failure surface and the magnitude of displacement for the entire breakwater under specific conditions. Most critically, current research has yet to provide a clear indicator for evaluating the overall shear stability of the breakwater–seabed system. This study proposes that the Strength Reduction Method (SRM) can address these limitations. Since Zienkiewicz et al. [
18] introduced the Finite Element Strength Reduction Method, the application of SRM in engineering has been widely adopted in the stability evaluation of land slopes. This method offers several advantages, including its applicability to complex geometries, boundary conditions, and loading scenarios. Additionally, it provides critical parameters such as stresses, displacements, and pore pressures—information that the Limit Equilibrium Method (LEM) cannot obtain [
19].
However, despite its widespread application in geotechnical stability analysis, SRM has rarely been employed to evaluate the stability of breakwaters. Therefore, the present study employs the SRM for stability analysis, using the FOS (factor of stability) as an evaluation metric. In fact, several recent studies have utilized the strength reduction method (SRM) to assess wave-induced submarine landslides. For instance, Chen et al. [
20] developed a comprehensive numerical method for wave–seabed interactions and applied SRM to evaluate the stability of temporary slopes excavated during the construction of submarine pipeline. Similarly, Rafiei et al. [
21] analyzed the instability of coastal slopes in the Fraser River Delta, caused by a storm in 1985, using a comprehensive finite element model combined with the SRM.
However, previous studies [
20,
21] have primarily focused on the stability of submarine slopes under linear waves. In contrast, our research specifically investigates stability of rubble mound breakwaters under solitary wave loading—a scenario that has received relatively little attention. The most distinctive characteristic of solitary waves is that their entire profile lies above the still water level. Due to their simple and clear representation, solitary waves have commonly been used to model tsunamis especially in experimental and numerical studies [
22,
23,
24]. This study could provide new insights into the interaction mechanisms between solitary waves and rubble mound structures.
To achieve this, a comprehensive numerical model of the wave–seabed–breakwater system is established. It is crucial to note that this study focuses specifically on the geotechnical stability (i.e., shear failure and sliding) of the breakwater core and its foundation under wave-induced loading. The armor layer is simplified as a porous continuum for the purpose of pressure transmission. Consequently, the well-established hydraulic failure modes of rubble mound breakwaters, such as the displacement and erosion of individual armor units, are not simulated in this model. Hudson-type formulae have been developed which describe the stability of breakwater armor layers under wave attack [
25]. The findings presented herein should therefore be interpreted as evaluating the internal structural integrity under the pre-condition of an intact armor layer and are not directly transferable to holistic breakwater design without incorporating standard hydraulic stability considerations.
In this study, the additional hydraulic pressure on the seabed and structure surface induced by waves is calculated using FLOW-3D and then imported into COMSOL Multiphysics to apply it to the seabed and structure surfaces [
20,
26,
27]. Darcy’s law is used to model the wave-induced pore pressure within the breakwater and seabed. The Mohr–Coulomb model is used based on the SRM to numerically calculate the elasto-plastic failure of the seabed and breakwater. Finally, the influences of parameters such as soil shear strength index, wave height, slope gradient of breakwater, wave–current interaction, and berm are analyzed.
3. Stability Analysis of Rubble Mound Breakwaters
The wave module is integrated with the seabed module through a one-way coupling approach. The N-S equations in the wave module are solved using the Finite Difference Method (FDM), while the Finite Element Method (FEM) is employed to compute the pore water pressure and seabed response in the seabed module. As depicted in
Figure 1, since this study does not focus on the movement of armor units or the complex fluid dynamics within them, the armor layer has been simplified as a thin, porous layer with large pores instead of distinct armor units (the porosity is assumed to be 0.4). The thickness of the armor layer is assumed to be 1.5 m. Additionally, the seabed module considers only the armor layer and core, without including a filter layer. Consequently, this study does not emphasize internal turbulence within the breakwater.
L remains constant with
L = 33.0 m, ensuring a seaward slope of 1:2 and a landward slope of 1:1.5 [
39].
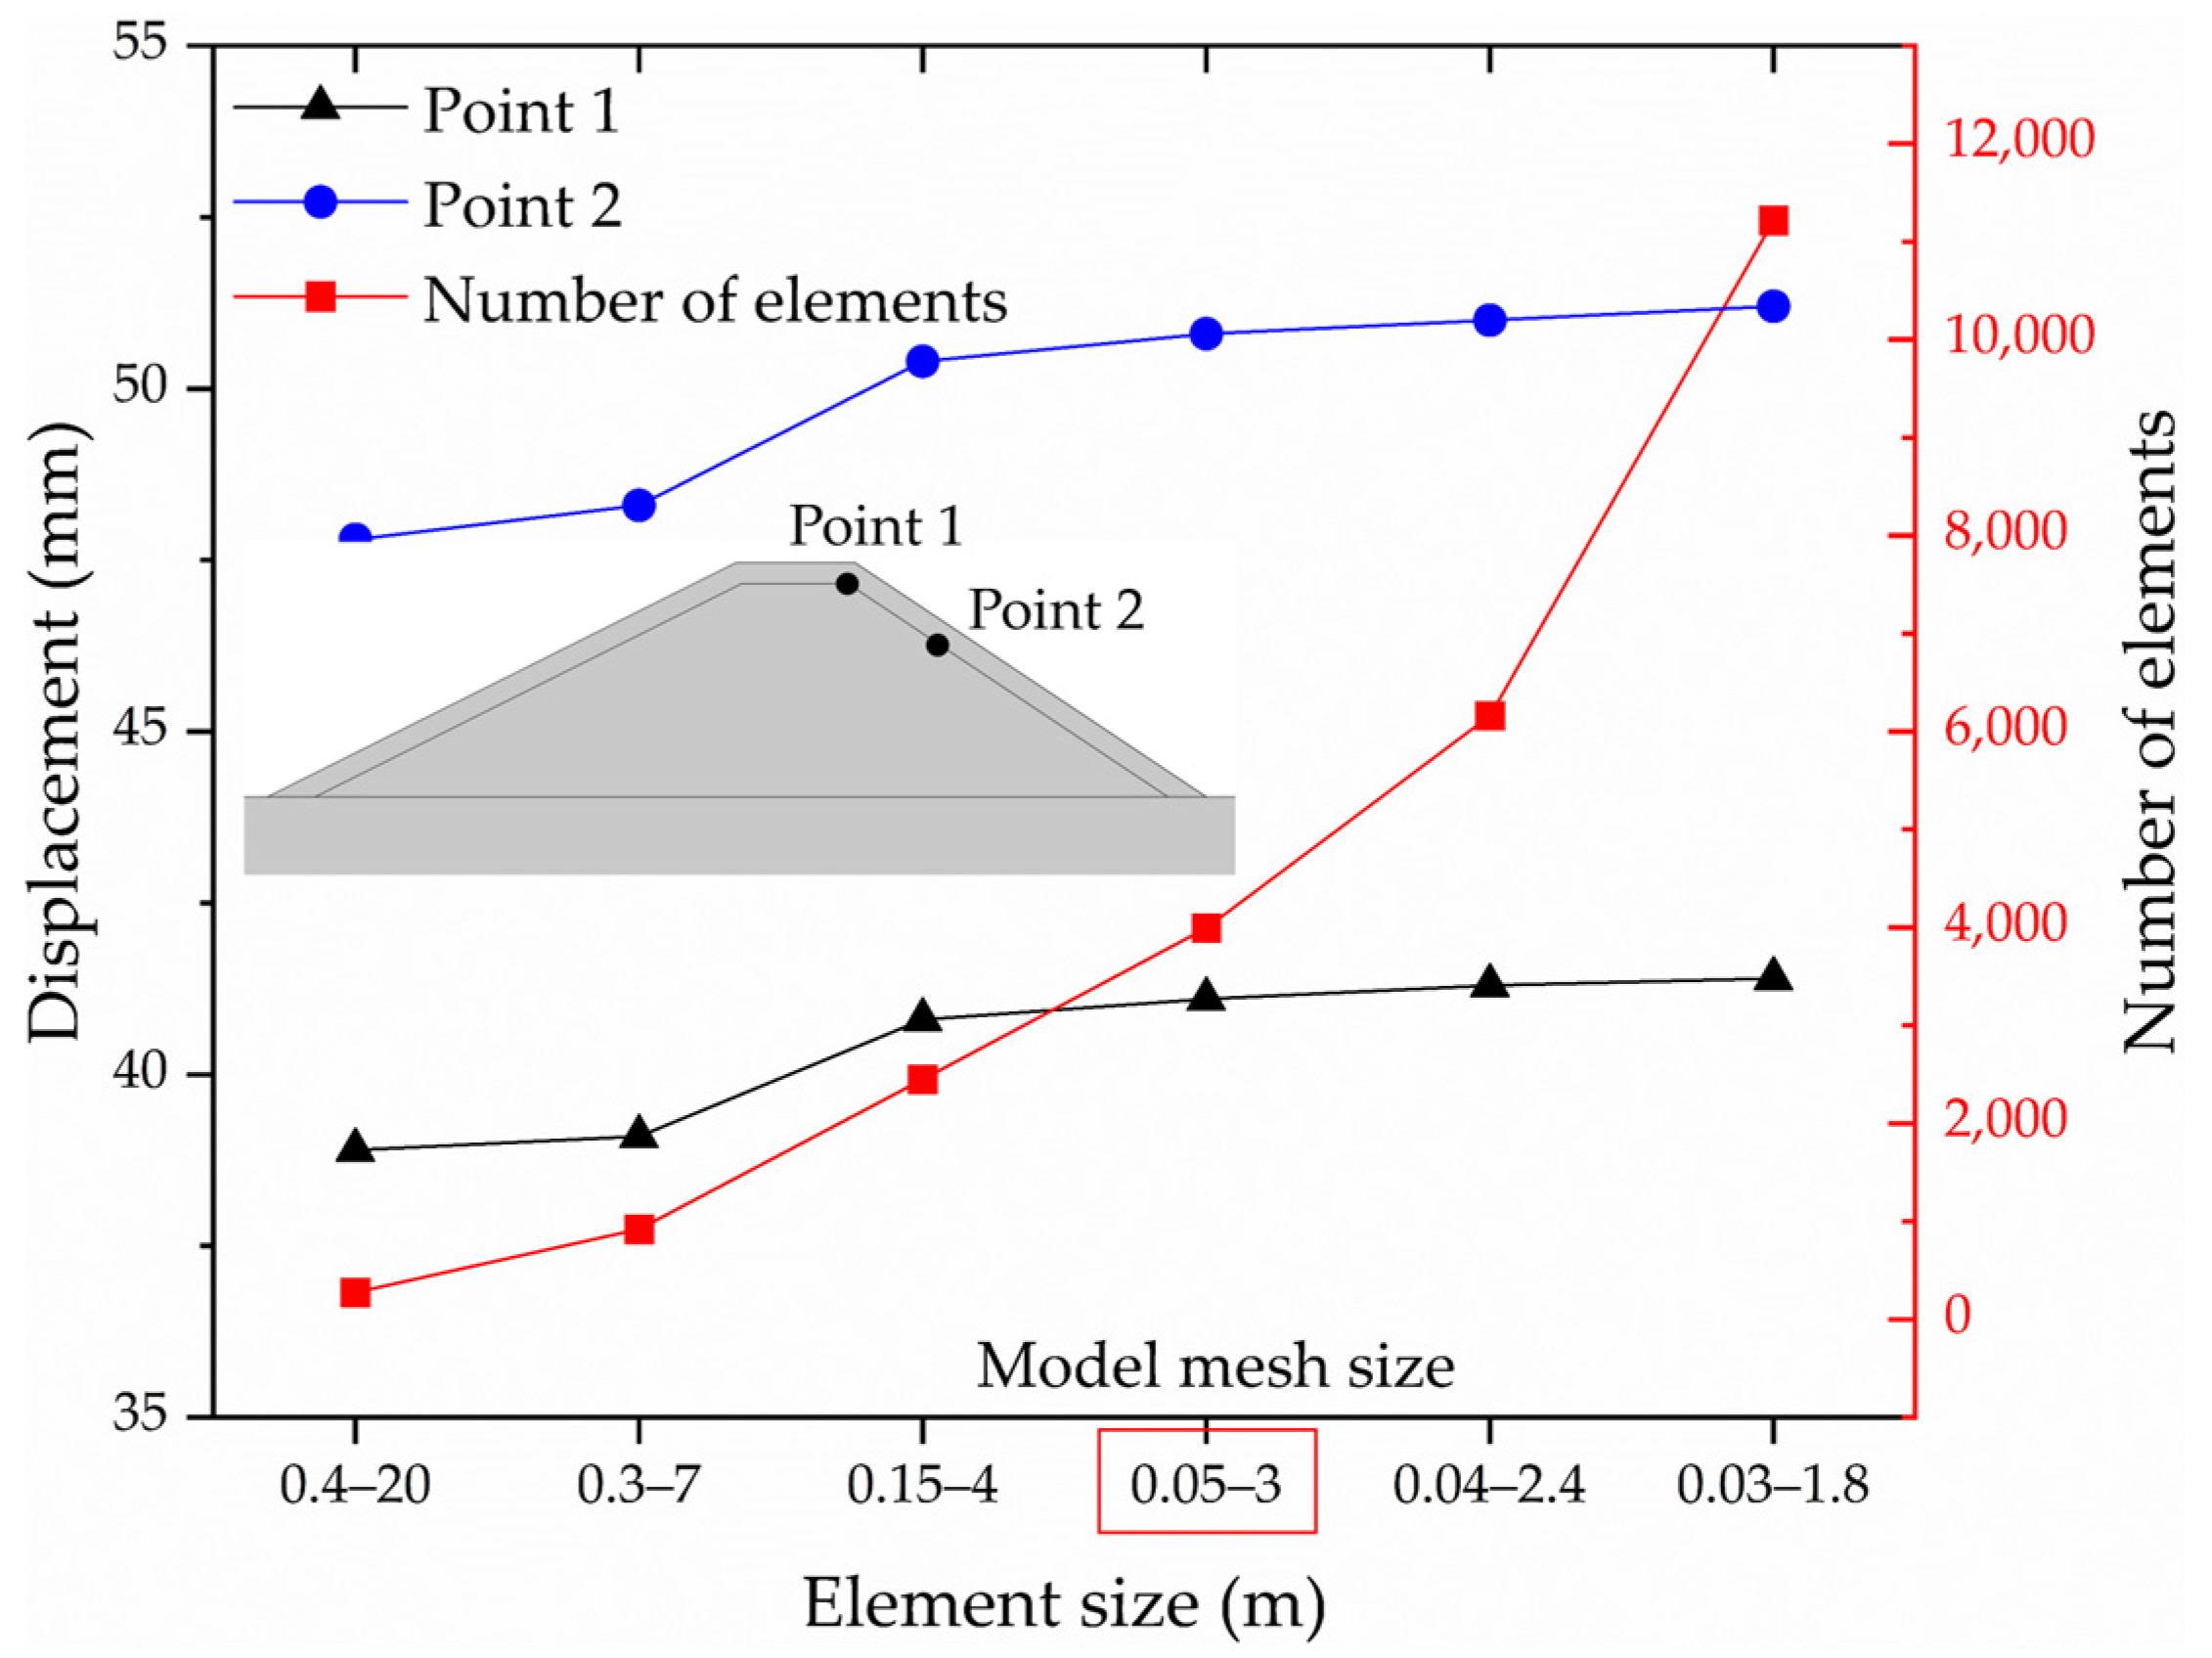
A mesh sensitivity analysis is conducted for the seabed model to ensure the reliability of the numerical results. The displacements at two specific points on the breakwater at
t = 17.8 s under a wave height of 7 m are monitored across six different mesh configurations. The coarsest mesh ranged from 0.4 to 20 m, while the finest ranged from 0.03 to 1.8 m. As shown in
Figure 4, the number of elements increases rapidly with mesh refinement. The results indicate that the calculated displacement converges when the element size is refined to 0.15–4 m, beyond which further refinement yields negligible changes. Considering both computational accuracy and resource constraints, a mesh size of 0.05–3 m is selected for this study. In addition, the results are obtained from single deterministic realization. This is because the core physics of the model (RANS for waves and Darcy’s law for seepage) are not highly sensitive to the random variations (e.g., turbulence seeding), making a full statistical ensemble less critical for this specific geotechnical application.
This study employs a two-dimensional (2D) plane–strain model for stability analysis. It is recognized in geotechnical literature that two-dimensional analyses can introduce a bias, as they do not account for the lateral confinement and end effects that are captured in three-dimensional (3D) models. This generally results in two-dimensional analyses yielding a lower, and thus potentially conservative, Factor of Safety (FOS) compared to three-dimensional analyses [
40,
41]. The two-dimensional approach in this work is justified by the elongated cross-section of the breakwater and for computational efficiency in a parametric study.
3.1. Reconsolidation State of Seabed
Typically, the reconsolidation of the saturated seabed after the construction of offshore structures occurs due to the self-weight of soils and structures. This study considers this reconsolidation state as the initial state for the following analysis of stability.
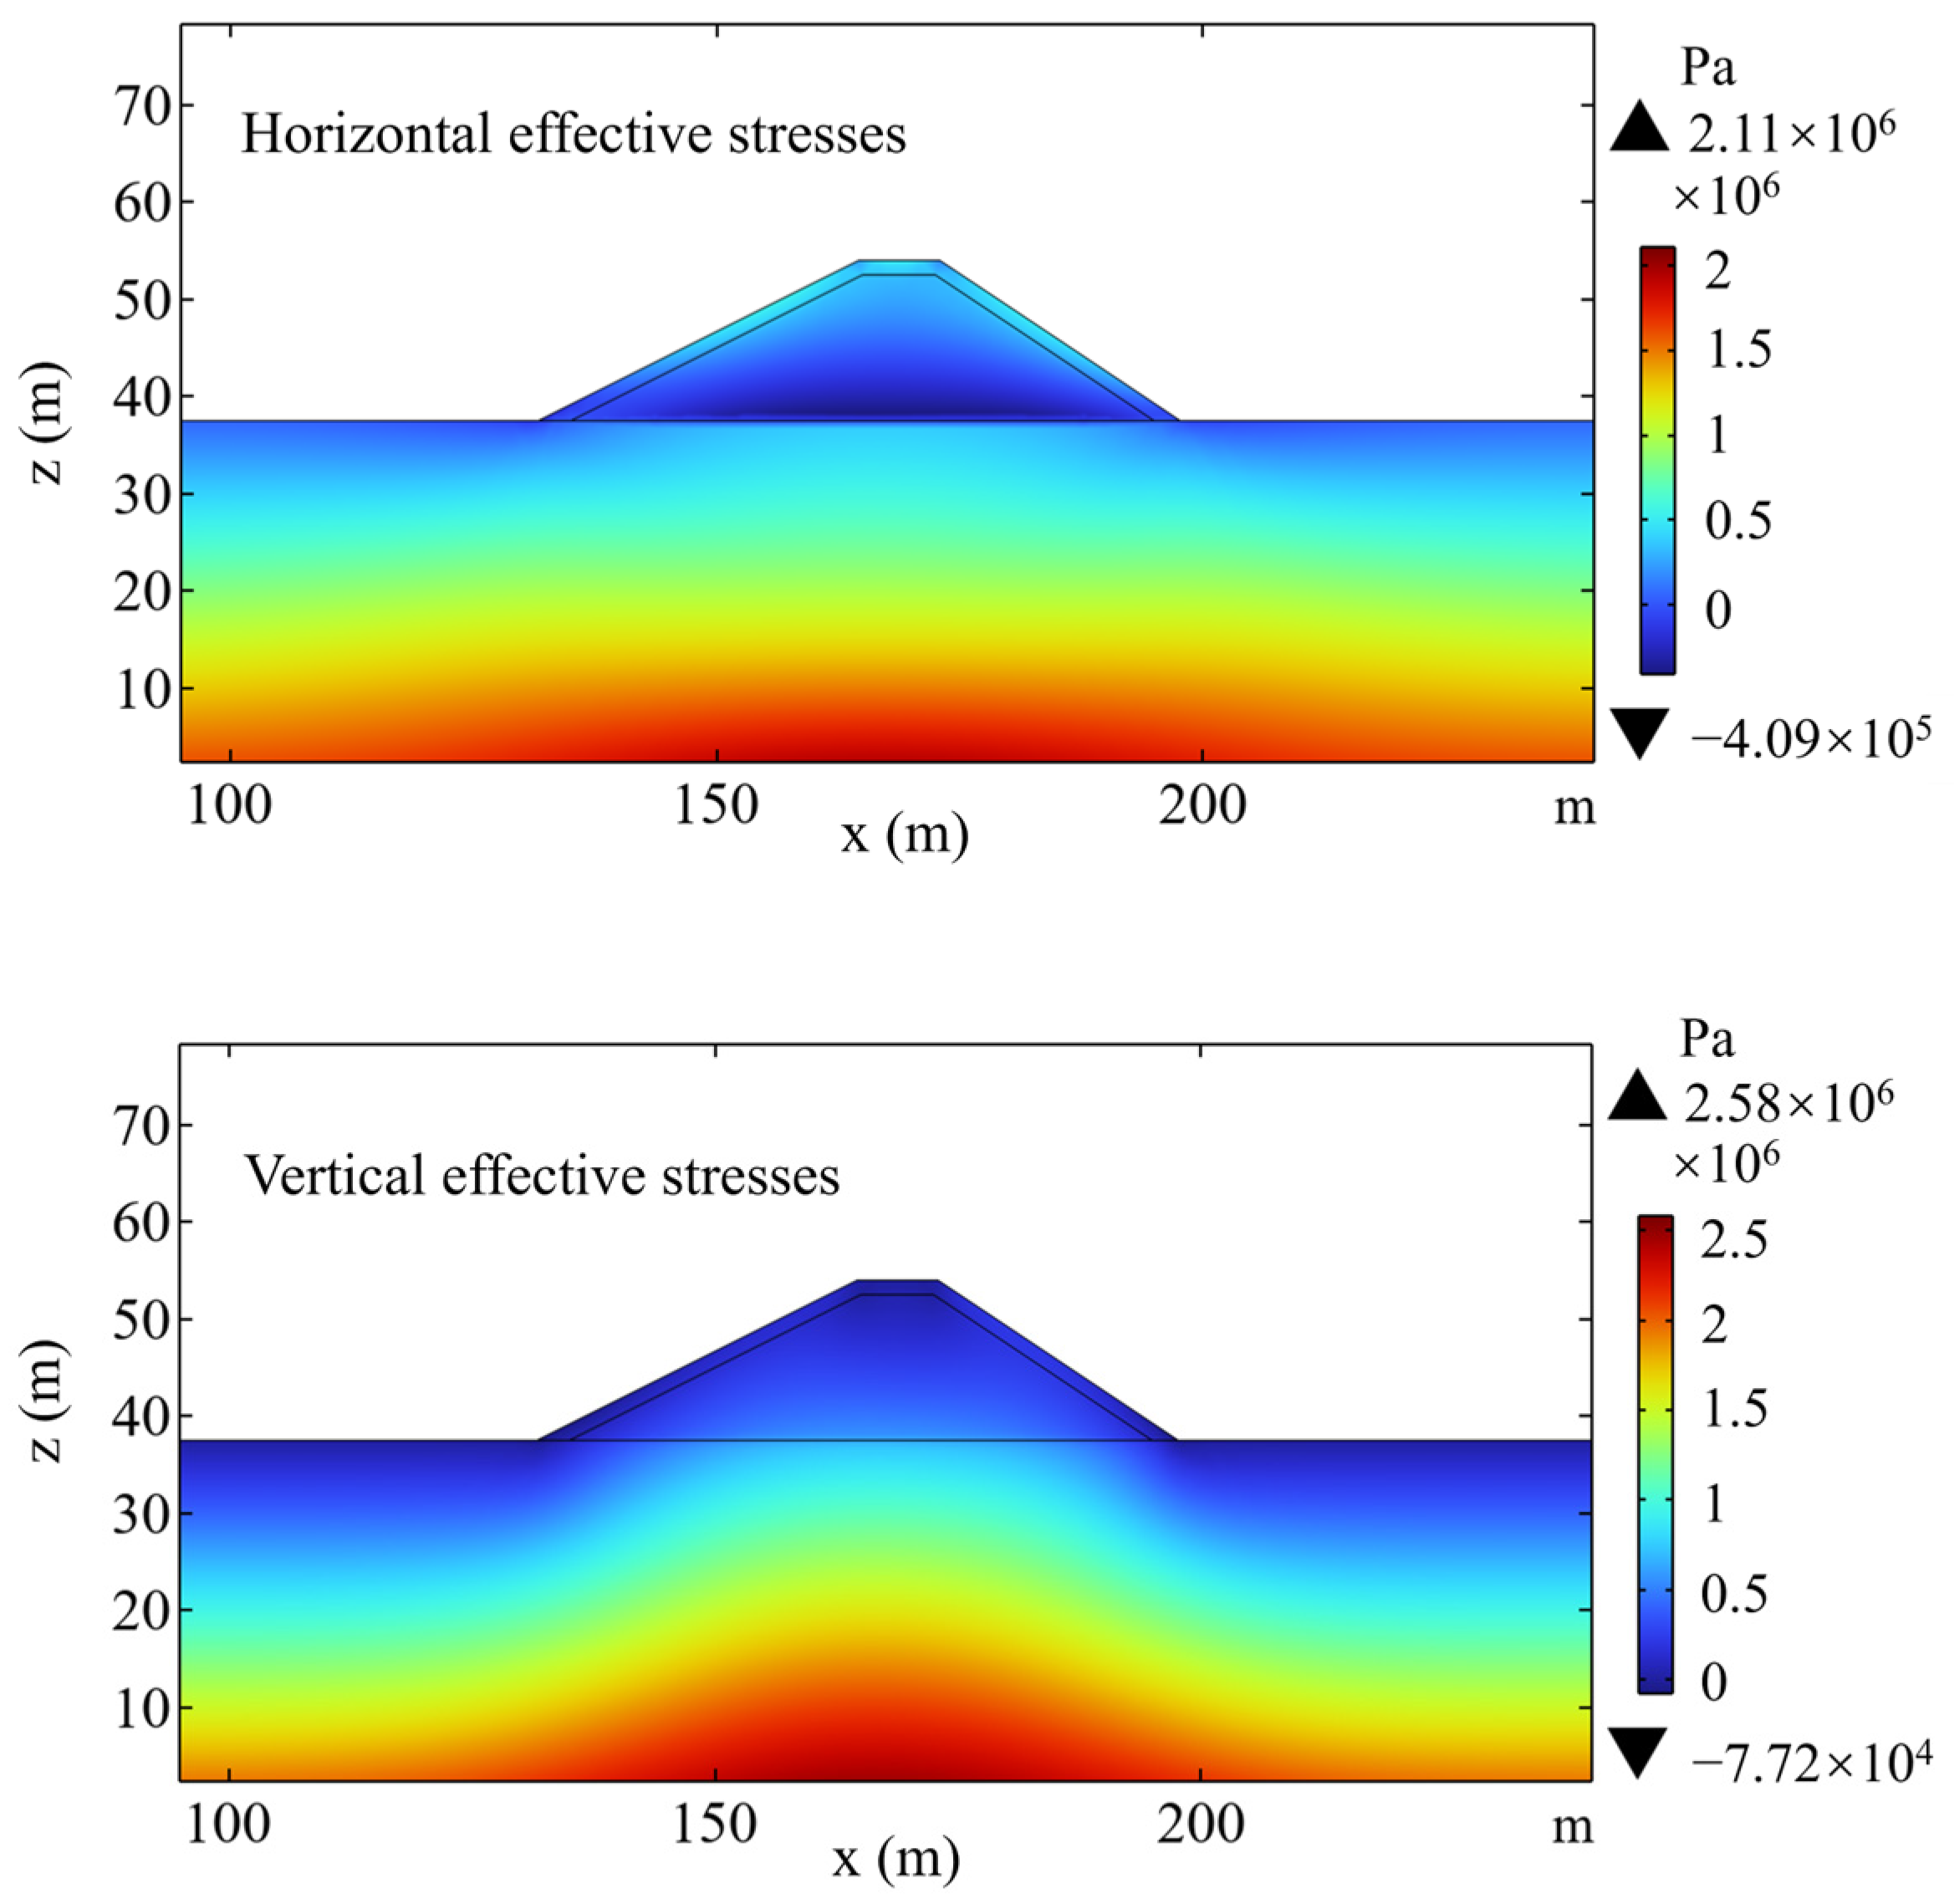
Given the computational parameters of the integrated model,
Figure 5 illustrates the initial consolidation state. It is observed that stress concentrates near the breakwater bottom, with significant increases in horizontal stress. This phenomenon may result from the significant difference in the modulus between the breakwater material and the seabed soils: the strength of the breakwater core is greater compared to that of the seabed. When the self-weight of the breakwater induces deformation of the seabed, and assuming no relative displacement at their interface, the bottom of the breakwater experiences greater lateral confinement to maintain displacement compatibility.
3.2. Wave-Induced Instability of Breakwater
After determining the state of reconsolidation of the seabed–structure system, the wave-induced pressure is then imposed on both the seabed and the breakwater. It should be noted that wave propagation is a dynamic process, and the pressure exerted on the surface seabed and breakwater varies continuously as the waves propagate. Consequently, FOS also changes with time. To identify the most critical state for the breakwater during wave propagation, FOS was calculated at multiple time steps to understand its variation. In practice, the change in FOS is closely related to the distribution of stress and seepage pressure in the seabed–breakwater system at the corresponding time step. In the following analysis, the calculation parameters are selected from
Table 1.
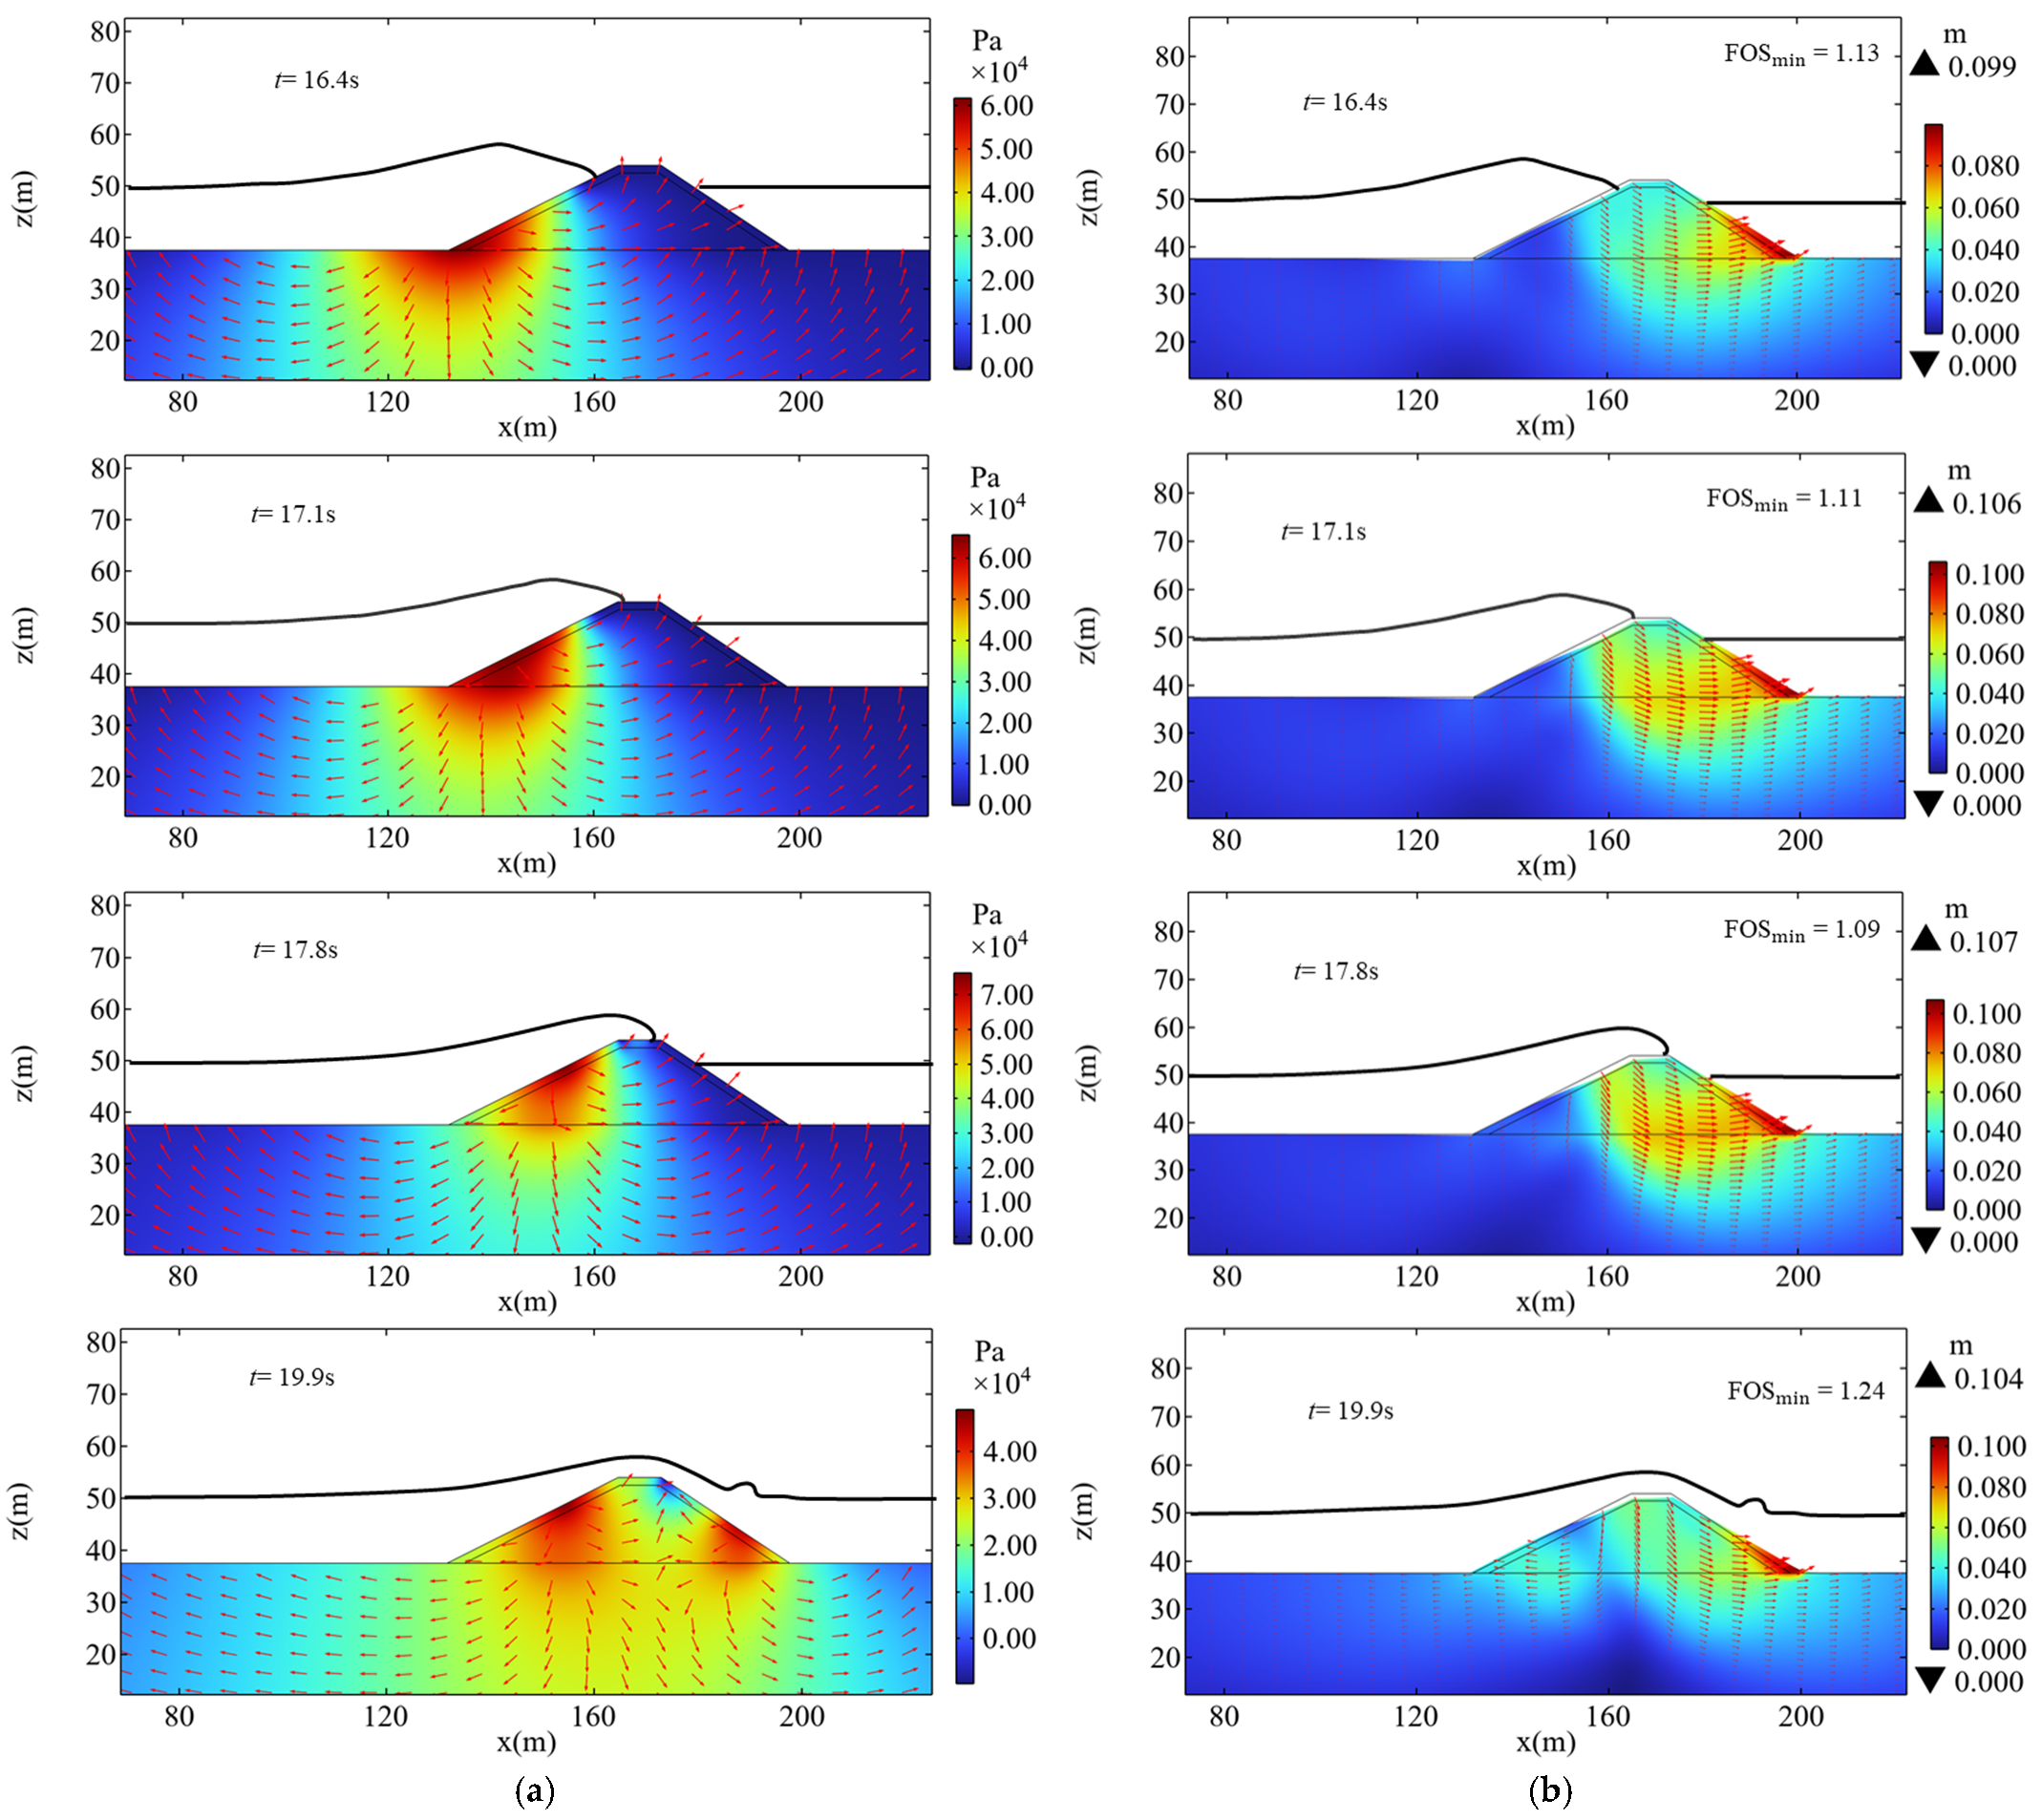
Figure 6a illustrates the relationship between wave profiles and seabed seepage pressure at different moments for a wave height of
H = 7 m. The arrows in
Figure 6a are meant to indicate the wave-induced seepage velocity based on Darcy’s law, i.e., Equation (14). It can be observed that after the waves reach the breakwater, as the distance between the wave crest and the crest of the seaward slope decreases, the peak seepage pressure induced by the waves on the seaward slope also increases. In this study, the instability of the breakwater is indicated by the non-convergence of numerical calculations in the finite element software during the strength reduction process, and the corresponding displacement at this point is defined as the failure displacement.
Figure 6b shows the corresponding relationship between the wave profile and the failure displacement of the seabed–breakwater system at different times under the same wave height. The failure displacement here refers to the displacement that occurs when the breakwater–seabed becomes unstable at a specific time step, as determined by the strength reduction method. When the wave propagates to the landward slope, the distribution of the failure displacement changes significantly, showing a noticeable decrease within the core of the structure.
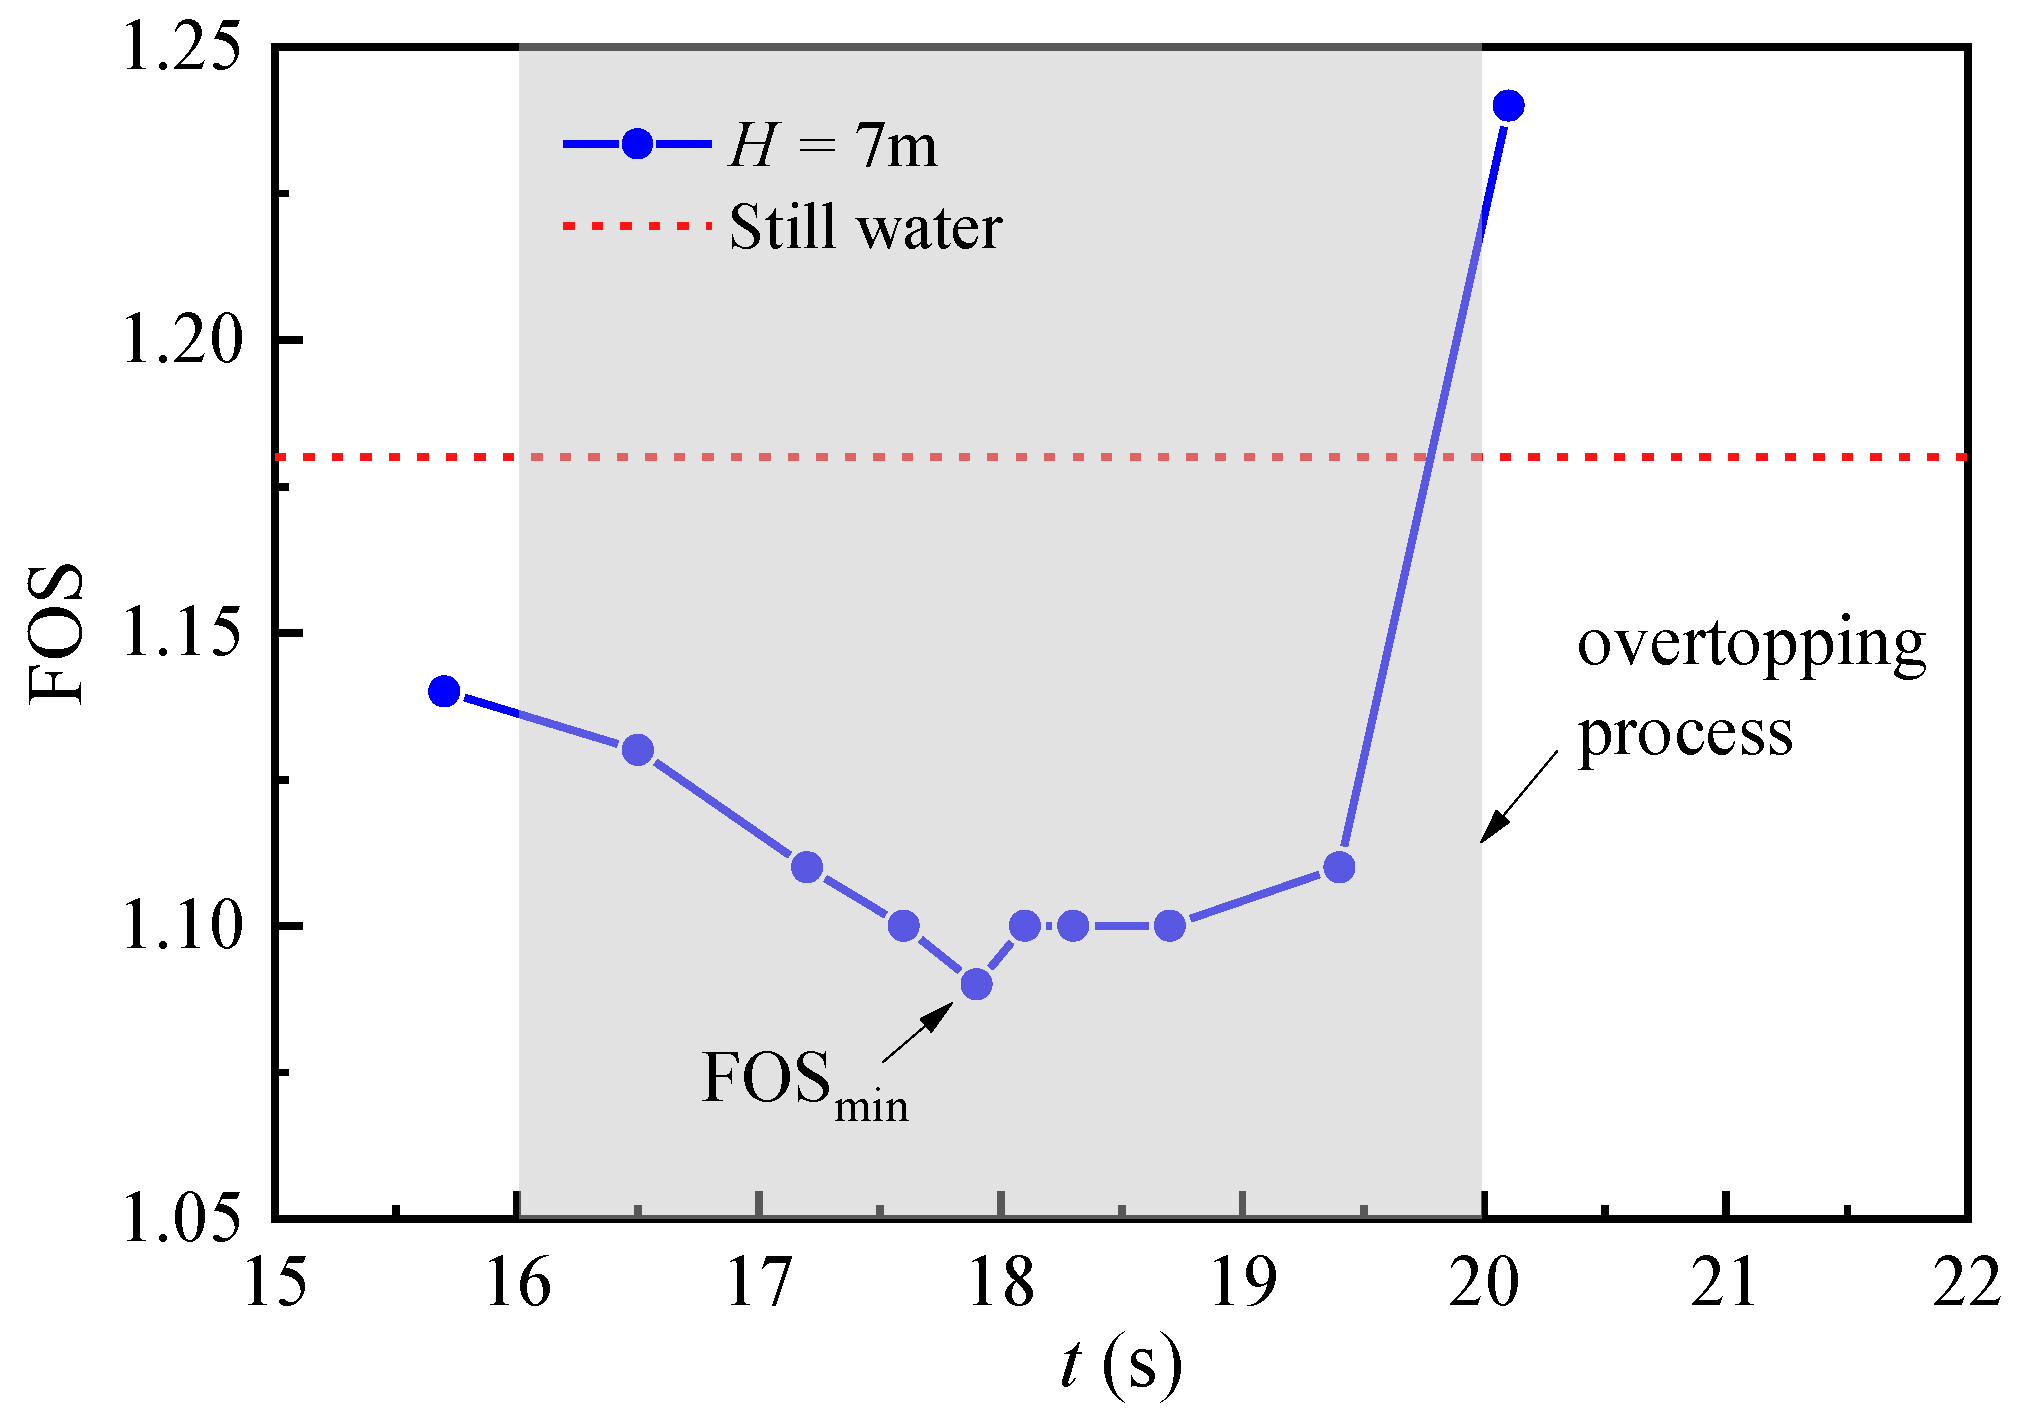
The temporal variations in FOS under different wave heights and back wave slopes are illustrated in
Figure 7, where the dashed line denotes the seabed–structure safety stability coefficient under still water conditions. As the waves propagate over the seaward slope, as shown in
Figure 6 (
t = 16 s~17.8 s), the value of FOS gradually decreases. When the waves reach the landward slope, there is a significant increase in FOS, even exceeding the conditions under static water. This indicates that the wave load applied to the landward slope contributes to the stability of the breakwater. Additionally, the moment corresponding to the minimum factor of stability (FOS
min) coincides with the moment when the wave crest approaches the crest of the seaward slope. This indicates that the breakwater is most prone to failure at this state. Therefore, FOS
min is defined as an indicator for evaluating breakwater stability in the following analysis.
The present model simplifies the armor layer and thus cannot capture its hydraulic instability, which is the dominant failure mechanism in practice. Hence, the “most critical state” is defined as the state with respect to geotechnical shear sliding of the core and foundation. The well-established hydraulic failure modes of rubble mound breakwaters, such as the displacement and erosion of individual armor units, are not simulated in this model.
3.3. Instability Characteristics of Breakwater
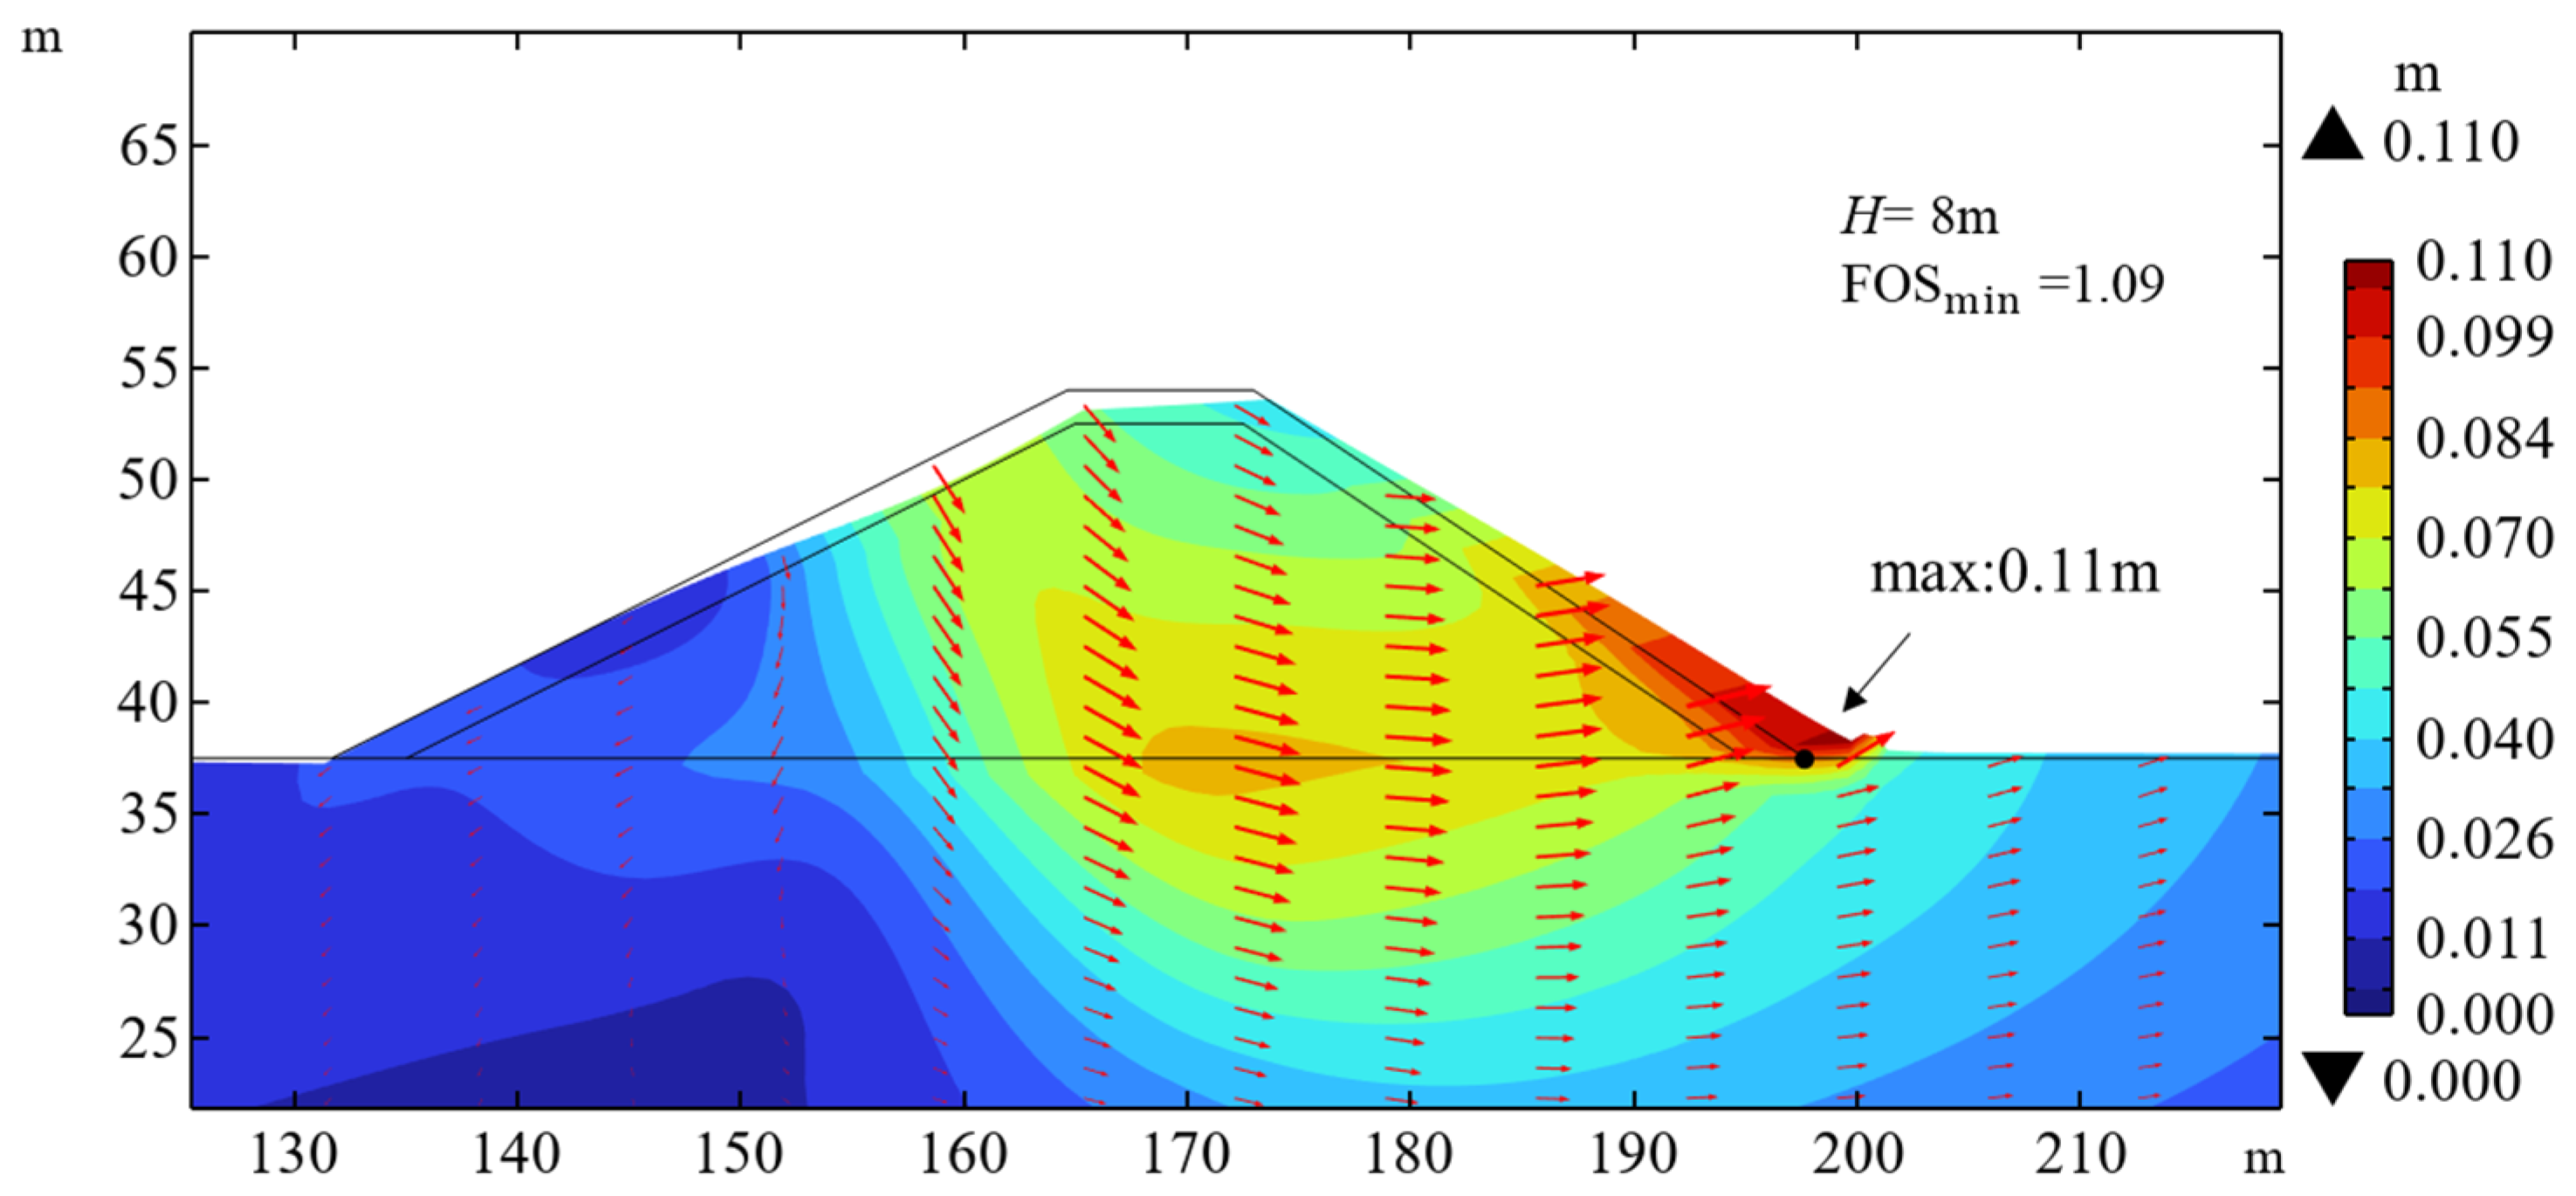
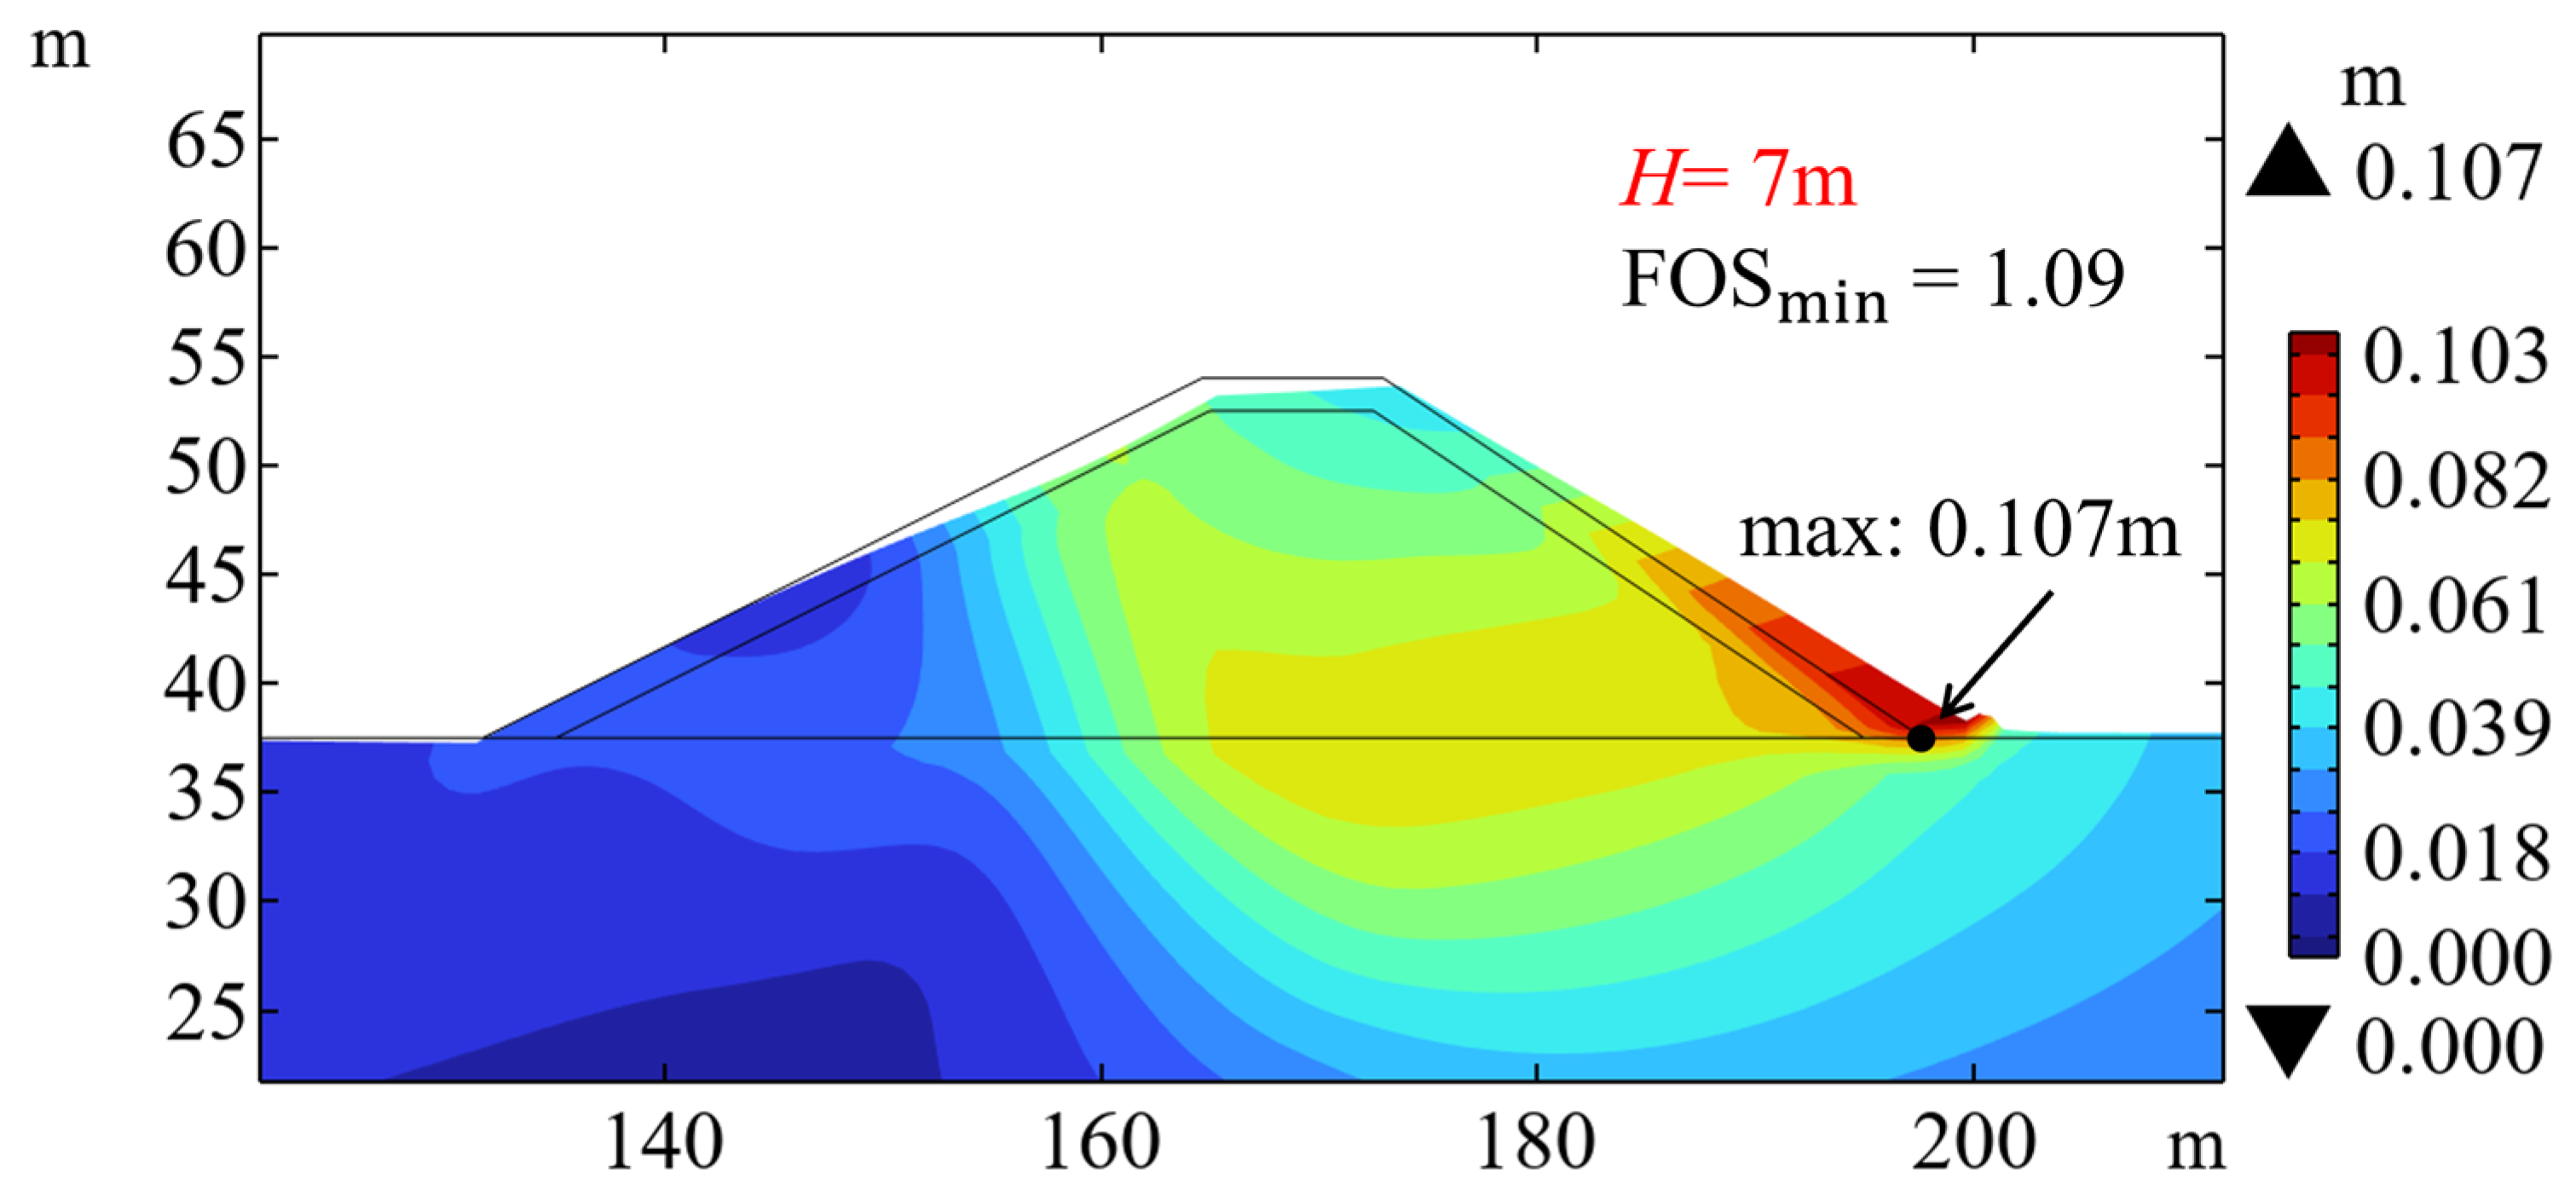
The effect of wave load on the instability of breakwater is investigated in this section. At the most critical moment when the wave crest propagates to the crest of the seaward slope, the displacement of the breakwater and seabed at this limit state is shown in
Figure 8. Due to the use of materials with low cohesion and high internal friction angle for both the core and the armor layer, there is no distinct slip surface in this case. The waves apply the load near the crest of the seaward slope, causing the core to compress and move towards the other side, leading to the sliding at the toe of the landward slope and ultimately causing the instability of the breakwater. At this most critical moment when instability occurs, after applying the strength reduction method, the maximum displacement appears near the toe of the landward slope and exceeds 0.10 m. This partially accounts for the significant increase in FOS when the waves propagate to the landward slope (see
Figure 8) because the wave-induced load on the landward slope effectively restrains the displacement of the landward slope toe.
Figure 9 shows the corresponding equivalent plastic strain at the most critical state. The plasticity of the armor layer is not considered, and the armor layer is only treated as a load applied to the core of the breakwater when using the strength reduction method for calculation. Compared with the displacement distribution, no arch-shaped plastic flow zone is observed inside the breakwater. Because the core material is gravel with a large internal friction angle and minimal cohesion, the failure surface tends to be nearly linear rather than a curved failure surface typically observed in cohesive soils. The development of effective plastic strain mainly concentrates in two areas: one is near the crest of the seaward slope, where it bears the maximum wave load, and plastic deformation spreads from the surface of the core to the interior; the other is the toe of the landward slope. Corresponding to the displacement distribution, the plastic deformation also reaches its maximum at the slope toe, indicating that sliding occurs on the surface and toe of the landward slope when the breakwater becomes unstable. In addition, the armor layers do not exhibit equivalent plastic strain, as plastic deformation of the armor units has not been explicitly considered in the numerical model. This may contribute to the absence of a visibly distinct slip surface in
Figure 9. However, the numerical results align with the expected failure mechanism for this type of structure.
3.4. Parametric Analysis
3.4.1. Effect of Wave Height
In general, the pressure acting on the offshore structure and seabed is influenced directly by the wave height, thereby influencing the formation and variation in pore water pressure inside the seabed.
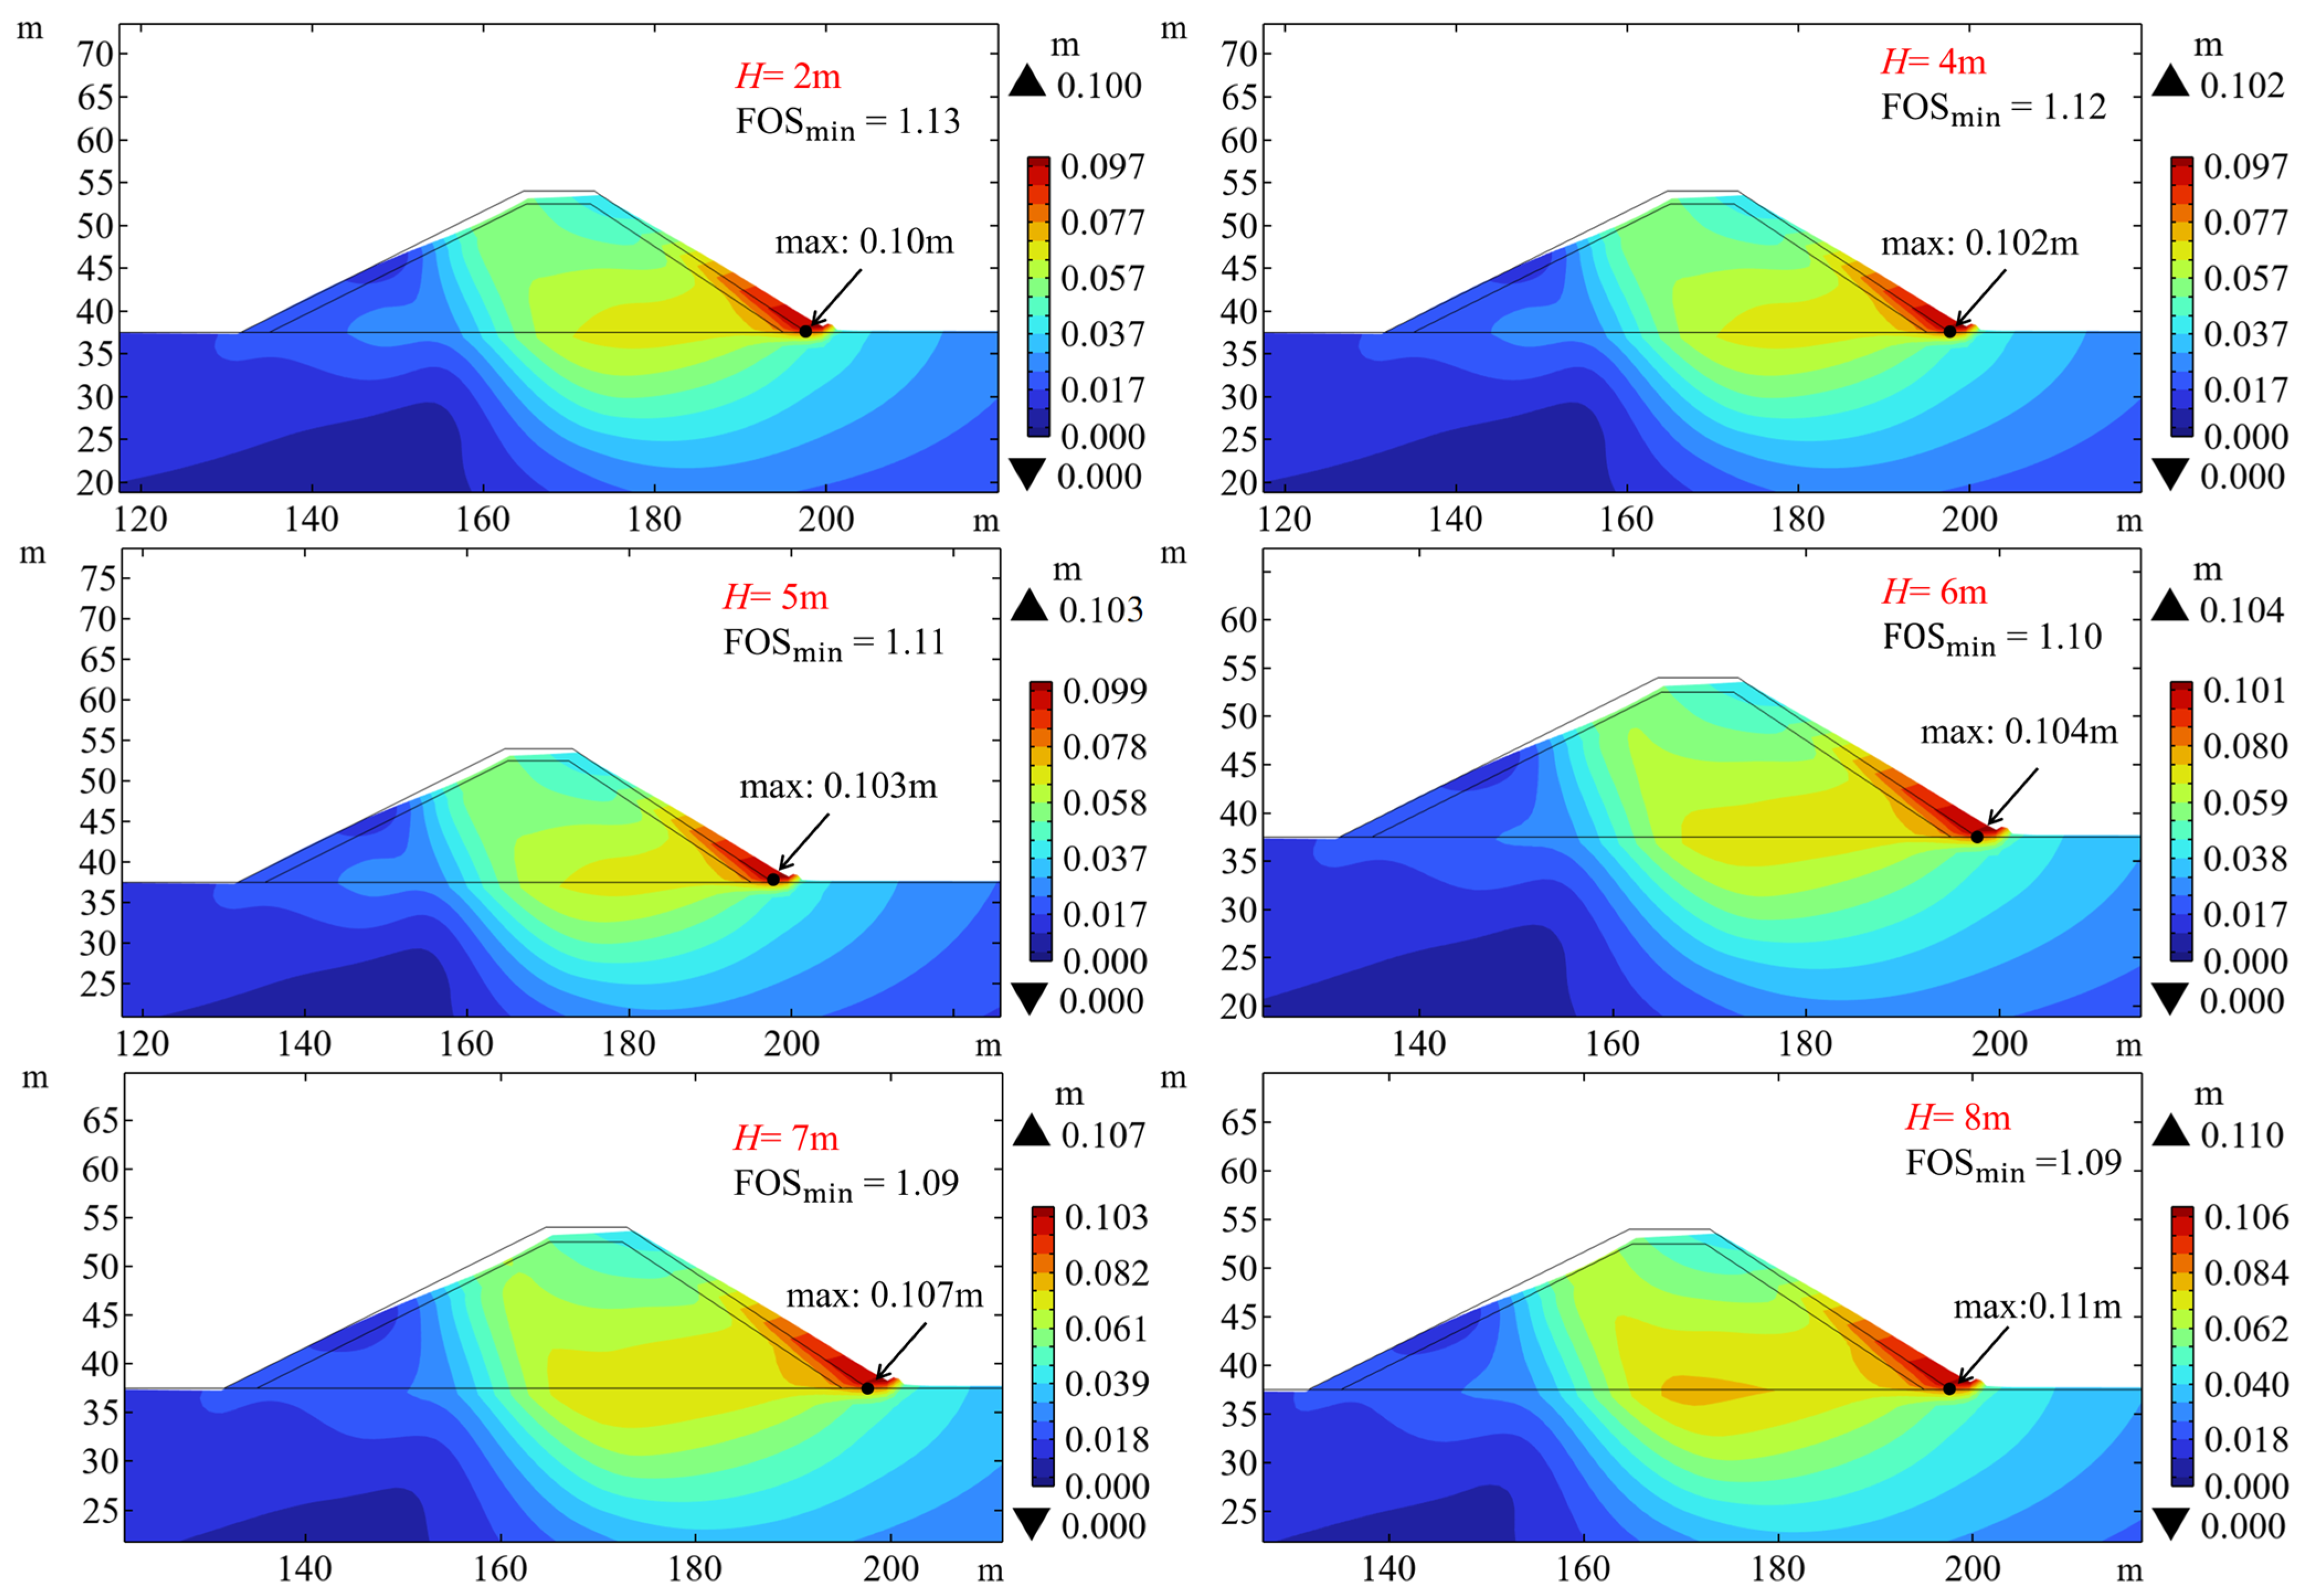
Figure 10 presents the corresponding failure displacement (scale factor is 20) when the waves propagate to the most critical position for four different wave heights (
H = 2, 4, 5, 6, 7, and 8 m), with a maximum water depth of 12 m. It is shown that the maximum displacement near the foot of the slope increases with the increasing wave height. When the wave height increases from 2 m to 8 m, the maximum displacement increases from 0.10 m to 0.11 m, while FOS
min decreases slightly from 1.13 to 1.09. This indicates that the deformation response of the seabed and breakwater to increasing wave height is limited, which is consistent with the merely slight reduction in the factor of safety. The small decrease in FOS
min is physically plausible because the driving force for shear failure is primarily governed by the massive self-weight of the breakwater core. The wave-induced pressure, despite its large percentage increase, constitutes a relatively small addition to the total driving force, as shown in
Figure 5 and
Figure 6.
Next,
Figure 11 shows the influence of wave height on the variation in FOS with time. Under the action of waves with different heights, the variation in FOS exhibits a similar pattern. FOS gradually decreases when the waves propagate over the seaward slope. When the waves reach the landward slope, FOS increases significantly.
3.4.2. Effect of Shear Strength of Seabed
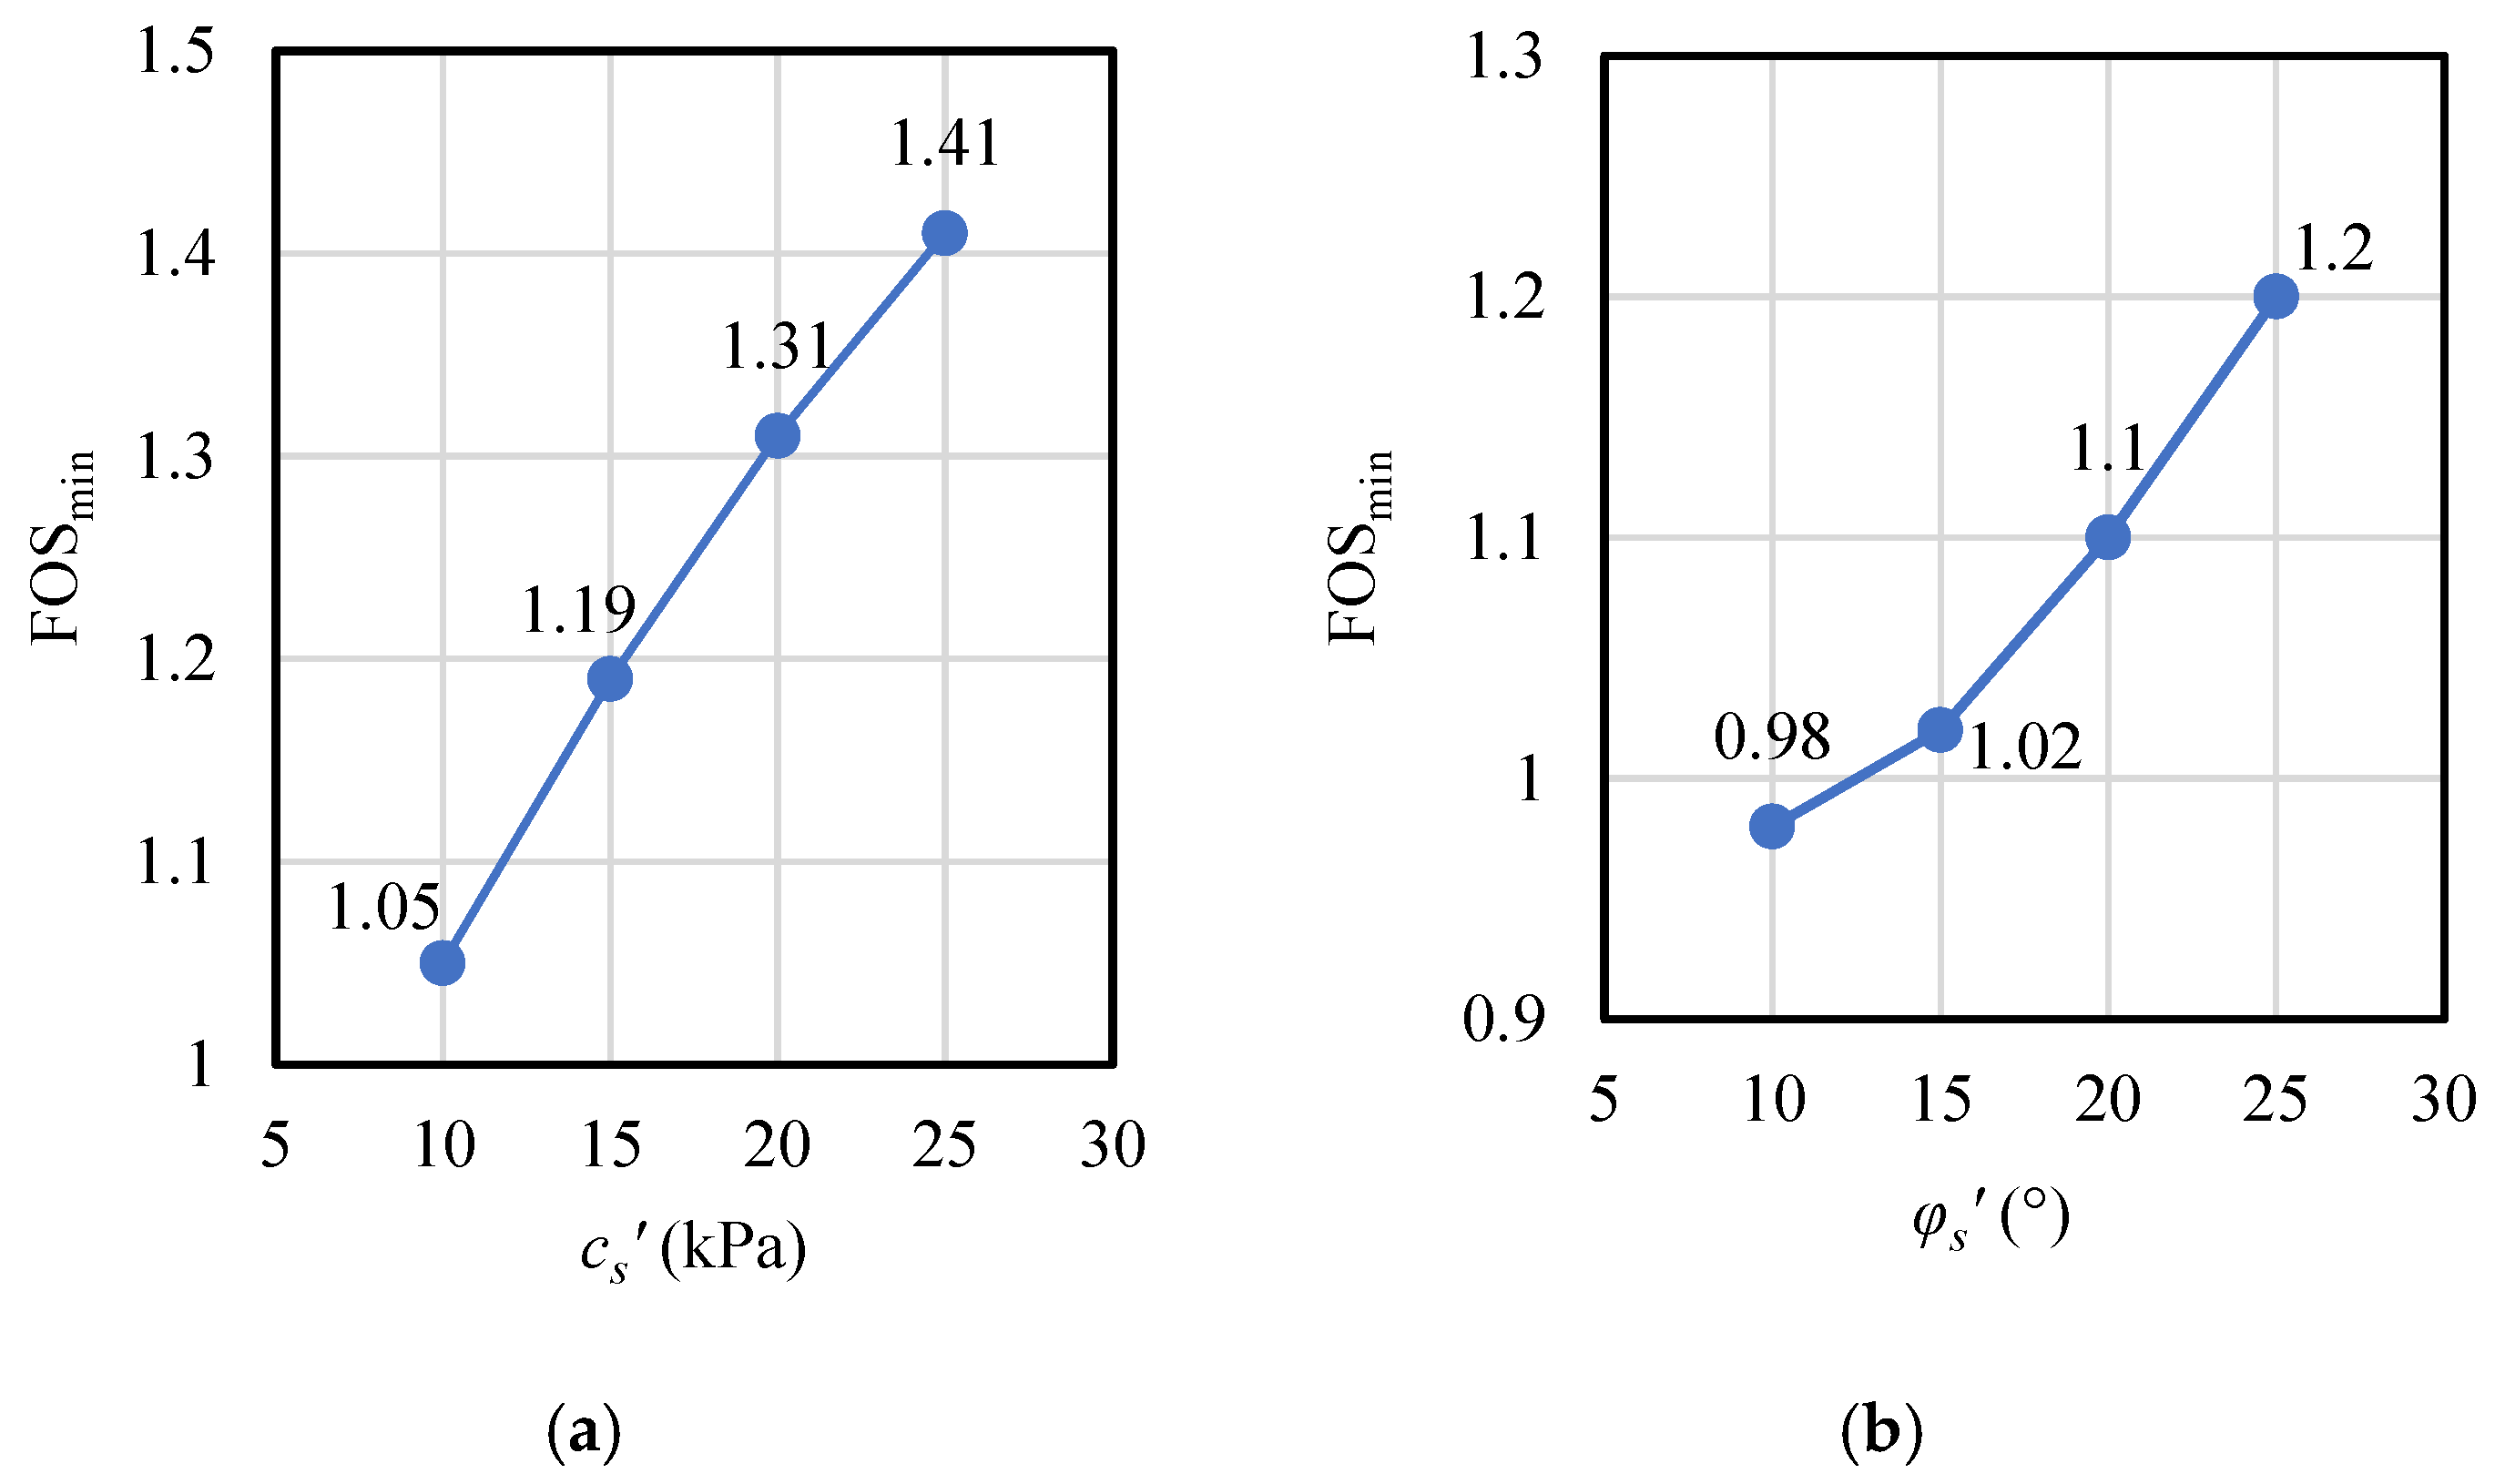
The inherent properties of the soils significantly influence the wave-induced pore pressure and displacement within the slope. The influence of the effective friction angle and effective cohesion of seabed soils on the factor of stability is discussed in this section. The wave height is set to be 7 m, and
Figure 12a illustrates the FOS
min corresponding to four different values of effective cohesion (
cs′ = 10, 15, 20, and 25 kPa), while keeping the effective friction angle constant (
φs′ = 20°). Meanwhile,
Figure 12b shows the FOS
min corresponding to four different effective friction angles (
φs′ = 10, 15, 20, and 25°), with the effective cohesion held constant (
cs′ = 12 kPa). The results indicate that increasing either the effective friction angle or the effective cohesion can significantly improve the stability of the breakwater, as expected. When the effective cohesion increases from 10 kPa to 25 kPa, the FOS
min increases from 1.05 to 1.41. In addition, FOS
min increases from 0.98 to 1.20 as the effective friction angle increases from 10° to 25°. This highlights the importance of constructing breakwaters on seabeds with the highest possible effective internal friction angle and cohesion, as these factors significantly enhance the overall safety and stability of the structure. For weak foundations (e.g., silt, loose sand), treatment is necessary; otherwise, it may lead to breakwater settlement, sliding, or instability.
3.4.3. Effect of the Effective Internal Friction Angle of Core Material
While the armor layer ensures hydraulic stability, the core is fundamental to the internal geotechnical integrity of the breakwater. Therefore, the material properties of the core are closely related to its stability against shear sliding, as investigated in this study. In this study, the core material is gravel, which has a high density and effective friction angle. Its effective cohesion is negligible. Considering the possibility of impurities in the actual marine environment, the effective cohesion of the core is assumed to be 2 kPa. In this section, the influence of effective internal friction angles of the core (
φs′ = 35, 38, 42, and 45°) on the FOS
min is investigated. The wave height is set to be 7 m. As shown in
Figure 13, as the effective internal friction angle increases, there is little change in the displacement of the breakwater at the failure state. However, the FOS
min gradually increases from 1.03 to 1.17, indicating an improvement in the stability of the breakwater. This is attributed to the frictional nature of the core material. The friction angle elevates the shear strength, thereby raising the safety factor. However, the displacement at the ultimate limit state is predominantly governed by the pre-failure stress–strain response (mainly governed by the elastic modulus), which remains relatively unchanged in this analysis. Thus, the safety factor is the principal indicator of enhanced stability. In practical engineering, selecting core materials with a higher effective internal friction angle can significantly enhance the stability of the structure.
3.4.4. Effect of the Slope Gradient
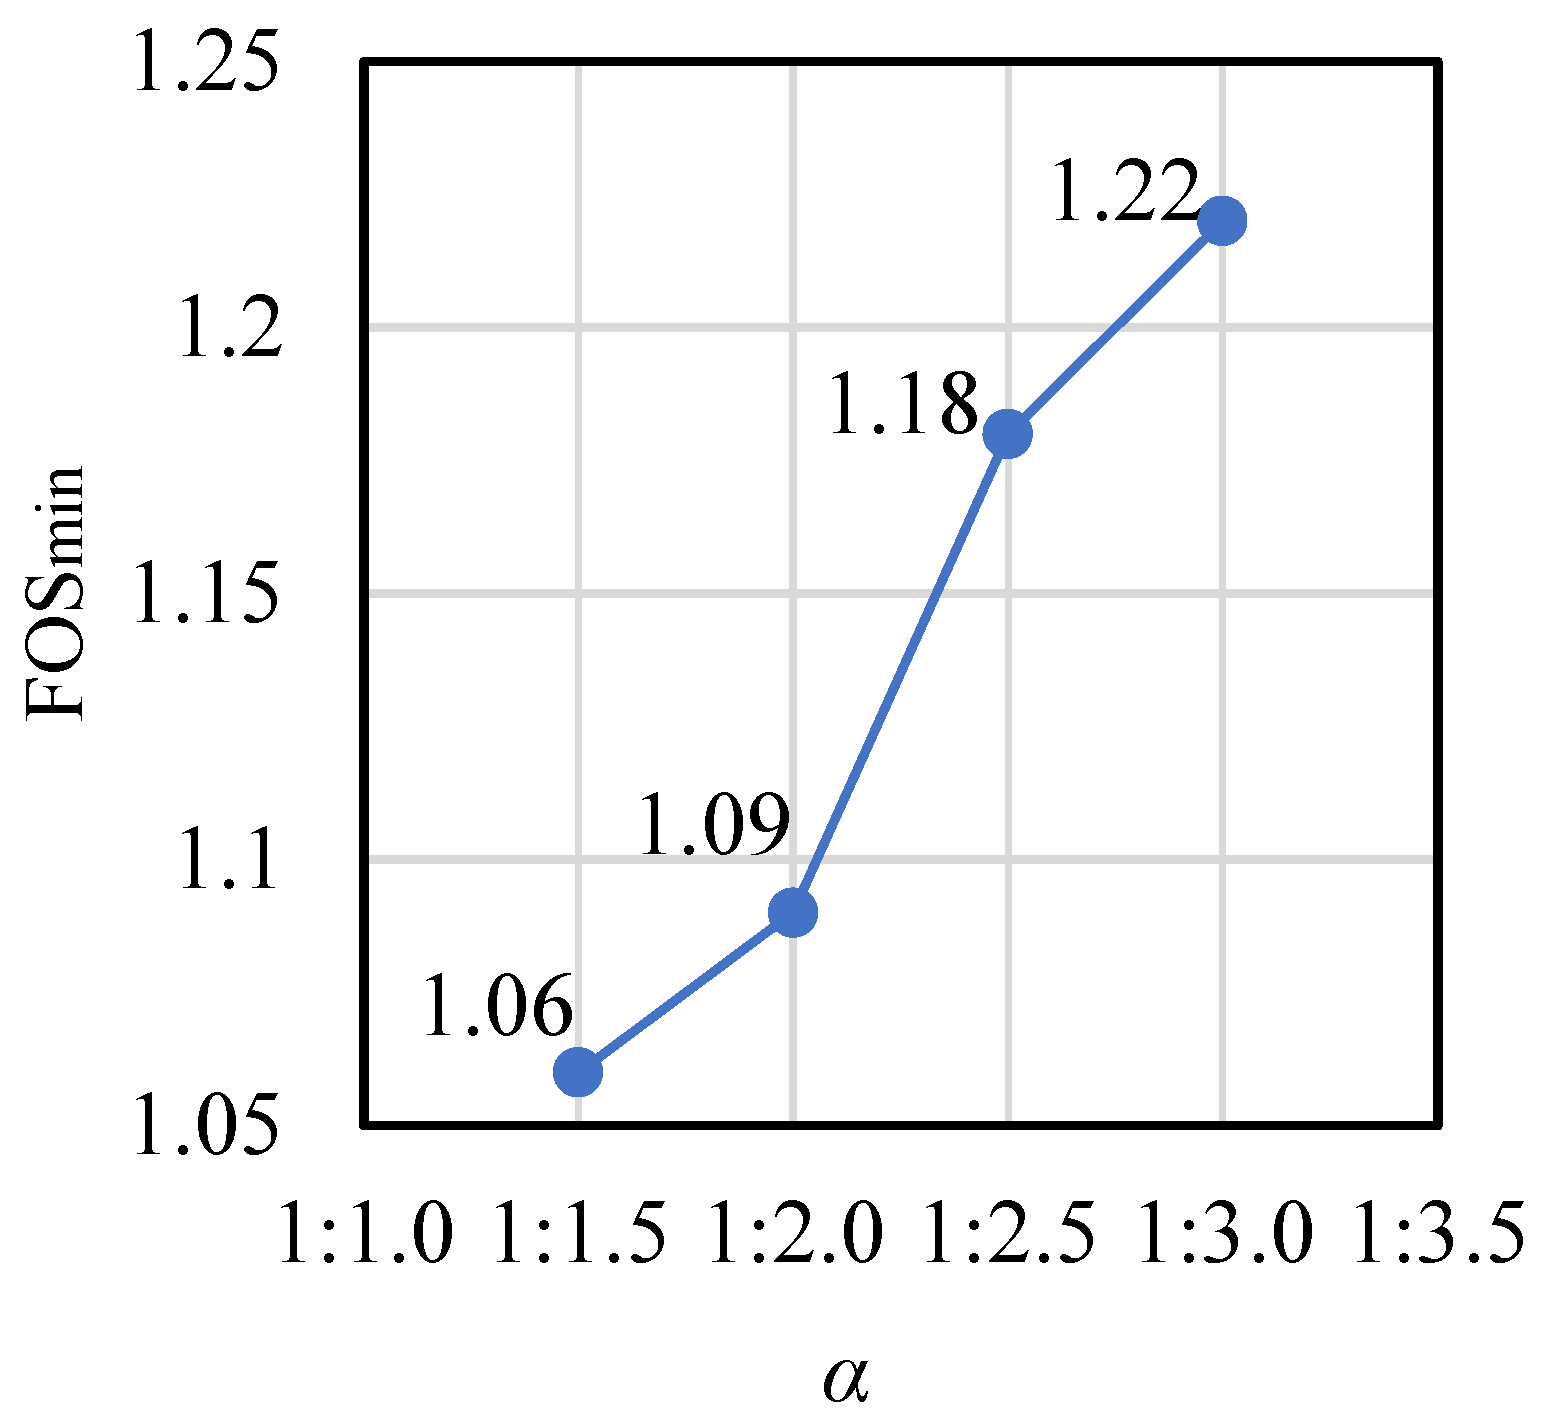
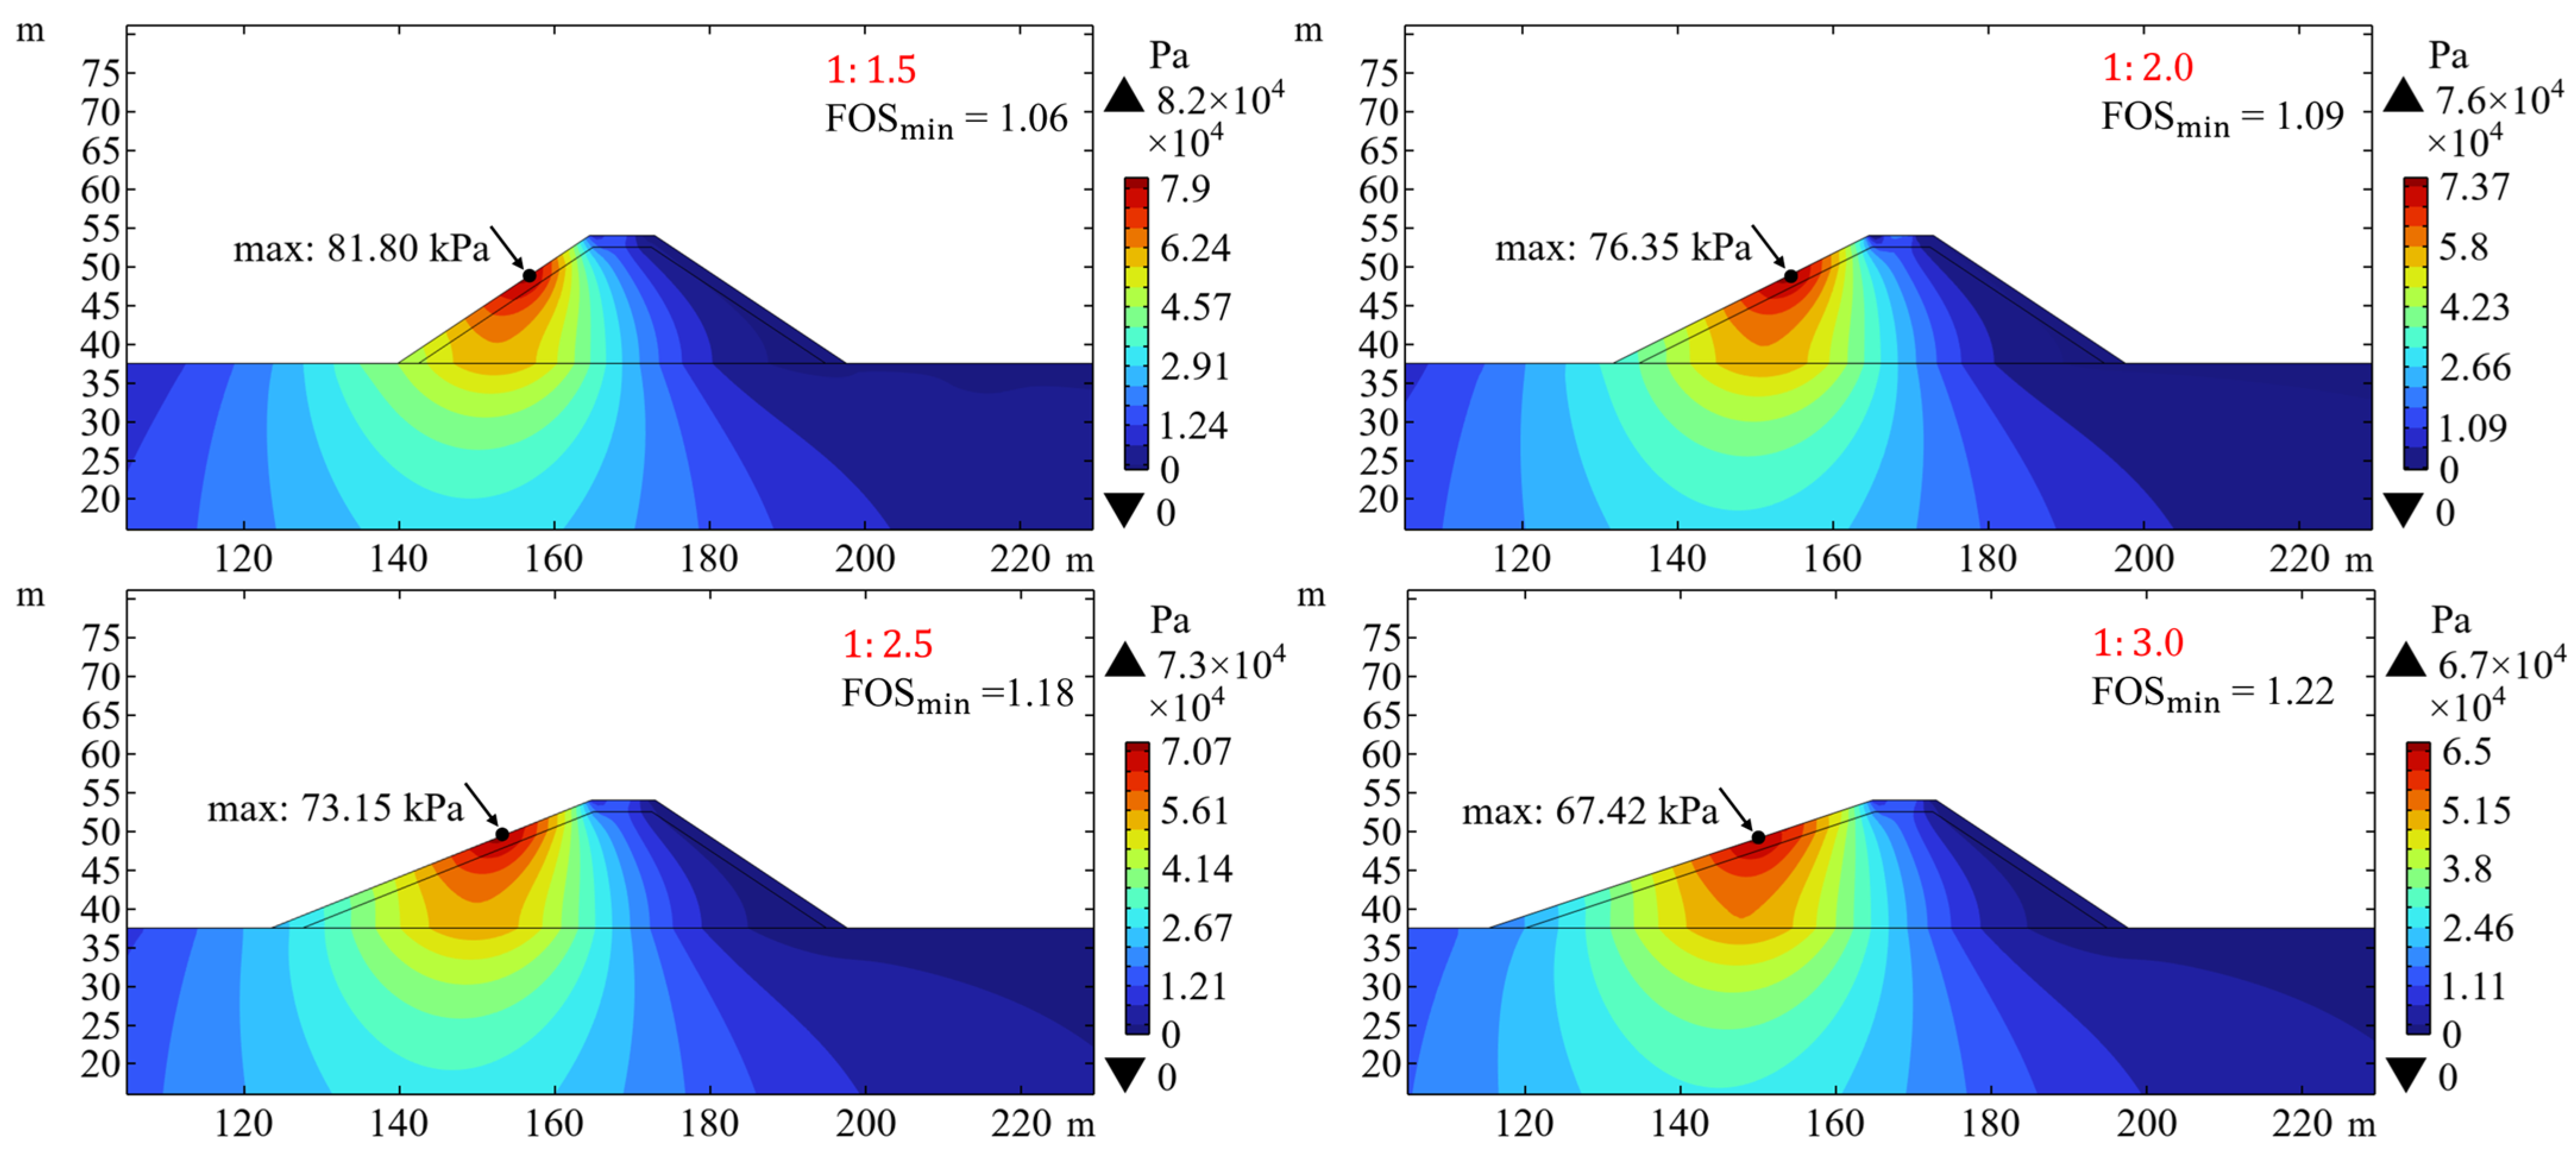
The slope gradient significantly influences the dimensions, material requirements, and construction costs of the breakwater structure. However, its final selection in practice must also reconcile other constraints such as local material availability and seabed morphology. The slope gradient is closely related to the dimensions and material requirements of the breakwater structure, thereby significantly affecting the construction costs. It is evident that a flatter slope leads to a more stable structure, but the corresponding construction costs also increase. To strike a balance between economic and safety considerations, it is essential to choose an appropriate slope gradient, thus the relationship between slope gradient variations and stability changes is crucial. In this section, the impact of four different seaward-slope gradients (1:1.5, 1:2.0, 1:2.5, and 1:3.0) on the FOS under a wave height of
H = 7 m is discussed. The results, as shown in
Figure 14, indicate that the decrease in slope gradient at the same intervals results in a gradual increase in FOS
min, as expected. However, this change is not linear: as the slope ratio decreases from 1:2.0 to 1:2.5, the increase in FOS is relatively larger.
Then,
Figure 15 illustrates the distribution of pore water pressure under different slope gradients. The distributions of pore pressure are similar at different slope gradients. However, as the slope gradient increases, the maximum pore pressure on the seaward slope gradually increases. This indicates that smaller slopes are advantageous in dispersing the wave load applied on the surface of the breakwater. This could be one of the reasons why the seaward-slope gradient affects the wave-induced stability of the breakwater.
Next,
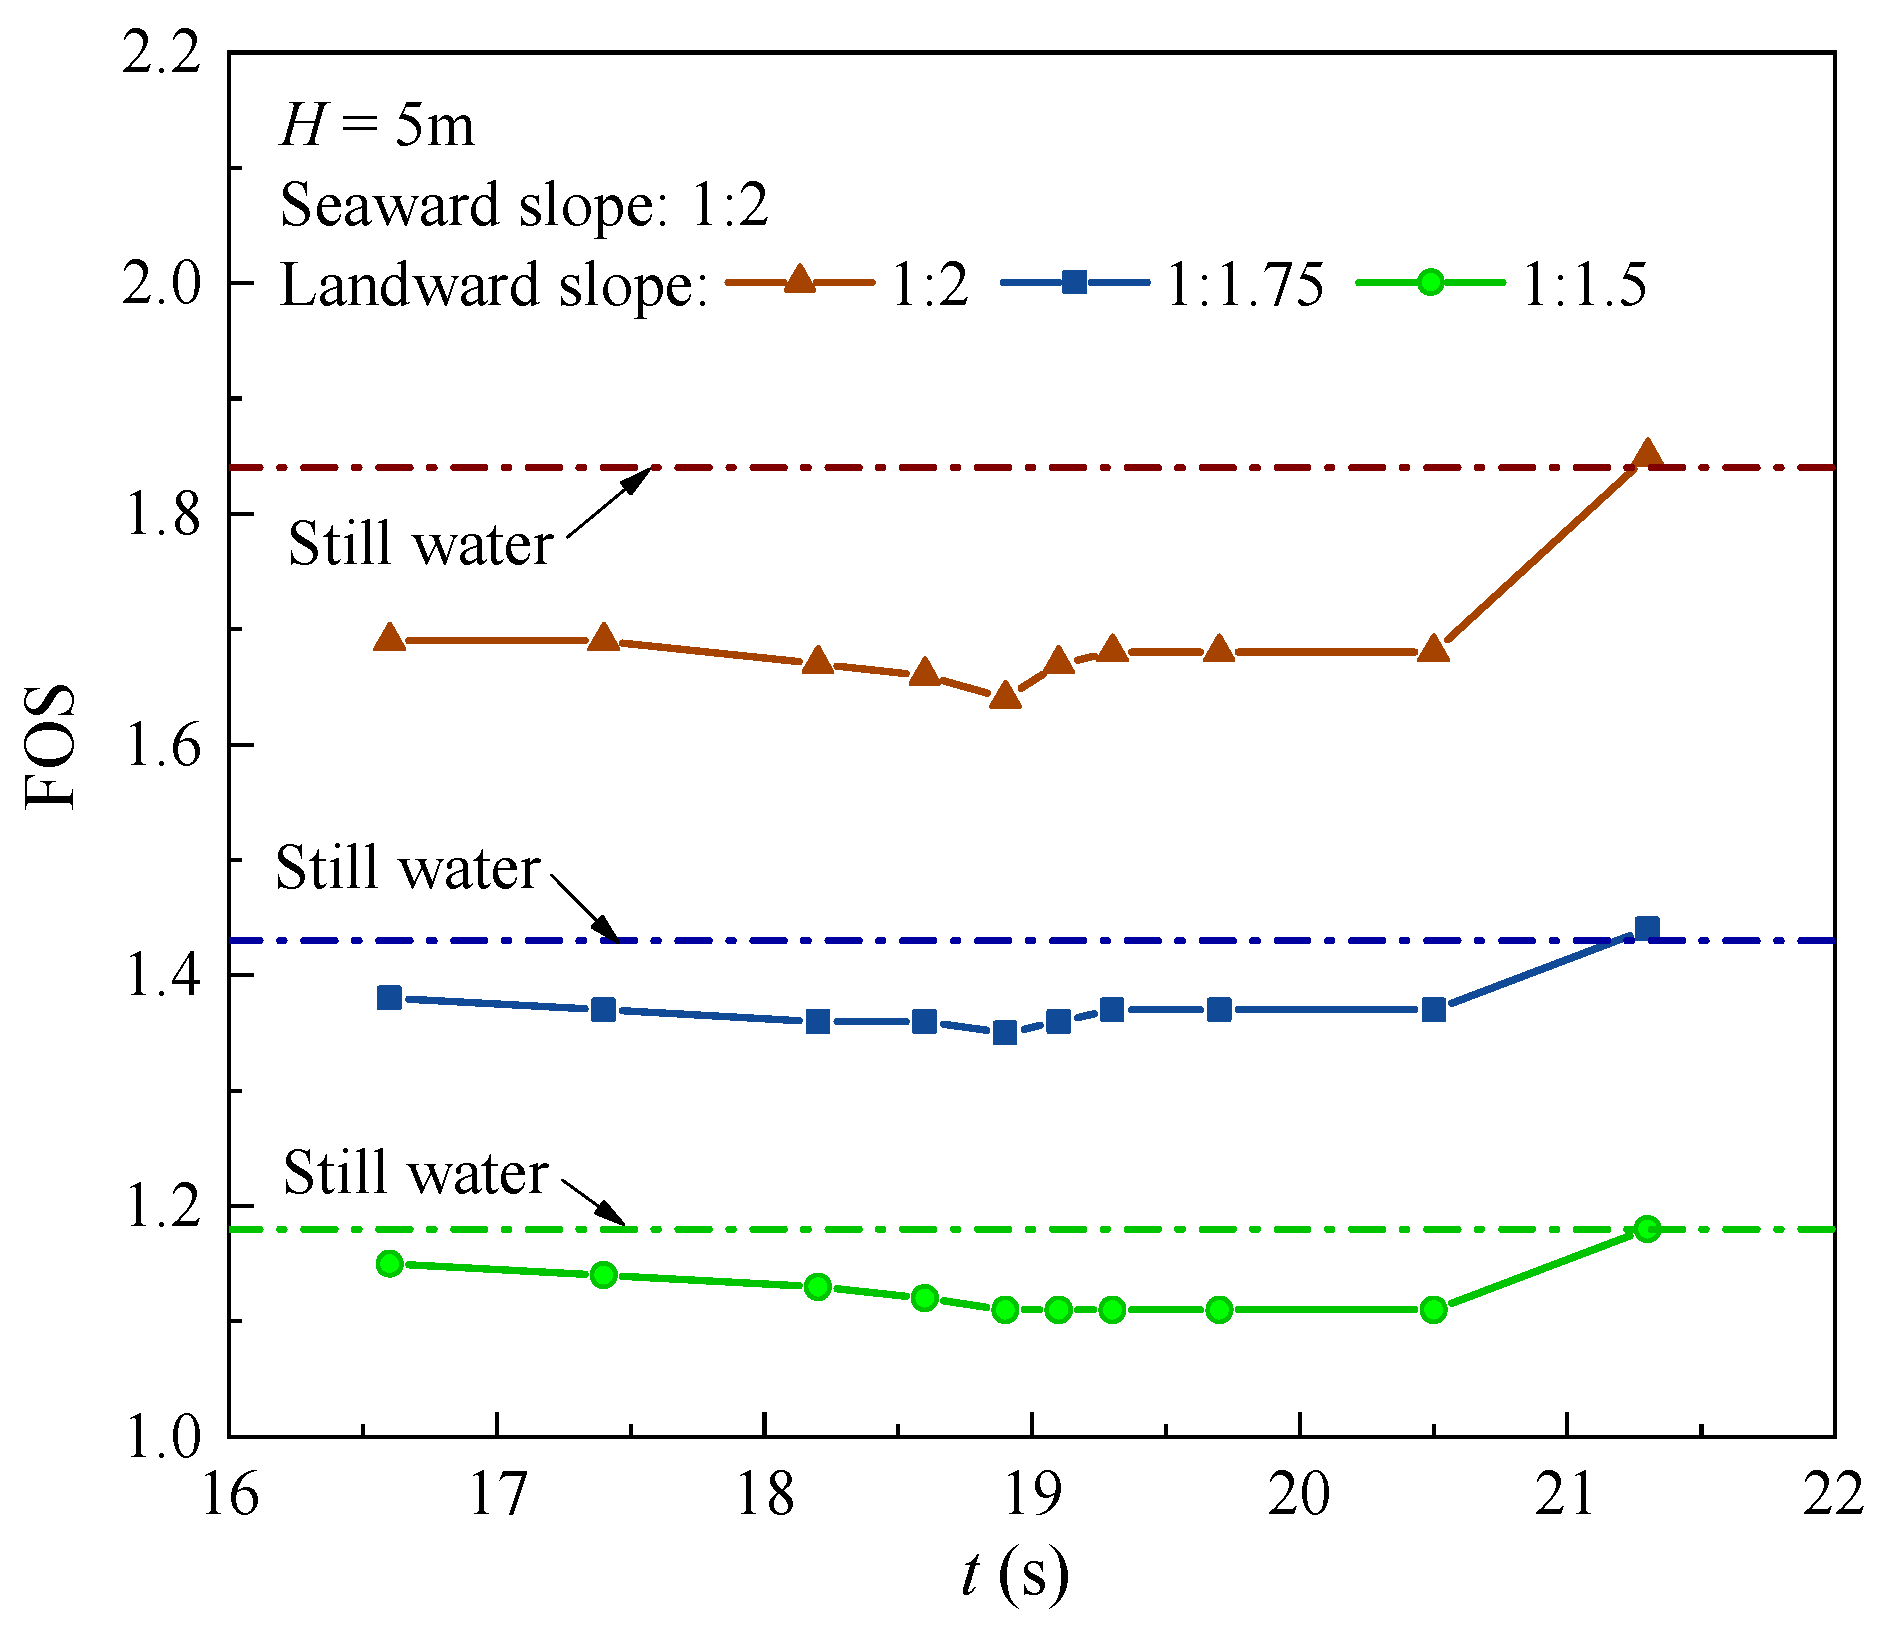
Figure 16 presents the temporal variations in FOS under different landward-slope gradients, with a constant wave height of 5 m. Three gradients of landward slope are examined: 1:1.5, 1:1.75, and 1.2. The FOS
min for these three cases are 1.11, 1.35, and 1.64, respectively; while the FOS for the cases without wave load (i.e., the still water state) are 1.18, 1.43, and 1.84, respectively. Notably, it is shown that FOS
min exceed conventional engineering design requirements (>1.5 for the terrestrial slopes) when both seaward and landward slopes maintain gradients of 1:2 or flatter. This finding highlights the critical relationship between slope geometry and coastal structure stability under hydrodynamic forcing.
3.4.5. Effect of Current
In the marine environment, waves and currents often coexist and interact. In this study, the current refers to an externally generated steady flow (e.g., tidal or wind-driven current), which is superimposed on the wave field. Waves and currents commonly coexist in the ocean environment, and the direction of current velocity can have a significant impact on the propagation of solitary waves, thereby influencing the stability of breakwaters. In this section, the initial horizontal velocity is applied to the fluid at the wave-making boundary, and the effects of two horizontal flow directions are calculated and discussed: co-directional flow with waves (V = 1 m/s) and counter-directional flow with waves (V = −1 m/s).
As shown in
Figure 17, the FOS
min of the breakwater is 1.09 when the flow is not considered. When the co-directional flow with waves is considered, the FOS
min decreases slightly to 1.08, which is unfavorable for breakwater stability. However, with counter-directional flow with waves, the FOS
min increases to 1.14, which is beneficial for breakwater stability. It can also be observed that the maximum displacement within the breakwater significantly decreases when there is counter-directional flow with waves. This may result from the reverse movement of the fluid, weakening the impact of the waves and flow on the breakwater, thereby enhancing its stability. Therefore, evaluating wave–current interaction is essential for predicting long-term structural performance under extreme marine conditions.
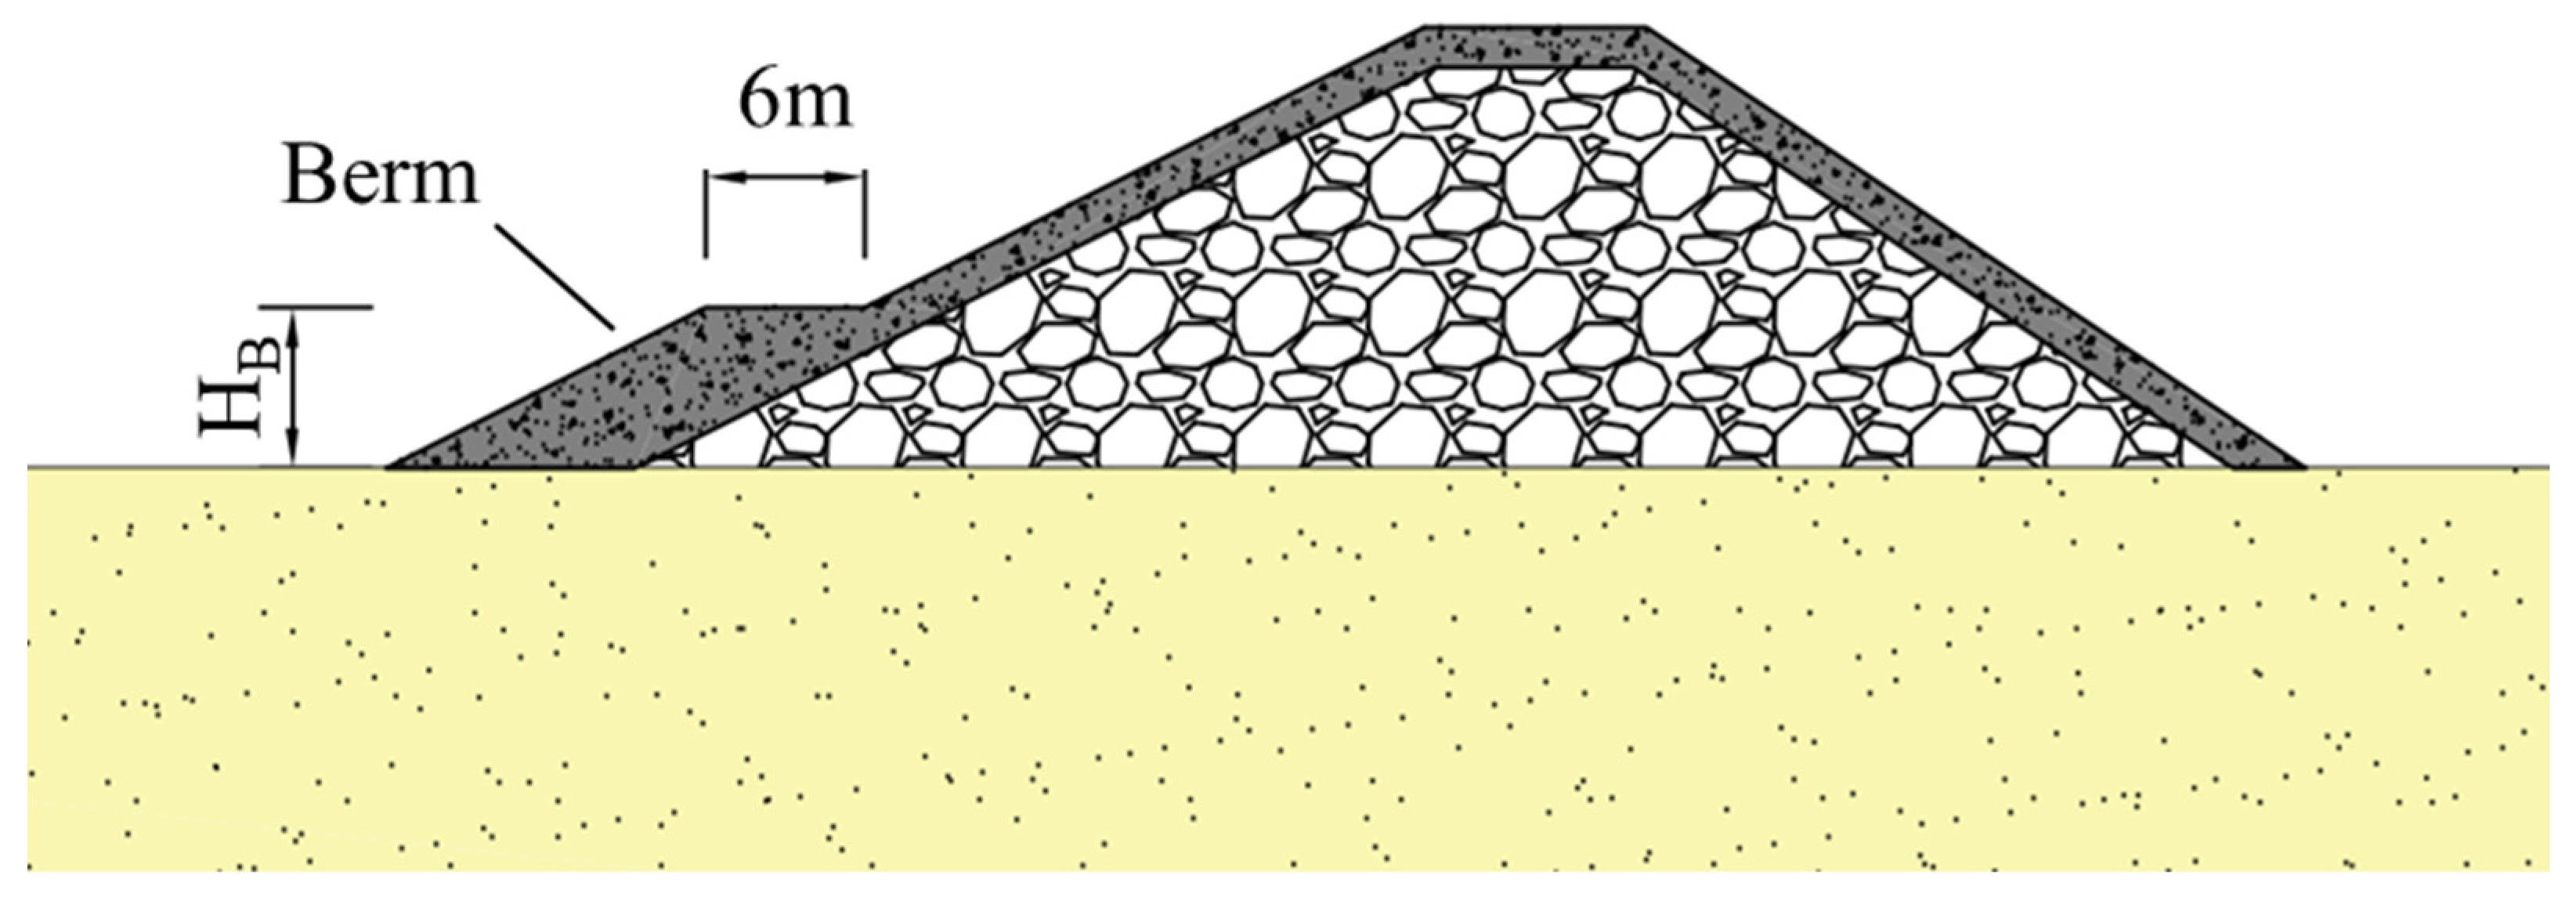
3.4.6. Effect of Berm
The platforms on the slopes of revetment and sloping breakwaters are referred to as berms. Berm could be placed at the toe of breakwater and could serve multiple purposes [
42]. In this section, the influence of berm on the stability of breakwaters is investigated, without considering the wave scouring and settlement. A schematic diagram of the berm dimensions is given in
Figure 18, with a constant width of 6 m. The stability of the breakwater with the installation of four different heights of berm (
HB = 4, 6, 8, and 10 m) is discussed. The wave height
H = 7 m and
Figure 19 illustrates the scenario without the installation of berm for the convenience of comparison.
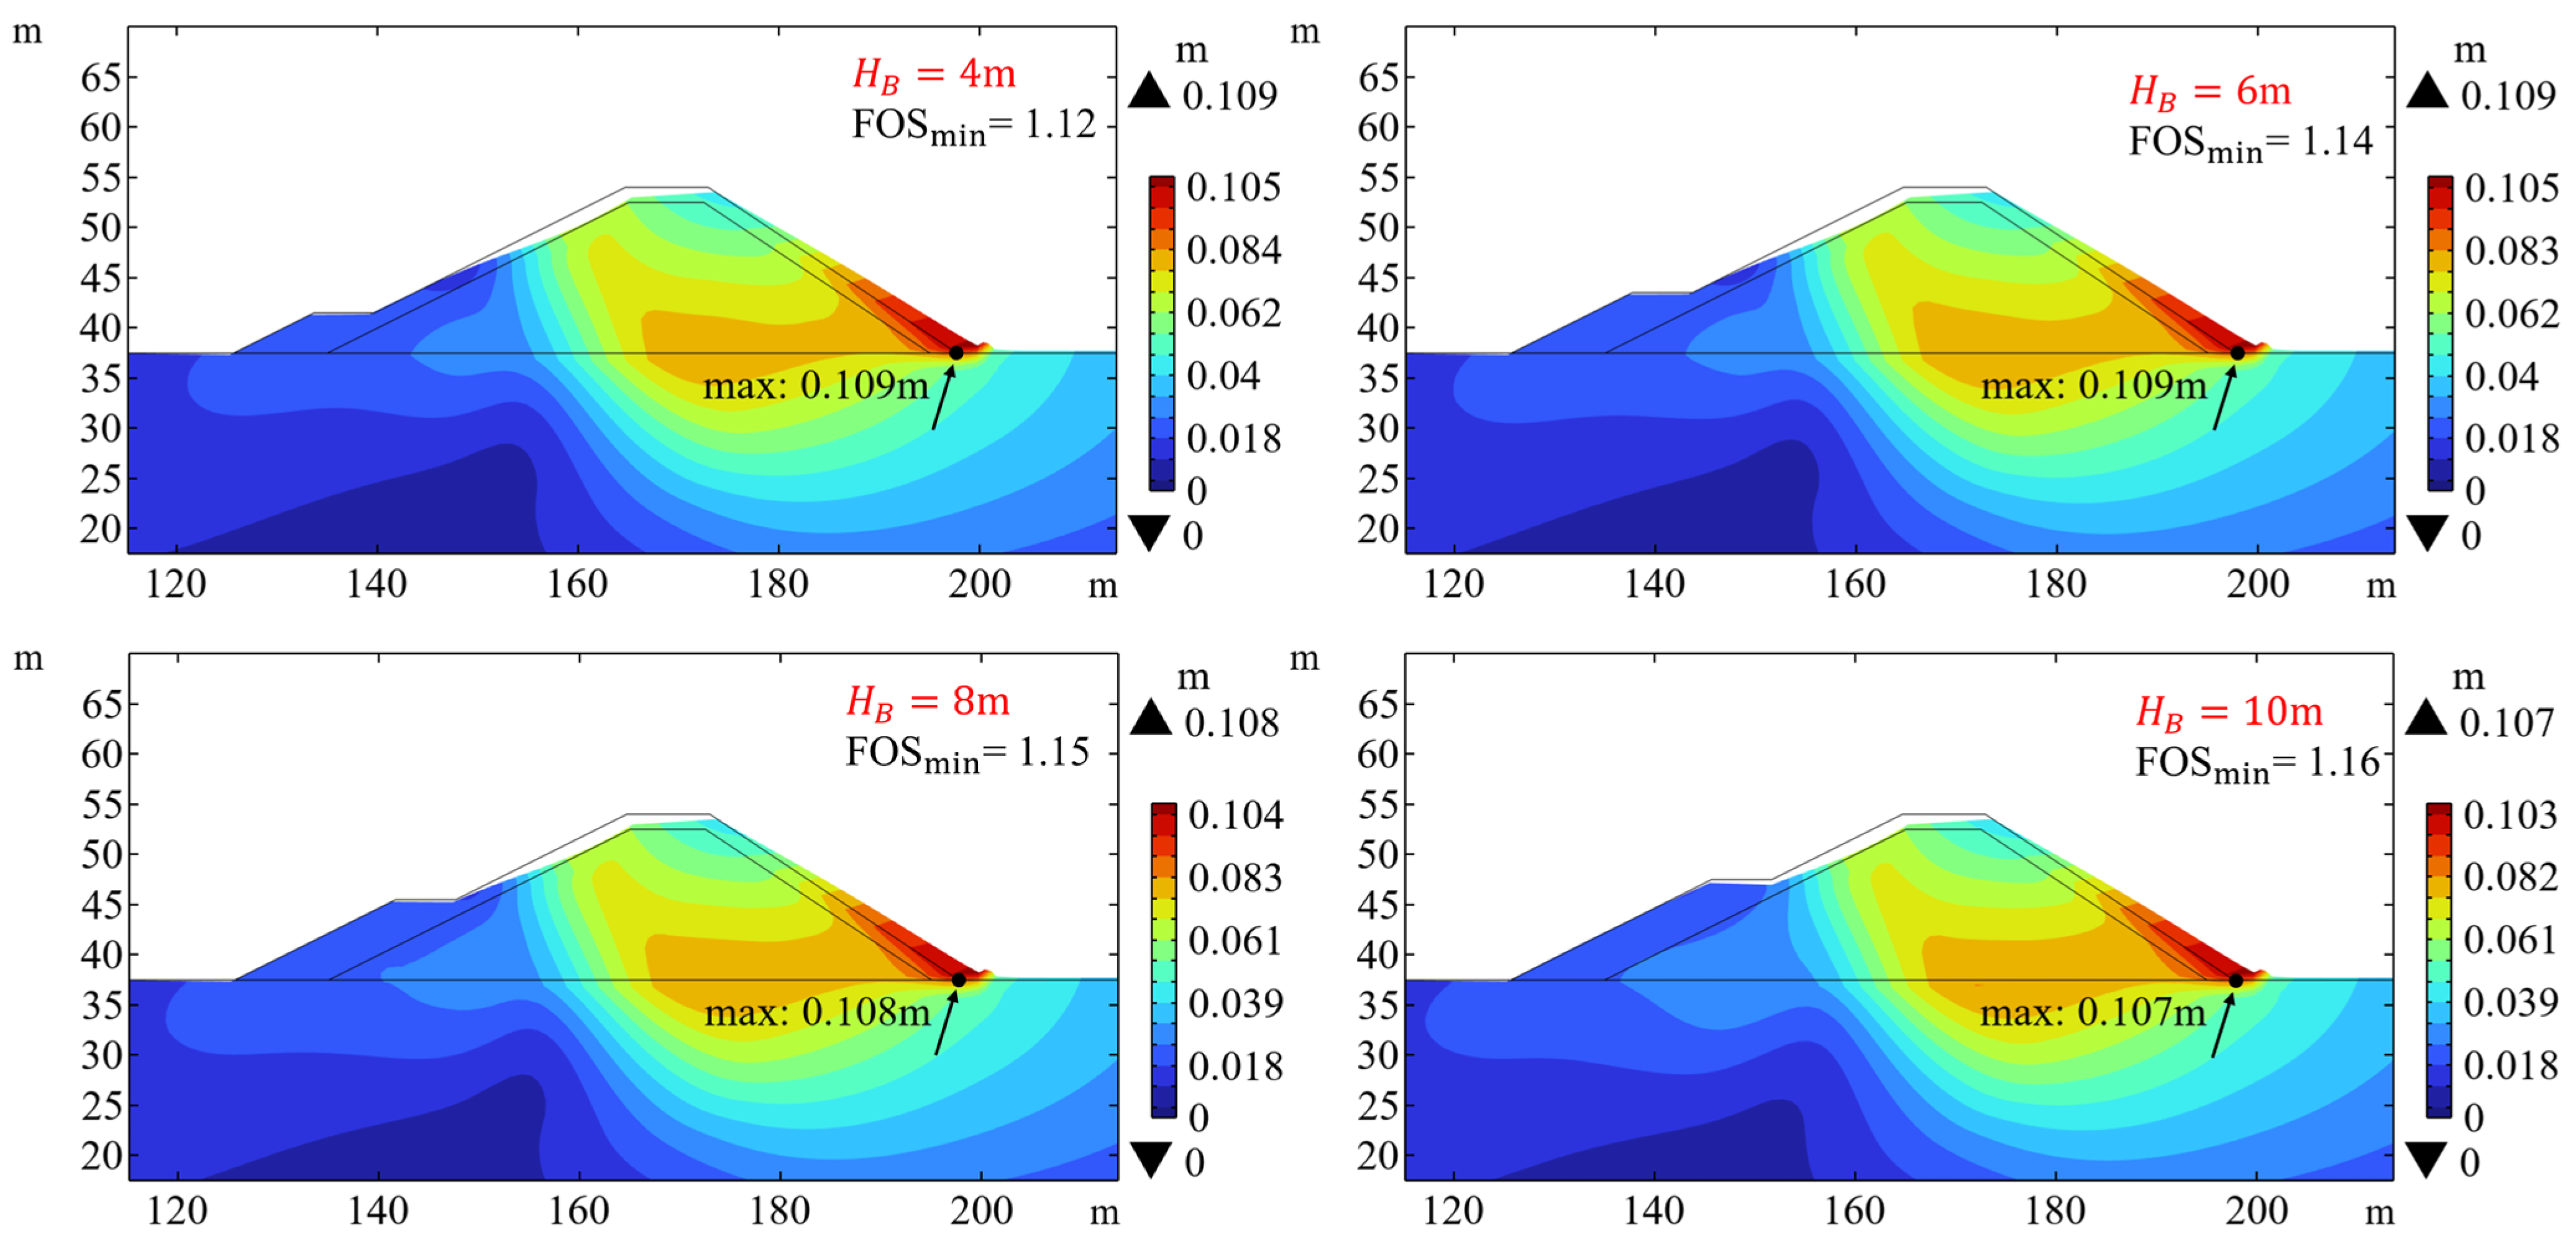
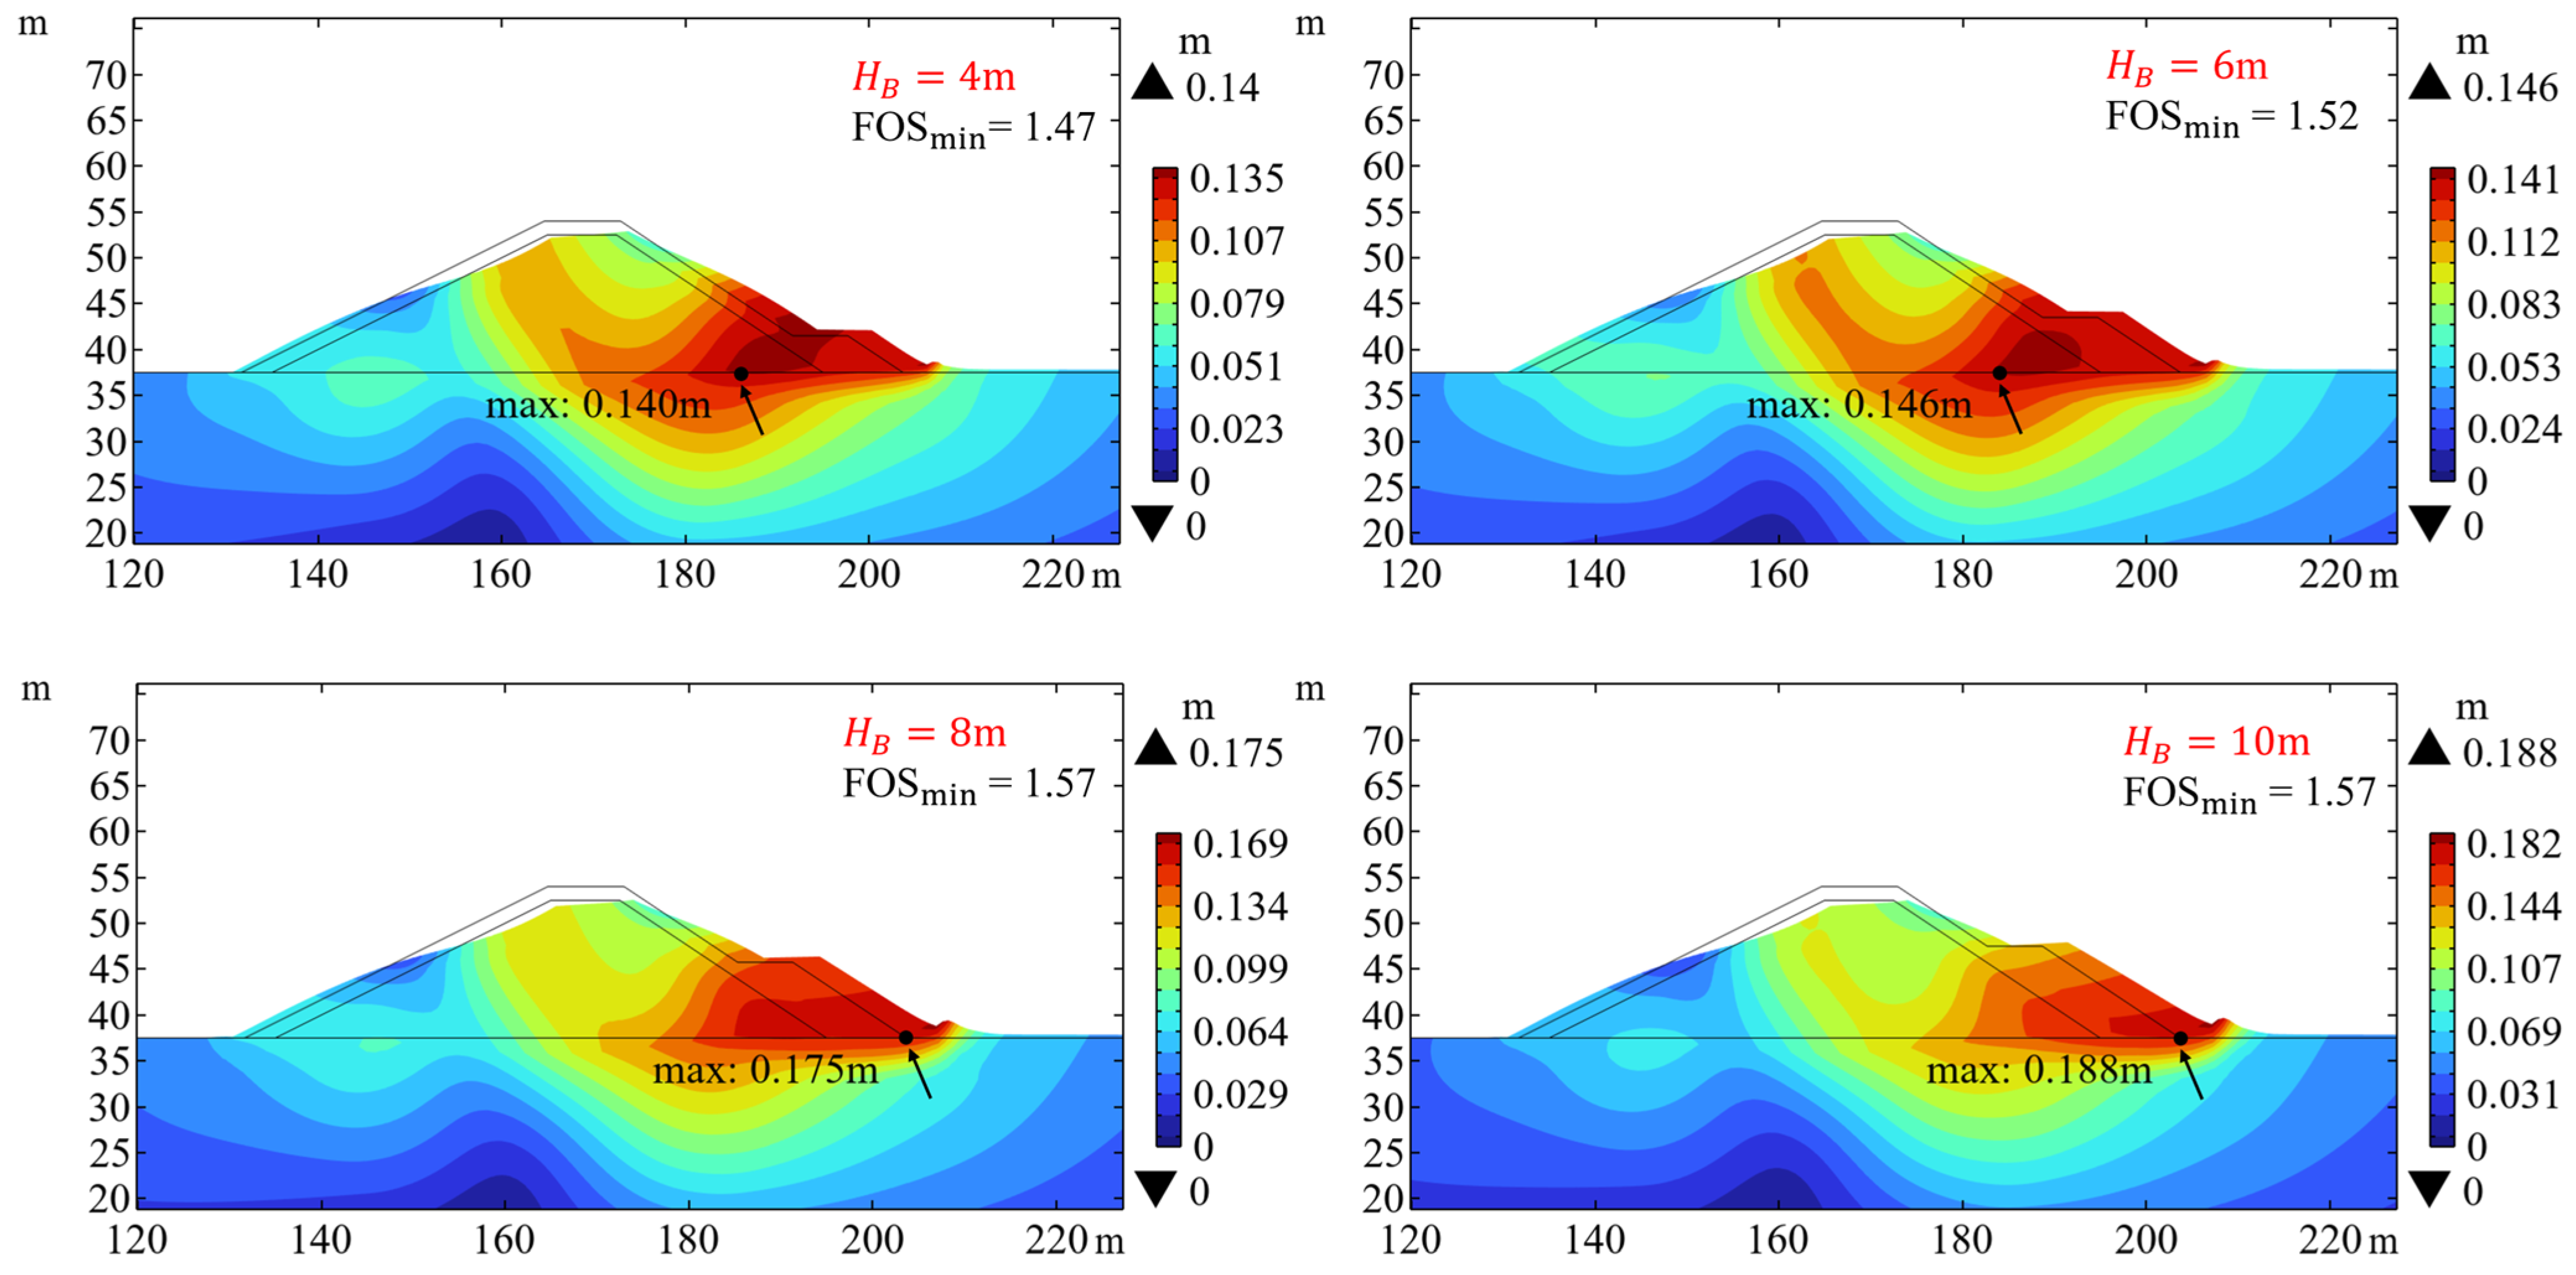
Figure 20 and
Figure 21 illustrate the displacement distribution at the most critical state when the berms of different heights are installed on the seaward slope and landward slope, respectively. It can be observed that placing the berm on either side of the breakwater increases the value of the FOS
min, enhancing the stability of the breakwater. Notably, when the berm is installed on the seaward slope, the increase in FOS
min is relatively small, with only a slight increment from 1.12 to 1.16 as the berm height increases. This could be due to the berm dispersing some of the wave load, alleviating the pressure exerted on the core of the breakwater. However, when the berm is installed on the landward slope, the FOS
min increases from 1.47 to 1.57, which is significantly greater than that in the scenario without berm (FOS
min = 1.08 in
Figure 7). Even with a relatively small berm height (
HB = 4 m), it substantially elevates the FOS
min. This could be attributed to the presence of the berm providing some support for the breakwater, allowing for greater displacement before instability occurs. Therefore, when wave scour and settlement are not considered, installing a berm on the landward side of the breakwater achieves better results in terms of both safety and economy.
4. Conclusions
This study constructs a one-way coupling and practical numerical model of wave–structure–seabed to analyze the stability of rubble mound breakwater under the load of a solitary wave. The wave load is obtained through the CFD method, the pore water pressures are calculated using Darcy’s law, and soil behavior is modeled using the Mohr–Coulomb constitutive model. The stability index of the breakwater under wave load is calculated using the SRM. This study includes a detailed assessment of stability under varying hydrodynamic conditions, including wave height, soil shear strength, and slope gradient. The results contribute to a deeper understanding of breakwater performance under extreme wave events.
Based on the numerical calculation, main conclusions can be drawn as follows:
(1) The wave motion directly affects the induced pore pressure inside the breakwater and seabed, exerting a considerable impact on the stability of the breakwater. Under solitary wave action, there is a minimum safety factor (FOSmin) that corresponds to the most critical situation for breakwaters with specific slopes. Thus, this quantitative index, i.e., FOSmin, is introduced to evaluate stability, distinguishing it from other analytical or numerical approaches.
(2) Disregarding the effects of scouring and settlement, the seaward slope experiences significant wave load, causing the core of the breakwater to displace laterally, leading to substantial sliding at the toe of the landward slope of the breakwater and resulting in instability.
(3) With the increasing wave height, the wave load and displacement at the toe of the landward slope increase accordingly. This results in a gradual decrease in the safety factor FOSmin, indicating an increasing risk of breakwater instability.
(4) Reinforcing the seabed soils, increasing the shear strength index, increasing the effective internal friction angle of the core material, and reducing the slope gradient of the breakwater could help increase the stability of the breakwater. The extent of stability improvement requires further calculation and evaluation.
(5) When the wave and current flow in the same direction, the stability of the breakwater decreases. Conversely, when the wave and current flow in opposite directions, the stability of the breakwater increases.
(6) The installation of berms effectively enhances the safety factor of the breakwater. When scour is not considered, installing berms on the landward slope is significantly more effective, from both safety and economic perspectives, than on the seaward slope.
These conclusions on stability are conditional, as they assume an intact armor layer and do not address its hydraulic failure, which in practice should be dealt with by empirical formulae.

