Abstract
With the rapid advancement of artificial intelligence and computational technologies, collision risk assessment remains a key challenge for Autonomous Surface Vehicles (ASVs). Traditional approaches typically based on five indicators including distance, Distance/Time to Closest Point of Approach (DCPA/TCPA), relative heading, and speed ratio often suffer from redundancy, weak indicator independence, and limited correspondence to the physical characteristics of dynamic encounters. To overcome these limitations, this study proposes a physics-driven collision risk evaluation framework grounded in the Quaternion Ship Domain (QSD). The model simplifies the indicator system to three physically interpretable metrics: inter-ship distance, the coupled DCPA-TCPA index, and the coupled Bow Crossing Range-Bow Crossing Time (BCR-BCT) index. A logarithmic and sigmoid function is introduced as the factor collision risk normalization function, in contrast to a traditional Min–Max scaling function, thereby enhancing the smoothness and interpretability of risk evolution. Python-based simulations involving overtaking, head-on, and crossing scenarios were conducted to validate the proposed approach. The results demonstrate that the framework accurately captures both the magnitude and temporal evolution of collision risk, significantly improving interpretability, robustness, and practical applicability. The proposed QSD-based model provides a physics-consistent and computationally efficient solution for real-time collision risk assessment of ASVs.
1. Introduction
With the rapid advancement of artificial intelligence technologies and computational power, research on Autonomous Surface Vehicles (ASVs) has accelerated in recent years [1]. As intelligent navigation and autonomous decision-making become prevailing trends in the maritime industry, a key challenge lies in whether vessels can accurately perceive and evaluate potential collision risks to ensure reliable collision-avoidance decisions [2,3,4].
Traditional collision risk assessment methods have primarily relied on the DCPA and the TCPA [5]. Under the assumption that vessels maintain their present courses and speeds, these parameters offer intuitive and computationally efficient estimations of potential conflicts and have, thus, been widely applied in conventional navigation and vessel traffic services. However, relying solely on DCPA and TCPA fails to capture the full complexity of real-world dynamic encounters. To address this limitation, later studies expanded the indicator set to include five commonly used factors: DCPA, TCPA, inter-ship distance, relative bearing, and speed ratio [6,7,8,9,10]. These parameters together can reflect vessel motion characteristics and navigational conventions. For instance, a vessel approaching from the starboard forward quadrant generally represents a higher collision risk, consistent with practical seamanship and COLREGs requirements. Nevertheless, such multi-factor models still exhibit inherent redundancy and weak indicator independence.
To more accurately describe spatial safety margins, the Ship Domain Theory was proposed, defining the minimum safe region surrounding a vessel—typically represented by circular, elliptical, or sector-shaped boundaries [11,12]. This concept incorporates maneuverability constraints, COLREGs compliance, and seamanship principles, offering a physically meaningful and operationally valuable description of navigational safety zones [13,14,15]. To further enhance dynamic representation, recent studies have introduced geometric–temporal coupling indicators. Liu et al. proposed the Ship Domain Overlapping Rate (SDOR) to quantify regional collision risk and visualize spatial risk distribution [16,17].
In recent years, numerous studies have refined collision risk modeling. Hörteborn et al. incorporated AIS-derived vessel density into the ship domain model to establish a collision risk index [18]. Chen et al. developed a multi-vessel risk evaluation framework using real-time AIS data [19,20], while Wang et al. applied the DBSCAN clustering algorithm to express collision risk as an exponential function of DCPA and TCPA [21,22]. Although such models leverage data-driven or AI-based algorithms, they often lack direct physical interpretability and depend heavily on empirical fitting, limiting generalizability to unseen scenarios.
For physics-based approaches, researchers have explored multi-criteria decision-making and fuzzy logic frameworks to integrate distance, DCPA, TCPA, bearing, and speed ratio into unified risk evaluation systems [19,23,24,25,26]. These methods improve flexibility and enable adaptive weighting; however, as DCPA and TCPA are derived from speed and bearing, recombining them with these same factors introduces redundancy and compromises indicator independence. Moreover, DCPA and TCPA are not always jointly meaningful—for example, when TCPA is negative, DCPA becomes irrelevant, yet many models fail to address this case [6,27]. Consequently, the excessive number of interdependent indicators increases subjectivity in weight assignment and weakens physical interpretability, ultimately reducing both objectivity and operational reliability. In contrast, indicators such as the Bow Crossing Range (BCR) and Bow Crossing Time (BCT) are often emphasized in navigation practice, as they directly characterize crossing behavior and temporal interaction between vessels. Stolzmann et al. analyzed AIS encounter data and demonstrated that BCR and BCT provide complementary information to DCPA and TCPA, effectively identifying when and where a target vessel may cross ahead [28].
In summary, existing research still faces several key challenges: (1) the lack of independent, physically interpretable indicators that reduce redundancy in DCPA/TCPA-based models; (2) the absence of standardized methods to jointly account for geometric constraints and temporal dynamics in defining safety boundaries; and (3) the overuse of coupled indicators that complicate fuzzy weighting and obscure physical causality, thereby limiting model robustness and practical interpretability (Table 1).

Table 1.
The comparison of other papers considering ships’ collision risk assessment.
To address these challenges, this study proposes a physics-driven collision risk evaluation framework grounded in the QSD. The major contributions of this work are as follows:
- Physics-based indicators: Traditional surrogates such as relative heading and speed ratio are replaced by BCR and BCT, providing physically interpretable metrics that directly correspond to actual vessel maneuvers.
- Coherent risk reconstruction: The model integrates QSD boundaries with a logarithmic coupling function and a sigmoid mapping to construct a unified collision risk function that is bounded, monotonic, and differentiable, improving interpretability and numerical stability.
- Simplified weighting: The indicator set is reduced from five to three—Distance, (Closest Point of Approach), and (Bow Crossing)—thereby minimizing redundancy, reducing coupling complexity, and enhancing both robustness and operational applicability.
2. Methodology
2.1. Problem Formulation and Basic Concepts
In this work, we use several key variables such as DCPA, TCPA, distance, BCR, and BCT of obstacles or target ships [33]. In ASV encounter situations, there are two vessels; one is own ship, the other is the target ship, as shown in the following figure.
Figure 1: “O” denotes own ship; “T” denotes target ship; denotes the distance between the O and T; denotes DCPA; denotes BCR; denotes the angle from the true bearing line of own ship to the relative velocity vector. represents the relative bearing of the target ship with respect to own ship; other parameters are calculated as in the following equations.
denotes the velocity vector of the target ship relative to own ship, is the velocity vector of the own ship, and is the velocity vector of the target ship.
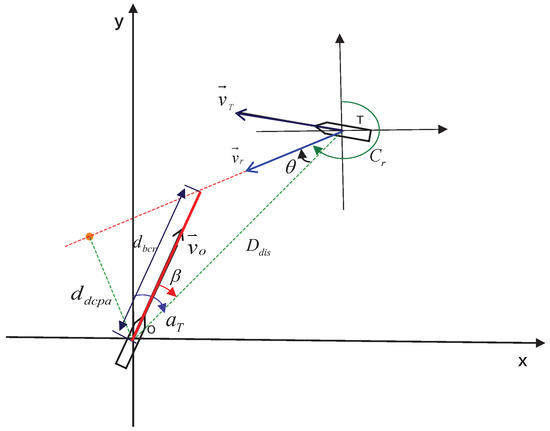
Figure 1.
Illustration of ship encounter parameters: relative velocity, course, and critical distances.
The DCPA and TCPA between the own ship and the target ship are calculated as follows:
In these equations, is the course of relative velocity vector , represents the true bearing of the target ship from own ship. The distance and time for the target ship passing ahead of own ship are calculated as follows:
In the above equations, denotes BCR, the distance of the target ship passing ahead of own ship, and denotes BCT, the corresponding passing time.
In the process of the ASV avoiding target vessels or obstacles, the key indicators commonly considered are DCPA and TCPA. A smaller DCPA indicates a higher level of danger, while a smaller TCPA reflects greater urgency and, thus, a higher risk. However, using these two indicators independently may lead to biased evaluations. For instance, when DCPA is large but TCPA is small, DCPA suggests a low risk while TCPA indicates high urgency. The combined result may be interpreted as moderate risk, which does not accurately reflect the actual situation. In practice, when DCPA is large, both indicators become less relevant for risk assessment.
Traditional methods often rely on five independent indicators, DCPA, TCPA, distance, relative bearing, and speed ratio, to construct a coupled ship collision index. Such coupling, however, is complex and prone to introducing bias due to the large number of indicators. To simplify the evaluation process and reduce coupling induced deviations, this study adopts only three indices: and .
Moreover, factors such as relative speed and bearing are already embedded in the calculation of TCPA and the QSD. Therefore, they are not separately included in the evaluation system. Instead, this study emphasizes the distance and time of the target ship passing ahead of the own ship, which are critical in practical collision avoidance. A shorter passing distance combined with a shorter passing time indicates higher urgency and, consequently, a greater risk.
Based on this analysis, the collision risk evaluation index system proposed in this study is structured as follows:
Here, represents a composite index of DCPA and TCPA, denotes the inter ship distance, and represents a composite index of BCR and BCT. The construction of these indices relies on encounter-related parameters of the ASV.
2.2. Ship Collision Risk Index Design via Logarithmic–Sigmoid Mapping
This study proposes a ship collision risk index model based on the coupling of the logarithmic and the sigmoid functions. First, when the base of the logarithmic function is less than one, it exhibits the following property: As the independent variable decreases and approaches zero, the function value increases rapidly, with the variation becoming more pronounced near the limit point. This characteristic effectively reflects the real situation in ship encounters, where the risk of collision rises sharply when the inter-ship distance or other critical safety parameters (e.g., TCPA, DCPA) approach their thresholds. Second, the sigmoid functions is widely applied in engineering and machine learning, and its mathematical model is expressed as follows:
In the above equation, denotes the constant weight of input variable and denotes the values of sigmod function value. The curve of this function is as below.
As shown in Figure 2, the function’s shape is governed by : A larger produces a steeper curve (greater gradient). Therefore, when collision risk (y) needs to respond more sensitively to the input (x), should be increased. And the sigmoid function demonstrates a typical S-shaped characteristic, with its output constrained within the interval [0, 1]. This enables the mapping of continuous variables into normalized risk probability values. Such a property is highly consistent with the requirements of ship collision risk assessment: The risk index remains close to 0 under low-risk conditions, while approaching 1 under high-risk conditions.
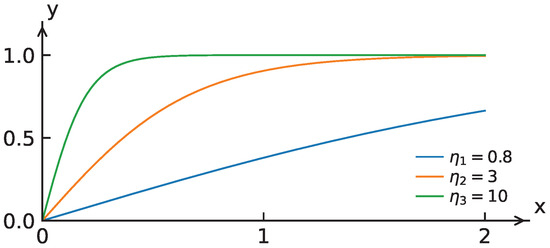
Figure 2.
The curve of sigmoid function.
Accordingly, the proposed risk index model operates as follows: Key encounter parameters (such as distance, relative velocity, and TCPA/DCPA) are first processed through the logarithmic function, leveraging its “critical approach and sharp increase” property for preliminary risk amplification. The output of the logarithmic function is then fed into the sigmoid function, which normalizes the result into the [0, 1] range, producing the final ship collision risk index.
This coupled model not only captures the sharp variation of risk near critical thresholds but also ensures that the resulting values are standardized and highly interpretable, thereby providing a reliable basis for ship collision avoidance decision-making.
2.2.1. Membership Function of Distance
The QSD is a vessel safety zone model that adapts to a ship’s dynamic parameters. Its core concept is to partition the surrounding safety area into four independent sectors—forward, after, port, and starboard—while incorporating shape control parameters to accommodate different navigation cases. In practice, the QSD is derived from vessel navigation habits and statistical analysis of AIS data, which inherently reflect the International Regulations for Preventing Collisions at Sea (COLREGs). Thus, the QSD represents a safety domain that integrates both regulatory requirements and practical maneuvering behavior. In operational cases, vessels in the starboard forward quadrant typically require a wider safety boundary, corresponding to the higher priority of potential collision risks.
In this study, the QSD serves as the basis for reconstructing a collision risk index model for USVs. The QSD boundaries are defined in a Cartesian coordinate system with the ship at the origin, the bow aligned along the positive y-axis, and the starboard direction along the positive x-axis, expressed as follows:
In the above equation, the function determines the sign of a parameter and is defined as follows:
Similarly, the function is defined. The details of the QSD are as follows.
In Figure 3, and denote the forward and after radian of the QSD along the longitudinal direction, while and denote the port and starboard radian along the lateral direction. Their expressions are as follows:
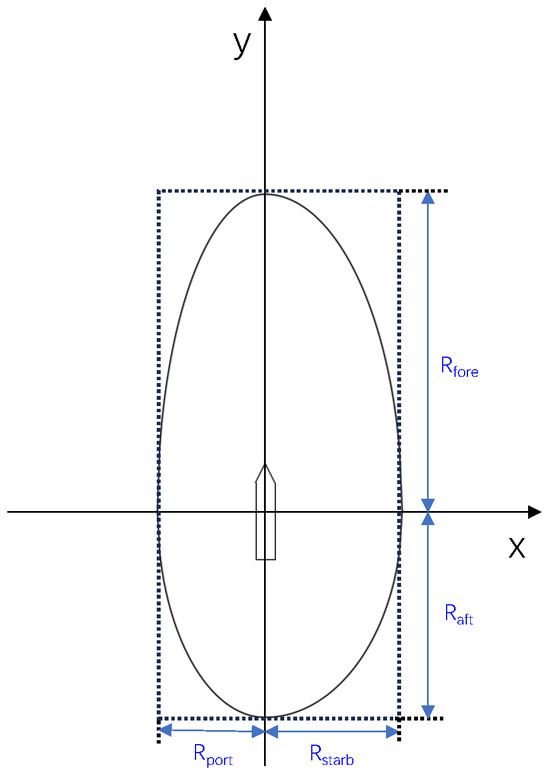
Figure 3.
Illustration frame of ship quaternion domain.
In the equations, L denotes the length of the own ship; is the near-distance index, and is the index for the initial turning radius. Both indices can be estimated from empirical relationships using the ship’s principal dimensions and speed (see [31,34]). The QSD defined above delineates a danger zone around the vessel into which other ships are prohibited from entering.
The own ship has two quaternion domains: The larger one represents the ship detection zone, and the smaller one represents the danger zone. When the target ship enters the larger detection zone, collision risk assessment between the ships begins. The position of the own ship (Own) is , and the position of the target ship (Target) is . The distance between the ships is calculated as follows:
In the equation, a and b represent the major and minor axes of the QSD, and denotes the relative bearing of the target ship with respect to the own ship. The specific expressions are as follows:
The maximum value for distance measurement, , represents the threshold below which the presence of the target ship is considered to pose a risk. Its expression is as follows:
Here, k is a proportional constant that reflects the maneuverability of the own ship, the danger level of the surrounding environment, and the skill of the navigator. In general, for ships with lower maneuverability, higher classification, or operating in high-risk environments, a larger k is adopted to account for the increased collision potential. Traditional distance-based collision assessment methods often fail to capture these practical considerations comprehensively. By contrast, the QSD provides a more realistic and objective representation of the ship’s navigable and danger zones in real time. Therefore, in this study, the proportional constant k is incorporated within the QSD framework to develop a collision risk index that is better aligned with engineering practice and operational realities.
The distance membership function is then constructed as follows:
In the above equations, is a logarithmic function of the inter-ship distance d, serving as the input to the sigmoid function, which ultimately yields the value of the distance membership function . The parameter in the sigmoid function is a hyperparameter that adjusts the sensitivity of the risk assessment.
2.2.2. Membership Functions of DCPA and TCPA
The ship domain constructed based on the aforementioned quaternion ship model is designed to exclude the intrusion of other vessels. Accordingly, the minimum encounter distance should be located outside the QSD, while the boundary distance must also be considered.
As shown in Figure 4, if the point of lies within the ship domain, the collision risk index increases; denotes the minimum threshold distance of the ship domain. At the same time, the maximum safe boundary distance should also be taken into account. Moreover, the relative bearing of the with respect to the own ship (Own) is also considered. Thus, the ship domain can be formulated as expressed in the following equations.
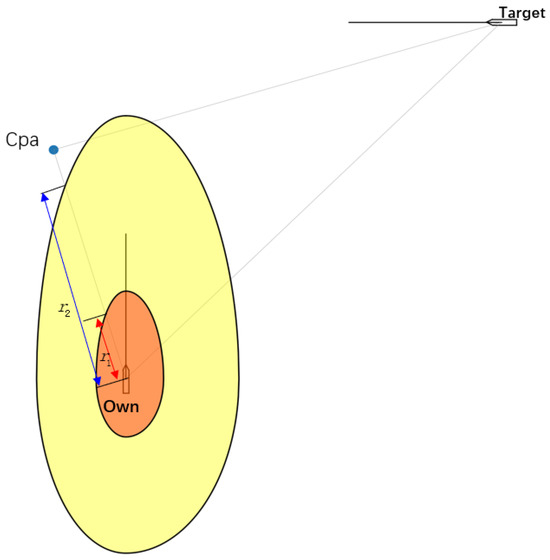
Figure 4.
Danger boundary of based on QSD.
In this equation, a and b (as in Equation (16)) are the major and minor axes of the QSD. After determining the CPA point, its true bearing is obtained as same as in Equations (18) and (19).
Similarly, . Here, k is a hyper-parameter, which can be adjusted by increasing or decreasing its value according to actual conditions. For instance, when navigating in restricted waters without changing the voyage plan, k should be reduced to ensure timely and effective avoidance. Accordingly, the overall membership function of the minimum distance to the closest point of approach and the minimum time to the closest point of approach is constructed as follows:
In the equation, represents the comprehensive membership function for the closest encounter risk of the target vessel; and denote the DCPA and TCPA, respectively. and represent the allowable distance and time thresholds. When the TCPA of the target vessel exceeds , it indicates that sufficient time is available for maneuvering, and the risk membership value becomes 0. Thus, is determined based on the seaman’s skill level or environmental conditions, with s set for this study. Similarly, when the DCPA of the target vessel exceeds , the encounter risk membership function value is also 0.
2.2.3. Membership Functions of BCR and BCT
From the perspective of ship handling practice, seafarers often pay close attention to the BCR and BCT. When the target vessel crosses the bow of the own ship, indicated by a positive BCR value, the collision risk increases as both BCR and BCT decrease. Based on this consideration, this study establishes the membership functions of BCR and BCT as follows.
In these equations, represents the comprehensive membership function of the target vessel’s bow-crossing risk; and denote BCR and BCT, respectively. and represent the allowable maximum bow-crossing distance and time threshold, while denotes the relative velocity of the target vessel. When the bow-crossing time exceeds , it indicates that sufficient time remains for safe passing and, thus, the risk membership value is 0. Similarly, when the bow-crossing distance exceeds the maximum allowable distance , the value of the bow-crossing risk membership function is 0.
2.3. Aggregation into a Comprehensive Collision Risk Index
After calculating the above membership functions, the ship collision risk index can be determined. The construction process of the ship collision risk index in this study is illustrated as follows.
Based on Figure 5, the autonomous vessel acquires the dynamic information of target ships through sensors such as radar, positioning systems, gyro-compass, and AIS, and combines this with its own static and dynamic information. This allows the calculation of the target vessel’s motion parameters, including DCPA, TCPA, and distance to the target vessel, as well as BCR and BCT.
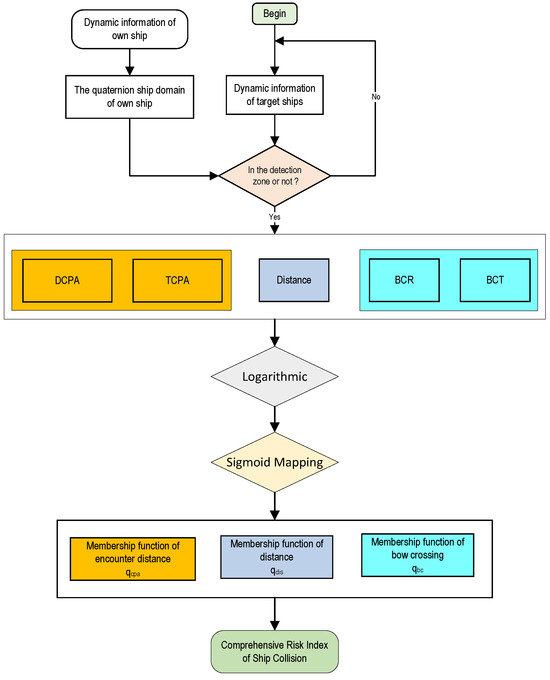
Figure 5.
Flowchart of comprehensive risk index of ship collision.
Using the QSD rules planned for the own ship, which incorporate maneuvering and speed related characteristics, the system further checks whether the distance to the target vessel falls within the detection domain. If it does, the distance membership function value is calculated using logarithmic–sigmoid mapping, such as in Equations (21) and (22); otherwise, the membership value is set to 0, while continuously monitoring the inter-ship distance.
Similarly, based on the distance and direction, the system determines whether this distance lies within the quaternion detection domain. If it does, the membership function of the distance () is calculated using DCPA and TCPA by using logarithmic–sigmoid mapping, such as in Equations (24) and (25); otherwise, the membership value is 0, with continuous monitoring of DCPA.
Likewise, using the BCR and BCT, the bow-crossing membership function is obtained using logarithmic–sigmoid mapping, such as in Equations (26) and (27). Finally, the overall distance membership function () is integrated. The collision risk index (CRI) between the own ship and the target vessel is then calculated using the following formula:
In this context, , , and represent the weighting coefficients of the corresponding factors, where a greater value signifies a higher level of importance. The weights may be derived using a fuzzy evaluation approach or subsequently adjusted manually to accommodate vessel type specific characteristics. Detailed descriptions of the weighting methodology are not included in the present study.
3. Simulation Experiments and Results
To verify the rationality, diversity, and robustness of the proposed ship collision risk index model (the “new QSD-based method”), a series of simulation experiments was carried out. The proposed approach was systematically compared with representative methods under different scenarios, including the “Traditional Method” in [29] and the “QSD-based Method” in [31]; their parameters are same as stated in the original papers.
The simulation platform was developed based on the Maneuvering Modeling Group (MMG) ship dynamics model [35], which accurately captures the inertial characteristics of ship motion. The MMG parameters were derived from a training vessel [36], as in Table 2.

Table 2.
Main parameters of the simulator ship.
The simulation environment was implemented using Pygame (Python version 3.9 or higher) and executed on a computer running Windows 10, equipped with an Intel Core i7 processor and 32 GB of RAM.
3.1. Parameter Testing
To validate the parameter values of the method proposed in this paper, a simulation of the starboard crossing case was conducted. The detailed parameter settings are provided in Table 3.

Table 3.
Initial parameter values of the ships for parameter testing.
Based on the parameter settings, the results for parameter testing are shown in the following Figure 6.
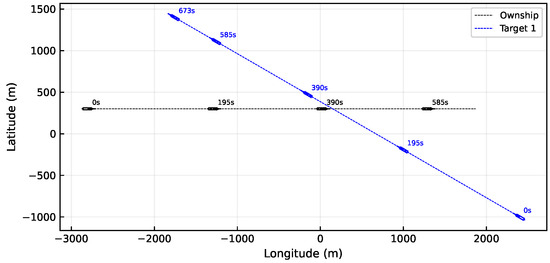
Figure 6.
Trajectory of ship under crossing case.
A larger value of k indicates that the vessel requires a wider safety margin. As illustrated in Figure 7, when k increases, the Collision Risk Index (CRI) rises correspondingly, and the associated risks of and also become more significant, particularly within the higher-value range of the distance risk index. Therefore, a larger k represents an expanded danger zone surrounding the vessel, which typically corresponds to a ship of larger size or one operating under limited maneuverability. For further verification, the weights of the impact factors were adjusted, while other settings remained the same as those in Table 3. The results are shown as follows.
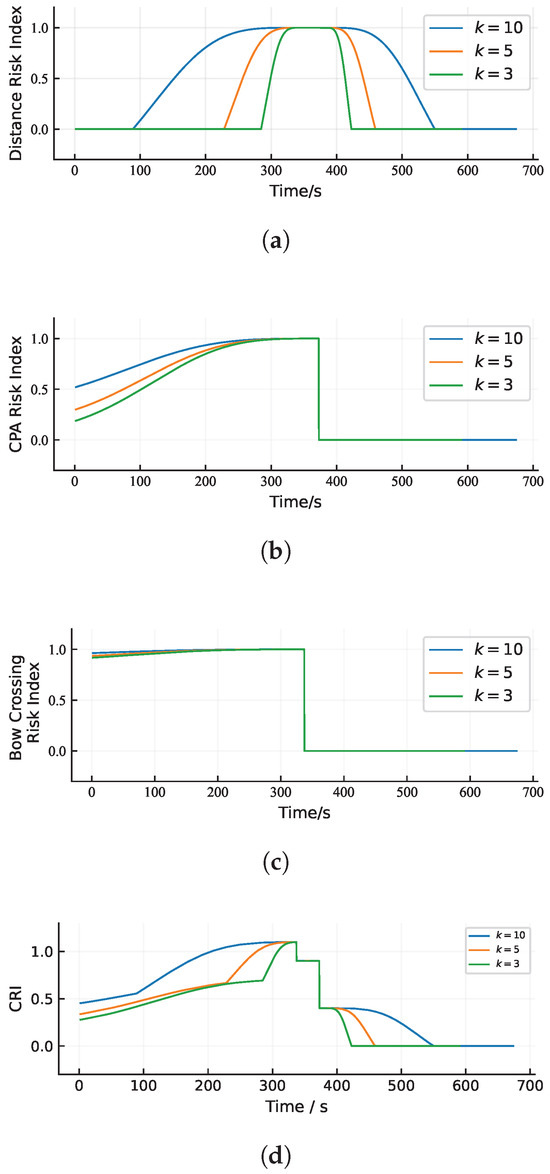
Figure 7.
Ship’s collision risk index curves, under other parameters: m, , , , , , and . (a) Curve of distance risk index. (b) Curve of risk index. (c) Curve of risk index. (d) Curve of collision risk index.
As illustrated in Figure 8, differences in the impact factor weights result in distinct CRI ranges. The overall CRI declines more rapidly when the risk associated with a higher-weight factor is released. For further verification, the ship’s length was adjusted, while other settings remained the same as those in Table 3 and the ship’s maneuverability was the same as before. The results are shown as follows.
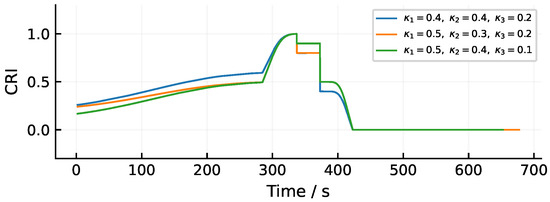
Figure 8.
Ship’s collision risk index under different weights of impact factors, while other parameters are: = 84 m, , , , and .
As shown in Figure 9, the ship length was varied while maintaining identical encounter conditions. With increasing ship length, the duration of the danger period correspondingly extends. This is because ship length is one of the key impact factors influencing the range of the QSD. When the QSD range changes, the corresponding CRI also varies. For subsequent comparisons with other methods, the hyperparameters in the following simulation tests were configured as follows: , , , , , , and .
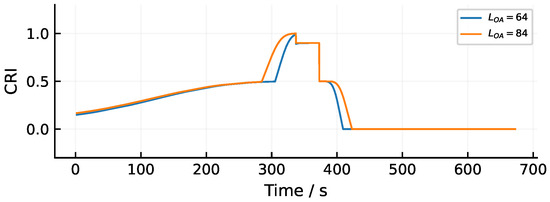
Figure 9.
Ship’s collision risk index under different ship length, while other parameters are: , , , , , , and .
3.2. Case Studies and Results Analysis
3.2.1. Head-On Case
The head-on case refers to the condition in which the own ship and the target ship are navigating in opposite directions. The detailed parameter settings are provided in Table 4.

Table 4.
Initial parameters values of the ships in the head-on case.
According to Table 4, the parameter settings of the ASVs conform to the head-on condition. Both vessels navigate in opposite directions while maintaining constant course and speed. The results are shown in the following figures.
In Figure 10a, own ship is sailing eastward with a course of 90°, while the target-ship is sailing westward with a course of 270°, forming a head-on situation in accordance with COLREGs Rule 14. Throughout the navigation, neither vessel makes any course alterations, and the total voyage time is approximately 340 s. As shown in Figure 10b, the distance between the two vessels decreases gradually from an initial 3400 m and reaches the of 80 m at 201 s. Thereafter, the distance between the vessels increases steadily.
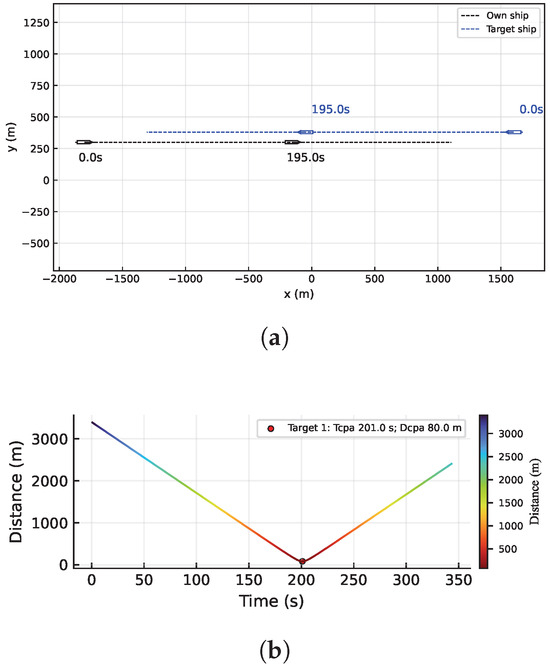
Figure 10.
Head-on case. (a) Trajectory of ship under head-on case. (b) Curve of distance between USVs.
Figure 11 illustrates the variation curves of collision risk indices for ASVs under the head-on case.
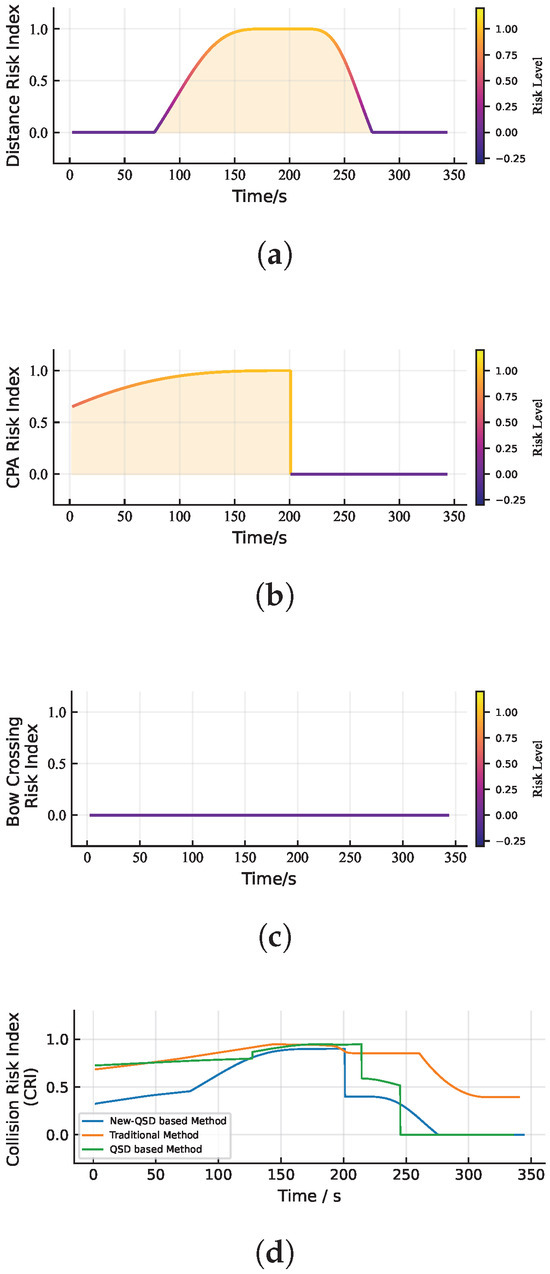
Figure 11.
Ship’s collision risk index curves under head-on case. (a) Curve of distance risk index. (b) Curve of risk index. (c) Curve of risk index. (d) Curve of collision risk index.
Figure 11a shows the distance risk index curve. Starting from zero at the beginning of the encounter, the index gradually increases as the target vessel enters the detection QSD of the own ship, indicating that the risk level rises as the distance decreases. At approximately 150 s, the target vessel enters the danger QSD, and the index reaches its maximum value of 1. After the at 201 s, the risk still exists until about 230 s, when the target vessel leaves the danger QSD, and the index begins to decline. By around 270 s, the target vessel has completely left the stern detection area, and the risk index drops to 0.
Figure 11b presents the risk index curve. Since the two vessels are in a head-on situation, the distance is extremely small, resulting in a relatively high initial index, which further increases as the time to decreases. After passing the point at 201 s, this risk index rapidly decreases to 0.
Figure 11c illustrates the variation of the risk index over time. Since no bow-crossing event occurs in the head-on scenario, the bow-crossing risk factor remains absent and, thus, the index maintains a value of zero throughout the entire simulation.
Figure 11d compares the collision risk indices obtained from three approaches: this paper’s proposed method (“new QSD-based Method”), the “Traditional Method” referenced in [29], and the “QSD-based Method” referenced in [31] (the same as the subsequent figures). The results indicate that all three methods can effectively capture the evolution of collision risk between vessels.
From the result shown in Figure 11d, the key distinction lies in the dynamic response of the “new QSD-based Method”, which eliminates abrupt fluctuations during the rising phase of the risk index, thereby offering a smoother and more reliable early warning capability. In contrast, the “Traditional Method” and “QSD-based Method” maintain a relatively high-risk level even after (e.g., beyond 201 s), failing to reflect the actual situation. By comparison, the “new QSD-based method” exhibits a gradual increase during risk escalation and a clear decline once the encounter is resolved, aligning more closely with real-world patterns and demonstrating superior rationality and engineering applicability.
As shown in Table 5, the “Traditional Method” indicates that the vessel remains at a high-risk level throughout most of the head-on encounter period.

Table 5.
Comparison of CRI time proportions within different value ranges under head-on encounter.
In contrast, the “QSD-based Method” maintains a medium-risk state for approximately of the total navigation time, suggesting more stable and sustained collision-avoidance behavior. The “New QSD-based Method” keeps the vessel predominantly within the safe zone, with risk only increasing temporarily near the head-on passing, after which safety is quickly restored—covering about of the overall period. According to Figure 11d, the vessel enters a moderate-risk region after approximately 70 s, passes the target ship at around 200 s where the risk sharply decreases, and subsequently, the risk continues to diminish as the target vessel moves away.
3.2.2. Crossing Case
To further validate the applicability of this paper’s proposed method, a simulation of a starboard crossing case was conducted. The detailed parameter settings are provided in Table 6.

Table 6.
Initial parameters values of the ships in crossing case.
Based on the parameter settings, the results for the crossing case are shown in the following figures.
In Figure 12a, the two vessels are in a crossing encounter, with the target ship approaching on the starboard side. Both maintain constant courses for approximately . Figure 12b shows the inter-ship distance decreasing until a CPA distance of at , after which the vessels separate. Once the CPA has passed (after ), the risk index rapidly diminishes and approaches zero.
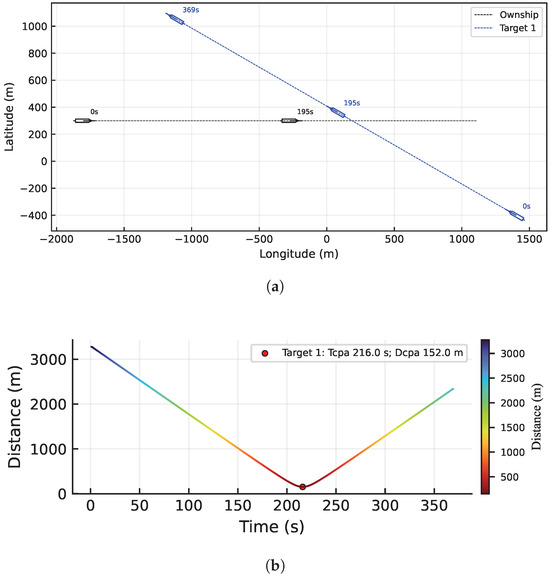
Figure 12.
Crossing case. (a) Trajectory of ship under crossing case. (b) Curve of distance between USVs.
Figure 13a shows the distance risk index curve between the ASVs. Starting from 0 at the beginning of the encounter, the index gradually rises after the target ship enters the detection zone of the own ship at 90 s, with the risk increasing as the distance decreases. Around 160 s, the target ship enters the danger zone, and the index reaches its maximum value of 1. By approximately 240 s, the target ship leaves the danger zone, and the risk gradually decreases. At around 290 s, the target ship completely exits the stern detection area, and the risk returns to 0. The duration for entering the danger detection zone is relatively long, while the exit is shorter, which is due to the characteristics of the QSD: The detection range on the starboard bow is larger, while the stern detection range is relatively smaller.
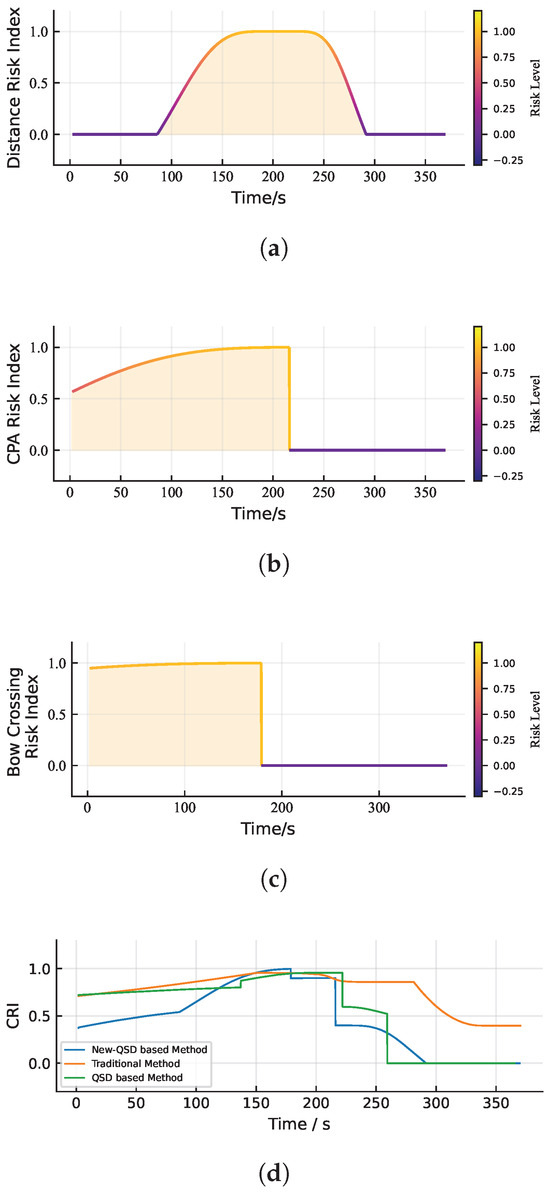
Figure 13.
Ship’s collision risk index curves under crossing case. (a) Curve of distance risk index. (b) Curve of risk index. (c) Curve of risk index. (d) Curve of collision risk index.
Figure 13b shows the CPA–based risk index. As the distance at CPA (DCPA) decreases and the time to CPA (TCPA) shortens, the index increases accordingly, reflecting higher encounter risk.
Figure 13c shows risk index curve. In the crossing case, as the target ship passes the bow and enters the danger detection range, the index increases gradually with decreasing time. After approximately 190 s, when the target ship completes the bow crossing, the index drops to 0.
Figure 13d compares the collision risk indices obtained by the three methods. The results indicate that the “new QSD-based Method” reflects a gradual increase in risk during the escalation phase, avoiding the abrupt rise observed in the “QSD-based Method”. During the risk reduction phase, there are two noticeable decreases: The first corresponds to the target ship passing the bow, and the second corresponds to the target ship passing the CPA, both accurately reflecting the risk mitigation process. In summary, the “new QSD-based Method” demonstrates stronger applicability in ASVs identification.
As shown in Table 7, the “Traditional Method” indicates that the vessel remains at a high-risk level for most of the encounter period. In contrast, the “QSD-based Method” maintains a medium risk for a longer duration, suggesting more stable collision-avoidance behavior. The “New QSD-based Method” keeps the vessel predominantly within a safe zone, with the risk increasing only during critical moments. According to Figure 13d, the vessel enters a moderate-risk region after approximately 80 s, crosses the target ship’s bow around 170 s when the risk decreases, and passes the closest encounter point near 210 s, after which the risk gradually diminishes as the target vessel moves away.

Table 7.
Comparison of CRI time proportions within different value ranges under crossing encounter.
3.2.3. Overtaking Case
To further validation, a simulation for a overtaking case was conducted. The detailed parameter settings are provided in Table 8.

Table 8.
Initial parameter values of overtaking case.
From Table 8, the target ship is overtaking own ship by the right side, and the trajectory and other results are shown in the following figures.
Figure 14a illustrates the trajectories of two ASV in an overtaking case, where both vessels maintained their courses, and the total sailing time exceeded 580 s. Figure 14b shows that the distance between the own ship and the target ship decreased continuously until overtaking was completed, after which the distance increased again. The closest point occurred at 275 s, with a minimum encounter distance of 100.0 m domain.
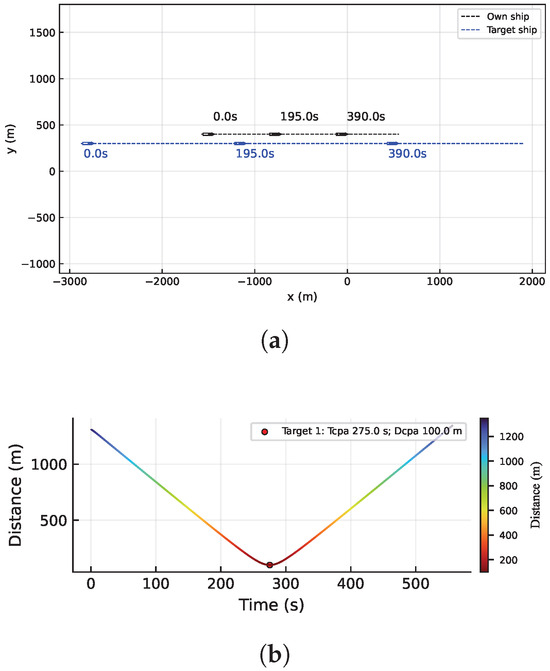
Figure 14.
Overtaking case. (a) Trajectory of USVs under overtaking case. (b) Curve of distance between USVs.
Figure 15a presents the distance risk index curve between two ASVs. The index starts from zero at the onset of the encounter and gradually increases after the target ship enters the stern detection domain of the own ship at 80 s, indicating an elevated collision risk as the distance decreases. Around 200 s, the target ship enters the danger domain, where the distance risk index reaches its maximum value of 1. Thereafter, the index gradually declines after approximately 400 s, when the target ship exits the danger domain. The risk index persists longer in the bow region than in the stern region, consistent with the inherent characteristics of the QSD.
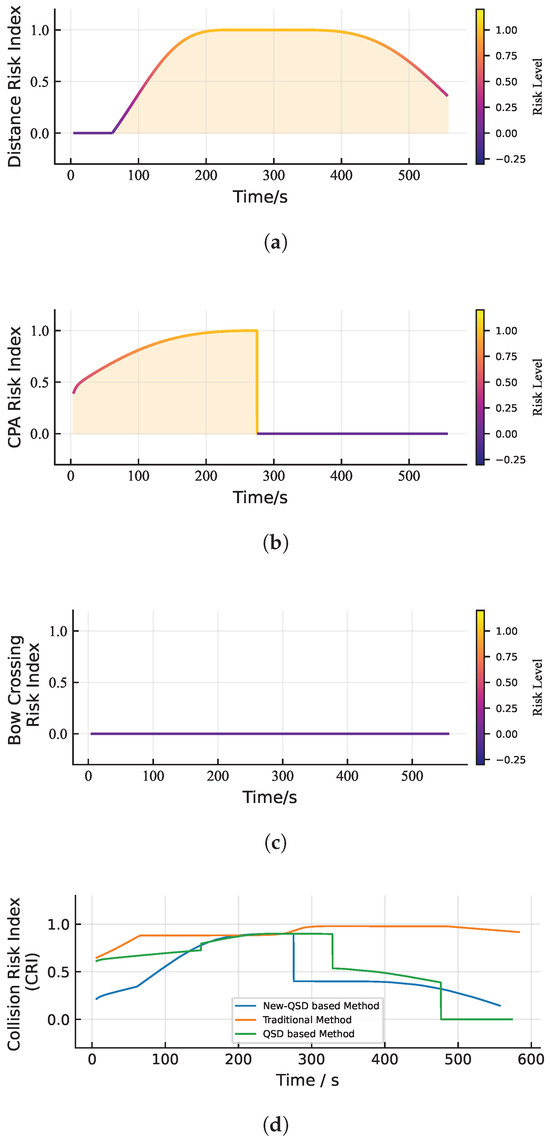
Figure 15.
Ship’s collision risk index curves under overtaking case. (a) Curve of distance risk index. (b) Curve of risk index. (c) Curve of risk index. (d) Curve of collision risk index.
Figure 15b shows the risk index curve. As the distance and the time to decreased, the index increased gradually, reflecting a rising collision risk. After 200 s, when the target ship entered the danger domain, the index reached its maximum value. Following the closest encounter (around 275 s), the risk subsided, and the index gradually decreased to zero.
Figure 15c illustrates the risk index. Since no passing occurred in the overtaking case, the index remained zero throughout.
Figure 15d compares the risk indices obtained by three different methods. The results indicate that the method proposed by this paper can capture the gradual increase in risk during the approach phase, and the clear reduction in risk after the target ship finishes the overtaking encounter; thereby, this method reflects the risk release process. This demonstrates that the method aligns well with engineering practice and shows strong application potential.
As shown in Table 9, the “Traditional Method” indicates that the vessel remains at a high-risk level throughout most of the overtaking period, showing little distinction between whether another ship is passing or not. In contrast, the “QSD-based Method” maintains a medium-risk state for approximately of the total navigation time.

Table 9.
Comparison of CRI time proportions within different value ranges under overtaking encounter.
For the “New QSD-based Method,” the CRI exhibits a wider variation during the overtaking process. About of the total period is classified as low collision risk. As illustrated in Figure 15d, the CRI increases temporarily near the overtaking region and then sharply decreases after passing, around s, followed by a continuous decline as the target vessel moves away.
3.2.4. Multi-Ship Crossing Case
To further verify the applicability of the proposed method of this paper, a multi-ship encounter simulation was conducted. The basic settings are summarized in Table 10.

Table 10.
Initial parameter values of ships in the multi-ship crossing case.
Based on the above settings, the target ships crossed the own ship on both the port and starboard sides, and their trajectories are shown as follows.
Figure 16a illustrates the trajectories of multiple ships in an encounter scenario, where all vessels maintained their original courses, and the total sailing time exceeded 350 s. Figure 16b shows the distance variations between the own ship and the two target ships. The distances of both target ships relative to the own ship are identical, reaching a minimum value of 337.0 m at 175 s.
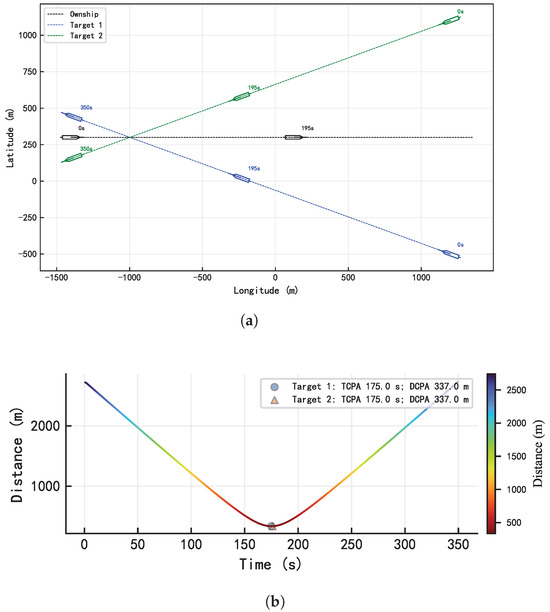
Figure 16.
Multi-ship case. (a) Trajectory of USVs under multi-ship case. (b) Curve of distance between target ships and own ship.
Figure 17 shows the collision risk variation curves for two target ships relative to the own ship in a crossing scenario. The risk level initially rose but did not peak, as no occurred. After approximately 175 s, once both target ships passed the CPA, the risk sharply decreased and gradually declined as the inter-ship distance increased. The primary difference in risk levels between the two target ships occurred before the CPA. Target 1, on the starboard side, exhibited an earlier and higher risk level than Target 2, on the port side. Despite identical values for distance, DCPA, TCPA, BCR, and BCT at that moment, the QSD asymmetry created a larger danger area on the starboard bow. Additionally, per the COLREGs, the own ship is the give-way vessel relative to Target 1 and the stand-on vessel relative to Target 2.
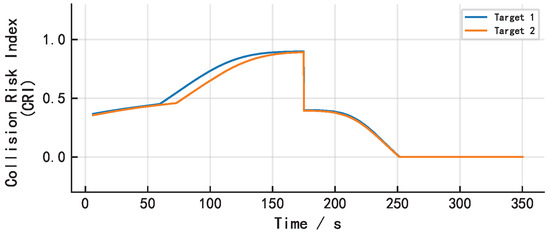
Figure 17.
Curves of different target ships’ collision risk index in multi-ship case.
4. Conclusions
This study introduces a QSD-based physics-driven collision risk evaluation framework for Autonomous Surface Vehicles (ASVs), integrating BCR and BCT to provide more physically grounded and interpretable risk assessments. Simulations in various encounter scenarios—head-on, crossing, and overtaking—demonstrated the model’s ability to effectively capture collision risk dynamics. By reducing risk indicators from five to three (Distance, CPA, and BC), the model minimizes redundancy and coupling complexity, improving its robustness and interpretability.
The model also incorporates a logarithmic coupling function and sigmoid mapping, generating a smooth, bounded, and differentiable risk function, which enhances its reliability and predictability. Compared to traditional methods, it offers a more stable collision-avoidance response, particularly in high-risk encounters.
However, the model does not account for external environmental factors, such as wind and current, which influence vessel trajectories and collision risk. This limitation restricts its real-world applicability, as environmental conditions play a critical role in maritime operations.
Future work should focus on incorporating environmental influences into the model, optimizing parameters, and testing under more complex conditions. Real-world validation, including multi-vessel interactions and dynamic environmental factors, will further enhance the model’s accuracy and applicability.
In conclusion, while the proposed model significantly improves collision risk assessment, further research integrating external dynamics and real-world validation is needed to ensure its effectiveness in actual maritime operations.
Author Contributions
Conceptualization, Z.W.; Methodology, Z.W.; Software, Z.W. and W.H.; Validation, Z.W. and W.H.; Formal analysis, Z.W.; Investigation, Z.W.; Resources, Z.W.; Writing—original draft, Z.W.; Writing—review & editing, Z.W.; Visualization, Z.W.; Supervision, N.I.; Project administration, N.I.; Funding acquisition, N.I. All authors have read and agreed to the published version of the manuscript.
Funding
This research was supported by Korea Institute of Marine Science & Technology Promotion (KIMST) funded by the Ministry of Oceans and Fisheries (RS-2023-00238653).
Data Availability Statement
All data supporting the findings of this study are available within the article. No additional data were used or generated.
Conflicts of Interest
The authors declare no conflicts of interest.
Abbreviations
The following abbreviations are used in this manuscript:
| DCPA | Distance to Closest Point of Approach |
| BCR | Bow Crossing Range |
| CRI | Collision Risk Index |
| ASV(s) | Autonomous Surface Vehicle(s) |
| Bow Crossing Indicator (BCR/BCT composite) | |
| Sigmoid sensitivity parameters | |
| Weight coefficients for factors | |
| FUJI | Fujii Ship Domain Model |
| The allowable maximum closet point passing/bow crossing time threshold | |
| Time to Closest Point of Approach | |
| BCT | Bow Crossing Time |
| QSD | Quaternion Ship Domain |
| Bow Crossing Indicator (DCPA/TCPA composite) | |
| COLREGs | International Regulations for Preventing Collisions at Sea |
| The base of the logarithm | |
| Distance Indicator | |
| AHP | Analytic Hierarchy Process |
References
- Zhang, X.; Wang, C.; Jiang, L.; An, L.; Yang, R. Collision-avoidance navigation systems for Maritime Autonomous Surface Ships: A state of the art survey. Ocean Eng. 2021, 235, 109380. [Google Scholar] [CrossRef]
- Yang, J.; Xie, W.; Xie, H.; Sun, Y.; Wang, X. Navigational Risk Evaluation of One-Way Channels: Modeling and Application to the Suez Canal. J. Mar. Sci. Eng. 2025, 13, 1864. [Google Scholar] [CrossRef]
- Wang, Z.; Im, N. Enhanced artificial potential field for MASS’s path planning navigation in restricted waterways. Appl. Ocean Res. 2024, 149, 104052. [Google Scholar] [CrossRef]
- Kot, R.; Szymak, P.; Piskur, P.; Naus, K. A-Star (A*) with Map Processing for the Global Path Planning of Autonomous Underwater and Surface Vehicles Operating in Large Areas. Appl. Sci. 2024, 14, 8015. [Google Scholar] [CrossRef]
- Hilgert, H.; Baldauf, M. A common risk model for the assessment of encounter situations on board ships. Dtsch. Hydrogr. Z. 1997, 49, 531–542. [Google Scholar] [CrossRef]
- Hu, Y.; Park, G.K. Collision risk assessment based on the vulnerability of marine accidents using fuzzy logic. Int. J. Nav. Archit. Ocean Eng. 2020, 12, 541–551. [Google Scholar] [CrossRef]
- Li, H. Discussion on the Construction of the Regulatory and Standard System for Navigation Aids in Transportation. China Marit. Saf. 2019, 6, 26–29. [Google Scholar] [CrossRef]
- Hu, Y. Research on Ship Collision Avoidance Decision-Making Based on Quaternion Ship Domain and Fuzzy Logic. Master’s Thesis, Tianjin University, Tianjin, China, 2021. [Google Scholar]
- Xu, W.; Hu, J.; Yin, J.; Li, K. Calculation of Ship Composite Collision Risk Based on Fuzzy Theory. Ship Sci. Technol. 2017, 39, 78–84. [Google Scholar] [CrossRef]
- Zhou, J.; Wu, C. Construction of Ship Collision Risk Model. J. Ningbo Univ. (Nat. Sci. Eng. Ed.) 2004, 1, 61–65. [Google Scholar]
- Pietrzykowski, Z.; Uriasz, J. The ship domain—A criterion of navigational safety assessment in an open sea area. J. Navig. 2009, 62, 93–108. [Google Scholar] [CrossRef]
- Liu, Z.; Zhang, B.; Zhang, M.; Wang, H.; Fu, X. A quantitative method for the analysis of ship collision risk using AIS data. Ocean Eng. 2023, 272, 113906. [Google Scholar] [CrossRef]
- Goerlandt, F.; Kujala, P. Traffic simulation based ship collision probability modeling. Reliab. Eng. Syst. Saf. 2011, 96, 91–107. [Google Scholar] [CrossRef]
- Szlapczynski, R.; Krata, P.; Szlapczynska, J. A Ship Domain-Based Method of Determining Action Distances for Evasive Manoeuvres in Stand-On Situations. J. Adv. Transp. 2018, 2018, 3984962. [Google Scholar] [CrossRef]
- Yang, T.; Wang, X.; Liu, Z. A novel ship domain-oriented parameter of ship collision risk considering the ship maneuverability and encounter situation. J. Mar. Sci. Appl. 2023, 22, 181–198. [Google Scholar] [CrossRef]
- Liu, Z.; Wu, Z.; Zheng, Z.; Yu, X.; Bu, X.; Zhang, W. A Domain-Based Model for Identifying Regional Collision Risk and Depicting Its Geographical Distribution. J. Mar. Sci. Eng. 2023, 11, 2092. [Google Scholar] [CrossRef]
- Luong, T.N.; Hwang, S.; Im, N. Harbour traffic hazard map for real-time assessing waterway risk using marine traffic hazard index. Ocean Eng. 2021, 239, 109884. [Google Scholar] [CrossRef]
- Hörteborn, A.; Ringsberg, J.W.; Svanberg, M.; Holm, H. A Revisit of the Definition of the Ship Domain based on AIS Analysis. J. Navig. 2019, 72, 777–794. [Google Scholar] [CrossRef]
- Chen, D.; Dai, C.; Wan, X.; Mou, J. A research on AIS-based embedded system for ship collision avoidance. In Proceedings of the 2015 International Conference on Transportation Information and Safety (ICTIS), Wuhan, China, 25–28 June 2015; pp. 512–517. [Google Scholar]
- Park, J.; Jeong, J.S. An estimation of ship collision risk based on relevance vector machine. J. Mar. Sci. Eng. 2021, 9, 538. [Google Scholar] [CrossRef]
- Wang, X.; Gang, L.; Zheng, L.; Liu, T.; Qiao, S. Multi-ship collision risk assessment based on DBSCAN algorithm. In Proceedings of the Eighth International Conference on Traffic Engineering and Transportation System (ICTETS 2024), Dalian, China, 20–22 September 2024; Volume 13421, pp. 505–510. [Google Scholar]
- Kitowski, Z.; Piskur, P.; Orłowski, M. Dual quaternions for the kinematic description of a fish–like propulsion system. Int. J. Appl. Math. Comput. Sci. 2023, 33, 171–181. [Google Scholar] [CrossRef]
- Zhang, L.; Meng, Q. Probabilistic ship domain with applications to ship collision risk assessment. Ocean Eng. 2019, 186, 106130. [Google Scholar] [CrossRef]
- Wang, Z.; Sun, Q.; Liu, Y.; Lin, N. Optimized Artificial Potential Field Algorithm for Autonomous Ship Emergency Collision Avoidance Scenarios Based on TCPA and DCPA. J. Shandong Jiaotong Univ. 2025, 33, 100–107. [Google Scholar]
- Wang, N. An intelligent spatial collision risk based on the quaternion ship domain. J. Navig. 2010, 63, 733–749. [Google Scholar] [CrossRef]
- Zhang, Z. Research on Ship Collision Risk Model Based on Fuzzy Comprehensive Evaluation. Master’s Thesis, Dalian Maritime University, Dalian, China, 2012. [Google Scholar]
- Zhao, L.; Fu, X. A novel index for real-time ship collision risk assessment based on velocity obstacle considering dimension data from AIS. Ocean Eng. 2021, 240, 109913. [Google Scholar] [CrossRef]
- Stolzmann, Ł. Bow Crossing Range correlation of small vessels–AIS data analysis with prospective application to autonomous ships. Sci. J. Gdyn. Marit. Univ. 2022, 121, 41–52. [Google Scholar] [CrossRef]
- Luo, J.; Wang, D.; Gao, Y. An improved AHP based fuzzy evaluation model for ship collision risk. J. Intell. Fuzzy Syst. 2021, 41, 4905–4913. [Google Scholar] [CrossRef]
- Li, W.; Zhong, L.; Xu, Y.; Shi, G. Collision risk index calculation based on an improved ship domain model. J. Mar. Sci. Eng. 2022, 10, 2016. [Google Scholar] [CrossRef]
- Zhou, Z.; Liu, Z.; Hu, Y.; Liu, J.; Yu, H.; Geng, X. Ship collision risk assessment model based on quaternion ship domain. J. Wuhan Univ. Technol. (Transp. Sci. Eng. Ed.) 2023, 47, 582–588. [Google Scholar]
- Zhang, H.; Cao, Y.; Shan, Q.; Sun, Y. Collision Avoidance for Maritime Autonomous Surface Ships Based on Model Predictive Control Using Intention Data and Quaternion Ship Domain. J. Mar. Sci. Eng. 2025, 13, 124. [Google Scholar] [CrossRef]
- Cai, X.; Wang, Z.; Zhu, Y.; Zhang, T.; Shi, G.; Shi, Y. A Review of Research on Autonomous Collision Avoidance Performance Testing and an Evaluation of Intelligent Vessels. J. Mar. Sci. Eng. 2025, 13, 1570. [Google Scholar] [CrossRef]
- Wang, N. A Novel Analytical Framework for Dynamic Quaternion Ship Domains. J. Navig. 2013, 66, 265–281. [Google Scholar] [CrossRef]
- Yasukawa, H.; Yoshimura, Y. Introduction of MMG standard method for ship maneuvering predictions. J. Mar. Sci. Technol. 2015, 20, 37–52. [Google Scholar] [CrossRef]
- Wang, Z.; Kim, J.; Im, N. Non-parameterized ship maneuvering model of Deep Neural Networks based on real voyage data-driven. Ocean Eng. 2023, 284, 115162. [Google Scholar] [CrossRef]
Disclaimer/Publisher’s Note: The statements, opinions and data contained in all publications are solely those of the individual author(s) and contributor(s) and not of MDPI and/or the editor(s). MDPI and/or the editor(s) disclaim responsibility for any injury to people or property resulting from any ideas, methods, instructions or products referred to in the content. |
© 2025 by the authors. Licensee MDPI, Basel, Switzerland. This article is an open access article distributed under the terms and conditions of the Creative Commons Attribution (CC BY) license (https://creativecommons.org/licenses/by/4.0/).