Article

Migration Patterns and Sedimentary Evolution of Deepwater Channels in the Niger Delta Basin

1
School of Geosciences and Technology, Southwest Petroleum University, Chengdu 610500, China
2
Key Laboratory of Natural Gas Geology of Sichuan Province, Southwest Petroleum University, Chengdu 610500, China
3
CNOOC International Limited, Beijing 100028, China
*
Author to whom correspondence should be addressed.
J. Mar. Sci. Eng. 2025, 13(11), 2135; https://doi.org/10.3390/jmse13112135
Submission received: 10 October 2025 / Revised: 5 November 2025 / Accepted: 6 November 2025 / Published: 12 November 2025
(This article belongs to the Special Issue Advances in Sedimentology and Coastal and Marine Geology, 3rd Edition)

Abstract

The internal architecture of deep-water channels is highly complex. Previous research has primarily emphasized the sedimentary processes governing channel migration, yet the linkage between sediment-source mechanisms and migration patterns—particularly their vertical evolution—remains insufficiently understood. Drawing on 3D seismic data, well logs, and core analyses, this study delineates the channel architecture within the deep-water succession of the Niger Delta Basin. Furthermore, by correlating high-frequency sea-level fluctuations with the formation timing of structural units, we explore how sea-level changes influence the spatial distribution and evolutionary dynamics of submarine fan systems. This study investigated the bottom-up evolution of two channel-lobe systems—the East Channel System (ECS) and West Channel System (WCS) within the stratigraphic succession, identifying two principal channel migration styles: expansive migration and downstream migration. In the ECS, migration was primarily characterized by a combination of downstream and expansive patterns. In contrast, the WCS displayed intermittent downstream migration, accompanied by some irregular migration. Correlation of sea-level variation curves with corresponding core photographs indicates that the ECS developed during a fourth-order sea-level. Its lower lobe and upper channel intervals each correspond to two complete five-stage sea-level cycles. In this system, debris flows and high-density turbidity currents produced stronger lateral erosion and channel migration, giving rise to the expansive migration style. Conversely, the WCS formed during a four-stage sea-level rise, with its lobe and channel sections likewise corresponding to two complete five-stage sea-level cycles. Here, sedimentation dominated by high- and low-density turbidity currents promoted enhanced erosion and migration along the flow direction, resulting in the predominance of downstream migration patterns. The ECS and WCS together constitute a complete three-tiered stratigraphic sequence representing two lobe–channel systems. This configuration deviates to some extent from the conventional understanding of the spatial distribution of debris flows, lobate channels, main channels, and deep-sea mud deposits. Consequently, during intervals of frequent sea-level fluctuation, deep-water sedimentary components within the continental slope region can partially record the signals of fourth- and even fifth-order sea-level variations, facilitated by a stable tectonic framework and favorable sediment preservation conditions. These findings offer valuable insights for reconstructing regional sedimentary processes and interpreting sea-level evolution.

1. Introduction

Deep-water channels function as the primary conduits for sediment transport to deep-sea plains and basins, serving as critical sites for the deposition of coarse-grained clastic sediments and the accumulation of hydrocarbons. They constitute one of the key reservoir types within deep-water depositional systems [1,2,3,4,5]. In recent years, significant advances in deep-water oil and gas exploration and development—particularly in the Niger Delta, Lower Congo, Campos, and Guyana basins [6] have heightened interest in deep-water turbidite systems. Consequently, the sedimentary mechanisms of turbidity currents and the internal structural variations in turbidites [7,8,9,10,11,12] have become central topics of investigation among researchers and petroleum geoscientists. Understanding these processes is essential for reconstructing turbidite depositional dynamics and promoting the development of deep-water hydrocarbon resources.
The sedimentary morphology and internal architecture of deep-water channels are controlled by multiple factors, including sediment composition, seafloor topography, tectonic framework, and sea-level fluctuations [13,14,15,16,17,18,19]. The morphology and spatial distribution of channel systems have been extensively documented in previous studies. Numerous case studies have demonstrated the influence of topography, geomorphology, mass-transport deposits (MTDs), and structural faults on the external configuration of channels [14,20,21,22,23,24]. However, investigations of internal channel architecture—particularly at finer stratigraphic scales-remain comparatively limited. The introduction of Laps confirmed the presence of lateral migration within deep-water channels [1,25]. Seismic data from the Niger Delta and the shallow Lower Congo Basin [1,26], together with turbidite distributions observed in channel outcrops [25,26], reveal both flow-directional path shifts and outward migrations toward channel bends, reflecting irregular migration behavior [27]. These patterns are categorized as orderly and disorderly migration, respectively [27,28]. Orderly migration typically coincides with basal erosion and pronounced channel curvature, where erosion and deposition occur concurrently, and levee formation is common [25,26,29]. Coarser-grained sediments tend to restrict lateral erosion of turbidity currents, with higher sand-to-mud ratios promoting a more confined distribution of channel sand bodies [1,25,26]. Conversely, as sand ratios decrease, channels display more dispersed sand-body distributions, enhanced planform curvature, and greater lateral migration [1,25,26,27]. Both geomorphology and sedimentary processes exert a combined influence on the morphology and distribution of channel migration within meandering segments [5,30,31,32]. Geomorphic controls generally increase channel width and width-to-depth ratios, which correspond with intensified lateral migration; however, the degree of migration driven predominantly by geomorphic factors tends to be markedly lower [33]. Flume experiments and numerical simulations further verify the presence of secondary circulation at channel bends, where sandy sediment is preferentially transported toward the outer bank, promoting lateral channel migration [34,35,36,37]. An increasing body of research now focuses on the mechanisms and morphological expression of such migration patterns. Within channel systems, vertical stratification of turbidity currents produces temporal variations in transported sediment, resulting in complex, time-dependent migration behaviors within individual channels. Consequently, deciphering the structural characteristics of submarine channels and deltaic systems, their vertical architectural variations, and the sedimentary signatures they record remains a significant challenge.
In this study, we utilized high-resolution 3D seismic reflection data to conduct a detailed sedimentary analysis of a complete channel-deltaic system in Block E of the Niger Delta Basin. The study area, located approximately 200 km offshore from Port Harcourt, encompasses a Neogene stratigraphic succession that includes a 16 km-long submarine channel system. The primary objective is to characterize the structural architecture and evolutionary development of the submarine channel system formed on a mudstone-dominated slope. Specifically, this study aims to: (A) analyze the internal structural features of the submarine channels and interpret their genetic mechanisms; and (B) establish an evolutionary model of the channel–lobe system across different developmental stages.

2. Geologic Setting

The Niger Delta Basin lies along the northwestern margin of the African continental shelf (Figure 1a). It is a passive-margin basin formed under an extensional tectonic regime. The basin encompasses onshore, coastal, and offshore shelf areas of Nigeria, covering an onshore extent of approximately 140,000 km2, with a maximum sedimentary thickness of up to 12 km [38,39,40]. Based on tectonic characteristics, the basin can be subdivided into three structural zones from north to south: the extensional belt, the extensional–compressional transition belt, and the compressional belt. The study area is located within the transition belt and represents a typical structural-lithologic hydrocarbon reservoir [41] (Figure 1b). During the evolution of the alluvial delta, early-formed pre-delta mudstones were overlain by thick deposits derived from the subsequently developed deltaic foreshore and delta plain. The overlying sediment load exceeded the bearing strength of the underlying plastic mudstones, generating overpressure and inducing fluid mobility within them [38,40,41,42]. As a result, the plastic mudstones migrated seaward [43], creating a mud-bottom gap ahead of their movement. This forward flow produced an accommodation space of substantial capacity [44,45], thereby impeding further deltaic progradation.
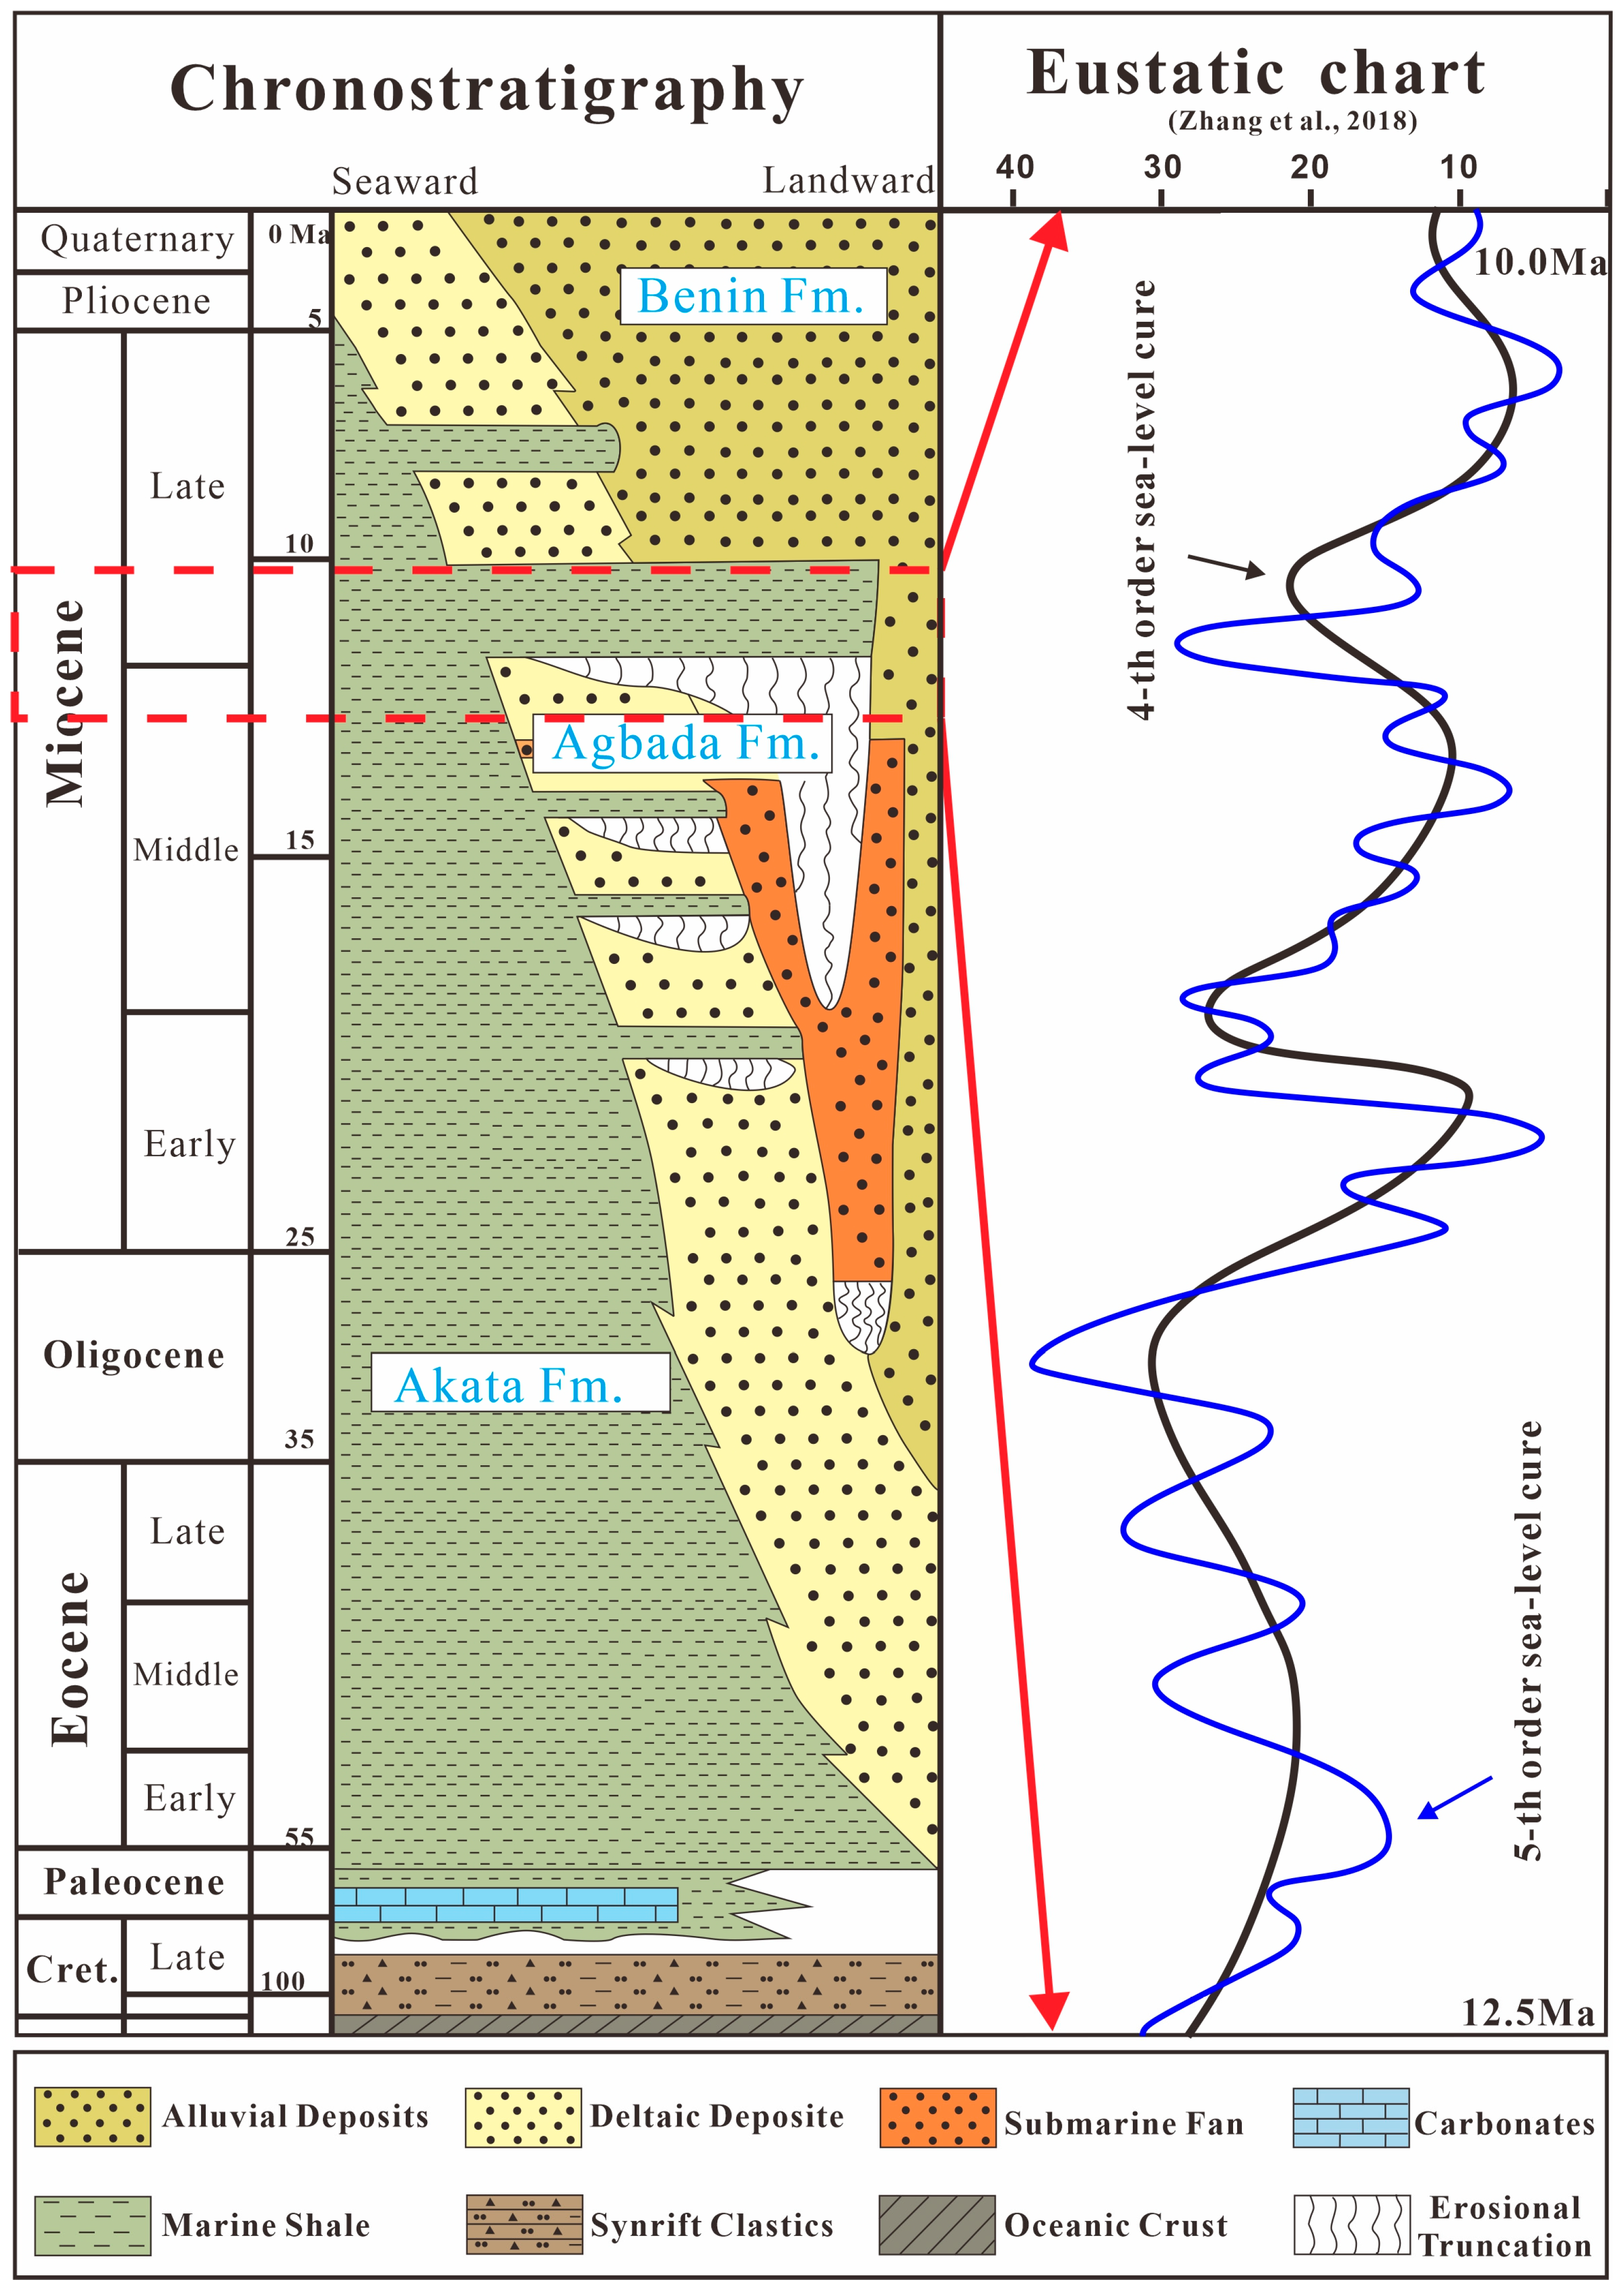
The Niger Delta Basin originated during the Eocene epoch. Following the cessation of continental rifting, it transitioned into a passive continental margin. Subsequent marine regression during the late stages of basin evolution created favorable conditions for widespread deltaic deposition [46,47]. Three progradational lithostratigraphic units-the Akata, Agbada, and Benin formations—are recognized within the basin [39,41] (Figure 2). The Akata Formation comprises thick deltaic mudstones, with thicknesses ranging from about 2000 m at the delta front to approximately 7000 m beneath the continental shelf [38,41]. Overlying the Akata, the Agbada Formation consists of interbedded delta-front sandstones and mudstones, representing the primary reservoir facies of the basin [48]. It is, in turn, overlain by the Benin Formation, composed predominantly of sandstones deposited in delta-plain and alluvial environments [49]. Between the early Eocene and late Pliocene, several global sea-level lowstands occurred (Figure 2), initiating a period of pronounced marine regression during which the Niger Delta prograded seaward. During the Neogene, voluminous deep-water clastic deposits accumulated across the distal slope and basin-floor areas [50,51].

3. Data and Methods

The primary dataset for this study comprises 3D seismic data for Block E, provided by the CNOOC Research Institute, covering an area of 1200 km2. The dataset consists of a post-stack time-migrated volume with a trace spacing of 12.5 m and a vertical sampling interval of 3 ms. The data have undergone time-to-depth conversion, spanning a depth range of −2200 m to −3200 m. Displayed as zero-phase data with SEG positive polarity, increases in acoustic impedance appear as red peak reflections on the in-phase axis. The seismic volume has been subjected to frequency enhancement and noise-reduction processing, ensuring high quality and reliability. The dominant formation frequency is approximately 35 Hz, and, assuming a formation velocity of 3000 m/s, the vertical resolution is estimated at ~20 m. The target interval contains a well-developed submarine channel–fan system. The research workflow involves: (I) defining seismic sequence frameworks and mapping boundary stratigraphic surfaces, and (II) utilizing seismic attribute maps and cross-sectional seismic facies to characterize deep-water deposits and their evolution.
Root Mean Square (RMS) amplitude maps provide insights into depositional architecture by highlighting variations in reflection energy, facilitating systematic mapping of the spatial organization of channel–lobe systems. Seismic attribute volumes, including spectrally decomposed red–green–blue (RGB) composites, are derived from three-dimensional seismic data and employed to analyze the topography of deep-water deposits. Spectral decomposition converts seismic reflection data into the frequency domain, generating multiple frequency volumes [53]. In the RGB color maps, each color represents a selected frequency bin used to image the channel-beam system within the target interval. These maps are particularly effective for delineating subtle channel margins, internal structural boundaries, and fluid variations. Significant changes in fluid or gas saturation within Miocene sediments can enhance amplitude in sand-rich channels and levees, making these deposits more prominent than equivalent strata in older, deeper intervals [54]. Reflection geometry, amplitude, and continuity of subsea channels exhibit distinct imaging characteristics, which are employed in the planar migration analysis to clearly illustrate planar channel morphology. And the software used is Petrel 2020.

4. Seismic Facies and Depositional Architectures

By integrating seismic, well-log, and lithological data, and by comparing seismic reflection characteristics with prior studies of deep-water sedimentary systems, we can identify key sedimentary elements and interpret depositional processes within the study area. Seismic facies differentiation is performed using integrated cross-sections and RMS attribute maps, guided by previous analyses of seafloor sedimentary elements [1,15,30,39,55]. In the study area, we recognize four vertically distributed seismic facies, interpreted as: (1) Submarine Channels, (2) lobes, (3) mass-transport deposits (MTDs), and (4) background mud (Table 1).

4.1. Submarine Channel

This seismic facies is characterized by distinct features, including curved bands in plan view and V- or U-shaped geometries in cross-section [1,5,9,12]. Internally, it exhibits relatively chaotic medium-to-high amplitudes, forming a pronounced boundary with the surrounding low-amplitude mudstones, which delineates the channel margin.

4.2. Lobes

This seismic facies is characterized by distinct, parallel sequences of medium-to-high amplitude reflections, exhibiting plate-like, wedge-shaped, or lens-shaped geometries on seismic profiles [12,56,57]. With lateral thinning or amplitude attenuation is observed toward the outer margins. Internally, vertically stacked medium-to-strong amplitude reflections are interpreted as lobe deposits formed by turbidity-current dispersal. In plan view, the facies displays distinct fan-shaped geometry, with boundaries clearly delineated by amplitude–color variations.

4.3. Mass-Transport Deposits

On seismic profiles, this facies is characterized by irregularly discontinuous, chaotic reflections of relatively weak amplitude, often exhibiting a banded distribution pattern [12,58]. It is interpreted as mass-transport deposits, typically showing weak amplitudes in plan view, with scattered, chaotic high-amplitude pockets internally. The pronounced chaotic amplitudes may reflect erosional processes associated with sediment sliding and collapse, with mudstones and conglomerates randomly distributed and locally eroding the underlying strata.

4.4. Mud

This seismic facies is characterized by stable, low-amplitude, parallel reflections that are continuous with underlying strata [9,12,56,57,58]. It is typically interpreted as extensive fine-grained mud deposited under low-energy, semi-oceanic conditions during periods of reduced sediment supply. However, some studies suggest that widespread, low-density turbidity currents may also produce this facies [59,60].

5. Characteristics of Channel-Lobe Systems

5.1. Channel Systems

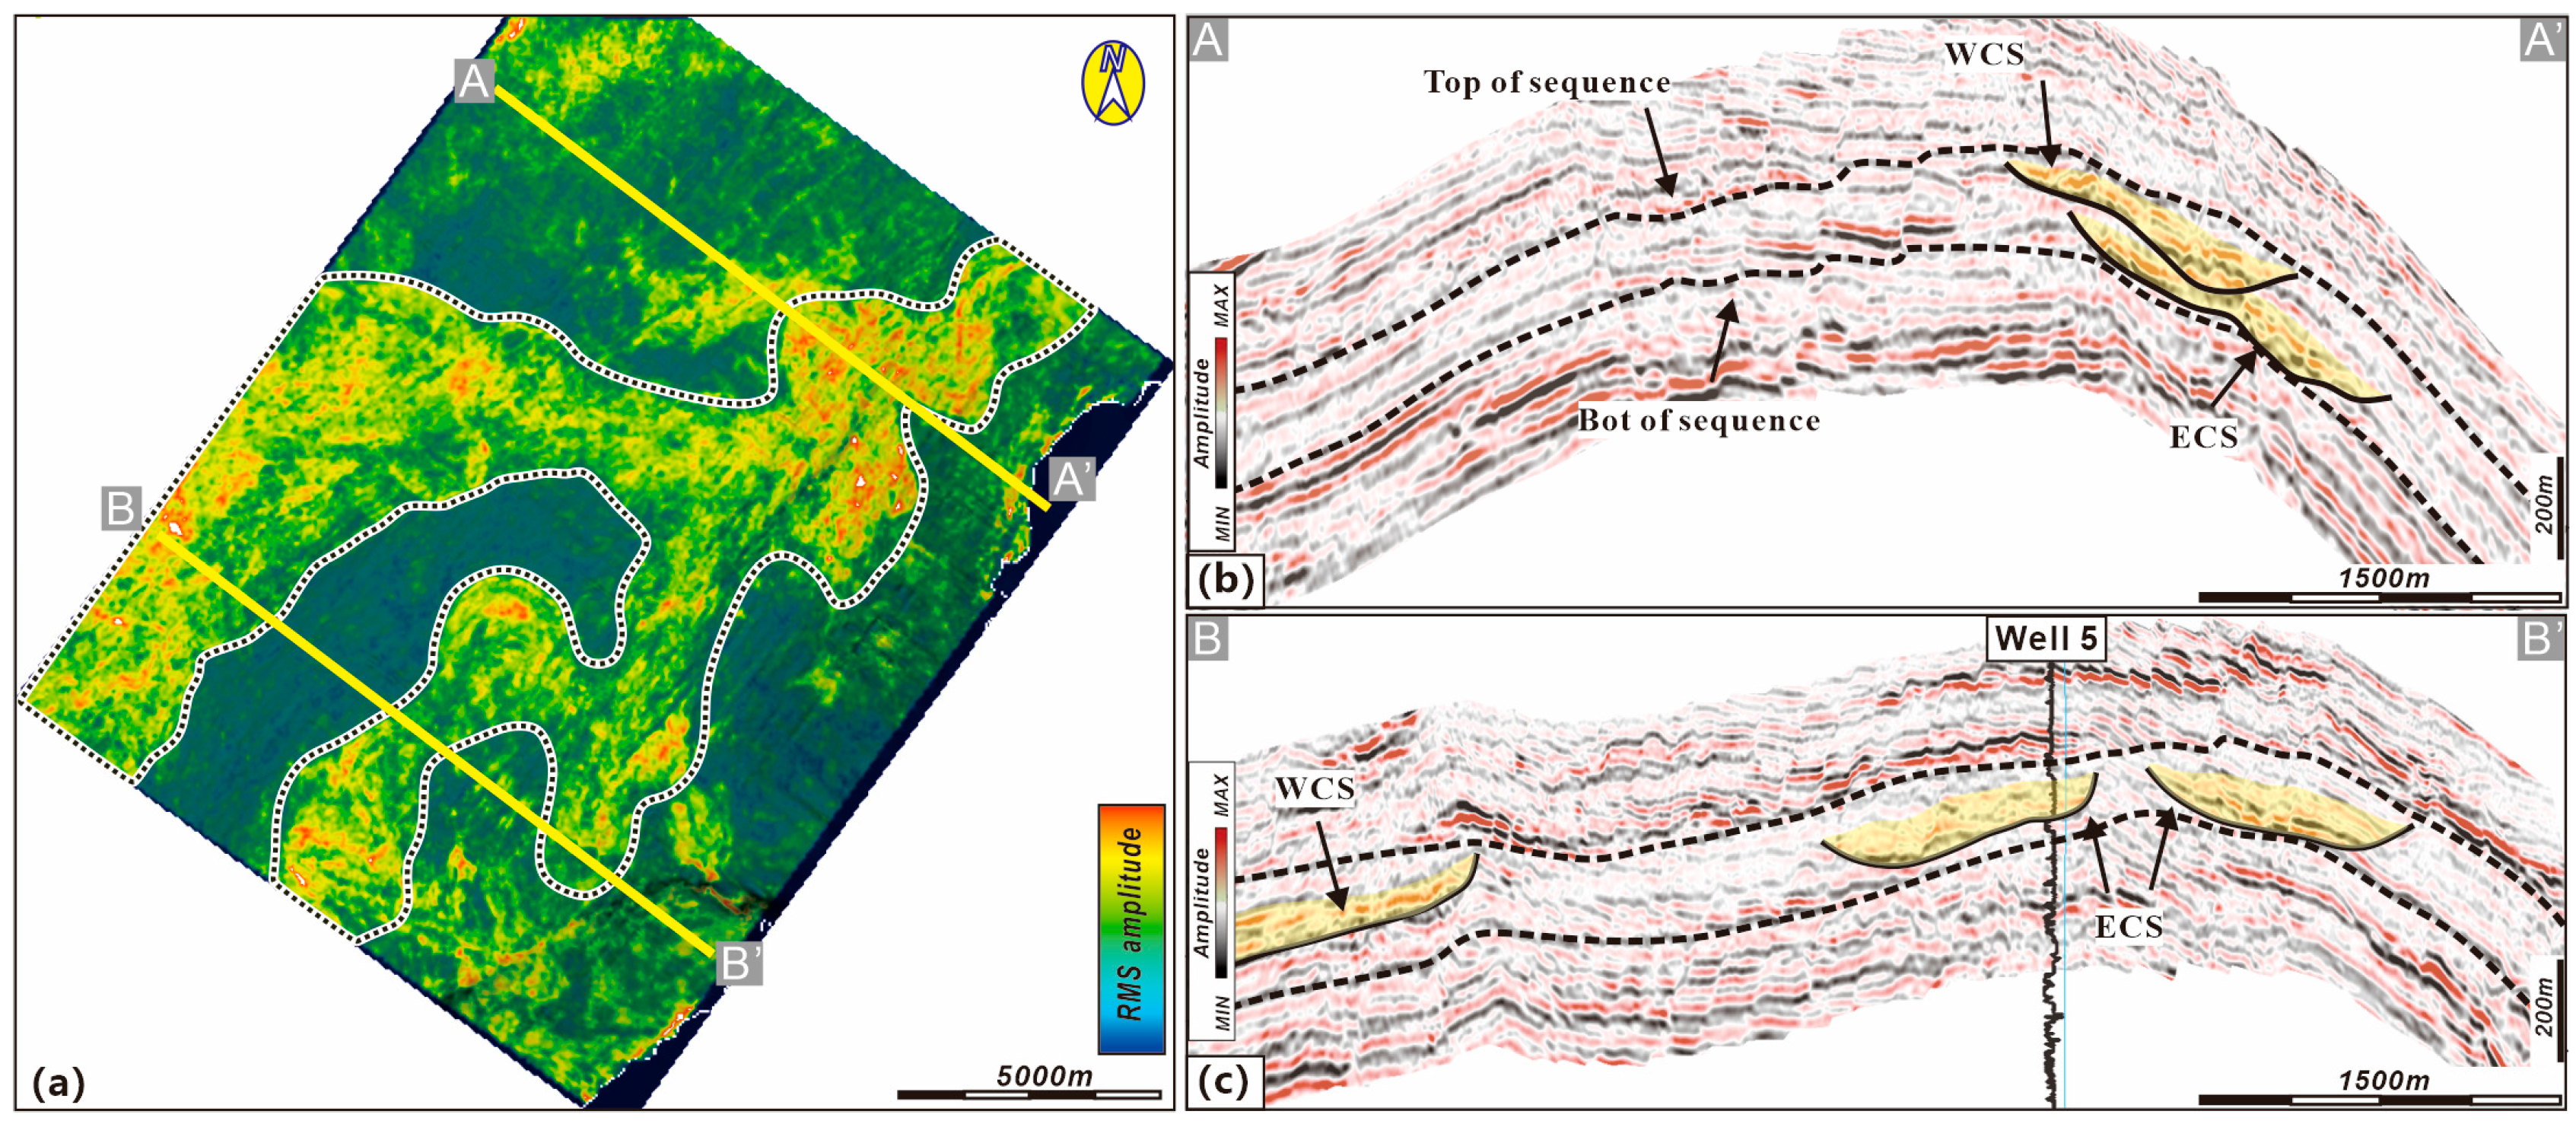
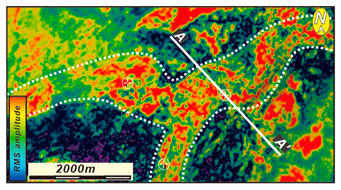
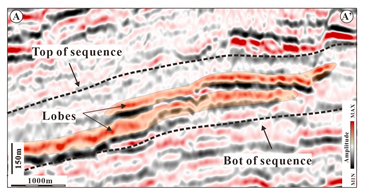
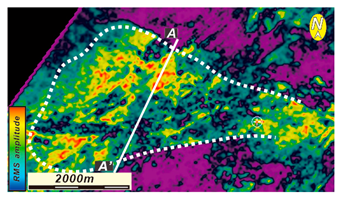
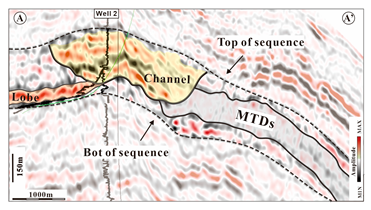
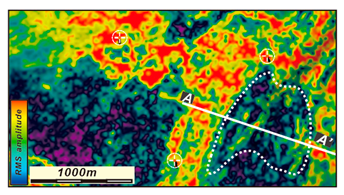
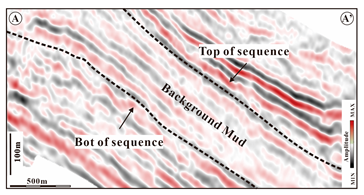
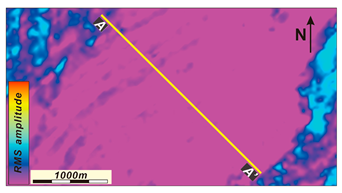
The channel system in the study area extends in a northeast–southwest orientation. Near sediment entry points, the channels form narrow bands, with sediments exhibiting significant lateral dispersion toward the source area (Figure 3a). Downstream, the system spreads into a fan-shaped distribution and terminates, indicating the cessation of deep-water gravity flows along this pathway. Based on flow direction, two distinct systems are recognized: the Eastern Channel System (ECS) and the Western Channel System (WCS), which appear as bifurcated strip patterns in plan view. Upstream sections display meandering channel morphology. Beyond the bifurcation point, the downstream WCS transitions into an irregular fan-shaped pattern, whereas the downstream ECS maintains a meandering, strip-like morphology (Figure 3a). Both systems exhibit narrow U-shaped profiles, separated from surrounding mudstones by enveloping surfaces. WCS deposits formed later, entirely overlying the ECS deposits. Where upstream channel paths coincide, the WCS vertically incised the ECS, producing a distinct V-shaped, low-amplitude erosional surface in the seismic record (Figure 3b). Branching begins approximately 6.5 km from the sediment entry point: the WCS shifts westward, while the ECS retains its original trajectory. The channels gradually diverge and become isolated downstream. After the divergence, no erosion occurs between the channels, and the sedimentary morphology exhibits a complete narrow U-shape (Figure 3c).
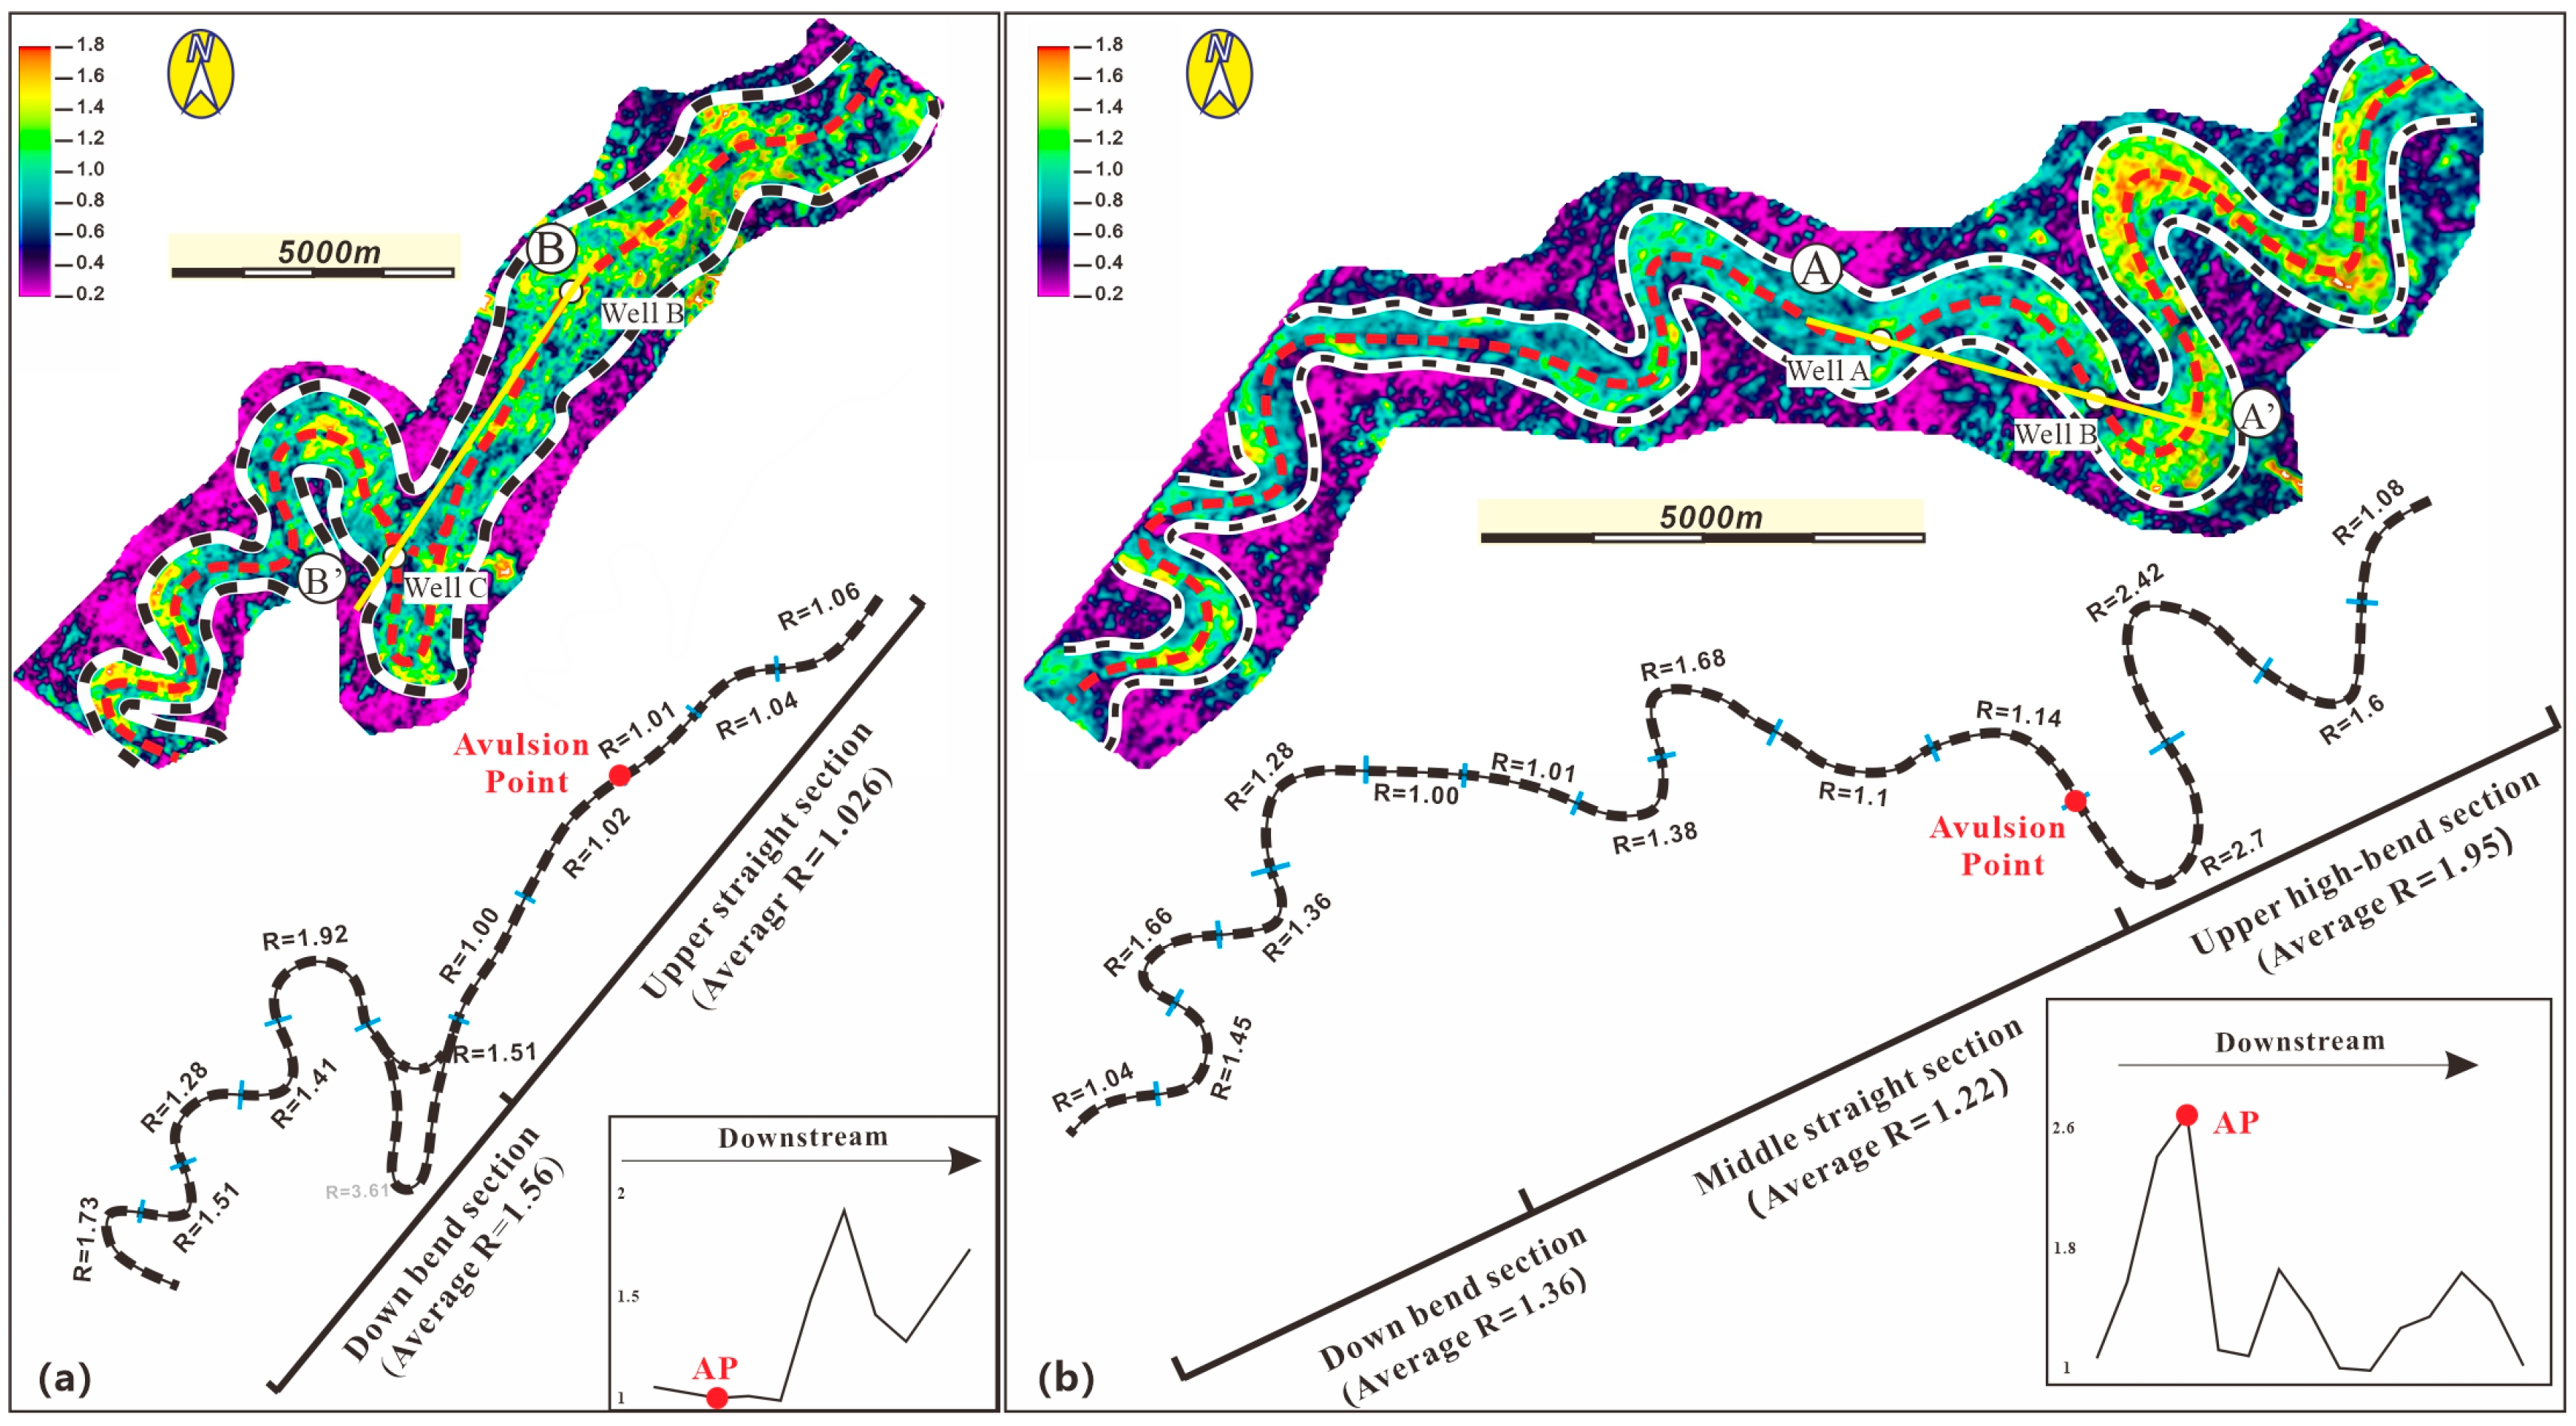
Vertical separation of the two channel systems and removal of basal influences reveal that both systems originate from the northeast, exhibiting curved, ribbon-like planar morphologies (Figure 4). The eastern branch extends in a northeast–southwest orientation. Its upper reaches consist of a 2.3 km straight segment, with curvature values ranging from 1.00 to 1.06, averaging 1.026. Downstream, the channel comprises a 6.65 km curved segment, with curvature ranging from 1.41 to 1.92 and an average of 1.56. Curvature gradually decreases along the flow before increasing again. Near the bifurcation point, curvature is lower and exhibits smaller fluctuations (Figure 4a). The western branch also extends northeast–southwest. Its upper reaches comprise a 5.55 km high-curvature segment, with curvature values ranging from 1.08 to 2.70, averaging 1.95. The middle reaches consist of a 7.45 km low-curvature segment, with curvature ranging from 1.00 to 1.68, averaging 1.22. The lower reaches form a 4.38 km segment with curvature values between 1.04 and 1.66, averaging 1.36. Curvature along the western branch exhibits an increasing–decreasing–increasing trend, with a sharp decline following the bifurcation point (Figure 4b).

5.2. Channel Complex

Within the channel system, sedimentary bodies are not vertically stacked in a continuous sequence; smaller units often display diverse spatial distribution patterns [61,62,63]. Although no universally accepted definition exists for such units [64], their presence is unquestionable. In this study, we adopt the term “channel complex” to refer to these sedimentary units.

5.2.1. Channel Complex in ECS

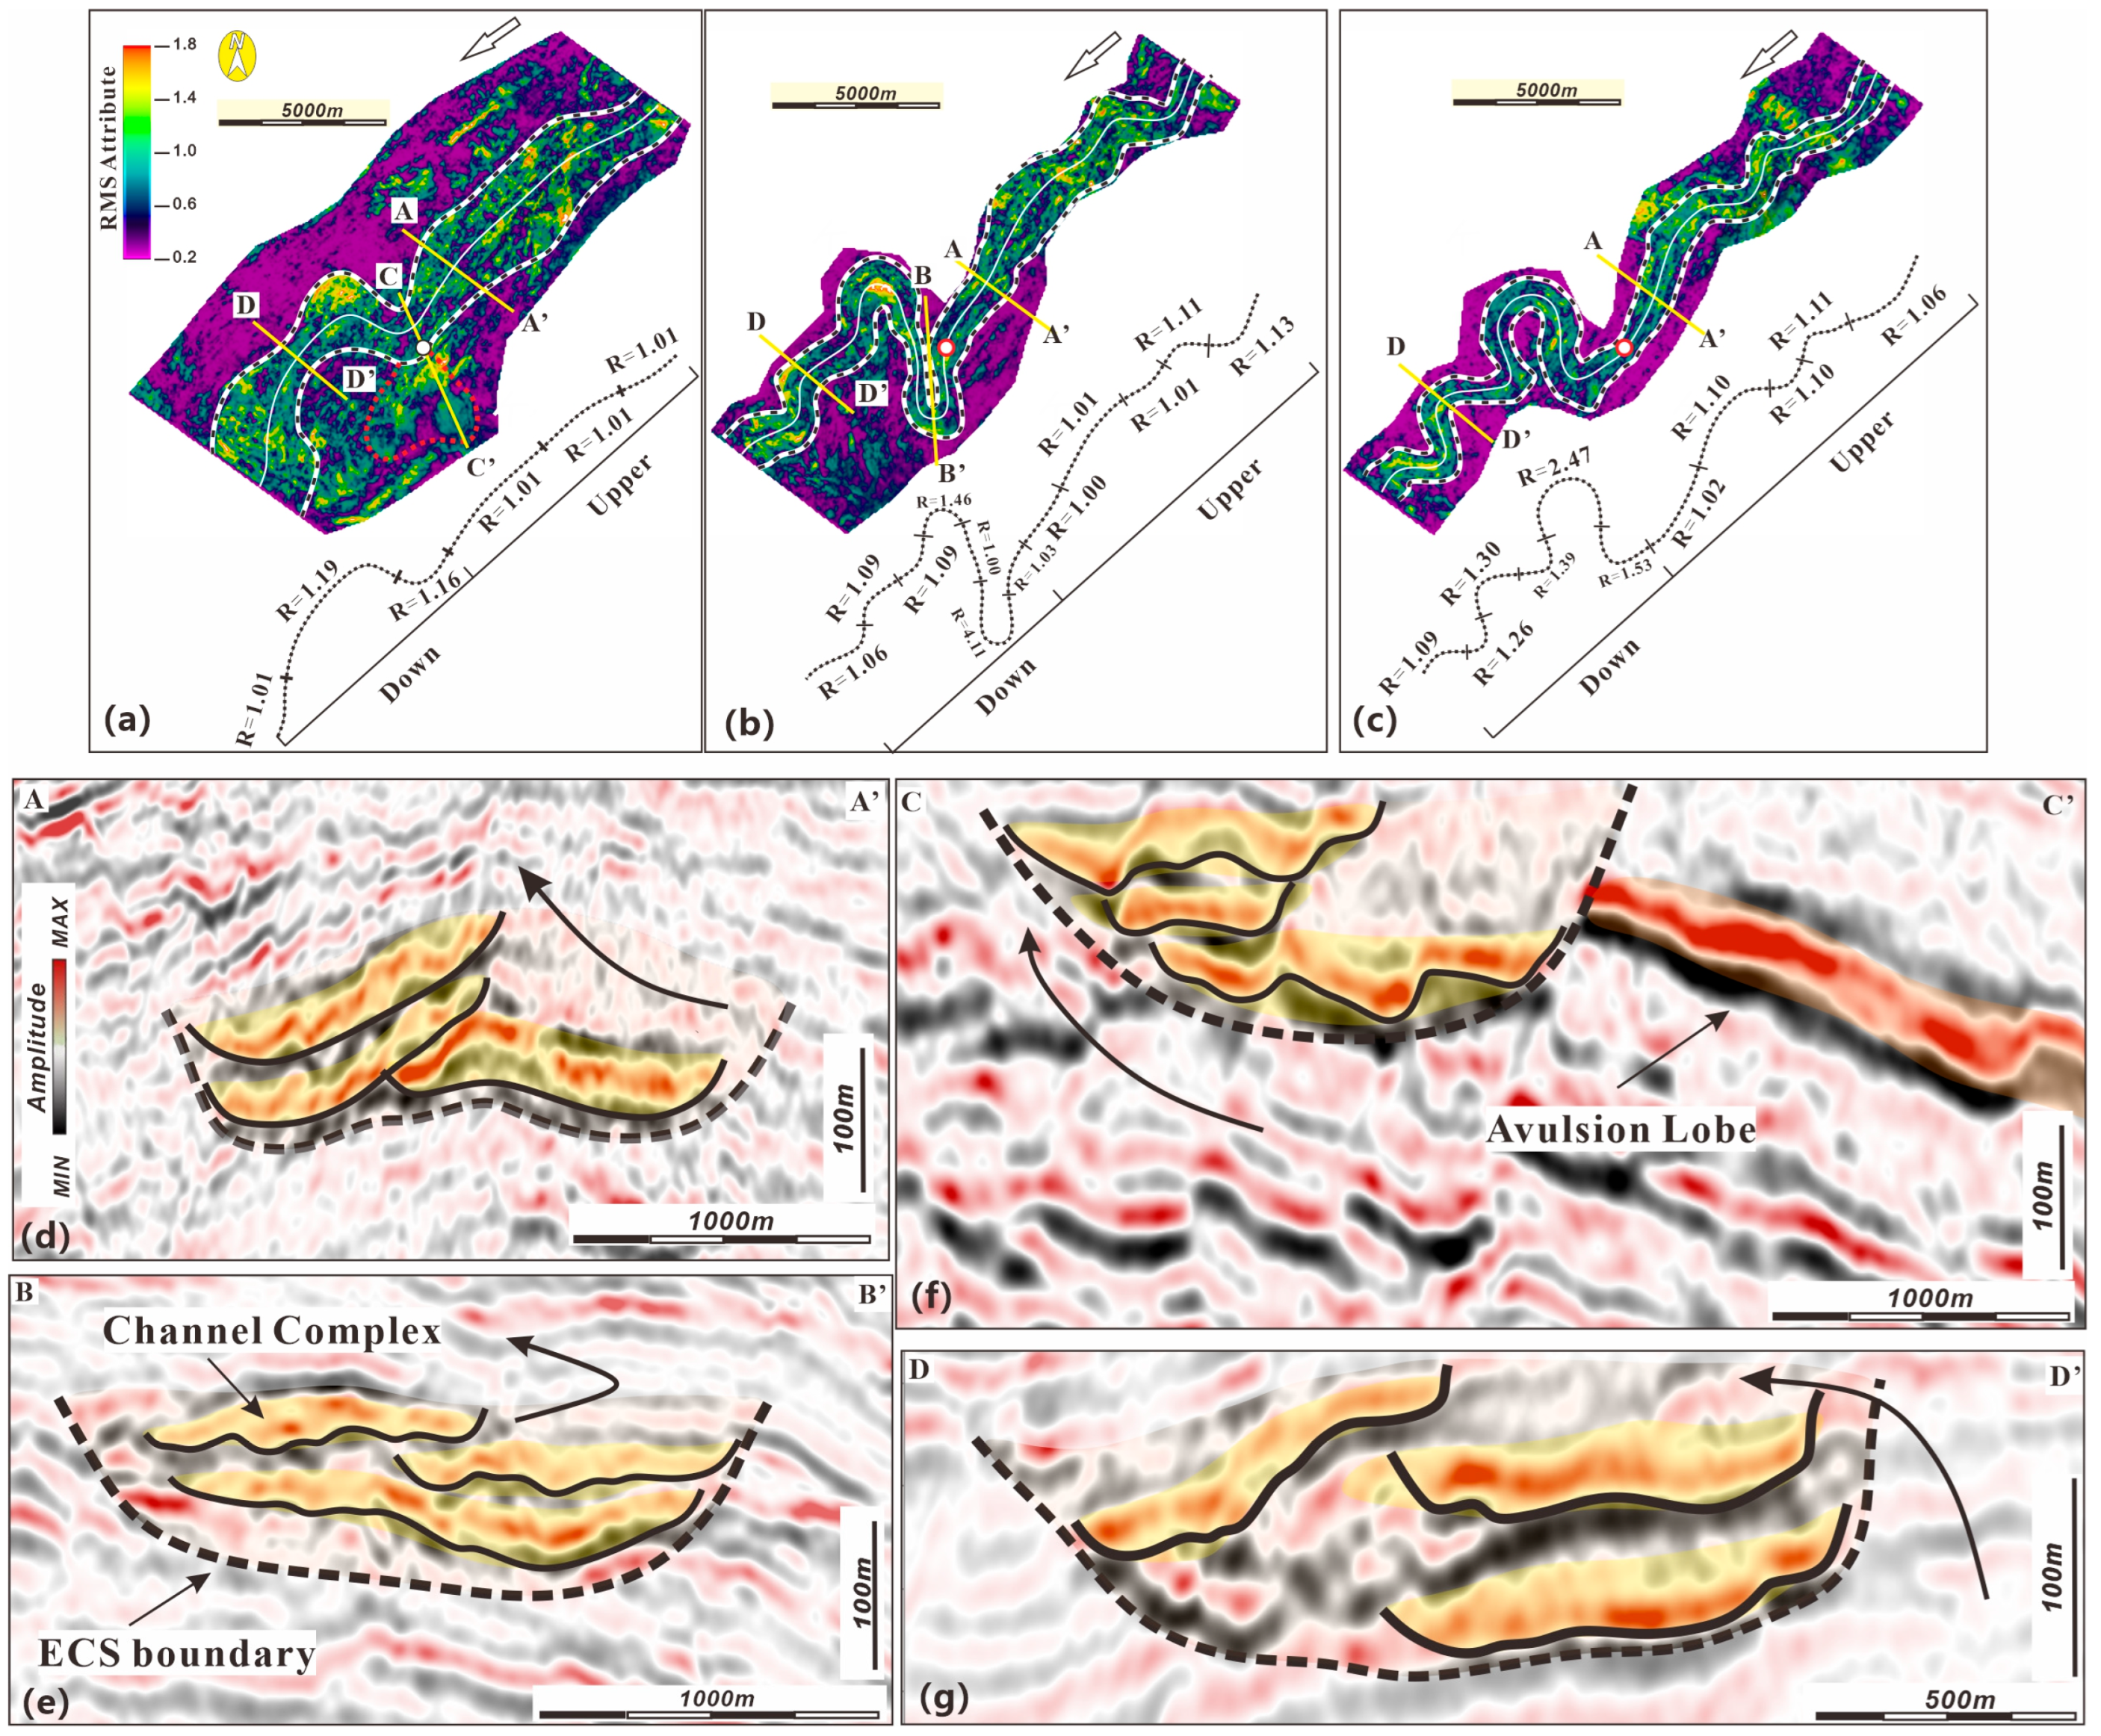
The ECS developed three vertically stacked channel complexes—ECC1, ECC2, and ECC3 -from base to top. Vertical amplitude variations enabled their separation along key interfaces. RMS seismic property planes of composite channels at different locations reveal morphological variations, though the complexes generally display straight or curved strip-like patterns. Seismically, they appear as U-shaped or wedge-shaped chaotic high-amplitude clusters (Figure 5). ECC2 occupies the middle section of the channel, with widths ranging from 1.1 km to 1.7 km. The upstream segment exhibits minimal curvature, averaging 1.052, while curvature increases abruptly downstream, averaging 1.55. The onset of the maximum curvature segment coincides with the planar location of the ECC1 breach (Figure 5a), and its planar morphology resembles that of the ECS (Figure 5b). ECC3 is located in the upper reaches of the channel, with widths of 1.0–1.3 km. It displays an overall curved, narrow strip-like configuration, with average curvature of 1.078 upstream and 1.51 downstream (Figure 5c).
Stacking patterns among channel complexes vary across different areas. In the upstream straight section, channels generally stack laterally in a single direction. ECC2 directly overlaps the ECC1 margin without obvious erosional features, whereas ECC3 stacks nearly perpendicular to ECC2, separated by weakly amplified bands. Lateral channel migration occurs from east to west (Figure 5d). In the transitional zones upstream and downstream, channels are vertically stacked. ECC1 occupies the channel bed, while ECC2 and ECC3 are distributed along the channel margins, separated by weakly amplified bands (Figure 5f). In the maximum bend segment, lateral stacking dominates: ECC1 fills the channel base, ECC2 migrates toward the bend and stacks east of ECC1, and ECC3 continues eastward, resulting in the apparent disappearance of the high-bend segment in plan view (Figure 5c,e). Downstream, composite channels are laterally stacked and separated by more pronounced low-amplitude bands. ECC1 and ECC2 stack perpendicularly, while ECC3 migrates westward, following the channel bend. This configuration corresponds with an increase in planar curvature within the bend segment (from 1.09 in ECC2 to 1.30 in ECC1). From upstream to downstream, distances between channel complexes increase, while the degree of vertical stacking progressively decreases. Concurrently, lateral migration intensifies, producing a trend toward increasing isolation and dispersion among the channel complexes.

5.2.2. Channel Complex in WCS

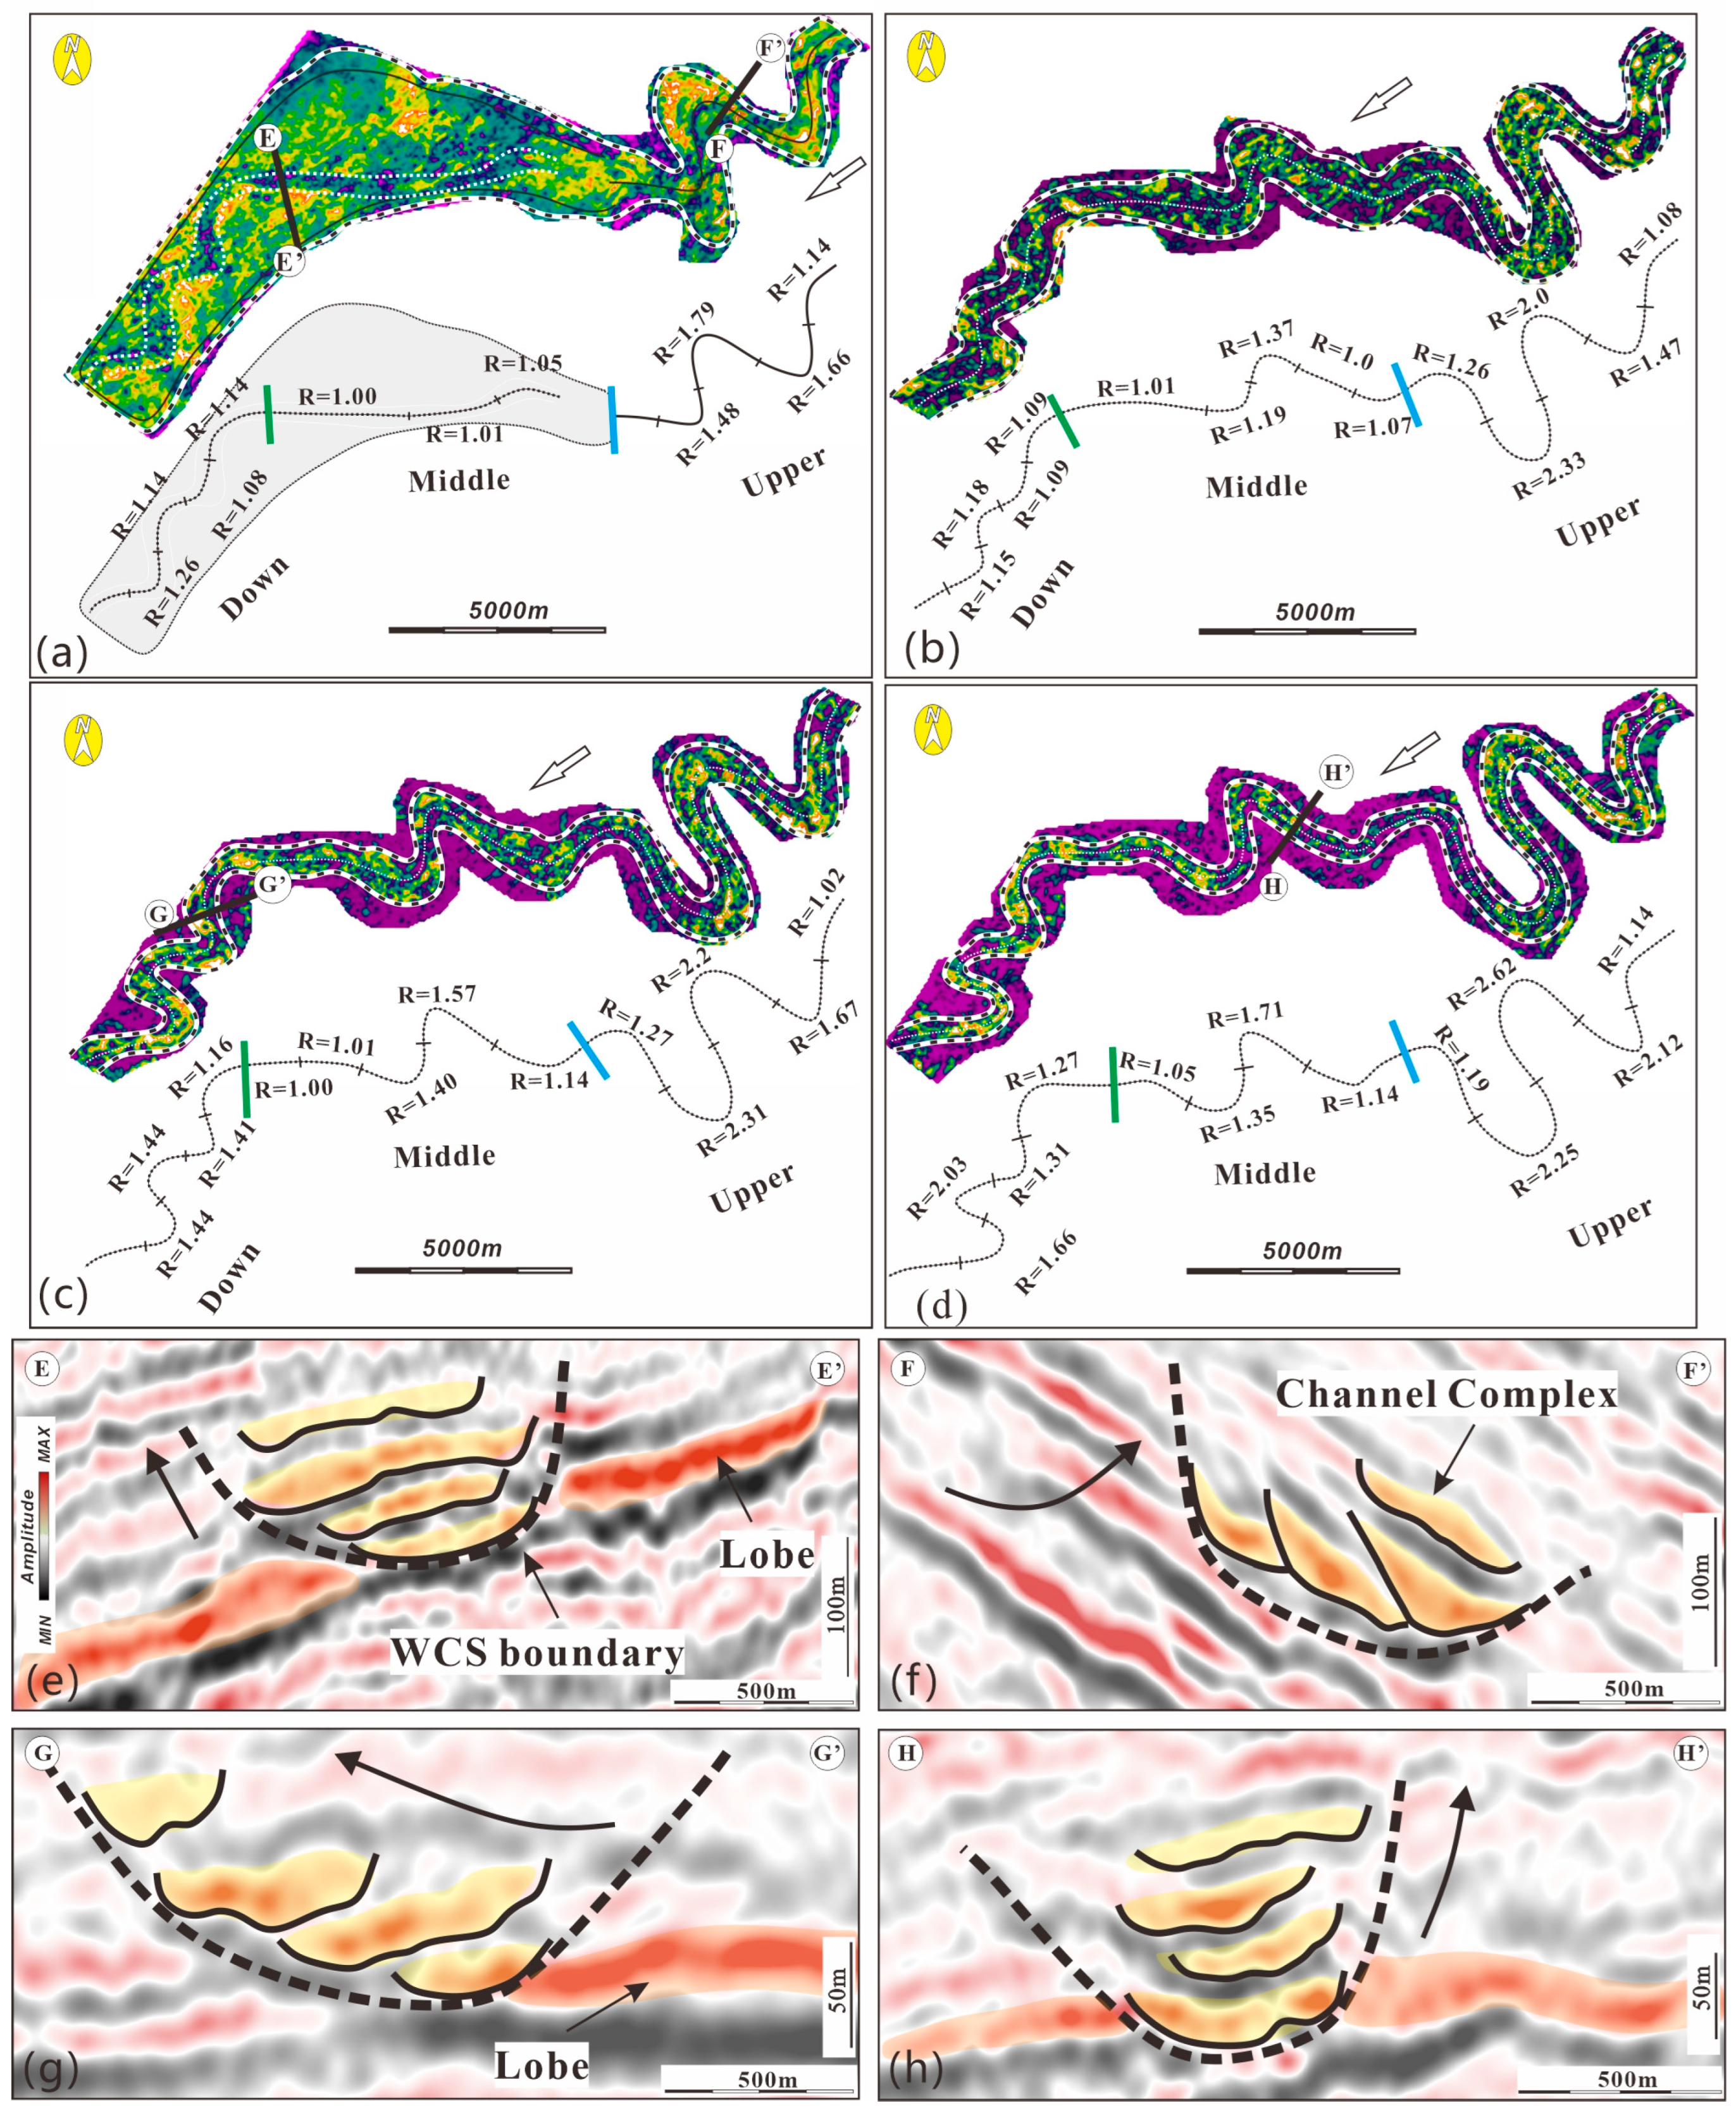
The WCS can be divided into four channel complex phases from base to top (Figure 6). WCC1 occupies the base of the channel system. RMS attribute maps indicate that upstream channels exhibit curvature ranging from 1.14 to 1.79. Mid-to-downstream channels diverge southwestward, forming fan-shaped deposits. These fans contain narrow, weakly curved channels with lower RMS amplitudes, exhibiting curvature of 1.00–1.05 in the mid-channel section and 1.08–1.26 downstream. Seismic profiles reveal continuous high-amplitude bands interrupted by chaotic reflection clusters, forming distinct envelope surfaces (Figure 6a). The WCC2 plane forms a curved strip, with upstream curvature ranging from 1.08 to 2.33, midstream curvature from 1.00 to 1.37, and downstream curvature from 1.09 to 1.18 (Figure 6b). WCC3 displays morphology similar to WCC2, with upstream curvature of 1.02–2.31, midstream curvature of 1.01–1.57, and downstream curvature of 1.16–1.44 (Figure 6c). WCC4 exhibits upstream curvature of 1.08–2.33, midstream curvature of 1.05–1.71, and downstream curvature of 1.27–2.03 (Figure 6d). Along the flow direction, each channel complex shows reduced curvature in the middle reaches, while upstream curvature increases with vertical elevation. Except for WCC1, the planar configurations of WCC2–WCC4 are highly similar, with curvature generally increasing with vertical elevation across different segments.
Superimposition patterns and stacking degrees of channel complex sand bodies vary across different sections of the WCS. In the upstream area, sand bodies are tightly stacked at an upward angle, with migration directed toward the outer bank of the planar bend. WCC1 exhibits a wedge shape resulting from subsequent channel erosion, while WCC4 is isolated atop WCC3, showing minimal lateral displacement (Figure 6f). In the middle reaches, channel sands are predominantly stacked vertically in a dispersed pattern, separated by low-amplitude seismic bands, with minimal lateral migration (Figure 6e,h). In the lower reaches, sand bodies are diagonally upward stacked in a dispersed arrangement, with migration directed toward the outer bank of planar bends. These deposits remain isolated, preserving their morphological integrity (Figure 6g). Along the flow direction, vertical stacking of channel sand bodies decreases while spacing gradually increases. Lateral migration is stronger in the upstream and downstream areas compared to the middle reaches. Overall, channel sand bodies exhibit a lateral stacking–vertical stacking–lateral stacking trend along the flow direction.

5.3. Plane Migration Pattern

Channels from different periods exhibit distinct planar morphologies, with variations in their pathways reflecting internal migration processes [1,26]. These migratory patterns are also observable in shallower strata at corresponding locations. Using RGB band fusion techniques in the study area, traces of migration events can be extracted, primarily manifesting in two modes: Downstream migration along the flow direction and lateral expansion toward the outer banks of bends.

5.3.1. Expansion

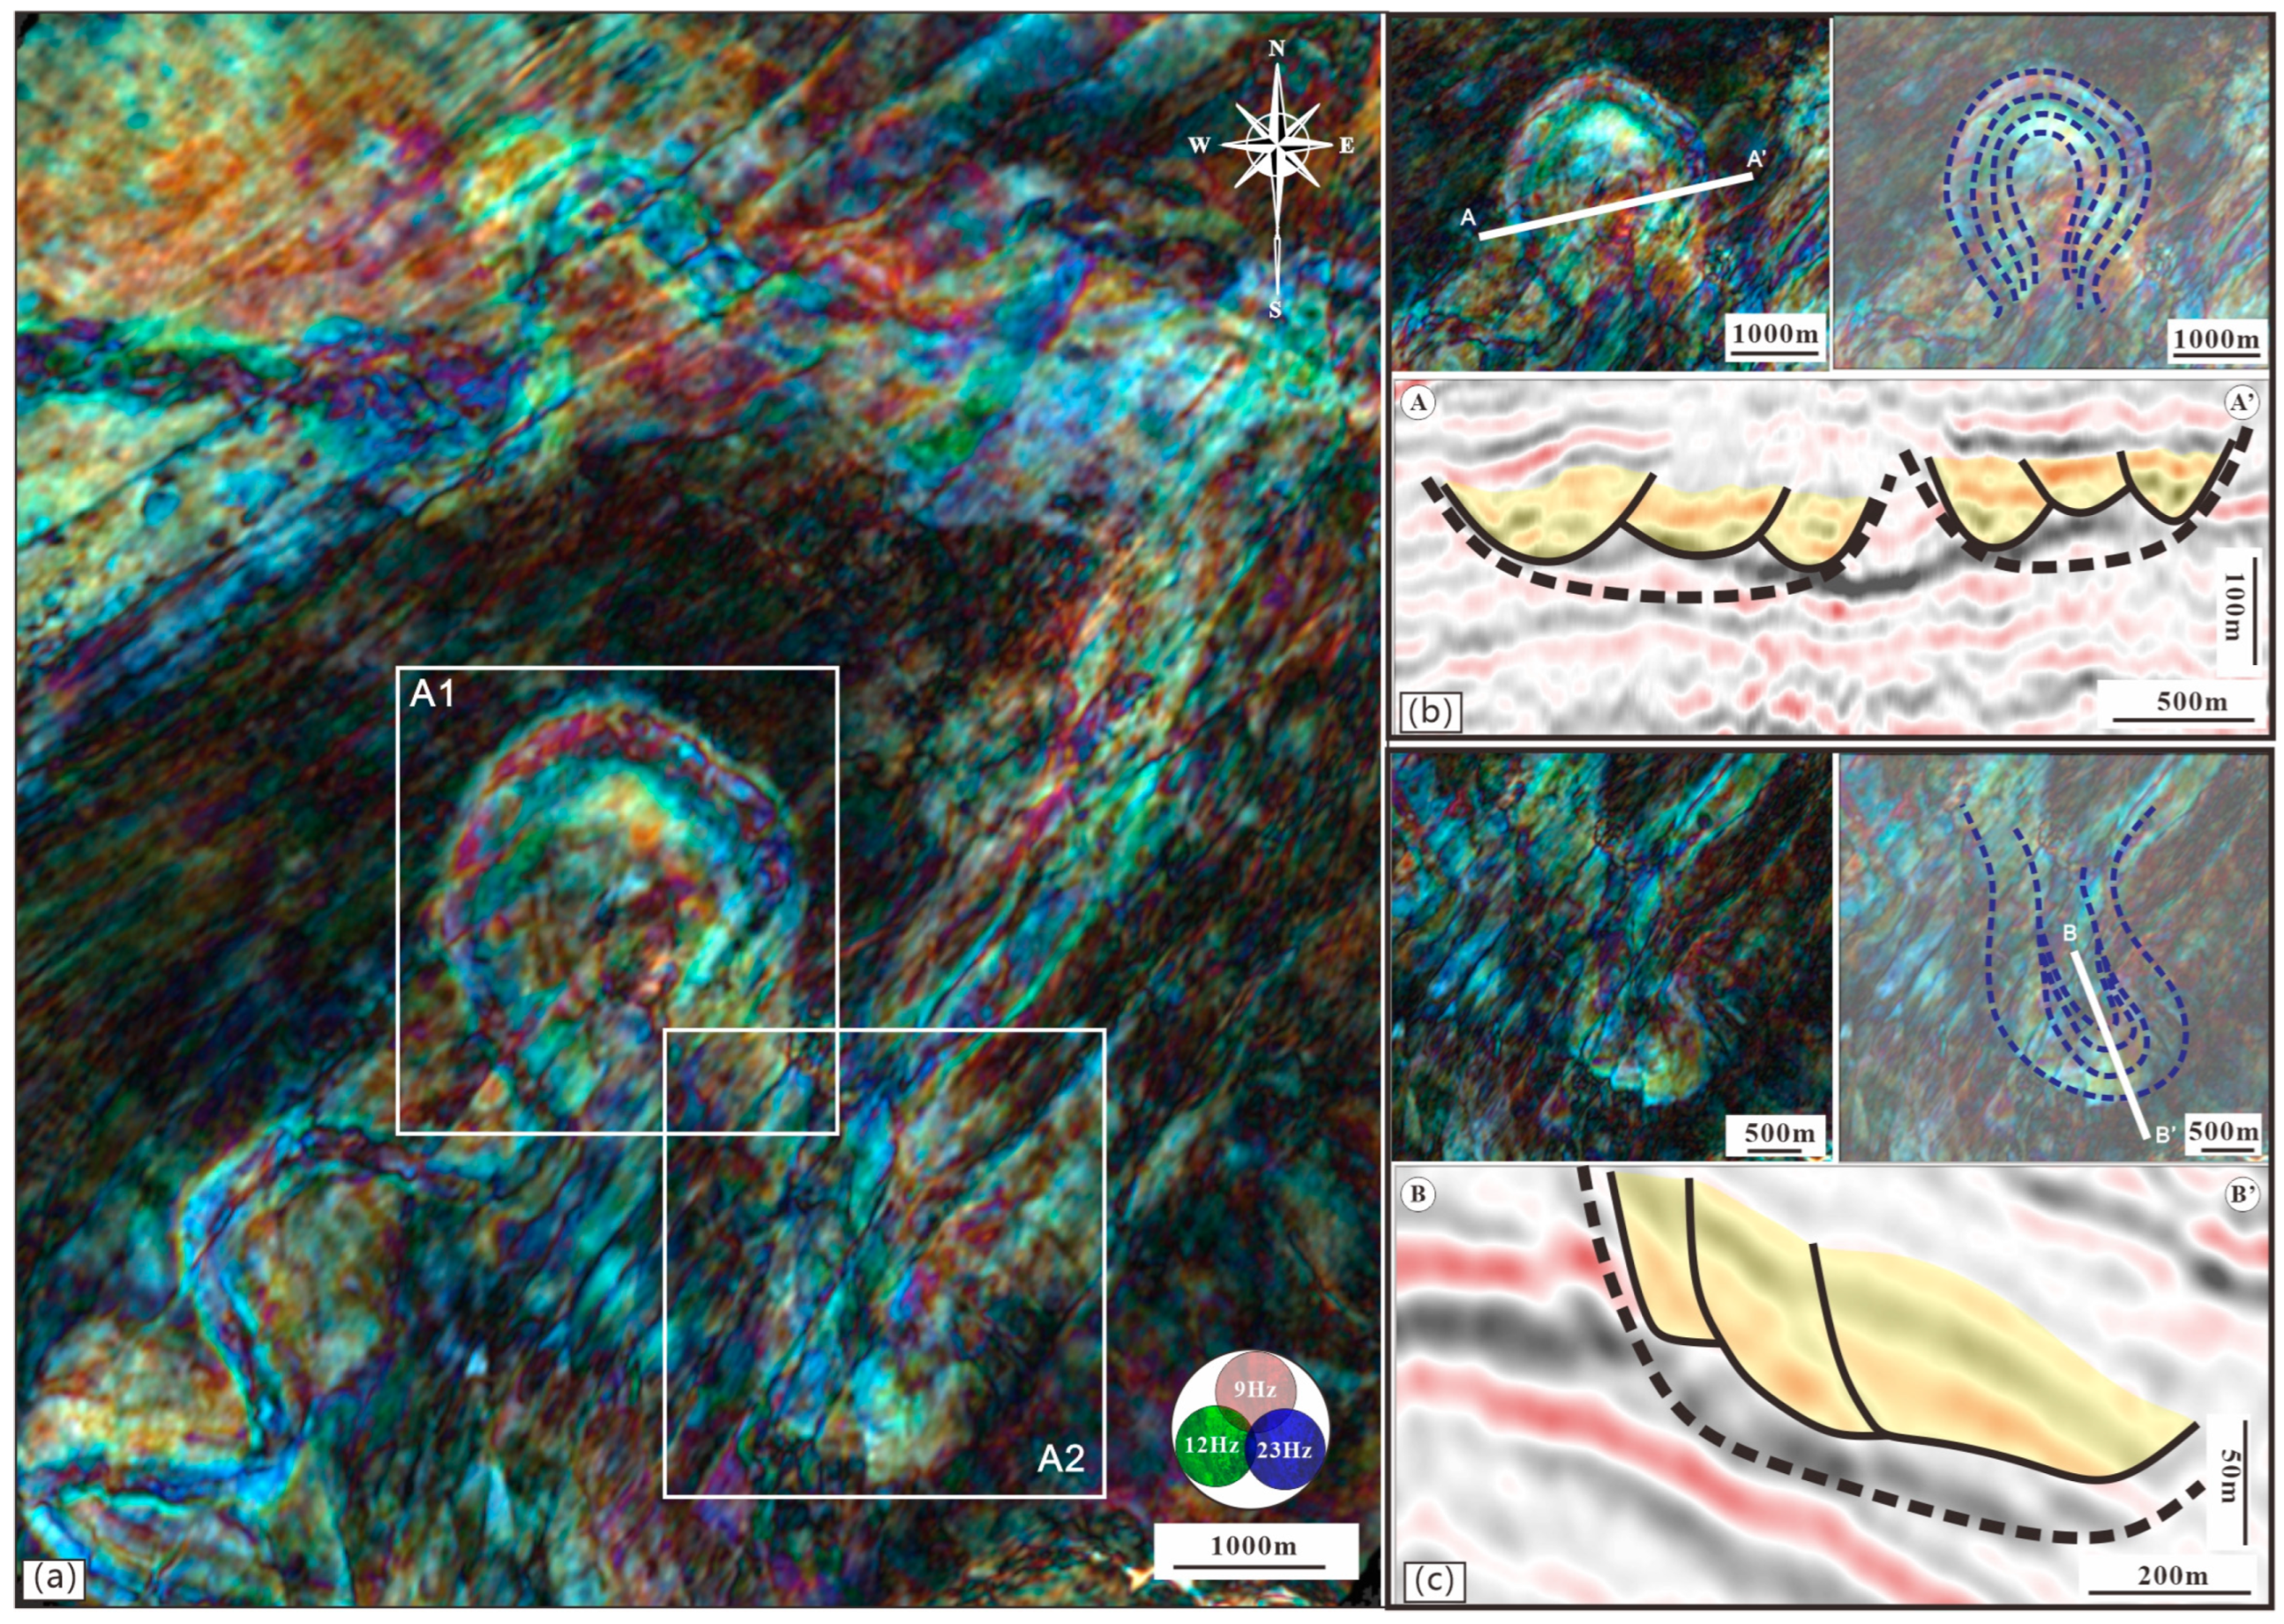
Expansive planar morphologies typically display semicircular or arcuate shapes, with channels gradually radiating outward from a central point. In the study area, the outermost channel formed during this process is observable in the middle-to-lower reaches of the ECS, delineating two regions, A1 and A2, on the planar map (Figure 7a). Channels in Area A1 exhibit an Ω-shaped morphology in plan view. Within this pattern, distinct channel boundaries are discernible, aligned along the curvature direction. These boundaries appear as relatively dense, low-amplitude curved lines within brighter bands. This morphology closely resembles point bars observed in meandering rivers (Figure 7b). Seismic profiles indicate that sand bodies within the small-amplitude clasts are laterally stacked. The outermost channel has eroded the inner channels, demonstrating a lateral migration trend toward the outer side of the bend. Area A2, located upstream of A1, forms a more curved arc in plan view. Its internal channels are less well-preserved than those in A1, with only partial pathway retention at points of maximum curvature (Figure 7c). Channels diverge toward the bend direction, and seismic profiles reveal lateral stacking of low-amplitude clusters, with stacking migration aligned with the planar bend. The sand bodies of the outermost channel retain relatively intact morphology.

5.3.2. Downstream Migration

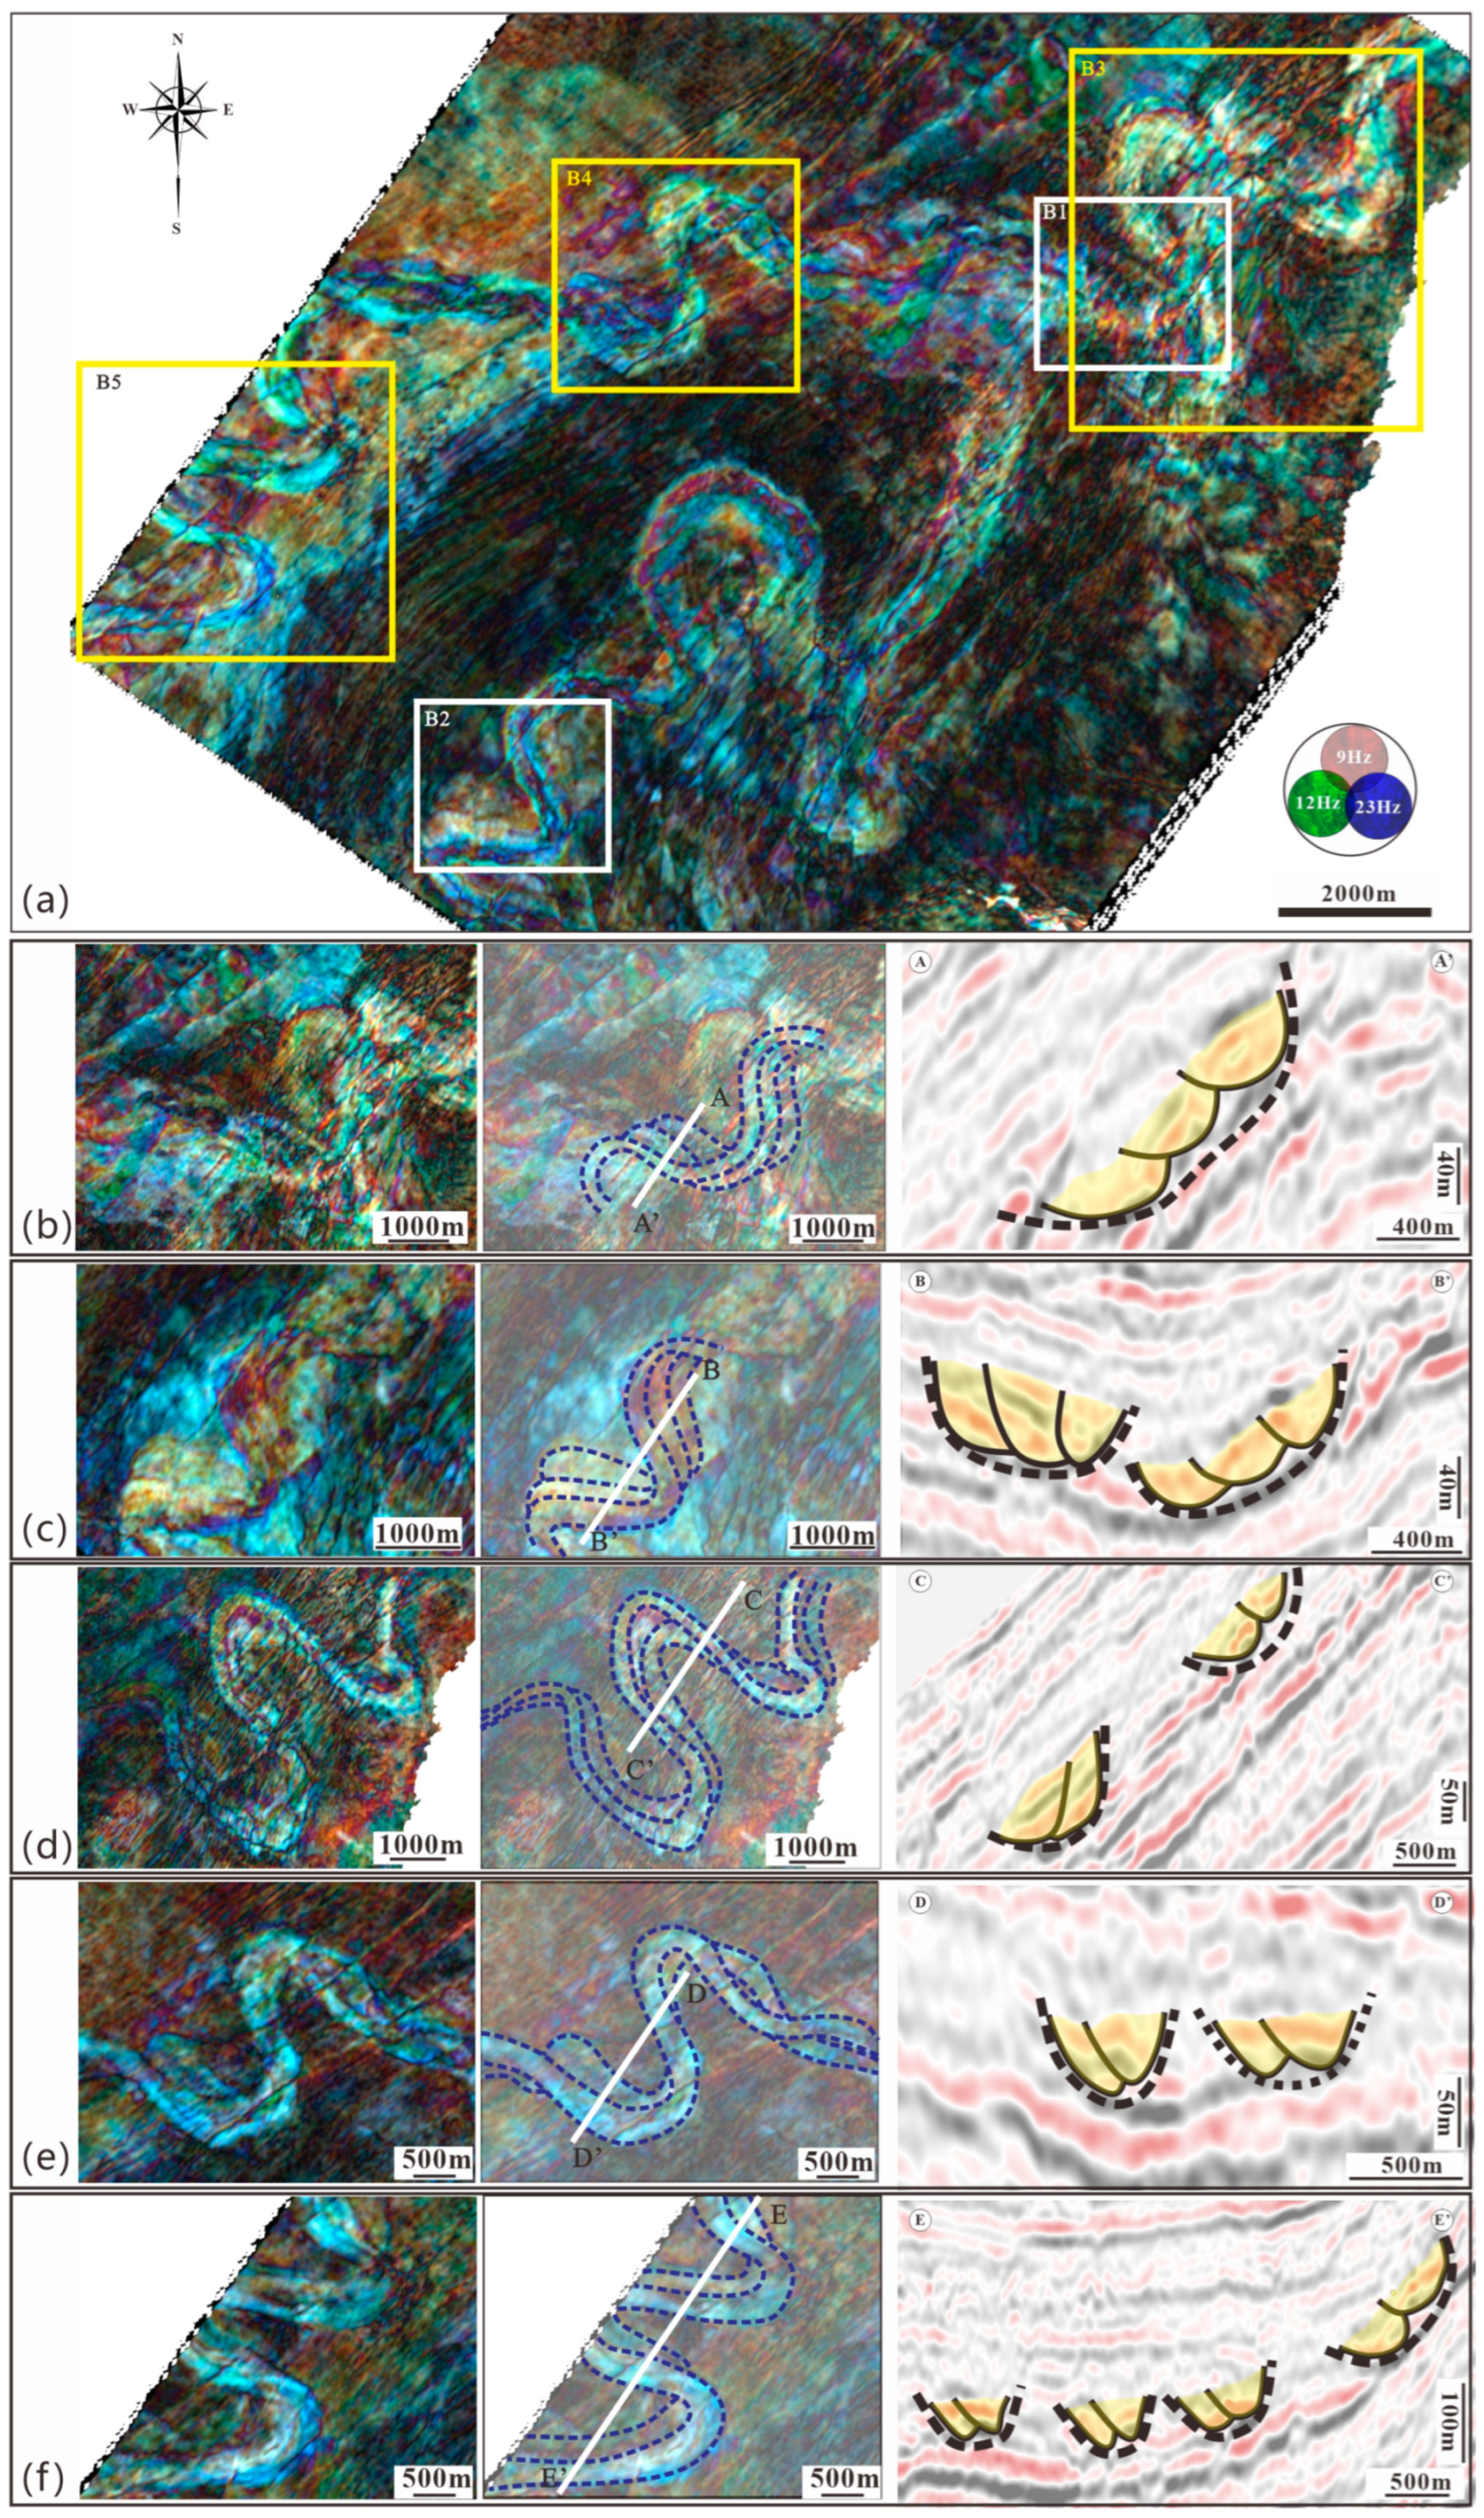
Downstream migration describes the process in which later-stage channels shift along the direction of fluid flow following earlier channel pathways, while maintaining an overall planar morphology largely unchanged. This migration pattern is evident in both the ECS and WCS (Figure 8).
(1)
Downstream migration in ECS
Downstream-migrating channels within the ECS occur in both the northern and southern parts of the study area, designated as B1 and B2 (Figure 8a). B1, situated closer to the sediment source, appears as a winding, undulating strip transitioning into a straight channel segment. Some WCS channels are also present in the surrounding area. In B1, three oscillating channels are visible as bright bands in plan view (Figure 8b). Subsequent channel paths migrate southwest along the flow direction, but the migration distance does not exceed the channel widths. In seismic profiles, this appears as lateral stacking of strong reflection amplitudes, with channels separated by low-amplitude oblique reflections aligned with the flow direction. B2 lies farther from the source, near the southern part of the study area, and is connected to Area A1 to the north. Within B2, three bright band-like channels meander and oscillate, with paths migrating along the flow direction (Figure 8c). The meanders in B2 have shorter wavelengths compared to B1. Seismic cross-sections show strong reflection amplitudes stacked laterally in a single direction. The final channel morphology exhibits a pronounced V-shape, with relatively smaller and more disordered amplitudes.
(2)
Downstream migration in WCS
Within the WCS channel system, several zones exhibit downstream migration along the flow direction, designated as Zones B3, B4, and B5 along the flow path (Figure 8a). Zone B3, located in the northeast of the study area, appears in plan view as a bright, high-amplitude meandering band. Later channels shift downstream along earlier channel paths, forming stacked high-amplitude segments in cross-section (Figure 8d). Downstream migration within B3 shows distinct variations: in the central bend segment, the later channel exhibits an outward expansion tendency. Near the northwest portion of the central bend, lateral displacement exceeds the width of the earlier channel, appearing as two dispersed bright bands in plan view. Conversely, southeastward displacement is smaller than the channel width, manifesting as two closely spaced bright bands. Zone B4, situated in the central part of the study area, corresponds to the first bend following the WCS breach diversion. Planar analysis shows a bright band curving from east to west, translating along the flow direction. Near the eastern edge, the translation distance exceeds the channel width, with some disconnected areas between channels. In the western zone, lateral displacement decreases, and the light-colored bands are closely adjacent in plan view. Cross-sections reveal lateral stacking of high-amplitude reflection clusters (Figure 8e). Zone B5, located in the southwestern part of the study area and representing the system terminus, contains channels deposited over a large-scale lobate structure. Light-colored channel bands exhibit planar meandering and downstream translation, with translation distances smaller than the channel width. In plan view, the channels appear as closely spaced bright bands, and cross-sectional profiles show multiple high-amplitude reflection clusters stacked laterally, with inclined reflection planes aligned with the flow direction (Figure 8f).

6. Discussion

6.1. Differences and Combinations of Migration Patterns

6.1.1. Differences in Bend Segment Properties

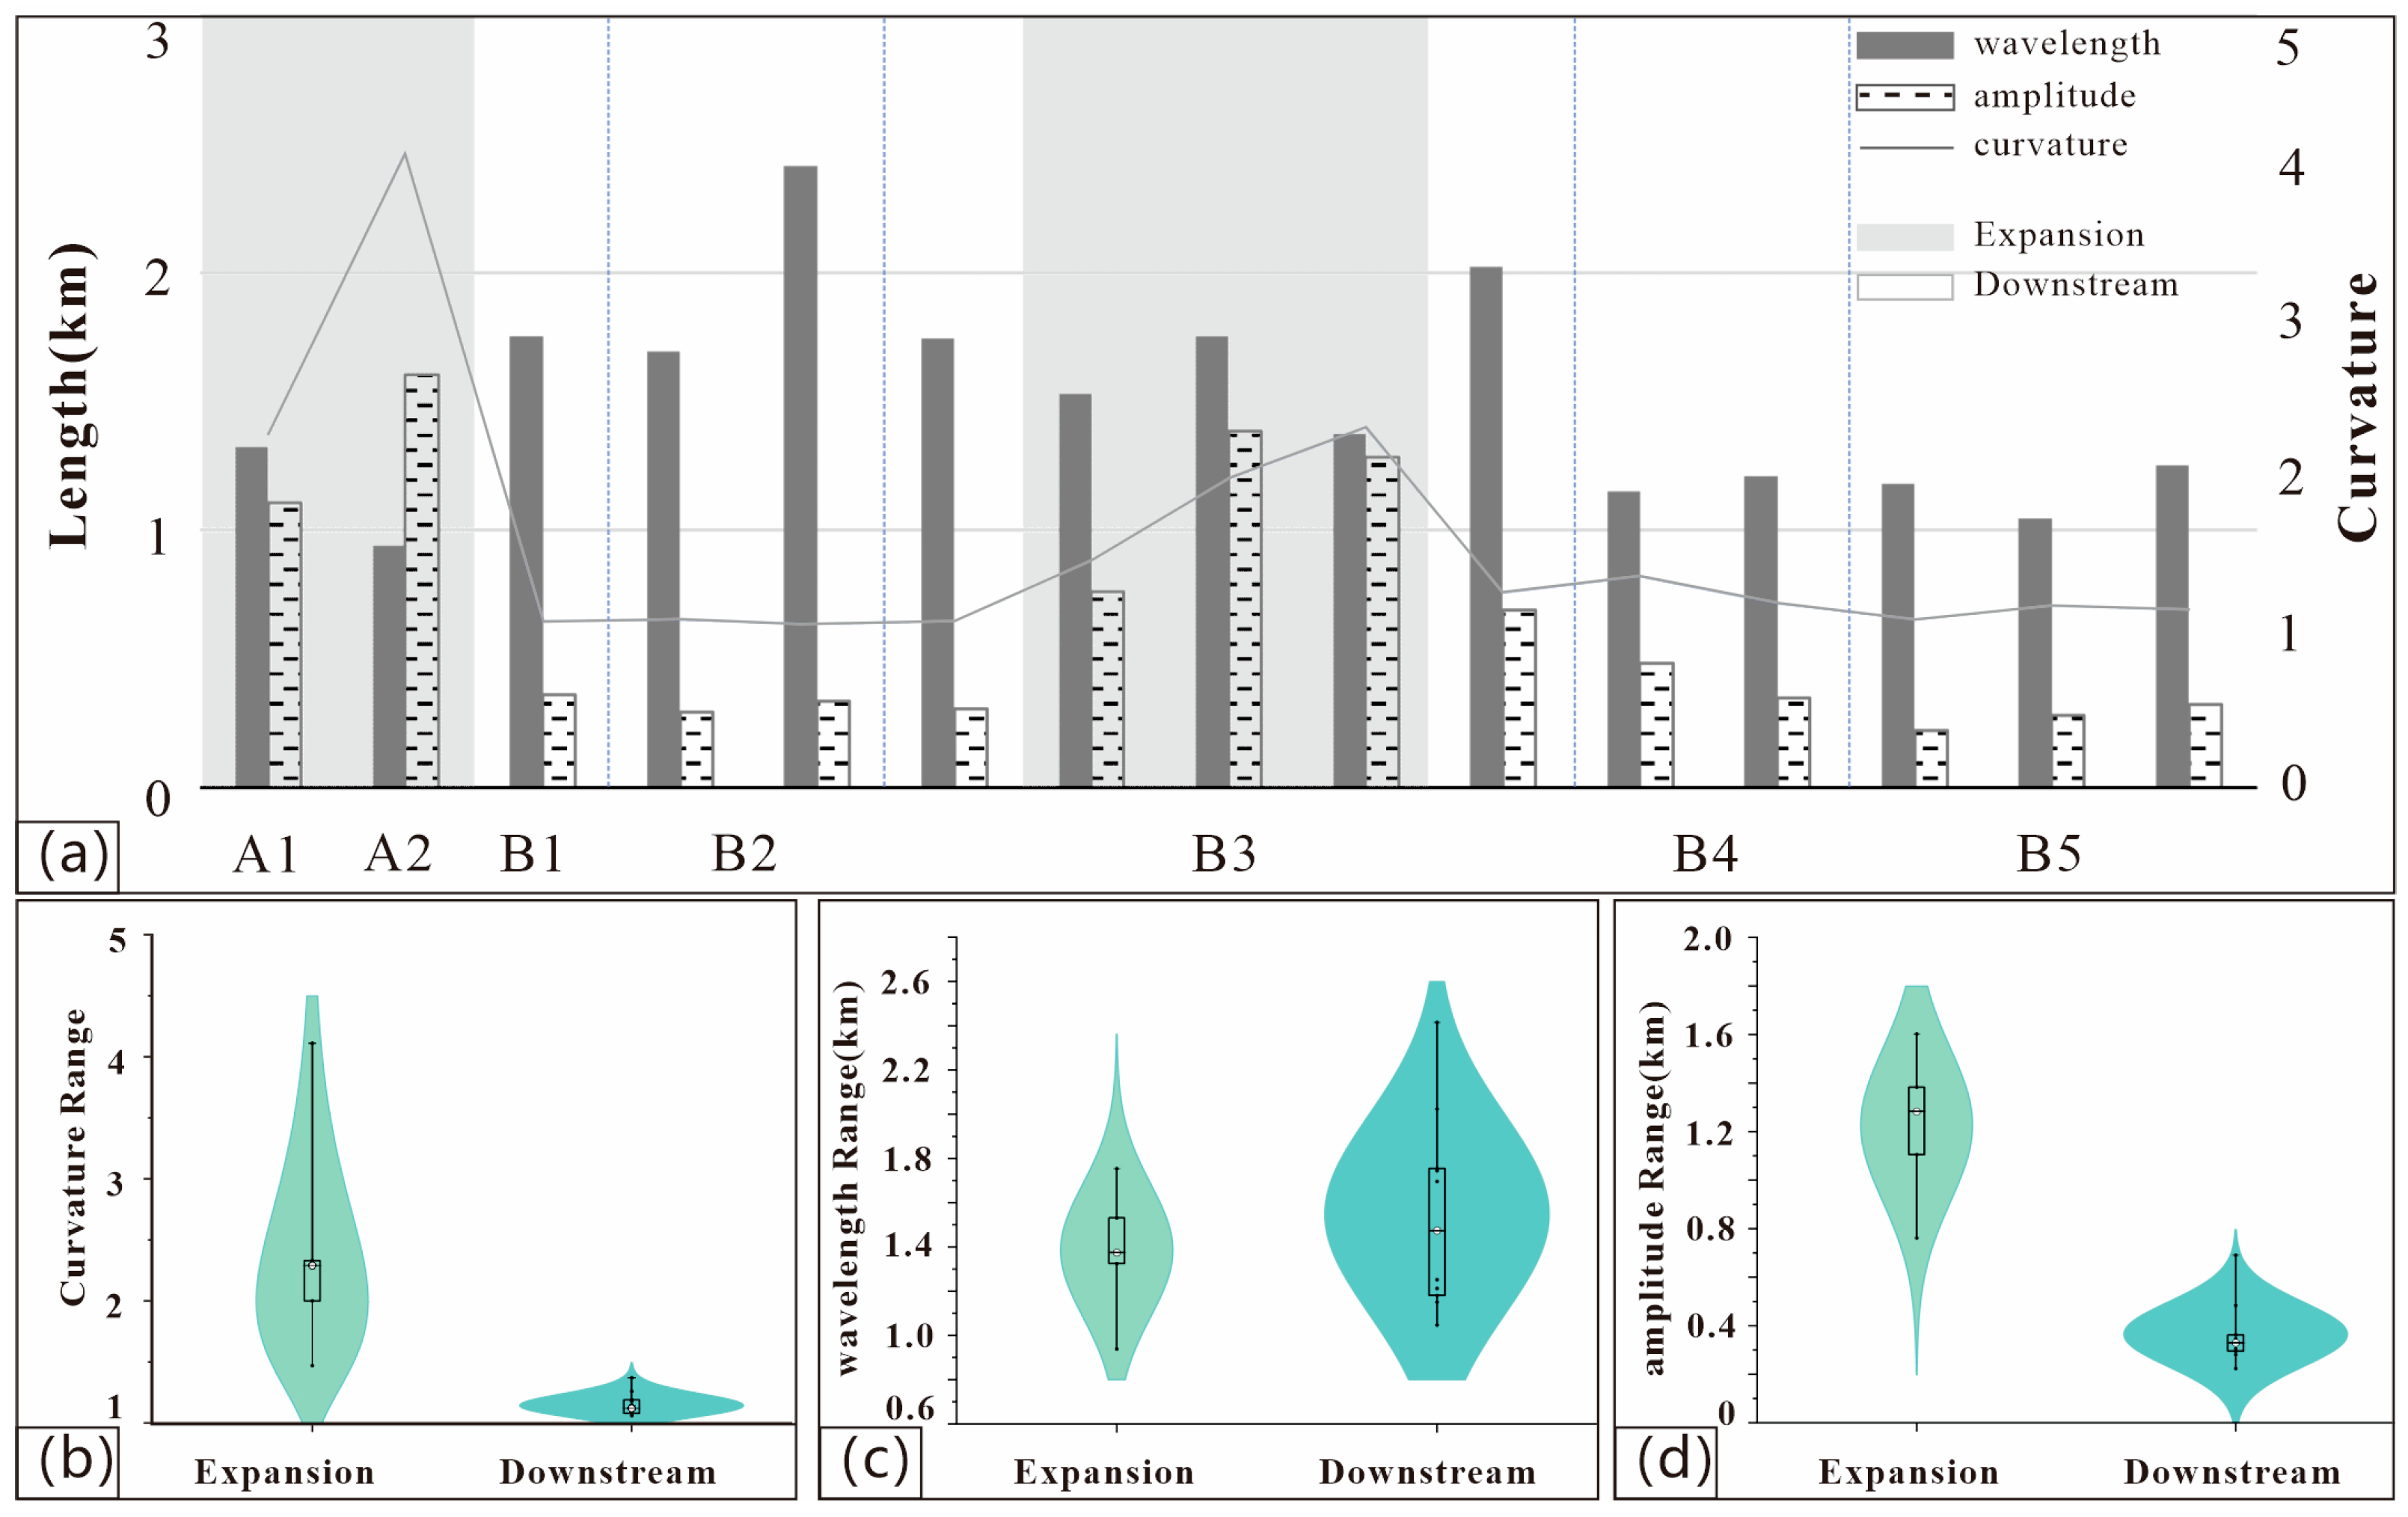
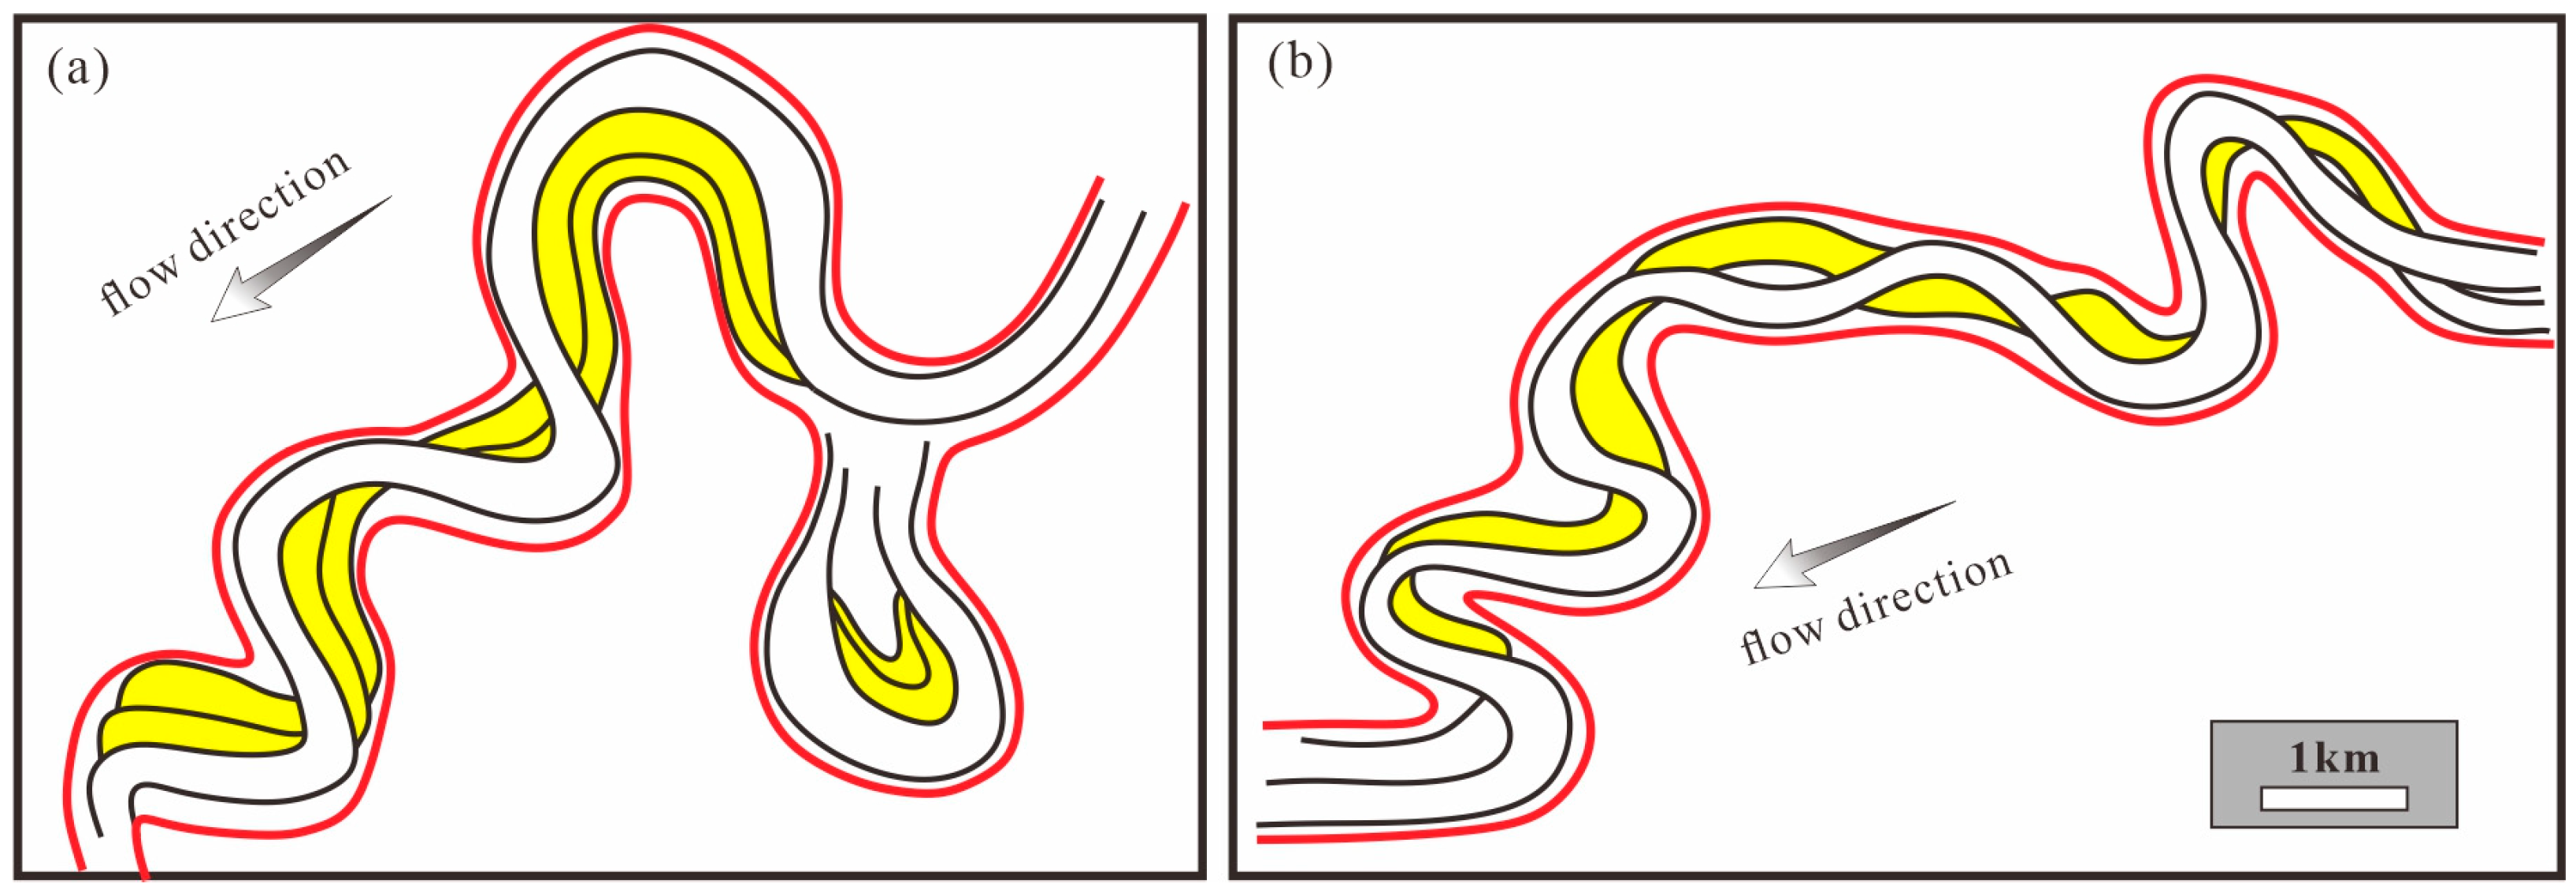
The lateral migration of channels is manifested as overlapping seismic reflections. This phenomenon is increasingly described in the literature as Lateral Accretion Packages (LAPs) [1,26,65], which are further classified according to the orientation of the shingled reflections as either channel-oriented or flow-oriented [26]. These correspond to the two migration types discussed here: flow-directed migration and expansion-directed migration. However, the scale definition of LAPs remains ambiguous, as it is unclear whether the term refers to individual channels or to sand bodies within a single channel [1]. We do not adopt this terminology in the present study, instead focusing solely on the path variation characteristics between individual channels. Channels typically exhibit a meandering pattern from the continental shelf to the deep-sea plain. During this process, the two migration patterns may recur cyclically and orderly [1,26], or a specific segment may be dominated by a single migration type [66,67], with such distributions often extending tens of kilometers. In the study area, however, different migration types can be observed within a planar range of nearly 15 km, indicating that variations in migration patterns may occur over very small scales—possibly just a few kilometers or even a single meander bend. We measured the curvature, wavelength, and amplitude of all meander segments undergoing migration within the study area (Figure 9a). Results indicate that curvature and amplitude exhibit distinct variations across different regions, whereas wavelength remains relatively consistent. These variations correspond closely with the migration pattern types observed in the channels. Statistical analysis reveals that regions formed by expansion-type migration consistently exhibit higher curvature than segments migrating along the flow direction (Figure 9b). Expansion-type migration predominantly occurs within the ECS channel system, corresponding to the two curved segments, A1 and A2. Traces of expansion-type migration are also observed in segment B3 of the WCS; although the planar path exhibits translational movement along the flow direction, it retains expansion-type characteristics within curved segments, defining a local expansion zone. Curvatures of expansion-type segments range from 1.47 to 4.11, whereas downstream migration segments in both the ECS and WCS exhibit curvatures ranging from 1.06 to 1.37, significantly lower than those of the expansion segments.
Expansion migration typically occurs under conditions of greater curvature, reflecting its orientation perpendicular to the channel migration direction. When the relative positions of the head and tail planes remain fixed, the curvature of the associated channel complex gradually increases as sedimentation propagates along the channel [26,34,36]. In contrast, migration along the flow direction preserves the overall channel morphology, involving only planar translation. Consequently, the channel curvature remains largely unchanged, and the downstream migration causes successive paths to overlap, effectively reducing the overall curvature of the channel complex [68]. Wavelengths (Figure 9c) and amplitudes (Figure 9d) were then measured for curved segments in different regions. Wavelengths fluctuate within 1–2 km without a discernible pattern, maintaining a generally sparse distribution. Expansion-type migration, being perpendicular to the channel, exhibits relatively large amplitudes ranging from 0.8 to 1.6 km. In contrast, flow-parallel migration produces smaller amplitudes, typically within 0.2–0.8 km, consistent with predominantly translational movement along the flow direction.

6.1.2. Combinatorial Differences on a Plane

Channels do not always maintain a single migration mode as they evolve; instead, they oscillate between different migration types. In areas of gentle terrain, channels generally adopt a meandering form, reflecting high-frequency lateral migration and producing a diverse range of migration characteristics. Within the study area, channels do not exhibit a consistently sinuous pattern. In both the central ECS and western WCS, straight channel bands with minimal curvature are also observed. Analysis of RGB spectral images further indicates that channel migration does not follow a regular pattern, consistent with what is typically classified as disordered migration. Within the ECS, the planar migration pattern evolves sequentially as Downstream—disordered—Expansion—Downstream migration. In contrast, the WCS exhibits a more complex sequence: Downstream migration (with expansion)—disordered—Downstream—disordered—Downstream migration. In the southwestern part of the study area, channel migration patterns stabilize into a Downstream mode. Correspondingly, curvature, amplitude, and wavelength measurements become relatively uniform. At this stage, channel sedimentary characteristics closely resemble continuous, meandering channels, suggesting that channels spontaneously evolve toward this stable state during the sedimentation process.
The channel planform migration patterns observed in the study area can be grouped into two primary sequences: (1) expansion-type migration followed by migration along the flow direction (Figure 10a), and (2) a sequence of migration along the flow direction → disordered migration → migration along the flow direction (Figure 10b).
(1)
Expansion—Downstream migration combination
The combination and transition between downstream and expansion migration represent the most common patterns in channel flow and sedimentation processes [67,68]. When downstream migration consists solely of translational movement along the flow direction, this migration characteristic can persist over extended distances. However, sedimentation typically involves migration perpendicular to the channel axis, which increases curvature within meander segments during evolution [69]. Once curvature reaches a certain threshold, lateral migration capacity exceeds that along the flow direction, triggering the onset of meander spreading [69] and gradually transitioning the migration pattern toward an expansion migration. As sedimentation progresses, continuous meandering and spreading further increase channel curvature. When curvature becomes excessive, straightening of meanders becomes more likely (Figure 5b,c and Figure 10a) [36,67,69], causing a rapid decrease in curvature. At this stage, translational capacity along the flow direction may surpass lateral migration, gradually reestablishing migration along the flow direction. During this alternating process, curvature typically increases and decreases in a cyclic manner, particularly at bends where straightening occurs, and curvature often reaches its maximum value (Figure 9a, Region A2).
(2)
Downstream—Disorder—Downstream Migration Combination
This migration pattern primarily consists of repeated downstream shifts along the flow direction on the planar surface, interconnected by segments of disordered migration (This disordered is not a fundamental migration mode, but rather a morphological description—specifically, it refers to the irregular connection between successive along-flow migration events.) (Figure 10b). Wavelength, curvature, and amplitude gradually stabilize along the flow path (Figure 9a), suggesting that external influences on channel sedimentation diminish as the system evolves. Sediment is deposited spontaneously by gravity-driven flows under the influence of inertia. Disordered migration segments tend to follow near-straight paths, with minimal lateral displacement over considerable distances [68], and the migration distances generally remain relatively short. Overall, this combination of migration patterns exhibits low curvature, although slight increases in curvature may occur during continuous downstream migration.

6.2. Sedimentary Processes Under Sea-Level Fluctuation Constraints

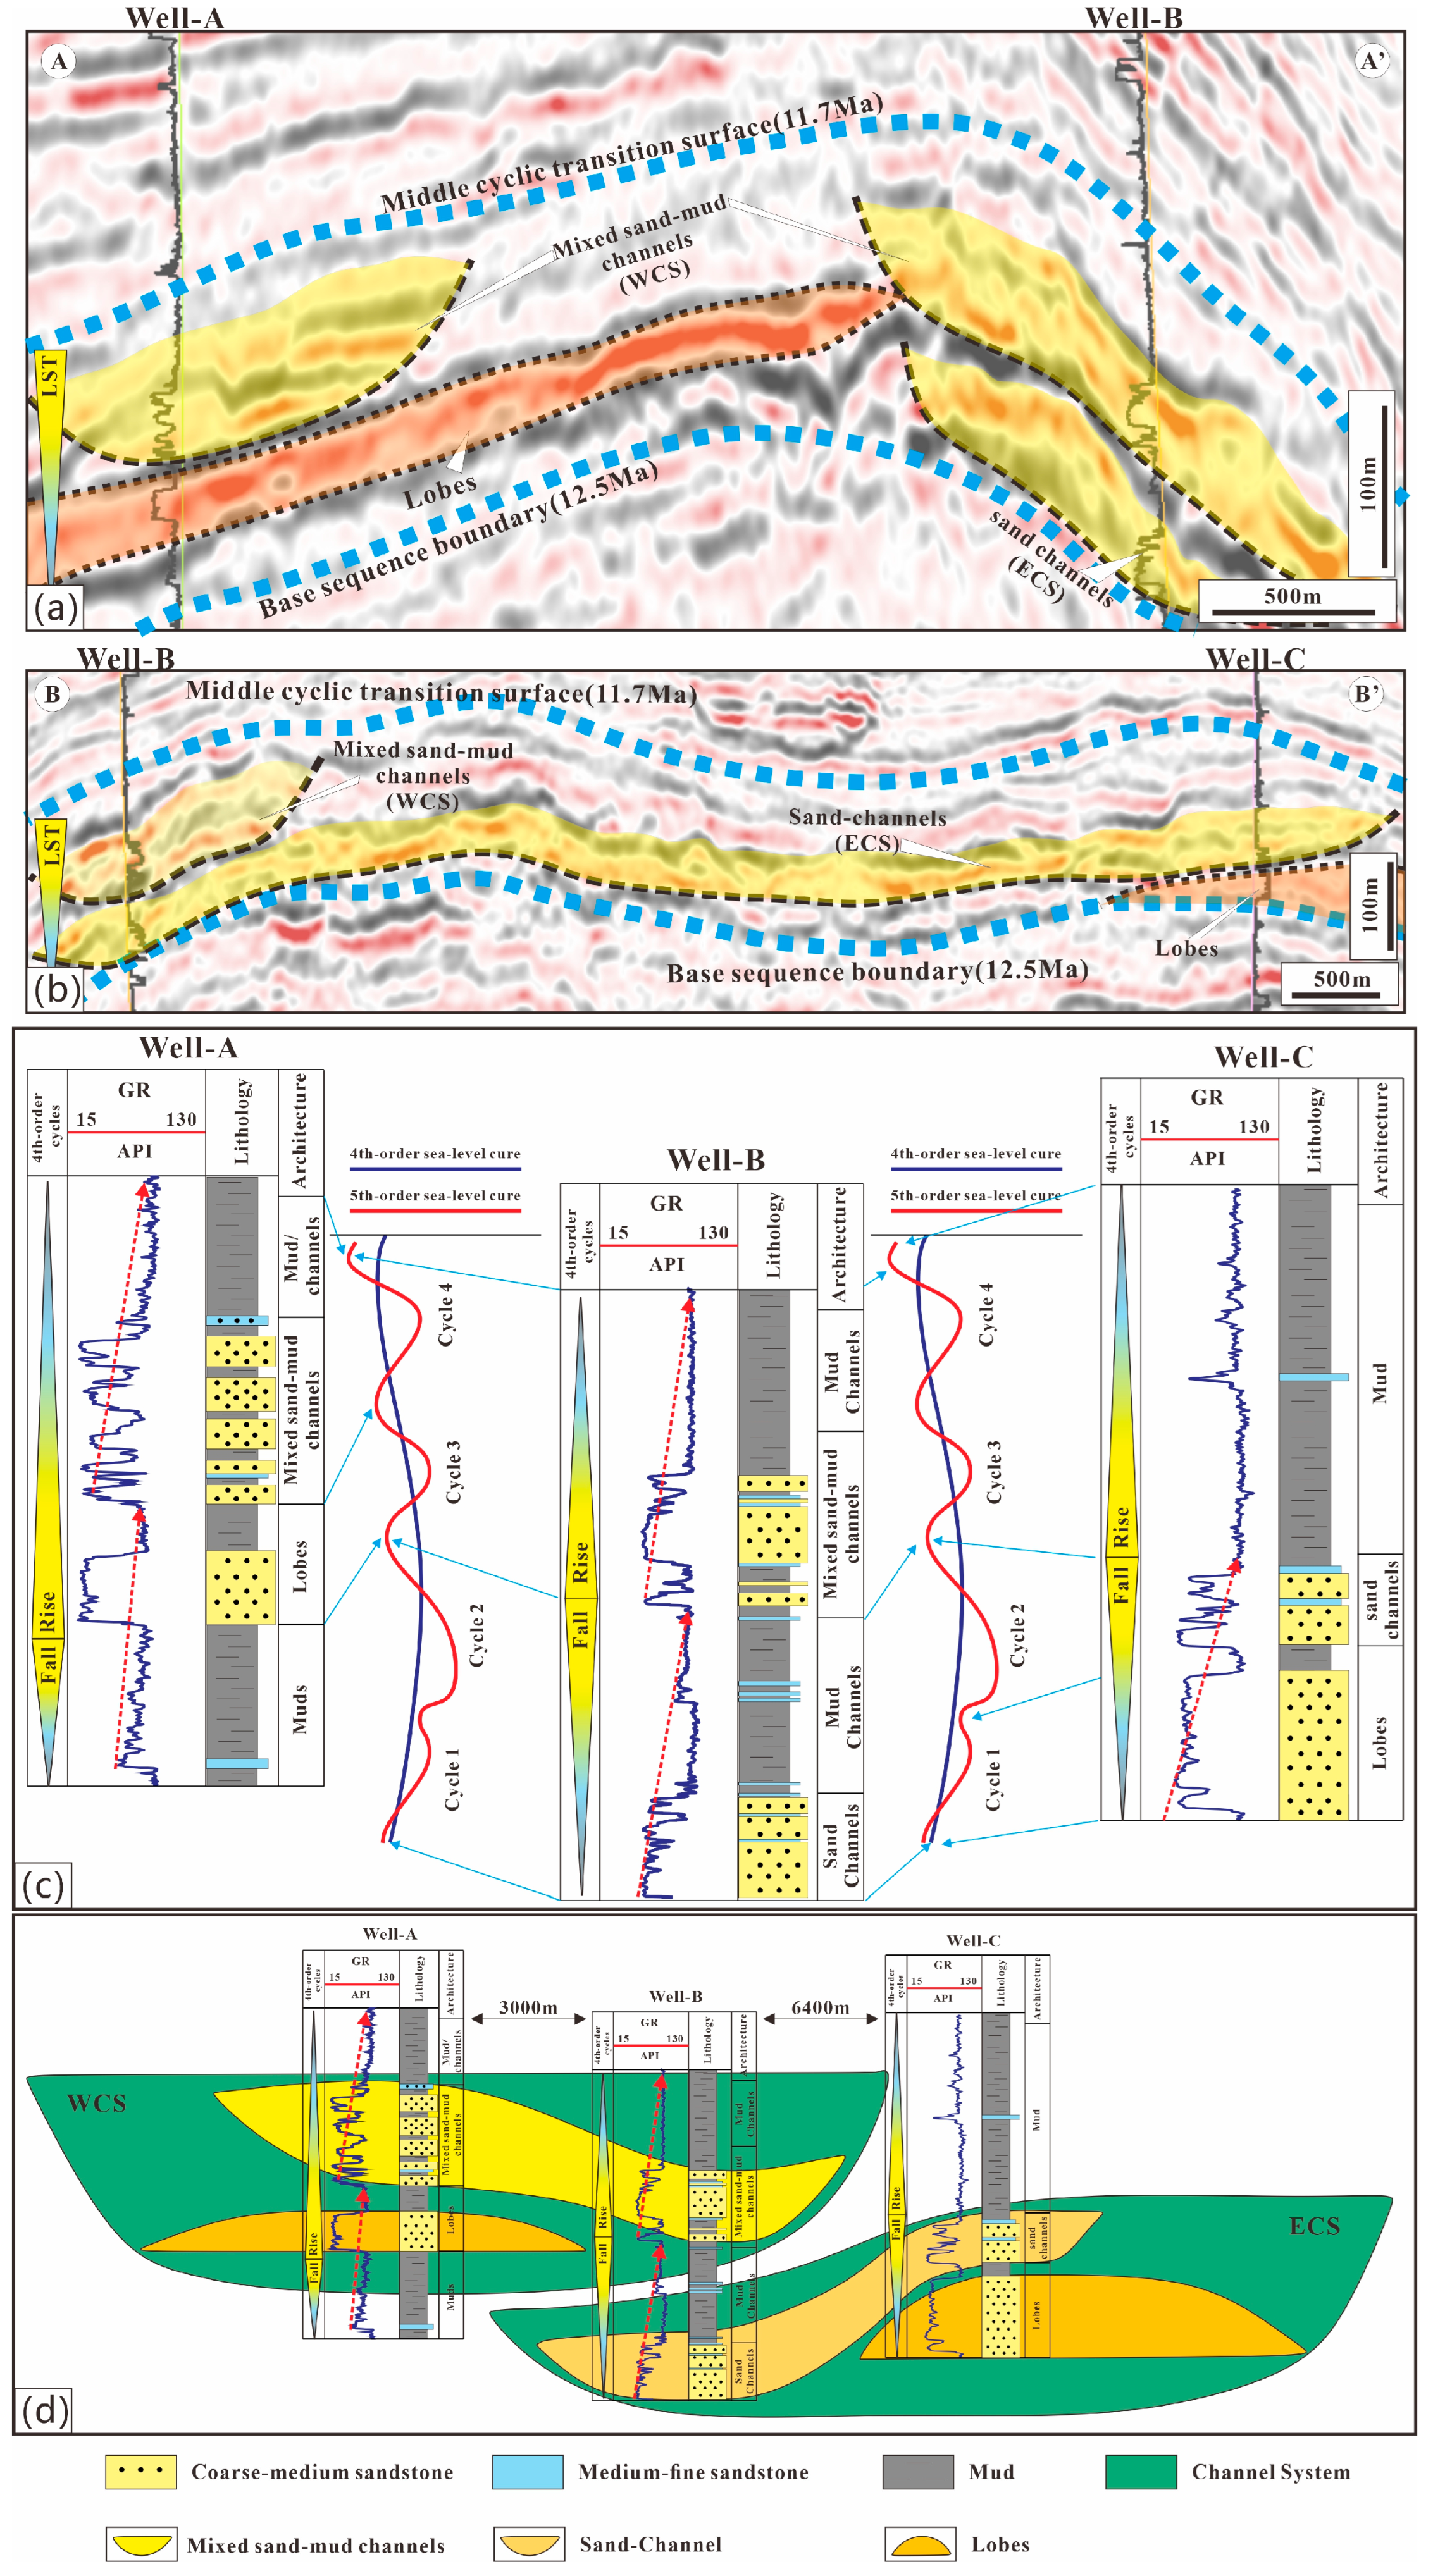
Tectonic activity on the lower slope of the Niger Delta Basin during the Middle Miocene was relatively minor [70], with sea-level fluctuations playing a more dominant role in shaping the stratigraphic architecture. During this period, overall sea level was in a declining phase, driving sedimentation within regressive deltaic systems. Frequent sea-level variations produced multiple prograding tertiary sequences in the Niger Delta Basin [9,71], extending from the shelf into deepwater areas [40]. Well data, 3D seismic surveys, and previous sequence stratigraphy studies have identified multiple synchronous tertiary sequences within the basin [52,72,73]. The study area is primarily situated within a tertiary sequence spanning 10.5–12.5 Ma. A detailed sea-level change curve indicates that the channel system developed within a complete fourth-order sequence, encompassing four full fifth-order sea-level cycles [51,52,72,73,74] (Figure 2).
During the studied sequence interval, global sea level experienced a three-stage rise–fall cycle, internally composed of multiple high-frequency oscillation cycles [51,52,72,73,74]. These fluctuations likely had a significant influence on the structural patterns of submarine fans [52]. By integrating borehole and 3D seismic data, we compared the channel deposits with corresponding sea-level change curves in the study area. The sequence as a whole corresponds to a regional sea-level fall phase during the Miocene, which, according to high-frequency sea-level records, represents a complete four-stage cycle of initial decline followed by subsequent rise. During this interval, the Niger River experienced a major capture event [75], expanding its drainage basin by 106 km2. This shift altered the river’s sediment supply to a mixed lithology of sandstone, shale, limestone, and volcanic outcrops, providing the material basis for extensive marine fan deposition.
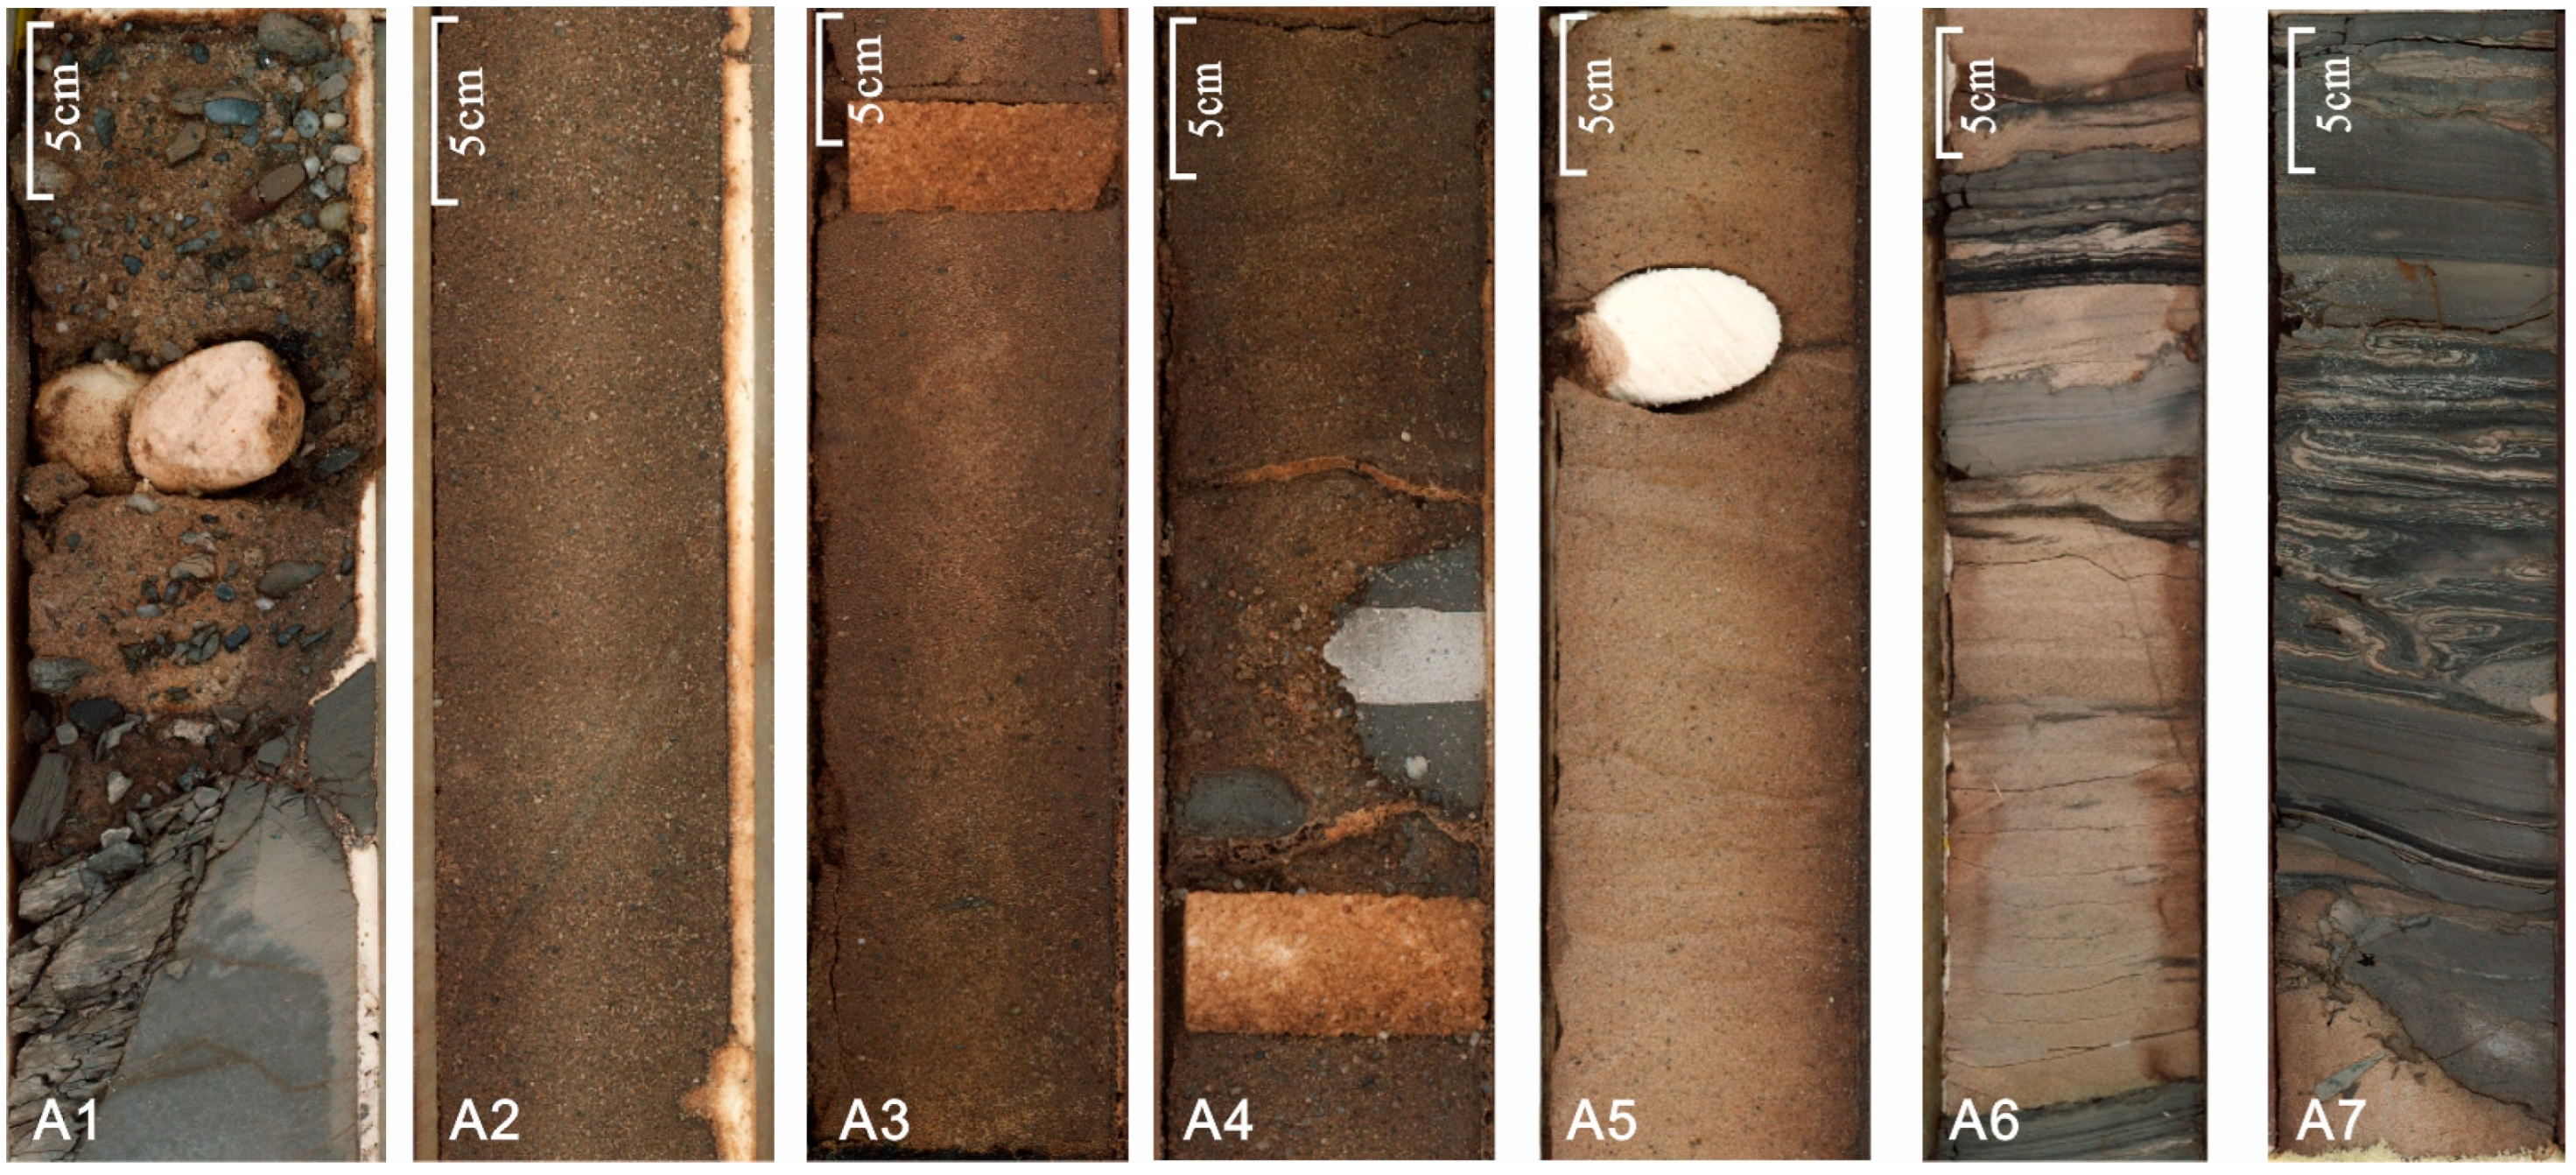
ECS deposits are located in the lower part of the sequence, while WCS deposits occupy the upper part (Figure 11a). Generally, only a single channel path existed at a given time, as gravity-flow sediments from the northwest could not simultaneously supply two channels flowing in different directions. Seismic profiles further indicate that WCS deposits overlie ECS deposits (Figure 1b and Figure 11a,b). Consistent with previous studies of the area [9,52,71], these observations confirm that the ECS formed first, followed by the WCS, and that the two channels did not operate concurrently. Refined tertiary and quaternary sea-level change curves suggest that the ECS primarily developed during a sea-level fall phase (Figure 11c), characterized by rapid fluctuations with amplitudes of 10–20 m over 0.1–0.2 Ma (Figure 2). The combination of rapid sea-level decline and increased sediment supply allowed gravity flows to reach the continental slope efficiently, depositing sediments rapidly. During this interval, channels were dominated by high-energy debris flows and high-density turbidity currents, producing relatively rectilinear channel deposits with limited lateral meandering within the ECS (Figure 5a–c). At the base of the ECS channels, deposits of gravel and muddy debris of varying sizes are evident (Figure 12). The middle section comprises massive coarse sandstone, with thin layers of medium-to-fine sandstone appearing only in the upper section, followed by thick deep-sea mudstone layers (Figure 11c and Figure 12). This vertical sedimentary succession aligns well with the five-stage sea-level curve, corresponding to the two five-stage cycles of Cycle 1 and Cycle 2. The foliate layers at the base of the ECS formed during Cycle 1 (Figure 11a,b,d), whereas the middle to upper channel deposits accumulated during Cycle 2, characterized by an increased proportion of sandy sediments and box-shaped logging curves (Figure 11c,d).
The WCS developed over approximately half of a fourth-order sea-level cycle (Figure 11c), during which sea level rose gradually from its lowest point. At the base of the WCS, a gravel layer deposited by debris flows is present (Figure 12), though both the size and quantity of gravel are smaller than those in the ECS. This layer partially records the rapid fluctuations associated with the new sea-level stage [25].

6.3. Evolution of Channel Systems

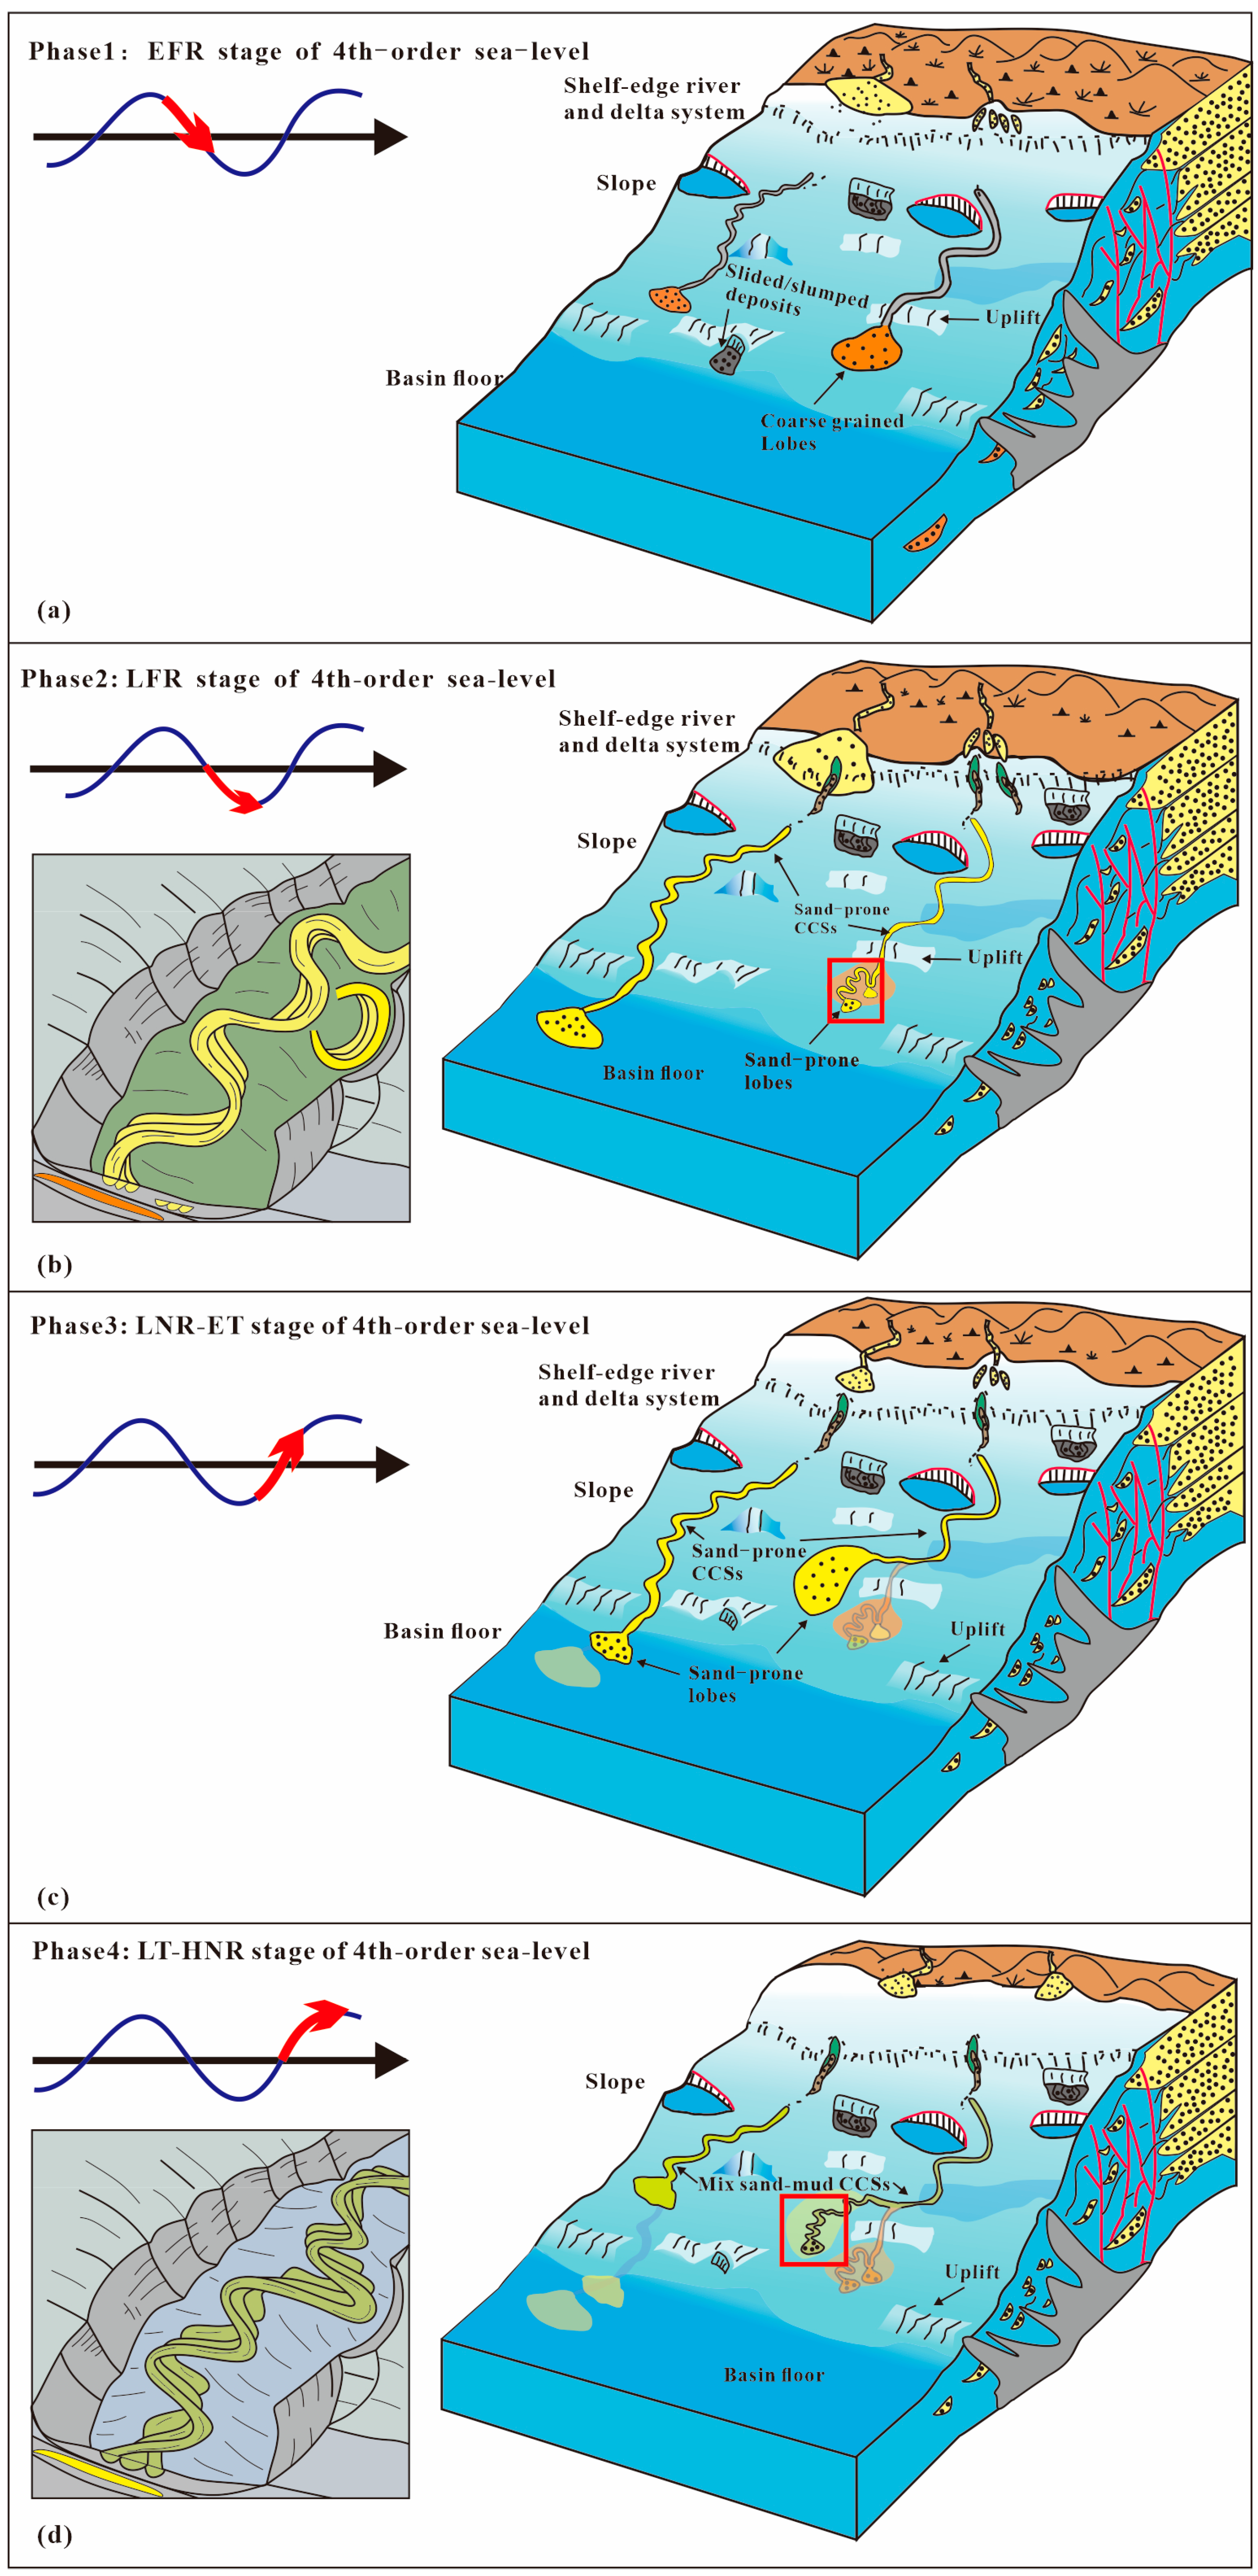
Within the channel systems of the study area, distinct planar morphologies, migration patterns, and lithological variations were observed among different channels. These differences reflect structural variations within the sequence [52]. Given their close correlation, we interpret these variations as responses to fourth-order sea-level fluctuations. Based on the structural characteristics of the various channel complexes, we established a four-stage structural evolution model for individual submarine fan systems (Figure 13). Each stage is associated with distinct types of sediment gravity flows, which correspond to specific phases of fourth-order sea-level fluctuations at different locations.
The first stage is characterized by a debris flow–fan complex dominated by conglomerates and coarse sandstone, typically distributed at the base of the channel system, such as in the basal deposits of the ECS (Figure 11 and Figure 12). These conglomeratic assemblages exhibit pronounced erosional capacity and cutting action. The chaotic lithological structure reflects rapid deposition accompanied by increasingly disordered sediment assemblages. Core data from channel bottoms reveal gravel, silt, and unevenly graded sandstone, all displaying typical debris flow sedimentary characteristics (Matrix-supported, poorly sorted to unsorted, and Chaotic fabric) [76,77]. These deposits are generally interpreted as overrun sediments retained at the channel base. This stage likely formed during a period of rapid sea-level decline within a Quaternary marine cycle. Landslides at the continental shelf margin and deltaic transgression facilitated the transport of shallow-water sediments onto the continental slope, generating debris flows under gravitational influence (Figure 13a). Sediment energy diminishes along the flow path, and at the channel terminus, plastic-flow debris spreads in sheet-like or fan-shaped patterns, forming mass-transport deposits (MTDs). Coarse sandstone within the upper fluid layer can subsequently spread over the MTDs, producing widely distributed lobate structures.
During the second stage, a sequence dominated by medium-to-coarse sandstone developed. These deposits, such as the channel sediments in the upper–middle part of the ECS, were vertically superimposed on the underlying gravel–coarse sandstone sequence at the base of the channel system. Log curves showing box-type reflections and core samples indicate high sand content (Figure 11 and Figure 12). Lateral erosive capacity intensified during this stage, while vertical erosion potential was relatively reduced; however, the gravel–coarse sandstone assemblage at the channel base still exhibited some vertical erosion, partially incising the underlying foliated units. Core data reveal predominantly blocky, grain-supported medium-to-coarse sandstones, indicative of high-energy sedimentary conditions closely resembling the high-density turbidite deposits described by Lowe [78]. These coarse-grained, high-energy gravity flows are interpreted as turbidity currents that dominated during periods of sea-level decline. Lateral migration of these high-density turbidity flows is complex. Within bend sections, coarse-grained sediments preferentially migrate toward the outer bend, with large-grained material gradually shifting downstream from the upstream side of the bend apex. This produces a migration pattern characterized by frequent lateral offsets with relatively short displacement distances (Figure 13b) [25], consistent with the expansion–downstream migration pattern observed in the upper ECS. When the Quaternary sea level reached its lowest point, the shelf-margin delta likely transported sediment directly through canyons into the deepwater environment, further promoting turbidite deposition along the continental slope and establishing a new turbidite sedimentary system (Figure 13b).
The third developmental stage is characterized by a composite complex dominated by gravelly sandstones and medium-to-coarse sandstones, exemplified by the channel-fan deposits and clastic sediments in the lower WCS. These deposits commonly form narrower, more sinuous bands, likely reflecting reduced sand transport in gravity flows (Figure 11 and Figure 12). Enhanced secondary circulation within meander bends [79] increased channel curvature and oscillation amplitude. As curvature intensified, the channel deviated from its original trajectory, spreading downstream to form fans with altered distribution orientations (Figure 13c), closely resembling breached fan deposits. Downstream, the reduced sandy material allowed leaf-like structures at the channel terminus to extend further, appearing as broader fans on plan view, though these fans were thinner than those formed during the first stage. Compared to the preceding stage, the combination of reduced sand supply and increased channel meandering indicates lower-energy conditions. This assemblage of gravelly and medium-to-coarse sandstones is interpreted as primarily resulting from a combination of debris flows and high-density turbidity currents (S3–T1) [78]. During this stage, gradual sea-level rise in the Quaternary enhanced the dominance of turbidity currents [80,81]. Concurrently, substantial sediment accumulation at the shelf margin formed extensive low-lying deltas, likely reducing the volume of sandy clastics transported into deepwater environments.
The fourth stage is characterized by medium sandstone–mudstone assemblages, exemplified by the channel belts in the upper WCS. These channels generally inherit the planar morphology of earlier deposits, exhibiting narrow, meandering forms. The amplitude of meander bends may increase, corresponding to a higher silt content in gravity flows (Figure 11 and Figure 12). Core data indicate that the vertical alternation of medium sandstone and mudstone reflects a combination of high-density and low-density turbidites within the Lowe sequence [79]. In these fine-grained turbidites, lateral confinement is reduced in the upper and middle portions of the flow, facilitating lateral movement at bends. Expansion-type migration within bends diminishes or ceases entirely, with simple channel oscillation and deposition becoming the dominant pattern (Figure 13d). This aligns with the simple downstream migration observed in the upper WCS (Figure 10). As the Quaternary sea level gradually reached its maximum, marginal sediments accumulated on land, further limiting the transport of sandy clasts into deepwater settings. Consequently, deep-water deposits during this stage primarily consist of turbidites composed of sand–silt mixtures interbedded with semi-pelagic shales.
Overall, the ECS in the study area reflects a process dominated by progressive marine transgression, characterized vertically by gravel and coarse sandstone, with debris flows and high-density turbidity currents prevailing within the channel system. In contrast, the WCS records a phase of progressive terrestrial regression, marked by a vertical decrease in sandy material and an increase in silt content, with sedimentation primarily governed by a combination of high-density and low-density turbidity currents.

7. Conclusions

(1)
The study area comprises a single submarine fan system developed through both channel and lobe components. Vertically, it consists of two distinct systems: the East Channel System(ECS) and the West Channel System (WCS). The lower portion of the ECS is dominated by a southward-extending lobate body, while the upper portion forms a curved channel belt. In contrast, the WCS exhibits a southwesterly lobate body in its lower section, with a more sharply curved channel belt in the upper section. In the proximal area, the two systems follow roughly parallel paths, but the WCS shifts westward in the middle section. Along the flow direction, the ECS channel belt displays a relatively gentle planar course before transitioning abruptly to a high-curvature segment. The WCS, in contrast, is more curved proximally, with its overall curvature decreasing following the mid-channel path shift.
(2)
Lateral migration of channels occurs through two primary mechanisms: Downstream and expansion migration. Downstream migration is typically associated with lower sinuosity values, whereas expansion-driven migration develops in segments with higher sinuosity. Even within a single area, migration types can coexist over relatively short distances of only a few kilometers. These two mechanisms often alternate or recur in plan view, forming two characteristic patterns: downstream–expansion and downstream–disorder–downstream. The downstream–expansion pattern is more prevalent in the lower portion of the stratigraphic sequence, while the downstream–disorder–downstream pattern dominates in the upper portion.
(3)
The study area in the Niger Delta developed within a complete 4th-order sea-level cycle, which encompassed four 5th-order cycles. The ECS formed during the first two 5-order cycles, whereas the WCS developed during the latter two, corresponding to the deposition of two deltaic lobes and two channel systems. In response to 5th-order sea-level falls, each sedimentary body exhibits coarser-grained gravelly sandy deposits at its base, transitioning upward to fine-grained siltstone and mudstone as sea level rose during the subsequent 5th-order transgressive phase.
(4)
Within this single submarine fan system, distinct channel systems display variations in planar morphology, sandstone content, migration patterns, and lithological characteristics. We interpret these differences as representing successive evolutionary stages of sediment gravity flows. In correspondence with four-stage sea-level fluctuations, the structural evolution of the submarine fan system in the study area can be divided into four phases: (1) An MTD and terminal fan dominated by debris flows and high-density turbidity currents; (2) ECS formed primarily by high-density turbidity currents, exhibiting sandy-dominated channel morphologies; (3) A terminal fan dominated by high-density turbidity currents with a predominantly sandy morphology; and (4) WCS dominated by both high- and low-density turbidity currents, featuring sand-silt-dominated deposits.
Meanwhile, evaluating channel migration patterns can also serve as a basis for recommending strategies to develop this type of reservoir. After all, the planar morphologies of these two combinations are quite different—and that matters for development. For deepwater reservoirs, where the number of wells is limited, a key point to boost production lies in whether a single perforation can penetrate multiple sand bodies. This means channels with different migration patterns will likely need tailored development approaches. Another aspect to focus on is the connectivity between channels. Given the current focus on efficient development and maximizing residual oil recovery, it is important not to overlook the internal interlayers that may form due to such migration in future geological exploration and development work.

Author Contributions

Conceptualization, F.L. and X.Z.; methodology, F.L. and J.G.; formal analysis, K.Q. and X.Z.; investigation, F.L. and J.G.; resources, S.C. and J.G.; data curation, S.C.; writing—original draft preparation, F.L.; writing—review and editing, K.Q. and M.B.; supervision, X.Z.; funding acquisition, X.Z. All authors have read and agreed to the published version of the manuscript.

Funding

This research is jointly funded by the Science Fund for Distinguished Young Scholars of Sichuan Province (No. 2024NSFJQ0065) and the International Science and Technology Innovation Cooperation Project of Sichuan Province (No. 24GJHZ0465).

Data Availability Statement

Data can be provided upon request from the corresponding author.

Conflicts of Interest

Author Shuchun Cao was employed by the company China National Offshore Oil Corporation. The remaining authors declare that the research was conducted in the absence of any commercial or financial relationships that could be construed as a potential conflict of interest.

References

  1. Abreu, V.; Sullivan, M.; Pirmez, C.; Mohrig, D. Lateral accretion packages (LAPs): An important reservoir element in deep water sinuous channels. Mar. Pet. Geol. 2003, 20, 631–648. [Google Scholar] [CrossRef]
  2. De, L.F.C.; Smith, C.R.; Rowden, A.A.; Bowden, D.A.; Clark, M.R. Submarine canyons: Hotspots of benthic biomass and productivity in the deep sea. Proc. R. Soc. B Biol. Sci. 2010, 277, 2783–2792. [Google Scholar]
  3. Talling, P.J.; Paull, C.K.; Piper, D.J.W. How are subaqueous sediment density flows triggered, what is their internal structure and how does it evolve? Direct observations from monitoring of active flows. Earth-Sci Rev. 2013, 125, 244–287. [Google Scholar] [CrossRef]
  4. Paull, C.K.; Talling, P.J.; Maier, K.L.; Parsons, D.; Xu, J.; Caress, D.W.; Gwiazda, R.; Lundsten, E.M.; Anderson, K.; James, B.P.; et al. Powerful turbidity currents driven by dense basal layers. Nat. Commun. 2018, 9, 4114. [Google Scholar] [CrossRef] [PubMed]
  5. Zhao, X.; Qi, K.; Liu, L.; Xie, T.; Li, M.; Hu, G. Quantitative characterization and controlling factor analysis of the morphology of bukuma-minor channel on southern Niger Delta slope. Interpretation 2018, 6, 57–69. [Google Scholar] [CrossRef]
  6. OPEC World Oil Outlook 2017. Available online: https://www.opec.org/world-oil-outlook.html (accessed on 1 June 2025).
  7. Shanmugam, G. The hyperpycnite problem. J. Palaeogeogr. 2018, 7, 6. [Google Scholar] [CrossRef]
  8. Foreman, B.Z.; Lai, S.Y.J.; Komatsu, Y.; Paola, C. Braiding of submarine channels controlled by aspect ratio similar to rivers. Nat. Geosci. 2015, 8, 700–703. [Google Scholar] [CrossRef]
  9. Zhang, J.J.; Wu, S.H.; Fan, T.E.; Fan, H.J.; Jiang, L.; Chen, C.; Wu, Q.Y.; Lin, P. Research on the architecture of submarine-fan lobes in the Niger Delta Basin, offshore West Africa. J. Palaeogeogr. 2016, 5, 185–204. [Google Scholar] [CrossRef]
  10. Bouchakour, M.; Zhao, X.; Miclăuș, C.; Fei, L.; Gamboa, D.; Yang, B. Compartmentalization of submarine channel splays controlled by growth faults and mud diapir. Mar. Pet. Geol. 2025, 172, 107221. [Google Scholar] [CrossRef]
  11. Clark, I.R.; Cartwright, J.A. Key controls on submarine channel development in structurally active settings. Mar. Pet. Geol. 2011, 28, 1333–1349. [Google Scholar] [CrossRef]
  12. Howlett, D.M.; Gawthorpe, R.L.; Ge, Z.; Rotevatn, A.; Jackson, C.A.-L. Turbidites, topography and tectonics: Evolution of submarine channel-lobe systems in the salt-influenced Kwanza Basin, offshore Angola. Basin Res. 2021, 33, 1076–1110. [Google Scholar] [CrossRef]
  13. Gong, C.L.; Steel, R.J.; Wang, Y.M.; Lin, C.S.; Olariu, C. Grain size and transport regime at shelf edge as fundamental controls on delivery of shelf-edge sands to deepwater. Earth-Sci. Rev. 2016, 157, 32–60. [Google Scholar] [CrossRef]
  14. Morley, C.K.; Alvey, A. Is spreading prolonged, episodic or incipient in the Andaman Sea? Evidence from Deepwater sedimentation. J. Asian Earth Sci. 2015, 98, 446–456. [Google Scholar] [CrossRef]
  15. Deptuck, M.E.; Sylvester, Z.; Pirmez, C.; O’byrne, C. Migration-aggradation history and 3D seismic geomorphology of submarine channels in the pleistocene benin-major canyon, western niger delta slope. Mar. Pet. Geol. 2007, 24, 406–433. [Google Scholar] [CrossRef]
  16. Mutti, E.; Normark, W.R. An integrated approach to the study of turbidite systems. In Seismic Facies and Sedimentary Processes of Submarine Fans and Turbidite Systems; Weimer, P., Link, M.H., Eds.; Springer: New York, NY, USA, 1991; pp. 75–106. [Google Scholar]
  17. Tinterri, R.; Laporta, M.; Ogata, K. Asymmetrical cross-current turbidite facies tract in a structurally-confined Mini-Basin (Priabonian-Rupelian, Ranzano Sandstone, Northern Apennines, Italy). Sediment. Geol. 2017, 352, 63–87. [Google Scholar] [CrossRef]
  18. Pinter, P.R.; Butler, R.W.H.; Hartley, A.J.; Maniscalco, R.; Baldassini, N.; Di Stefano, A. Tracking sand-fairways through adeformed turbidite system: The numidian (Miocene) of CentralSicily, Italy. Basin Res. 2018, 30, 480–501. [Google Scholar] [CrossRef]
  19. Etienne, S.; Collot, J.; Sutherland, R.; Patriat, M.; Bache, F.; Rouillard, P.; Henrys, S.; Barker, D.; Juan, C. Deepwater sedimentation and cenozoic deformation in the southern New Caledonia trough (northern Zealandia, SW Pacific). Mar. Pet. Geol. 2018, 92, 764–779. [Google Scholar] [CrossRef]
  20. Turner, C.C.; Bastidas, R.E.; Connell, E.R.; Petrik, F.E. Proximal submarine fan reservoir architecture and development in the Upper urassic Brae Formation of the Brae fields, South Viking Graben, U.K. North Sea. In Rift-Related Coarse-Grained Submarine Fan Reservoirs; the Brae Play, South Viking Graben, North Sea; Turner, C.C., Cronin, B.T., Eds.; AAPG Memoir: Tulsa, OK, USA, 2018; Volume 115, pp. 213–256. [Google Scholar]
  21. Pizzi, M.; Whittaker, A.C.; Lonergan, L.; Mayall, M.; Mitchell, W.H. New statistical quantification of the impact of active deformation on the distribution of submarine channels. Geology 2021, 49, 926–930. [Google Scholar] [CrossRef]
  22. Gaitan, G.; Adam, J. Extent and variability of Mesozoic-Cenozoicmulti-stage salt diapirs in the Southern PermianBasin, Southern North Sea. Basin Res. 2023, 35, 2078–2117. [Google Scholar] [CrossRef]
  23. El-Azabi, M.H. Sedimentology and sequence stratigraphy of shallow and deeper marine Miocene deposits: Acase study from the St. Paul and Gebel El-Zeitblocks, Gulf of Suez, Egypt. Basin Res. 2024, 36, e12836. [Google Scholar] [CrossRef]
  24. Ramirez-Perez, P.; Cofrade, G.; Martín-Martín, J.D.; Travé, A. Stratigraphic evolution of a salt-walled basin: The influence of diapirism and compressional tectonics on the sedimentary record of the Estopanyà syncline (South-Central Pyrenees). Mar. Pet. Geol. 2024, 163, 106715. [Google Scholar] [CrossRef]
  25. Mayall, M.; Jones, E.; Casey, M. Turbidite channel reservoirs e key elements in facies prediction and effective development. Mar. Pet. Geol. 2006, 23, 821–841. [Google Scholar] [CrossRef]
  26. Janocko, M.; Nemec, W.; Henriksen, S.; Warchol, M. The diversity ofdeep-water sinuous channel belts and slope valley-fill complexes. Mar. Pet. Geol. 2013, 41, 7–34. [Google Scholar] [CrossRef]
  27. McHargue, T.; Pyrcz, M.J.; Sullivan, M.D.; Clark, J.D.; Fildani, A.; Romans, B.W.; Covault, J.A.; Levy, M.; Posamentier, H.W.; Drinkwater, N.J. Architecture of turbidite channel systems on the continental slope: Patterns and predictions. Mar. Pet. Geol. 2011, 28, 728–743. [Google Scholar] [CrossRef]
  28. Prather, B.E.; Deptuck, M.E.; Mohrig, D.; Mohrig, D.; Van, H.B.; Wynn, R.B. Application of the Principles of Seismic Geomorphology to Continental Slope and Base-of-Slope Systems: Case Studies from Seafloor and Near-Seafloor Analogues; SEPM: Tulsa, OK, USA, 2012; Volume 99, pp. 5–9. [Google Scholar]
  29. Hansen, L.; Janocko, M.; Kane, I.; Kneller, B. Submarine channel evolution, terrace development, and preservation of intra-channel thin-bedded turbidites: Mahin and Avon channels, offshore Nigeria. Mar. Geol. 2017, 383, 146–167. [Google Scholar] [CrossRef]
  30. Bouchakour, M.; Zhao, X.M.; Ge, J.W.; Miclauș, C.; Yang, B.Q. Evolution of submarine channel morphology in intra-slope mini-basins: 3D-seismic inter pretation from offshore Niger delta. Mar. Pet. Geol. 2022, 146, 105912. [Google Scholar] [CrossRef]
  31. Zhao, X.; Li, M.; Qi, K.; Liu, L.; Hu, G.; Wu, W.; Zhang, W.; Ge, J. Development of a Distinct Submarine Depositional System on a Topographically Complex Niger Delta Slope. Geol. J. 2020, 55, 3732–3747. [Google Scholar] [CrossRef]
  32. Zhao, X.; Qi, K.; Liu, L.; Gong, C.L.; McCaffrey, W.D. Development of a partially-avulsed submarine channel on the Niger Delta continental slope: Architecture and controlling factors. Mar. Pet. Geol. 2018, 95, 30–49. [Google Scholar] [CrossRef]
  33. Bouchakour, M.; Zhao, X.; Miclăuș, C.; Yang, B. Lateral migration and channel bend morphology around growing folds (Niger Delta continental slope). Basin Res. 2023, 35, 1154–1192. [Google Scholar] [CrossRef]
  34. Janocko, M.; Cartigny, M.B.J.; Nemec, W.; Hansen, E.W.M. Turbidity current hydraulics and sediment deposition in erodible sinuous channels: Laboratory experiments and numerical simulations. Mar. Pet. Geol. 2013, 41, 222–249. [Google Scholar] [CrossRef]
  35. Peakall, J.; Amos, K.J.; Keevil, G.M.; Bradbury, P.W.; Gupta, S. Flow processes and sedimentation in submarine channel bends. Mar. Pet. Geol. 2007, 24, 470–486. [Google Scholar] [CrossRef]
  36. Sylvester, Z.; Covault, J.A. Development of cutoff-related knickpoints during early evolution of submarine channels. Geology 2016, 44, 835–838. [Google Scholar] [CrossRef]
  37. Dorrell, R.M.; Peakall, J.; Burns, C.; Keevil, G.M. A novel mixing mechanism in sinuous seafloor channels: Implications for submarine channel evolution. Geomorphology 2018, 303, 1–12. [Google Scholar] [CrossRef]
  38. Doust, H.; Omatsola, E. Niger delta. In Divergent/Passive Margin Basins; Edwards, J.D., Santogrossi, P.A., Eds.; AAPG Bulletin: Tulsa, OK, USA, 1990; pp. 201–238. [Google Scholar]
  39. Zhao, X.; Qi, K.; Marco, P.; Tan, C.; Xie, T. Submarine channel network evolution above an extensive mass-transport complex: A 3D seismic case study from the Niger delta continental slope. Mar. Pet. Geol. 2019, 104, 231–248. [Google Scholar] [CrossRef]
  40. Damuth, J.E. Neogene gravity tectonics and depositional processes on the deep Niger Delta continental margin. Mar. Pet. Geol. 1994, 11, 320–346. [Google Scholar] [CrossRef]
  41. Spina, V.; Amoyedo, S.; Wibberley, C.; Tozer, R.; Ribes, C.; Maia, R.; Atoyebi, H.; Vincent, E. Characterization of a deep-water turbiditic reservoir under an active hydrodynamic regime (Niger delta). Mar. Pet. Geol. 2025, 172, 107185. [Google Scholar] [CrossRef]
  42. Hooper, R.J.; Fitzsimmons, R.J.; Grant, N.; Vendeville, B.C. The role of deformation in controlling depositional patterns in the south-central Niger Delta, West Africa. J. Struct. Geol. 2002, 24, 847–859. [Google Scholar] [CrossRef]
  43. Evamy, B.D.; Haremboure, J.; Kamerling, P.; Knaap, W.A.; Molloy, F.A.; Rowlands, P.H. Hydrocarbon habitat of Tertiary Niger Delta. AAPG Bull. 1978, 62, 1–39. [Google Scholar] [CrossRef]
  44. Morgan, R. Structural Controls on the Positioning of Submarine Channels on the Lower Slopes of the Niger Delta. Geol. Soc. Lond. Mem. 2004, 29, 45–52. [Google Scholar] [CrossRef]
  45. Briggs, S.E.; Davies, R.J.; Cartwright, J.A.; Morgan, R. Multiple detachment levels and their control on fold styles in the compressional domain of the deepwater west Niger Delta. Basin Res. 2006, 18, 435–450. [Google Scholar] [CrossRef]
  46. MacGregor, D.S.; Robinson, J.; Spear, G. Play fairways of the Gulf of Guinea transform margin. Geol. Soc. Spec. Publ. 2003, 207, 131–150. [Google Scholar] [CrossRef]
  47. Cobbold, P.R.; Clarke, B.J.; Løseth, H. Structural consequences of fluid overpressure and seepage forces in the outer thrust belt of the Niger Delta. Pet. Geosci. 2009, 15, 3–15. [Google Scholar] [CrossRef]
  48. Riboulot, V.; Cattaneo, A.; Berne, S.; Schneider, R.R.; Voisset, M.; Imbert, P.; Grimaud, S. Geometry and chronology of late Quaternary depositional sequences in the Eastern Niger Submarine Delta. Mar. Geol. 2012, 319–320, 1–20. [Google Scholar] [CrossRef]
  49. Hou, G.; Liu, H.; Zuo, Q. A study of distribution characteristics of petroleum in Niger delta basin and their controling factors. Oil Gas Geol. 2005, 26, 374–378. [Google Scholar]
  50. Westerhold, T.; Bickert, T.; Röhl, U. Middle to late Miocene oxygen isotope stratigraphy of ODP site 1085 (SE Atlantic): New constrain on Miocene climate variability and sea-level fluctuations. Palaeogeogr. Palaeoclimatol. Palaeoecol. 2005, 217, 205–222. [Google Scholar] [CrossRef]
  51. Haq, B.U.; Hardenbol, J.; Vail, P.R. Chronology of fluctuating sea levels since the Triassic. Science 1987, 235, 1156–1166. [Google Scholar] [CrossRef]
  52. Zhang, J.J.; Wu, S.H.; Hu, G.Y.; Fan, T.E.; Yu, B.; Lin, P.; Jiang, S.N. Sea-level control on the submarine fan architecture in a deepwater sequence of the Niger Delta Basin. Mar. Pet. Geol. 2018, 94, 179–197. [Google Scholar] [CrossRef]
  53. Othman, A.A.A.; Fathy, M.; Maher, A. Use of spectral decomposition technique for delineation of channels at solar gas discovery, offshore West Nile Delta, Egypt. Egypt. J. Pet. 2016, 25, 45–51. [Google Scholar] [CrossRef]
  54. Maestrelli, D.; Iacopini, D.; Jihad, A.A.; Bond, C.E.; Bonini, M. Seismic and structural characterization of fluid escape pipes using 3d and partial stack seismic from the loyal field (Scotland, UK): A multiphase and repeated intrusive mechanism. Mar. Pet. Geol. 2017, 88, 489–510. [Google Scholar] [CrossRef]
  55. Rodriguez, C.R.; Jackson, C.A.-L.; Bell, R.E.; Rotevatn, A.; Francis, M. Deep-water reservoir distribution on a salt-influenced slope, Santos Basin, offshore Brazil. AAPG Bulletin. 2021, 105, 1679–1720. [Google Scholar] [CrossRef]
  56. Chen, M.; Wu, S.; Wang, R.; Zhang, J.; Xie, P.; Wang, M.; Wang, X.; Xiong, Q.; Yu, J.; Miramontes, E. Sedimentary architecture of submarine lobes affected by bottom currents: Insights from the Rovuma Basin offshore East Africa. Basin Res. 2024, 36, e12829. [Google Scholar] [CrossRef]
  57. Yao, X.; Feng, C.; Qu, H.; Zhang, M.; Li, D. The Middle Miocene lobe-shaped and band-shaped submarine fans in the Lingshui Sag, Qiongdongnan Basin: Source-to-sink system, genesis and implication. Acta Oceanol. Sin. 2024, 43, 61–79. [Google Scholar] [CrossRef]
  58. Moscardelli, L.; Wood, L. New classification system for mass transport complexes in offshore Trinidad. Basin Res. 2008, 20, 73–98. [Google Scholar] [CrossRef]
  59. Boulesteix, K.; Poyatos-Moré, M.; Flint, S.S.; Taylor, K.G.; Hodgson, D.M.; Hasiotis, S.T. Transport and deposition of mud in deep-water environments: Processes and stratigraphic implications. Sedimentology 2019, 66, 2894–2925. [Google Scholar] [CrossRef]
  60. Straub, K.M.; Mohrig, D. Constructional canyons built by sheet-like turbidity currents: Observations from offshore Brunei Darussalam. J. Sediment. Res. 2009, 79, 24–39. [Google Scholar] [CrossRef]
  61. Mutti, E.; Normark, W.R. Comparing examples of modern and ancient turbidite systems: Problems and concepts. In Marine Clastic Sedimentology: Concepts and Case Studies; Springer: Dordrecht, The Netherlands, 1987; pp. 1–38. [Google Scholar]
  62. Prather, B.E.; Booth, J.R.; Steffens, G.S.; Craig, P.A. Classification, lithologic calibration, and stratigraphic succession of seismic facies of intraslope basins, deep-water Gulf of Mexico. AAPG Bull. 1998, 82, 701–728. [Google Scholar] [CrossRef]
  63. Pickering, K.T.; Cantalejo, B. Deep-marine environments of the Middle Eocene Upper Hecho Group, Spanish Pyrenees: Introduction. Earth-Sci. Rev. 2015, 144, 1–9. [Google Scholar] [CrossRef]
  64. Cullis, S.; Colombera, L.; Patacci, M.; McCaffrey, W.D. Hierarchical classifications of the sedimentary architecture of deep-marine depositional systems. Earth-Sci. Rev. 2018, 179, 38–71. [Google Scholar] [CrossRef]
  65. Li, S.L.; Gong, C.L. Flow dynamics and sedimentation of lateral accretion packages in sinuous deep-water channels: A 3D seismic case study from the northwestern South China Sea margin. J. Asian Earth Sci. 2016, 124, 233–246. [Google Scholar] [CrossRef]
  66. Deptuck, M.E.; Steffens, G.S.; Barton, M.; Pirmez, C. Architecture and evolution of upper fan channel-belts on the Niger Delta slope and in the Arabian Sea. Mar. Pet. Geol. 2003, 20, 649–676. [Google Scholar] [CrossRef]
  67. Sylvester, Z.; Pirmez, C.; Cantelli, A. A model of submarine channel-levee evolution based on channel trajectories: Implications for stratigraphic architecture. Mar. Pet. Geol. 2011, 28, 716–727. [Google Scholar] [CrossRef]
  68. Posamentier, H.W.; Kolla, V.; Liu, H.Q. An Overview of Deepwater Turbidite Deposition. Acta Sedimentol. Sin. 2019, 37, 879–903. [Google Scholar]
  69. Alan, D.H.; Thomas, R.K. Sufficient Conditions for River Meandering: A Simulation Approach. Water Resour. Res. 1984, 20, 1659–1667. [Google Scholar] [CrossRef]
  70. Shi, S.Y.; Ding, W.L.; Yu, Y.X.; Zhang, J.X. Deformation and Evolution of Akata Formation Mudstone in the Niger Delta Basin: Insights from Analogue Models. J. Mar. Sci. Eng. 2025, 13, 590. [Google Scholar] [CrossRef]
  71. Zhang, J.J.; Wu, S.H.; Hu, G.Y.; Yue, D.L.; Chen, C.; Chen, M.; Yu, J.T.; Xiong, Q.C.; Wang, L.Q. Sedimentary-tectonic interaction on the growth sequence architecture within the intraslope basins of deep-water Niger Delta Basin. J. Palaeogeogr. 2023, 12, 107–128. [Google Scholar] [CrossRef]
  72. Olayiwola, M.A.; Bamford, M.K.; Durugbo, E.U. Graphic correlation: A powerful tool for biostratigraphic correlation of petroleum exploration and production in the Cenozoic deep offshore Niger Delta, Nigeria. J. Afr. Earth Sci. 2017, 131, 156–165. [Google Scholar] [CrossRef]
  73. Fadiya, L.S.; Salami, B.M. A Neogene calcareous nannofossil biozonation scheme for the deep offshore Niger Delta. J. Afr. Earth Sci. 2015, 112, 251–275. [Google Scholar] [CrossRef]
  74. Corredor, F.; Shaw, J.H.; Bilotti, F. Structural styles in the deep-water fold and thrust belts of the Niger Delta. AAPG Bull. 2005, 89, 753–780. [Google Scholar] [CrossRef]
  75. Bonne, K.P.M. Reconstruction of the evolution of the Niger River and implications for sediment supply to the Equatorial Atlantic margin of Africa during the Cretaceous and the Cenozoic. In Sediment Provenance Studies in Hydrocarbon Exploration and Production; Geological Society of London: London, UK, 2014; Volume 386, pp. 327–349. [Google Scholar]
  76. Shanmugam, G. High-density turbidity currents: Are they sandy debris flows? J. Sediment. Res. 1996, 66, 2–10. [Google Scholar] [CrossRef]
  77. Shanmugam, G. The Bouma sequence and the turbidite mind set. Earth-Sci. Rev. 1997, 42, 201–229. [Google Scholar] [CrossRef]
  78. Lowe, D.R. Sediment gravity flows; II, Depositional models with special reference to the deposits of high-density turbidity currents. J. Sediment. Res. 1982, 52, 343–361. [Google Scholar] [CrossRef]
  79. Keevil, G.M.; Peakall, J.; Best, J.L.; Amos, K.J. Flow structure in sinuous submarine channels: Velocity and turbulence structure of an experimental submarine channel. Mar. Geol. 2006, 229, 241–257. [Google Scholar] [CrossRef]
  80. Stevenson, C.J.; Jackson, C.A.-L.; Hodgson, D.M.; Hubbard, S.M.; Eggenhuisen, J.T. Deep-water sediment bypass. J. Sediment. Res. 2015, 85, 1058–1081. [Google Scholar] [CrossRef]
  81. Catuneanu, O.; Abreu, V.; Bhattacharya, J.P.; Blum, M.D.; Dalrymple, R.W.; Eriksson, P.G.; Fielding, C.R.; Fisher, W.L.; Galloway, W.E.; Gibling, M.R.; et al. Towards the standardization of sequence stratigraphy. Earth-Sci. Rev. 2009, 92, 1–33. [Google Scholar] [CrossRef]
Figure 1. (a) Regional map showing the location of the Niger Delta and its main structural zones. (b) Regional structural cross-section for the Niger Delta Basin. There are three zones from north to south, extensional, transitional and compressional, respectively. The interval of interest lies in the most basinward part of the transitional zone.
Jmse 13 02135 g001
Figure 2. Generalized Stratigraphic Column of the Niger Delta (Not to Scale), and Major Eustatic Sea-Level Curves (adapted from Zhang et al., 2018 [52], with permission from ELSEVIER/2025), The red line shows the strata of the study area.
Jmse 13 02135 g002
Figure 3. (a) RMS attribute plan view extracted between the top and bottom layers; the reddish high-amplitude areas indicate banded water channels, with boundaries shown by dashed lines; (b) upstream-directed seismic section; dashed lines indicate the positions of the top and bottom layers; (c) downstream-directed seismic section; dashed lines indicate the positions of the top and bottom layers.
Jmse 13 02135 g003
Figure 4. Morphological Characteristics of the channel System: (a) RMS amplitude attribute map of the East channel system, with the red dashed line indicating the midpoint of the channel. The bottom panel shows the curvature values for different bends and the curvature variation along the flow direction; (b) RMS amplitude attribute map of the West channel system, with the bottom panel showing the curvature values for different bends and the curvature variation along the flow direction.
Jmse 13 02135 g004
Figure 5. Sedimentary Characteristics of Channel complex within the East Channel System: (a) RMS planar attribute map of ECC1 channel complex, with white dashed lines indicating channel boundaries and red dashed lines showing breached fan boundaries; (b) RMS planar attribute map of ECC2 channel complex, with dashed lines indicating channel boundaries; (c) RMS planar attribute map of ECC3 channel complex, dashed lines indicate channel boundaries; and (d) upstream, (e) midstream, (f) maximum bend, and (g) downstream seismic profiles of the channel.
Jmse 13 02135 g005
Figure 6. Sedimentary Characteristics of Channel complex within the West Channel System: (a) RMS attribute map of WCC1 channel complex, with dashed lines indicating boundaries; the same representation is used for (b) RMS attribute map of WCC2 channel complex, (c) RMS attribute map of WCC3 channel complex, and (d) RMS attribute map of WCC4 channel complex; (e) Midstream seismic profile of the WCS channel-lobe system; (f) Seismic profile of the WCS channel system; (g) Downstream seismic profile of the WCS channel-lobe system; (h) Upstream seismic profile of the WCS channel-lobe system.
Jmse 13 02135 g006
Figure 7. Depositional Characteristics of Expansive Migration Patterns: (a) RGB composite attribute map of the middle reaches of the ECS channel system; (b) Regular expansive migration morphology and its corresponding seismic profile; (c) Irregular expansive migration morphology and its corresponding seismic profile.
Jmse 13 02135 g007
Figure 8. Downstream Migration Depositional Characteristics: (a) RGB fusion attribute map of the ECS and WCS channel systems, with rectangles marking different downstream migration positions; (b) Low-bend regular downstream migration and corresponding seismic profile; (c) Low-bend offset downstream migration and corresponding seismic profile; (d) High-deflection downstream migration with high curvature and corresponding seismic profile; (e) Irregular downstream migration with high curvature and corresponding seismic profile; (f) Downstream migration with high curvature and corresponding seismic profile.
Jmse 13 02135 g008
Figure 9. (a) Statistics of curvature, amplitude, and wavelength for all migration pattern regions; gray background indicates data from expansive migration; (b) Curvature statistics for different migration types; (c) Wavelength statistics for different migration types; (d) Amplitude statistics for different migration types.
Jmse 13 02135 g009
Figure 10. Combination relationships of channel migration types: (a) Combination of expansion-downstream migration; (b) Combination of downstream migrations. Yellow indicates the earlier channels, and white indicates the latest channels.
Jmse 13 02135 g010
Figure 11. (a) Seismic profile upstream of the source, along with corresponding wellbore logs; profile location shown in Figure 4b. channels are marked in yellow, while alluvial fans are marked in orange; (b) Seismic profile downstream of the source, along with corresponding wellbore logs; profile location shown in Figure 4a; (c) Log curves and lithological interpretations for Wells A, B, and C, along with corresponding sea-level change curves sourced from [52]. Detailed sea-level variations for individual wells have been established; here, seismic profiles and sea-level changes are used to correlate dispersed wells. Corresponding (d) sedimentary facies interpretations for Wells A, B, and C.
Jmse 13 02135 g011
Figure 12. Lithological types in the study area: ECS: (A1) Matrix-supported sandy conglomerate (A2) Massive, clast-rich coarse sandstone (A3) Massive medium-coarse sandstone, and in WCS: (A4) Massive mud-chip conglomeratic sandstone (A5) Massive medium sandstone (A6) Interbedded sandstone-mudstone (A7) Interlaminated siltstone-mudstone.
Jmse 13 02135 g012
Figure 13. Sedimentary Evolution Model of Waterways in the Study Area. (a): Early forced regression (EFR) stage, dominated by debris flows and high-density turbidity currents, developing coarse-grained lobes and coarse-grained sand-prone deposits (CCSs). The black curve shows changes in the 4th-level sea level, while the red curve illustrates different phases within a 4th-level sea level cycle. (b): Late forced regression (LFR) stage, characterized by high-density turbidity currents, forming sand-dominated CCSs and terminal sand-dominated lobe deposits, potentially accompanied by an expansion-along-flow migration pattern. (c): Lowstand normal regression (LNR)-early transgression (ET) stage, characterized by high-density turbidity currents, forming sand-dominated CCSs and sand-dominated lobe deposits. (d): Early transgression (ET)—highstand normal regression (HNR) stage, characterized by low-density turbidity currents and muddy turbidity currents, forming mixed sand-mud CCSs, with a more likely combination of different alongstrike migration patterns. The red box highlights the channel morphology, with a schematic diagram drawn on the left side.
Jmse 13 02135 g013
Table 1. Summary of seismic facies interpretation and depositional environment within the study interval, with examples of cross-sections and RMS maps.
Seismic FaciesAmplitude and Geometry ReflectionsSeismic SectionRMS Attribute Map
Submarine ChannelU-shaped incised fills exhibit basal erosion surfaces truncating underlying strata, with internally discontinuous, high-amplitude subparallel reflections, indicative of cut-and-fill deposition during channel evolutionJmse 13 02135 i001Jmse 13 02135 i002
LobesWedge-shaped deposits overlie the substrate with continuous, high-amplitude subparallel reflections, extending over broad lateral areas, suggesting sustained sediment delivery during lobe developmentJmse 13 02135 i003Jmse 13 02135 i004
Mass-transport depositsElongated or wedge-shaped deposits exhibit internally continuous but chaotic low-amplitude reflections, with evident erosion of underlying strata, suggesting rapid deposition following erosional events.Jmse 13 02135 i005Jmse 13 02135 i006
MudHorizontally stratified, with a small thickness range, in parallel contact with the upper and lower strataJmse 13 02135 i007Jmse 13 02135 i008
Disclaimer/Publisher’s Note: The statements, opinions and data contained in all publications are solely those of the individual author(s) and contributor(s) and not of MDPI and/or the editor(s). MDPI and/or the editor(s) disclaim responsibility for any injury to people or property resulting from any ideas, methods, instructions or products referred to in the content.