Article

Decadal Evaluation of Sea Surface Temperature Products from MWRI Onboard FY-3B/C/D Satellites

1
School of Marine Technology and Geomatics, Jiangsu Ocean University, Lianyungang 222005, China
2
National Satellite Meteorological Center (National Centre for Space Weather), China Meteorological Administration, Beijing 100081, China
3
Innovation Center for FengYun Meteorological Satellite (FYSIC), China Meteorological Administration, Beijing 100081, China
4
Key Laboratory of Radiometric Calibration and Validation for Environmental Satellite, China Meteorological Administration, Beijing 100081, China
*
Author to whom correspondence should be addressed.
J. Mar. Sci. Eng. 2025, 13(11), 2136; https://doi.org/10.3390/jmse13112136
Submission received: 22 September 2025 / Revised: 7 November 2025 / Accepted: 10 November 2025 / Published: 12 November 2025
(This article belongs to the Section Ocean Engineering)

Abstract

Microwave Radiation Imagers (MWRIs) onboard the FY-3B, FY-3C, and FY-3D satellites are the primary sensors for sea surface temperature (SST) observation. Benefiting from the resolution of several key calibration issues in brightness temperature products, MWRI SST records spanning more than a decade have been reprocessed. In this study, these reprocessed SST products are evaluated using direct comparison and the extended triple collocation (ETC) method, along with additional error analyses. Compared with iQuam SST, the reprocessed MWRI SST products from the three satellites show total root mean square errors (RMSEs) of 0.80–0.82 °C and total biases of −0.12 °C to 0.00 °C. ETC analyses based on MWRI, ERA5, and Argo SSTs indicate random errors of 0.76–0.78 °C. Furthermore, the reprocessed MWRI SST products demonstrate temporal stability and exhibit minimal crosstalk effects from sea surface wind speed, columnar water vapor, and columnar cloud liquid water in SST retrievals. Compared with previous versions, the reprocessed products show significant improvements, with consistent performance across FY-3B, FY-3C, and FY-3D. However, differences in SST observations due to the varying local times of the ascending nodes among the three satellites should be corrected in practical applications.

1. Introduction

Sea surface temperature (SST) is a vital environmental variable that plays a significant role in regulating global climate dynamics and supporting marine ecosystems. As a primary driver of atmospheric circulation, SST influences large-scale weather phenomena, including the intensity of tropical cyclones, the development of El Niño–Southern Oscillation (ENSO) events, and the variability of monsoon systems [1,2,3]. It also serves as a key determinant of marine biodiversity and ecosystem health [4]. In addition, SST is closely connected to human activities: elevated SSTs contribute to sea-level rise through thermal expansion and glacial melt, thereby intensifying coastal erosion and increasing the risk of flooding [5,6,7]. Given its central role in Earth’s climate system and marine sustainability, SST is a critical indicator for assessing global environmental change. Long-term SST monitoring is essential for improving climate models and enhancing the prediction of extreme weather events [8].
In situ measurements of SST serve as essential sources of SST data, although they are limited in spatial coverage [9,10], especially at high latitudes [11,12]. In contrast, remotely sensed SSTs offer global coverage, high spatial resolution, and frequent sampling. With advancements in sensor performance and data processing algorithms, SST observations from radiometers operating in the microwave and infrared bands onboard various satellite constellations have become fundamental to numerous applications [13,14]. Benefiting from the longer wavelengths of electromagnetic radiation, satellite-based microwave radiometers can observe SST under all weather conditions [15]. Since the 1980s, satellite-based microwave radiometers have provided valuable long-term SST observations, with accuracies between 0.4 °C and 0.6 °C [16,17,18].
In China, the FengYun-3 (FY-3) series of satellites are equipped with the Microwave Radiation Imager (MWRI) for SST observation. The FY-3 series represents the second generation of Chinese polar-orbiting meteorological satellites [19]. The first satellite, FY-3A, was launched on 25 May 2008 and was designated as a research satellite [20]. Subsequently, FY-3B, FY-3C, FY-3D, FY-3F, and FY-3G, each equipped with MWRI, were launched on 5 December 2010, 23 September 2013, 15 November 2017, 3 August 2023, and 16 April 2023, respectively. To support all-weather precipitation measurements, the MWRI onboard FY-3G includes additional channels: atmospheric temperature channels near 54 GHz, weak precipitation channels at 118 GHz and 166 GHz, and humidity channels around 183 GHz [21]. Extensive calibration and validation efforts have been conducted to assess the brightness temperature (BT) products from MWRI instruments onboard FY-3 satellites [22,23,24,25]. He et al. (2023) performed a comprehensive evaluation of long-term operational MWRI BT products from FY-3B and FY-3D, using BT products of Advanced Microwave Scanning Radiometer 2 (AMSR2) as a reference [24]. They reported that the mean bias of MWRI BT products over ocean ranges from −10.63 K to −2.22 K, depending on the channel frequency. Their analysis also demonstrated a notable improvement in the performance of FY-3D MWRI BT products compared to those of FY-3B. Based on operational BT products, Zhang et al. (2018) developed an empirical SST retrieval algorithm for FY-3C MWRI [26]. This algorithm was later applied to generate operational SST products for the MWRI instruments on FY-3C and FY-3D. Zhao et al. (2024) validated the FY-3D MWRI SST products against SSTs from AMSR2 and in situ SST Quality Monitor (iQuam) using both extended triple collocation (ETC) and direct comparison methods [27]. Their results showed that for ascending passes, the total bias and root mean square error (RMSE) were −0.33 °C and 1.30 °C, respectively, while for descending passes, the values were 0.05 °C and 1.22 °C. Li et al. (2024) attempted to improve the performance of FY-3D MWRI SST retrievals, and the results confirmed the potential for further improvement [28].
Benefiting from a national program titled Retrospective Calibration of Historical Chinese Earth Observation Satellite Data, launched in 2018, the calibration algorithms of the FY-3 MWRI instruments were significantly improved, leading to the generation of an updated version of BT products [29,30,31,32]. Xia et al. (2023) evaluated the updated BT products from MWRI onboard FY-3B, FY-3C, and FY-3D, using Level 1C BT data from GMI as a reference [33]. The results indicate that the mean BT biases between MWRI and GMI are generally less than 0.5 K, and the RMSEs are less than 1.5 K. Based on the improved MWRI BT products, Zhang et al. (2024) refined the SST retrieval algorithm by accounting for the influence of Earth incidence angle and subsequently produced a decadal SST dataset from MWRI onboard FY-3B, FY-3C, and FY-3D [34]. In this study, the accuracy of the reprocessed decadal SST products is evaluated using direct comparison and the ETC method. A comprehensive error analysis is conducted, and improvements over the previous version of the SST products are assessed. Section 2 introduces the datasets and methods used in the study, while Section 3 and Section 4 present the results and discussion, respectively.

2. Materials and Methods

2.1. Datasets

2.1.1. MWRI SST

The MWRI is the first-generation conical-scanning microwave imager onboard China’s FY-3 meteorologic satellites. It receives microwave radiation from the Earth at frequencies of 10.65, 18.7, 23.8, 36.5, and 89.0 GHz, with dual polarization, at an Earth incidence angle of 53.0°, with a variation of approximately ±0.8°. Unlike microwave imagers on other platforms, MWRI features a uniquely designed calibration system in which the main reflector observes both cold and hot calibration targets [23]. Table 1 lists the key parameters of MWRI.
MWRI was carried as a primary payload on FY-3B, FY-3C, and FY-3D to provide brightness temperature observations for direct assimilation into numerical weather prediction (NWP) models [35]. All three satellites operate in sun-synchronous orbits but with different Local Times of the Ascending Node (LTAN). This variation reduces the global ocean observation revisit time and improves temporal coverage. Information on FY-3B, FY-3C, and FY-3D is presented in Table 2.
Operational MWRI SST products from the National Satellite Meteorological Center (NSMC) are derived from the empirical algorithm of [26]. Incorporating findings from multiple calibration studies, a new version of the MWRI BT products was reprocessed after resolving key calibration issues, including the emissivity of the hot-load reflector, backlobe intrusion from the Earth view, and the nonlinear characteristics of the instrument. Based on these reprocessed BT products, Zhang et al. (2024) improved their SST retrieval algorithm by incorporating the effect of Earth incidence angle [34]. Specifically, the incidence angle was introduced as an additional proportional term in the improved empirical algorithm. Additionally, the collocations of updated BT products and in situ SST are used for retrieval algorithm training. Based on this improved algorithm, the MWRI SST archives from FY-3B, FY-3C, and FY-3D were reprocessed and are planned for release as an independent SST dataset. The quality of the reprocessed SST products is categorized into three groups, labeled with quality flags 50, 51, and 52. These quality levels correspond to absolute deviations from the Copernicus Climate Change Service (C3S) V2.0 SST product of less than 1.5 °C, between 1.5 °C and 2.5 °C, and greater than 2.5 °C, respectively. SSTs with quality flags 50, 51, and 52 account for approximately 71%, 13%, and 16% of the dataset, respectively [34].

2.1.2. iQuam SST

In situ SST measurements are essential for calibrating space-based sensors and validating remotely sensed SST products. The quality of in situ SSTs varies with platform type, sensor manufacturer, deployment method, calibration frequency, and the reporting organization. iQuam, developed by the National Oceanic and Atmospheric Administration (NOAA), is designed to enhance the quality control of in situ SST observations. iQuam integrates SST measurements from eight platforms: conventional ships, drifting buoys, tropical moorings (T-M), coastal moorings (C-M), Argo floats, high-resolution drifters (HR-D), Integrated Marine Observing System (IMOS) ships, and Coral Reef Watch (CRW) coastal buoys. The system performs multiple quality control procedures, including Bayesian reference and buddy checks, duplicate removal, plausibility checks, platform track validation, and SST spike detection. It also supports near-real-time online monitoring of quality-controlled SST measurements and distributes reformatted Global Telecommunication System (GTS) SST data with quality flags to users [10].
Despite quality control efforts, inconsistencies in in situ SST data from various international sources still persist. Xu and Ignatov (2016) analyzed the error characteristics of iQuam SST using triple collocation with SSTs from the NOAA-17 Advanced Very High Resolution Radiometer (AVHRR) and the Envisat Advanced Along-Track Scanning Radiometer (AATSR). They found that the standard deviations of iQuam in situ SSTs were 0.75 K for ships, 0.21–0.22 K for drifters and Argo floats, and 0.17 K and 0.40 K for T-M and C-M, respectively [36]. Zhao et al. (2024) conducted an ETC analysis based on SST measurements from iQuam, AMSR2, and MWRI onboard FY-3D. The results showed that the random errors were 0.28 °C for drifters, T-M, Argo floats, and HR-D; 0.51 °C and 0.52 °C for C-M and IMOS ships, respectively; and 0.83 °C for conventional ships [27]. Considering the typical accuracy of satellite-based SST observations from microwave imagers (0.3–0.6 °C), only in situ SST data from drifters, Argo floats, T-M, and HR-D are used in this study.

2.1.3. ERA5 SSTint

ERA5, the fifth-generation reanalysis from the European Centre for Medium-Range Weather Forecasts, currently covers data from 1950 onwards [37]. It replaces the earlier ERA-Interim reanalysis and is based on the Integrated Forecasting System (IFS) Cycle 41r2, which became operational in 2016. Key improvements in ERA5 include a significantly higher horizontal resolution of 31 km, compared to 80 km in ERA-Interim, as well as hourly outputs and ensemble-based uncertainty estimates at half the horizontal resolution. ERA5 demonstrates improved forecasting skill, offering up to a one-day gain in reforecast accuracy over ERA-Interim. It also exhibits a better fit to radiosonde measurements of temperature, wind, and humidity in the troposphere, and shows superior agreement with buoy observations of ocean wave height. Additionally, ERA5 features enhanced global-mean correlation with precipitation data from the Global Precipitation Climatology Project (GPCP) and effectively captures low-frequency climate variability [38].
ERA5 assimilates diverse satellite observations, including temperature sounder radiances, humidity sounder radiances, microwave imager radiances, and infrared sounder radiances from multiple satellite platforms. BT products from satellite-based microwave imagers such as TMI, AMSR2, GMI, and SSMI are incorporated in ERA5 assimilation. Regarding sensors onboard FY-3 satellites, the Microwave Humidity Sounder (MWHS) and MWHS-II on FY-3B and FY-3C provide humidity sounder radiances [38]. However, the MWRIs onboard FY-3 satellites are not included in ERA5 assimilation. Therefore, ERA5 SST can serve as an independent reference for evaluating MWRI SST products. In situ measurements of 10 m wind over the sea, 2 m humidity, and surface pressure over land and oceans are directly assimilated by ERA5, but in situ SST measurements are not. For atmospheric reanalysis boundary conditions, SST datasets from the Hadley Centre Sea Ice and Sea Surface Temperature dataset version 2 (HadISST2) covering 1979 to August 2007, and the operational sea surface temperature and sea ice analysis (OSTIA) from September 2007 to the present, are used. ERA5 SST is derived from an ocean model corrected by increments calculated as the difference between OSTIA SST and the ocean analysis [39]. The OSTIA system integrates satellite SST data from international agencies via the GHRSST framework, incorporating microwave and infrared measurements with uncertainty estimates, as well as in situ SST data from ships, drifting buoys, and moored buoys [40]. MWRI SST products are not used in the OSTIA system.
ERA5 provides two ocean surface temperature parameters: the foundation SST and the skin temperature [39,41]. The ERA5 skin temperature is derived from an ocean mixed layer model and represents a theoretical temperature at the precise air–sea interface (hereafter SSTint) [41]. Compared with Argo SST, which is not assimilated in ERA5, the bias and RMSE of ERA5 foundation SST during sunset are −0.13 °C and 0.41 °C, respectively. During sunrise, the bias relative to Argo SST is near zero, and the RMSE decreases to 0.35 °C [42]. Validation results show that ERA5 SSTint has a bias of -0.21 °C and a standard deviation of 0.36 °C [43]. In this study, ERA5 SSTint is adopted as the reference, since it is closer to the sub-skin SST measured by MWRI than the foundation SST.
This study employs ERA5 hourly data at single levels, with all variables mapped onto a regular geographic grid at a spatial resolution of 0.25°. ERA5 SSTint is used as an independent reference, while variables such as columnar water vapor, columnar cloud liquid water, precipitation, and the eastward and northward components of 10 m wind are utilized for quality control and error analysis.

2.2. Methodology

2.2.1. Collocation and Quality Control

To obtain synchronous SST records from MWRI, iQuam, and ERA5, spatial–temporal matching was initially performed. The matching between MWRI SST and iQuam SST from drifters, T-M, HR-D, and Argo floats was conducted over the global ocean. Subsequently, the collocated MWRI and iQuam SSTs were matched with ERA5 SSTint to construct a triple collocation dataset. The pixel center location and observation time of the MWRI SSTs were used as references. SSTs from iQuam and ERA5 within 25 km of the MWRI pixel center and within 30 min of the MWRI observation time were paired. Quality control was also applied during collocation. Collocations were discarded if any of the following criteria were met.
(1)
MWRI SST with quality flags of 51 or 52, indicating medium and poor quality, respectively.
(2)
iQuam SST quality level below 5.
(3)
iQuam SST measurement depth greater than 5 m.
(4)
Presence of precipitation as indicated by ERA5 total precipitation.
(5)
Collocations located less than 50 km from the coastline.
Condition 1 was applied to select the highest-quality MWRI SST data, while retrievals affected by rainfall or land contamination were excluded under Conditions 4 and 5. Condition 2 follows the iQuam recommendation, which suggests using quality level 5 for the validation of remotely sensed SST. Condition 3 was applied to minimize the difference between SST and the measurement depth.
In this study, reprocessed Level 2 orbital SST products from MWRI onboard FY-3B (27 November 2011 to 4 August 2019), FY-3C (14 October 2013 to 16 December 2019), and FY-3D (16 January 2018 to 16 May 2022) were collected and matched with iQuam and ERA5 SST data. The number of collocated observations is listed in Table 3. Given the differing performance of MWRI during ascending and descending passes, the collocations were separated into two groups accordingly.

2.2.2. Evaluation Method

Microwave radiometer-derived SST corresponds to the sub-skin temperature at a depth of ~1 mm. In contrast, iQuam SST corresponds to the SST measured at depths of 0.2–5 m, while ERA5 SSTint represents the temperature at the air–sea interface (the top layer of the ocean water) [40,41]. Differences in the representative measurement depths of MWRI, iQuam, and ERA5 SSTint inherently result in temperature discrepancies due to the effects of cool-skin and diurnal warming processes [44,45,46]. These inherent differences introduce systematic errors when evaluating MWRI SST against iQuam and ERA5 SST. Additionally, MWRI SST represents an average over an area determined by the sensor’s footprint size, whereas iQuam SST is a point measurement, and ERA5 SST has a spatial resolution of approximately 30 km. These differences in spatial representation also introduce noise into the evaluation. To estimate independent error, topical collocation (TC) and ETC methods have been widely used in the evaluation of remotely sensed SST. However, TC and ETC are limited in capturing the full spectrum of MWRI performance characteristics. Therefore, this study employs both direct comparison and ETC methods for comprehensive evaluation.
(a)
Direct comparison
In the direct comparison method, the bias and RMSE of MWRI SST relative to iQuam and ERA5 SSTs are calculated using the following equations.
Bias   =   i = 0 n SST M W R I , i SST r e f e r e n c e , i n
RMSE = i = 0 n SST M W R I , i SST r e f e r e n c e , i 2 n
where SST MWRI is MWRI SST. SST reference represents iQuam SST or ERA5 SSTint.
(b)
Extended triple collocation
ETC assumes that three independent SST measurements are linearly related to an unknown true value, T. The common affine error model describing each measurement can be expressed as [47,48].
X i = α i + β i T + ε i
where X i ( i     { 1 ,   2 ,   3 } ) denotes collocated SST measurements from MWRI, iQuam, and ERA5, respectively. The parameters α i and β i represent the intercept and slope, respectively, of measurement i relative to the truth, while ε i is the random noise.
The covariance between different measurement systems is given by:
Q ij = Cov X i , X j = E X i X j E X i E X j = β i β j σ T 2 + β j Cov T , ε i + β i Cov T , ε j + Cov ε i , ε j
σ T 2 = Var T
where Cov represents covariance and E represents expected value. Assuming that the measurement errors are mutually independent, uncorrelated with the true value, and have zero mean, we have Cov T , ε i = 0 , Cov T , ε j = 0 , Cov ε i , ε j = 0 , and E ε i = 0 . So, Equation (4) simplifies to,
Q ij = β i β j σ T 2                               f o r   i j β i 2 σ T 2 + σ ϵ i 2                 f o r   i = j
where σ ε i 2   =   Var ( ε i ) . Letting θ i   =   β i ε T , then Equation (6) can be rewritten as:
Q ij = θ i θ j                                       f o r   i j θ i 2 + σ ε i 2                       f o r   i = j
By solving the six equations for Q ij with six unknown variables, θ i , σ ε i , the error standard deviations (ESD) of three measurement systems can be calculated as:
E S D =   σ ε   =   Q 11 Q 12 Q 13 Q 23 Q 22 Q 12 Q 23 Q 13 Q 33 Q 13 Q 23 Q 12
In addition to σ ε , ETC defines a scaled, unbiased signal-to-noise ratio ( SNR sub ) that incorporates measurement sensitivity and can be used to assess the system’s capability to detect variation in the target variable [48].
SNR sub = Q 12 Q 13 Q 11 Q 23 s i g n Q 13 Q 23 Q 12 Q 23 Q 22 Q 13 s i g n Q 12 Q 23 Q 13 Q 23 Q 33 Q 12 2
where sign indicates sign function. SNR sub has been used in previous studies [27,42] as an indicator to evaluate the ability of a measurement system to detect SST variations. In this study, both of ESD and SNR sub are employed in the ETC analysis.

3. Results

3.1. ETC Analysis

ETC requires that the three SST datasets used in the analysis be independent of one another. In this study, SSTs from iQuam, ERA5, and MWRI onboard FY-3B, FY-3C, and FY-3D are collocated to construct triple collocations. Observations from MWRI onboard FY-3B, FY-3C, and FY-3D are not assimilated into the ERA5 system. Moreover, while ERA5 assimilates most in situ SST measurements, it does not assimilate SST data collected by Argo floats. Therefore, triple collocations comprising MWRI SST, iQuam Argo SST, and ERA5 SSTint are used in the ETC analysis.
ESD serves to estimate random errors in SST measurement systems, whereas SNR sub is used to evaluate their capacity for detecting SST variations. Table 4 presents the ETC results, grouped by satellite and orbit direction. The ESDs of the three MWRIs (onboard FY-3B, FY-3C, and FY-3D) show minor variations, ranging from 0.76 °C to 0.78 °C, indicating that their random errors are comparable. Notably, the ESDs for ascending and descending passes of FY-3B and FY-3D are identical, while the differences between passes for FY-3C are also negligible. This suggests that the random error of MWRI SST retrieval is consistent between ascending and descending orbits across all three satellites. The SNR sub values for the three MWRIs range from 0.9921 to 0.9943, demonstrating high sensitivity to SST variation.
For Argo, the ESD ranges from 0.28 °C to 0.38 °C and the SNR sub ranges from 0.9984 to 0.9991, which are consistent with previous findings reported in [27,42]. ERA5 SSTint shows ESDs between 0.19 °C and 0.22 °C and SNR sub values between 0.9993 and 0.9997, in agreement with the results in [42].

3.2. Direct Comparison

As shown in Figure 1, the comparison between MWRI SSTs from all three satellites and iQuam SSTs reveals similar performance. The total biases of MWRI SST relative to iQuam SST range from −0.11 °C to 0.00 °C, with biases from the descending passes showing smaller absolute values. The RMSEs of MWRI SST relative to iQuam SST vary between 0.80 and 0.82 °C. Direct comparisons between MWRI SST and ERA5 SST were also conducted, and the results are listed in Table 5. The biases of MWRI SST relative to ERA5 SSTint range from 0.15 °C to 0.23 °C, while the RMSEs range from 0.79 °C to 0.83 °C. Furthermore, direct comparison of ERA5 SSTint with Argo SST reveals a total bias of −0.24 °C and a total RMSE of 0.47 °C. In theory, MWRI measures sub-skin SST, which is expected to be closer to interface SST than to bulk SST. However, the biases of MWRI SST relative to iQuam SST have smaller absolute values than those relative to ERA5 SSTint, indicating that MWRI SST is more consistent with bulk SST than with interface SST. This discrepancy may arise because the MWRI SST retrieval algorithm is empirical rather than physically based, relying on in situ SST measurements as ground truth during algorithm training.
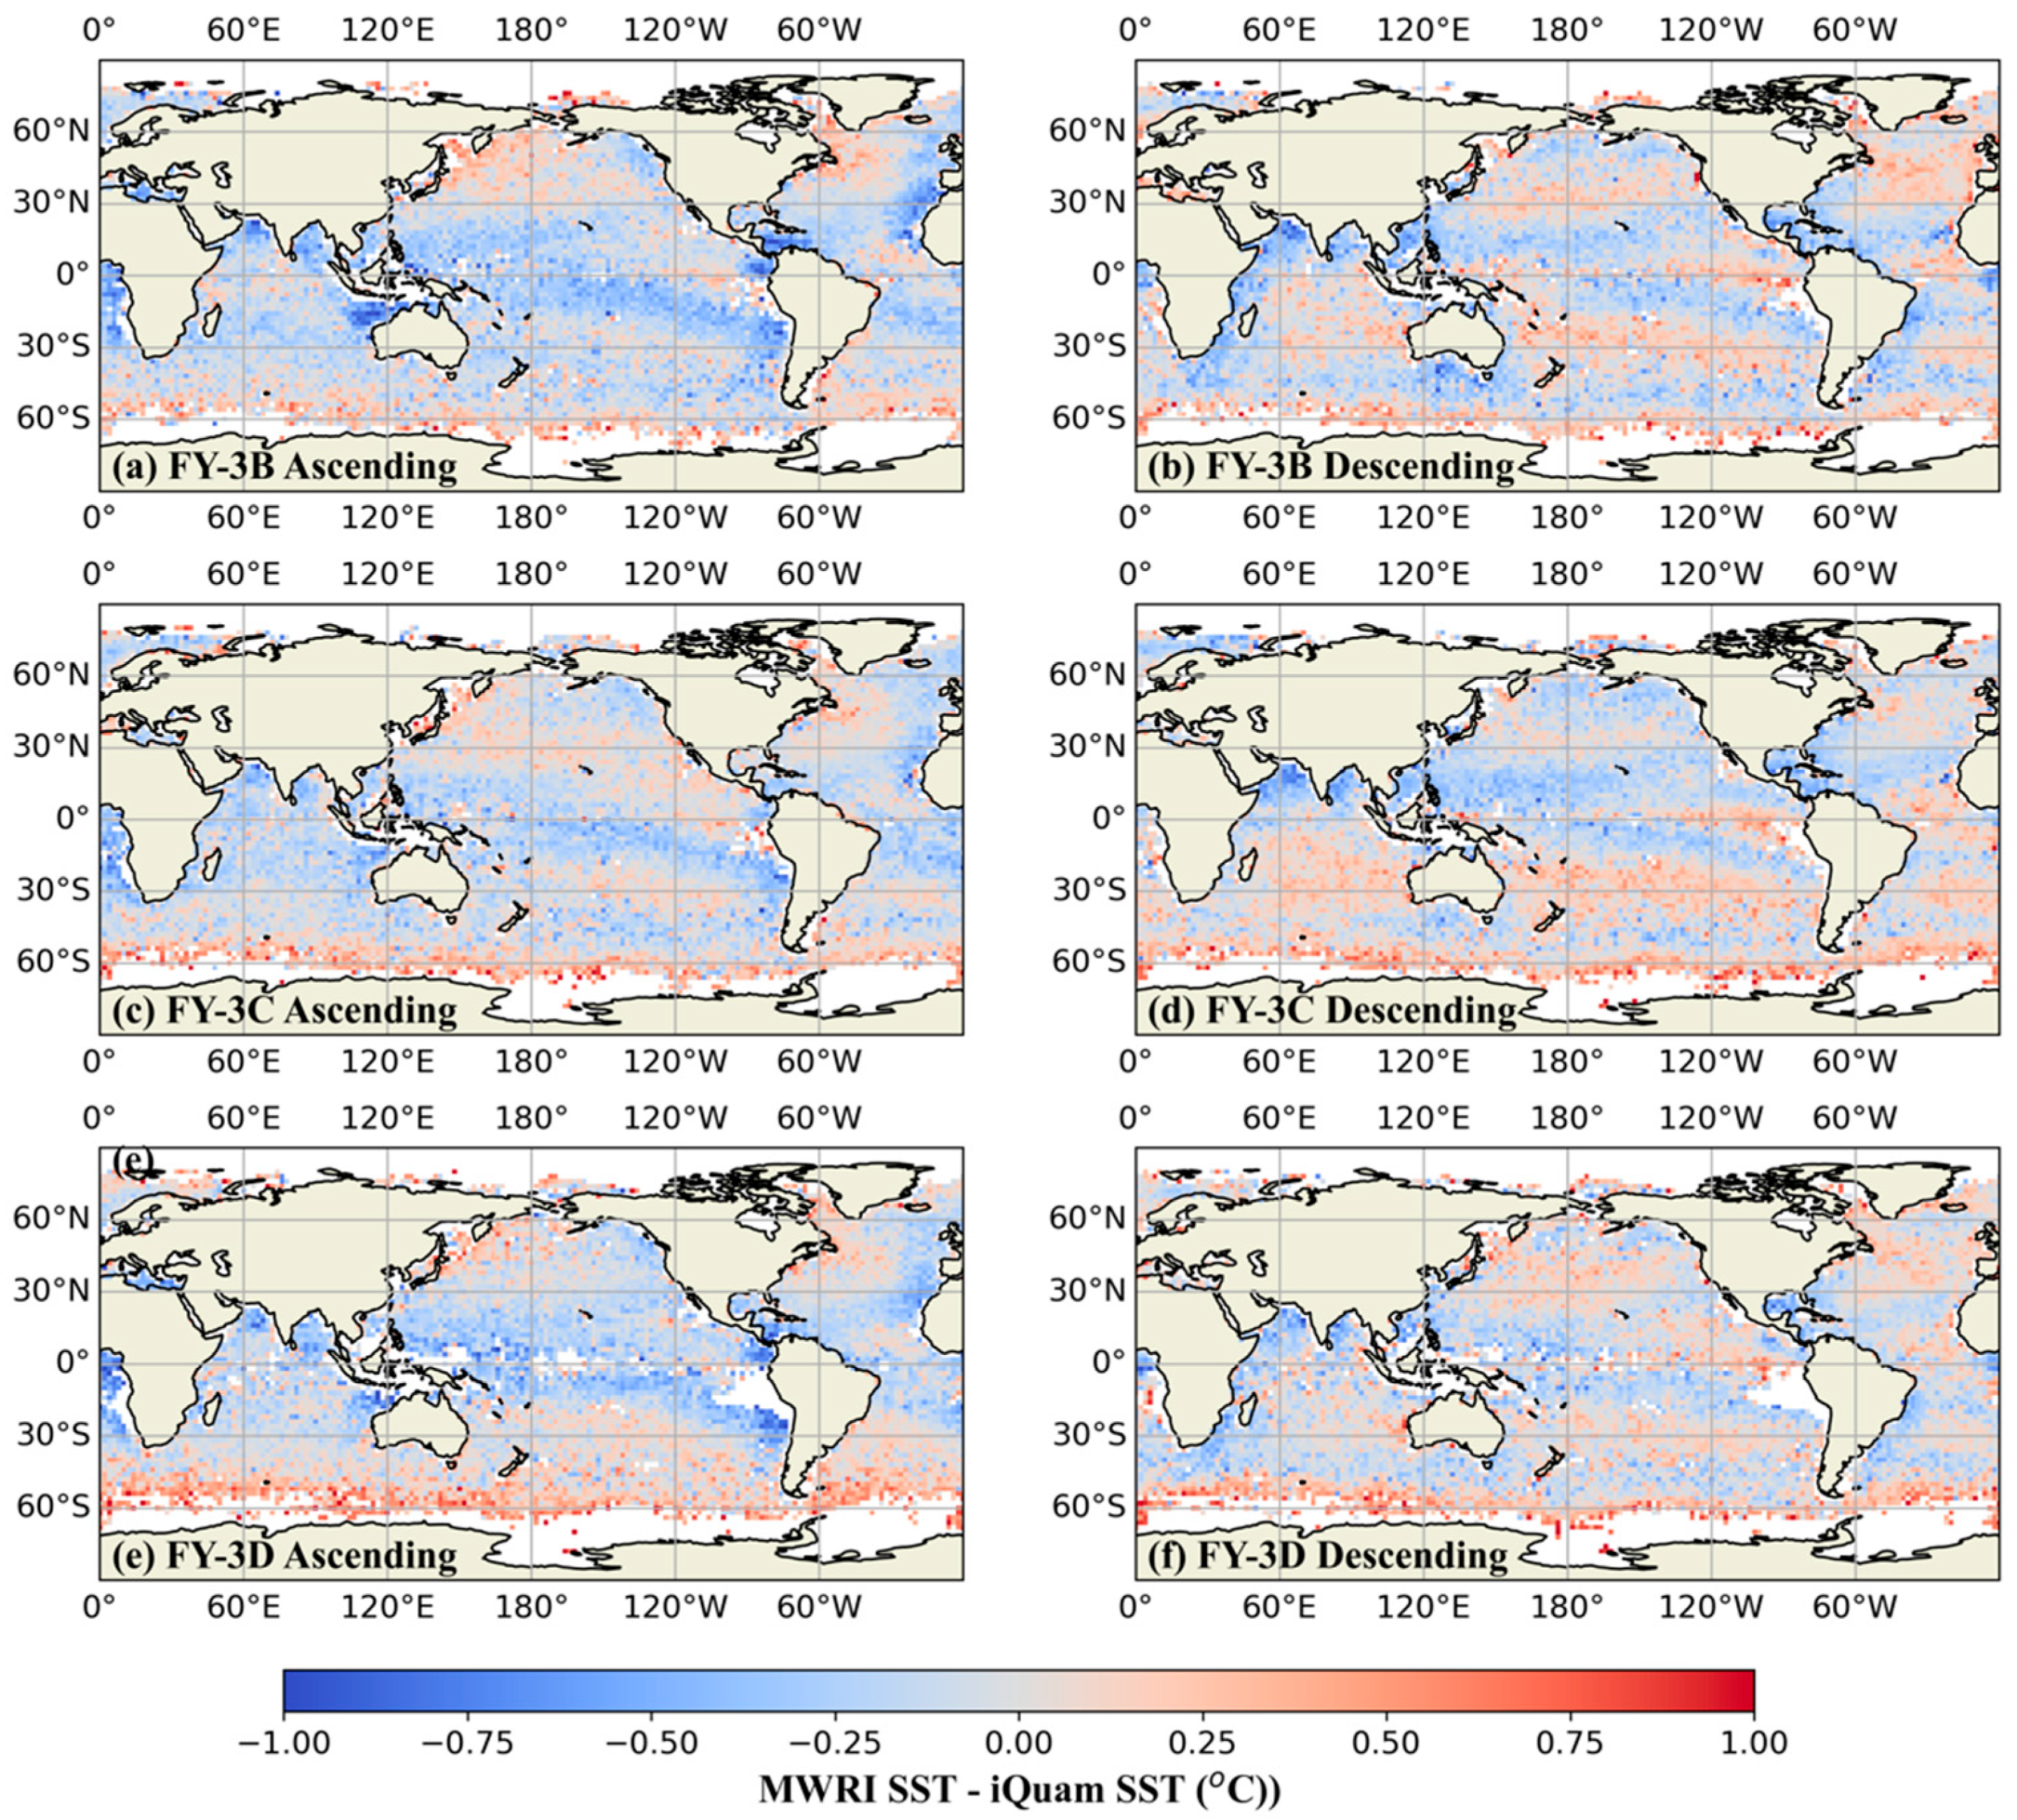
To evaluate the regional performance of MWRI SST over the global ocean, the spatial distribution of MWRI SST biases against iQuam SST from drifters, Argo floats, T-M, and HR-D was analyzed. Figure 2 illustrates the global distribution of MWRI SST bias for FY-3B, FY-3C, and FY-3D. The MWRI SSTs from all three satellites exhibit notable warm biases in high-latitude ocean regions, along the west coast of North America, and in certain nearshore areas of South America. Notable cold biases are observed in regions northwest of Australia and Central America and along the west coast of South America, particularly for FY-3B and FY-3D during ascending passes (see Figure 2a,e). Additionally, the spatial extent of cold biases in the ascending passes is generally larger than that in the descending passes. For MWRI onboard FY-3B and FY-3C, more pronounced positive biases are observed in descending orbits near the equator, around 30° S, and 30° N (see Figure 2b,f). Specifically, FY-3B shows significantly stronger warm biases in the North Pacific and North Atlantic during descending passes compared to ascending ones (see Figure 2a,b). For FY-3C, the descending orbit exhibits noticeably stronger positive biases around 30° S (see Figure 2d). Considering the effects of diurnal warming, SST biases during daytime are generally expected to be warmer than those at night; conversely, little to no day-night difference should exist when diurnal warming is not considered a significant factor. However, Figure 2 shows the opposite: FY-3B/D exhibits colder daytime biases compared to nighttime, while FY-3C shows warmer daytime biases relative to nighttime. These unexpected results may be linked to brightness temperature (BT) calibration, as [33] notes that calibrated MWRI BT products exhibit biases that differ between ascending and descending passes.

3.3. Error Analyses

Applications of SST products, such as global climate change monitoring, require consistent performance across both time and space. However, satellite-based microwave retrievals of SST are affected by crosstalk from sea surface wind, atmospheric water vapor, and cloud liquid water. These contaminating signals introduce performance variability under differing ocean–atmosphere conditions.
In this section, the dependencies of ESD, S N R s u b , bias and RMSE are examined with respect to time, latitude, SST, sea surface wind speed, columnar water vapor, and columnar cloud liquid water. It is important to note that, ESD and S N R s u b of MWRI SST are derived using ETC based on triple collocations of SSTs from MWRI, ERA5, and Argo. In contrast, bias and RMSE are calculated through direct collocations of MWRI SST with iQuam SST from drifters, T-M, HR-D, and Argo floats.
(a)
Temporal variation in error characteristics
Figure 3 presents the temporal variations in ESD, S N R s u b , bias and RMSE for MWRI SST from FY-3B, FY-3C, and FY-3D over the period from November 2011 to April 2022. Monthly collocations were aggregated to compute these error characteristics. The standard deviation of SST collocations used in the calculation of ESD and S N R s u b is also presented, as it reflects the variation in SST. In addition, the number of collocations used for the bias and RMSE calculations is illustrated.
As shown in Figure 3a,b, both ESD and S N R s u b of MWRI SST from FY-3B exhibits greater fluctuations prior to June 2014, after which the values become more stable. In contrast, MWRI SSTs from FY-3C and FY-3D show consistent temporal stability throughout the study period. The curves of ESD and S N R s u b for ascending and descending passes nearly overlap, indicating no significant differences between orbit directions. Across the full-time span, the ESD values for all three satellites fluctuate around 0.79 °C, suggesting that MWRI SSTs from FY-3B, FY-3C, and FY-3D have uniform random errors.
Figure 3d,e show the temporal variations in bias and RMSE of MWRI SSTs compared with iQuam SST for the three satellites. The RMSEs demonstrate consistent temporal behavior for both ascending and descending passes, fluctuating around 0.81 °C. However, differences in bias between ascending and descending passes vary by satellite. For FY-3B, the ascending-pass bias fluctuates around −0.11 °C, while the descending-pass bias centers near −0.03 °C. FY-3D exhibits a similar pattern, with mean biases of approximately −0.06 °C for ascending passes and 0 °C for descending passes. In contrast, the biases of MWRI SSTs from FY-3C for both ascending and descending passes fluctuate around −0.05 °C, with little distinguishable difference between them. The bias values presented are averages over the global ocean, which may obscure the differences between ascending and descending passes.
(b)
Latitudinal variation
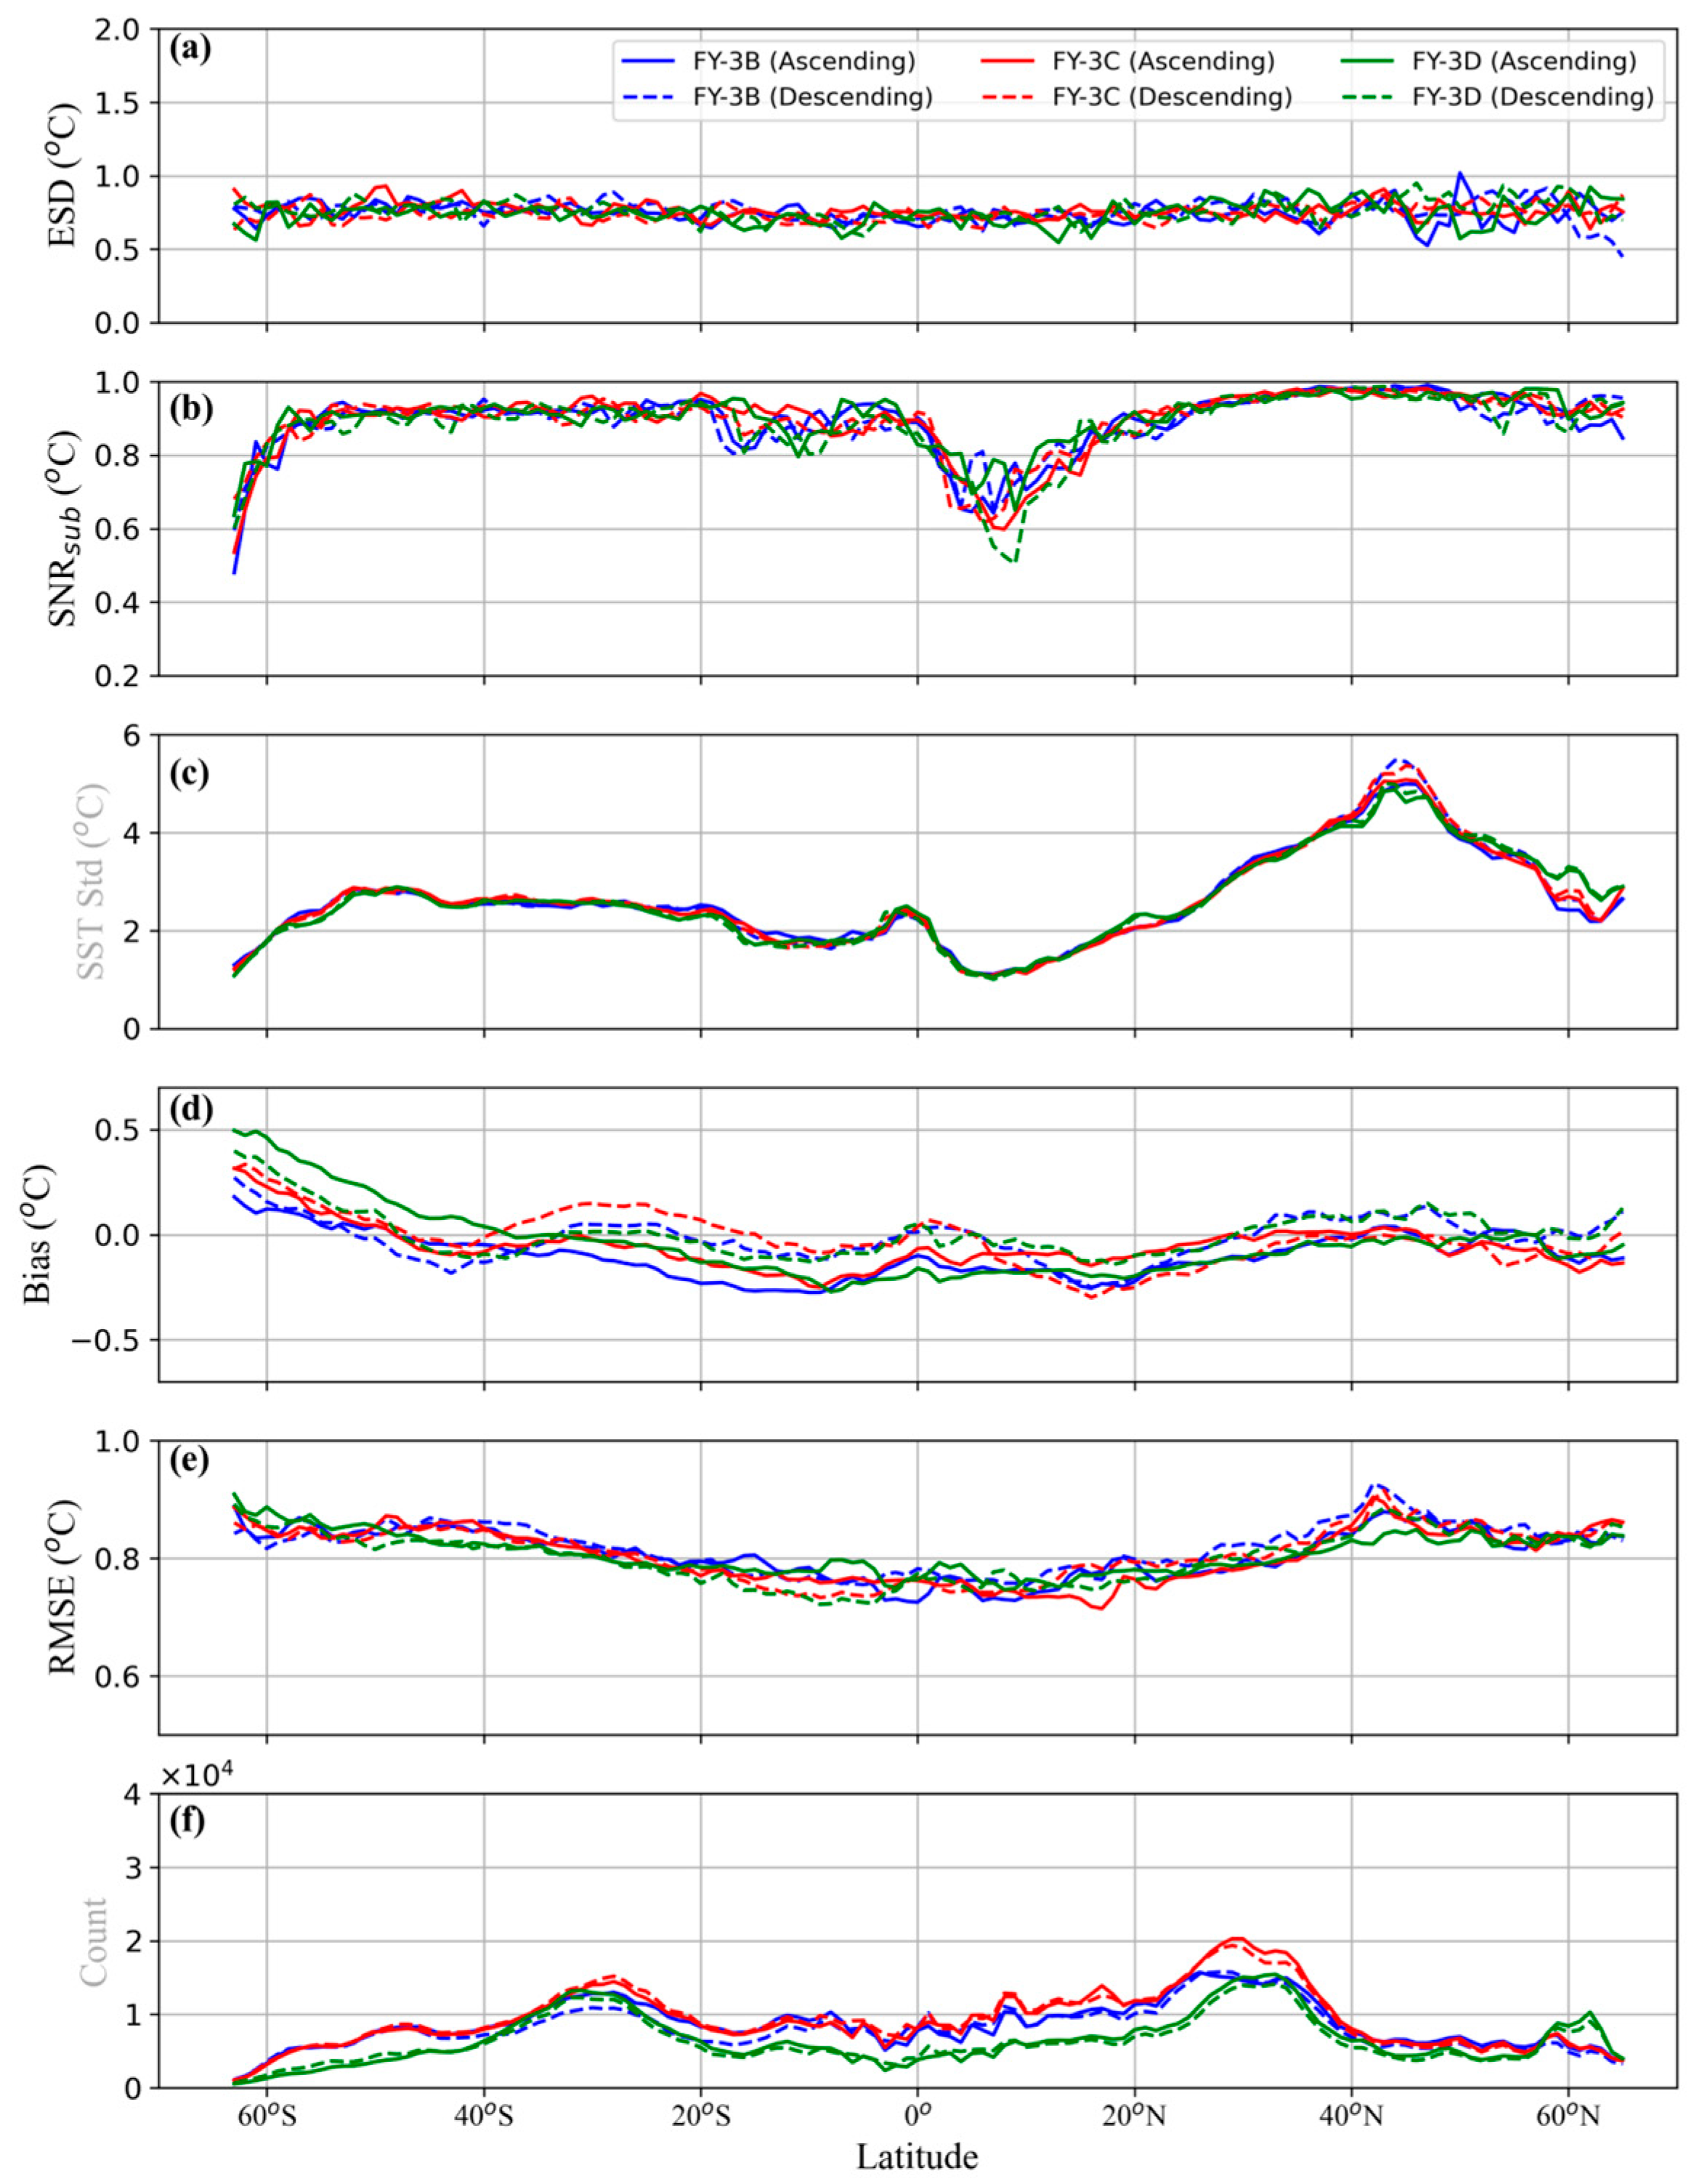
Figure 4 displays the latitudinal variations in the error characteristics of MWRI SSTs from the FY-3B, FY-3C, and FY-3D satellites. As shown in Figure 4a,b, both the ESD and S N R s u b of the MWRI SSTs from all three satellites exhibit consistent variations with latitude, showing no substantial differences between ascending and descending passes. ESD fluctuations range from 0.6 °C to 0.9 °C, increasing slightly at latitudes above 40° N. The S N R s u b values for all three satellites significantly decrease from 0.9 to 0.5 at latitudes above 50° S, with a similar drop occurring between 0° and 20° N. These findings are consistent with those reported in [27,42]. Two factors contribute to the reduction in S N R s u b at high latitudes. First, SST becomes more stable in these regions, as confirmed by the SST standard deviation shown in Figure 3c. Second, the reduced accuracy of MWRI SST retrievals in cold waters further lowers S N R s u b . Although ESD shows a relatively flat trend from low to high latitude, the lower SST standard deviation between 0° and 20°N indicates that SST is also more stable in the tropics. In this region, the decline in S N R s u b arises because the natural SST variability has decreased to the point that it is nearly indistinguishable from the relatively constant background noise level of MWRI SST.
The bias of MWRI SSTs in ascending and descending passes shows different latitudinal patterns. In ascending passes, the biases for FY-3B, FY-3C, and FY-3D are 0.18 °C, 0.32 °C, and 0.5 °C at 63° S, respectively. Moving northward, the biases decrease, reaching the most negative approximately −0.27 °C at 10°S and then gradually become less negative beyond this latitude. In descending passes, the biases remain significantly positive at 63° S and fluctuate between −0.3 °C and 0.2 °C within the latitude range of 50° S to 65° N. Regarding RMSE relative to the iQuam SST, the MWRI SSTs from the three satellites show a consistent latitudinal pattern, with minimal differences between ascending and descending passes. The RMSE values are approximately 0.75 °C near the equator and increase with latitude. In the Southern Hemisphere, the RMSE reaches a maximum above 0.83 °C at 63° S. Conversely, in the Northern Hemisphere, the RMSE peaks near 42° N before gradually decreasing with increasing latitude. Similar latitudinal variations in RMSE for satellite-based microwave SSTs have also been reported in previous studies [42]. Interestingly, the RMSE curves mirror the SST standard deviation curves across most latitude ranges. This correlation suggests that the increased variability away from the equator stems from the differing spatial scales of the datasets: iQuam provides point measurements, while MWRI observes a much larger area. Consequently, as the underlying SST variability increases, so does the discrepancy between the iQuam and MWRI observations.
(c)
Variation related to SST
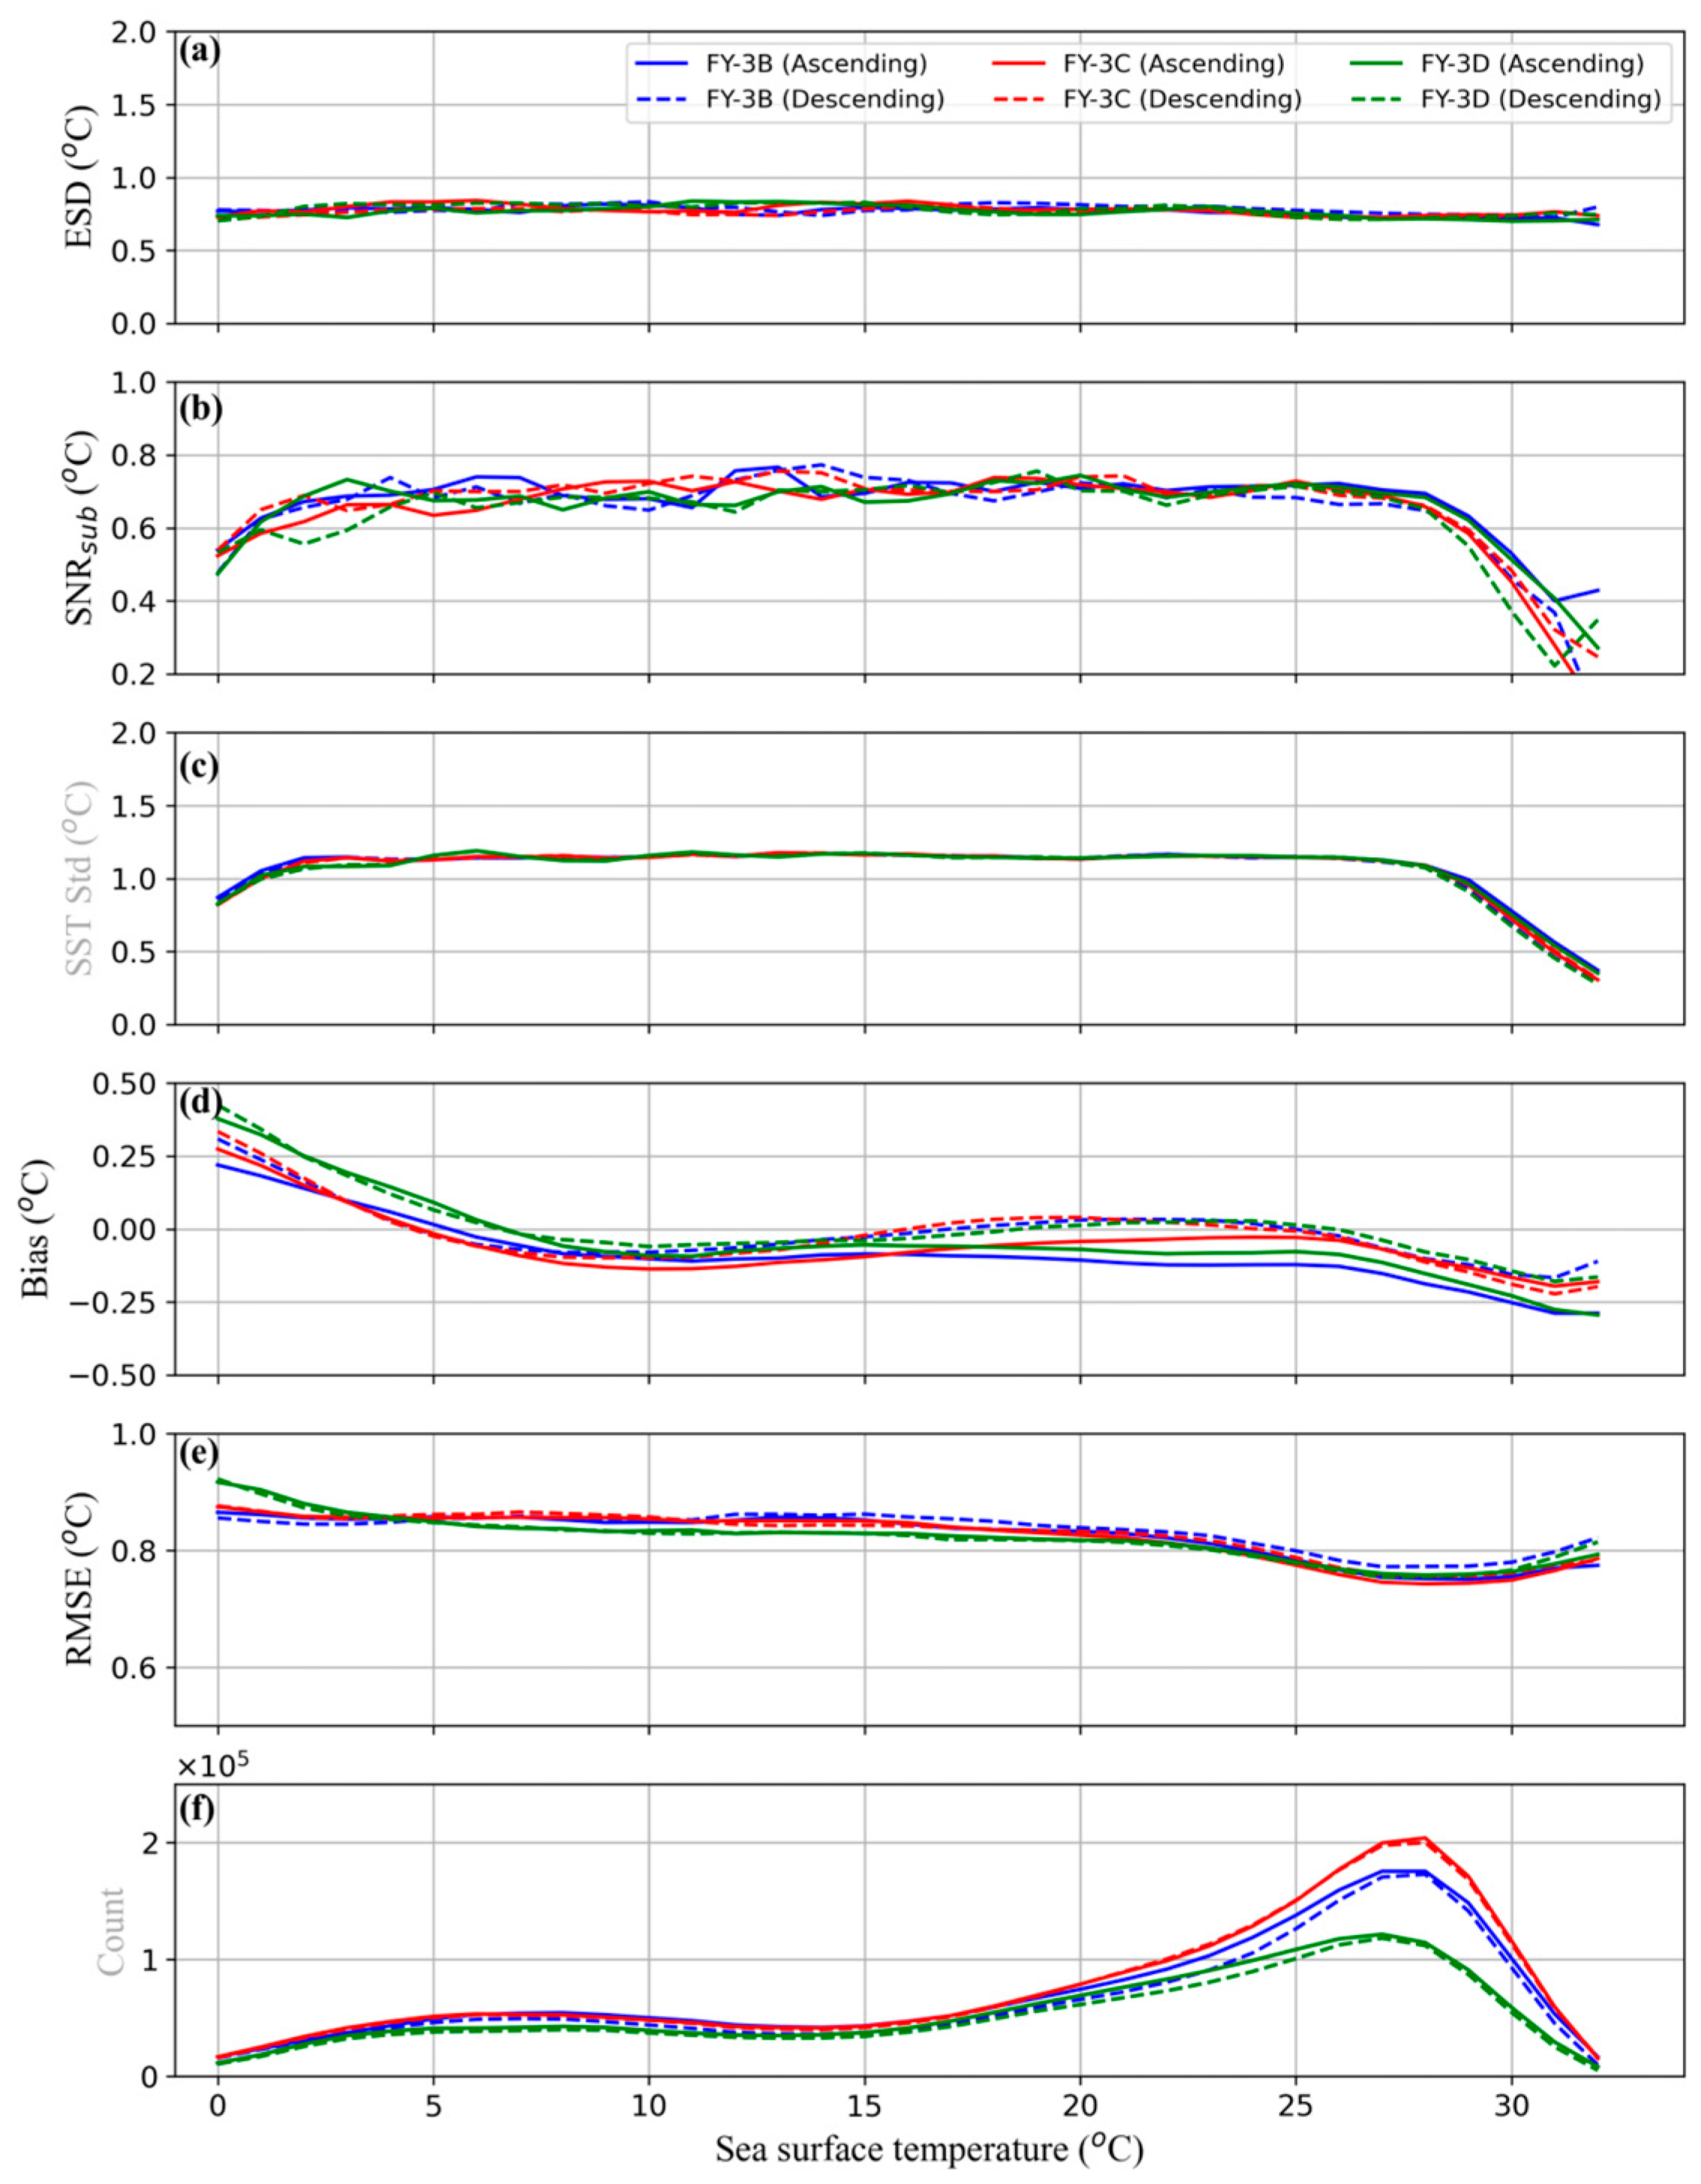
Figure 5 illustrates the variations in ESD, SNR sub , bias, and RMSE with respect to SST. The nearly overlapping ESD curves in Figure 5a indicate that MWRI SSTs from ascending and descending passes of FY-3B, FY-3C, and FY-3D exhibit a uniform pattern of ESD variation across SST, with slight fluctuations between 0.7 °C and 0.9 °C. This suggests that the random errors of the MWRI SSTs from all three satellites are comparable. The SNR sub values of the MWRI SSTs from the three satellites also show consistent variations with SST. S N R s u b remains between 0.65 and 0.75 within the SST range of 5–28 °C, drops sharply to 0.2–0.4 when SST exceeds 28 °C. This decline at high SST is consistent with the reduced S N R s u b observed between 0° and 20° N, where SST variability is weak.
The biases of MWRI SSTs from the three satellites exhibit consistent variation with SST, with slight differences between ascending and descending passes. In both passes, the biases reach their maximum positive value at 0 °C and decrease with increasing SST in the 0–10 °C range. Beyond 10 °C, the bias in ascending passes remains negative and begins to decrease further around 26 °C. In descending passes, the bias shifts from negative to positive between 10 °C and 20 °C. When SST exceeds 25 °C, the bias becomes negative again and continues to decrease with increasing SST. The RMSE of MWRI SSTs from all three satellites generally decreases as SST increases, showing a marked reduction between 23 °C and 27 °C, followed by an upward trend thereafter. The RMSE patterns for FY-3B and FY-3C are nearly identical, although MWRI SSTs from FY-3C exhibit slightly smaller fluctuations. For FY-3D, the RMSE is significantly higher than that of the other two satellites when SST is below 5 °C, but notably lower in the range of 5–20 °C. The higher RMSE at lower SST is attributed to the channel configuration of MWRI. MWRI’s lowest channel is at 10.7 GHz, and the sensitivity of the 11 GHz brightness temperature decreases in colder waters, resulting in less accurate SST retrievals [49].
(d)
Variation related to sea surface wind speed
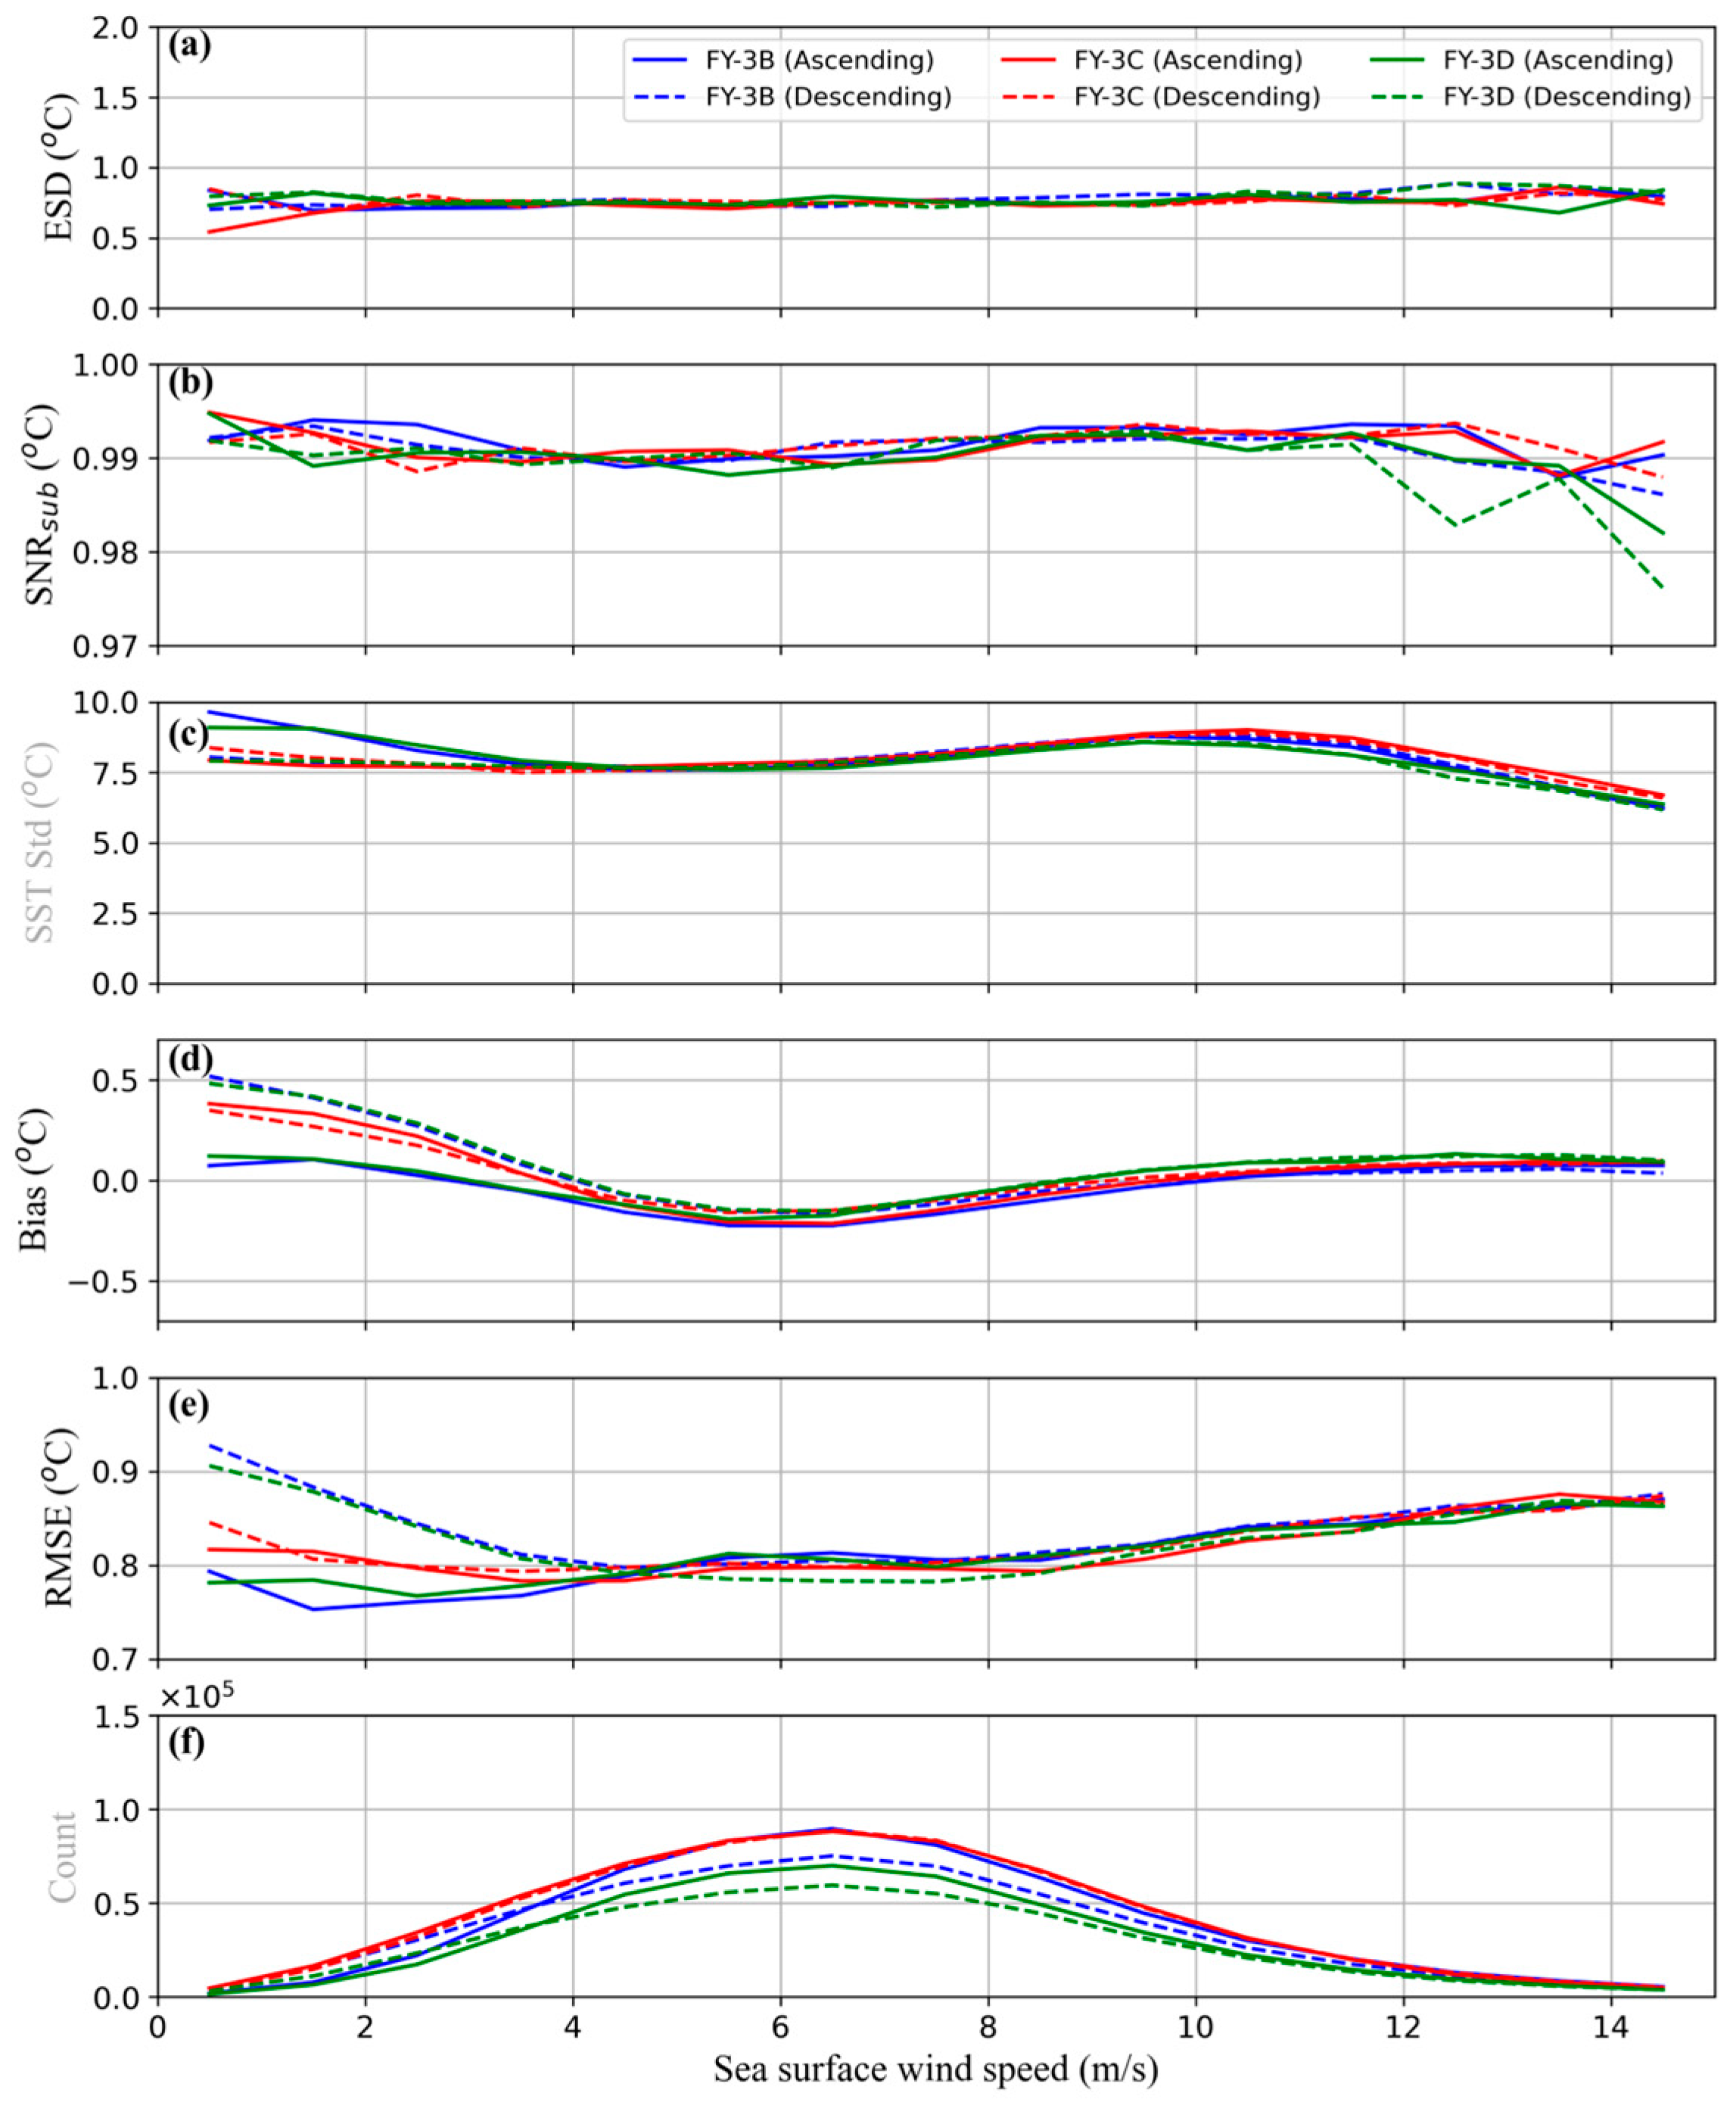
The accuracy of SST retrievals from microwave radiometers is highly sensitive to sea surface wind speed. Figure 6 illustrates the error characteristics of MWRI SSTs from FY-3B, FY-3C, and FY-3D in relation to sea surface wind speed. The ESDs from all three satellites are seen to increase slightly with wind speed. The S N R s u b fluctuate significantly for wind speeds below 4 m/s. As wind speed increases beyond 4 m/s, S N R s u b rises slightly up to around 11 m/s, after which it decreases markedly with further increases in wind speed. Among the satellites, FY-3C exhibits the smallest fluctuations in S N R s u b , while FY-3D demonstrates the steepest decline under high wind conditions, particularly during descending passes.
The MWRI SST biases for all three FY-3 satellites generally decrease at wind speeds below 6 m/s. For FY-3B and FY-3D, ascending and descending passes show significant differences in bias at low sea surface wind speeds, which diminish as wind speed increases. In contrast, FY-3C exhibits only slight differences between ascending and descending passes, even at low wind speeds. This discrepancy can be attributed to differences in local observation time. As summarized in Table 2, FY-3B and FY-3D have LTAN at 13:40 and 14:00, respectively, indicating similar daytime and nighttime overpass times. FY-3C, however, has an LTAN at 22:15, corresponding to a different observation schedule. Considering the effects of the cool-skin layer and diurnal warming, MWRI SST biases during daytime are generally expected to be higher than those at night. However, Figure 6d shows the opposite: the daytime bias is actually smaller than the nighttime bias. These unexpected results may be influenced by the calibration of brightness temperatures and the construction of the retrieval algorithm, though the exact cause remains difficult to determine in this study. Beyond a wind speed threshold of 6 m/s, biases from all three satellites increase uniformly, ranging from –0.2 °C to 0.15 °C, while the RMSE of MWRI SST rises monotonically within the 5–14 m/s range, reaching 0.87 °C at 14 m/s. For wind speeds below 5 m/s, RMSE values show significant differences between ascending and descending passes for FY-3B and FY-3D. The RMSE in ascending passes remains below 0.8 °C with a slight increase, while in descending passes it exceeds 0.9 °C before decreasing to 0.8 °C at 5 m/s. In contrast, MWRI SSTs from FY-3C maintain consistent RMSE values between ascending and descending passes throughout the wind speed range.
(e)
Variation related to columnar water vapor
The presence of atmospheric water vapor and cloud liquid water introduces noise into the brightness temperatures received by satellite microwave radiometers, which compromises the accuracy of SST retrieval. In this section, the crosstalk effect of atmospheric water vapor is specifically examined.
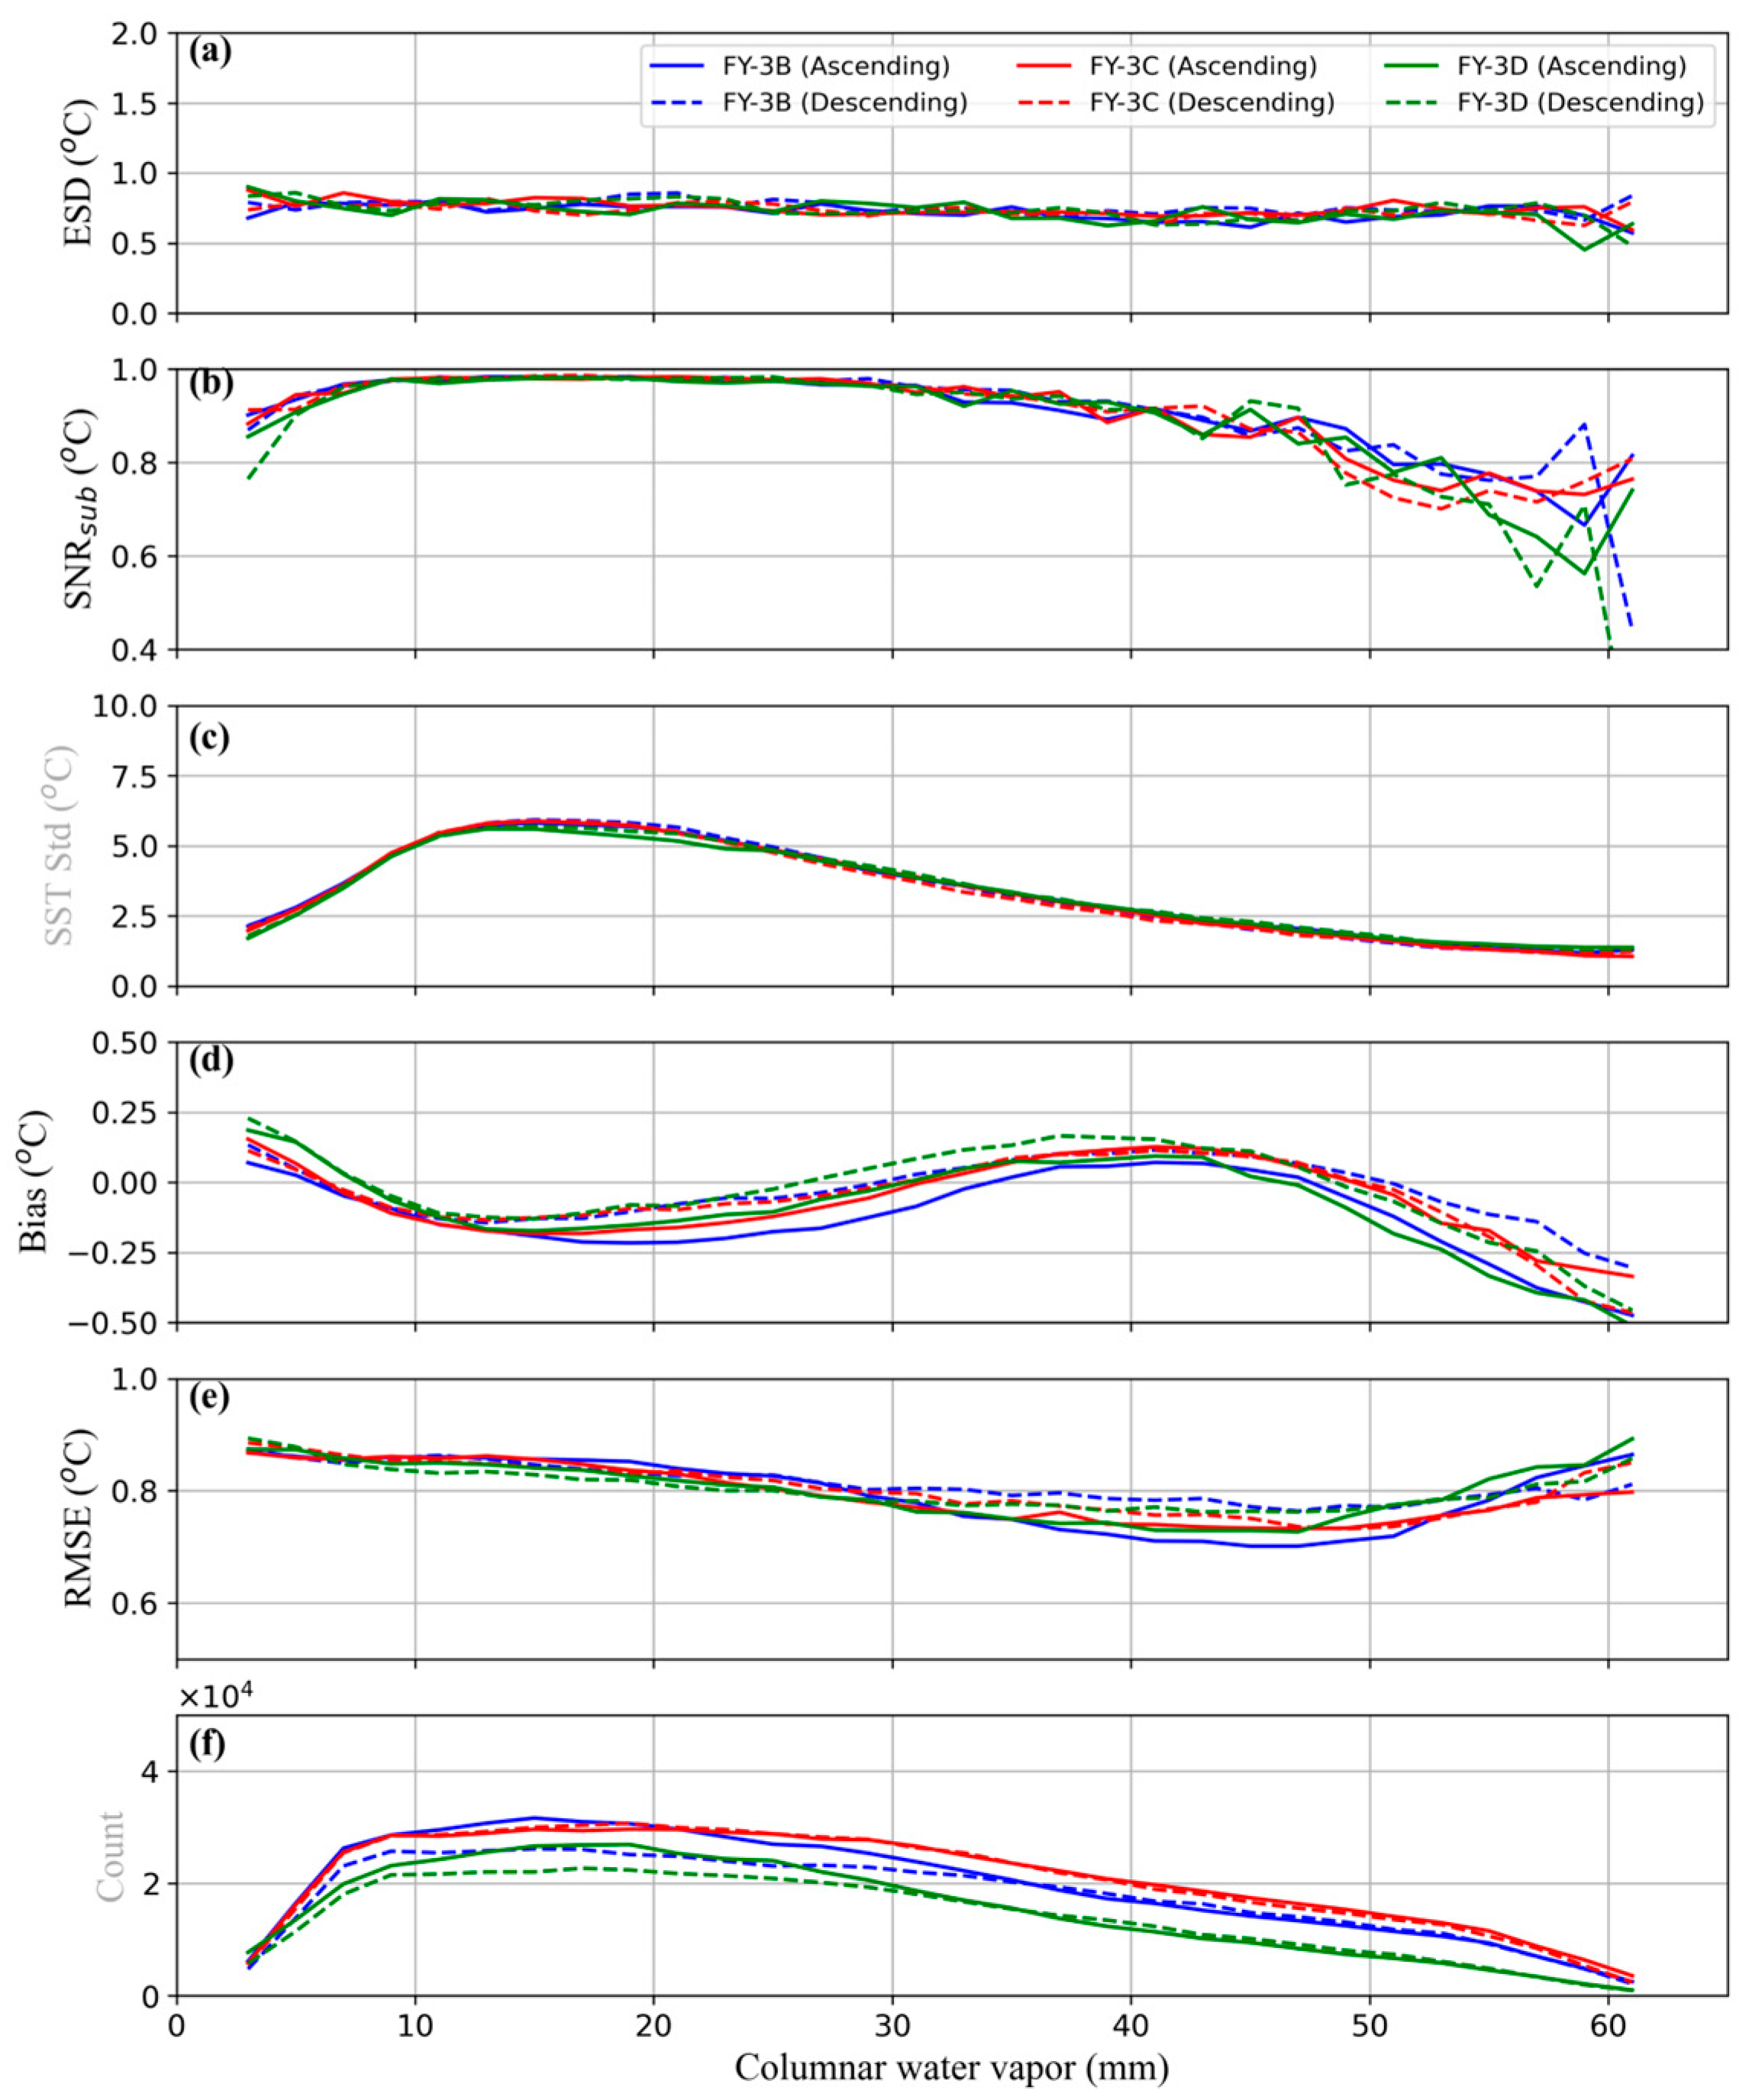
Figure 7 shows the error characteristics of MWRI SSTs from FY-3B, FY-3C, and FY-3D as a function of columnar water vapor. As shown in Figure 7a, the ESD curves for the three satellites are nearly overlapping and exhibit a slight decreasing trend as water vapor increases. Notably, significant decreases in S N R s u b are observed when water vapor is either below 10 mm or above 30 mm. The similar variations in SST standard deviation and S N R s u b suggest that the decline in S N R s u b is driven by increasing SST stability.
The biases of MWRI SSTs from all three satellites exhibit similar variation with water vapor. When water vapor is below 40 mm, the biases fluctuate between −0.2 °C and 0.2 °C. Beyond 40 mm, the biases begin to decrease, reaching −0.4 °C at 60 mm. The RMSE of MWRI SSTs shows an initial decrease from 0.88 °C at 3 mm to a minimum near 45 mm. When water vapor exceeds 45 mm, RMSE increases with further increases in water vapor. In the range of 30–60 mm, MWRI SSTs from descending passes exhibit higher RMSE values than those from ascending passes. Furthermore, FY-3B SSTs show a pronounced difference in RMSE between ascending and descending passes, with the difference reaching as much as 0.08 °C.
(f)
Variation related to columnar cloud liquid water
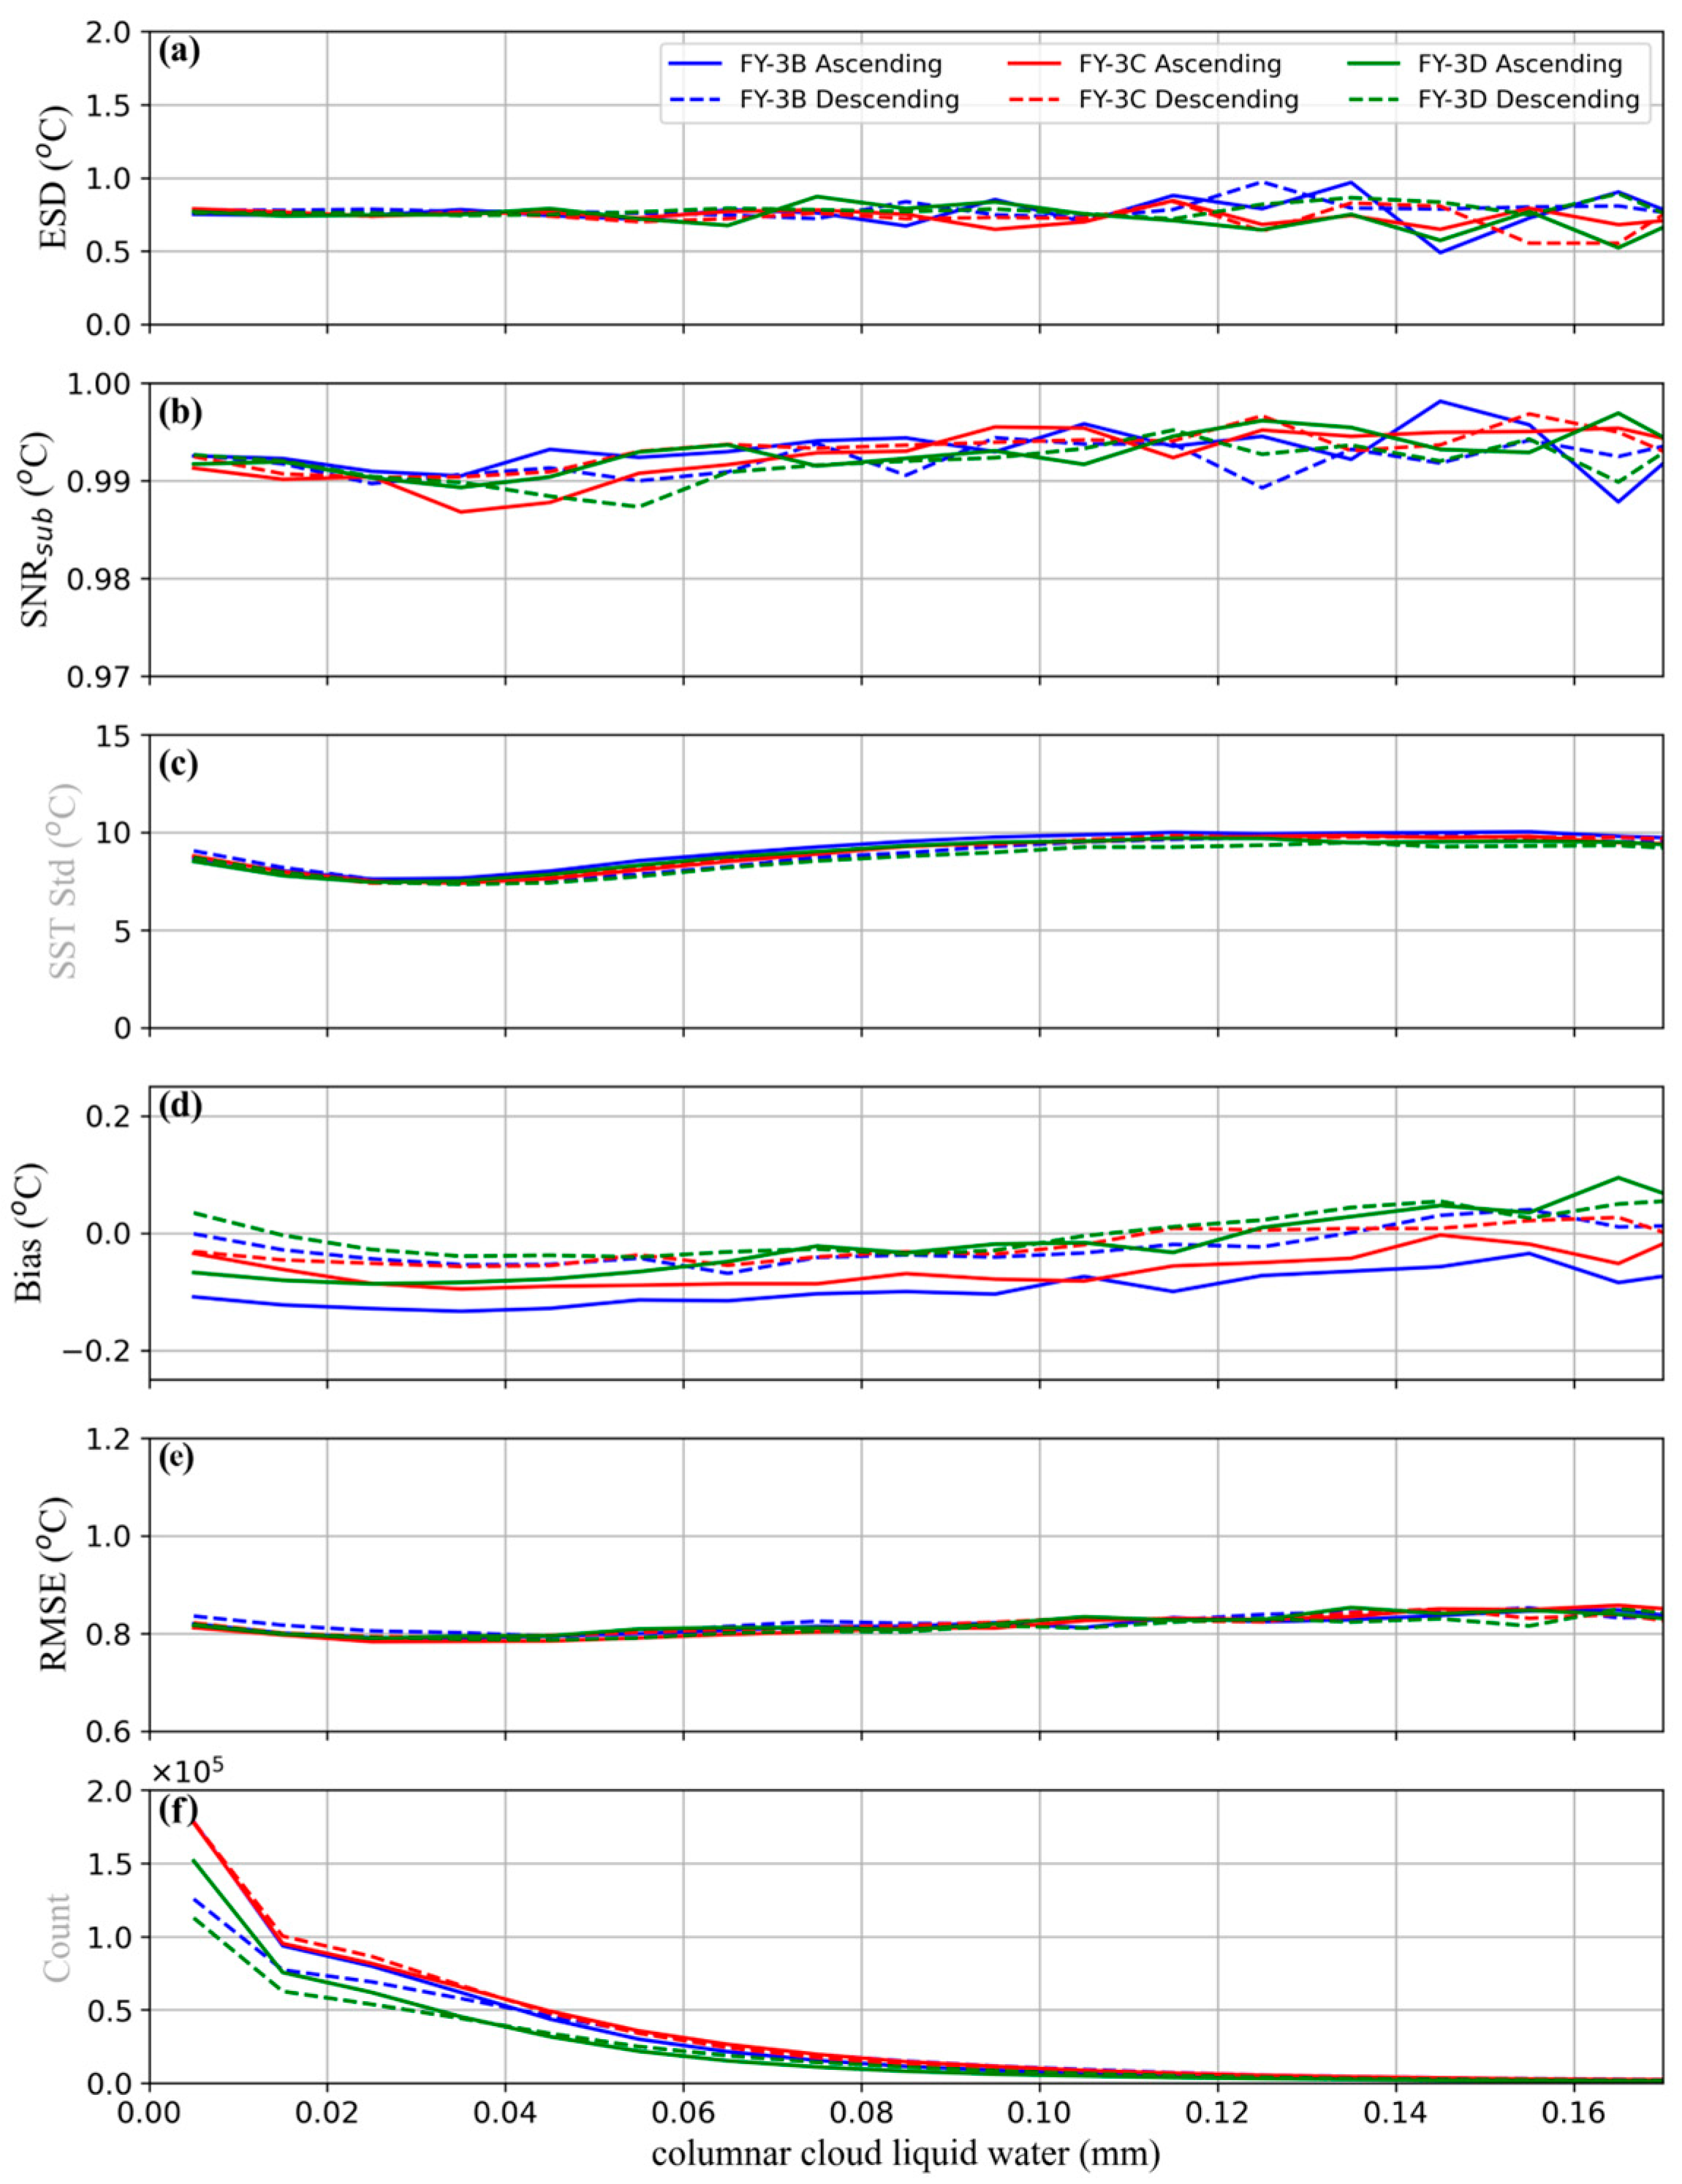
Figure 8 illustrates the variation in the error characteristics of MWRI SSTs from FY-3B, FY-3C, and FY-3D with respect to columnar cloud liquid water. As shown in Figure 8a, the ESD of MWRI SSTs from all three satellites shows no clear dependence on columnar cloud liquid water, although the amplitude of fluctuations gradually increases with increasing liquid water content. Among them, the ESD in ascending passes from FY-3B exhibits the largest fluctuation amplitude, followed by FY-3D. When columnar cloud liquid water exceeds 0.03 mm, the S N R s u b of MWRI SSTs from all three satellites increases with increasing columnar liquid water.
The biases of MWRI SSTs exhibit a weak positive correlation with columnar cloud liquid water, with a marked distinction between ascending and descending passes. During ascending passes, the biases of FY-3B and FY-3C are less negative than those observed in descending passes. The RMSEs of MWRI SSTs from all three satellites decrease slightly from 0.81 °C to 0.80 °C as columnar cloud liquid water increases up to 0.04 mm, and then rise to 0.83 °C once it increases beyond 0.04 mm.

4. Discussion

Operational SST products from the MWRI onboard FY-3D, published by the National Satellite Meteorological Center (NSMC), were previously validated in [27] using direct comparison and ETC methods. A diagnostic derived from ETC, S N R s u b , was employed to quantify the measurement system’s capability to detect SST variations. The performance of iQuam SST from various platforms was also evaluated, and data from drifters, Argo floats, T-M, and HR-D were recommended for validating satellite-based microwave radiometer SST. Building on that work, this study evaluates reprocessed MWRI SST products. The same methods are applied to generate characteristic parameters, enabling a consistent evaluation of improvements over the operational products. Because the reprocessed dataset includes FY-3B, FY-3C, and FY-3D, which have different LTAN and span more than a decade, ERA5 Ts reanalysis data serve as the reference. The consistency of MWRI SST among the three satellites is also examined. The validation results offer important insights for prospective users of the reprocessed MWRI SST products.
Comparison of the previous evaluation results presented in [27] with those presented in Section 3 demonstrates substantial improvements in the performance of the reprocessed MWRI SST products. For FY-3D in the ascending pass, the ESD, bias, and RMSE have decreased from 1.22 °C, −0.33 °C, and 1.30 °C to 0.77 °C, −0.07 °C, and 0.81 °C, respectively. In the descending pass, the values decreased from 1.19 °C, 0.05 °C, and 1.22 °C to 0.77 °C, −0.00 °C, and 0.80 °C, respectively. The S N R s u b increased from 0.98 to 0.99 in both ascending and descending passes. The lower ESD values indicate improved noise control, while reduced RMSE reflects improved accuracy. The higher S N R s u b further suggests enhanced sensitivity to SST variations. Compared with the operational MWRI SST products, reprocessed MWRI SST products show weaker dependencies of ESD on SST, sea surface wind speed, columnar water vapor, and columnar cloud liquid water. This implies that the random error of the reprocessed MWRI SST is largely unaffected by environmental crosstalk. Moreover, the ESD, bias, and RMSE in the new version show improved temporal stability. Although some sensitivity to sea surface wind speed, water vapor, and cloud liquid water remains, the influence of these parameters on bias and RMSE has been notably reduced.
The reprocessed MWRI SST products from FY-3B, FY-3C, and FY-3D together provide over a decade of global SST observations. Since the products from all three satellites were generated using a consistent BT calibration method and SST retrieval algorithm, they exhibit nearly uniform system noise and accuracy. This consistency makes them suitable for use in global data assimilation systems and long-term climate monitoring. However, it should be noted that FY-3B, FY-3C, and FY-3D have different bias patterns relative to iQuam SST. Therefore, when combining SST products from the three satellites into a single dataset, diurnal SST variations must be calibrated.

5. Conclusions

Evaluation results of this study demonstrate that the newly reprocessed MWRI SST products provide a substantial improvement in quality compared with the previously operational products. For FY-3D, both ascending and descending passes show marked reductions in ESD, bias, and RMSE, accompanied by significant increases in S N R s u b . These results highlight improved noise suppression, enhanced sensitivity to SST variations, and greater overall accuracy. In addition, the reprocessed products exhibit weaker dependencies of random error on environmental factors such as SST, sea surface wind speed, water vapor, and cloud liquid water, indicating that environmental crosstalk has been substantially reduced. The improved temporal stability of bias and RMSE further underscores the robustness of the reprocessed products for long-term monitoring. However, due to the complexity of the satellite remote sensing dataset, characterized by extensive spatiotemporal coverage and multiple influencing factors, the current manuscript lacks sufficient depth in analyzing the underlying physical mechanisms. The physical origins of the observed features will be further elaborated in future studies.
Beyond the performance improvements for a single satellite, the reprocessed MWRI SST products from FY-3B, FY-3C, and FY-3D collectively provide a consistent and reliable record of global SST observations spanning more than a decade. Their consistency in system noise and accuracy, ensured by uniform calibration and retrieval algorithms, makes them well suited for assimilation into global ocean and climate models, as well as for use in long-term climate change assessments. Nevertheless, differences in the LTAN among the three satellites introduce distinct bias patterns relative to iQuam SST, which must be carefully corrected when combining data across platforms. Taken together, these findings demonstrate that the reprocessed MWRI SST dataset represents a significant advance in satellite-based SST monitoring and provides valuable resources for both operational applications and climate research. Looking forward, future efforts should focus on refining cross-platform calibration strategies, integrating MWRI SST with complementary satellite and in situ observations, and extending the continuity of high-quality SST records through upcoming satellite missions, thereby strengthening their role in advancing Earth system science and climate prediction.

Author Contributions

Conceptualization, Y.Z., M.Z. and N.X.; methodology, Y.Z., M.Z. and L.C.; code, validation, analysis, P.L., S.Z. and S.S.; writing—original draft preparation, S.Z., P.L. and S.S.; writing—review and editing, Y.Z., M.Z., N.X. and L.C. All authors have read and agreed to the published version of the manuscript.

Funding

This study was funded by the National Natural Science Foundation of China under Grant U2442216 and 42376181, the Marine Meteorological Comprehensive Support Phase ll Project-Space-based Observation Subsystem Program under Grant 20230111029.

Data Availability Statement

Reprocessed MWRI SST products of FY-3B, C, and D that supported this study will be published as an independent dataset by the National Satellite Meteorological Center (NSMC) but are now only accessible by contacting the corresponding author. iQuam SST products and ERA5 hourly data on single levels used in this study are publicly available. The data sources are (1) In situ SST Quality Monitor (iQuam) SST, available at https://www.star.nesdis.noaa.gov/socd/sst/iquam/ (accessed on 1 February 2025), and (2) ERA5 hourly data on single levels, available at https://cds.climate.copernicus.eu/datasets/reanalysis-era5-single-levels?tab=download (accessed on 1 February 2025).

Acknowledgments

We would like to thank the National Oceanic and Atmospheric Administration (NOAA) and European Centre for Medium-Range Weather Forecasts (ECMWF) for providing the data used in this study.

Conflicts of Interest

The authors declare no conflicts of interest.

References

  1. Cai, W.; Ng, B.; Wang, G.; Santoso, A.; Wu, L.; Yang, K. Increased ENSO Sea Surface Temperature Variability under Four IPCC Emission Scenarios. Nat. Clim. Change 2022, 12, 228–231. [Google Scholar] [CrossRef]
  2. Sekizawa, S.; Nakamura, H.; Kosaka, Y. Interannual Variability of the Australian Summer Monsoon System Internally Sustained Through Wind-Evaporation Feedback. Geophys. Res. Lett. 2018, 45, 7748–7755. [Google Scholar] [CrossRef]
  3. Tory, K.J.; Dare, R.A. Sea Surface Temperature Thresholds for Tropical Cyclone Formation. J. Clim. 2015, 28, 8171–8183. [Google Scholar] [CrossRef]
  4. D’Agata, S. Ecosystems Services at Risk. Nat. Clim. Change 2022, 12, 13–14. [Google Scholar] [CrossRef]
  5. Zaiss, J.; Boyd, P.W.; Doney, S.C.; Havenhand, J.N.; Levine, N.M. Impact of Lagrangian Sea Surface Temperature Variability on Southern Ocean Phytoplankton Community Growth Rates. Glob. Biogeochem. Cycles 2021, 35, e2020GB006880. [Google Scholar] [CrossRef]
  6. Sung, H.M.; Kim, J.; Lee, J.-H.; Shim, S.; Boo, K.-O.; Ha, J.-C.; Kim, Y.-H. Future Changes in the Global and Regional Sea Level Rise and Sea Surface Temperature Based on CMIP6 Models. Atmosphere 2021, 12, 90. [Google Scholar] [CrossRef]
  7. Venegas, R.M.; Acevedo, J.; Treml, E.A. Three Decades of Ocean Warming Impacts on Marine Ecosystems: A Review and Perspective. Deep Sea Res. Part II 2023, 212, 105318. [Google Scholar] [CrossRef]
  8. O’Carroll, A.G.; Armstrong, E.M.; Beggs, H.M.; Bouali, M.; Casey, K.S.; Corlett, G.K.; Dash, P.; Donlon, C.J.; Gentemann, C.L.; Høyer, J.L.; et al. Observational Needs of Sea Surface Temperature. Front. Mar. Sci. 2019, 6, 420. [Google Scholar] [CrossRef]
  9. Kennedy, J.J. A Review of Uncertainty in in Situ Measurements and Data Sets of Sea Surface Temperature. Rev. Geophys. 2014, 52, 1–32. [Google Scholar] [CrossRef]
  10. Xu, F.; Ignatov, A. In Situ SST Quality Monitor (iQuam). J. Atmos. Ocean. Technol. 2014, 31, 164–180. [Google Scholar] [CrossRef]
  11. Jia, C.; Minnett, P.J. High Latitude Sea Surface Temperatures Derived from MODIS Infrared Measurements. Remote Sens. Environ. 2020, 251, 112094. [Google Scholar] [CrossRef]
  12. Jia, C.; Minnett, P.J.; Szczodrak, M. Characteristics of R2019 Processing of MODIS Sea Surface Temperature at High Latitudes. Remote Sens. 2024, 16, 4102. [Google Scholar] [CrossRef]
  13. Minnett, P.J.; Alvera-Azcárate, A.; Chin, T.M.; Corlett, G.K.; Gentemann, C.L.; Karagali, I.; Li, X.; Marsouin, A.; Marullo, S.; Maturi, E.; et al. Half a Century of Satellite Remote Sensing of Sea-Surface Temperature. Remote Sens. Environ. 2019, 233, 111366. [Google Scholar] [CrossRef]
  14. Merchant, C.J.; Embury, O.; Bulgin, C.E.; Block, T.; Corlett, G.K.; Fiedler, E.; Good, S.A.; Mittaz, J.; Rayner, N.A.; Berry, D.; et al. Satellite-Based Time-Series of Sea-Surface Temperature since 1981 for Climate Applications. Sci. Data 2019, 6, 223. [Google Scholar] [CrossRef]
  15. Wentz, F.J.; Gentemann, C.; Smith, D.; Chelton, D. Satellite Measurements of Sea Surface Temperature Through Clouds. Science 2000, 288, 847–850. [Google Scholar] [CrossRef] [PubMed]
  16. Nielsen-Englyst, P.; Høyer, J.L.; Toudal Pedersen, L.; Gentemann, C.L.; Alerskans, E.; Block, T.; Donlon, C. Optimal Estimation of Sea Surface Temperature from AMSR-E. Remote Sens. 2018, 10, 229. [Google Scholar] [CrossRef]
  17. Kim, H.-Y.; Park, K.-A.; Chung, S.-R.; Baek, S.-K.; Lee, B.-I.; Shin, I.-C.; Chung, C.-Y.; Kim, J.-G.; Jung, W.-C. Validation of Sea Surface Temperature (SST) from Satellite Passive Microwave Sensor (GPM/GMI) and Causes of SST Errors in the Northwest Pacific. Korean J. Remote Sens. 2018, 34, 1–15. [Google Scholar] [CrossRef]
  18. Gentemann, C.L.; Hilburn, K.A. In Situ Validation of Sea Surface Temperatures from the GCOM-W 1 AMSR 2 RSS Calibrated Brightness Temperatures. J. Geophys. Res. Ocean. 2015, 120, 3567–3585. [Google Scholar] [CrossRef]
  19. Chen, L.; Xu, N.; Wang, J.; Shang, J.; Shou, Y.; Li, B.; Xu, R.; Wu, S.; Wang, X.; Zheng, W.; et al. FengYun Satellites: From Observations to Quantitative Applications. Nat. Remote Sens. Bull. 2025, 29, 1462–1479. [Google Scholar] [CrossRef]
  20. Dong, C.; Yang, J.; Zhang, W.; Yang, Z.; Lu, N.; Shi, J.; Zhang, P.; Liu, Y.; Cai, B. An Overview of a New Chinese Weather Satellite FY-3A. Bull. Am. Meteorol. Soc. 2009, 90, 1531–1544. [Google Scholar] [CrossRef]
  21. He, W.; Xia, X.; Wu, S.; Zhang, P.; Chen, H.; Xia, X.; Zhou, Y.; Cai, M. A Rapid Assessment of MWRI-RM/FY3G Brightness Temperature. Atmos. Ocean. Sci. Lett. 2024, 17, 100466. [Google Scholar] [CrossRef]
  22. Yang, H.; Lv, L.; Xu, H.; He, J.; Wu, S. Evaluation of FY3B-MWRI Instrument on-Orbit Calibration Accuracy. In Proceedings of the 2011 IEEE International Geoscience and Remote Sensing Symposium, Vancouver, BC, Canada, 24–29 July 2011; pp. 2252–2254. [Google Scholar]
  23. Yang, H.; Weng, F.; Lv, L.; Lu, N.; Liu, G.; Bai, M.; Qian, Q.; He, J.; Xu, H. The FengYun-3 Microwave Radiation Imager On-Orbit Verification. IEEE Trans. Geosci. Remote Sens. 2011, 49, 4552–4560. [Google Scholar] [CrossRef]
  24. He, W.; Chen, H.; Xia, X.; Wu, S.; Zhang, P. Evaluation of the Long-Term Performance of Microwave Radiation Imager Onboard Chinese Fengyun Satellites. Adv. Atmos. Sci. 2023, 40, 1257–1268. [Google Scholar] [CrossRef]
  25. Xu, Z.; Sun, R.; Wu, S.; Shao, J.; Chen, J. Inter-Calibration of Passive Microwave Satellite Brightness Temperature Observations between FY-3D/MWRI and GCOM-W1/AMSR2. Remote Sens. 2024, 16, 424. [Google Scholar] [CrossRef]
  26. Zhang, M.; Wang, S.; Qin, D.; Qiu, H.; Tang, S. The inversion and quality validation of FY-3C MWRI sea surface temperature. J. Remote Sens. 2018, 22, 713–722. [Google Scholar] [CrossRef]
  27. Zhao, Y.; Liu, P.; Zhou, W. Inter-Comparison of SST Products from iQuam, AMSR2/GCOM-W1, and MWRI/FY-3D. Remote Sens. 2024, 16, 2034. [Google Scholar] [CrossRef]
  28. Li, Z.; Jiang, G.M. Sea Surface Temperature Retrieval From the FY-3D MWRI Measurements. IEEE Trans. Geosci. Remote Sens. 2024, 62, 1–10. [Google Scholar] [CrossRef]
  29. Xie, X.; Meng, W.; Dong, K.; Gu, S.; Li, X. In-Orbit Calibration of FengYun-3C Microwave Radiation Imager: Characterization of Backlobe Intrusion for the Hot-Load Reflector. IEEE J. Sel. Top. Appl. Earth Obs. Remote Sens. 2021, 14, 6686–6693. [Google Scholar] [CrossRef]
  30. Xie, X.; Dong, K.; Yu, W.; Meng, W.; Gu, S. In-Orbit Calibration of FengYun-3C Microwave Radiation Imager: Nonlinearity Correction. IEEE Trans. Geosci. Remote Sens. 2021, 59, 7618–7626. [Google Scholar] [CrossRef]
  31. Xie, X.; Wu, S.; Xu, H.; Yu, W.; He, J.; Gu, S. Ascending–Descending Bias Correction of Microwave Radiation Imager on Board FengYun-3C. IEEE Trans. Geosci. Remote Sens. 2019, 57, 3126–3134. [Google Scholar] [CrossRef]
  32. Xie, X.; Meng, W.; He, J.; Yu, W.; Li, X. In-Orbit Calibration Uncertainty of the Microwave Radiation Imager on Board Fengyun-3C. J. Meteorol. Res. 2021, 35, 943–951. [Google Scholar] [CrossRef]
  33. Xia, X.; He, W.; Wu, S.; Fu, D.; Shao, W.; Zhang, P.; Xia, X. A Thorough Evaluation of the Passive Microwave Radiometer Measurements Onboard Three Fengyun-3 Satellites. J. Meteorol. Res. 2023, 37, 573–588. [Google Scholar] [CrossRef]
  34. Zhang, M.; Chen, L.; Xu, N.; Cao, G. Influences of Earth Incidence Angle on FY-3/MWRI SST Retrieval and Evaluation of Reprocessed SST. J. Trop. Meteorol. 2024, 30, 230–240. [Google Scholar] [CrossRef]
  35. Zou, X. Studies of FY-3 Observations over the Past 10 Years: A Review. Remote Sens. 2021, 13, 673. [Google Scholar] [CrossRef]
  36. Xu, F.; Ignatov, A. Error Characterization in iQuam SSTs Using Triple Collocations with Satellite Measurements. Geophys. Res. Lett. 2016, 43, 10826–10834. [Google Scholar] [CrossRef]
  37. Bell, B.; Hersbach, H.; Simmons, A.; Berrisford, P.; Dahlgren, P.; Horányi, A.; Muñoz-Sabater, J.; Nicolas, J.; Radu, R.; Schepers, D.; et al. The ERA5 Global Reanalysis: Preliminary Extension to 1950. Q. J. R. Meteorol. Soc. 2021, 147, 4186–4227. [Google Scholar] [CrossRef]
  38. Hersbach, H.; Bell, B.; Berrisford, P.; Hirahara, S.; Horányi, A.; Muñoz-Sabater, J.; Nicolas, J.; Peubey, C.; Radu, R.; Schepers, D.; et al. The ERA5 Global Reanalysis. Q. J. R. Meteorol. Soc. 2020, 146, 1999–2049. [Google Scholar] [CrossRef]
  39. Yang, C.; Leonelli, F.E.; Marullo, S.; Artale, V.; Beggs, H.; Nardelli, B.B.; Chin, T.M.; De Toma, V.; Good, S.; Huang, B.; et al. Sea Surface Temperature Intercomparison in the Framework of the Copernicus Climate Change Service (C3S). J. Clim. 2021, 34, 5257–5283. [Google Scholar] [CrossRef]
  40. Donlon, C.J.; Martin, M.; Stark, J.; Roberts-Jones, J.; Fiedler, E.; Wimmer, W. The Operational Sea Surface Temperature and Sea Ice Analysis (OSTIA) System. Remote Sens. Environ. 2012, 116, 140–158. [Google Scholar] [CrossRef]
  41. Kang, E.-J.; Sohn, B.-J.; Kim, S.-W.; Kim, W.; Kwon, Y.-C.; Kim, S.-B.; Chun, H.-W.; Liu, C. A Revised Ocean Mixed Layer Model for Better Simulating the Diurnal Variation in Ocean Skin Temperature. Geosci. Model Dev. 2024, 17, 8553–8568. [Google Scholar] [CrossRef]
  42. Liu, P.; Zhao, Y.; Zhou, W.; Wang, S. Evaluation of HY-2B SMR Sea Surface Temperature Products from 2019 to 2024. Remote Sens. 2025, 17, 300. [Google Scholar] [CrossRef]
  43. Luo, B.; Minnett, P.J. Evaluation of the ERA5 Sea Surface Skin Temperature with Remotely-Sensed Shipborne Marine-Atmospheric Emitted Radiance Interferometer Data. Remote Sens. 2020, 12, 1873. [Google Scholar] [CrossRef]
  44. Fairall, C.W.; Bradley, E.F.; Godfrey, J.S.; Wick, G.A.; Edson, J.B.; Young, G.S. Cool-Skin and Warm-Layer Effects on Sea Surface Temperature. J. Geophys. Res. Ocean. 1996, 101, 1295–1308. [Google Scholar] [CrossRef]
  45. Jia, C.; Minnett, P.J.; Luo, B. Significant Diurnal Warming Events Observed by Saildrone at High Latitudes. J. Geophys. Res. Ocean. 2023, 128, e2022JC019368. [Google Scholar] [CrossRef]
  46. Jia, C.; Minnett, P.J. Ocean Warm Skin Signals Observed by Saildrone at High Latitudes. Geophys. Res. Lett. 2023, 50, e2022GL102384. [Google Scholar] [CrossRef]
  47. Zwieback, S.; Scipal, K.; Dorigo, W.; Wagner, W. Structural and Statistical Properties of the Collocation Technique for Error Characterization. Nonlin. Process. Geophys. 2012, 19, 69–80. [Google Scholar] [CrossRef]
  48. McColl, K.A.; Vogelzang, J.; Konings, A.G.; Entekhabi, D.; Piles, M.; Stoffelen, A. Extended Triple Collocation: Estimating Errors and Correlation Coefficients with Respect to an Unknown Target. Geophys. Res. Lett. 2014, 41, 6229–6236. [Google Scholar] [CrossRef]
  49. Gentemann, C.L.; Meissner, T.; Wentz, F.J. Accuracy of Satellite Sea Surface Temperatures at 7 and 11 GHz. IEEE Trans. Geosci. Remote Sens. 2010, 48, 1009–1018. [Google Scholar] [CrossRef]
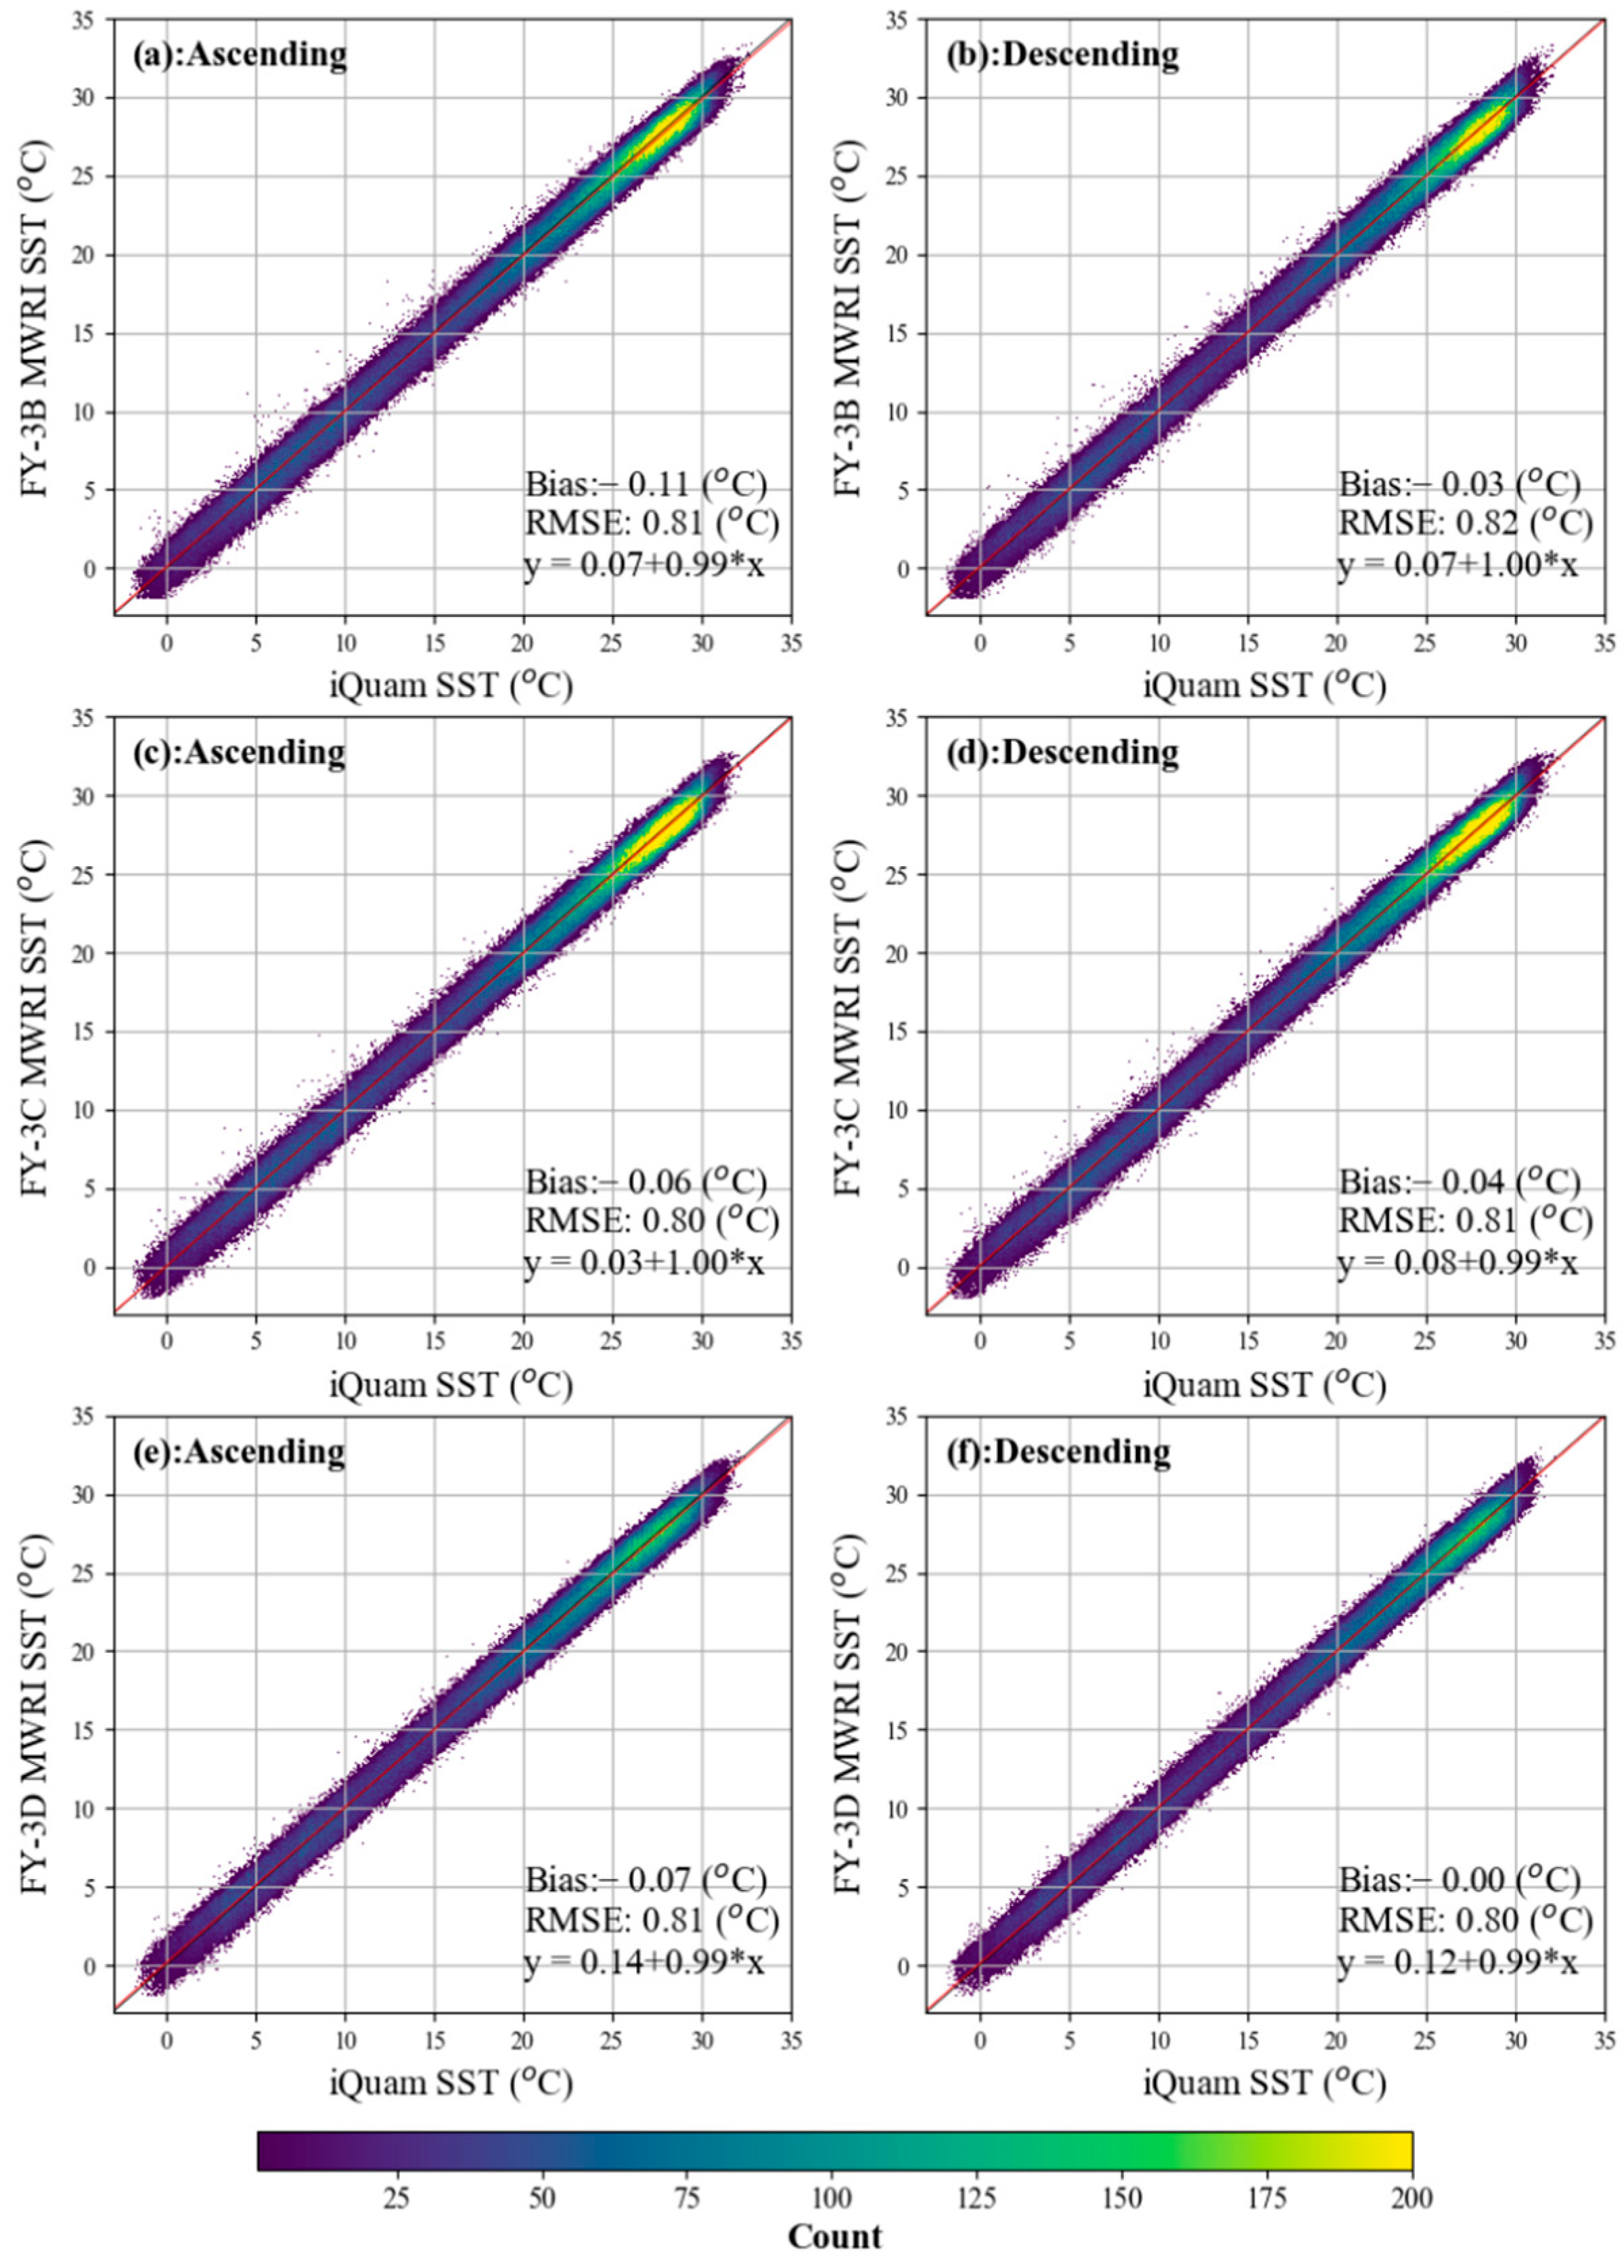
Figure 1. 2D histogram of SST comparison between MWRI and iQuam for FY-3B, FY-3C and FY-3D. (a,c,e) Ascending passes, (b,d,f) Descending passes.
Jmse 13 02136 g001
Figure 2. Spatial distribution of MWRI SST bias referring to iQuam SST for FY-3B, FY-3C and FY-3D. (a,c,e) Ascending passes; (b,d,f) descending passes.
Jmse 13 02136 g002
Figure 3. Temporal variation in error characteristics. (a) ESD. (b) S N R s u b . (c) SST standard deviation associated with the ESD and S N R s u b calculations. (d) Bias. (e) RMSE. (f) Number of collocations used to calculate Bias and RMSE.
Jmse 13 02136 g003
Figure 4. Latitudinal variation in error characteristics. (a) ESD. (b) S N R s u b . (c) SST standard deviation associated with the ESD and S N R s u b calculations. (d) Bias. (e) RMSE. (f) Number of collocations used to calculate Bias and RMSE.
Jmse 13 02136 g004
Figure 5. Variation in error characteristics with SST. (a) ESD. (b) S N R s u b . (c) SST standard deviation associated with the ESD and S N R s u b calculations. (d) Bias. (e) RMSE. (f) Number of collocations used to calculate Bias and RMSE.
Jmse 13 02136 g005
Figure 6. Variation in error characteristics with sea surface wind speed. (a) ESD. (b) S N R s u b . (c) SST standard deviation associated with the ESD and S N R s u b calculations. (d) Bias. (e) RMSE. (f) Number of collocations used to calculate Bias and RMSE.
Jmse 13 02136 g006
Figure 7. Variation in error characteristics with columnar water vapor. (a) ESD. (b) S N R s u b . (c) SST standard deviation associated with the ESD and S N R s u b calculations. (d) Bias. (e) RMSE. (f) Number of collocations used to calculate Bias and RMSE.
Jmse 13 02136 g007
Figure 8. Variation in error characteristics with columnar liquid water. (a) ESD. (b) S N R s u b . (c) SST standard deviation associated with the ESD and S N R s u b calculations. (d) Bias. (e) RMSE. (f) Number of collocations used to calculate Bias and RMSE.
Jmse 13 02136 g008
Table 1. Instrument parameters of MWRI.
Frequency
(GHz)
PolarizationGround Resolution
(km)
Sensitivity
(K)
Calibration Error
(K)
Earth Incidence Angle
(Degree)
10.65V.H51 × 850.51.553
18.7V.H30 × 500.51.5
23.8V.H27 × 450.51.5
36.5V.H18 × 300.51.5
89V.H9 × 150.81.5
Table 2. Information on the FY-3A, B, C, and D Satellites.
SatelliteLTANStart DateEnd Date
FY-3B13:4018 November 201019 August 2019
FY-3C22:15 *29 September 20133 February 2020
FY-3D14:0015 November 2017present
* The LTAN for the FY-3C satellite is derived from its Local Time of the Descending Node (LTDN), which is provided by the National Satellite Meteorological Center (NSMC), by adding 12 h.
Table 3. Count of Triple collocations.
SatelliteOrbitTotalDrifterT-MHR-DArgo
FY-3BAscending529,092430,95122,55169,1936397
Descending481,050394,23821,22659,4806106
FY-3CAscending631,268522,40221,46978,2189179
Descending624,904518,65021,61776,1178520
FY-3DAscending459,383398,95212,06543,1545212
Descending424,727367,65711,52039,7675783
Table 4. ETC analysis results of SSTs from MWRI, Argo and ERA5.
SST
Measuring System
Orbit Direction *ParameterFY-3BFY-3CFY-3D
MWRIAscendingESD (°C)0.760.770.76
SNR sub 0.99370.99210.9943
DescendingESD (°C)0.780.760.77
SNR sub 0.99280.99330.9933
ArgoAscendingESD (°C)0.380.300.34
SNR sub 0.99850.99880.9989
DescendingESD (°C)0.370.360.28
SNR sub 0.99840.99850.9991
ERA5AscendingESD (°C)0.210.220.19
SNR sub 0.99950.99930.9997
DescendingESD (°C)0.210.180.21
SNR sub 0.99950.99960.9995
* For FY-3B and FY-3D, ascending orbits are daytime passes and descending orbits are nighttime. In contrast, FY-3C operates with its ascending orbit at night and its descending orbit during the day.
Table 5. Direct comparison results of MWRI SST against iQuam SST and ERA5 SSTint.
Data PairOrbit Direction *ParameterFY-3BFY-3CFY-3D
MWRI vs. iQuamAscendingBias (°C)−0.11−0.06−0.07
RMSE (°C)0.810.800.81
DescendingBias (°C)−0.03−0.04−0.00
RMSE (°C)0.820.810.80
MWRI vs. ERA5AscendingBias (°C)0.180.230.18
RMSE (°C)0.800.830.81
DescendingBias (°C)0.210.150.22
RMSE (°C)0.830.790.83
* For FY-3B and FY-3D, ascending orbits are daytime passes and descending orbits are nighttime. In contrast, FY-3C operates with its ascending orbit at night and its descending orbit during the day.
Disclaimer/Publisher’s Note: The statements, opinions and data contained in all publications are solely those of the individual author(s) and contributor(s) and not of MDPI and/or the editor(s). MDPI and/or the editor(s) disclaim responsibility for any injury to people or property resulting from any ideas, methods, instructions or products referred to in the content.