Article

Sediment Distribution and Seafloor Substratum Mapping on the DD Guyot, Western Pacific

1
National Deep Sea Center, Qingdao 266237, China
2
College of Ocean Science and Engineering, Shandong University of Science and Technology, Qingdao 266590, China
3
College of Engineering, Ocean University of China, Qingdao 266404, China
*
Author to whom correspondence should be addressed.
J. Mar. Sci. Eng. 2025, 13(10), 1904; https://doi.org/10.3390/jmse13101904
Submission received: 12 September 2025 / Revised: 28 September 2025 / Accepted: 29 September 2025 / Published: 3 October 2025
(This article belongs to the Special Issue Advances in Sedimentology and Coastal and Marine Geology, 3rd Edition)

Abstract

The DD Guyot, a flat-topped seamount located in the Western Pacific, was completely mapped using multibeam echosounders (MBESs) in 2024. Clarifying substratum patterns is crucial for understanding seafloor evolution, sediment transport processes, and resource assessment. This study integrates near-bottom video data from the manned submersible Jiaolong, multibeam bathymetry and backscatter data from EM124, and a convolutional neural network (CNN) model to classify the four substratum types (exposed bedrock, thinly sedimented bedrock, sediment–rock transition zone, and continuous sediment) of the DD Guyot. The results indicate that exposed bedrock predominates on the summit platform, while sediment cover increases with water depth along the flank. The base of the guyot is almost entirely covered by sediments. Two landslide areas were identified, with clear main scarps, sidewalls, and debris accumulations. These features, together with underflow erosion, collectively influence sediment distribution patterns. The resulting substratum maps provide guidance for seabed resource exploration. The results are consistent with a post-drowning onlap framework, which points to a drowning unconformity, but video and surface acoustic data alone are insufficient for definitive confirmation. Further investigation is required to more clearly elucidate the substratum characteristics of the DD Guyot.

1. Introduction

As a vital component of deep-sea topography, seamounts are widely distributed across the world’s oceans. They represent a frontier field for studying surface features and serve as a crucial window for understanding seafloor topography evolution, seafloor material cycles, and marine ecological environments [1,2,3].
Among the myriad seamounts, guyots represent a distinctive type characterized by a level summit. This feature is generally interpreted as the result of erosion, sedimentation, and tectonic subsidence submerging what were once exposed volcanic islands [4]. The Western Pacific serves as a classic distribution zone for guyots, attracting significant attention in regional geomorphology and sedimentology [5,6].
Deep-sea sediments constitute the largest geological deposits on Earth [7]. The distribution of these sediments is controlled by multiple factors, including source areas, water depth, carbonate compensation depth, ocean currents, topography, and episodic inputs. They document changes in marine environmental conditions and play a crucial role in assessing marine resource potential [7,8,9,10,11]. After drowning, the summit and flanks of seamounts primarily receive pelagic/hemipelagic sedimentation, including carbonate mud, clay, radiolarians, and volcanic ash [4,12]. On the flanks, sediments are redistributed under the influence of bottom currents and episodic gravity-driven transport [8]. If the summit or ridge remains exposed with a hard substratum for a long time, cobalt-rich crusts can grow at an extremely slow rate; in areas with low relief, polymetallic nodules often develop within fine-grained sediment cover [13,14,15]. Due to the prominent topographic features of seamounts, sediments exhibit significant spatial heterogeneity on these structures [16], with locally observable combinations ranging from exposed bedrock to continuously overlying sediments. Drowning unconformity refers to the phenomenon where carbonate rocks in a basin environment are onlapped by siliciclastic deposits [17,18], which holds significant implications for the study of guyot sedimentation. The coupling relationship between topography and sedimentation is crucial for deep-sea benthic organism research and deep-sea resource exploration and development [19,20].
Deep-sea sediment detection is a prerequisite for conducting research, which is primarily categorized into three types: in situ sampling detection, optical detection, and acoustic detection. In situ sampling methods typically involve capturing the substratum type samples on-site using specialized instruments, enabling the accurate acquisition of field data [21,22]. However, these methods are costly, inefficient, and have a very limited detection range. Optical detection primarily relies on near-bottom imaging conducted by towed camera systems mounted on underwater vehicles, enabling the direct observation of seafloor substratum types, biological coverage, and microtopography [23,24]. Acoustic detection primarily involves using an MBES to acquire high-precision bathymetric data and corresponding backscatter intensity, as well as employing side-scan sonar (SSS) to obtain high-resolution acoustic images [25,26]. Currently, integrated approaches combining multiple methods are commonly employed to overcome the limitations of individual methods in terms of coverage, detection content, and detection accuracy [22].
To analyze the distribution characteristics of seamount sediments, it is necessary to classify the sedimentary conditions of the entire seamount. Traditional methods primarily rely on rule-based and statistical empirical approaches, such as statistical analysis based on texture features and physical inversion based on echo-angle models [21,27,28]. Classic machine learning methods have been widely applied in sediment classification, with techniques such as Random Forest (RF), Support Vector Machine (SVM), and Adaptive Boosting (AdaBoost) [26,29,30]. For example, Herkul et al. [31] and Turner et al. [32] conducted research using RF to demonstrate its advantages in substratum mapping. In recent years, deep learning techniques such as CNNs have demonstrated superior representational capabilities in image classification due to their outstanding performance, significantly improving substratum type classification accuracy [33,34,35,36,37]. For example, Yang et al. [33] utilized a CNN to classify the seabed substratum in a certain sea area of New Zealand and successfully identified the outline of a shipwreck. Whether employing traditional machine learning or deep learning, accurate and sufficiently comprehensive ground truth data form the foundation for model reliability.
Against this backdrop, in this study, the DD Guyot was selected as the research subject. Utilizing video data from the manned submersible Jiaolong, multibeam bathymetry data, and multibeam backscatter intensity data, the following was conducted: (1) a visual interpretation of video obtained by the Jiaolong submersible was made, analyzing the seabed substratum characteristics along the dive trajectories of Jiaolong; (2) the spatial distribution of sediments on the DD Guyot was identified and classified using CNN, and a map of the substratum types was obtained; and (3) the distribution characteristics of DD Guyot sediments across different landform units were analyzed, a preliminary exploration of the reasons was carried out, and the impact of landslides on sediment distribution as well as the phenomenon of drowning unconformities were examined.

2. Study Area

2.1. Overview of the Study Area

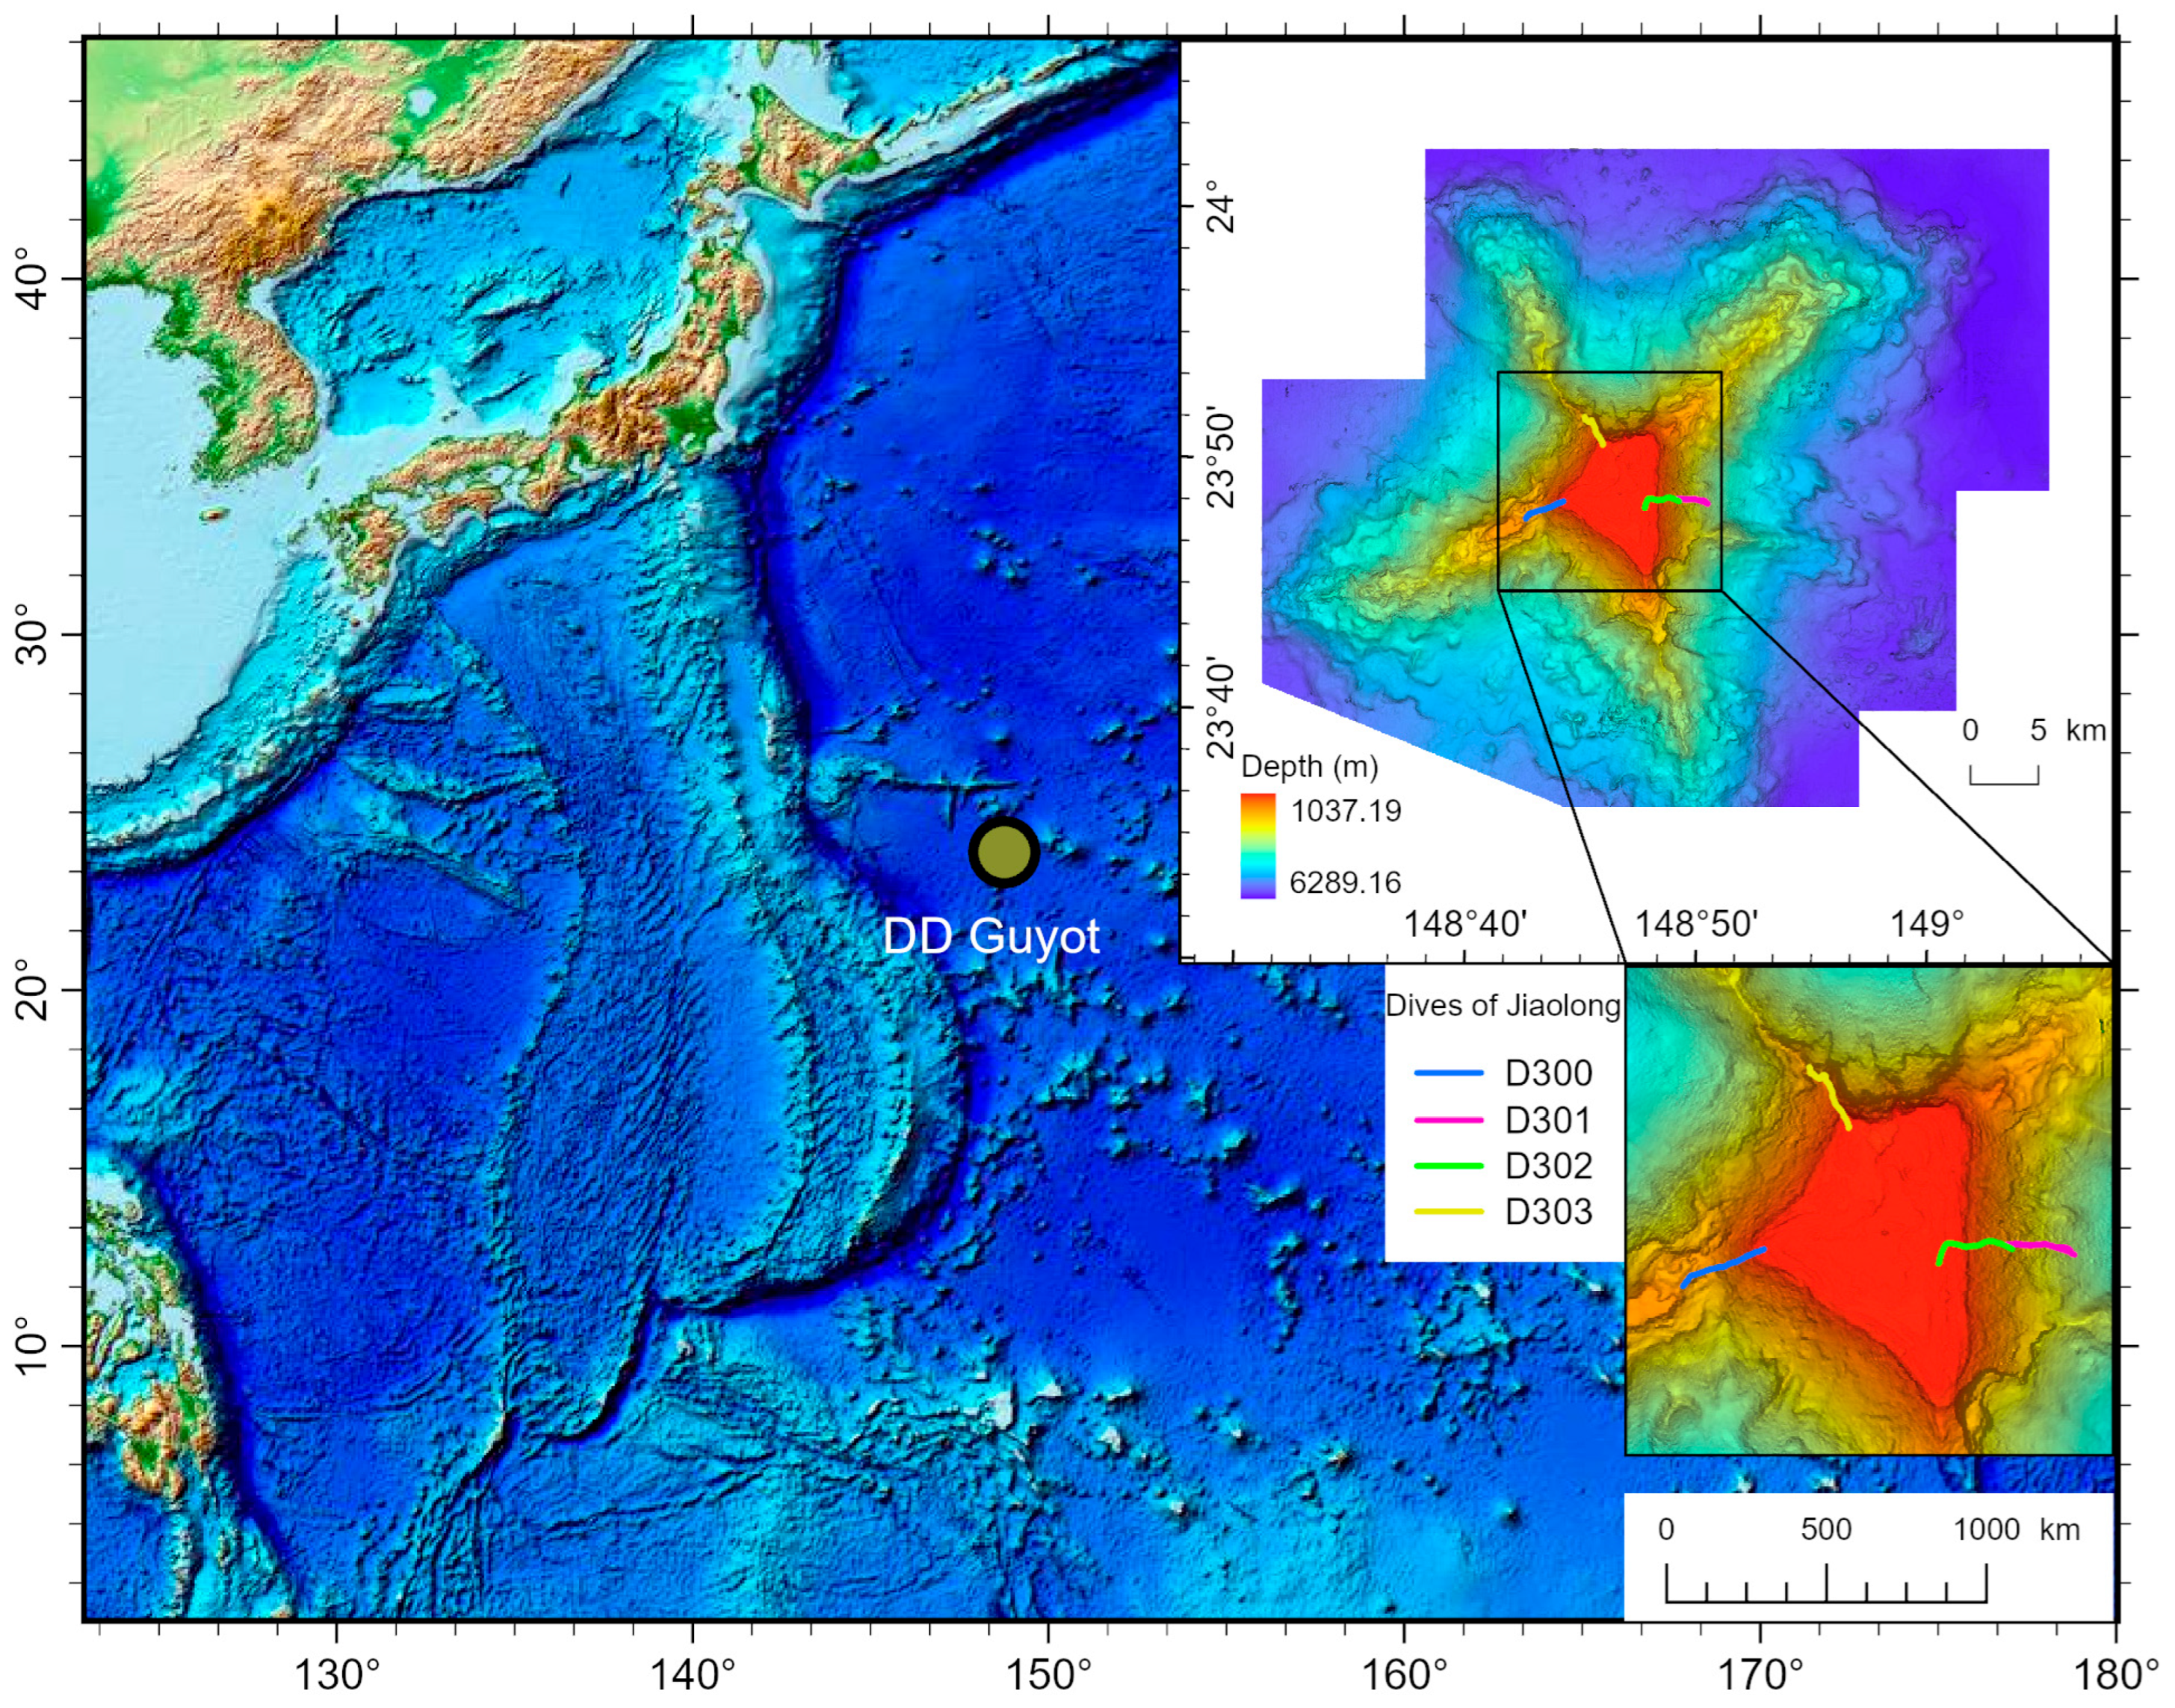
The DD Guyot is connected to the Marcus–Wake Seamount Area in the north and borders the Magellan Seamount Area in the south, which was completely mapped by MBES (Kongsberg, Horten, Norway) in 2024. The DD Guyot has a depth ranging from approximately 1037 to 6289 m. Its shape is irregular, with a generally steep profile, and it features four massive ridges. The summit platform measures approximately 10 km in length and 7 km in width, covering a relatively small area. The specific location and morphology of the DD Guyot are shown in Figure 1.

2.2. Geological Setting

The complex geomorphology of the Western Pacific resulted from multiple episodes of tectonic and magmatic activity during the Mesozoic era, with the seamounts and intermontane basins formed in different periods distributed alternately [38]. The seamounts in this area were formed by intraplate volcanic eruptions of mantle-derived magmas from multiple hotspots [39,40,41].
The surface sediments of the Western Pacific seamounts consist primarily of deep-sea clay, calcareous mud, and siliceous mud [42]. The mountain basin underwent multiple episodes of uplift and subsidence, receiving diverse sediments that formed a relatively complex sedimentary sequence [38,43]. The sedimentary layers in the Marcus–Wake Seamounts are relatively thin—thinner than those in the Magellan Seamounts—and notably lack shallow-water carbonate deposits [43,44].
The topography and substratum characteristics of the DD Guyot are complex. In certain areas, the slope is extremely steep. According to submersible data, the region is predominantly characterized by hard substratum types, particularly on steep slopes and ridges. Sediment deposits are also commonly found in areas with gentler slopes and greater water depths.

3. Data Acquisition and Processing

3.1. Data Acquisition

The MBES bathymetry data and backscatter intensity data were acquired during the 2024 Western Pacific scientific expedition. The multibeam equipment employed was Kongsberg’s EM124 MBES (Kongsberg, Horten, Norway), with a data resolution of 50 m.
The manned submersible Jiaolong conducted near-bottom observations at the DD Guyot in 2024, including Dive 300 (D300), Dive 301 (D301), Dive 302 (D302), and Dive 303 (D303). The survey line information is shown in Figure 1 and Table 1.
In this study, substratum refers to the surface to near-surface seafloor medium that can be classified using MBES bathymetry, backscatter, and near-bottom video data. In contrast, acoustic basement is a term from reflection seismology, denoting the deepest relatively continuous reflector in seismic profiles and the poor-imaging section below it [45]. Its identification relies on reflection seismic data, but such data were not acquired in this study. Therefore, this research does not address the acoustic basement; all mapping and discussion are confined to the seafloor substratum.

3.2. Data Processing

Data processing includes the visual interpretation of manned submersible video data, the feature extraction and selection of MBES data, and substratum classification based on the CNN.
Based on the nature of the seafloor substratum and sediment distribution within the visual field, sediment distribution types were delineated using visual interpretation methods. Since the number of each type was unevenly distributed, this imbalance affected subsequent deep learning-based substratum type classification tasks. Therefore, a category weighting method was employed in this study to achieve the balanced processing of video data [46].
Backscatter intensity data were extracted from shipborne MBES data. Due to limitations imposed by the marine environment and the inherent characteristics of the multibeam system, correction of the backscatter intensity data is required [47]. Correction was performed using CARIS HIPS and SIPS 11.4 (https://www.teledynecaris.com/, accessed on 1 July 2024).
Although substratum type characteristics are closely related to water depth and backscatter intensity [16], the information contained in these two datasets is complex and insufficient for substratum type classification. Therefore, extracting their spatial features is crucial. Based on water depth data, this study extracted slope and topographic relief [48]. Based on backscatter intensity, this study extracted an eight-dimensional gray-level co-occurrence matrix (GLCM) [49], a four-dimensional Laws texture feature [50], and a two-dimensional Gabor filter feature [51]. Detailed information is shown in Table 2.
These 18-dimensional data often exhibit high correlations, with multiple terrain indices or texture feature indices potentially describing similar substratum type information. Therefore, this study employs the mRMR–Pearson correlation coefficient method to screen the features listed in Table 2, aiming to develop a model that retains good performance while reducing redundancy. First, the mRMR algorithm is employed to rank the importance of features across dimensions, selecting the top 10 features. Subsequently, Pearson’s correlation coefficient method is applied to analyze the correlations among these 10 features, eliminating highly correlated ones to achieve feature parsimony.
Machine learning models come in various types, among which CNNs excel at capturing local texture features and demonstrate excellent practical performance, making them widely applicable in substratum type identification [33]. Based on the data processing described earlier, in this study, the filtered features were fed into a CNN model for iterative training until the desired error threshold was met. The final output underwent accuracy evaluation. The processing workflow is illustrated in Figure 2.

4. Results

4.1. Sediment Distribution Along the Trajectory of Manned Submersibles

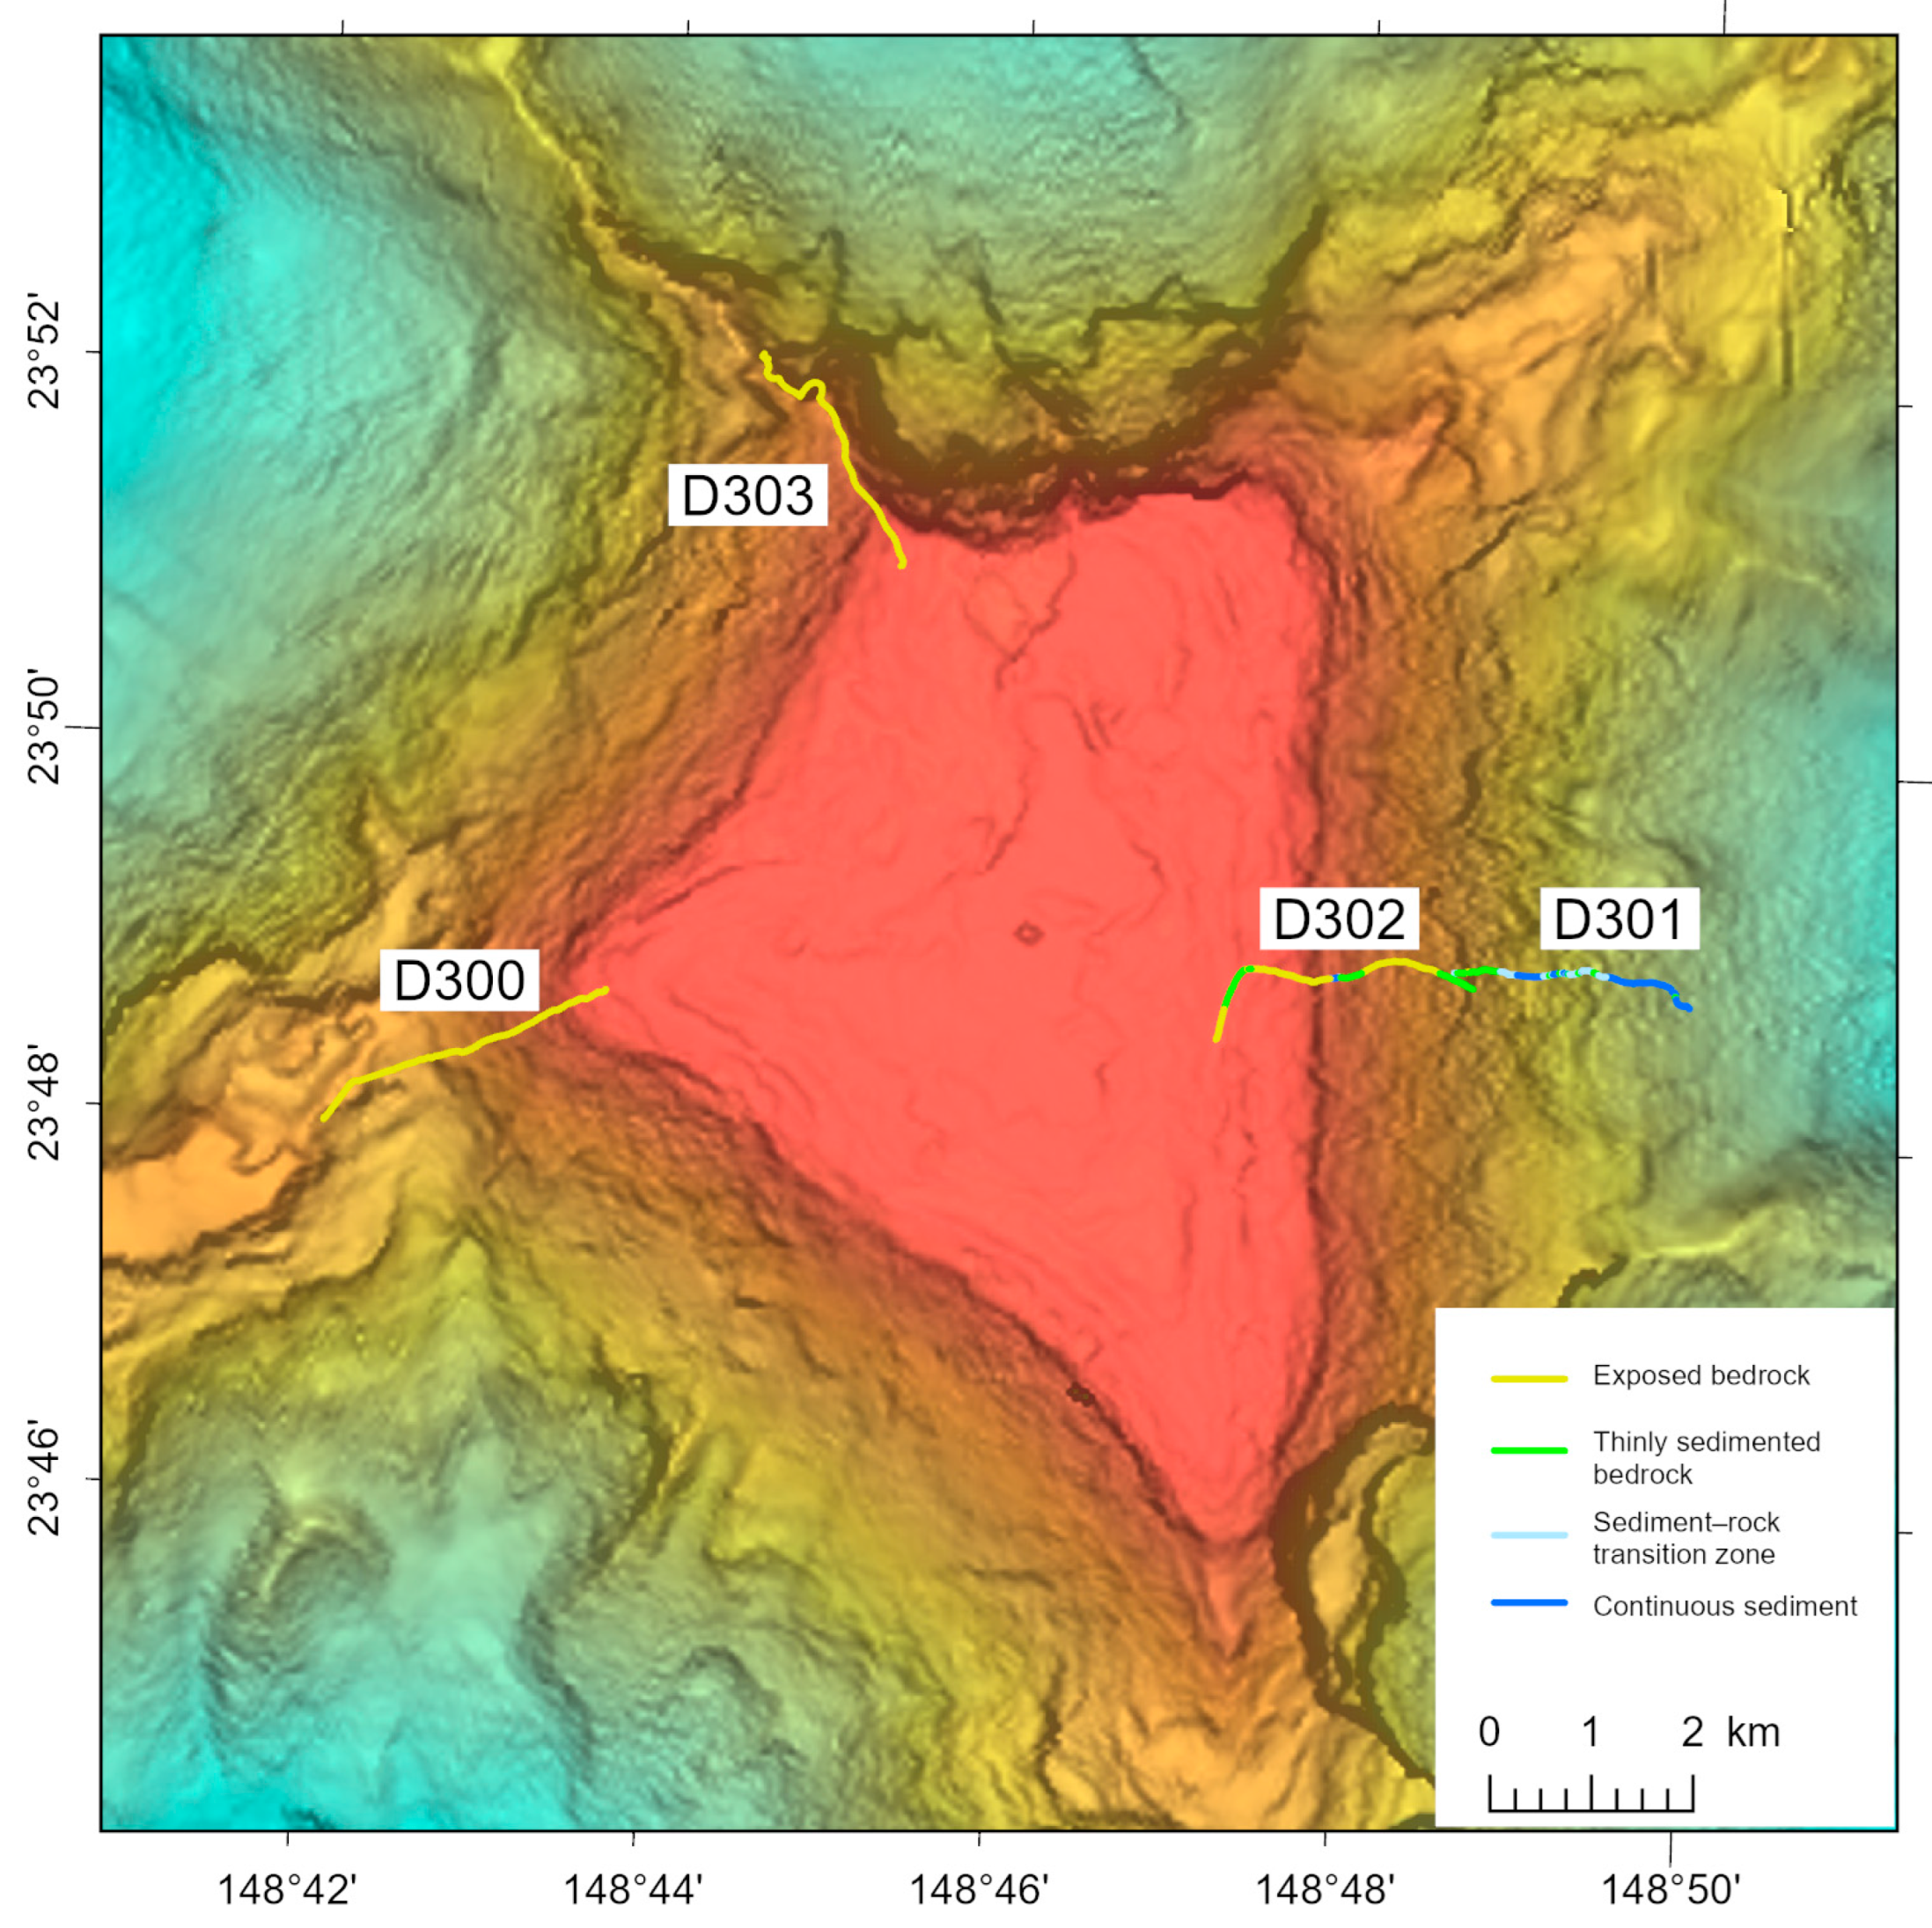
Through visual interpretation, the distribution of seafloor sediments was classified into four types (Table 3, Figure 3).
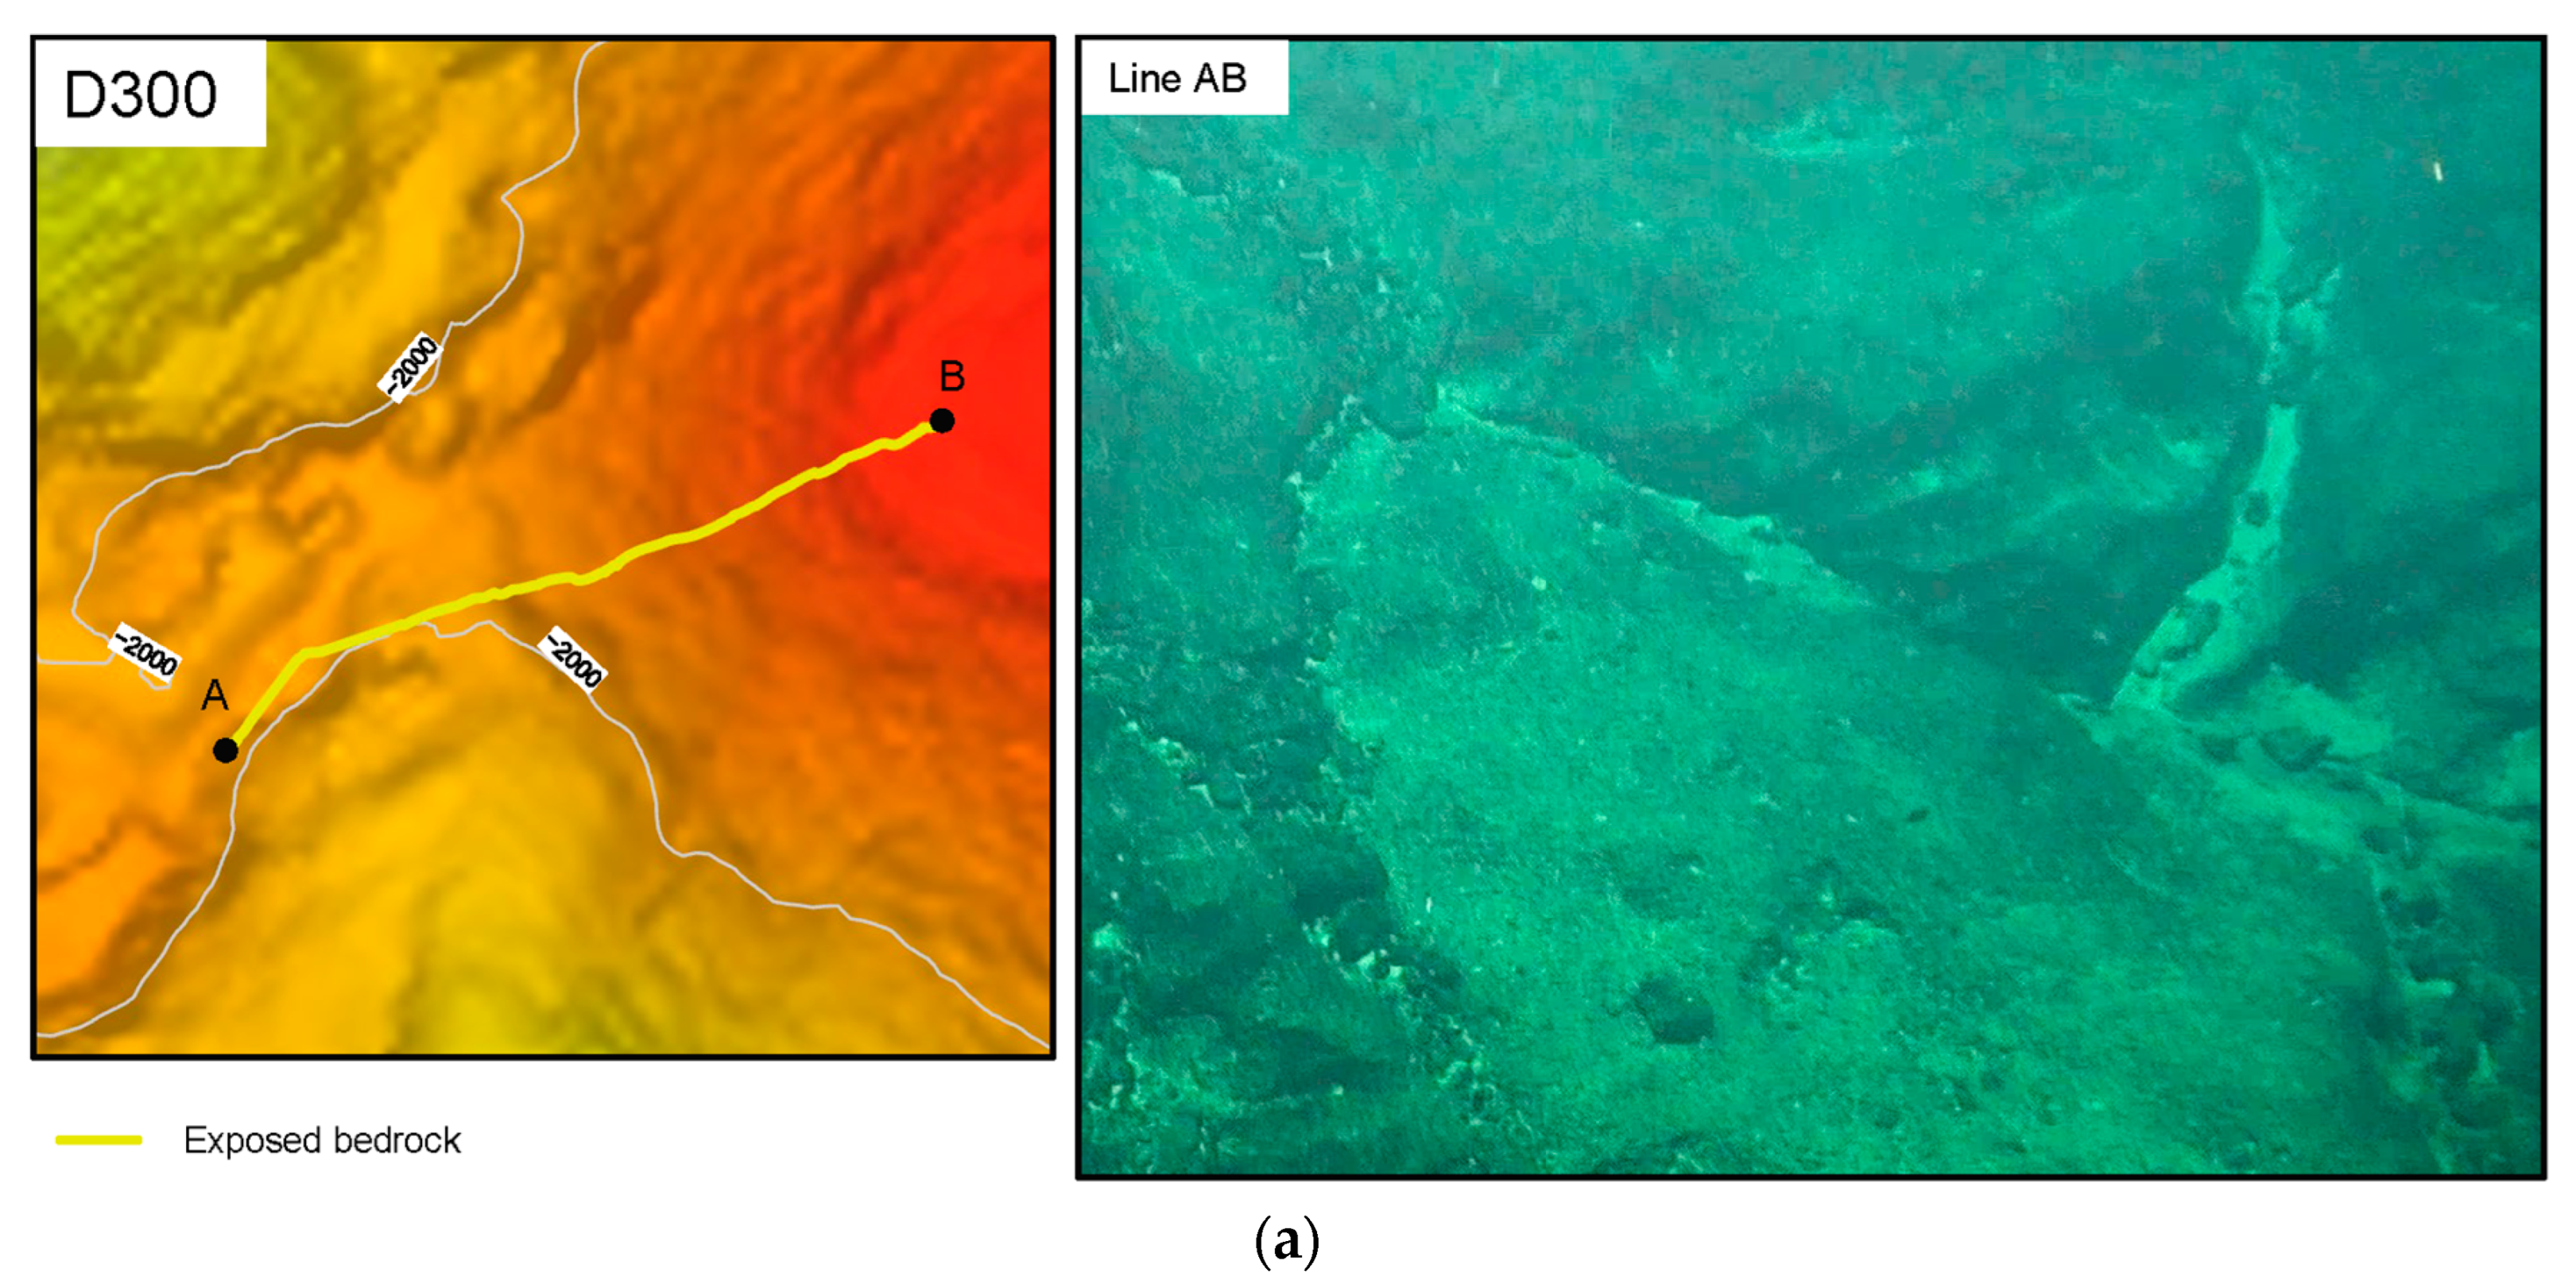
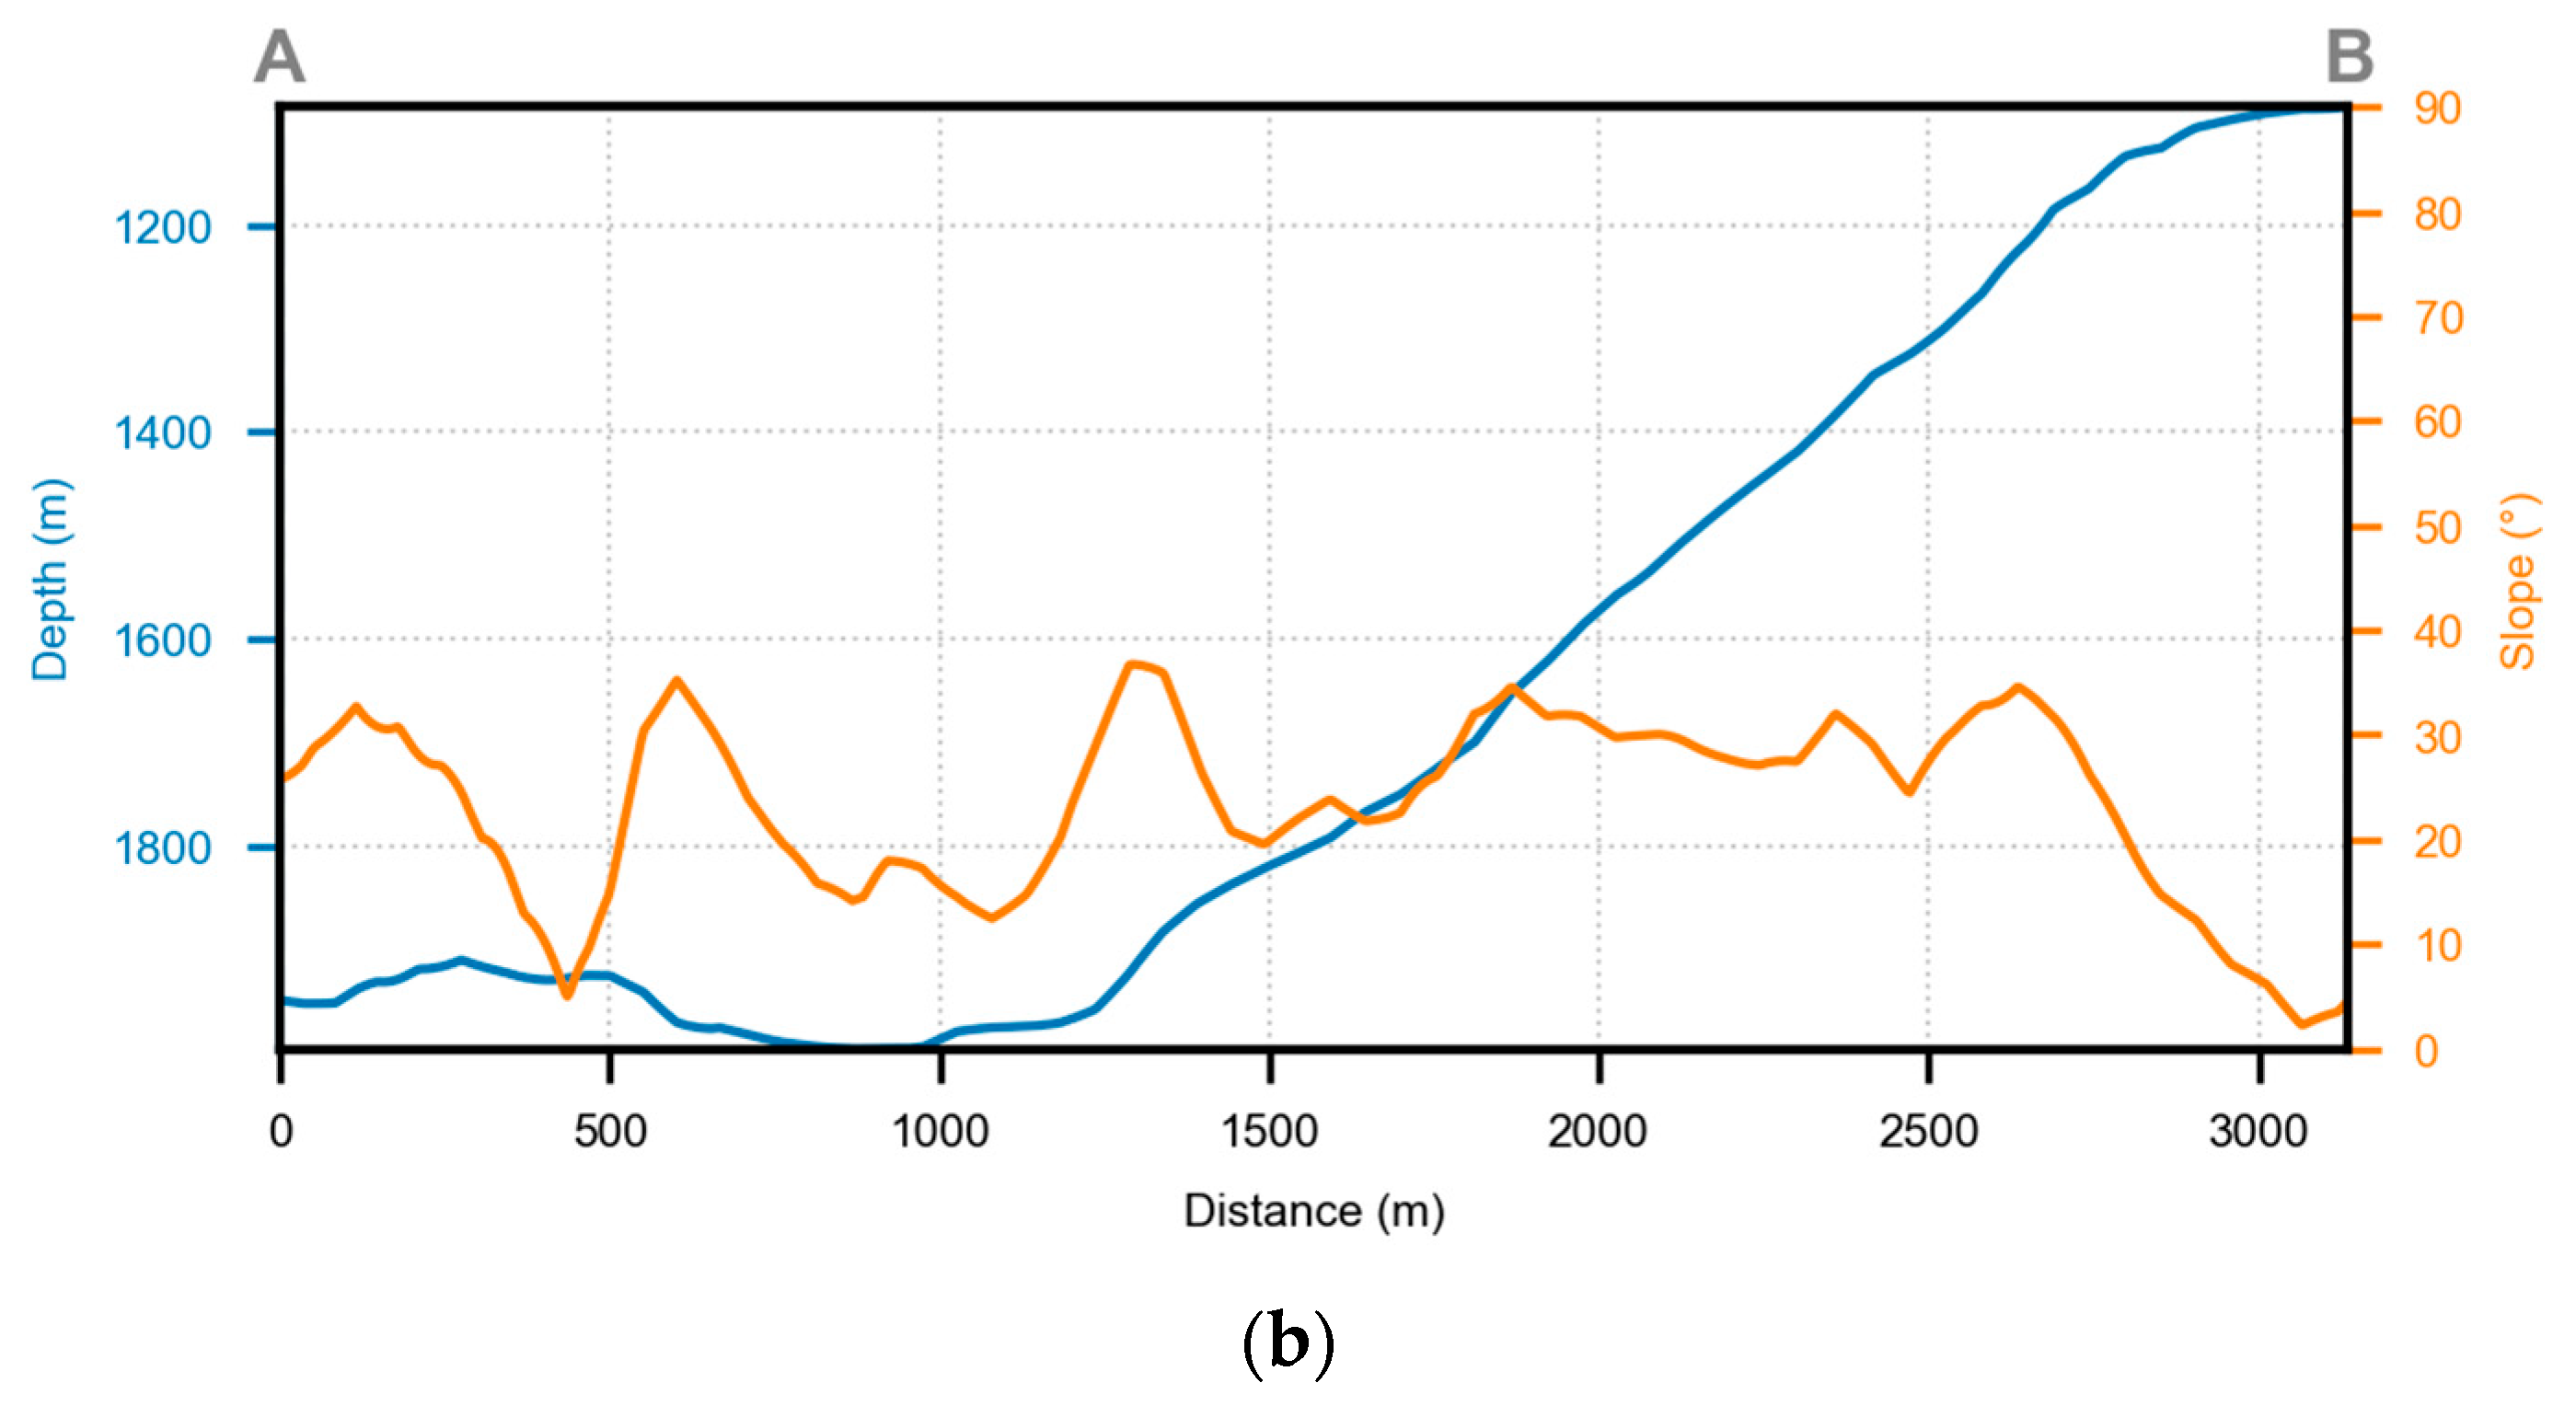
The seafloor substratum type in the D300 area is relatively uniform, consisting entirely of exposed bedrock with minimal sediment deposits. Some sections contain small amounts of rock debris (Figure 4a). The survey line spans 3258 m, with the depth gradually decreasing from 1950 m to 1086 m. The slope generally ranges between 0 and 40 degrees, exhibiting overall gradual changes (Figure 4b).
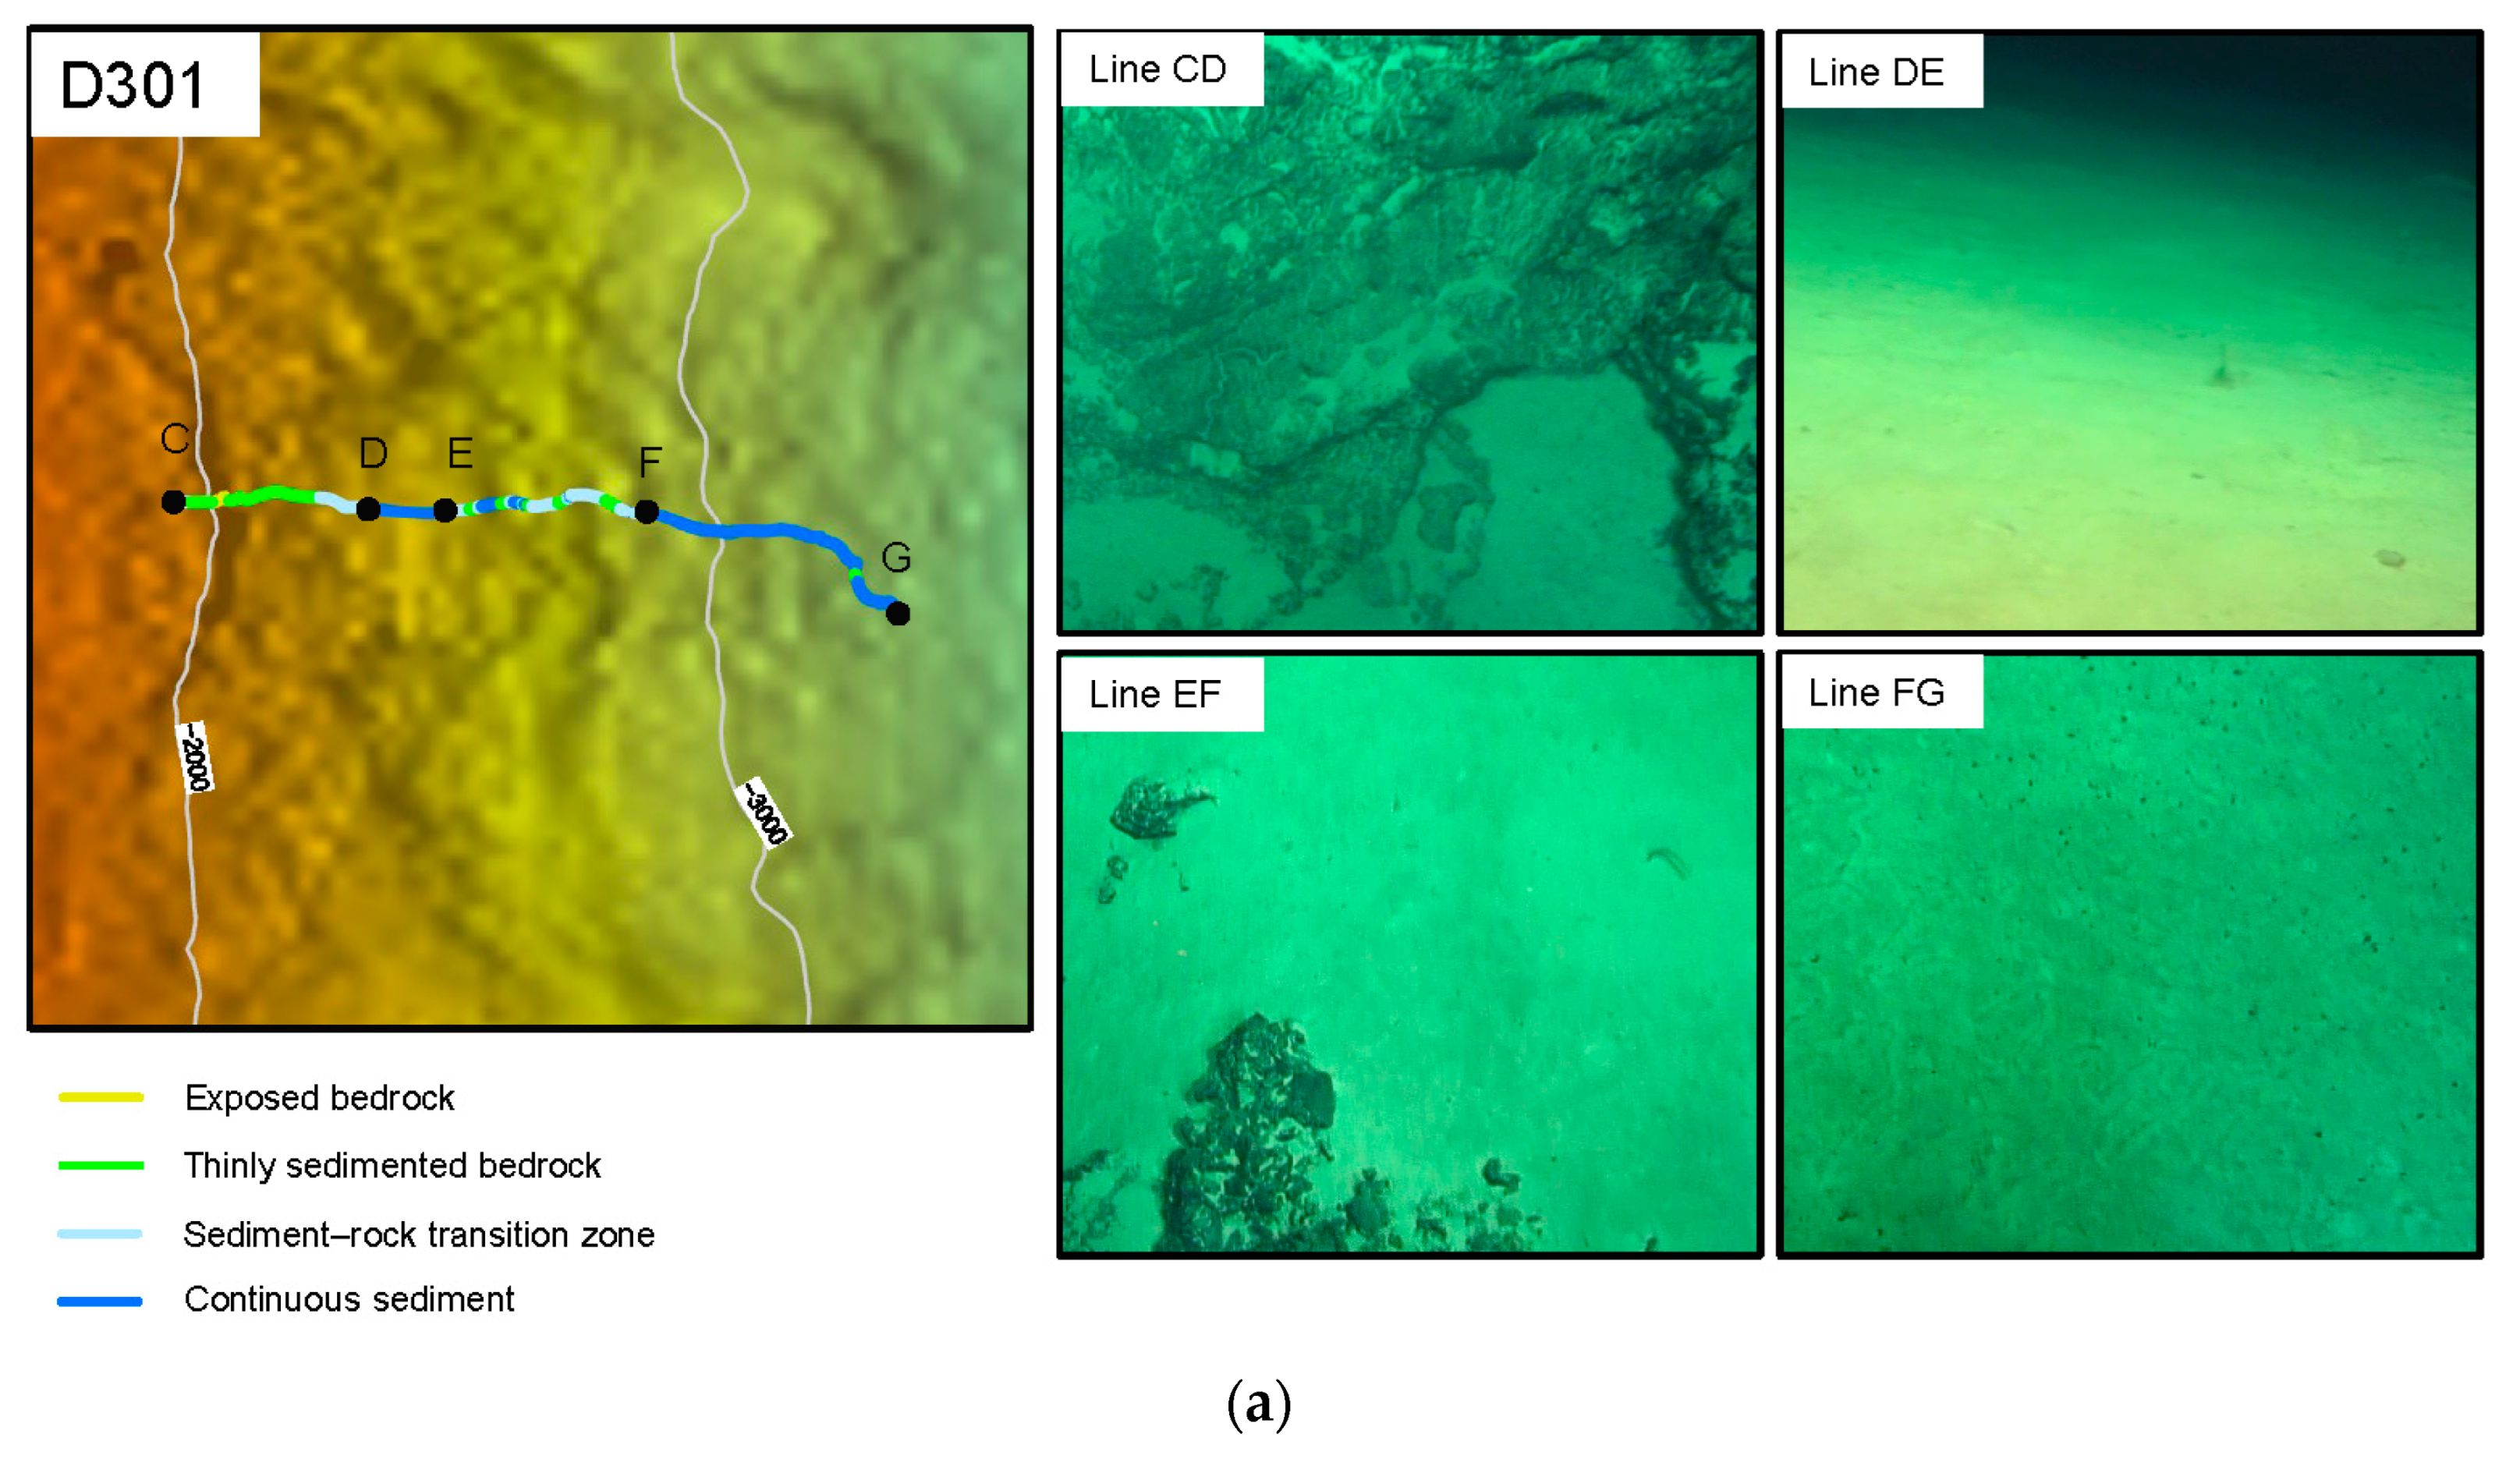
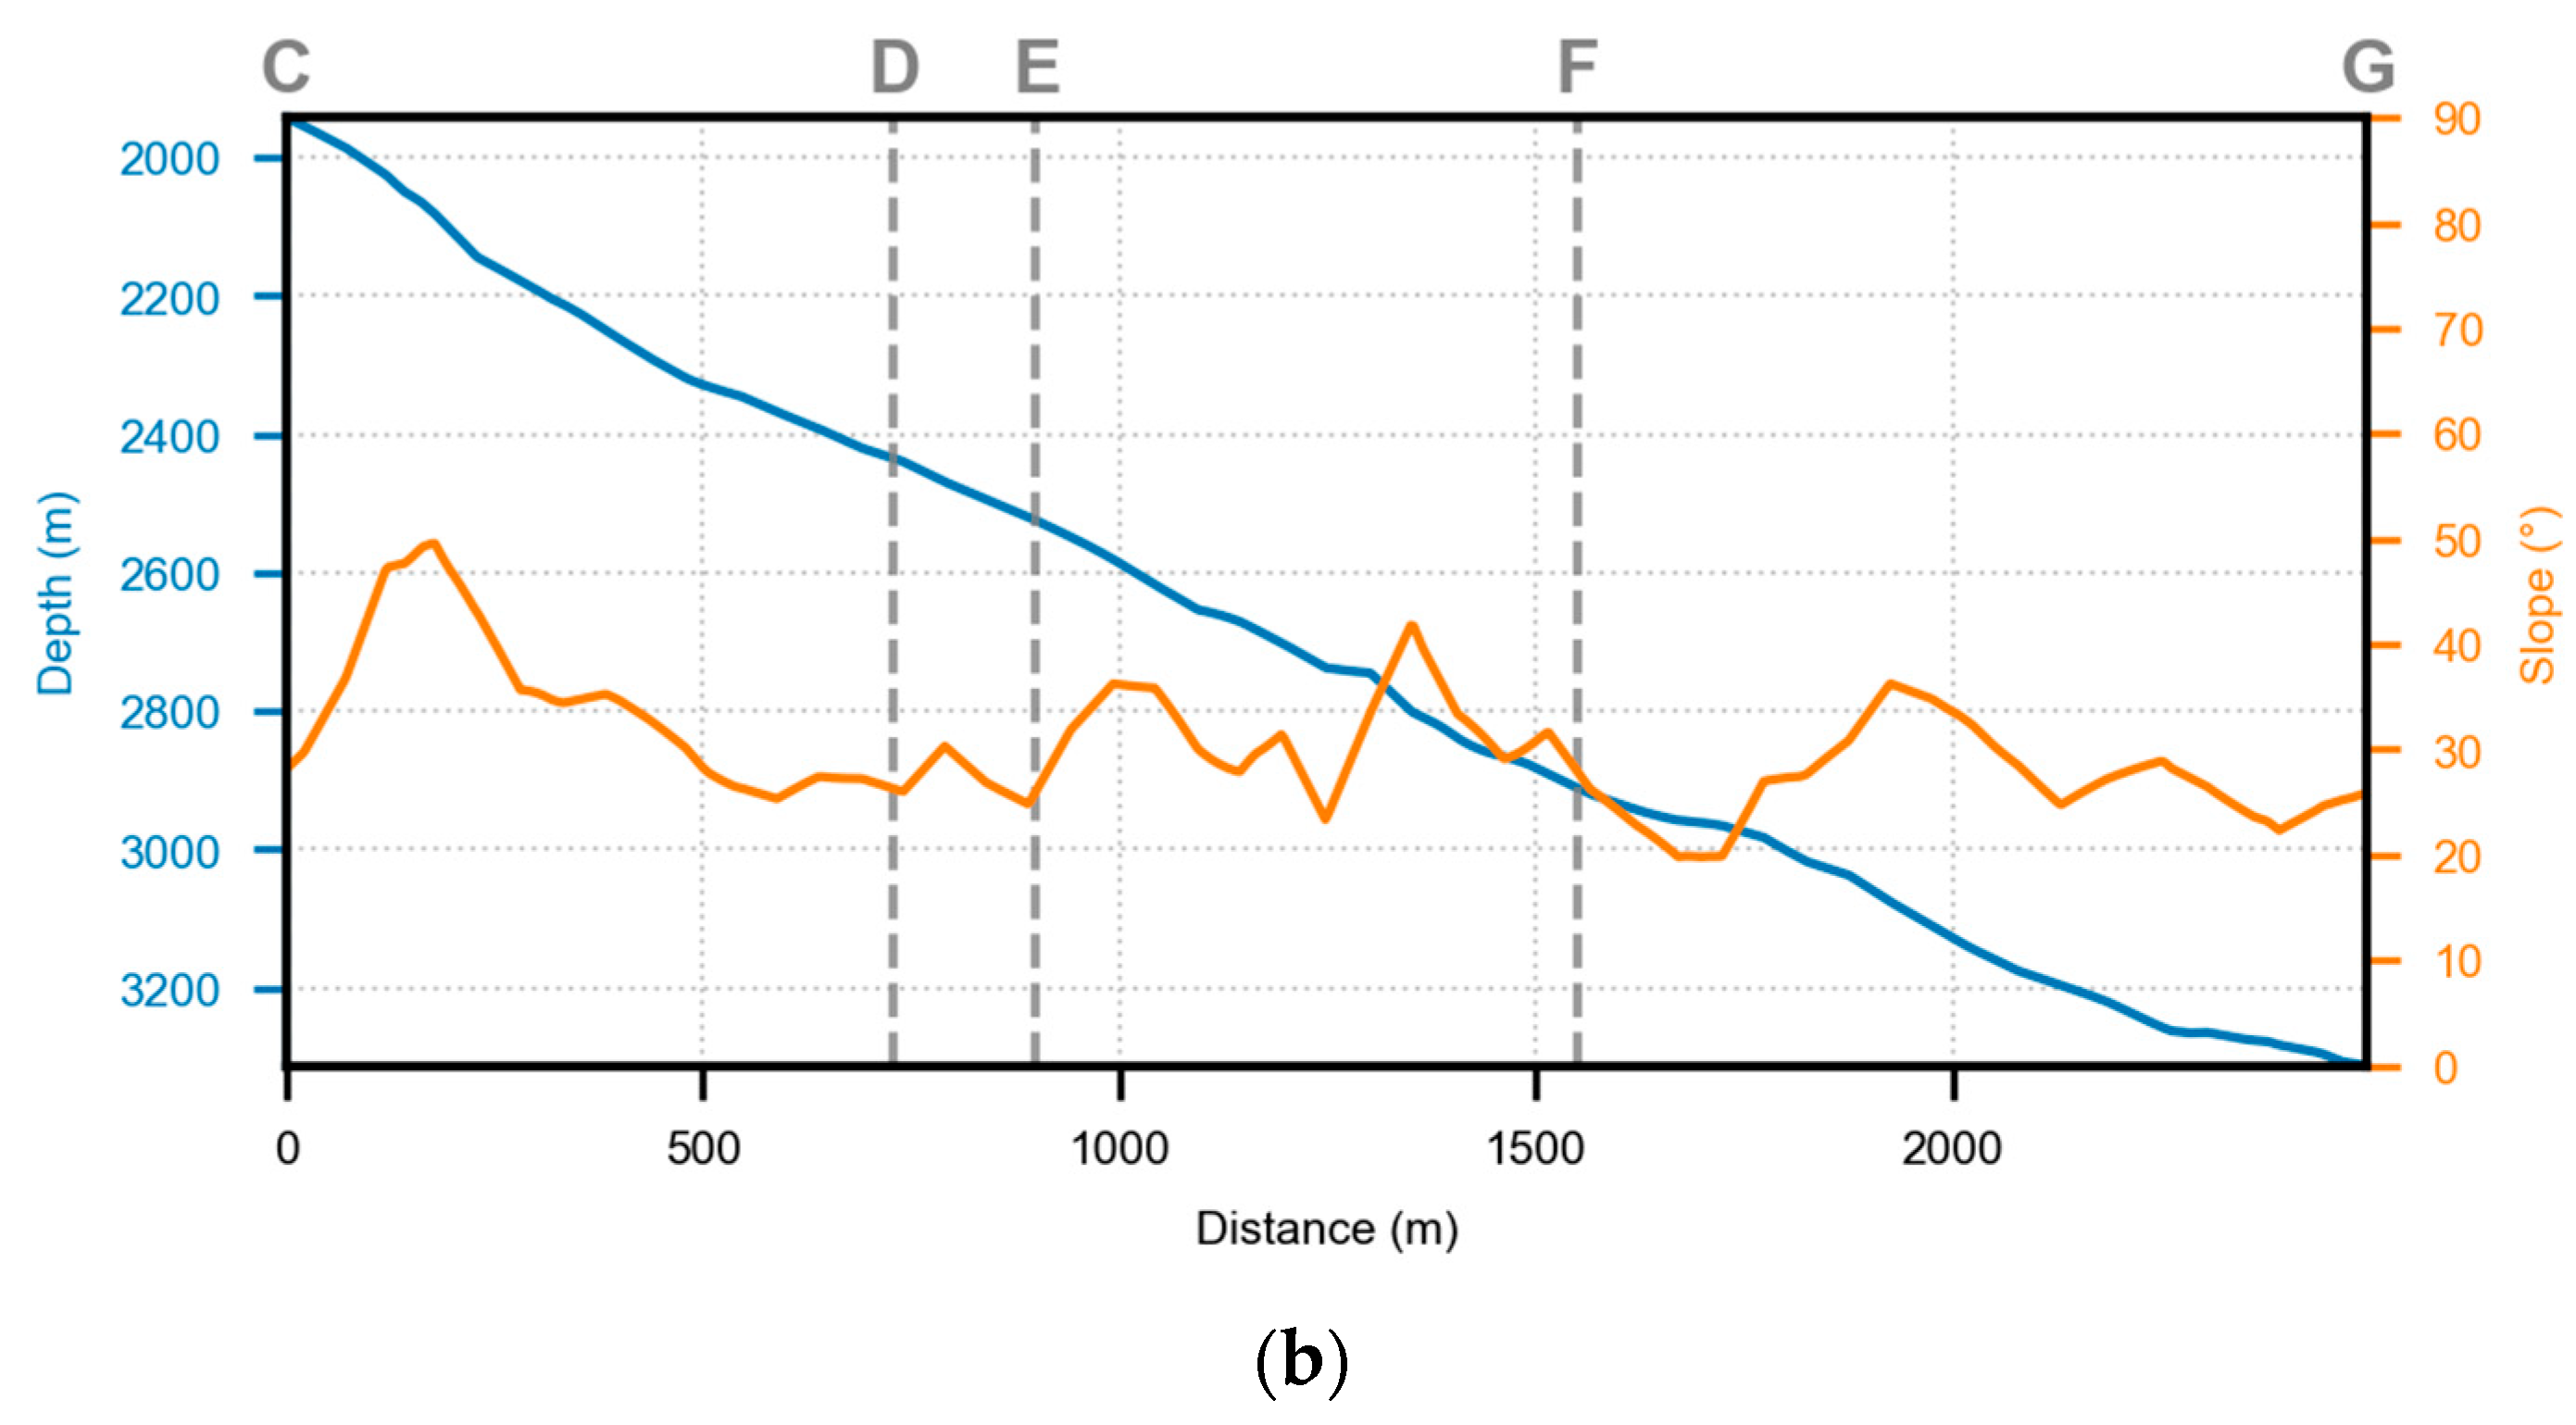
The sediment distribution in the D301 area is relatively complex. Section CD primarily consists of bedrock covered by thin sediment layers. With increasing depth, sediment accumulation gradually increases, transitioning into a sediment–rock transition zone where slope variations are significant. Section DE features continuous, relatively soft sediments with minimal slope changes. The EF section exhibits complex sediment distribution, primarily characterized by a sediment–rock transition zone. Some areas are entirely covered by sediments, while others contain minimal sediment deposits; the slope variations in this section are unstable. Due to the varying sediment cover in this region, the classification of substratum types is fragmented. The FG section consists mainly of continuous sediments, with occasional small amounts of gravel visible; the slope variations here are also unstable (Figure 5).
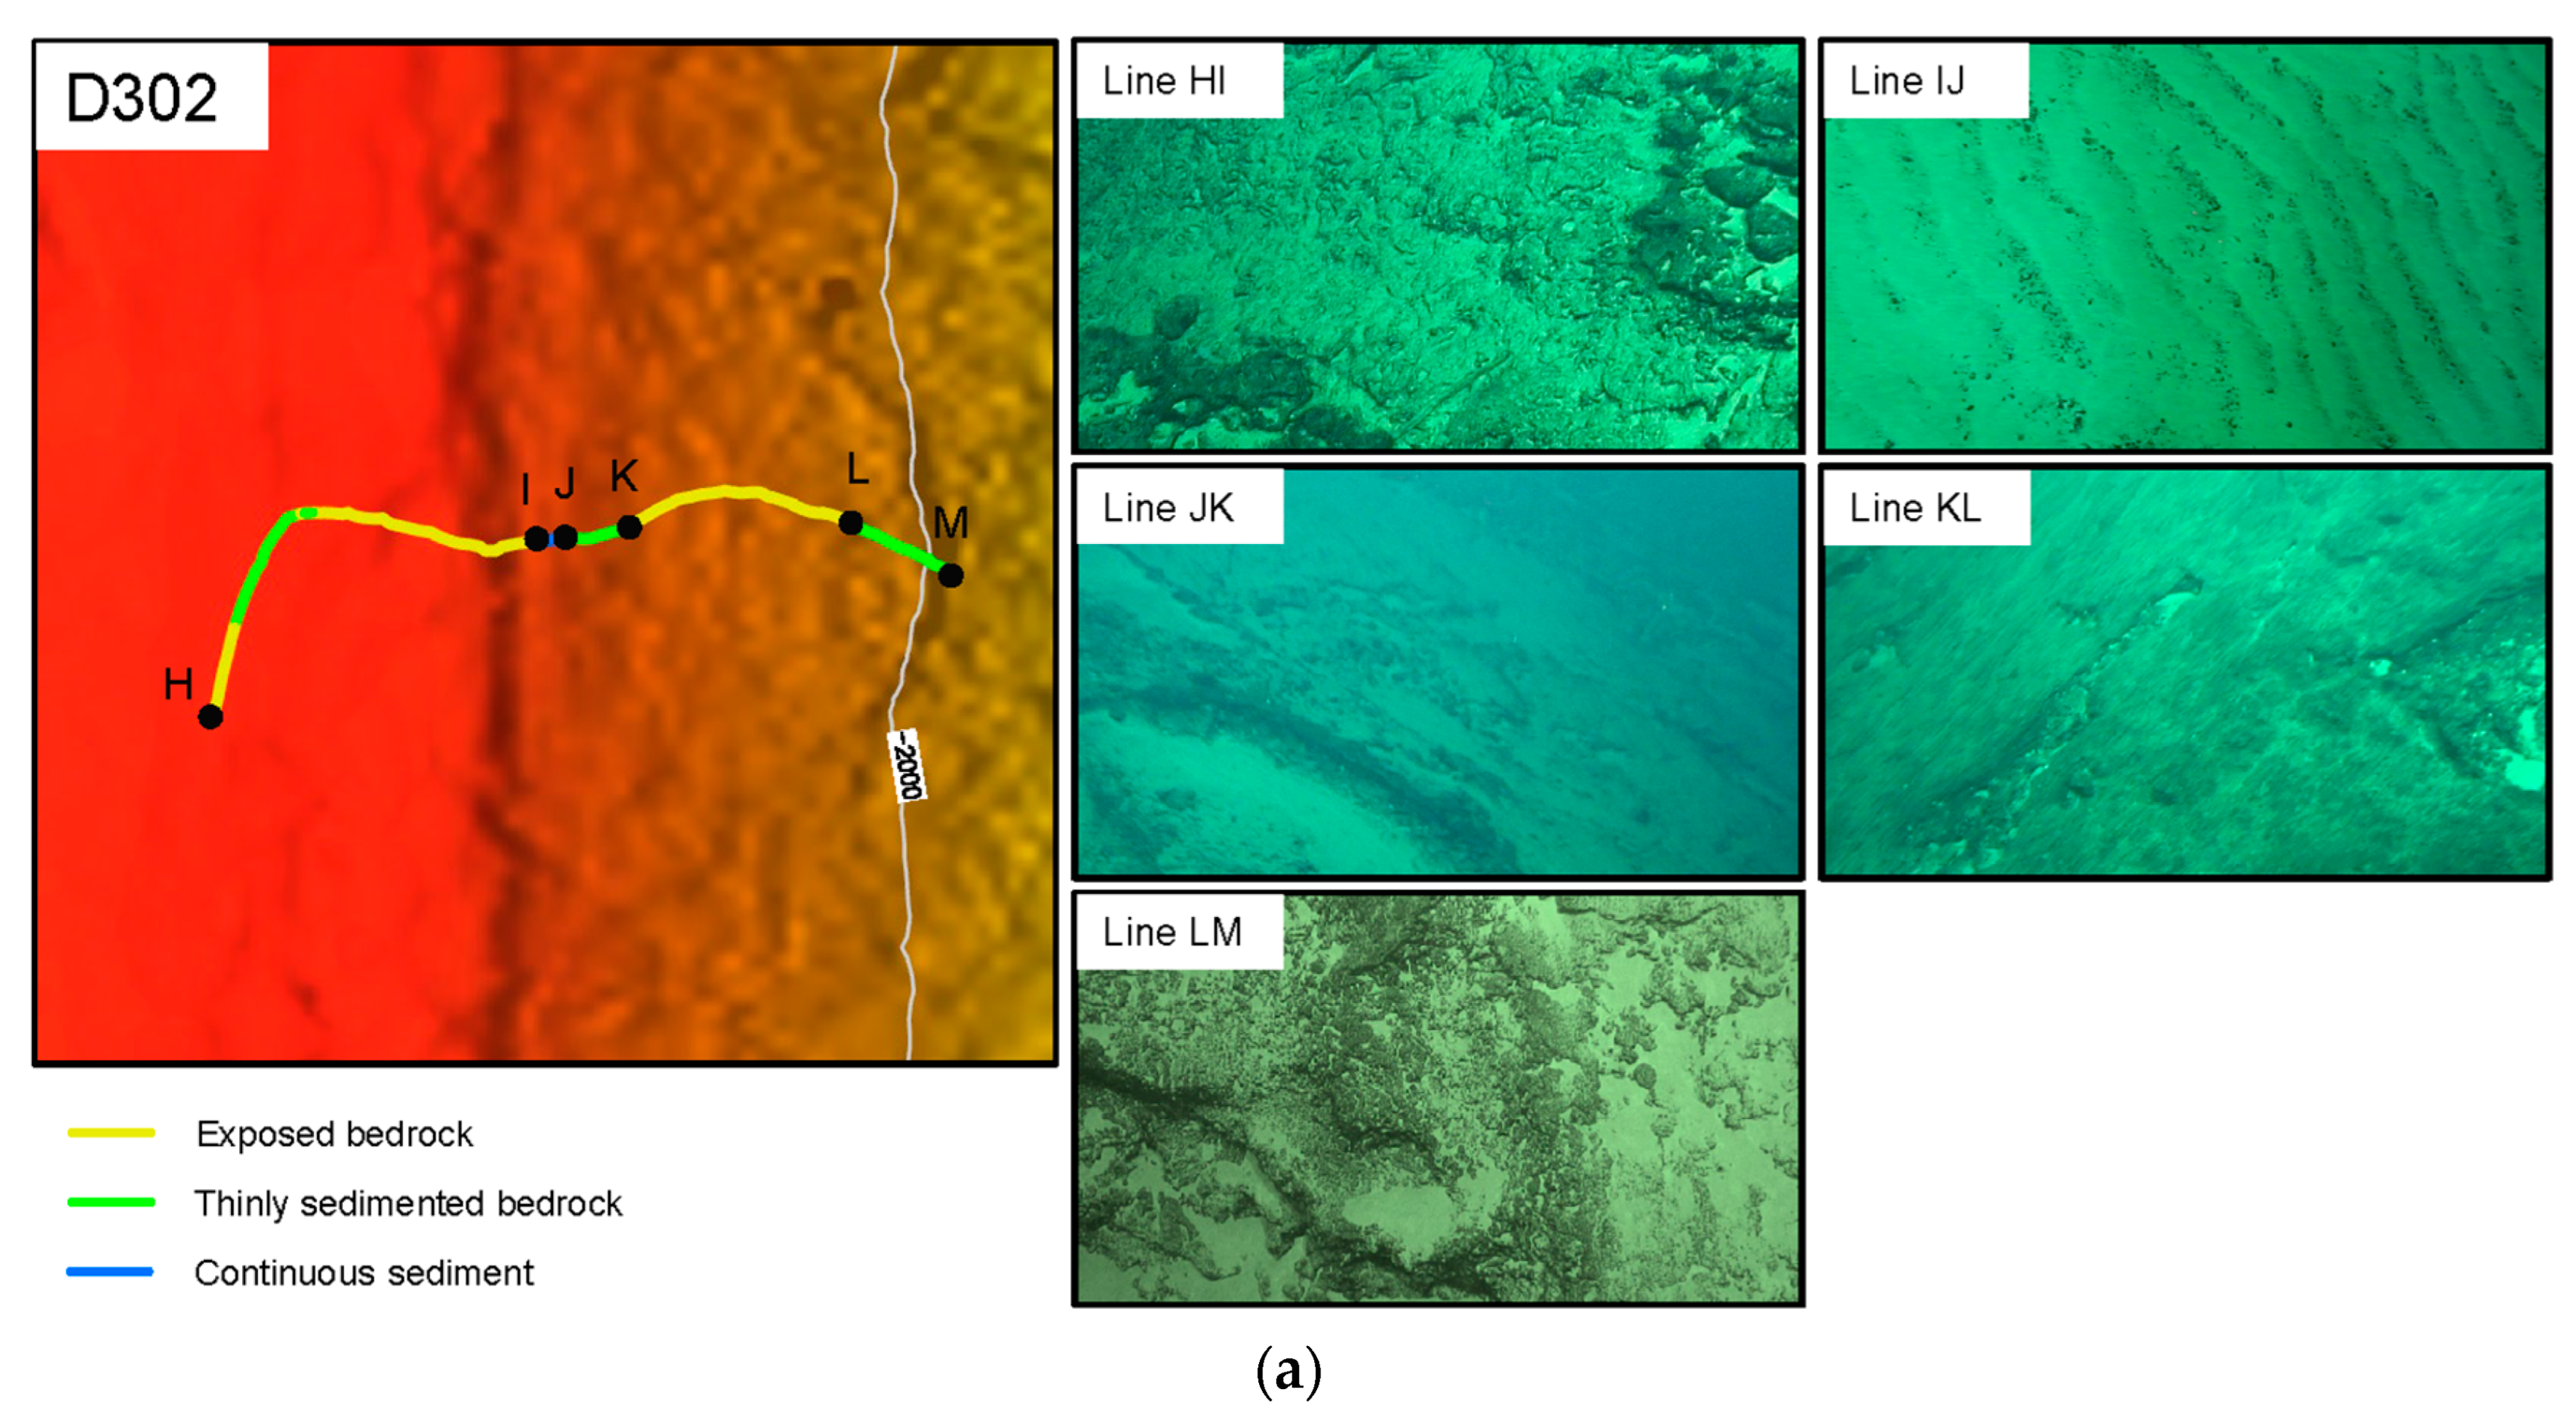
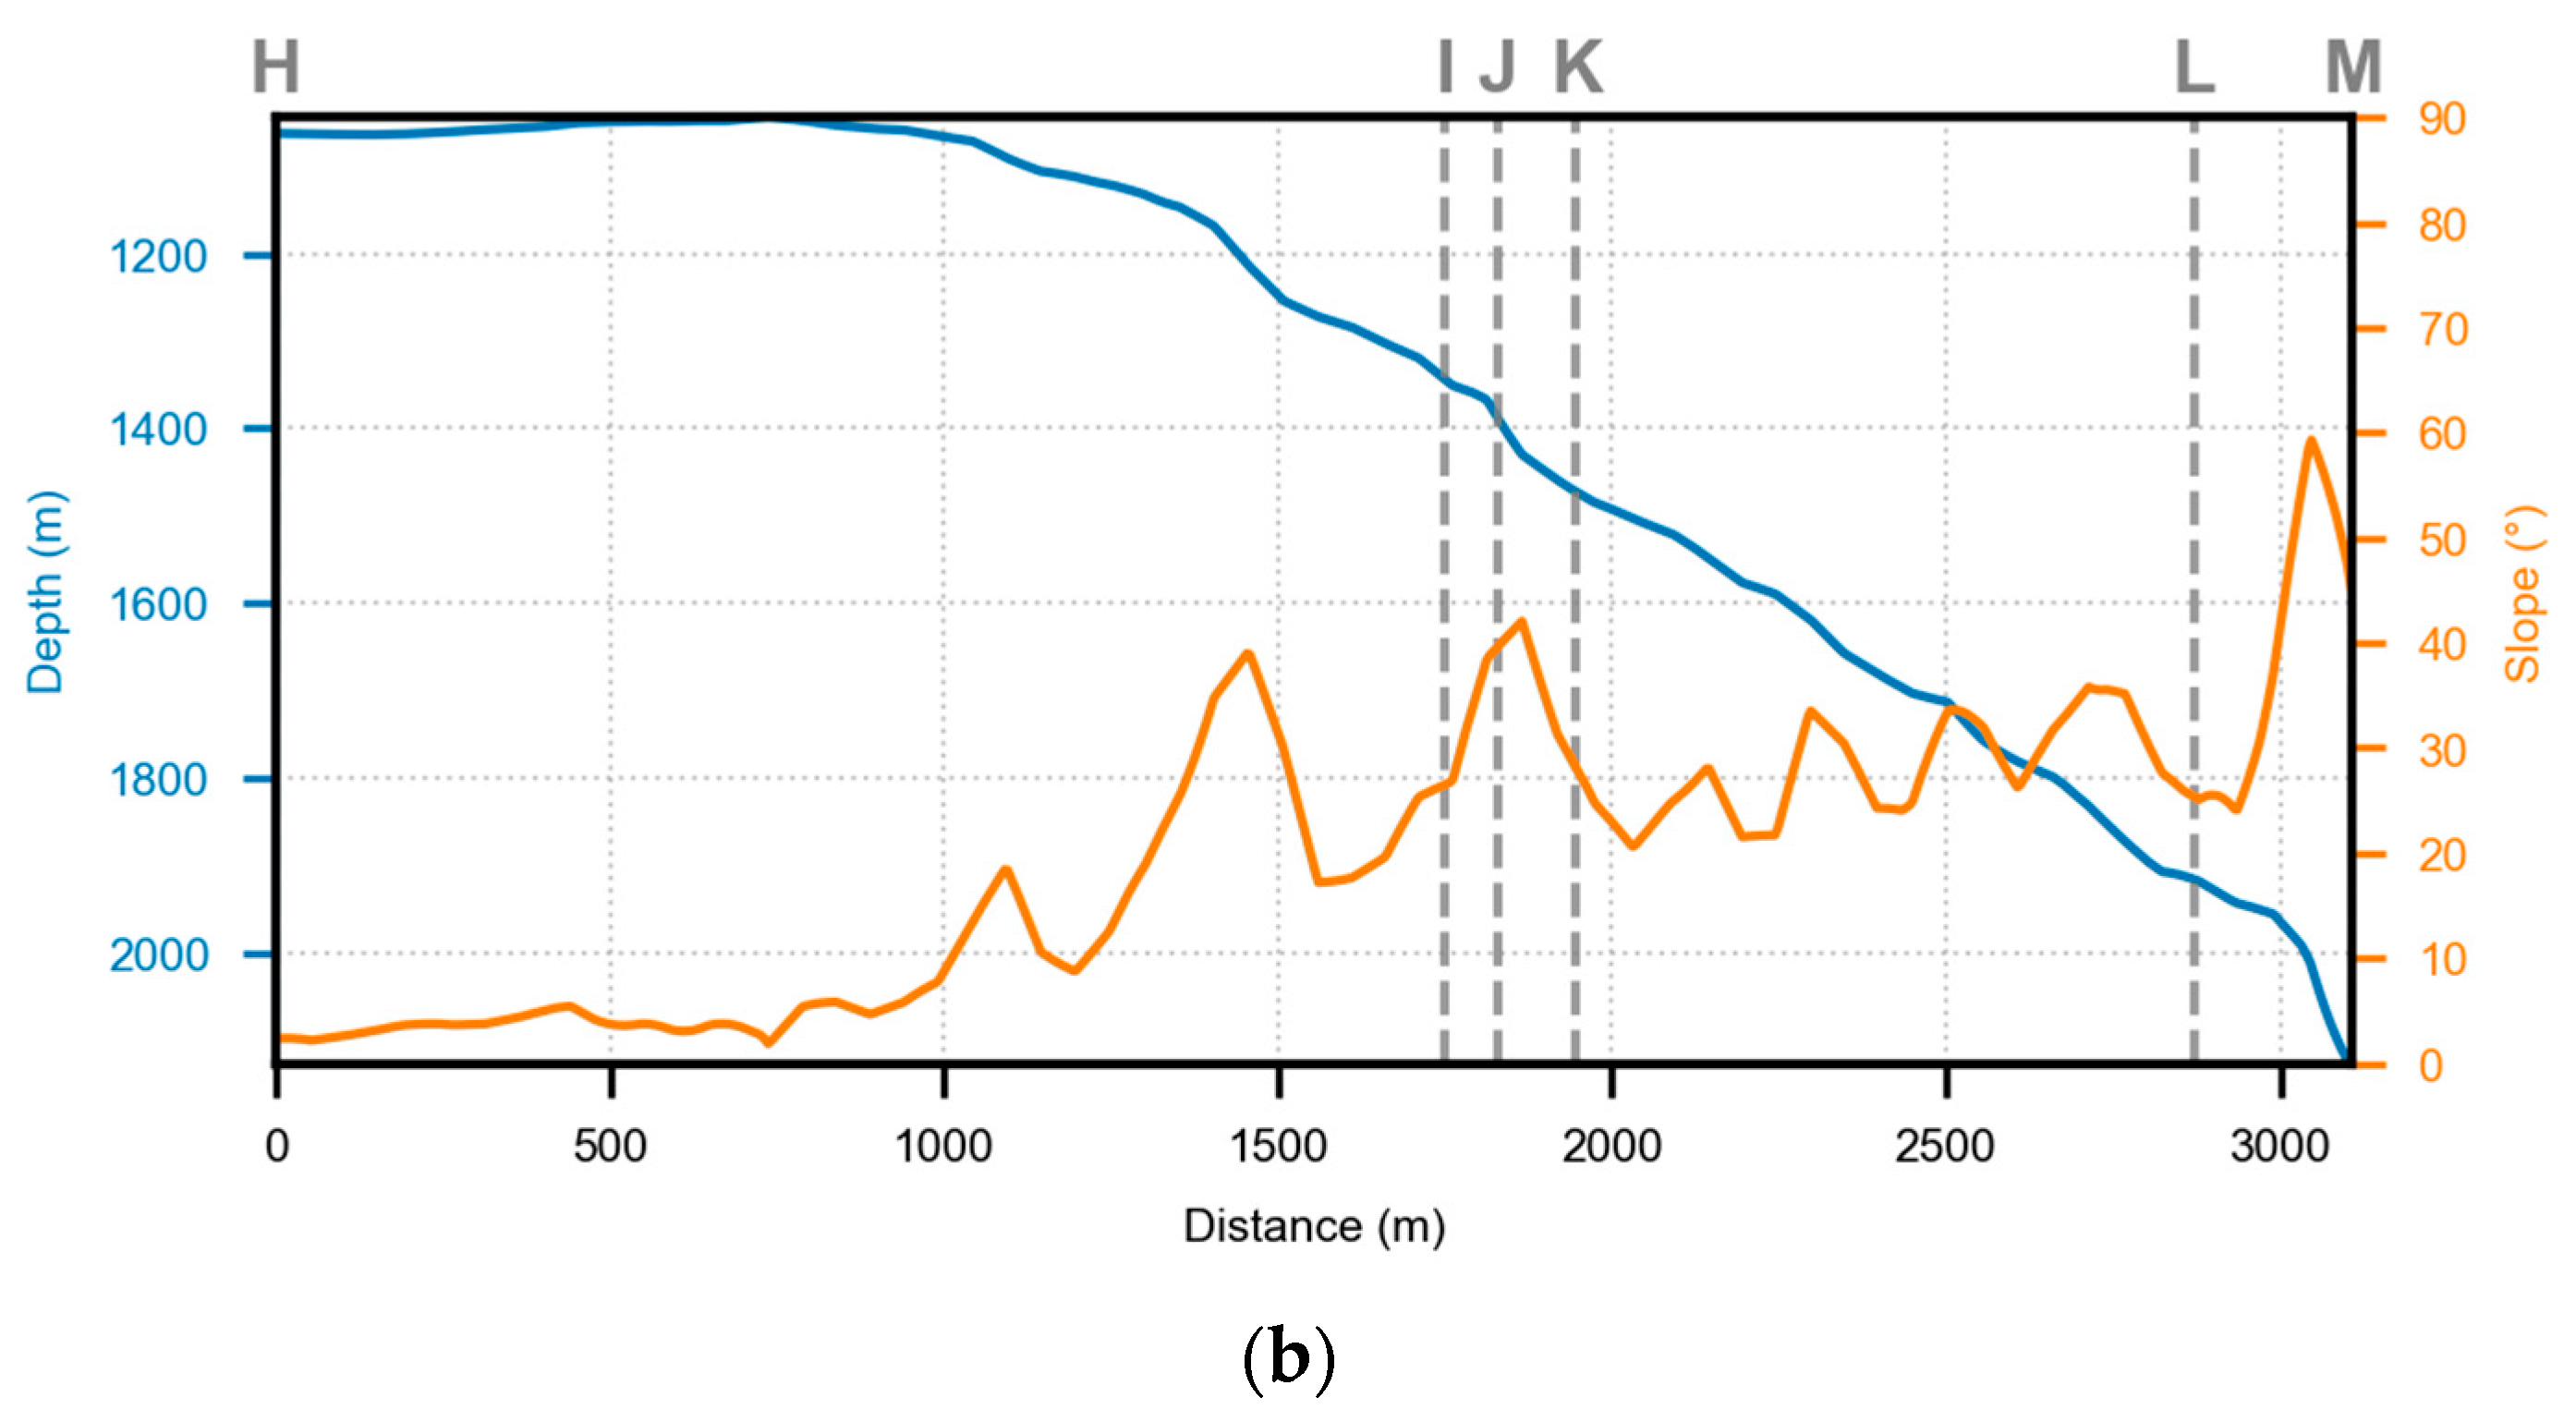
The D302 area exhibits minimal sediment cover. The HI section consists primarily of exposed bedrock, with only a small portion covered by a thin layer of sediment. This area is located on a mountaintop plateau with relatively stable depth and slope variations. Section IJ is unique as a short stretch with sediment cover. Sediments here may be thin and potentially bury crusts, but the absence of drill core samples prevents the determination of underlying substratum types. Sections JK and LM feature bedrock covered by thin sediments with steep slopes. Section KL consists of exposed bedrock with negligible sediment cover (Figure 6).
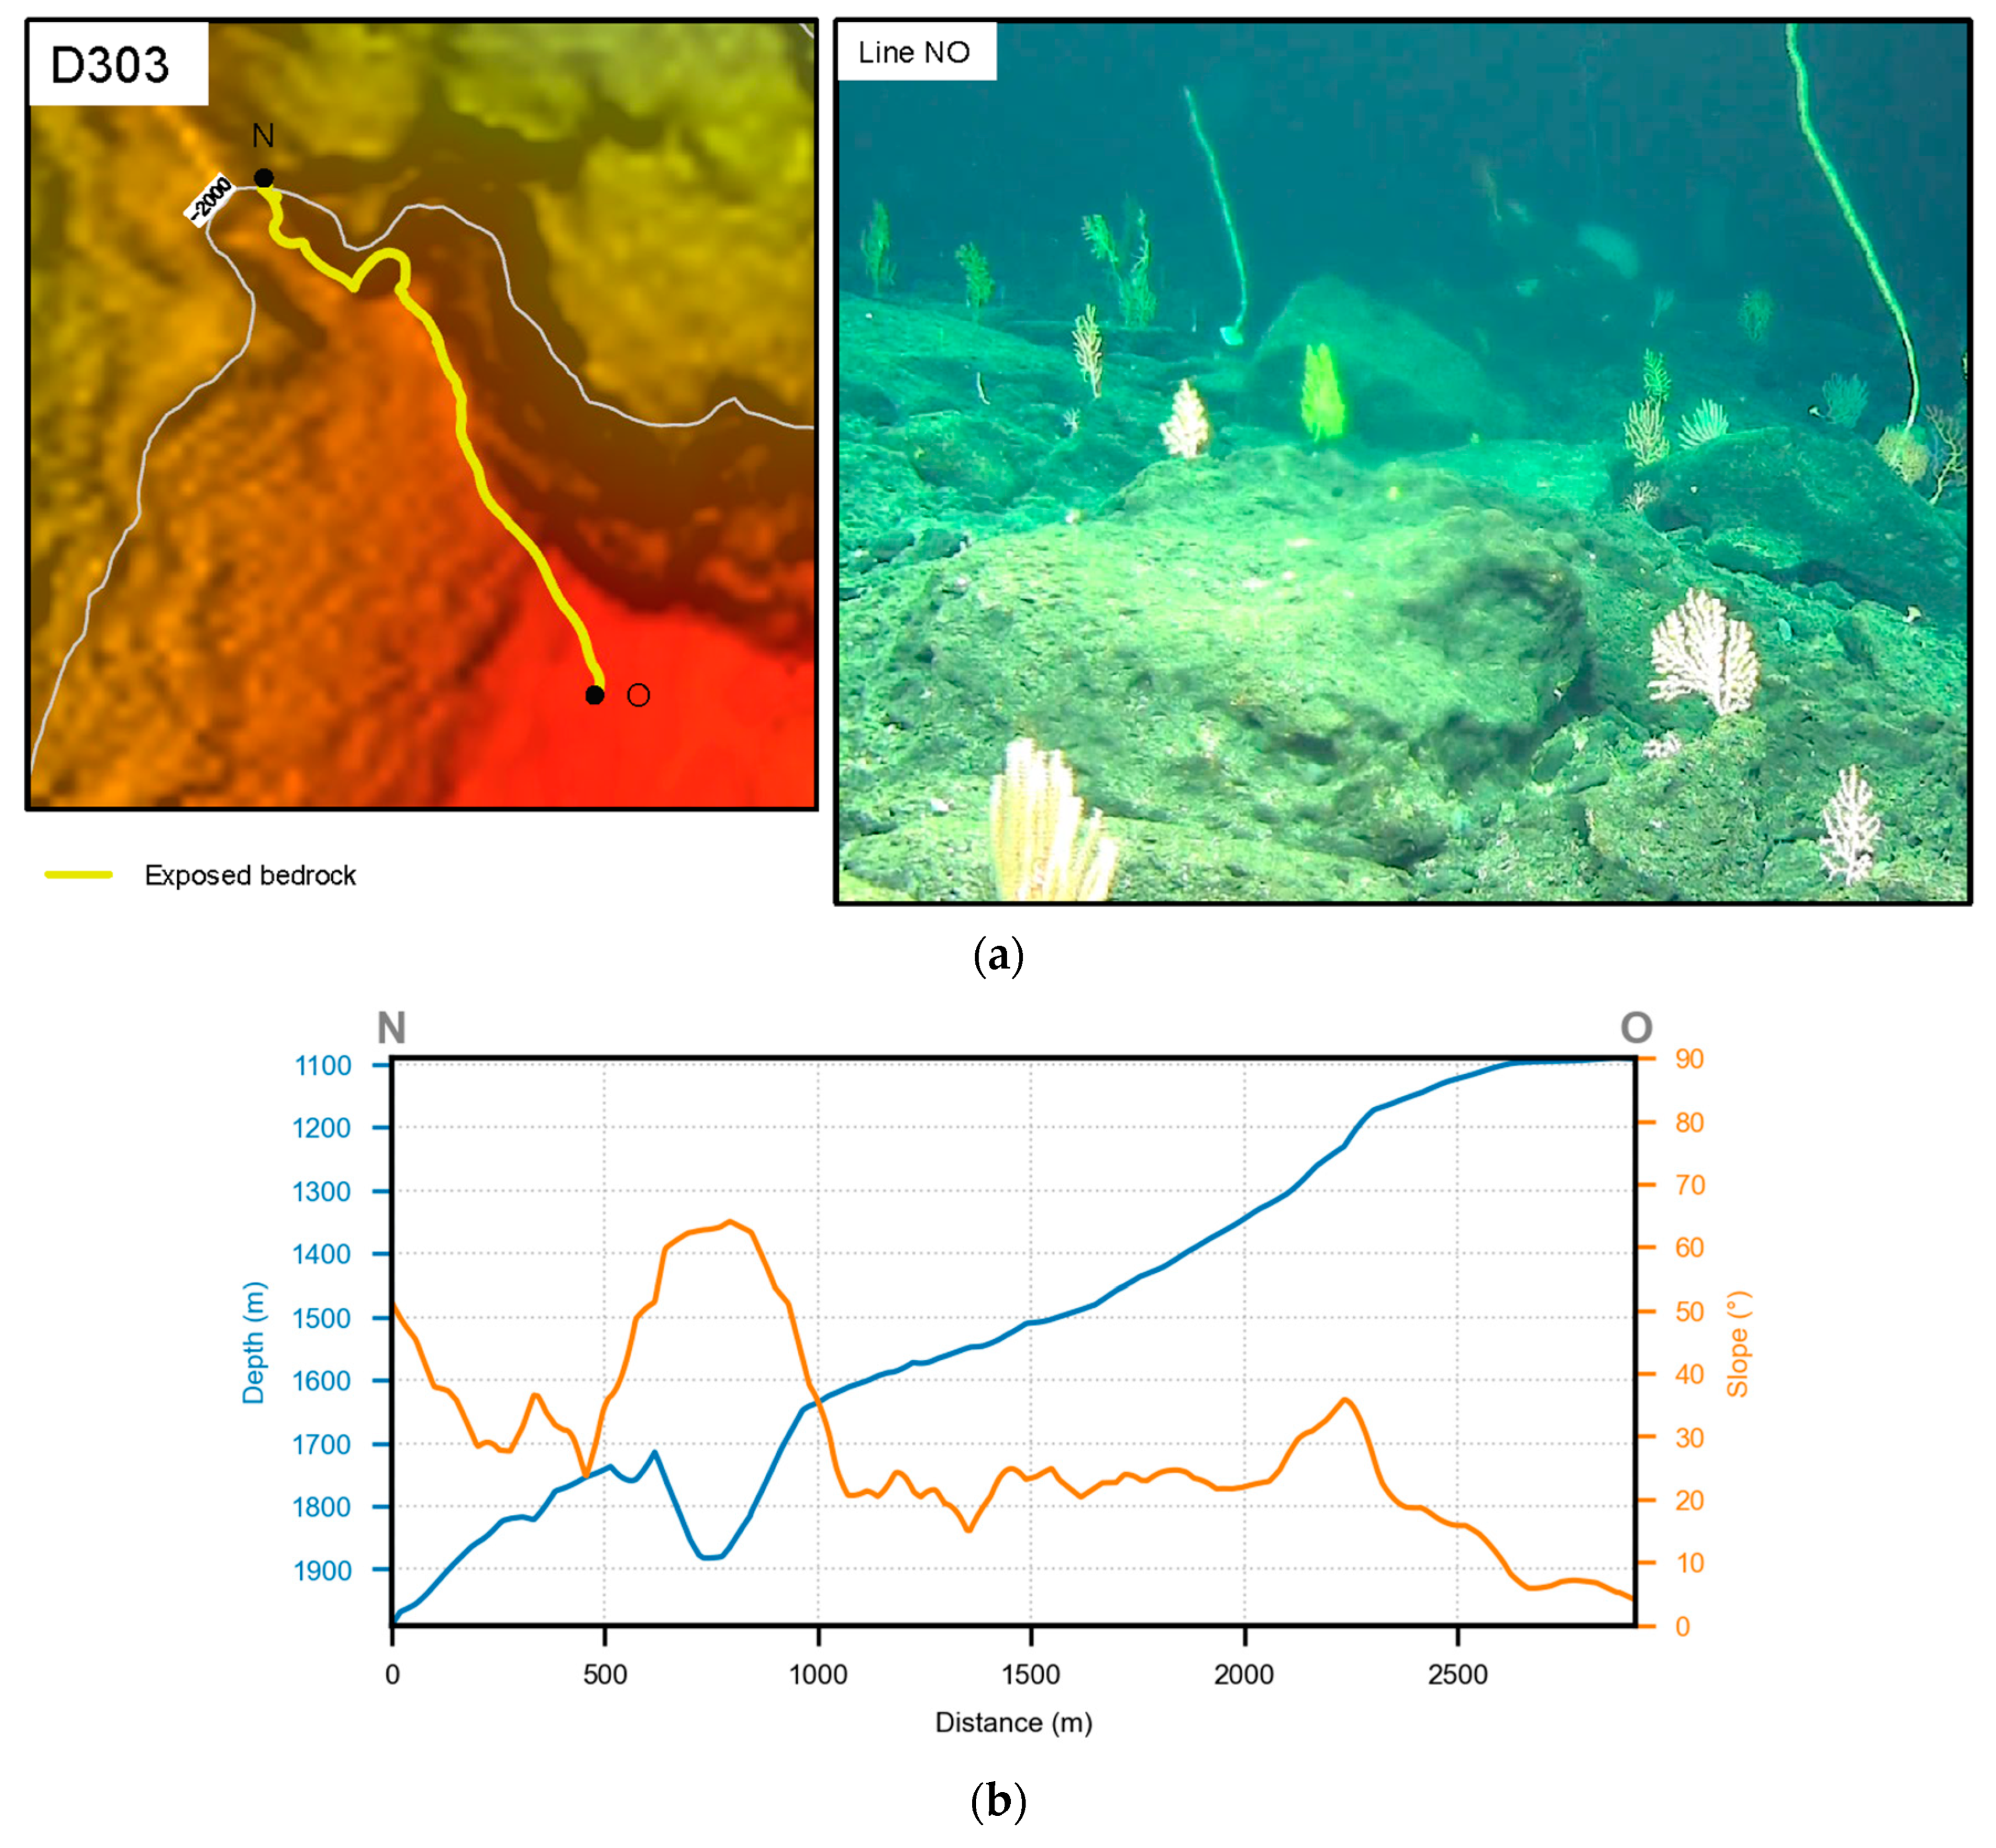
The area covered by D303 is similar to that of D300 in terms of substratum type, featuring a uniform substratum composed of exposed bedrock with minimal sedimentation and scattered rock debris in some sections. The steep slope observed in the NO segment indicates the presence of extremely steep sections along the ridge (Figure 7).

4.2. Substratum Type Classification Results

The training and validation sets were divided in a 4:1 ratio, with the specific details shown in Table 4. Based on the visual interpretation results, the data volume differed significantly among the four substratum types. Therefore, the category weighting method was employed for substratum type classification in this study.
Based on mRMR, the top 10 feature groups with high correlation and low redundancy were extracted as follows: Depth, Con, Gabor-0°, E 5 E 5 , Hom, S 5 S 5 , Mean, Dis, Var, Cor. However, applying Pearson’s correlation coefficient revealed excessive correlations between Gabor-0° and Mean/Var, as well as between Con and Dis/Cor (correlation coefficients exceeding 0.8). Therefore, the four features Mean, Var, Dis, and Cor were excluded, retaining the six features Depth, Con, Gabor-0°, E 5 E 5 , Hom, and S 5 S 5 for model training. The results after model training are shown in Table 5.
In terms of accuracy, exposed bedrock and continuous sediment demonstrate relatively good classification performance, while thinly sedimented bedrock and sediment–rock transition zone show less satisfactory results, especially sediment–rock transition zone, which only achieves an accuracy of 78.68%. Among the recall rates, all three substratum types performed well except for thinly sedimented bedrock, which reached 89.23%.
The trained CNN model was applied to classify the substratum type across the entire seamount. Following post-processing of the classification results, the sediment distribution pattern of the DD Guyot was obtained (Figure 8).

5. Discussion

5.1. Substratum Type Classification Effect

As shown in Table 5, exposed bedrock is primarily misclassified as thinly sedimented bedrock, suggesting some similarity in their features, though the overall distinguishability remains high. Thinly sedimented bedrock is partially misclassified as sediment–rock transition zone, with isolated instances misclassified as exposed bedrock and continuous sediment, indicating confusion. The sediment–rock transition zone is partially misclassified as continuous sediment, with one sample misclassified as thinly sedimented bedrock, while numerous other samples are correctly classified as sediment–rock transition zone, which would increase the error in the substratum classification results. Some continuous sediment samples were misclassified as sediment–rock transition zone but not assigned to other substratum types, indicating that the characteristics of continuous sediment are relatively distinct.
Exposed bedrock and continuous sediment exhibit relatively high classification accuracy due to their simpler substratum type composition. Misclassifications primarily occur in transitional zones, with the sediment–rock transition zone being the most problematic. This is expected, and reduces confidence in transitional boundaries. This stems from three factors: first, the limited sample size for this category, which, despite balancing adjustments, still yields inferior results compared to categories with larger samples. Second, this transition zone inherently bridges “exposed bedrock” and “continuous sediment,” with acoustic characteristics often intermediate, leading to confusion. Third, the complex nature of this area also introduces some misclassification into visual interpretation, thereby affecting the classification accuracy of the deep learning model. Although the accuracy of the sediment–rock transition zone is not high, there are no misclassifications of exposed bedrock into this type. Overall, the sediment–rock transition zone still clearly represents the transition between thinly sedimented bedrock and sediment–rock transition zone, effectively reflecting changes in sediment cover across the region.
This study compares the CNN with models such as RF, SVM, AdaBoost, and Multilayer Perceptron (MLP) (Table 6). The CNN model achieves the best performance.
Repeated MBES surveys combined with CNN classification could be used to monitor sediment redistribution, slope stability, or post-landslide recovery. With adaptation to shallower-water MBES datasets, the approach can be applied in coastal engineering, dredging impact assessment, or marine protected area management.
However, it should be noted that the relatively limited number of submersible video transects limits the robustness of the training data. Expanding coverage using remotely operated vehicles (ROVs), autonomous underwater vehicles (AUVs), or towed cameras would strengthen model calibration. MBES and optical data only provide information on surface layers. Internal stratigraphy and sediment thickness remain unknown without seismic profiling or coring. Meanwhile, efforts should be made to apply this model to continental slopes, abyssal plains, hydrothermal vent fields, and mid-ocean ridges where complex sediment–rock mosaics occur.

5.2. Characteristics of Overall Sediment Distribution in the DD Guyot

The analysis of the Jiaolong trajectory provides a general overview of sediment distribution. Line AB in Figure 4 primarily traverses the ridge, reaching a maximum depth of 1998 m. Line NO in Figure 7 also mainly follows the ridge, with a maximum depth of 2044 m. Line HI in Figure 6 primarily traverses the summit plateau, with Point I at a depth of 1283 m. The substratum type in these areas is predominantly exposed bedrock, with occasional patches of sediment. Starting from Point L in Figure 6, the substratum type is predominantly thinly sedimented bedrock at a depth of 1913 m. From Point D in Figure 5, the substratum type is primarily sediment–rock transition zone at a depth of 2393 m. From Point F in Figure 5, the substratum type is mainly continuous sediment at a depth of 2918 m. This suggests that, on the flank, sediment cover generally increases with depth.
A comprehensive analysis of Figure 8 reveals that most of the summit platform consists of exposed bedrock. In ridge zones, sediment cover generally decreases with proximity to the ridge’s central axis. On the flank, sediment distribution is closely correlated with depth and slope. In areas with shallower depths and steeper slopes, sediment cover tends to be relatively low; as depth increases and slope decreases, sediment cover gradually rises. This is primarily attributed to bottom currents transporting sediments from steeper upper slopes to lower areas for deposition.
The scour marks and ripples on the flank of the DD Guyot (Figure 6) align with the erosion–deposition processes of contourites dominated by bottom currents [8], forming flow-controlled flat terraces (Figure 8). Therefore, bottom currents may be a significant factor in sediment transport in this region, but in situ observations using moored current meters and acoustic doppler current profilers (ADCPs) are still needed to investigate the specific reasons.
The specific conditions for each substratum type are detailed in Table 7.
Seamounts harbor abundant cobalt-rich crust resources, predominantly distributed in the upper slopes. Typical cobalt-rich crust distribution zones include summit margins, ridges, and upwind-facing slope sections [52], consistent with video data from manned submersibles. Due to unknown sediment thickness and the absence of drilling samples, it remains uncertain whether cobalt-rich crusts develop beneath sediment-covered areas [53]. Polymetallic nodules are typically scattered across the seafloor surface, either exposed above sediments or buried within them [15]. The sediments themselves are rich in rare earth elements [54]. Therefore, the resource characteristics of different areas on the seamount can be inferred based on the extent of sediment cover. The exposed bedrock and thinly sedimented bedrock areas in the upper part of the DD Guyot should be prioritized as exploration targets for cobalt-rich crusts, while the continuous sediments near the abyssal plain are more suitable for the occurrence of polymetallic nodules and rare earth elements. These will be complementary to geochemical exploration.
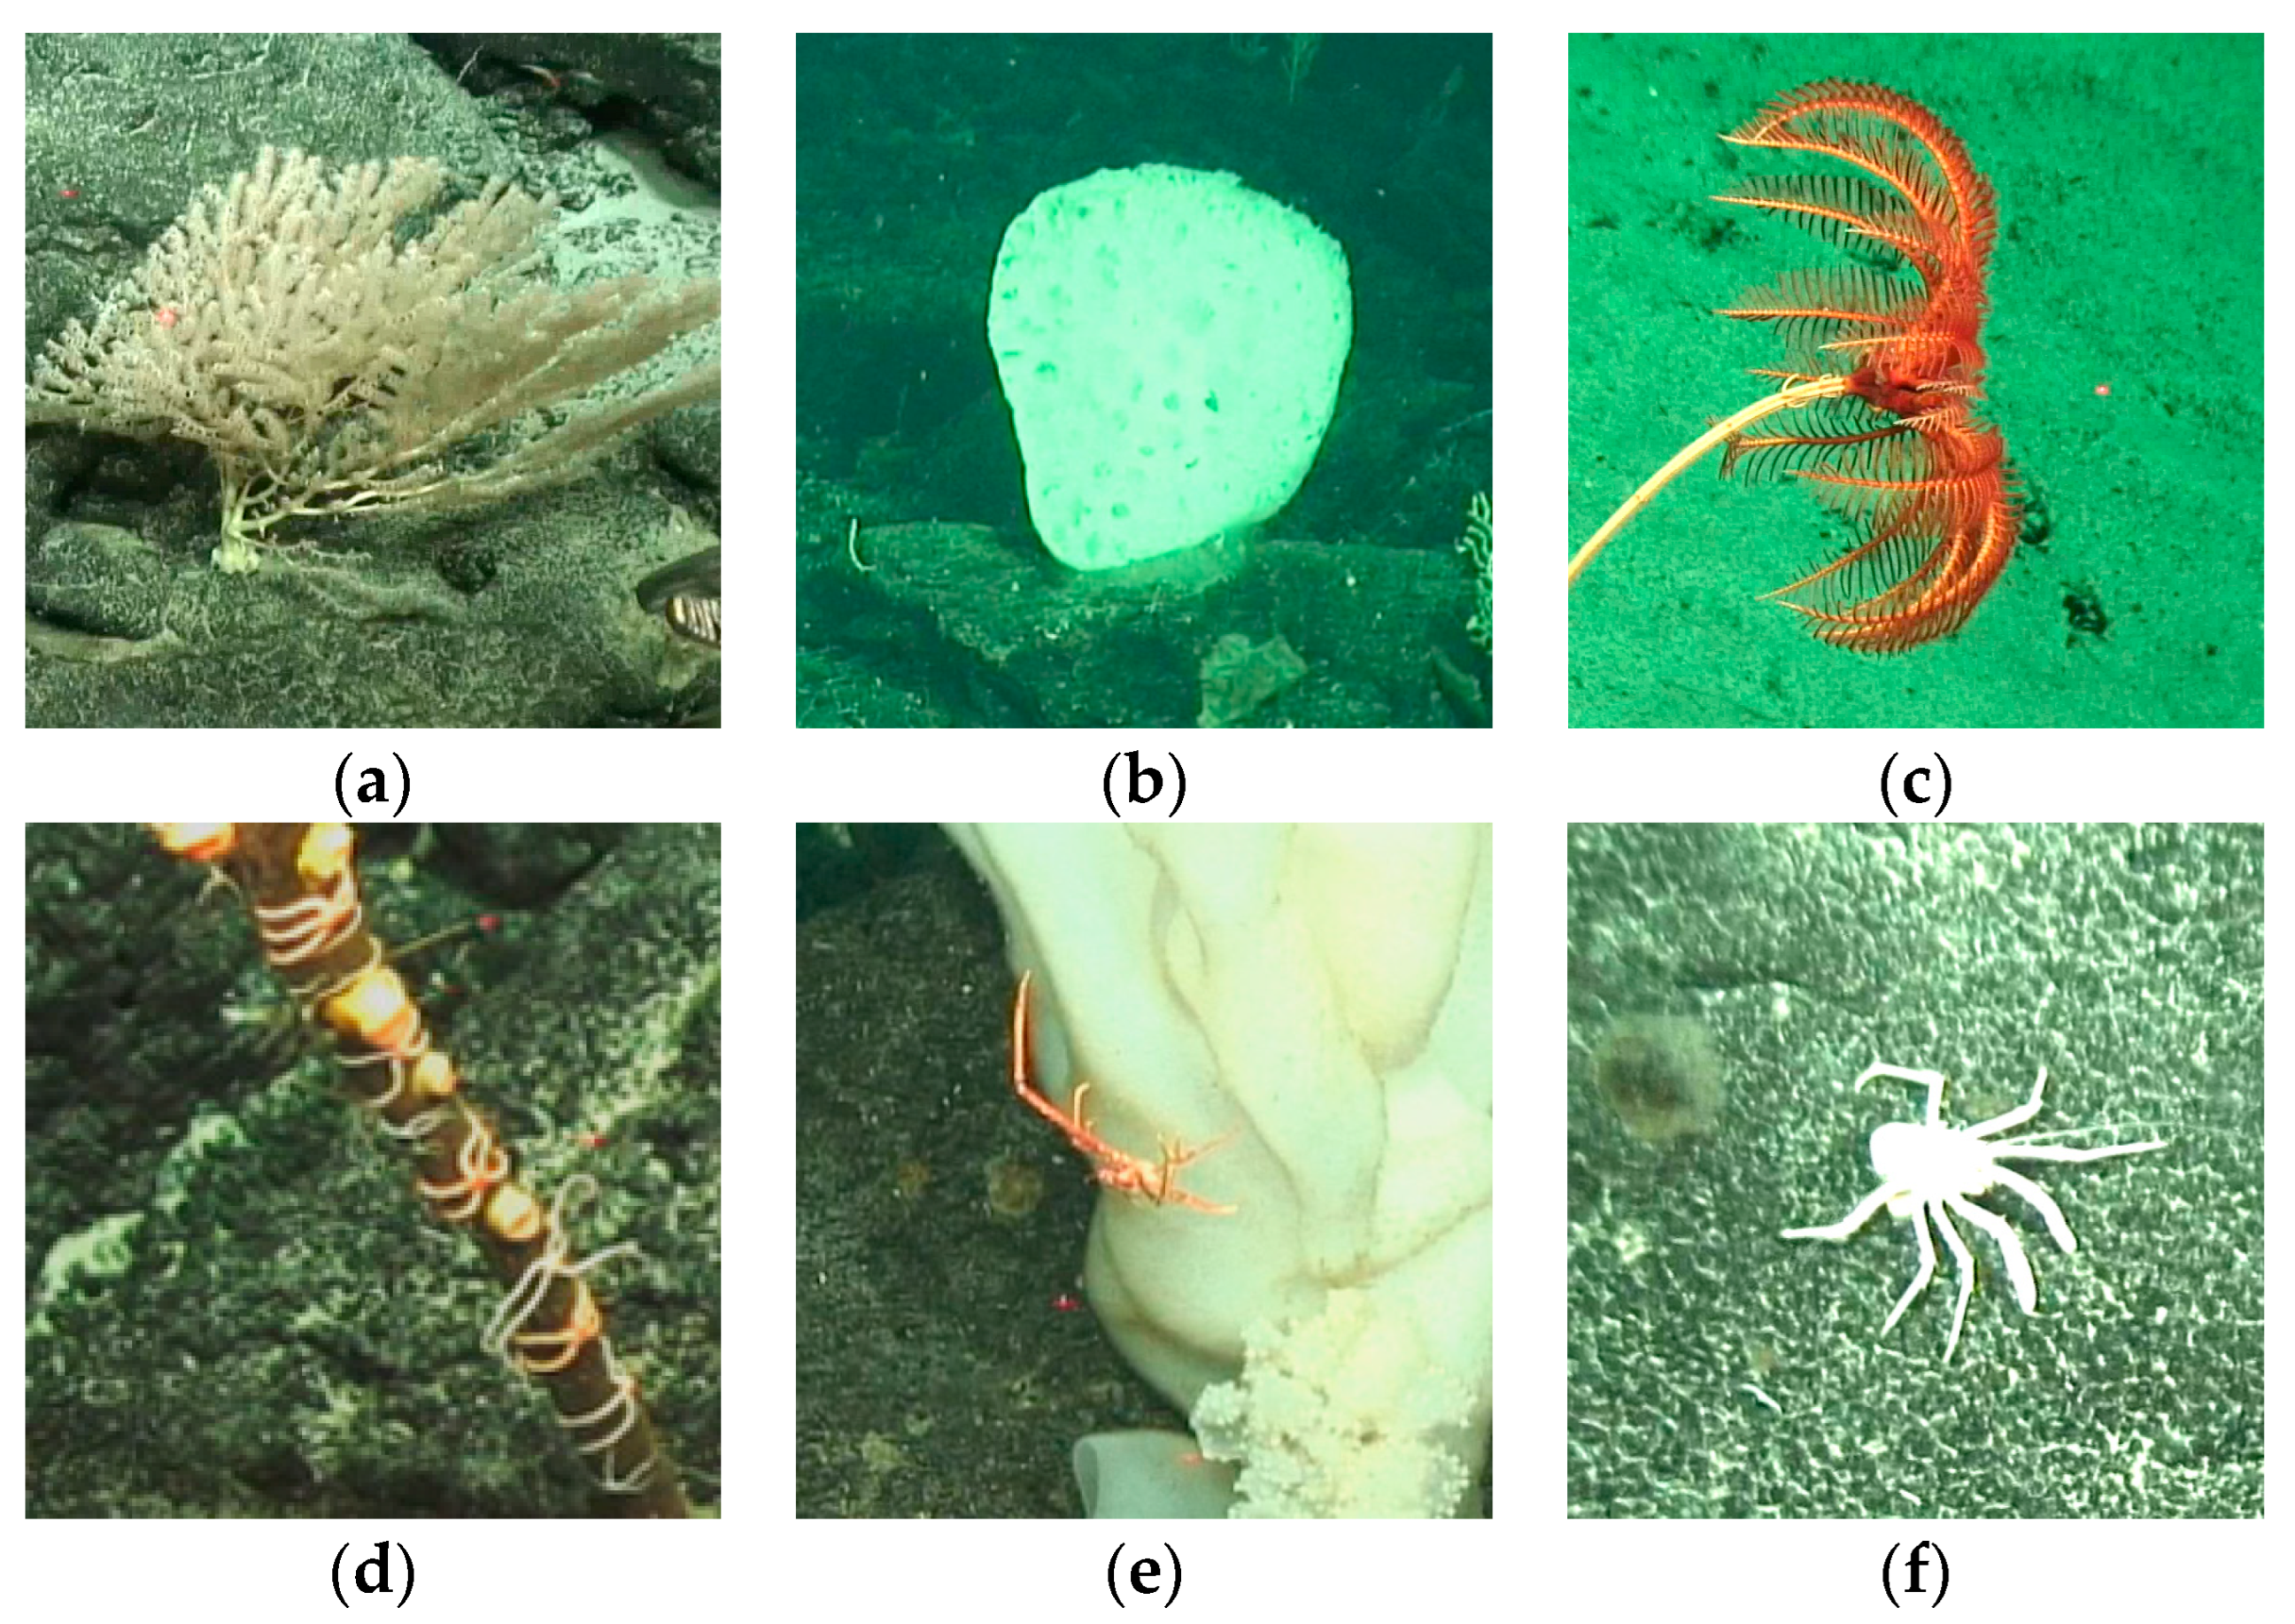
The manned submersible Jiaolong also observed several benthic organisms during its voyage, including cnidarians, sponges, echinoderms, and crustaceans (Figure 7a and Figure 9). These organisms were distributed across various substratum types and were relatively sparse in distribution. Integration with benthic biological surveys can support studies of habitat distribution and ecosystem services in relation to substratum types.

5.3. Regional Sediment Distribution Characteristics

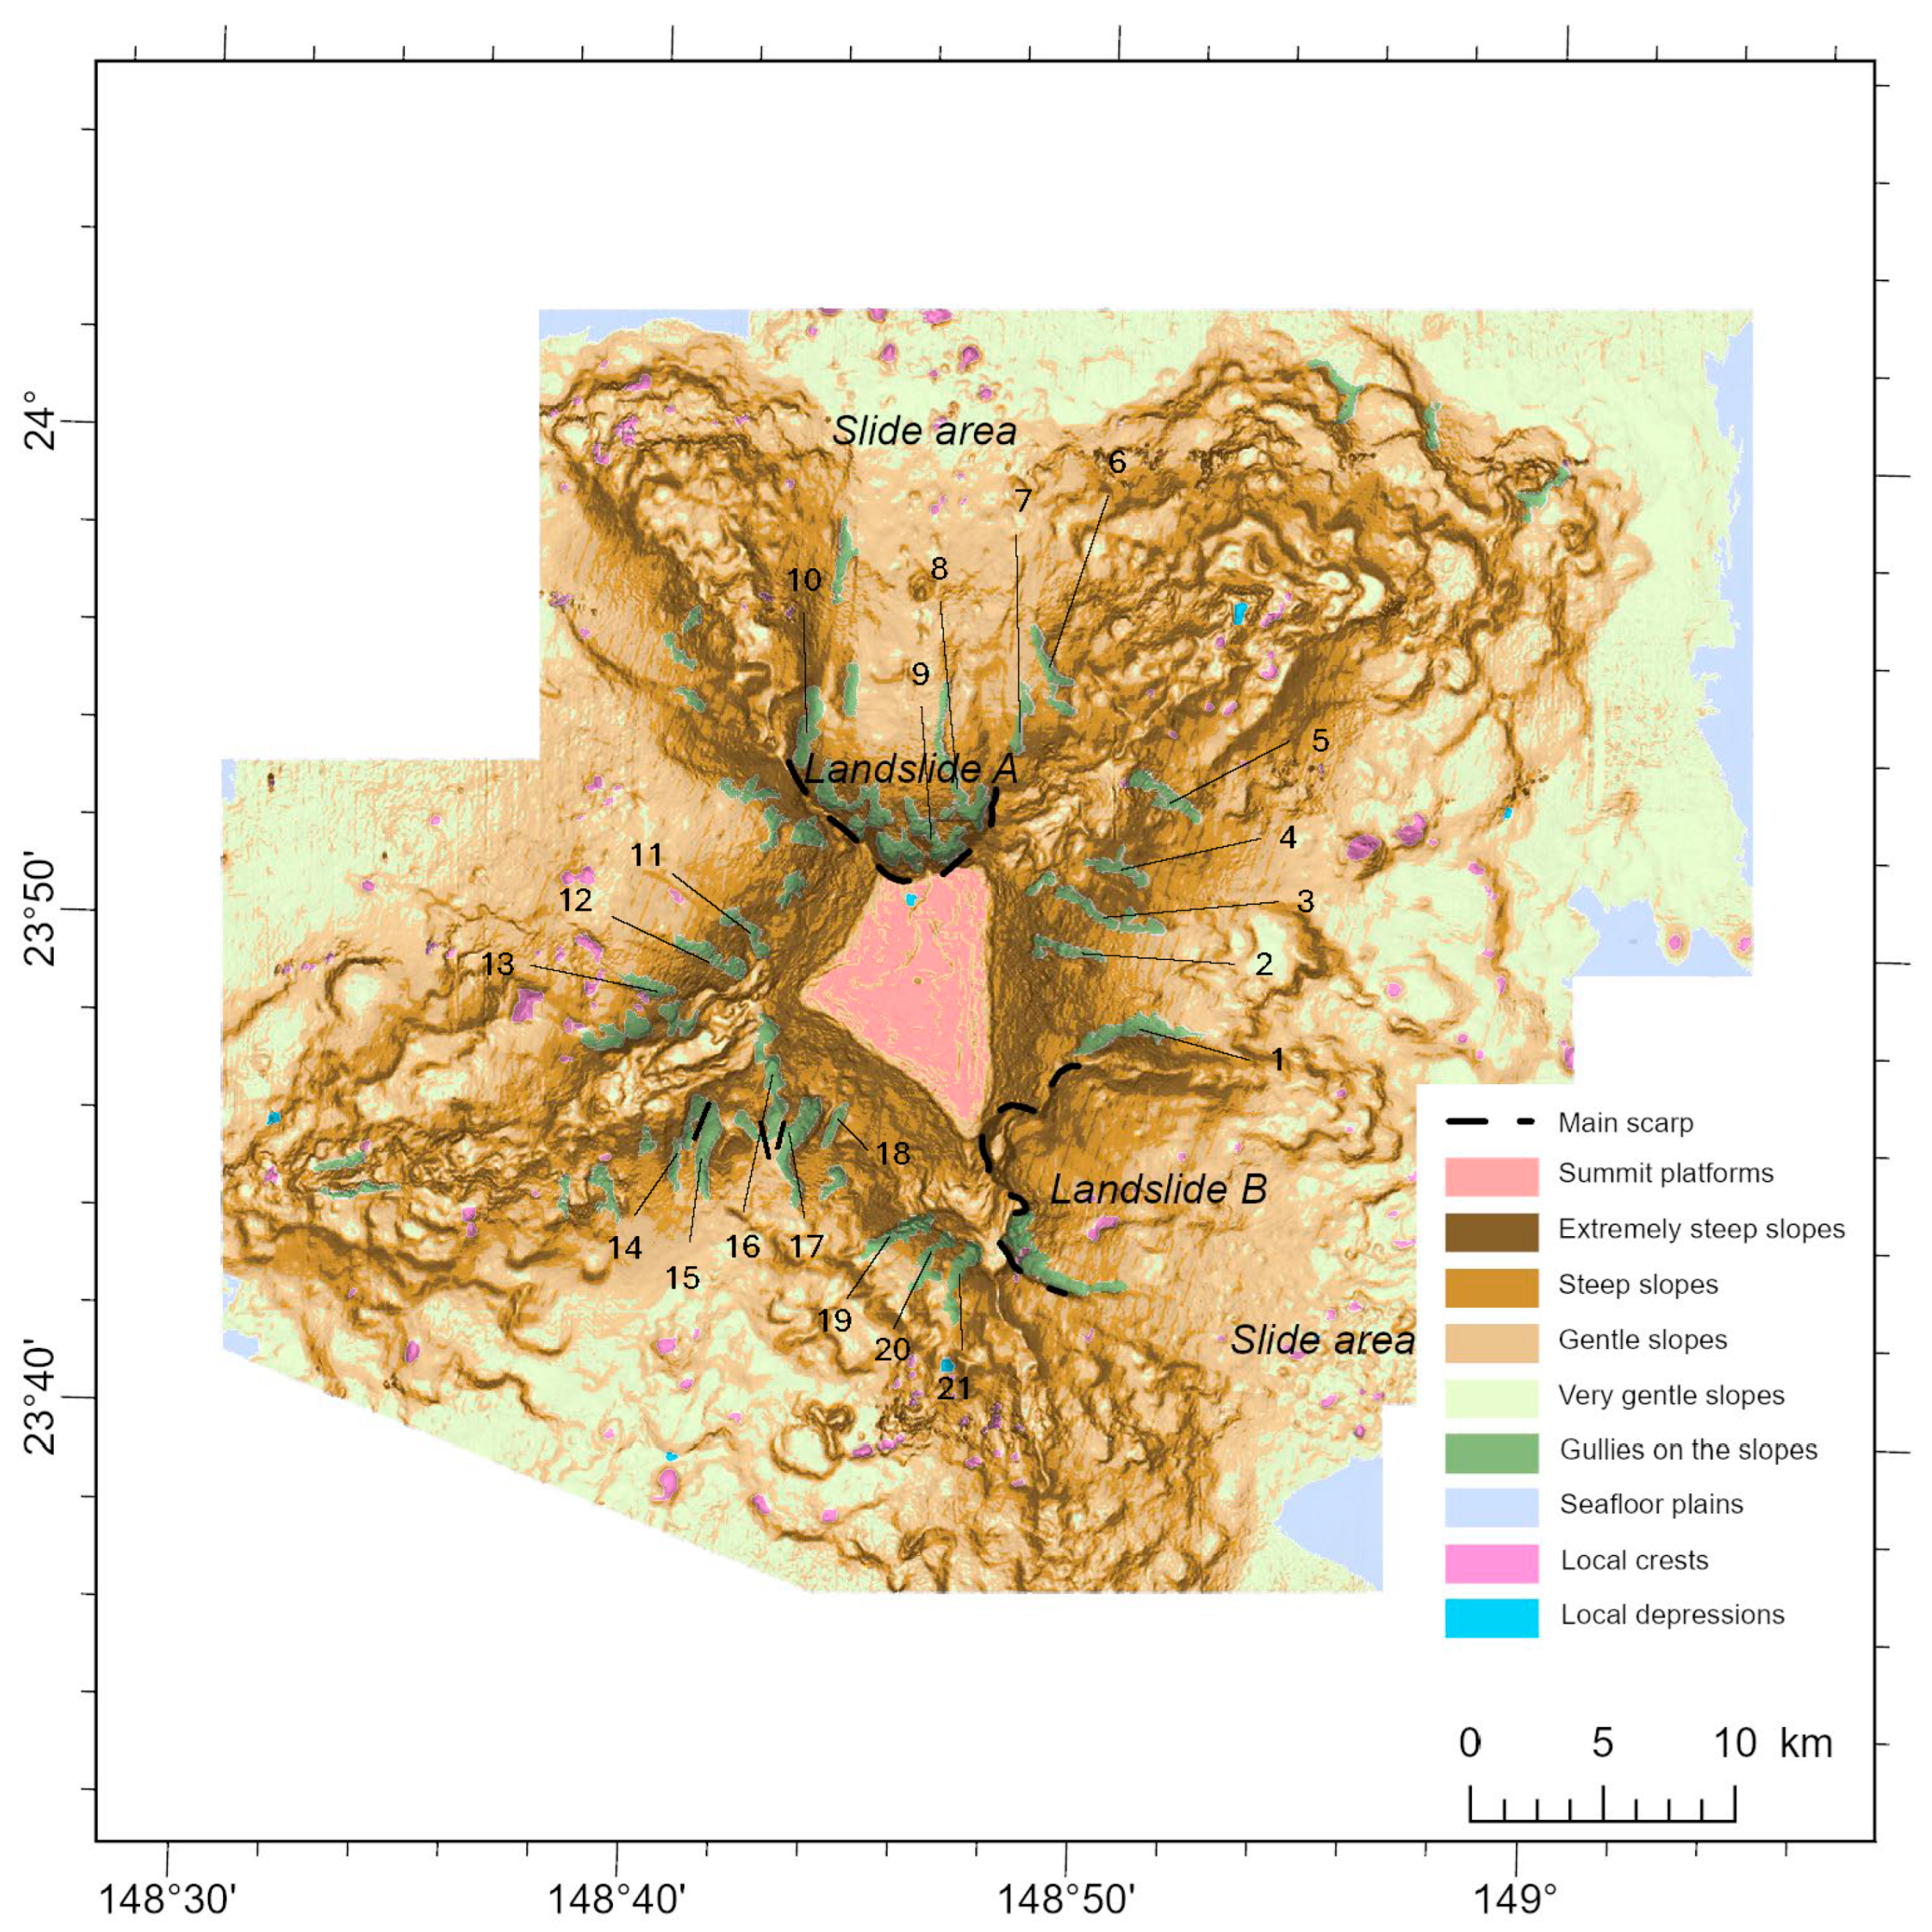
Using data such as water depth, slope, and BPI [48,55,56], geomorphologic types are classified into five major categories: summit platform, flank, seafloor plain, local crest, and local depression. Among these, flank is further subdivided into five subtypes: extremely steep slope, steep slope, gentle slope, very gentle slope, and gully on the slope (Figure 10). For the relevant classification methodology, please refer to reference [57].

5.3.1. Summit Platforms

The summit platform has an average slope of 2.38° and an average depth of 1081.10 m. Only two substratum types are distributed in this area: exposed bedrock and thinly sedimented bedrock, with vastly differing areas. Since the summit platform constitutes the area atop the mountain with slopes less than 5°, it is relatively gentle. Consequently, the two substratum types exhibit little difference in depth and slope (Table 8).
The summit platforms of most guyots are covered by sediments, commonly deep-oceanic loose deposits including clay and calcium-rich biogenic sediments [58,59,60]. However, the summit platform of the DD Guyot is largely exposed bedrock, with only a few areas covered by thin sediment layers. Multiple factors contribute to this phenomenon. For instance, strong bottom currents can transport fine-grained sediments, exposing bedrock locally [59]. Lower sedimentation rates and shorter deposition times also contribute to the exposure of summit bedrock [58]. The exposed summit bedrock makes it rougher, whereas the summit platform of the more sediment-covered Caiwei Guyots has an average slope of only 0.95° [57,61]. Further investigations using other detection methods are needed to study the specific characteristics and genesis of the summit platform.

5.3.2. Gullies on the Slope

Numerous gullies have developed on the slopes of the DD Guyot’s flank, most of which are situated on steep inclines between four major ridges. All four substratum types are distributed across these slope valleys, with thinly sedimented bedrock and continuous sediment predominating. Exposed bedrock tends to occur in steeper areas, while the average slope is lower in regions dominated by the other three substratum types (Table 9).
Due to the varying morphology, size, and locations of the gullies, analyzing their sedimentary characteristics aids in identifying the distribution patterns of sediments on the slopes. In this study, 21 distinct gullies were selected for analysis, sequentially from the eastern, northern, northwestern, and southwestern slopes (Figure 10). Table 10 indicates that sediment thickness generally increases with depth across most slopes, particularly in valleys 2, 3, 4, 5, 7, 8, 12, and 13, where the lower sections consist almost entirely of continuous sediment. Valleys 1 and 13 are nearly entirely composed of continuous sediment. The sole exception is valley 15, where sediment thickness decreases from the upper to lower sections.

5.3.3. Other Areas of the Flank and the Seafloor Plains

The statistical distribution of extremely steep slopes, steep slopes, gentle slopes, very gentle slopes, and seafloor plains (excluding local crests and local depressions) on the DD Guyot is shown in Table 11. The analysis indicates that continuous sediment constitutes the primary substratum type across all topographic types, though its proportion increases progressively from extremely steep slopes to seafloor plains. The sediment–rock transition zone is primarily distributed on the extremely steep slope, with minimal occurrence in other areas. Thinly sedimented bedrock is distributed across all five major topographic types, while exposed bedrock is distributed in all topographic types except the seafloor plain, showing an overall decreasing trend with increasing water depth. From a slope perspective, within each landform type, exposed bedrock and thinly sedimented bedrock generally occur in steeper areas, with the former exhibiting a slightly steeper average slope than the latter. Continuous sediment is found in gentler slopes; the sediment–rock transition zone shows no discernible slope-dependent distribution pattern.

5.4. Sediment Distribution Characteristics in Typical Landslide Areas

As shown in Figure 8 and Figure 10, multiple unstable zones exist on the DD Guyot, with Landslide A and Landslide B being the most prominent. In terms of the geomorphological manifestations of submarine slope instability, common features include a distinct main scarp, sidewalls, and mass-transport deposits (MTDs) extending outward from the source area [62,63,64]. Landslide A and Landslide B conform to the classic morphology of submarine slope instability source zones, exhibiting characteristics consistent with the typical manifestations of gravity-driven mass collapse and sliding processes [64]. Through the comprehensive analysis of landforms and substratum type, landslide events in this area can be preliminarily identified. Both major landslides exhibit extensive debris accumulations on slopes of less than 5° (very gentle slopes).
The primary triggering mechanisms for landslides include earthquake triggering, oversteepening at slope breaks, cyclic loading by internal tides/bottom currents, and weak layer failure accompanied by transient pore pressure increase [65,66]. Thin sediment layers overlying multiple accumulation zones may indicate geologically recent destabilization events or reflect persistently low sedimentation rates [65,67]. Intermittent collapses and low-flow modifications may exceed pelagic sedimentation rates, thereby preserving steep head scarps and stepped terraces and allowing the long-term maintenance of extensively exposed or thinly covered bedrock on guyots [66]. Further verification through seismic profiling and field sampling is required to characterize the specific features of these landslides.
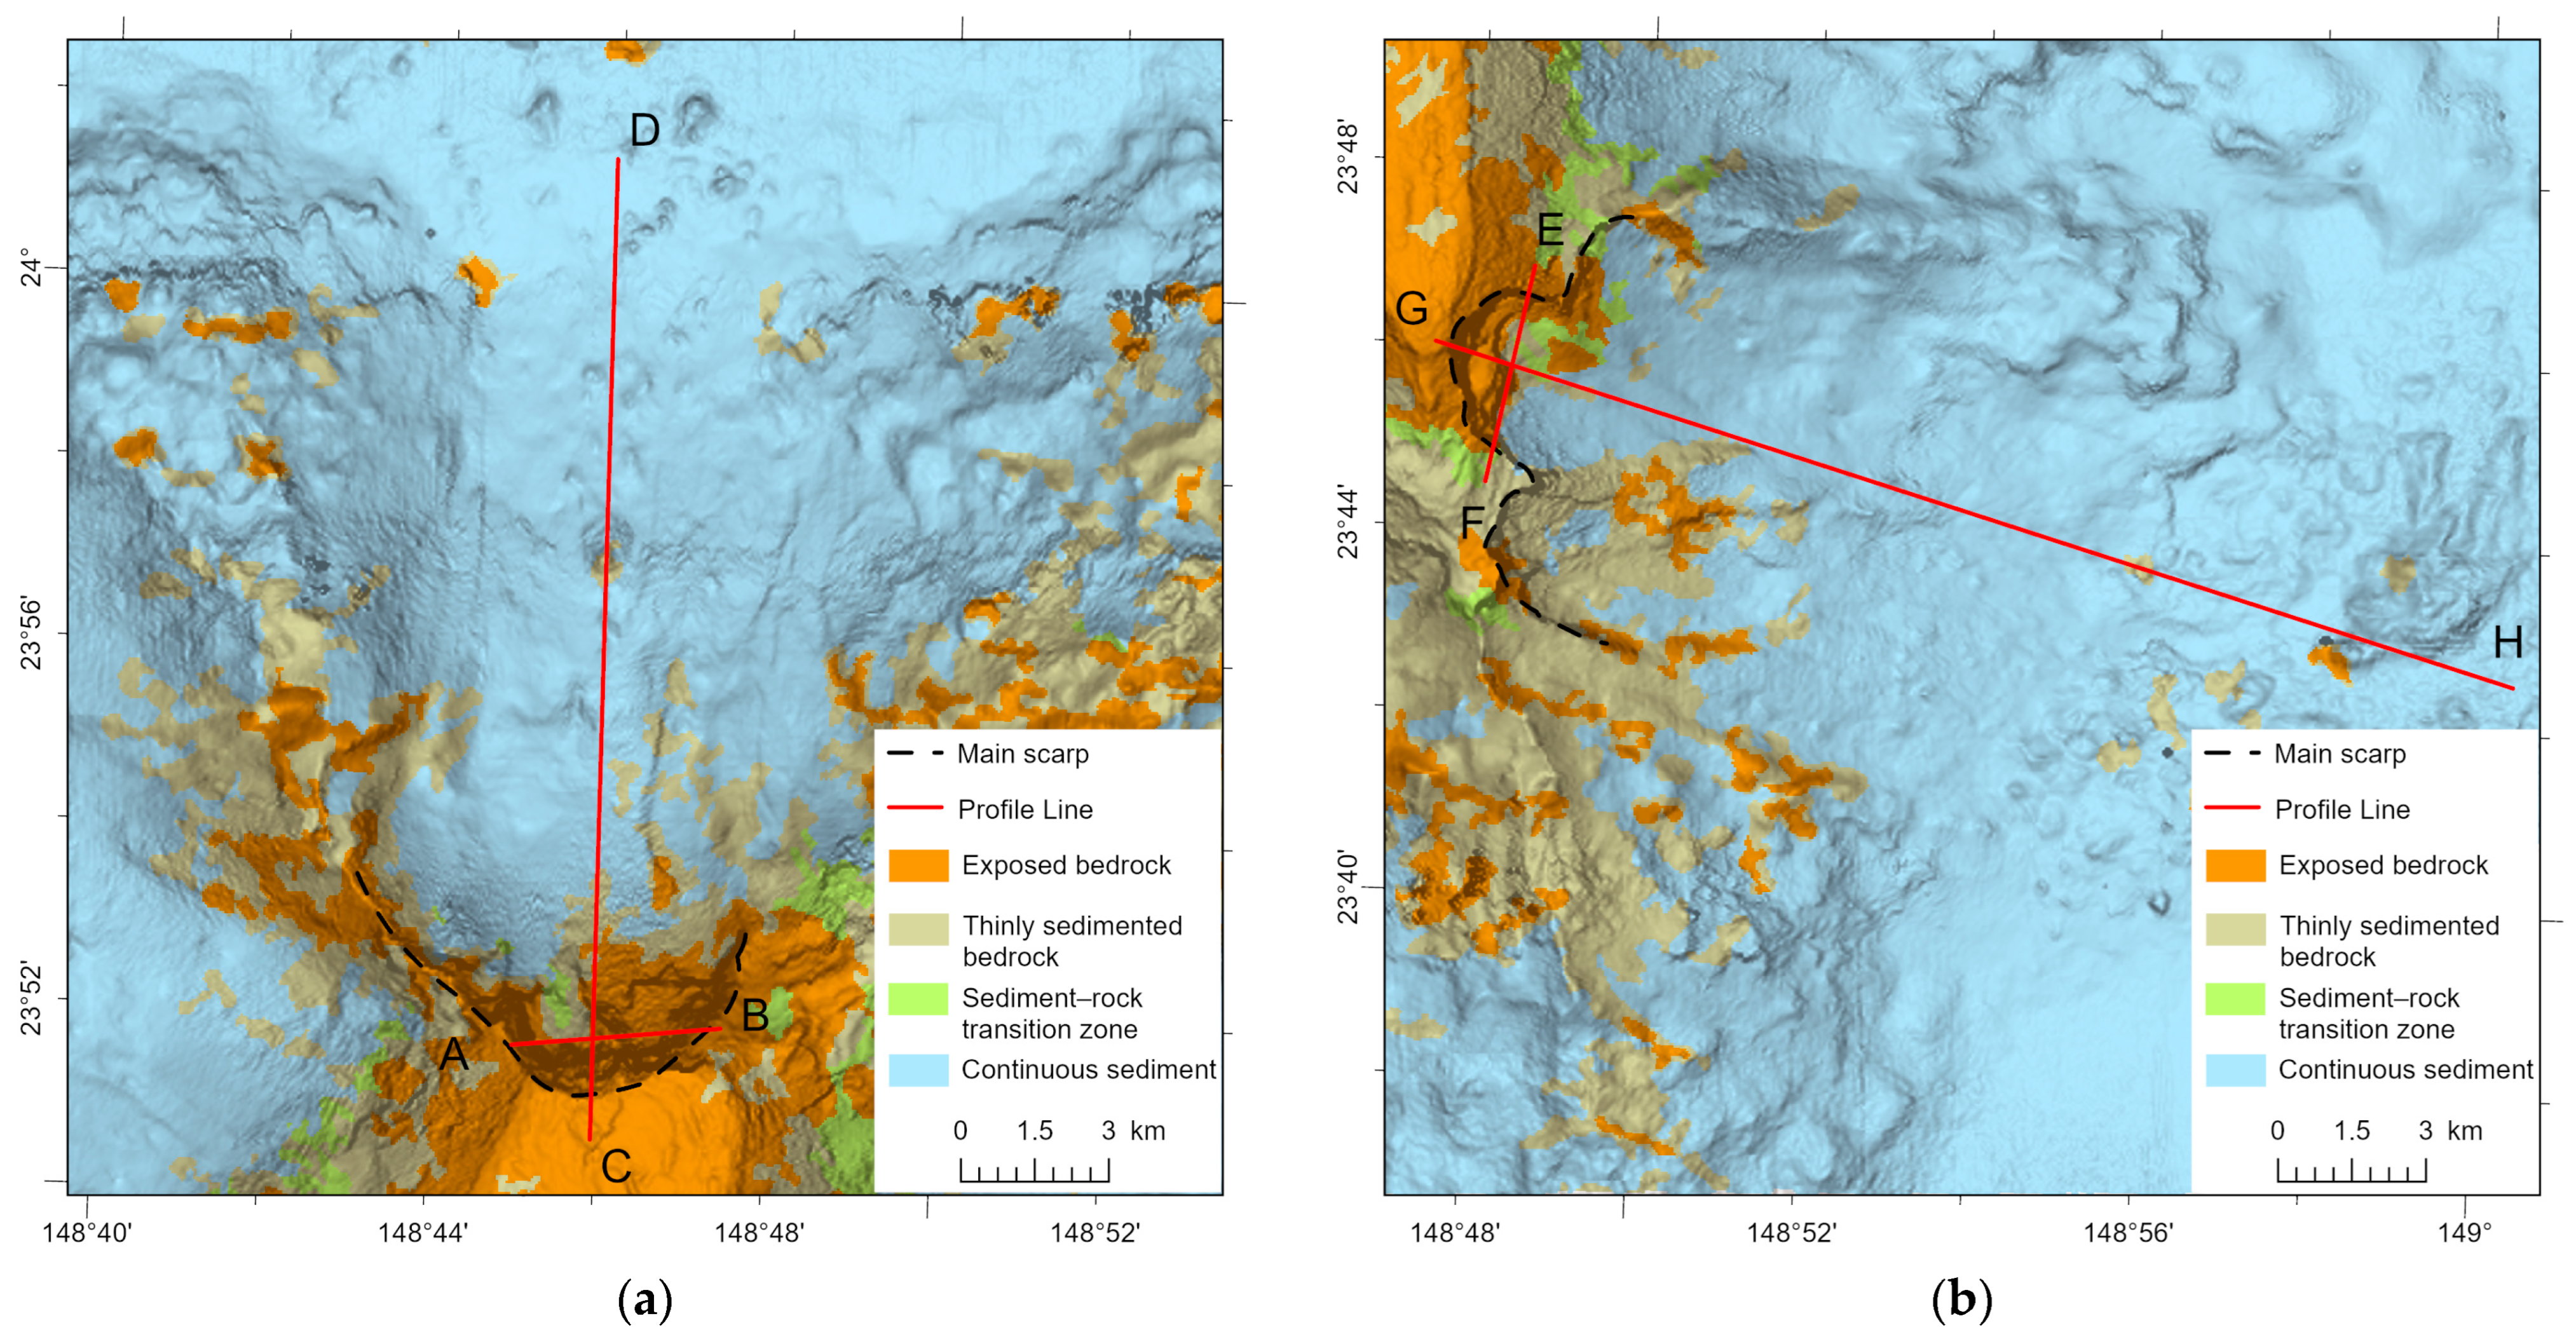
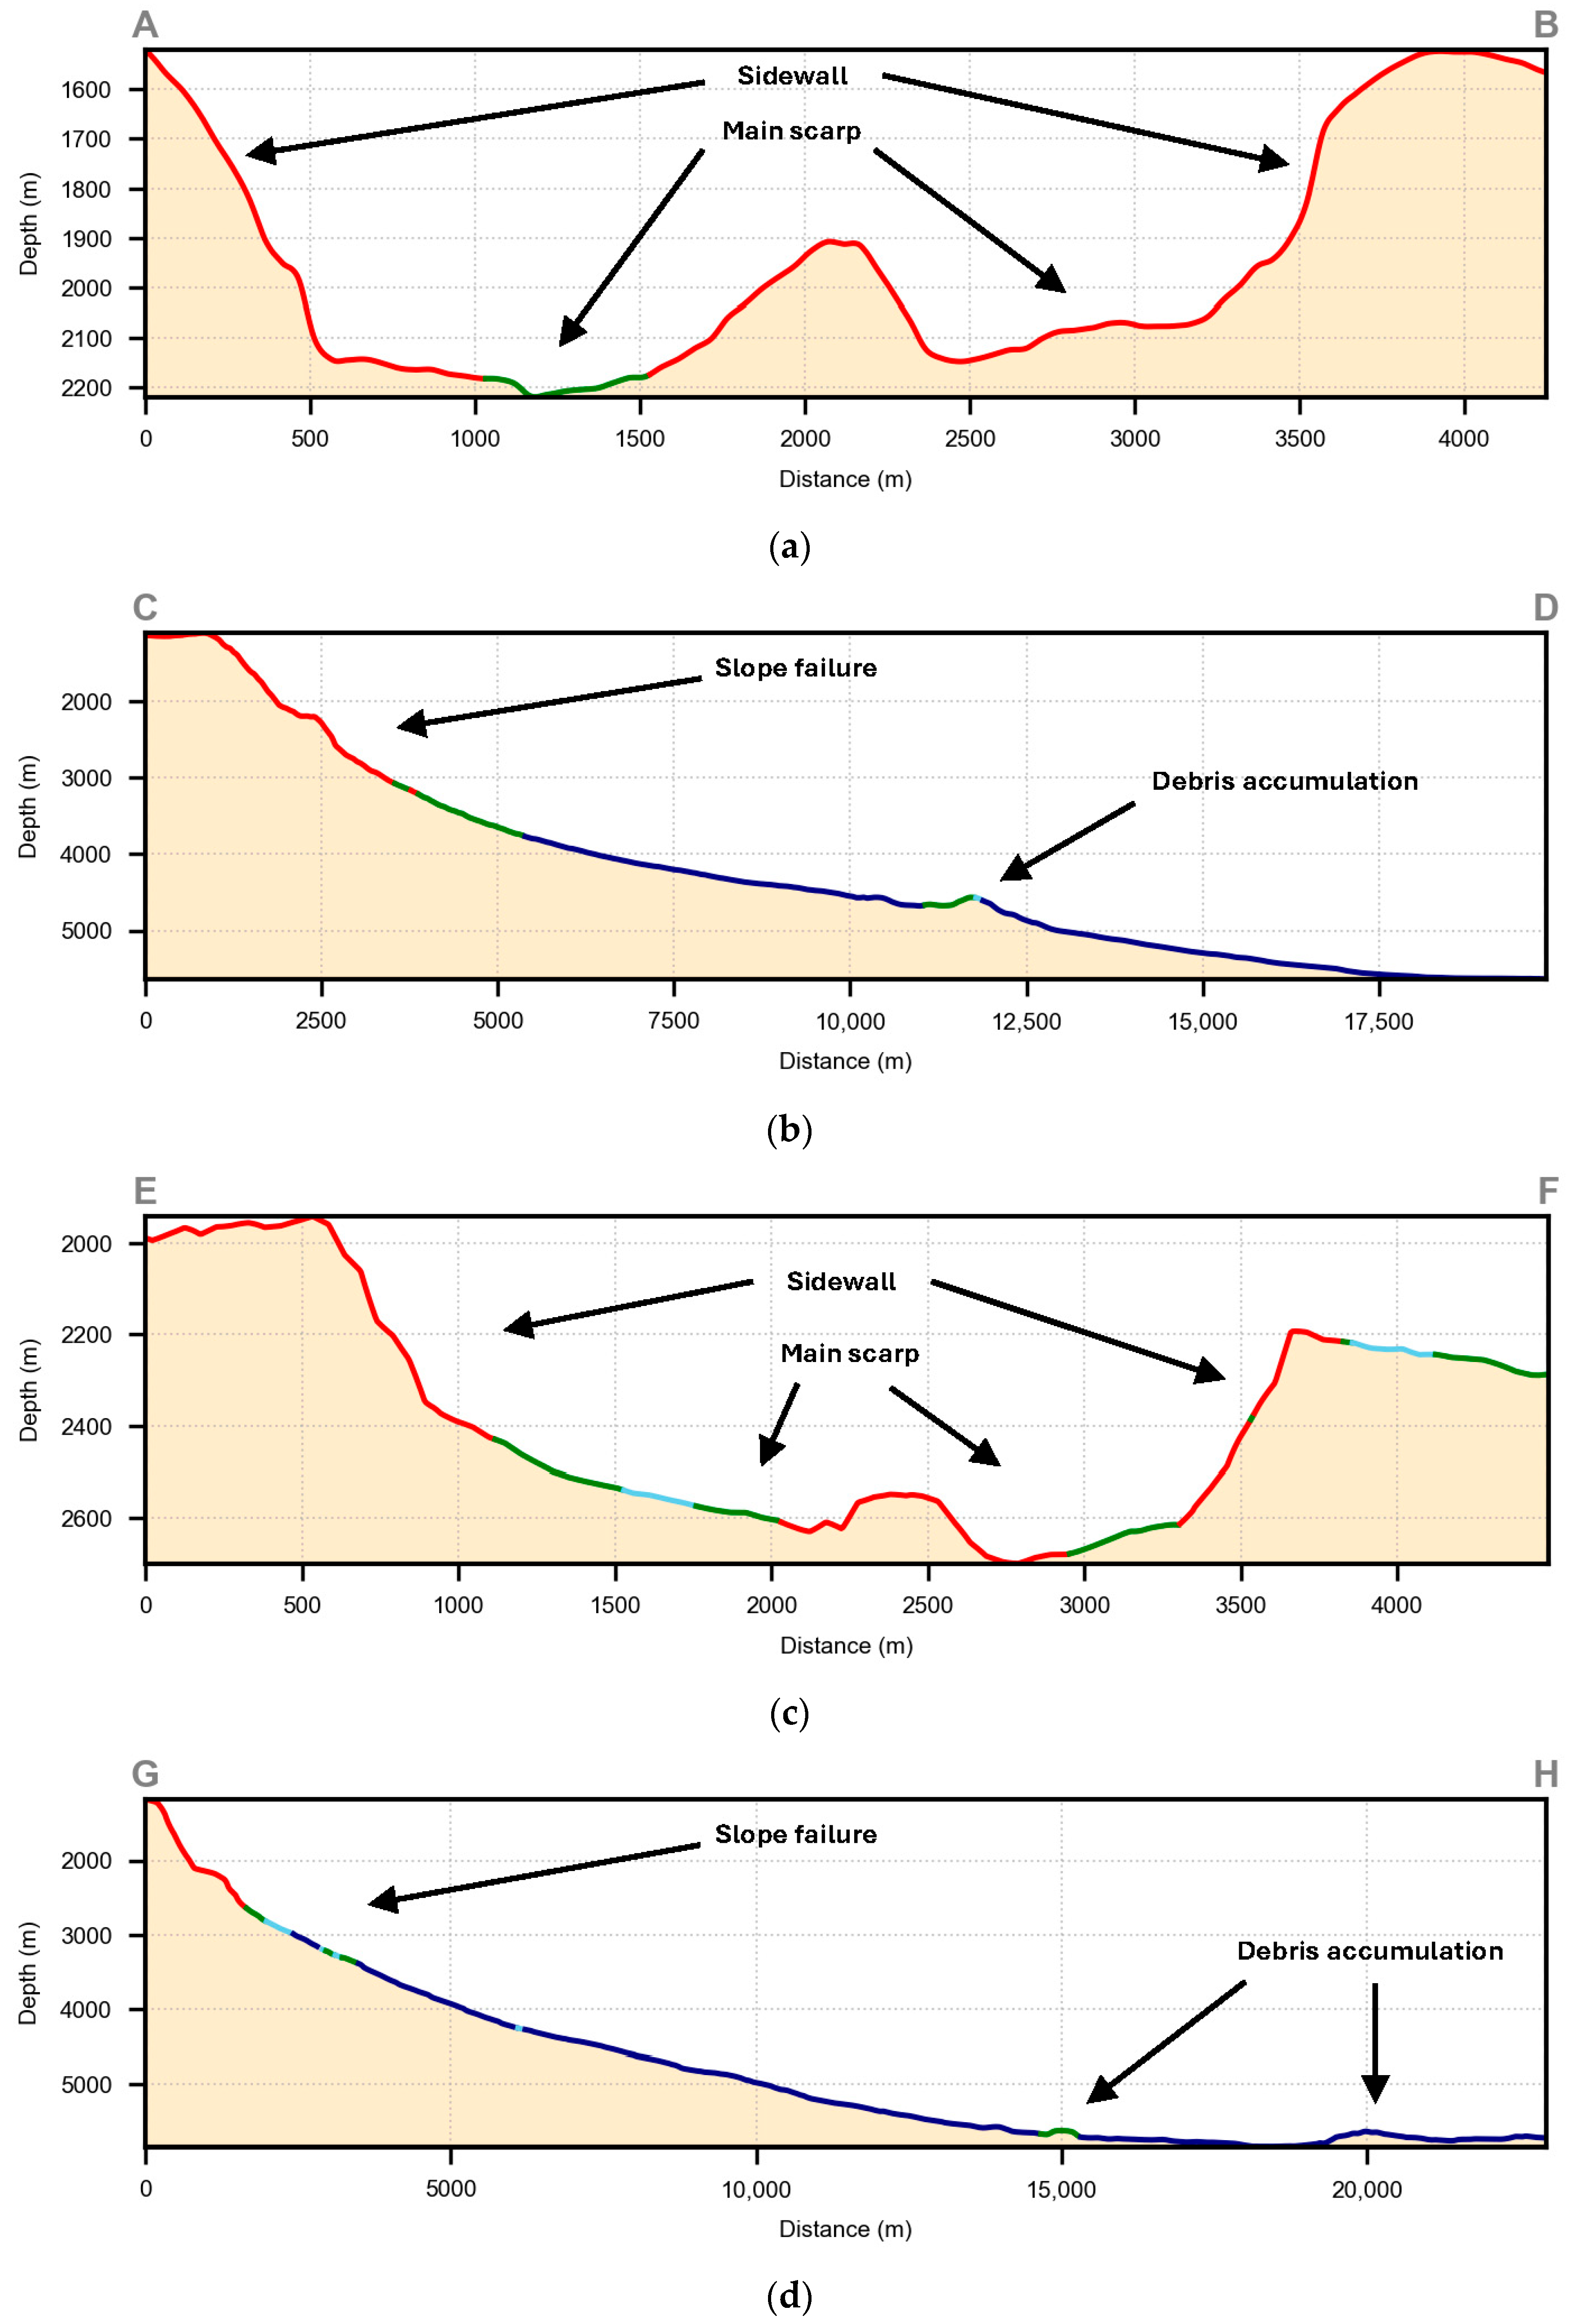
To clearly characterize the regional landslide features and sediment distribution, two topographic cross-sections of Landslide A were drawn at points A–D, and two topographic cross-sections of Landslide B were drawn at points E–H (Figure 11 and Figure 12).
Line AB represents a cross-section of Landslide A (Figure 12a). The figure reveals two distinct sidewalls and prominent main scarps, consistent with typical characteristics of slope failure. The geology of Section AB consists primarily of exposed bedrock, with a minor portion comprising thinly sedimented bedrock.
Line CD represents the longitudinal profile of Landslide A (Figure 12b), extending approximately 22.23 km in length. The depth increases from 1114 m at Point C to 5643 m at Point D, with a maximum depth of 5701 m. With increasing depth, sedimentation exhibits an overall trend from sparse to abundant. A distinct slope discontinuity exists at the boundary between the summit platform and the slope. Additionally, stepped topography is observed in the upper slope section, likely resulting from multiple instability events or phased sliding [64,68]. As the distance increases, debris accumulation gradually becomes more abundant, with the surface layer of this debris potentially covered by a thin sedimentary layer.
Line EF represents a lateral cross-section of Landslide B (Figure 12c). Similar to Line AB, this area also exhibits two distinct sidewalls and main scarps. Sedimentation is minimal on the sidewalls, while the main scarps show more significant deposition.
The GH segment represents the longitudinal profile of Landslide B (Figure 12d), extending approximately 22.93 km in length. Depth increases from 1181 m at Point G to 5716 m at Point H, with a maximum depth of 5832 m. Within the zone shallower than 2700 m, the slope primarily consists of exposed bedrock, exhibiting a distinct landslide toe. The sediment content gradually increases with depth. In the distant debris accumulation zone, the sediment content is relatively low.

5.5. Implications of Drowning Unconformity

One stage for the formation of guyots is the submergence of volcanic islands due to erosion and subsidence [4]. The extensively exposed bedrock on the summit platform of the DD Guyot indicates that the sediment supply rates in this area are extremely low, insufficient to cover the platform. The FG section in Figure 5 consists of continuous fine-grained deposits, with occasional minor amounts of rock debris. These phenomena indicate that carbonate production on the summit platform was abruptly halted, with extremely low rates of carbonate accumulation, and basin-derived pelagic or siliciclastic fines began to cover the area. If siliceous clastic sediments onlap relative to carbonate rocks, this represents a classic example of a drowning unconformity [17,18,69,70,71].
It should be emphasized that the drowning unconformity surface represents a sequence boundary, which cannot be definitively determined solely based on surface acoustic data and near-bottom video data. The video data coverage in this area is limited and does not extend to the extremely gentle bottom slopes where sediments are widely distributed, and does not provide information about the deep-seated substratum type. Moreover, the transport action of the bottom current and repeated landslide processes also affects the sedimentary cover on the seafloor. Therefore, the identification of the drowning unconformity phenomenon at the DD Guyot in this study is preliminary. To further validate this phenomenon, high-resolution sub-bottom profiling and targeted coring are required [69,70,71].
The identification of drowning unconformities holds significant value for investigating seamount evolution, reconstructing paleoenvironments, conducting resource assessments, and making engineering geological judgments.

6. Conclusions

This study focuses on the sediment distribution characteristics of the DD Guyot, utilizing a CNN for substratum type classification based on videos from the manned submersible Jiaolong, EM124 multibeam bathymetry, and backscatter intensity data. It systematically analyzes both the overall sediment distribution patterns and the distribution characteristics of sediments across different geomorphological units. The results indicate the following:
  • The CNN model successfully classified the overall seamount surface into four types: exposed bedrock, thinly sedimented bedrock, sediment–rock transition zone, and continuous sediment. Except for the sediment–rock transition zone, the overall accuracy was high.
  • Sediment distribution on the DD Guyot exhibits distinct spatial heterogeneity. Sediment cover is relatively sparse on the summit plateau and ridge areas, while on the slopes and seafloor plains, sediment cover generally increases with depth. Areas near the seafloor are nearly completely covered by continuous sediment deposits.
  • Landslides exert a certain influence on sediment distribution. Both Landslide A and Landslide B feature slip surfaces and sidewalls dominated by exposed bedrock, with relatively thin surface sediment layers in the distant source debris accumulation zone. This, to some extent, reflects the impact of landslides on sedimentation.
  • The sediment distribution on the DD Guyot reflects the potential existence of a drowning unconformity, which represents a highly significant research direction.
This paper represents one of the earliest studies on the sedimentary characteristics of the DD Guyot. However, the research also has several limitations: the observation area covered by the manned submersible was relatively small, resulting in a very limited amount of field video data available for this study; multibeam data can only reflect the characteristics of the seafloor surface layer, while the internal conditions of the seafloor require further investigation through shallow sub-seafloor profiling or borehole sampling; CNN models trained on one seamount may not directly generalize to others without re-training, due to variations in lithology, sediment sources, and hydrodynamic regimes; and the 50 m MBES resolution, though adequate for large-scale mapping, may not capture fine-scale features important for ecological studies or small-scale mineral resource assessment. Future work should involve conducting more detailed marine surveys to enable a more precise analysis of the sedimentary features of the DD Guyot.

Author Contributions

Conceptualization, W.G., H.W. and Y.S.; methodology, W.G. and H.W.; software, W.G. and H.W.; validation, W.G., H.W. and Y.S.; formal analysis, W.G. and H.W.; investigation, W.G. and W.X.; resources, W.G. and H.W.; data curation, W.G., H.W., W.X. and Y.G.; writing—original draft preparation, W.G.; writing—review and editing, W.G., H.W. and Y.S.; visualization, W.G. and H.W.; supervision, H.W. and Y.S.; project administration, W.G. and H.W.; funding acquisition, W.G. All authors have read and agreed to the published version of the manuscript.

Funding

This work was supported by the National Key Research and Development Program of China (2023YFC2812905).

Data Availability Statement

The data presented in this study are available on request from the corresponding author due to laboratory confidentiality regulations.

Conflicts of Interest

The authors declare that the research was conducted in the absence of any commercial or financial relationships that could be construed as potential conflicts of interest.

References

  1. Zhao, B.; Yang, Y.; Zhang, X.; He, G.; Lü, W.; Liu, Y.; Wei, Z.; Deng, Y.; Huang, N. Sedimentary Characteristics Based on Sub-Bottom Profiling and the Implications for Mineralization of Cobalt-Rich Ferromanganese Crusts at Weijia Guyot, Western Pacific Ocean. Deep Sea Res. Part I Oceanogr. Res. Pap. 2020, 158, 103223. [Google Scholar] [CrossRef]
  2. Wang, X.; Li, H.; Zhang, J.; Chen, J.; Xie, X.; Xie, W.; Yin, K.; Zhang, D.; Ruiz-Pino, D.; Kao, S.-J. Seamounts Generate Efficient Active Transport Loops to Nourish the Twilight Ecosystem. Sci. Adv. 2024, 10, eadk6833. [Google Scholar] [CrossRef]
  3. Craig, C.H.; Sandwell, D.T. Global Distribution of Seamounts from Seasat Profiles. J. Geophys. Res. Solid Earth 1988, 93, 10408–10420. [Google Scholar] [CrossRef]
  4. Staudigel, H.; Clague, D.A. The Geological History of Deep-Sea Volcanoes Biosphere, Hydrosphere, and Lithosphere Interactions. Oceanography 2010, 23, 58–71. [Google Scholar] [CrossRef]
  5. Batiza, R. Abundances, Distribution and Sizes of Volcanoes in the Pacific Ocean and Implications for the Origin of Non-Hotspot Volcanoes. Earth Planet. Sci. Lett. 1982, 60, 195–206. [Google Scholar] [CrossRef]
  6. Harris, P.T.; Macmillan-Lawler, M.; Rupp, J.; Baker, E.K. Geomorphology of the Oceans. Mar. Geol. 2014, 352, 4–24. [Google Scholar] [CrossRef]
  7. Dutkiewicz, A.; O’Callaghan, S.; Muller, R.D. Controls on the Distribution of Deep-Sea Sediments. Geochem. Geophys. Geosystems 2016, 17, 3075–3098. [Google Scholar] [CrossRef]
  8. Rebesco, M.; Hernandez-Molina, F.J.; Van Rooij, D.; Wahlin, A. Contourites and Associated Sediments Controlled by Deep-Water Circulation Processes: State-of-the-Art and Future Considerations. Mar. Geol. 2014, 352, 111–154. [Google Scholar] [CrossRef]
  9. Stow, D.; Smillie, Z. Distinguishing between Deep-Water Sediment Facies: Turbidites, Contourites and Hemipelagites. Geosciences 2020, 10, 68. [Google Scholar] [CrossRef]
  10. Zhu, Z.; Tao, C.; Zhou, J.; Wilkens, R.H.; Jin, X.; Zhang, J.; Zhang, G. Seafloor Classification Combining Shipboard Low-Frequency and AUV High-Frequency Acoustic Data: A Case Study of Duanqiao Hydrothermal Field, Southwest Indian Ridge. IEEE Trans. Geosci. Remote Sens. 2022, 60, 4207815. [Google Scholar] [CrossRef]
  11. Ridgwell, A. Interpreting Transient Carbonate Compensation Depth Changes by Marine Sediment Core Modeling. Paleoceanography 2007, 22, PA4102. [Google Scholar] [CrossRef]
  12. Campbell, S.M.; Moucha, R.; Derry, L.A.; Raymo, M.E. Effects of Dynamic Topography on the Cenozoic Carbonate Compensation Depth. Geochem. Geophys. Geosystems 2018, 19, 1025–1034. [Google Scholar] [CrossRef]
  13. Hein, J.R.; Mizell, K.; Koschinsky, A.; Conrad, T.A. Deep-Ocean Mineral Deposits as a Source of Critical Metals for High- and Green-Technology Applications: Comparison with Land-Based Resources. Ore Geol. Rev. 2013, 51, 1–14. [Google Scholar] [CrossRef]
  14. Simon-Lledó, E.; Bett, B.J.; Huvenne, V.A.I.; Schoening, T.; Benoist, N.M.A.; Jones, D.O.B. Ecology of a Polymetallic Nodule Occurrence Gradient: Implications for Deep-Sea Mining. Limnol. Oceanogr. 2019, 64, 1883–1894. [Google Scholar] [CrossRef]
  15. Hein, J.R.; Koschinsky, A.; Kuhn, T. Deep-Ocean Polymetallic Nodules as a Resource for Critical Materials. Nat. Rev. Earth Environ. 2020, 1, 158–169. [Google Scholar] [CrossRef]
  16. Bailey, L.P.; Clare, M.A.; Hunt, J.E.; Kane, I.A.; Miramontes, E.; Fonnesu, M.; Argiolas, R.; Malgesini, G.; Wallerand, R. Highly Variable Deep-Sea Currents over Tidal and Seasonal Timescales. Nat. Geosci. 2024, 17, 787–794. [Google Scholar] [CrossRef]
  17. Schlager, W.; Camber, O. Submarine Slope Angles, Drowning Unconformities, and Self-Erosion of Limestone Escarpments. Geology 1986, 14, 762–765. [Google Scholar] [CrossRef]
  18. Schlager, W. The Paradox of Drowned Reefs and Carbonate Platforms. Geol. Soc. Am. Bull. 1981, 92, 197. [Google Scholar] [CrossRef]
  19. Bridges, A.E.H.; Barnes, D.K.A.; Bell, J.B.; Ross, R.E.; Howell, K.L. Benthic Assemblage Composition of South Atlantic Seamounts. Front. Mar. Sci. 2021, 8, 660648. [Google Scholar] [CrossRef]
  20. Xiao, T.; Xu, D.; Deng, T.; Lin, J.; Ye, L.; Ge, Q.; Han, X.; Dong, Y.; Chu, F. The Influence of Seamounts on the Enrichment of Rare Earth Elements in Sediments-A Case Study of the Marcus-Wake Seamounts in the Western Pacific Ocean. J. Mar. Sci. Eng. 2024, 12, 117. [Google Scholar] [CrossRef]
  21. Zheng, H.; Yan, P.; Chen, J.; Wang, Y. Seabed Sediment Classification in the Northern South China Sea Using Inversion Method. Appl. Ocean Res. 2013, 39, 131–136. [Google Scholar] [CrossRef]
  22. Qi, Y.U.; Gaowen, H.E.; Yong, Y. Status quo and prospect in acoustic detection technology for submarine cobalt-rich crust exploration. Mar. Geol. Front. 2024, 40, 83–92. (In Chinese) [Google Scholar] [CrossRef]
  23. Lowe, S.C.; Misiuk, B.; Xu, I.; Abdulazizov, S.; Baroi, A.R.; Bastos, A.C.; Best, M.; Ferrini, V.; Friedman, A.; Hart, D.; et al. BenthicNet: A Global Compilation of Seafloor Images for Deep Learning Applications. Sci. Data 2025, 12, 230. [Google Scholar] [CrossRef]
  24. Anisimov, I.; Lesin, A.; Muravya, V.; Zalota, A.; Zalota, M. Videomodule Towed System: Acquisition and Analysis of Video Imaging Data for Benthic Surveys. Oceanography 2025, 38, 96–99. [Google Scholar] [CrossRef]
  25. Huang, Z.; Siwabessy, J.; Cheng, H.; Nichol, S. Using Multibeam Backscatter Data to Investigate Sediment-Acoustic Relationships. J. Geophys. Res. Ocean. 2018, 123, 4649–4665. [Google Scholar] [CrossRef]
  26. Ji, X.; Yang, B.; Tang, Q. Seabed Sediment Classification Using Multibeam Backscatter Data Based on the Selecting Optimal Random Forest Model. Appl. Acoust. 2020, 167, 107387. [Google Scholar] [CrossRef]
  27. Lark, R.M.; Dove, D.; Green, S.L.; Richardson, A.E.; Stewart, H.; Stevenson, A. Spatial Prediction of Seabed Sediment Texture Classes by Cokriging from a Legacy Database of Point Observations. Sediment. Geol. 2012, 281, 35–49. [Google Scholar] [CrossRef]
  28. Khomsin; Mukhtasor; Pratomo, D.G.; Suntoyo. The Development of Seabed Sediment Mapping Methods: The Opportunity Application in the Coastal Waters. IOP Conf. Ser. Earth Environ. Sci. 2021, 731, 012039. [Google Scholar] [CrossRef]
  29. Tang, Q.; Li, J.; Ding, D.; Ji, X.; Li, N.; Yang, L.; Sun, W. Deep-Sea Seabed Sediment Classification Using Finely Processed Multibeam Backscatter Intensity Data in the Southwest Indian Ridge. Remote Sens. 2022, 14, 2675. [Google Scholar] [CrossRef]
  30. Rubbens, P.; Brodie, S.; Cordier, T.; Destro Barcellos, D.; Devos, P.; Fernandes-Salvador, J.A.; Fincham, J.I.; Gomes, A.; Handegard, N.O.; Howell, K. Machine Learning in Marine Ecology: An Overview of Techniques and Applications. ICES J. Mar. Sci. 2023, 80, 1829–1853. [Google Scholar] [CrossRef]
  31. Herkul, K.; Peterson, A.; Paekivi, S. Applying Multibeam Sonar and Mathematical Modeling for Mapping Seabed Substrate and Biota of Offshore Shallows. Estuar. Coast. Shelf Sci. 2017, 192, 57–71. [Google Scholar] [CrossRef]
  32. Turner, J.A.; Babcock, R.C.; Hovey, R.; Kendrick, G.A. Can Single Classifiers Be as Useful as Model Ensembles to Produce Benthic Seabed Substratum Maps? Estuar. Coast. Shelf Sci. 2018, 204, 149–163. [Google Scholar] [CrossRef]
  33. Yang, F.; Zhu, Z.; Li, J.; Feng, C.; Xing, Z.; Wu, Z. Seafloor Classification Based on Combined Multibeam Bathymetry and Backscatter Using Deep Convolution Neural Network. Acta Geod. Cartogr. Sin. 2021, 50, 71–84. [Google Scholar]
  34. Zhu, Z.; Cui, X.; Zhang, K.; Ai, B.; Shi, B.; Yang, F. DNN-Based Seabed Classification Using Differently Weighted MBES Multifeatures. Mar. Geol. 2021, 438, 106519. [Google Scholar] [CrossRef]
  35. Wan, J.; Qin, Z.; Cui, X.; Yang, F.; Yasir, M.; Ma, B.; Liu, X. MBES Seabed Sediment Classification Based on a Decision Fusion Method Using Deep Learning Model. Remote Sens. 2022, 14, 3708. [Google Scholar] [CrossRef]
  36. Khomsin; Hadicahyo, O. Deep Neural Network to Classify Seabed Sediment Using MBES Multifrequency. IOP Conf. Ser. Earth Environ. Sci. 2023, 1276, 012058. [Google Scholar] [CrossRef]
  37. Loureiro, G.; Dias, A.; Almeida, J.; Martins, A.; Hong, S.; Silva, E. A Survey of Seafloor Characterization and Mapping Techniques. Remote Sens. 2024, 16, 1163. [Google Scholar] [CrossRef]
  38. Hilde, T.W.C.; Uyeda, S.; Kroenke, L. Evolution of the Western Pacific and Its Margin. Tectonophysics 1977, 38, 145–165. [Google Scholar] [CrossRef]
  39. Chinese Ocean Mineral Resources Research and Development Association Office. Chinese Gazetteer of Undersea Features on the International Seabed (2019); China Ocean Press: Beijing, China, 2020; ISBN 978-7-5210-0537-0. [Google Scholar]
  40. Smoot, N.C. The Marcus-Wake Seamounts and Guyots as Paleofracture Indicators and Their Relation to the Dutton Ridge. Mar. Geol. 1989, 88, 117–131. [Google Scholar] [CrossRef]
  41. Hirano, N.; Sumino, H.; Morishita, T.; Machida, S.; Kawano, T.; Yasukawa, K.; Hirata, T.; Kato, Y.; Ishii, T. A Paleogene Magmatic Overprint on Cretaceous Seamounts of the Western Pacific. Isl. Arc 2021, 30, e12386. [Google Scholar] [CrossRef]
  42. Dutkiewicz, A.; Mueller, R.D.; O’Callaghan, S.; Jonasson, H. Census of Seafloor Sediments in the World’s Ocean. Geology 2015, 43, 795–798. [Google Scholar] [CrossRef]
  43. Wang, X.; Li, H.; Cheng, Y.; Yao, P.; Chu, F.; Ma, W.; Wang, H.; Lv, S.; Li, X.; Li, Z.; et al. Submarine Morphological Description of the Ancient Archipelagic Aprons in the Marcus–Wake Seamount Group, Northwestern Pacific Ocean. J. Mar. Sci. Eng. 2024, 12, 670. [Google Scholar] [CrossRef]
  44. Winterer, E.L.; Natland, J.H.; Van Waasbergen, R.J.; Duncan, R.A.; Mcnutt, M.K.; Wolfe, C.J.; Premoli Silva, I.; Sager, W.W.; Sliter, W.V. Cretaceous Guyots in the Northwest Pacific: An Overview of Their Geology and Geophysics. Mesoz. Pac. Geol. Tecton. Volcanism Geophys Monogr Am Geophys Union 1993, 77, 307–334. [Google Scholar] [CrossRef]
  45. Neuendorf, K.K. Glossary of Geology; Springer Science & Business Media: Berlin/Heidelberg, Germany, 2005; ISBN 0-922152-76-4. [Google Scholar]
  46. He, H.; Garcia, E.A. Learning from Imbalanced Data. IEEE Trans. Knowl. Data Eng. 2009, 21, 1263–1284. [Google Scholar] [CrossRef]
  47. Schimel, A.C.G.; Beaudoin, J.; Parnum, I.M.; Le Bas, T.; Schmidt, V.; Keith, G.; Ierodiaconou, D. Multibeam Sonar Backscatter Data Processing. Mar. Geophys. Res. 2018, 39, 121–137. [Google Scholar] [CrossRef]
  48. Tang, G. Geographic Information System Curriculum, 2nd ed.; Higher Education Press: Beijing, China, 2019; ISBN 978-7-04-052355-3. [Google Scholar]
  49. He, D.; Wang, L. Texture Unit, Texture Spectrum, And Texture Analysis. IEEE Trans. Geosci. Remote Sens. 1990, 28, 509–512. [Google Scholar] [CrossRef]
  50. Massot-Campos, M.; Oliver-Codina, G.; Ruano-Amengual, L.; Miró-Juliá, M. Texture analysis of seabed images: Quantifying the presence of posidonia oceanica at palma bay. In Proceedings of the 2013 MTS/IEEE OCEANS, Bergen, Norway, 10–13 June 2013; pp. 1–6. [Google Scholar]
  51. Nguyen, H.-G.; Fablet, R.; Ehrhold, A.; Boucher, J.-M. Keypoint-Based Analysis of Sonar Images: Application to Seabed Recognition. Ieee Trans. Geosci. Remote Sens. 2012, 50, 1171–1184. [Google Scholar] [CrossRef]
  52. Li, Y.; Yao, H.; Chen, Z.; Wang, L.; Zhou, H.; Zhang, S.; Zhao, B. Detailed Investigation of Cobalt-Rich Crusts in Complex Seamount Terrains Using the Haima ROV: Integrating Optical Imaging, Sampling, and Acoustic Methods. J. Mar. Sci. Eng. 2025, 13, 702. [Google Scholar] [CrossRef]
  53. Fuyuan, Z.; Weiyan, Z.; Kechao, Z.; Shuitu, G.; Haisheng, Z.; Xiaoyu, Z.; Benduo, Z. Distribution Characteristics of Cobalt-Rich Ferromanganese Crust Resources on Submarine Seamounts in the Western Pacific. Acta Geol. Sin. Engl. Ed. 2008, 82, 796–803. [Google Scholar] [CrossRef]
  54. Tanaka, E.; Mimura, K.; Nakamura, K.; Ohta, J.; Yasukawa, K.; Kato, Y. Rare-Earth Elements in Deep-Sea Sediments in the South Pacific Gyre: Source Materials and Resource Potentials. Geochem. Geophys. Geosystems 2023, 24, e2022GC010681. [Google Scholar] [CrossRef]
  55. Horn, B.K.P. Hill Shading and the Reflectance Map. Proc. IEEE 1981, 69, 14–47. [Google Scholar] [CrossRef]
  56. Lundblad, E.R.; Wright, D.J.; Miller, J.; Larkin, E.M.; Rinehart, R.; Naar, D.F.; Donahue, B.T.; Anderson, S.M.; Battista, T. A Benthic Terrain Classification Scheme for American Samoa. Mar. Geod. 2006, 29, 89–111. [Google Scholar] [CrossRef]
  57. Wang, H.; Sun, Y.; Wang, S.; Gao, W.; Xu, W.; Liu, Z.; Yin, X.; Ruan, S.; Shao, Y. Fine-Scale Geomorphologic Classification of Guyots in Representative Areas of the Western Pacific Ocean. J. Mar. Sci. Eng. 2025, 13, 823. [Google Scholar] [CrossRef]
  58. Mitchell, N.C.; Simmons, H.L.; Lear, C.H. Modern and Ancient Hiatuses in the Pelagic Caps of Pacific Guyots and Seamounts and Internal Tides. Geosphere 2015, 11, 1590–1606. [Google Scholar] [CrossRef]
  59. Du, D.; Yan, S.; Yang, G.; Shi, F.; Zhu, Z.; Song, Q.; Yang, F.; Cui, Y.; Shi, X. Depositional Patterns Constrained by Slope Topography Changes on Seamounts. Sci. Rep. 2020, 10, 20534. [Google Scholar] [CrossRef]
  60. Fan, M.; Shi, S.; Ma, Y.; Wang, H.; Zhai, J.; Zhang, X.; Ning, P. High Resolution Geomorphological Classification of Benthic Structure on the Western Pacific Seamount. Front. Mar. Sci. 2022, 9, 1007032. [Google Scholar] [CrossRef]
  61. Zhao, B.; Wei, Z.; Yang, Y.; He, G.; Zhang, H.; Ma, W. Sedimentary Characteristics and the Implications of Cobalt-Rich Crusts Resources at Caiwei Guyot in the Western Pacific Ocean. Mar. Georesources Geotechnol. 2020, 38, 1037–1045. [Google Scholar] [CrossRef]
  62. Talling, P.J.; Wynn, R.B.; Masson, D.G.; Frenz, M.; Cronin, B.T.; Schiebel, R.; Akhmetzhanov, A.M.; Dallmeier-Tiessen, S.; Benetti, S.; Weaver, P.P.E.; et al. Onset of Submarine Debris Flow Deposition Far from Original Giant Landslide. Nature 2007, 450, 541–544. [Google Scholar] [CrossRef]
  63. Carter, G.D.O.; Cooper, R.; Gafeira, J.; Howe, J.A.; Long, D. Morphology of Small-Scale Submarine Mass Movement Events across the Northwest United Kingdom. Geomorphology 2020, 365, 107282. [Google Scholar] [CrossRef]
  64. Puga-Bernabeu, A.; Lopez-Cabrera, J.; Webster, J.M.; Beaman, R.J. Submarine Landslide Morphometrics and Slope Failure Dynamics along a Mixed Carbonate-Siliciclastic Margin, North-Eastern Australia. Geomorphology 2022, 403, 108179. [Google Scholar] [CrossRef]
  65. Cacchione, D.A.; Pratson, L.F.; Ogston, A.S. The Shaping of Continental Slopes by Internal Tides. Science 2002, 296, 724–727. [Google Scholar] [CrossRef]
  66. Masson, D.G.; Harbitz, C.B.; Wynn, R.B.; Pedersen, G.; Løvholt, F. Submarine Landslides: Processes, Triggers and Hazard Prediction. Philos. Trans. R. Soc. Math. Phys. Eng. Sci. 2006, 364, 2009–2039. [Google Scholar] [CrossRef]
  67. Urgeles, R.; Camerlenghi, A. Submarine Landslides of the Mediterranean Sea: Trigger Mechanisms, Dynamics, and Frequency-Magnitude Distribution. J. Geophys. Res. Earth Surf. 2013, 118, 2600–2618. [Google Scholar] [CrossRef]
  68. Moscardelli, L.; Wood, L.; Mann, P. Mass-Transport Complexes and Associated Processes in the Offshore Area of Trinidad and Venezuela. AAPG Bull. 2006, 90, 1059–1088. [Google Scholar] [CrossRef]
  69. Schlager, W. Scaling of Sedimentation Rates and Drowning of Reefs and Carbonate Platforms. Geology 1999, 27, 183–186. [Google Scholar] [CrossRef]
  70. Godet, A. Drowning Unconformities: Palaeoenvironmental Significance and Involvement of Global Processes. Sediment. Geol. 2013, 293, 45–66. [Google Scholar] [CrossRef]
  71. De Oliveira, L.C.; Rancan, C.C.; Leonel Sartorato, A.C.; Farias, F.A.; Pereira, E. Drowning Unconformities on Presalt Carbonate Platforms-Examples from the Itapema Formation (Lower Cretaceous), Santos Basin, Offshore Brazil. Palaeogeogr. Palaeoclimatol. Palaeoecol. 2021, 577, 110570. [Google Scholar] [CrossRef]
Figure 1. Location and morphology of the DD Guyot, and the dive trajectories of the manned submersible Jiaolong.
Jmse 13 01904 g001
Figure 2. CNN-based DD Guyot substratum type classification pipeline.
Jmse 13 01904 g002
Figure 3. Sediment distribution characteristics along the trajectory of manned submersibles.
Jmse 13 01904 g003
Figure 4. Sediment distribution characteristics along the D300 trajectory line, along with corresponding depth and slope values. (a) Location and video image; (b) depth and slope profile.
Jmse 13 01904 g004aJmse 13 01904 g004b
Figure 5. Sediment distribution characteristics along the D301 trajectory line, along with corresponding depth and slope values. (a) Location and video image; (b) depth and slope profile.
Jmse 13 01904 g005aJmse 13 01904 g005b
Figure 6. Sediment distribution characteristics along the D302 trajectory line, along with corresponding depth and slope values. (a) Location and video image; (b) depth and slope profile.
Jmse 13 01904 g006aJmse 13 01904 g006b
Figure 7. Sediment distribution characteristics along the D303 trajectory line, along with corresponding depth and slope values. (a) Location and video image; (b) depth and slope profile.
Jmse 13 01904 g007
Figure 8. CNN-based classification results for seafloor substratum types in the DD Guyot.
Jmse 13 01904 g008
Figure 9. Common benthic organisms seen by the Jiaolong submersible: (a) coral, (b) sponge, (c) sea lily, (d) brittle star on dead sponge, (e) decapod shrimp, and (f) squat lobster.
Jmse 13 01904 g009
Figure 10. Results of the geomorphologic classification of the DD Guyot. The figure depicts two typical landslides and marks 21 typical gullies.
Jmse 13 01904 g010
Figure 11. Location of Landslide A, Landslide B, and their cross-sections AB, CD, EF, and GH. Among them, (a) represents the Landslide A area, and (b) represents the Landslide B area.
Jmse 13 01904 g011
Figure 12. Depth profile of lines (a) AB, (b) CD, (c) EF, and (d) GH from Figure 11. Profile lines indicate different substratum types with distinct colors: red for exposed bedrock, green for thinly sedimented bedrock, light blue for the sediment–rock transition zone, and dark blue for continuous sediment. Light brown indicates the guyot.
Jmse 13 01904 g012
Table 1. Jiaolong manned submersible survey line information.
DiveLocationLength (m)Maximum Depth (m)
D300Southwestern edge of the summit platform and the ridge32581998
D301Eastern flank26293032
D302Eastern part of the summit platform and the eastern flank32512087
D303Northwest edge of the summit platform and the ridge32912044
Table 2. Summary of predictor variables derived from MBES data (total: 18 dimensions).
Feature CategoryFeatureDescription
DepthDepthElevation.
SlopeSlopeThe degree of inclination of a local surface slope.
Topographic reliefTopographic reliefThe difference between the highest point and the lowest point within a specific area.
Backscatter intensityBackscatter intensityThe intensity of energy reflected back from the seafloor in response to multibeam pulse signals.
GLCMMeanThe average level of grayscale values corresponding to each row (column) of the GLCM.
Variance (Var)Degree of dispersion in the gray distribution.
Homogeneity (Hom)Similarity of gray levels between adjacent pixels.
Contrast (Con)Magnitude of gray-level transitions.
Dissimilarity (Dis)Average intensity of grayscale differences.
Entropy (Ent)Measurement of texture feature complexity.
Angular Second Moment (ASM)The stability of texture grayscale variations.
Correlation (Cor)Linear correlation between row- and column-wise gray levels.
Laws E 5 E 5 Construct a two-dimensional convolution kernel using the outer product of two one-dimensional filters to compute the local response energy, thereby reflecting texture features in the pixel domain.
L 5 = 1 4 6 4 1 E 5 = 1 2 0 2 1 S 5 = 1 0 2 0 1 W 5 = 1 2 0 2 1 R 5 = 1 4 6 4 1
L 5 ,   E 5 ,   S 5 ,   W 5 ,   and   R 5 represent level, edge, spot, wave, and ripple, respectively.
L 5 E 5
L 5 S 5
S 5 S 5
GaborThe short-time Fourier transform localized using Gaussian windows can extract structures with specific scales and orientations. The direction angle determines the filter’s selectivity toward textures oriented in a specific direction.
45°
Table 3. Substratum type, primarily classified based on sediment cover.
TypeDescriptionSediment Cover
Exposed bedrockContinuously distributed bedrock, with cobalt-rich crusts developed in some areas; rough surface, with minimal or absent sediment cover.Very low
Thinly sedimented bedrockContinuously distributed bedrock, with surfaces often developed with cobalt-rich crusts, overlain by thin sedimentary deposits.Low
Sediment–rock transition zoneComposed of a mixture of nodules, gravelly crusts, cobbles, and sediments, exhibiting spatial mosaicism and high heterogeneity.High
Continuous sedimentContinuously distributed sediments with a relatively flat surface, showing ripple marks in places.Very high
Table 4. Number of substratum types used for the training set and validation set.
TypeTotal NumberTraining Set NumberValidation Set Number
Exposed bedrock656452511313
Thinly sedimented bedrock13001040260
Sediment–rock transition zone572457115
Continuous sediment14461157289
Table 5. Confusion matrix and accuracy evaluation of the CNN. The table includes precision, recall, overall accuracy (OA), and kappa coefficient for exposed bedrock (EB), thinly sedimented bedrock (TSB), sediment–rock transition zone (SRT), and continuous sediment (CS).
TypeEBTSBSRTCSRecall (%)OA (%)Kappa
EB1281310197.5695.600.92
TSB1123210789.23
SRT01107793.04
CS001927093.43
Precision(%)99.1587.8878.6894.74
Table 6. Comparison of substratum type classification performance among different models.
ModelOA (%)Kappa
RF92.770.86
SVM83.160.63
AdaBoost68.130.50
MLP89.020.79
Table 7. The area, depth, and slope of different substratum types in the DD Guyot.
TypeArea (km2)Area (%)Mean Depth (m)Mean Slope (°)
Exposed bedrock176.028.76%2667.3320.38
Thinly sedimented bedrock280.0713.93%3524.8921.06
Sediment–rock transition zone34.011.69%2573.1227.80
Continuous sediment1520.3275.62%5023.0911.23
Table 8. The area, depth, and slope of the summit platform.
TypeArea (km2)Area (%)Mean Depth (m)Mean Slope (°)
Exposed bedrock23.1592.23%1081.742.56
Thinly sedimented bedrock1.957.77%1071.132.19
Table 9. The area, depth, and slope of the gully on the slope.
TypeArea (km2)Area (%)Mean Depth (m)Mean Slope (°)
Exposed bedrock7.1615.07%2774.8824.77
Thinly sedimented bedrock19.6141.27%3378.2721.52
Sediment–rock transition zone2.595.45%2482.2517.67
Continuous sediment18.1638.22%3625.3620.87
Table 10. Detailed descriptions of the morphology and sedimentary characteristics of gullies.
NumberTrendLength (m)Width (m)Mean Slope (°)Sedimentary Features
1E470372923.52Mainly continuous sediment, no exposed bedrock.
2E267240029.79All four types are present, with sediment cover increasing from top to bottom.
3ESE550931026.01All four types are present, with sediment cover increasing from top to bottom.
4ESE244537426.57All four types are present, with sediment cover increasing from top to bottom.
5SE286029723.77All four types are present, with sediment cover increasing from top to bottom.
6NNW360122421.31No sediment–rock transition zone; sediment cover increases from top to bottom.
7N227315420.49No exposed bedrock; sediment cover increases from top to bottom.
8NNW552730126.62No sediment–rock transition zone; sediment cover increases from top to bottom.
9NW274045137.71Mainly exposed bedrock, with a small amount of thinly sedimented bedrock.
10NNE290162428.21No sediment–rock transition zone; sediment cover increases from top to bottom.
11NW217434029.15All four types are present, with sediment cover increasing from top to bottom.
12WNW275041628.12All four types are present, with sediment cover increasing from top to bottom.
13WNW190939526.64Continuous sediment dominates the landscape, with no exposed bedrock.
14SSW369223522.77All four types are present, with sediment cover increasing from top to bottom.
15S337839723.79All four types are present, with sediment cover decreasing from top to bottom.
16S435761830.42All four types are present, with sediment cover increasing from top to bottom.
17S397745623.10All four types are present, with sediment cover increasing from top to bottom.
18SSW164917325.49All four types are present, with sediment cover increasing from top to bottom. Continuous sediment accounts for a smaller proportion.
19WSW311335329.82Mainly thinly sedimented bedrock.
20SW239336523.89Mainly thinly sedimented bedrock, no sediment–rock transition zone.
21SSW298952125.51Mainly thinly sedimented bedrock.
Table 11. The area, depth, and slope of the other areas of the flank and the seafloor plain. Type of exposed bedrock (EB), thinly sedimented bedrock (TSB), sediment–rock transition zone (SRT), and continuous sediment (CS).
LandformMean Depth (m)Mean Slope (°)TypeArea (km2)Area (%)Mean Depth (m)Mean Slope (°)
Extremely steep slope3485.8831.48EB58.7920.69%2589.9733.05
TSB82.5229.04%3181.3730.52
SRT18.856.63%2623.5431.22
CS124.0143.64%4297.6328.99
Steep slope4130.5719.68EB38.069.10%3013.1820.81
TSB91.8521.95%3575.5820.21
SRT1.030.25%2447.3222.40
CS287.4368.70%4530.3819.23
Gentle slope4808.429.64EB34.684.93%2859.4510.19
TSB62.588.90%3868.2511.24
SRT1.130.16%2247.6614.60
CS604.7986.01%5023.059.60
Very gentle slope5492.922.83EB8.091.87%4663.103.76
TSB12.272.84%4383.884.10
SRT0.050.01%2115.826.22
CS411.7995.28%5545.212.97
Seafloor plain5872.681.44TSB0.030.07%5863.641.62
CS44.1899.93%5874.171.47
Disclaimer/Publisher’s Note: The statements, opinions and data contained in all publications are solely those of the individual author(s) and contributor(s) and not of MDPI and/or the editor(s). MDPI and/or the editor(s) disclaim responsibility for any injury to people or property resulting from any ideas, methods, instructions or products referred to in the content.