Article

Reliability and Risk Assessment of Hydrogen-Powered Marine Propulsion Systems Based on the Integrated FAHP-FMECA Framework

by
Meng Wang
1,
Fenghui Han
1,2,*,
Huairui Li
1,
Jingkai Zhou
1 and
Zhe Wang
1,3,*
1
Marine Engineering College, Dalian Maritime University, Dalian 116026, China
2
National Center for International Research of Subsea Engineering Technology and Equipment, Dalian 116026, China
3
State Key Laboratory of Maritime Technology and Safety, Dalian Maritime University, Dalian 116026, China
*
Authors to whom correspondence should be addressed.
J. Mar. Sci. Eng. 2025, 13(11), 2115; https://doi.org/10.3390/jmse13112115
Submission received: 23 September 2025 / Revised: 30 October 2025 / Accepted: 31 October 2025 / Published: 7 November 2025
(This article belongs to the Special Issue Marine Fuel Cell Technology: Latest Advances and Prospects)

Abstract

With the IMO’s 2050 decarbonization target, hydrogen is a key zero-carbon fuel for shipping, but the lack of systematic risk assessment methods for hydrogen-powered marine propulsion systems (under harsh marine conditions) hinders its large-scale application. To address this gap, this study proposes an integrated risk evaluation framework by fusing Failure Mode, Effects, and Criticality Analysis (FMECA) with the Fuzzy Analytic Hierarchy Process (FAHP)—resolving the limitation of traditional single evaluation tools and adapting to the dynamic complexity of marine environments. Scientific findings from this framework confirm that hydrogen leakage, high-pressure storage tank valve leakage, and inverter overload are the three most critical failure modes, with hydrogen leakage being the primary risk source due to its high severity and detection difficulty. Further hazard matrix analysis reveals two key risk mechanisms: one type of failure (e.g., insufficient hydrogen concentration) features “high severity but low detectability,” requiring real-time monitoring; the other (e.g., distribution board tripping) shows “high frequency but controllable impact,” calling for optimized operations. This classification provides a theoretical basis for precise risk prevention. Targeted improvement measures (e.g., dual-sealed valves, redundant cooling circuits, AI-based regulation) are proposed and quantitatively validated, reducing the system’s overall risk value from 4.8 (moderate risk) to 1.8 (low risk). This study’s core contribution lies in developing a universally applicable scientific framework for marine hydrogen propulsion system risk assessment. It not only fills the methodological gap in traditional evaluations but also provides a theoretical basis for the safe promotion of hydrogen shipping, supporting the scientific realization of the IMO’s decarbonization goal.

1. Introduction

As global regulations on carbon neutrality tighten, the maritime industry, led by the International Maritime Organization (IMO), has set an ambitious goal of achieving net-zero emissions by 2050 [1]. Hydrogen, as a clean and zero-carbon energy carrier, has attracted increasing attention for its potential to transform marine propulsion [2,3]. Compared with conventional fossil fuels, hydrogen combustion releases only water vapor, effectively reducing greenhouse gas emissions and improving energy efficiency [4,5,6,7].
Hydrogen can be produced from diverse feedstocks such as natural gas, ammonia, methanol, and water electrolysis, providing flexible pathways for sustainable energy supply [8]. Among clean propulsion technologies, proton exchange membrane fuel cells (PEMFCs) are particularly promising for their high efficiency, fast startup, and zero emissions [9,10,11,12,13,14,15]. In maritime applications, PEMFC-based power systems boost propulsion efficiency and cut operational emissions, supporting shipping’s green transition.
Several recent studies have demonstrated the practical benefits of hydrogen PEMFCs in real ship operations. Inal et al. (2024) [16] studied a medium-sized general cargo ship (Mediterranean/Black/Marmara Seas) on PEMFC replacing DGs. Per March 2020–January 2021 data: PEMFC cut CO2 (37.4%), NOx (32.5%), SOx (37.3%), PM (37.4%); kept CII Grade A (2023–2030, vs. DG’s projected Grade E); costs were competitive (15-yr CAPEX: USD1.305M, OPEX: USD2.47M; 18-voyage H2 cost: USD260,981 vs. MDO’s USD206,435)–confirming PEMFC’s value for maritime decarbonization/compliance. Similarly, Di Bernardo et al. (2025) [17] designed a 75 m Mega Yacht with hydrogen FC-diesel-electric hybrid propulsion (for carbon neutrality/ECA compliance). It enables 130-nautical-mile zero-emission sailing (diesel backup without H2). Key specs: 4 FCs (540 kW total), 2 × 180 kW motors, 2 × 1765 kW thermal engines, 105 H2 cylinders (21.3 m3, 350 bar, IGF Code/DNV compliant). RINA/Autohydro tests confirmed viability–proving hydrogen FC’s utility in mid-sized luxury yachts.
To realize the large-scale application of hydrogen-powered ships, reliable and safe hydrogen storage technologies are essential. Currently, high-pressure hydrogen tanks and solid-state hydrogen storage are two mainstream approaches, each with unique advantages and safety challenges [18,19,20]. Marine conditions—characterized by high humidity, vibration, and salt corrosion—expose these systems to elevated risks such as hydrogen leakage, valve fatigue, and material degradation. Therefore, systematic reliability assessment is critical to ensure safe and efficient operation of hydrogen propulsion systems.
Failure Mode, Effects, and Criticality Analysis (FMECA) provides a structured method for identifying potential failure modes, evaluating their impacts, and prioritizing corresponding risks [21]. The FMECA technical process is shown in Figure 1. However, traditional FMECA often struggles to address uncertainties and subjective expert judgments. The Fuzzy Analytic Hierarchy Process (FAHP) introduces fuzzy numbers and multi-criteria decision logic to better capture uncertainty and reduce subjective bias in weighting [22,23,24,25]. Integrating FMECA with FAHP thus offers a powerful tool for quantifying system reliability under complex and uncertain conditions.
Despite notable research efforts in other engineering domains such as aerospace, nuclear, and automotive systems, the application of FMECA and FAHP to hydrogen-powered marine propulsion remains limited [26,27,28,29]. Most existing studies focus on single subsystems—such as fuel cells or hydrogen storage—without addressing the multi-physics coupling effects (electrochemical–thermal–fluid) and environmental uncertainties inherent to marine operation [30,31,32]. Moreover, few studies quantitatively incorporate environmental correction factors (e.g., vibration, temperature fluctuations, salt spray) into the reliability evaluation of hydrogen propulsion systems.
To bridge these gaps, this study establishes an integrated fuzzy-FMECA framework for the quantitative reliability and risk assessment of hydrogen-powered marine propulsion systems. The main contributions and novelties are summarized as follows:
(1) A hybrid framework combining FMECA and FAHP is developed to address uncertainty and multi-factor coupling in hydrogen propulsion systems;
(2) Multi-physics risk factors (electrochemical, thermal, and fluid dynamics) and marine environmental correction coefficients are incorporated into the reliability model;
(3) A case study of a representative hydrogen-powered vessel validates the applicability and accuracy of the proposed method, providing targeted engineering improvement strategies.
The remainder of this paper is organized as follows: Section 2 introduces the hydrogen propulsion system architecture and key subsystems; Section 3 presents the fuzzy-FMECA methodology; Section 4 discusses reliability results; Section 5 Discussion; Section 6 concludes Conclusions.

2. Hydrogen Energy Ship Propulsion System

2.1. Composition and Functions of the Hydrogen Energy Power System

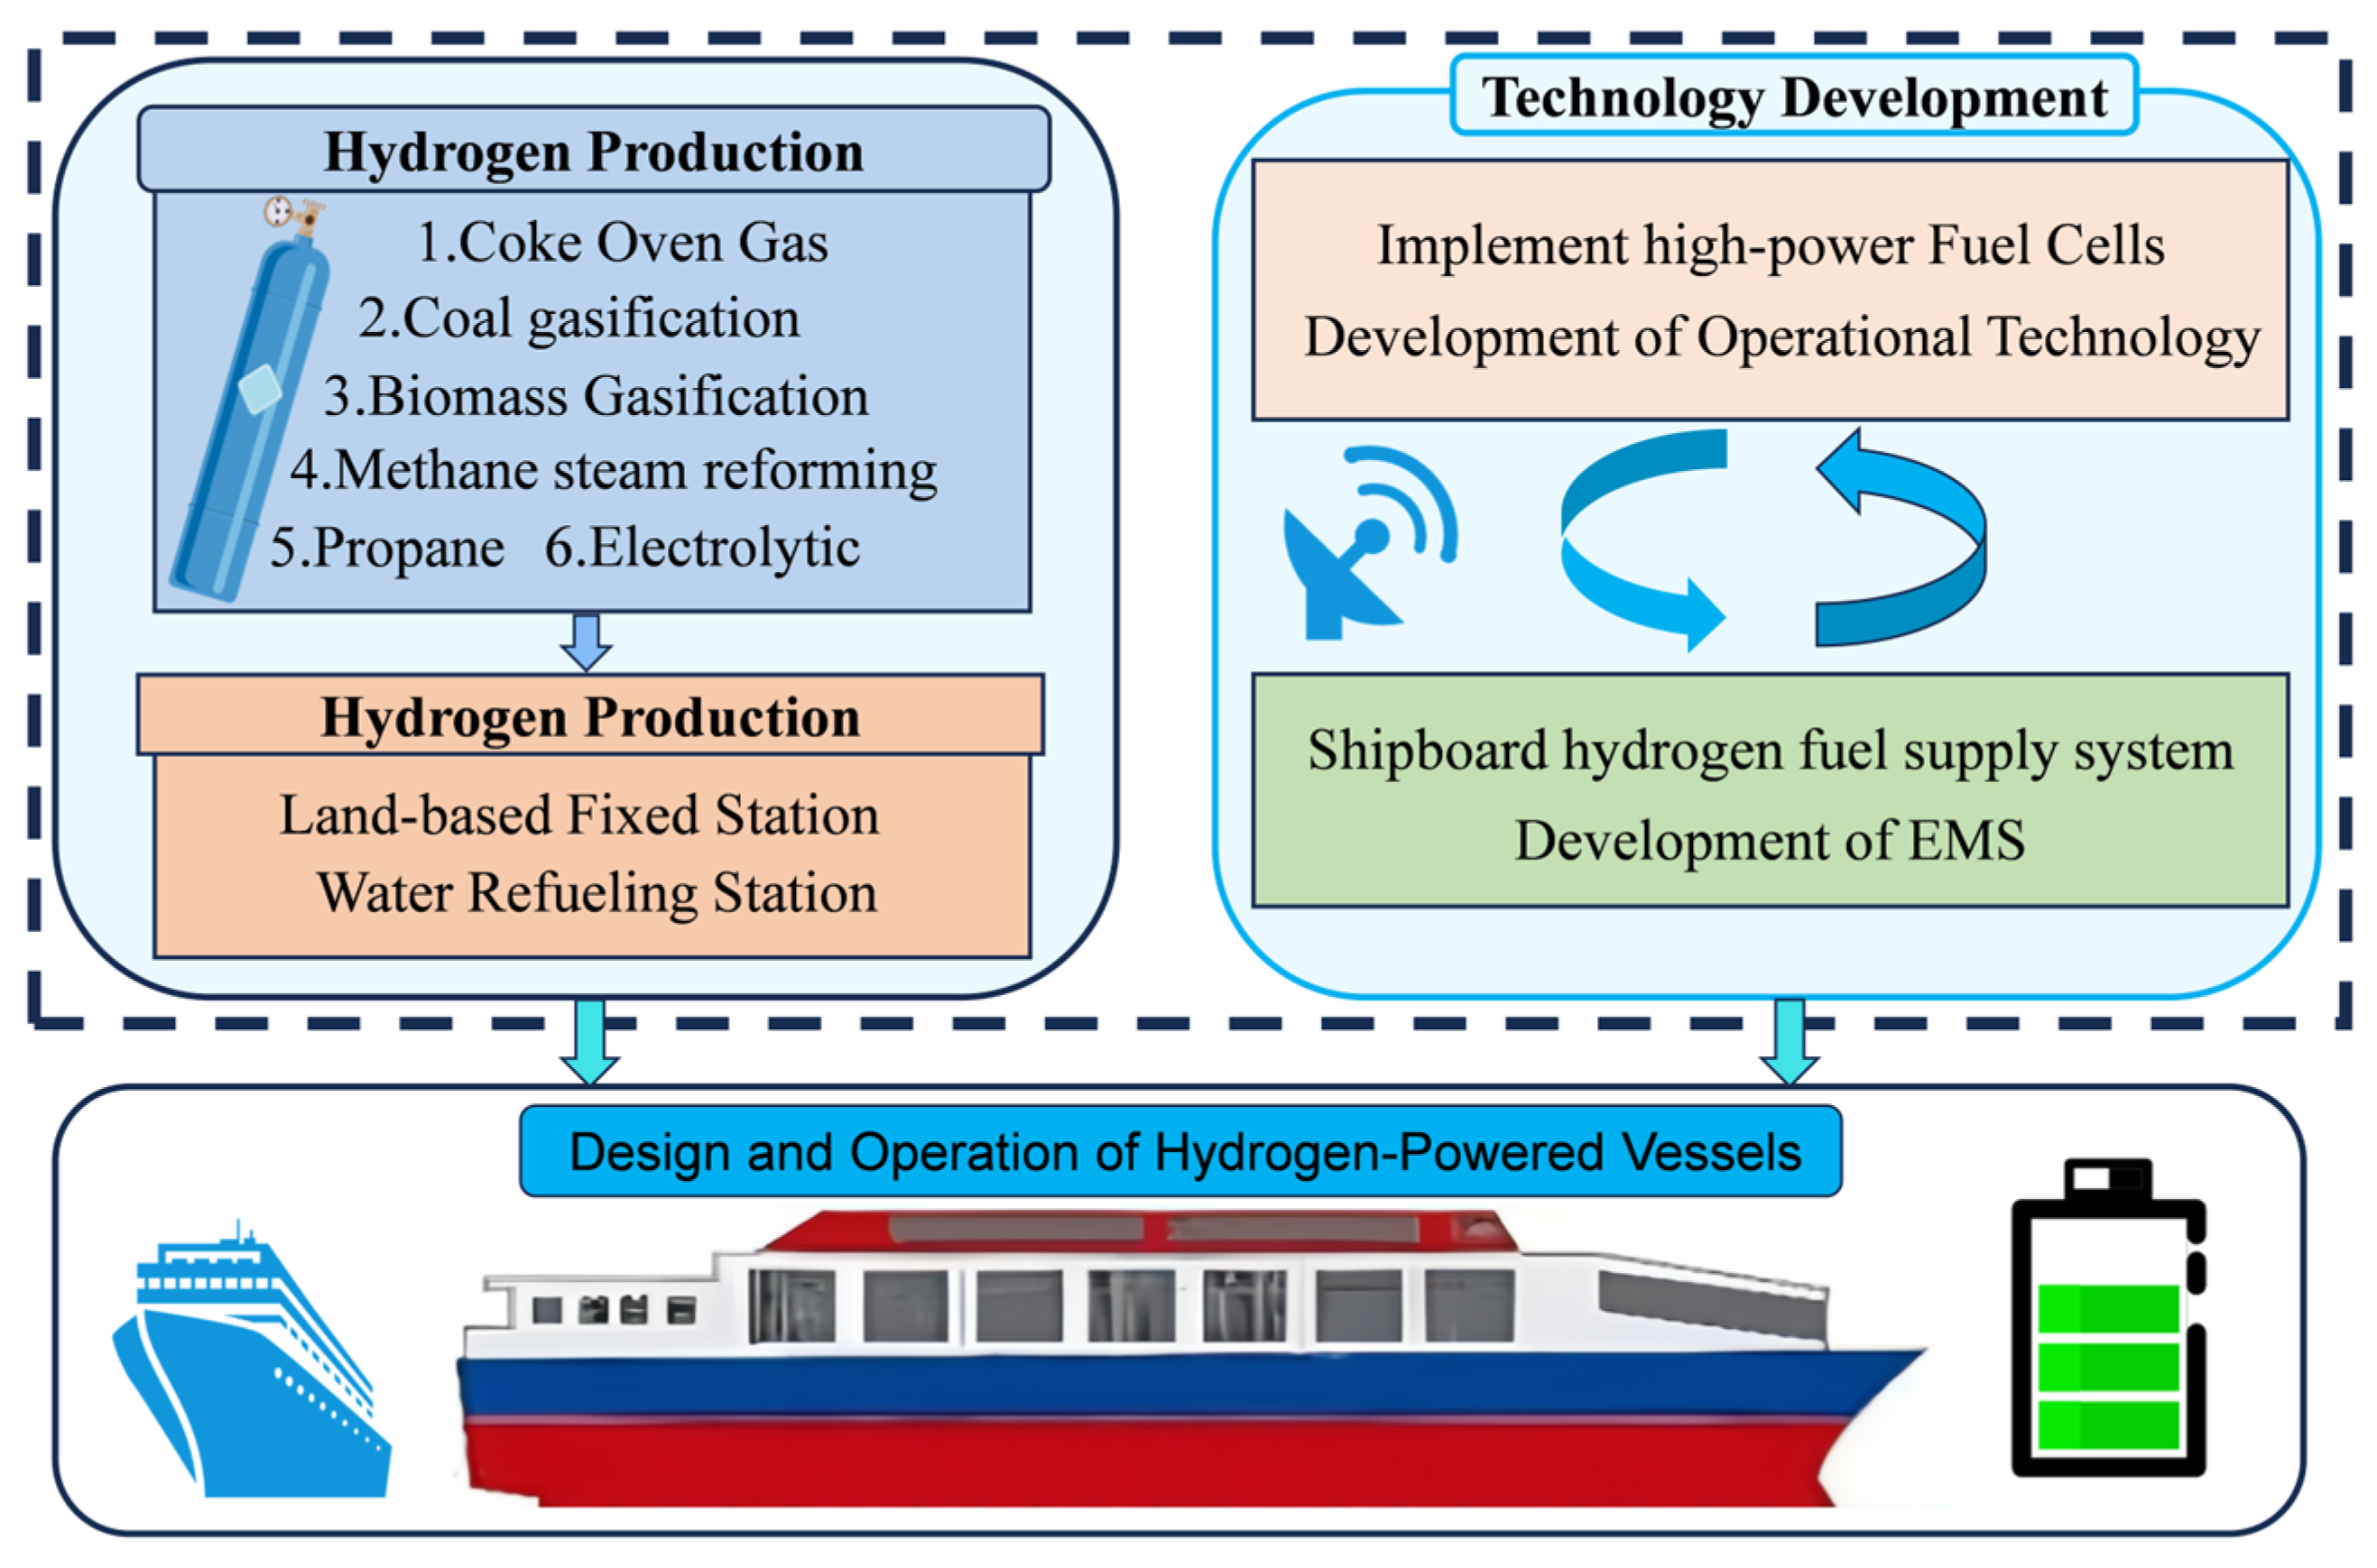
In the field of environmentally friendly clean energy, fuel cells (FCs) have become one of the most representative options [33,34]. Proton exchange membrane fuel cells (PEMFCs) are highly efficient energy converters with an energy conversion efficiency of 40–60%. Their environmental friendliness gives them broad prospects in the energy sector and global attention [35]. PEMFCs directly convert the chemical energy of hydrogen and oxygen into electrical energy through electrochemical reactions. They offer advantages such as high power density, rapid startup, low operating temperatures, and zero emissions, making them suitable for applications in transportation and other sectors [36]. In this field, the core research team has made outstanding contributions, and the design concept of hydrogen-powered ships is shown in Figure 2.
To achieve the sustainable development of hydrogen-powered propulsion systems, constructing an efficient hydrogen storage subsystem is essential. Currently, the most widely used hydrogen storage technologies are high-pressure hydrogen tanks and solid-state storage. Both have unique advantages but face challenges in safety and technological maturity. These issues have become critical topics requiring urgent resolution within the architecture of hydrogen-powered marine propulsion systems.
High-pressure hydrogen storage tanks garner significant attention due to their high energy density. Typically operating at pressures ranging from 350 to 700 bar, they enable efficient hydrogen storage and facilitate rapid hydrogen release. However, this storage method carries safety risks including hydrogen leakage, combustion, and explosion [37]. According to the “Safety Requirements and Risk Assessment Methods for Fuel Cell Vessels,” failure modes of high-pressure hydrogen storage tanks primarily include material fatigue and valve malfunctions. Addressing this situation, integrating advanced risk assessment models such as FMECA with hydrogen leakage diffusion models to conduct quantitative analysis of potential failures can provide theoretical support for developing practical safety measures. Through research surveys, Balestra et al. (2021) [38], in “Safety Barrier Analysis of Hydrogen-Powered Ships,” found through ship simulations that the severity scores of consequences caused by hydrogen leakage leading to thermal runaway generally ranged between 0.8 and 0.9. Zou et al. (2024) [18], in “High-Pressure Hydrogen Release from Type III Tanks under Fire Scenarios,” indicated in their study of 350–700 bar high-pressure hydrogen tanks that the early detection rate of hydrogen leaks was below 40%.
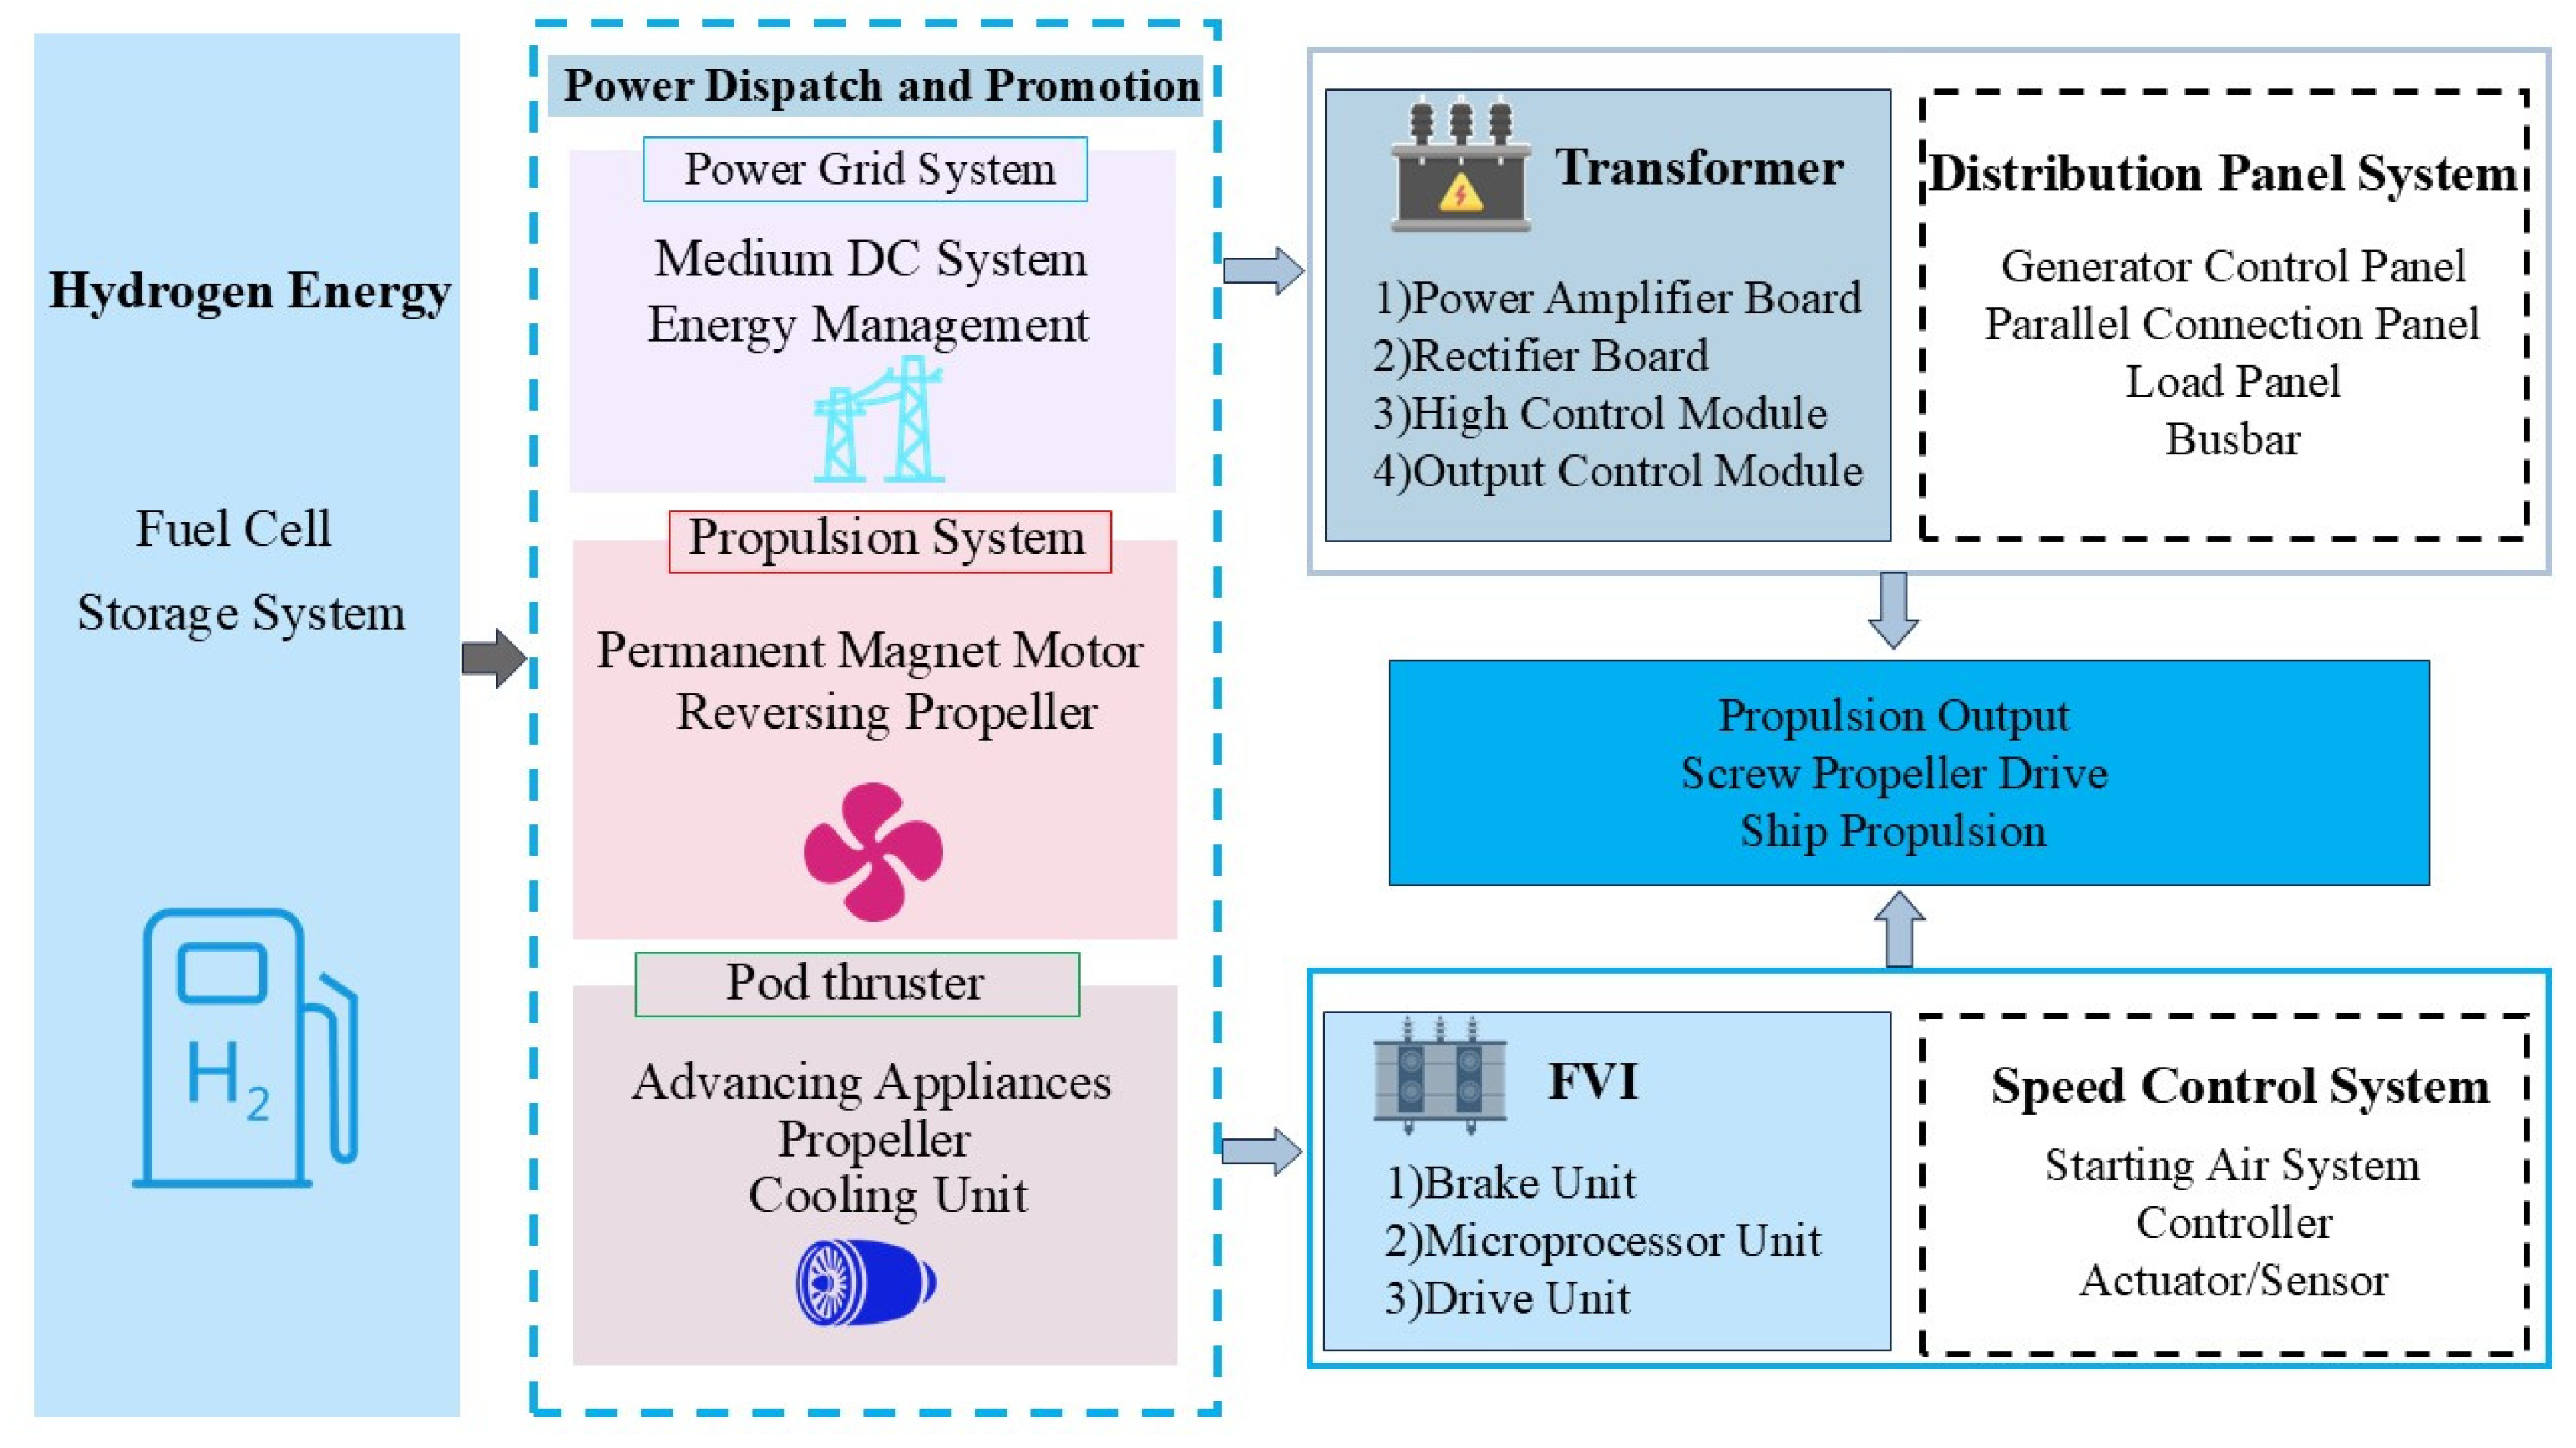
Against the backdrop of the current energy transition, the integrated design of hydrogen-powered ship electric propulsion and energy management holds critical significance. The core of energy management system integration lies in achieving real-time monitoring and control of hydrogen flow, load demand, and battery status. Research indicates that power systems exhibit dynamic response characteristics, which directly impact vessel propulsion efficiency and safety. Against this backdrop, intelligent optimization of propulsion systems through real-time data acquisition and analysis becomes paramount. However, in practical applications, PEMFC performance is influenced by multiple factors such as temperature, gas flow, and load coupling [39]. This necessitates the implementation of rational energy management strategies for optimization, as illustrated in Figure 3.

2.2. Fault Analysis and Risk Assessment of Hydrogen Energy Systems: From Boundary Definition to Pattern Recognition

In hydrogen-powered marine propulsion systems, clearly defining system boundaries and key components forms the cornerstone for ensuring system safety and reliability. The core components of this system include the “fuel cell stack,” “hydrogen storage tank,” and the associated “cooling system.” Among these, the fuel cell stack serves as the heart of the hydrogen propulsion system, converting hydrogen into electrical energy through electrochemical reactions [40]. These components are functionally interdependent, collectively forming a complex multiphysics-coupled system where failure of any single part could lead to complete system failure. Therefore, delineating failure-sensitive regions for each critical component is a crucial prerequisite for subsequent failure mode and effects analysis. However, under varying environmental and load conditions, this component is prone to failures such as fluid backflow, abnormal temperatures, and performance degradation. Experimental data indicates that when voltage fluctuation rates reach ±5%, the fuel cell stack’s output power decreases due to reduced reaction efficiency caused by localized temperature increases, adversely affecting the stability of the entire ship’s power chain. To assess the potential impact of such failures, temperature monitoring and fluid dynamics analysis technologies must be employed and appropriately matched with current demand.
Simultaneously, within hydrogen-powered vessel propulsion systems, analyzing typical failure modes is intrinsically linked to system reliability and safety, serving as a critical driver for advancing hydrogen shipping technology. To effectively identify and address these failure modes, this paper employs the FMECA framework, exploring aspects including hydrogen leakage, fuel cell membrane electrode degradation, and thermal management failures. Hydrogen leakage represents a critical risk category within hydrogen systems. As a highly flammable and diffusive gas, hydrogen leaks can trigger explosions and fires. Data from the “Safety Requirements and Risk Assessment Methods for Fuel Cell Vessels” indicates a leakage frequency of approximately 0.02 incidents per year, with often catastrophic consequences when leaks occur. In some real-world cases, hydrogen leaks have resulted in vessel destruction, property damage, and even casualties. Therefore, real-time monitoring of hydrogen leaks and the establishment of corresponding emergency measures are particularly critical. Additionally, introducing hydrogen leak diffusion models can help assess the extent of leaks and their potential impact on the surrounding environment. The degradation of fuel cell membrane electrodes significantly impacts hydrogen energy system performance, representing one of the key factors contributing to system deterioration. PEMFCs, prolonged continuous operation causes gradual performance decline in membrane electrodes due to combined chemical and physical factors. Research indicates that when the conductivity of the membrane electrode decreases to below 70%, the system’s power output is significantly constrained. Against this backdrop, constructing a multiphysics coupling model to quantitatively describe the degradation rate of the membrane electrode and its impact on ship power output has become an important means of ensuring system reliability. This paper classifies several failure modes of hydrogen-powered ship systems, as shown in Table 1.
A detailed analysis of the failure propagation mechanisms reveals that failures in hydrogen energy systems often exhibit cascade effects. In the case of a cooling system failure leading to membrane electrode damage, the mechanism involves elevated temperatures accelerating membrane degradation, with localized hotspots causing the formation of pinholes; the time delay is dependent upon the load level. Preventive measures include temperature gradient monitoring and hotspot warning systems. In the instance where a control system anomaly results in hydrogen leakage, the failure mechanism is attributed to a breakdown in pressure control that leads to overpressure, thereby triggering frequent operation of the safety valve; the recommended preventive measures involve establishing triple-redundant control along with an independent safety circuit. For voltage fluctuations leading to inverter damage, the mechanism is characterized by overvoltage causing IGBT breakdown and undervoltage inducing overcurrent, with a time delay on the order of milliseconds; preventive strategies include the application of rapid current-limiting protection and dynamic voltage regulation.

3. Reliability Analysis of Fuel Cell Hybrid Marine Propulsion System

3.1. Fundamental Reliability Theory and Fuzzy Comprehensive Evaluation Method

3.1.1. Fundamentals of Reliability

Safety and economic performance of hydrogen-powered systems fundamentally rely on reliability. Thus, when analyzing the reliability of fuel cell hybrid ship power systems, we first clarify the basic concept of “reliability” [41]. Reliability refers to the ability of a system to perform its intended functions within a specified period and under predefined conditions. Building on this definition, the analysis method will comprehensively employ fuzzy Fault Modes, Effects, and Criticality Analysis to facilitate an all-encompassing assessment of the hydrogen system’s reliability under variable conditions.
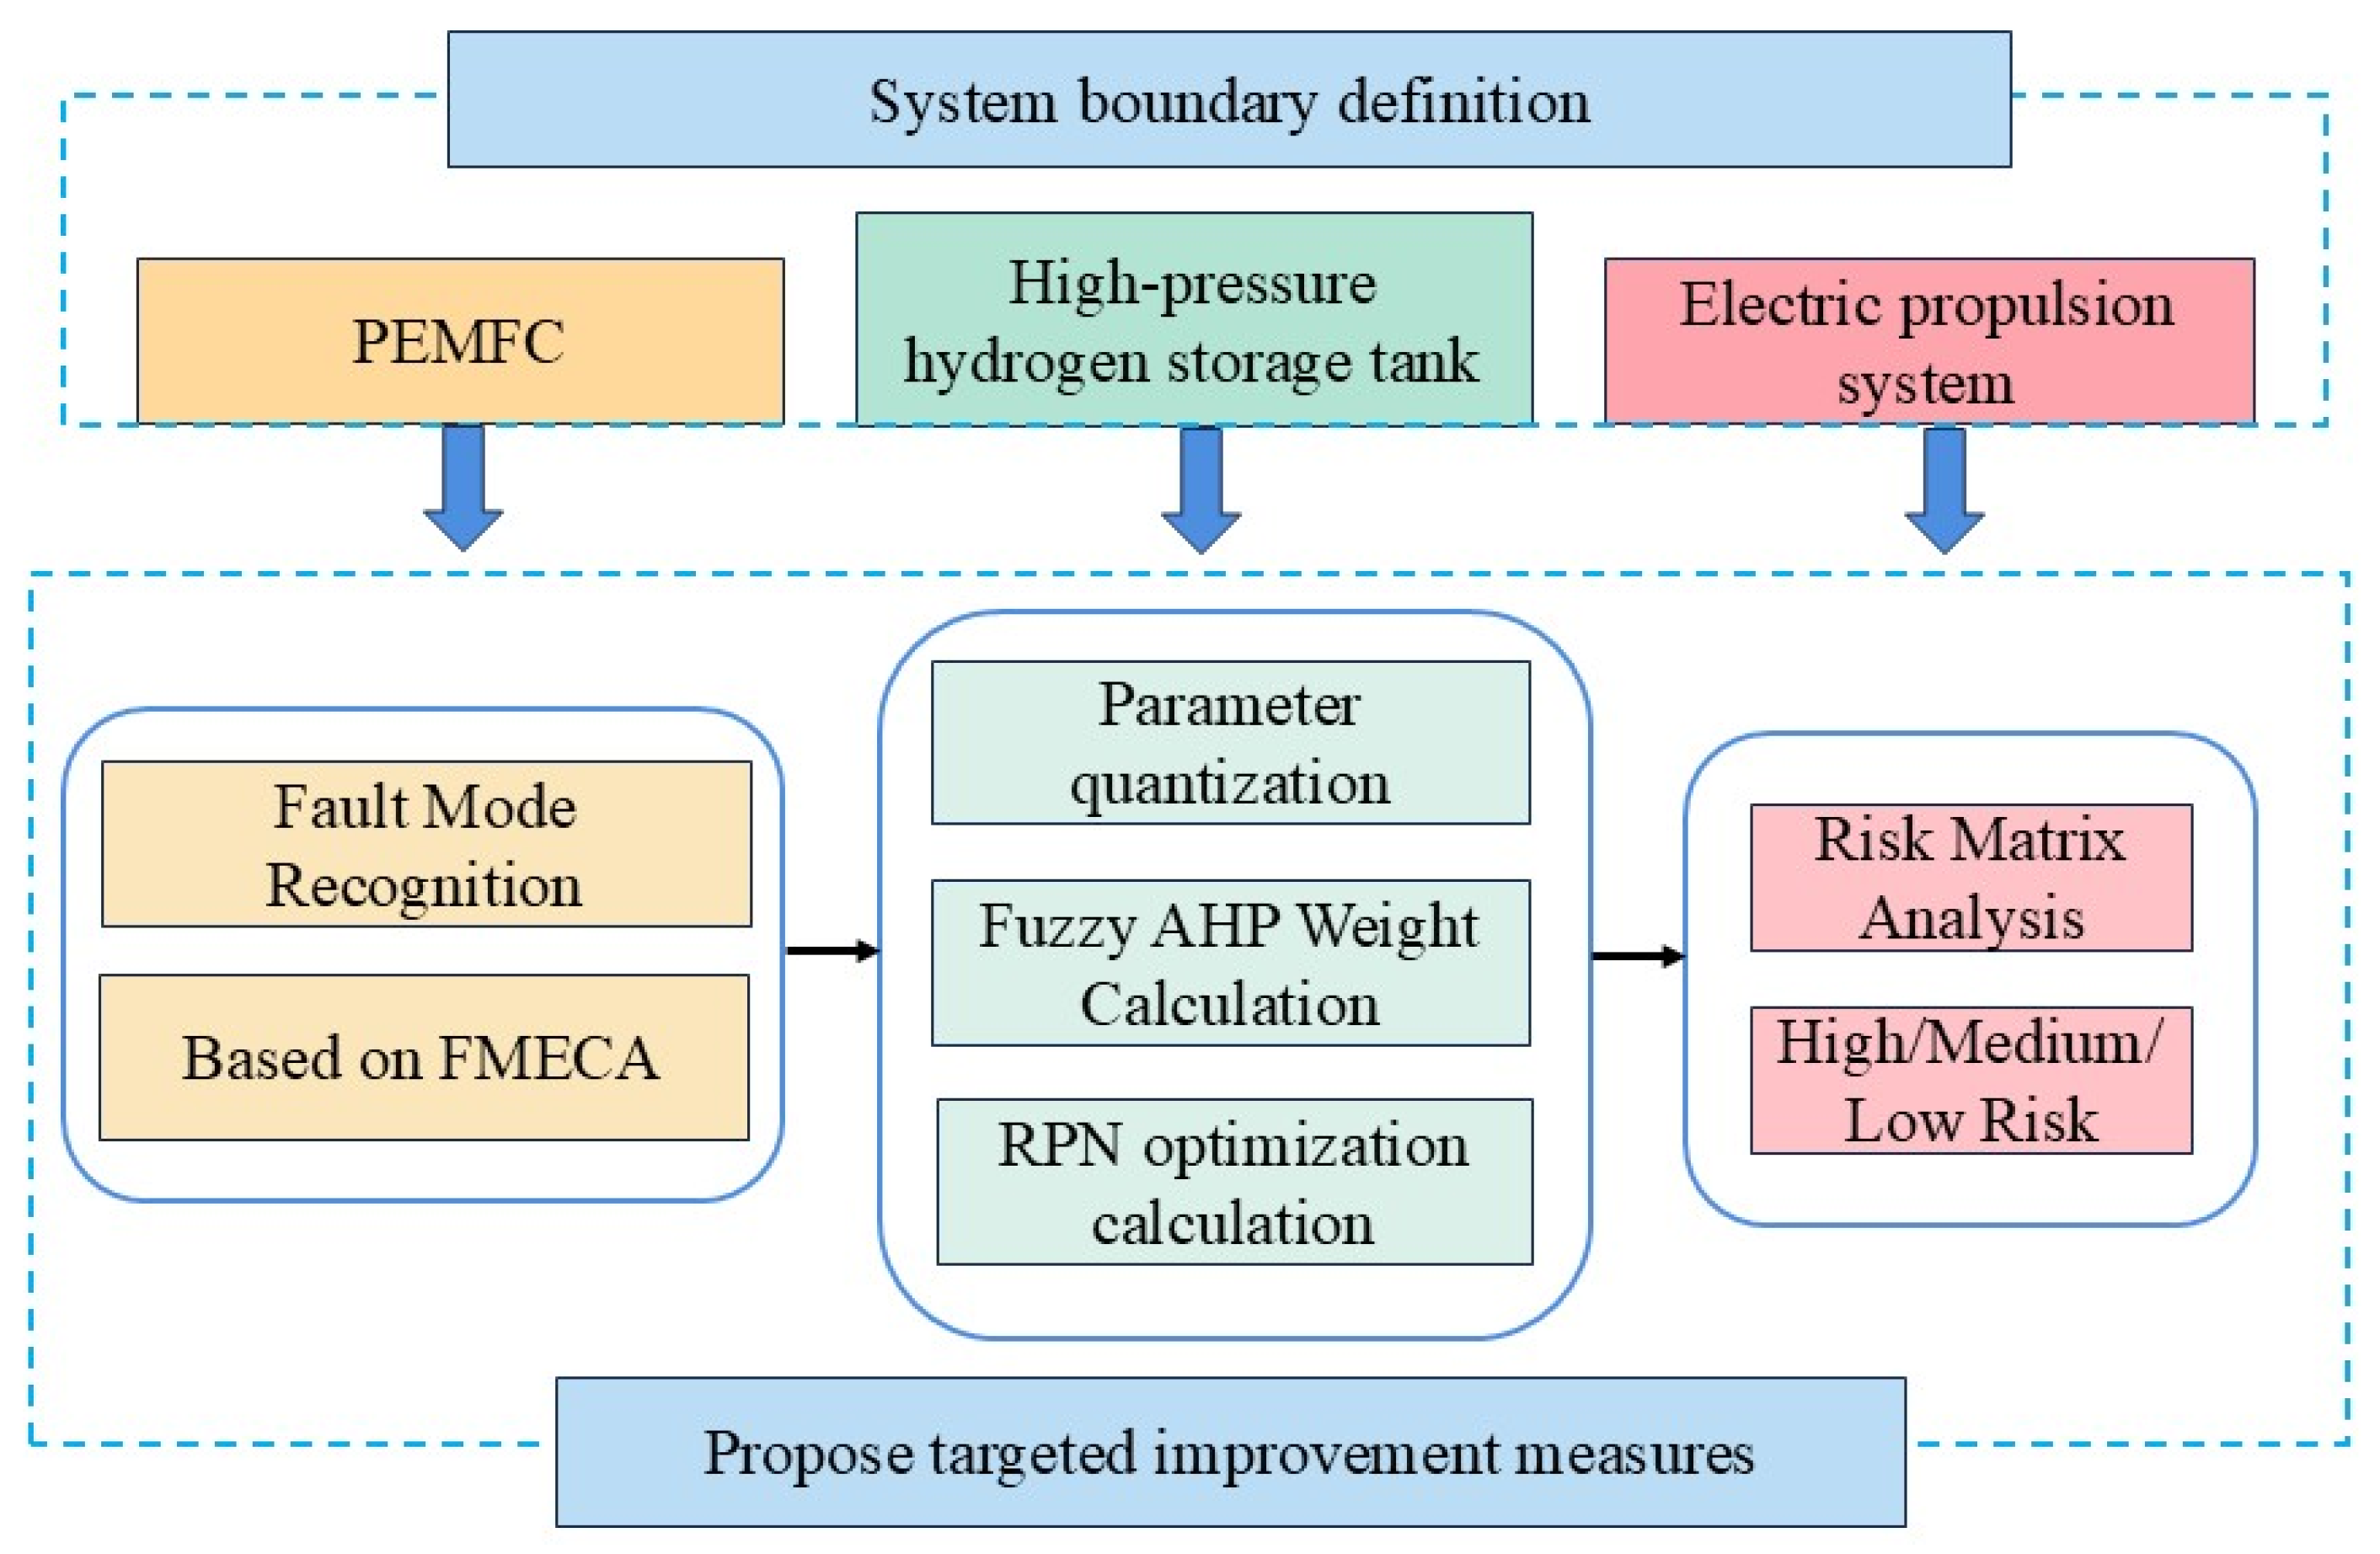
Therefore, a flowchart is needed to summarize this methodology, as shown in Figure 4, which is a flowchart of the risk assessment method for hydrogen-powered ship propulsion systems. Within the reliability analysis of fuel cell hybrid ship power systems, the application of the Risk Priority Number (RPN) calculation model is undoubtedly a key step in optimizing the risk assessment process [42]. The RPN is defined as the product of each fault mode’s occurrence frequency, severity, and detection probability; the higher the resulting value, the greater the corresponding risk level of that fault mode.
When assessing fault modes Via FMECA, the primary task is to clarify scoring criteria for each core parameter. This assessment process requires selecting three key parameters, namely Occurrence (abbreviated as O), Severity (abbreviated as S), and Detection (abbreviated as D), and it is necessary to elaborate on the definition and scoring logic of each parameter using clear and understandable language.
To ensure the standardization and operability of scoring, the scoring range for all parameter items is set to 1 to 10 points, and a specific and implementable scoring guideline is constructed based on this range. In addition, regarding the specific indices corresponding to different parameter levels, strict reference should be made to the Guidelines for Application of Failure Mode and Effects Analysis issued by the China Classification Society (CCS), and the specific corresponding standards can be found in Table 2, Table 3 and Table 4 of this guideline [43].
The factors affecting reliability mainly encompass component failure modes, environmental conditions, load variations, and system redundancy design. As hydrogen energy system technology continues to mature, its components—such as proton ex-change membrane fuel cells (PEMFC), hydrogen storage tanks, and cooling systems—are becoming increasingly complex. Taking PEMFC as an example, its performance is influenced not only by electrochemical reactions but also by environmental parameters such as temperature and pressure. Therefore, a comprehensive reliability analysis must consider the interaction among these various variables. This multi-physics coupling characteristic suggests that a single analytical tool is no longer sufficient for reliability assessment, and multiple theoretical tools must be employed to provide real-time feedback on the system’s state.
Based on previously established scoring criteria, failure modes are quantified into specific numerical values, and these values are used to calculate the criticality of the failure mode’s RPN using the following method:
R P N = O × S × D
To quantify the uncertainty inherent in expert subjective assessments while maintaining consistency with the standard FMECA 1–10 ordinal scale, this study converts expert ratings for Occurrence Probability (O), Severity (S), and Detection Probability (D) into fuzzy membership degrees within the 0–1 interval. The conversion formula is:
Fuzzy Membership Degree = (Expert Rating − 1)/9
where Expert ratings strictly adhere to the standard FMECA 1–10 ordinal scale definition (1 denotes the lowest level, e.g., O = 1 signifies “extremely unlikely to occur”; 10 denotes the highest level, e.g., S = 10 signifies “catastrophic consequences”);
Fuzzy membership quantifies expert scores probabilistically, with 0 corresponding to a score of 1 and 1 to a score of 10, enabling ordered mapping from “qualitative description to quantitative value”.
Taking hydrogen leak severity (S) as an example:
Experts rated hydrogen leak severity as 9 on the standard FMECA scale (meeting the definition of “catastrophic consequences”, see Table 3);
Substituting into the formula yields S fuzzy membership degree = (9 − 1)/9 ≈ 0.89;
Statistical analysis of long-term operational data reveals that the failure rate of PEMFC systems is not constant but varies over time. Further analysis of long-term data from multiple projects indicates that the reliability characteristics of PEMFC systems follow a three-parameter Weibull distribution—a finding that holds significant implications for developing maintenance strategies and predicting service life.
The reliability function of the Weibull distribution is given by [13]:
R ( t ) = exp ( t γ η ) β
Using the maximum likelihood estimation method, the distribution parameters for a marine environment are determined as follows:
β = 2.3 ± 0.2 (shape parameter, indicating that wear-related failures dominate),
η = 5900 ± 500 h (characteristic life, which is 30% lower than in terrestrial environments),
γ = 300 ± 50 h (location parameter, indicating a shortened initial stable period).

3.1.2. Analytic Hierarchy Process

Analytic Hierarchy Process (AHP), as an efficient multi-level decision-making tool, has demonstrated unique advantages in reliability analyses across various fields. In the study of the reliability of fuel cell hybrid ship power systems, the application of AHP enables the precise evaluation of the impact of various risk factors on the overall system, thereby providing decision-makers with a scientific basis for optimizing system design and risk management strategies.
The fundamental principle of this method lies in constructing a judgment matrix and hierarchically decomposing complex issues, simplifying the comprehensive evaluation of influencing factors. Specifically, decision-makers first perform pairwise comparisons of the factors based on their importance to form a normalized judgment matrix; subsequently, the eigenvector method is employed to calculate the weights of each factor, and finally, these hierarchical weights are aggregated to produce an overall evaluation result. This process not only enhances the transparency of decision outcomes but also effectively mitigates the influence of subjective biases.
In practical applications, AHP is often combined with FMECA to establish a systematic risk assessment framework. For example, in assessing the reliability of hydrogen fuel cell systems, the results of AHP can be used to initially identify potential failure modes, such as battery degradation after long-term operation and thermal management failures; thereafter, FMECA is applied to conduct a detailed analysis of the frequency of occurrence, severity, and detectability of these failure modes. This integrated approach enables a more systematic capture of the critical risk points within hydrogen energy systems, thereby providing targeted guidance for subsequent improvement measures. The format of the hierarchical judgment matrix with F H as the evaluation criterion is as follows:
F H A 1 A 2 A j A n A 1 a 11 a 12 a 1 j a 1 n A 2 a 21 a 22 a 2 j a 2 n A i a i 1 a i 2 a ij a in A n a n 1 a n 2 a nj a nn
In the judgment matrix A, the element a i j is used to represent the relative importance of element A i compared to element A j , evaluated from the perspective of criterion F H ; that is, a i j = W i / W j . The judgment scale refers to the quantitative measure employed to express the relative importance among elements, as illustrated in Table 5, which is based on the nine-point judgment scale proposed by T.L. Satty.

3.1.3. Fuzzy Comprehensive Evaluation

The fuzzy comprehensive evaluation method effectively addresses uncertainty and fuzziness, making it particularly suitable for reliability analysis of hydrogen-powered ship propulsion systems. In complex system environments involving multi-variable interactions, traditional deterministic evaluation methods often fail to accurately capture system risks. By leveraging the theory of fuzzy mathematics, the fuzzy comprehensive evaluation method effectively overcomes the problem of incomplete information while enhancing the flexibility and adaptability of the assessment [44].
When applying this methodology, it is first necessary to establish a comprehensive evaluation framework that fully reflects the risk characteristics of hydrogen energy systems. This framework incorporates practical considerations through fuzzy processing, transforming quantitative metrics into a qualitative secondary evaluation system. Subsequently, by constructing a fuzzy relationship matrix and assigning weights to each indicator through expert assessment and the Delphi method, a holistic evaluation combining quantitative and qualitative approaches is achieved.
In the process of fuzzy comprehensive evaluation, the credibility of the results is closely related to the setup of fuzzy rules, the distribution of weights, and the opinions of experts. To optimize the evaluation outcome in dynamic marine environments, simulation experiments can be conducted on typical hydrogen-powered ships (such as LNG-hydrogen hybrid power PCTC). Based on various operating conditions (e.g., navigational states, meteorological conditions), the fuzzy rules and weight assignments are progressively adjusted, thereby continuously improving the evaluation results and enhancing the accuracy of safety assessments for hydrogen systems.
The basic concept of fuzzy comprehensive evaluation is to use the principles of fuzzy linear transformation and the maximum membership degree (or weighted average) to consider all factors related to the object of evaluation, thereby performing a reasonable comprehensive assessment. The specific steps are as follows:
Assume there are m factors related to the object being evaluated, denoted by U   =   { u 1 , u 2 , , u m } , which is referred to as the factor set. Suppose there are n evaluation comments, denoted by V   =   { v 1 , v 2 , , v n } , which is called the comment set.
(1)
Single-factor evaluation
For each individual factor u i in the factor set U ( i = 1 , 2 , , m ) , a single-factor evaluation is conducted by determining the membership degree rij of the object with respect to the comment v j ( j = 1 , 2 , , n ) . This produces the single-factor evaluation set for factor u i : r i = ( r i 1 , r i 2 , , r in ) , which is a fuzzy subset on the comment set V. In other words, a fuzzy mapping is defined as:
f : U F V , u i f u i
where f = u i = r j = ( r i 1 , r i 2 , , r i m ) is the fuzzy comment vector corresponding to factor u i , and r i j represents the degree to which factor ui is associated with comment vj.
(2)
Construction of the comprehensive evaluation matrix
The m single-factor evaluation sets are arranged as rows to form an overall evaluation matrix:
R = f m
R is referred to as the comprehensive evaluation matrix.
(3)
Determination of fuzzy sets for factor weights
In the comprehensive evaluation, the contribution of each influencing factor to the overall outcome is not equal—some factors may be significantly more important than others. Therefore, it is essential to establish the relative importance of each factor. A fuzzy subset A = (a1, a2, …, an) can be defined on the factor set U, where ai represents the impact degree of factor u i on the overall evaluation. This parameter also reflects the decision-making capability of the single-factor evaluation level. Subset A is thus referred to as the fuzzy subset of factor importance, with ai being the importance coefficient or weight of factor u i .
Determining the weight of each factor is a crucial step toward achieving a comprehensive evaluation. It helps analysts consider all influencing factors in a thorough and objective manner, thereby enhancing the accuracy and credibility of the evaluation results. Once the weights of the factors are established, it becomes possible to more accurately identify the strengths and weaknesses of the subject, thereby providing a scientific and rational basis for decision-making. It should be noted, however, that the determination of weights must be based on real-world conditions and data analysis, rather than solely on subjective assumptions or intuitive judgments, as the latter could lead to inaccurate or unreliable evaluation results.
(4)
Determination of the Comprehensive Evaluation Model
When the fuzzy set A, representing the importance of each factor, and the comprehensive evaluation matrix (fuzzy relation) R are given, a fuzzy linear transformation is applied Via R to transform A into a fuzzy subset on the set of evaluation comments V, expressed as:
B = A R = b 1 , b 2 , , b n
here, the symbol “*” denotes the generalized fuzzy composition operation, that is:
b j = a 1 r 1 j a 2 r 2 j a 3 r 3 j j = 1 , 2 , , n
In this context, “ * ^ * ^ represents the generalized fuzzy “AND” operation, and “ * ˇ ” represents the generalized fuzzy “OR” operation. B is referred to as the fuzzy comprehensive evaluation set on the comment set V, where b j ( j = 1 , 2 , , n ) indicates the membership degree of the evaluation comment v j in the fuzzy evaluation set B obtained from the comprehensive evaluation. Equation (7) is known as the comprehensive evaluation model and is denoted as the model M ( * ^ , * ˇ ) .
(5)
Comprehensive Evaluation
The core significance of comprehensive evaluation lies in the fact that when considering a single factor ui, the corresponding membership degree to the evaluation comment vj is denoted by u = r i j ( j = 1 , 2 , , n ) . However, the result r i j * obtained by the generalized fuzzy “AND” operation ( a 1 * ^ r i j ) represents the membership degree of ui to v j when multiple factors are taken into account—in other words, it adjusts r i j * under the premise of assigning a weight a 1 to u i . Finally, by integrating the adjusted membership degrees r i j * Via the generalized fuzzy “OR” operation, a more reasonable comprehensive evaluation result can be obtained.
Considering that a single-level evaluation might be insufficient, a comprehensive evaluation model applicable to two-level or multi-level evaluations is constructed to achieve more precise and rational evaluation outcomes. The specific steps for two-level (or multi-level) fuzzy comprehensive evaluation are as follows:
Let the factor set be U = { u 1 , u 2 , , u m } and the evaluation set be V = { v 1 , v 2 , , v m } .
(1) From different perspectives, select several representative models to perform primary fuzzy comprehensive evaluations separately. Denote the resulting fuzzy comprehensive evaluation sets as follows:
A 1 = B 1 = b 11 , b 12 , , b 1 n A 2 = B 2 = b 21 , b 22 , , b 2 n A s = B s = b s 1 , b s 2 , , b sn
Since using any one of B 1 , B 2 , , B s alone as the evaluation index may be one-sided, they are combined to form the secondary evaluation index set, denoted as U 0 = { B 1 , B 2 , , B s } . Assume that the weight allocation for each index B i ( i = 1 , 2 , , s ) in U 0 is given by A 0 = ( a 1 , a 2 , , a s ) , where a 1 0 and a 1 + a 2 + + a s = 1 . The secondary comprehensive evaluation matrix is then constructed using B 1 , B 2 , , B s as its rows.
(2) Conduct a secondary-level fuzzy comprehensive evaluation of the indicators. A weighted average model is used to perform the secondary evaluation on A 0 and R 0 , that is, B = A 0     R 0 = ( b 1 , b 2 , , b n ) , where b j = i = 1 s a i     b i j for j = 1 , 2 , , n . According to the maximum membership principle, the optimal evaluation result is determined by the grade (comment) vj corresponding to the largest bj value. When defuzzification of this fuzzy vector is required, the usual methods are the Maximum Membership Method and the Centroid Method. The Centroid Method (i.e., the weighted average method) can eliminate the aforementioned drawbacks; its calculation formula is as follows:
u = i = 1 n μ u i u i i = 1 n μ u i
In the Centroid Method, one may use the calculated evaluation vector μ ( u i ) as the weighting coefficient, or alternatively, use [ μ ( u i ) ] 2 as the weighting coefficient to enhance the influence of elements with higher membership values.

3.2. Determination of Evaluation Parameters

In carrying out the failure modes, effects, and criticality analysis (FMECA) for hydrogen-driven marine propulsion systems, the selection and determination of parameters constitute the cornerstone for ensuring the scientific rigor and validity of the analysis. This process involves a comprehensive evaluation of the frequency of failure occurrences, severity, and detectability, which are indispensable for both constructing the theoretical framework and applying it in practice.
Specifically, the frequency of failure occurrence refers to the number of times a particular failure mode may occur within a given period, typically analyzed quantitatively using historical data and statistical methods. In hydrogen propulsion systems, for failure modes such as hydrogen leakage and fuel cell malfunctions, it is essential to refer to existing accident statistics and to apply Bayesian inference methods alongside historical case databases for cross-validation, thereby enhancing the precision of the frequency assessment. For instance, under specific operational conditions, the frequency of hydrogen leakage can be differentiated and quantified by comparing it to similar failure scenarios outlined in the “Safety Requirements and Risk Assessment Methods for Fuel Cell Vessels,” thereby establishing robust data support.
Integrating the overall analysis results, a hazard analysis is conducted for the various failure modes associated with the subsystems of the marine propulsion system, in accordance with the evaluation criteria outlined in Table 2, Table 3 and Table 4 of Section 3.1.1.

3.3. Fuzzy Evaluation Framework Construction

3.3.1. Evaluation Factor Set (U) Construction

To address the potential risks associated with hydrogen-powered vessel propulsion systems, a two-tier factor set comprising the hydrogen propulsion system (U1) and hydrogen fuel generator system (U2) has been established based on the principle of ‘multiphysics coupling + marine environment adaptation’. The specific definitions are as follows:
(1)
Hydrogen-powered System Factor Set (U1):
U 1 = { Technological   factors   U 11 ,   Environmental   factors   U 12 ,   Management   factors   U 13 }
where each element U 1 j (j = 1, 2, 3) is composed of more fundamental elements.
The factor set for each U 1 j (first-level indicators) is:
U 1 j   = {Clean fuel cell design and efficiency ( U 1 11 ), Technological characteristics of hydrogen ( U 2 11 ), Design and efficiency of the hydrogen storage system( U 3 11 ), PEMFC operational efficiency ( U 4 11 ), Hydrogen leakage ( U 51 11 ), Pollutant emissions ( U 6 11 ), Ship compliance ( U 7 11 ), Project schedule management ( U 1 13 )}.
(2)
Hydrogen fuel generator system factor set (U2):
U 2   = {Fault Mode Occurrence Frequency ( U 21 ), Fault Mode Severity ( U 12 ), Fault Mode Detection Difficulty ( U 13 )}
Each element U 2 j (j = 1, 2, 3) is composed of more fundamental elements. The factor set for each U 2 j (primary indicators) is:
U i j = {Stator Winding Short Circuit ( U 1 2 ), Three-Phase Current Imbalance ( U 2 2 ), Excessive Generator Current ( U 3 2 ), Excitation Failure ( U 4 2 ), Generator Demagnetization ( U 5 2 ), Hydrogen Leakage ( U 6 2 ), Reverse Excitation ( U 7 2 ), Unstable Excitation ( U 8 2 ), Abnormal De-excitation ( U 9 2 ), Coil Damage ( U 10 2 ), Insulated Coil Aging ( U 11 2 ), Stator Core Insulation Damage ( U 12 2 ), Poor Bearing Installation ( U 13 2 ), Bearing Damage ( U 14 2 ), Component Operating Noise ( U 15 2 ), Eccentric Air Gap Fault ( U 16 2 ), Generator Overheating ( U 17 2 )}.
The construction of factor sets must satisfy the following requirements: (1) Covering risks associated with multi-physics coupling across electrochemical, thermal, and fluid domains; (2) Incorporating environmental characteristics such as high humidity, vibration, and salt spray corrosion within the vessel; (3) Distinguishing between system-level risk factors (e.g., the hydrogen propulsion system as a whole) and equipment-level risk factors (e.g., the generator stator).

3.3.2. Evaluation Comments Collection (V) Confirmed

Hydrogen Power System Factor U11 and Hydrogen Fuel Generator System Factor U12 Comments Collection:
V 1 = {Extremely Rare ( V 11 ), Rare ( V 12 ), Occasional ( V 13 ), Sometimes ( V 14 ), Frequent ( V 15 )}
For factor U 12 , the set of remarks is:
V 2 = {Negligible Impact ( V 21 ), Slight Impact ( V 22 ), Moderate Impact ( V 23 ), Severe Impact ( V 24 ), Catastrophic Impact ( V 25 )}
For factor U13, the set of remarks is:
V 3 = {Direct Detection ( V 31 ), Routine Inspection ( V 32 ), Somewhat Difficult ( V 33 ), Additional Testing ( V 34 ), Nearly Undetectable ( V 35 )}

3.3.3. Construction of Fuzzy Evaluation Matrix (R)

In the safety assessment process of hydrogen-powered ship propulsion systems, constructing a fuzzy evaluation matrix R is an extremely critical task. This matrix provides a systematic framework for risk identification and analysis, integrating expert opinions and multi-dimensional uncertain information, thereby providing strong support for decision-making and risk assessment. The primary step in constructing a fuzzy evaluation matrix for hydrogen power systems is to collect FMECA data related to hydrogen systems. This study uses the ECSIM dataset for analysis [25], which covers failure frequencies and severities of major risk events such as hydrogen leakage and combustion explosions. In the actual construction process, the fuzzy Analytic Hierarchy Process (AHP) is used to decompose the complex evaluation problem into several controllable hierarchical structures. Expert surveys are employed to determine the fuzzy set values of each evaluation criterion. When these criteria are combined with the characteristics of hydrogen-powered ship systems, the application of fuzzy logic significantly enhances the scientific and systematic nature of the evaluation process, with each criterion’s assessment value represented in the form of fuzzy numbers based on fuzzy set theory. In hydrogen fuel generator systems, risk factors such as hydrogen leakage, system overheating, and electrical faults need to be identified promptly. The identification of these risk factors relies not only on theoretical analysis but also on extensive use of experimental data and case studies from prior work. Collecting professional insights from experts in the relevant field allows for fuzzy evaluation of the above risk factors. Through expert interviews and surveys, subjective assessments from multiple experts regarding the severity, likelihood of occurrence, and detectability of each risk factor are systematically collected. The obtained data is typically presented in the form of fuzzy numbers, thus more accurately reflecting the inherent uncertainty in the evaluation process.

3.3.4. Determination of the Weights of Various Factors

In the process of evaluating the power system of hydrogen-fueled ships, clarifying the weight of each factor is crucial for scientific decision-making. The allocation of factor weights not only directly affects the effectiveness of the FMECA (Failure Mode, Effects, and Criticality Analysis) model, but also is closely related to the accurate judgment of the overall safety and reliability of the system. Therefore, the adoption of the Fuzzy Analytic Hierarchy Process (FAHP) provides an effective solution for determining the weights of various factors.
In the hydrogen power system, it is necessary to identify the main factors with key impacts. After completing the factor identification, experts in relevant fields are invited to evaluate the importance of each factor in terms of safety and performance based on their rich experience and professional knowledge. The experts’ subjective ratings are presented in the form of fuzzy numbers, so as to fully reflect the inherent uncertainty and fuzziness in the evaluation process. Subsequently, a comparison matrix is constructed, and the above-mentioned factors are compared pairwise using the Fuzzy Analytic Hierarchy Process to calculate the relative weight of each factor. In addition, combined with the theories of electrochemistry, thermodynamics and fluid mechanics, a solid theoretical support is provided for the rationality of the weight allocation of each factor.
Weight vector W: W = {0.35, 0.40, 0.15, 0.10}. The severity (S) has the highest weight (40%), which reflects its key impact on system safety.
In the multi-dimensional evaluation process of the hydrogen fuel generator system, the determination of weights not only affects the reasonable presentation of the relative importance among key factors, but also directly relates to the effectiveness of the overall evaluation results and the scientificity of decision-making. By adopting the Fuzzy Analytic Hierarchy Process combined with expert evaluation, the subjective and objective data are comprehensively analyzed to improve the accuracy of the weight allocation of various evaluation factors. In the process of weight setting, it is necessary to identify and lock the key influencing factors, which usually include the efficiency of the fuel cell stack, system safety, the reliability of hydrogen supply, and environmental adaptability. With the help of the systematic Delphi method, multiple experts in the fields of aerospace, shipbuilding and hydrogen energy research are invited to participate in the evaluation, ensuring that the determined weights have a solid academic and industrial foundation. This process not only effectively eliminates personal subjective bias, but also ensures the scientificity of the weight allocation of core factors.
Weight vector W:
W = {0.30, 0.25, 0.25, 0.20}. Voltage fluctuation (30%) and current overload (25%) are the key control points.
The qualifications and selection criteria for experts are as follows:
Composition of the expert group and qualification requirements: An interdisciplinary expert group should be established, whose members include university professors in the field of naval architecture and ocean engineering, fuel cell researchers, senior engineers from shipyards/engine manufacturers and ship owners, as well as evaluation experts from classification societies or standardization organizations. All experts must have ≥8 years of relevant professional experience and ≥3 years of experience in projects related to energy or ship propulsion systems. This standard aims to avoid judgment deviations on “the impact of marine environmental factors (such as salt spray, vibration) on failure probability” caused by insufficient experience, and ensure that experts can accurately quantify the risk factors unique to the marine environment.
Selection and scoring process: The Delphi iterative method (two rounds) is used to collect experts’ opinions. Experts independently fill in the Failure Mode Risk Scoring Form without prior discussion to avoid the impact of “groupthink”. After the first round of scoring, anonymous summary feedback is provided to the experts, and then the second round of scoring is conducted to reach a consensus. The final weights are calculated using the Fuzzy Analytic Hierarchy Process (FAHP), and the consistency ratio is reported.

3.4. Risk Priority Number Calculation

By employing specialized technical terminology to rate the occurrence probability (O), severity (S), and detection difficulty (D) of failure modes, these failure modes are transformed into quantified indicators falling within a numerical range of 1 to 10. In conjunction with Formula 1 outlined in Section 3.1.1, these numerical values can be utilized to calculate the critical RPN of the failure modes. However, it is often challenging for technical personnel to provide direct and accurate numerical assessments of the aforementioned factors; in practice, they rely more heavily on qualitative evaluations, predicted failure rates, and other factors that inherently involve subjective estimation. This clearly indicates that the precision of this method is considerably limited, and hence there is an urgent need for optimization of the calculation methodology.
Standardized Definition of RPN:
“To avoid confusion with the numerical range of traditional RPN and adapt to the interval characteristic of fuzzy membership degree (0–1), this study defines the ‘standardized RPN’, with the calculation formula as follows:
Standardized RPN = (Fuzzy Membership Degree of O × 100) × (Fuzzy Membership Degree of S × 100) × (Fuzzy Membership Degree of D × 100)/100
where
Multiplying by 100 is to convert the fuzzy membership degree in the 0–1 interval into a numerical value in the 0–100 interval, ensuring that it is close to the order of magnitude of traditional RPN;
Dividing by 100 is to eliminate the dimensional impact caused by multiple multiplications by 100, and the final result is rounded to an integer to facilitate risk level ranking.”
In order to carry out the reliability analysis of the fuel cell hybrid marine power system, the application of the RPN calculation model is crucial for optimizing the risk assessment process. In the analysis of failure modes, their impacts, and criticalities—especially when addressing various failure modes in hydrogen-powered marine systems—optimizing the RPN calculation becomes particularly necessary.
Optimization of the RPN calculation requires a quantitative analysis for each failure mode, while simultaneously strengthening the accuracy and reliability of data sources. For instance, failure frequency data obtained from the “Fuel Cell Ship Safety Requirements and Risk Assessment Methods” must be cross-verified with actual operational records to ensure the scientific integrity of the risk assessment. In addition, constructing a coupled electro-thermal-gas dynamic model and integrating multi-physical field factors will provide a multidimensional perspective for the RPN calculation.
Advanced technological approaches can be employed to optimize the parameter settings within the RPN calculation process. Specifically, for hydrogen leakage scenarios, a reliable leakage diffusion model must be used to quantitatively assess the leakage risk, while also incorporating climatic conditions and environmental factors to predict potential consequences, thereby assigning a more scientifically grounded weight to the severity parameter within the RPN framework. This method not only improves the accuracy of the risk assessment but also enhances decision-making effectiveness.
A simplified calculation method for obtaining this ranking is as follows: the pairwise comparison matrix is continuously raised to successive powers, then the row sums are computed and normalized until the difference between the row sums in two consecutive iterations is smaller than a predetermined threshold, at which point the iterative process is terminated.
As shown in Table 6, the calculated priorities (i.e., importance levels) for the different parameters are as follows: occurrence frequency 0.463, severity 0.368, and detection difficulty 0.170. At the same time, the inconsistency ratio I R calculated using Formula is 0.018, which is well below the acceptable standard value of 0.1. According to Chang et al. (2024) [45] in ‘Combining Fuzzy Analytic Hierarchy Process with Weighted Aggregation and Product Evaluation Methods,’ FAHP can maintain a consistency ratio (CR) below 0.02 in the allocation of risk weights in ship systems, which conforms to the academic standards of the method and further validates the rationality of the weight allocation.
Based on the analyzed parameter priorities and considering various failure modes under different subsystems, specific hierarchical analysis can be conducted at the lowest level (i.e., the failure mode level). Specifically, by performing a composite calculation of parameter priorities with the normalized weights of failure modes, a weighted risk index (WRI) for each specific failure mode can be obtained. The calculation formula is as follows:
W R I i = 0.463 O i i = 1 n O i + 0.368 S i i = 1 n S i + 0.169 D i i = 1 n D i
(Note: In the formula, i represents the i-th fault mode of the target system, and n represents the total number of fault modes contained in the target system.)
The rationality of the weighted risk index lies in overcoming the limitations of the RPN’s ‘equal weighting and ordinal scale multiplication’ and accurately adapting to the characteristics of hydrogen-powered ship propulsion systems, which involve ‘multi-field coupling and uneven parameter influence.’ Its weights are determined through FAHP combined with expert experience (O = 0.463, S = 0.368, D = 0.170). The data are standardized, and the risk rankings are highly consistent with actual ship failure data and the verification of improvement measures, as shown in Table 7.

3.5. Hazard and Hazard Matrix Analysis

In the study of hydrogen-powered ship propulsion systems, researchers have developed a systematic approach based on Failure Modes, Effects, and Criticality Analysis (FMECA) to identify potential failure modes of key system components and evaluate their consequences and hazard levels. A comprehensive analysis first focuses on the performance impact factors of three key components: proton exchange membrane fuel cells (PEMFCs), hydrogen storage subsystems, and electric propulsion systems. As the core component, PEMFCs require the construction of a failure mode database, classifying and summarizing failures such as membrane electrode degradation to clarify their impact on system reliability and safety. The hydrogen storage subsystem focuses on issues such as leaks in high-pressure hydrogen tanks and solid-state hydrogen storage technologies, as well as material strength degradation, providing a basis for safety risk assessment.
In the analysis, combining fuzzy comprehensive evaluation with FMECA helps identify key parameters, score them based on actual data, and optimize the RPN to focus on high-risk failures. At the same time, hazard matrices are used to map failure modes to risk levels, visually presenting the severity and probability of failures, improving decision-making efficiency and risk response speed.
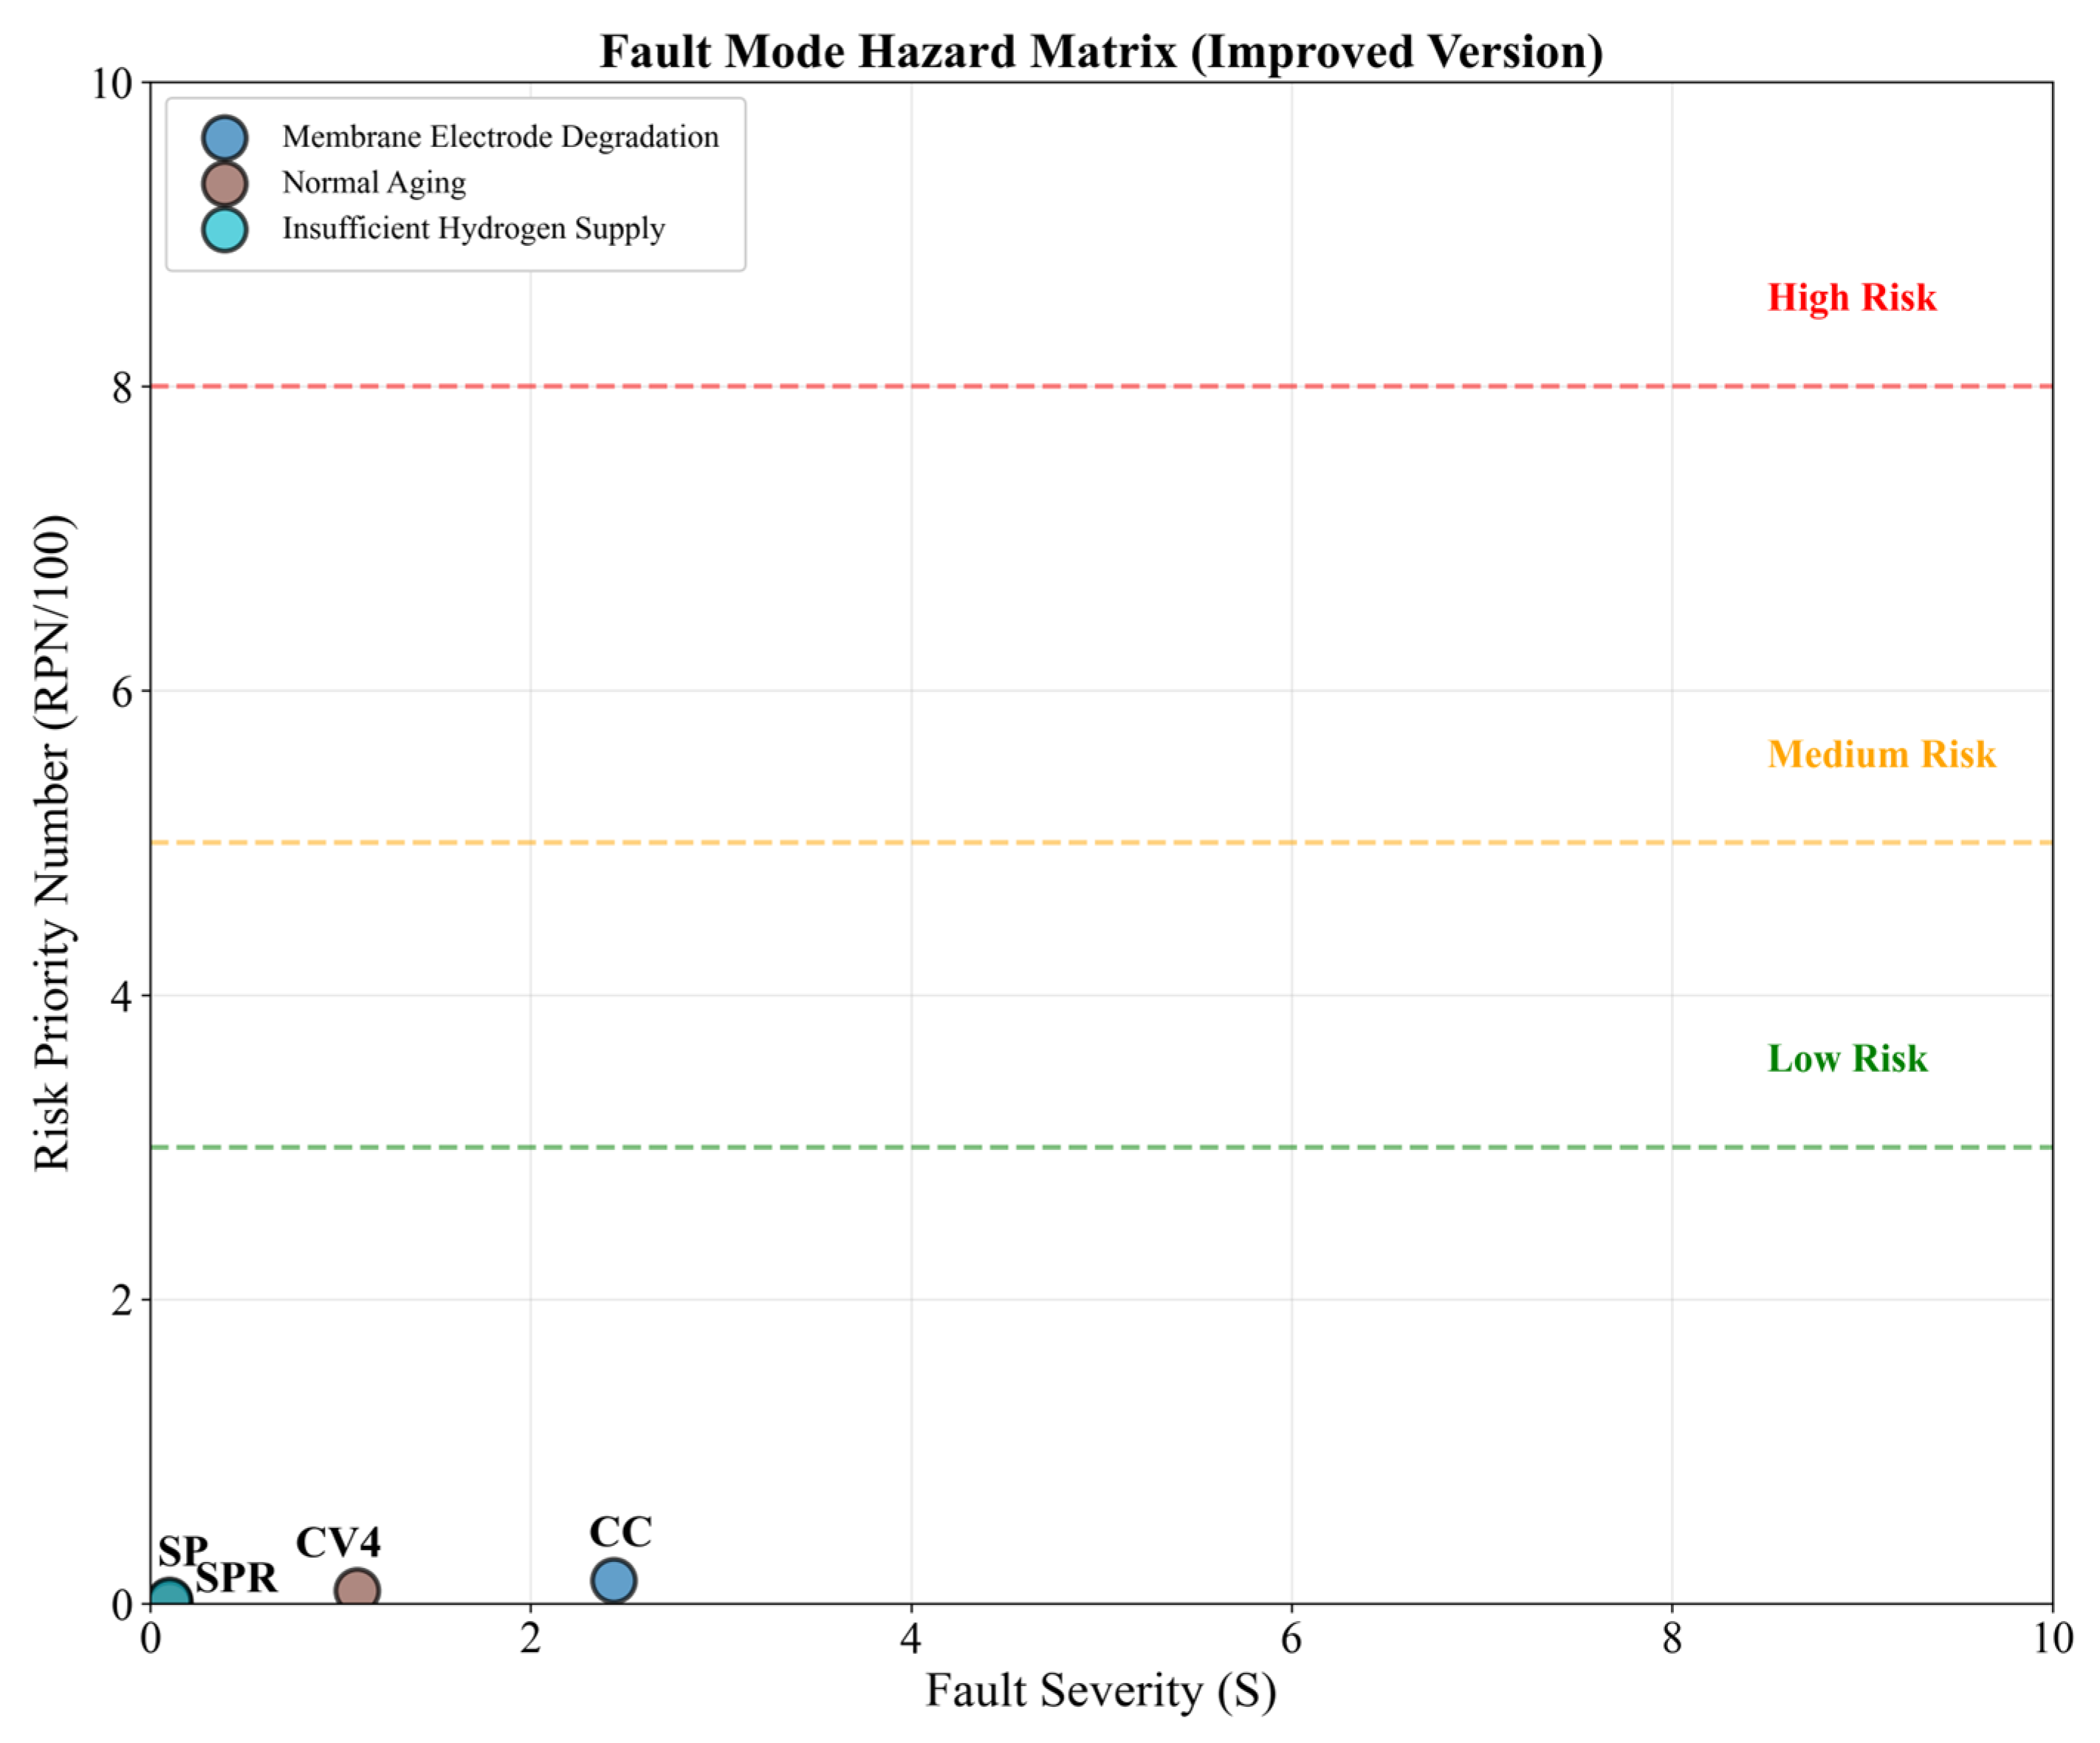
In the process of studying the failure modes, effects, and criticality of hydrogen-powered ship propulsion systems using FMECA, hazard matrix analysis is a crucial step. This analysis is mainly used to identify potential failure modes, evaluate their severity and likelihood of occurrence, and ultimately determine which failure modes should be prioritized for handling. By constructing a hazard matrix, quantitative scores are assigned to the severity, occurrence frequency, and detectability of each potential failure mode, thereby calculating a weighted risk index. This method allows for identifying which failure modes may pose higher risks to the safety of cargo or personnel, enabling preventive measures to be taken. Combining relevant data, hazard matrices for each system are ultimately constructed. Specifically, the procedure sets the failure severity as the horizontal axis and the failure mode Risk Priority Number as the vertical axis, and for each failure mode data point, a perpendicular line is drawn to the diagonal line to obtain point P, as detailed in Figure 5.

4. Reliability Analysis Results of Hydrogen-Powered Ship Propulsion Systems

Based on the fuzzy FMECA evaluation framework established in Chapter 3 (including the factor set U, comment set V, fuzzy matrix R, and weight calculation model), this chapter focuses on the reliability analysis results of hydrogen-powered ship propulsion systems, specifically presenting the numerical results of failure modes, risk ranking, and visualization analysis for the PEMFC system and hydrogen fuel generator system.

4.1. Fuzzy Evaluation Results of Hydrogen Power System

4.1.1. Fuzzy Evaluation

The fuzzy evaluation method for hydrogen energy-driven marine propulsion systems provides a systematic theoretical framework for the assessment and optimization of critical components. When analyzing common failure modes of hydrogen energy propulsion systems and their hazards, the primary fuzzy evaluation tool plays a vital role. Based on fuzzy comprehensive evaluation theory, this tool assigns appropriate weights to the various components of the hydrogen energy-driven propulsion system, thereby enabling a scientific assessment of failure risks.
Throughout the evaluation process, it is first necessary to establish a fuzzy hierarchical analysis structure that encompasses the key evaluation factors to clearly define the relative importance of the influencing elements. For hydrogen energy-driven propulsion systems, the intermediate evaluation layer typically includes multiple dimensions such as safety, reliability, economy, and environmental impact. For instance, in the case of hydrogen leakage, its effects on system safety and the environment are both significant. In this context, the use of Fuzzy Pairwise Comparison can effectively quantify the contributions of each factor in the overall evaluation, thus rendering the results more precise and scientific.
Detailed analysis results based on measured PEMFC data are provided in Table 8.
Then, Wang et al. (2025) [3], in “Electro-Thermal-Gas Synergistic Dynamics of a PEMFC-Lithium Battery Hybrid System,” pointed out that Na+ contamination caused by salt spray in marine environments accelerates membrane electrode degradation. This also explains the phenomenon observed in this study where the RPN of membrane electrode degradation rises to 20.7 under actual shipboard conditions, further supporting the scientific basis for the recommendation of “regular replacement.”
Data collection and organization constitute the core steps in primary fuzzy evaluation. Common tools, such as structured questionnaires and expert interviews, can effectively capture expert judgments to provide a reliable basis for the fuzzy evaluation. For example, multiple engineers with extensive experience in hydrogen safety can be consulted regarding their perceptions of different fault levels (e.g., minor, moderate, and severe faults) to construct a fuzzy evaluation matrix. This matrix, in subsequent fuzzy operations, adequately accounts for the uncertainties of each factor, thereby revealing potential levels of failure risk.
Example of fuzzy evaluation based on measured data (membrane electrode degradation):
B = W × R = 0.35 × 0.123 + 0.40 × 0.244 + 0.15 × 0.509 + 0.10 × 0.309 = 0.248
The corresponding risk level is “Low Risk” (Level 2). Through an in-depth analysis of the measured data, we have constructed a failure mode hazard matrix, as shown in Figure 6, which visually presents the distribution of various failure modes under different test conditions.
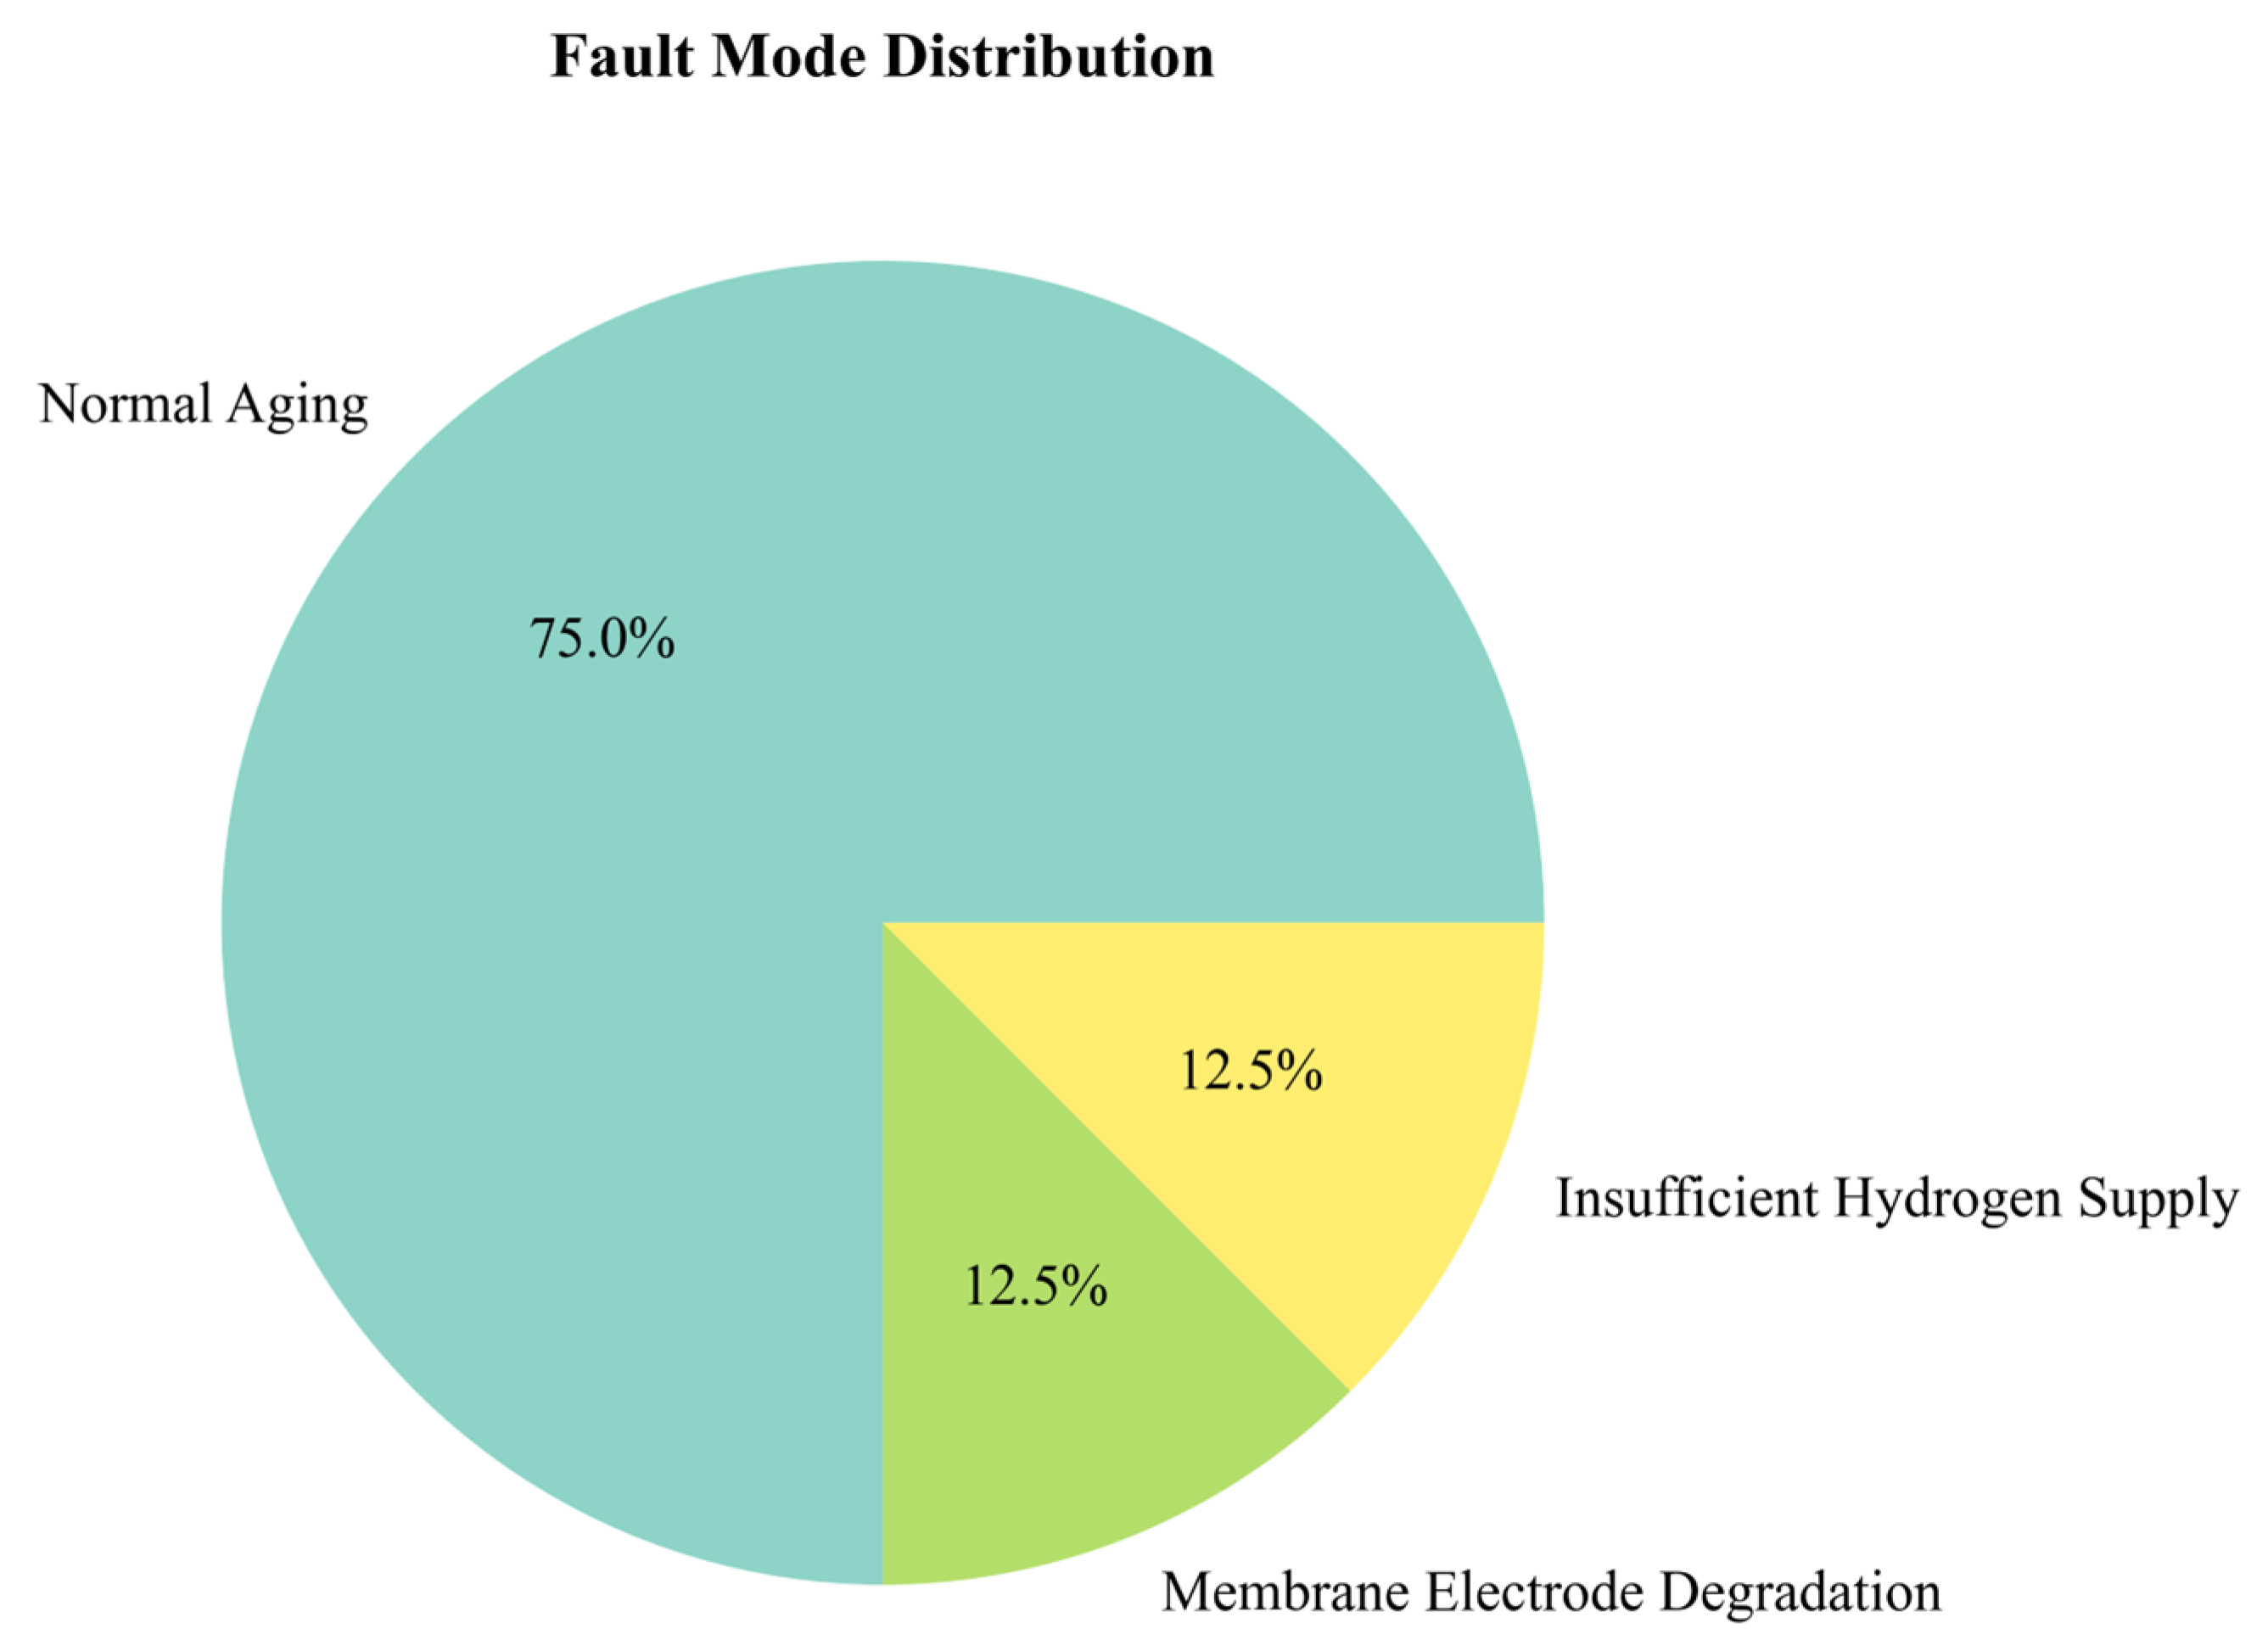
Based on the data presented in the figure, most testing conditions exhibit indices in the low-risk zone (RPN < 30), which is consistent with our fuzzy evaluation conclusions. It is noteworthy that although the membrane electrode degradation under the CC testing condition falls within the low-risk zone, its relatively high RPN value calls for special attention. For detailed distributions of failure modes, please refer to Figure 7. The data indicate that under 75% of the testing conditions, the PEMFC system demonstrates normal aging, which is the expected performance of the system. Membrane electrode degradation and insufficient hydrogen supply each account for 12.5%; despite their low occurrence rates, their potential impacts in actual marine environments should not be overlooked.

4.1.2. Fuzzy Comprehensive Evaluation

In the process of assessing and making decisions regarding the hydrogen-powered vessel propulsion system, the secondary fuzzy comprehensive evaluation method serves as an effective analytical tool that significantly enhances the accuracy of evaluations and the decision support capability. This method employs fuzzification of the evaluation indices to render the assessment of complex technical decision-making issues under multi-level and multi-factor influences more intuitive and scientifically grounded. The basic framework of the secondary fuzzy comprehensive evaluation mainly comprises two parts: the identification of fuzzy evaluation factors and the comprehensive evaluation itself. In hydrogen-powered propulsion systems, evaluation factors typically include failure modes (such as hydrogen leakage and fuel cell stack failures), safety indicators (e.g., hydrogen concentration and temperature), and economic factors (such as construction and operational costs). For instance, during experiments, the quantification of the potential impact of hydrogen leakage on the surrounding environment allows this risk factor to be integrated into the evaluation model.
The inherent fuzzy logic characteristics of fuzzy comprehensive evaluation endow it with the capability to handle uncertainty issues. This is particularly critical in multidisciplinary and complex hydrogen energy systems. Taking the cooling subsystem in the hydrogen-powered vessel propulsion system as an example, the secondary fuzzy comprehensive evaluation method can utilize multiple data sources for a comprehensive assessment, thereby overcoming the limitations of relying on a traditional singular model. This method not only allows experts to adjust based on subjective judgments but also converts the relative importance of different data points into actionable decision support information through fuzzy mathematical operations.
Comprehensive Assessment Based on Empirical Data:
D = 0.248 (“Membrane Electrode Degradation”) + 0.095 (“Insufficient Hydrogen Supply”) + 0.186 (“Normal Aging”) = 0.529.
The overall system risk is classified as “low risk.
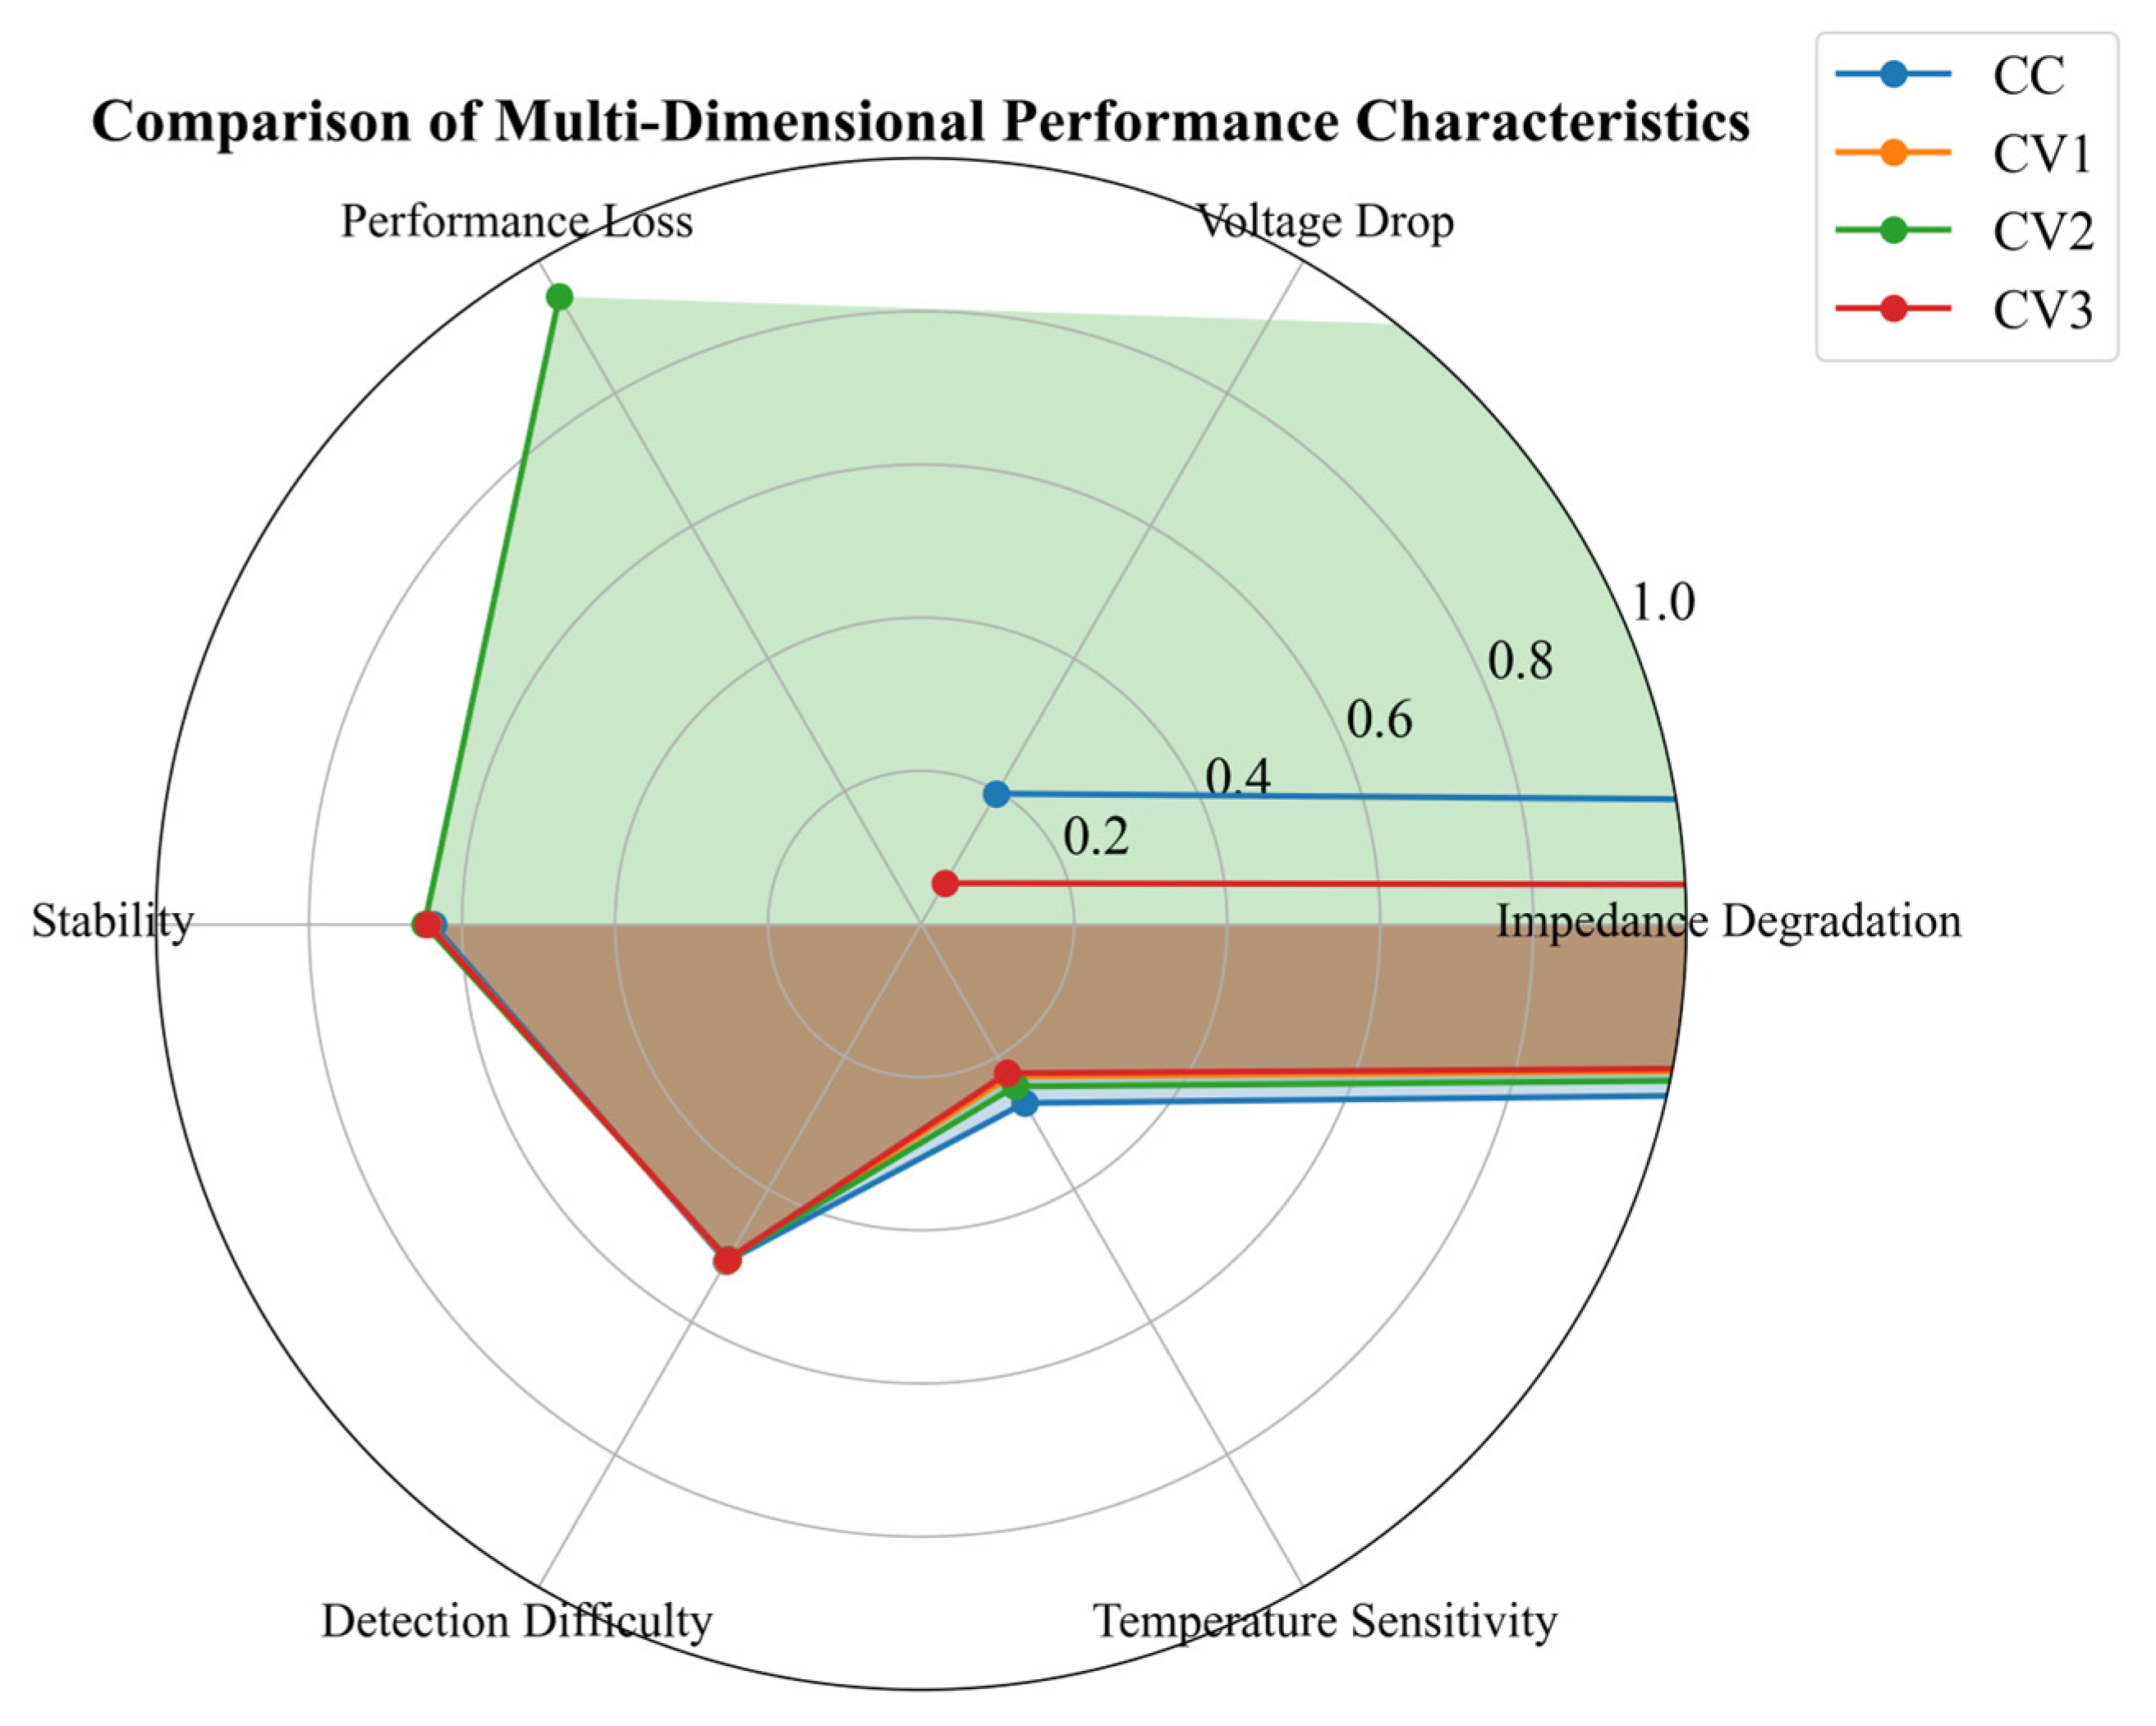
To more comprehensively assess the system performance, a radar chart is employed to depict the multidimensional performance features under various test conditions, as shown in Figure 8.
From the radar chart, it can be seen that CV2 exhibits the poorest performance in terms of performance degradation, which is associated with its fault mode of insufficient hydrogen supply. In contrast, CC demonstrates relatively stable performance regarding voltage drop and impedance degradation. Additionally, all test conditions show good temperature sensitivity, indicating that the thermal management system is operating normally.
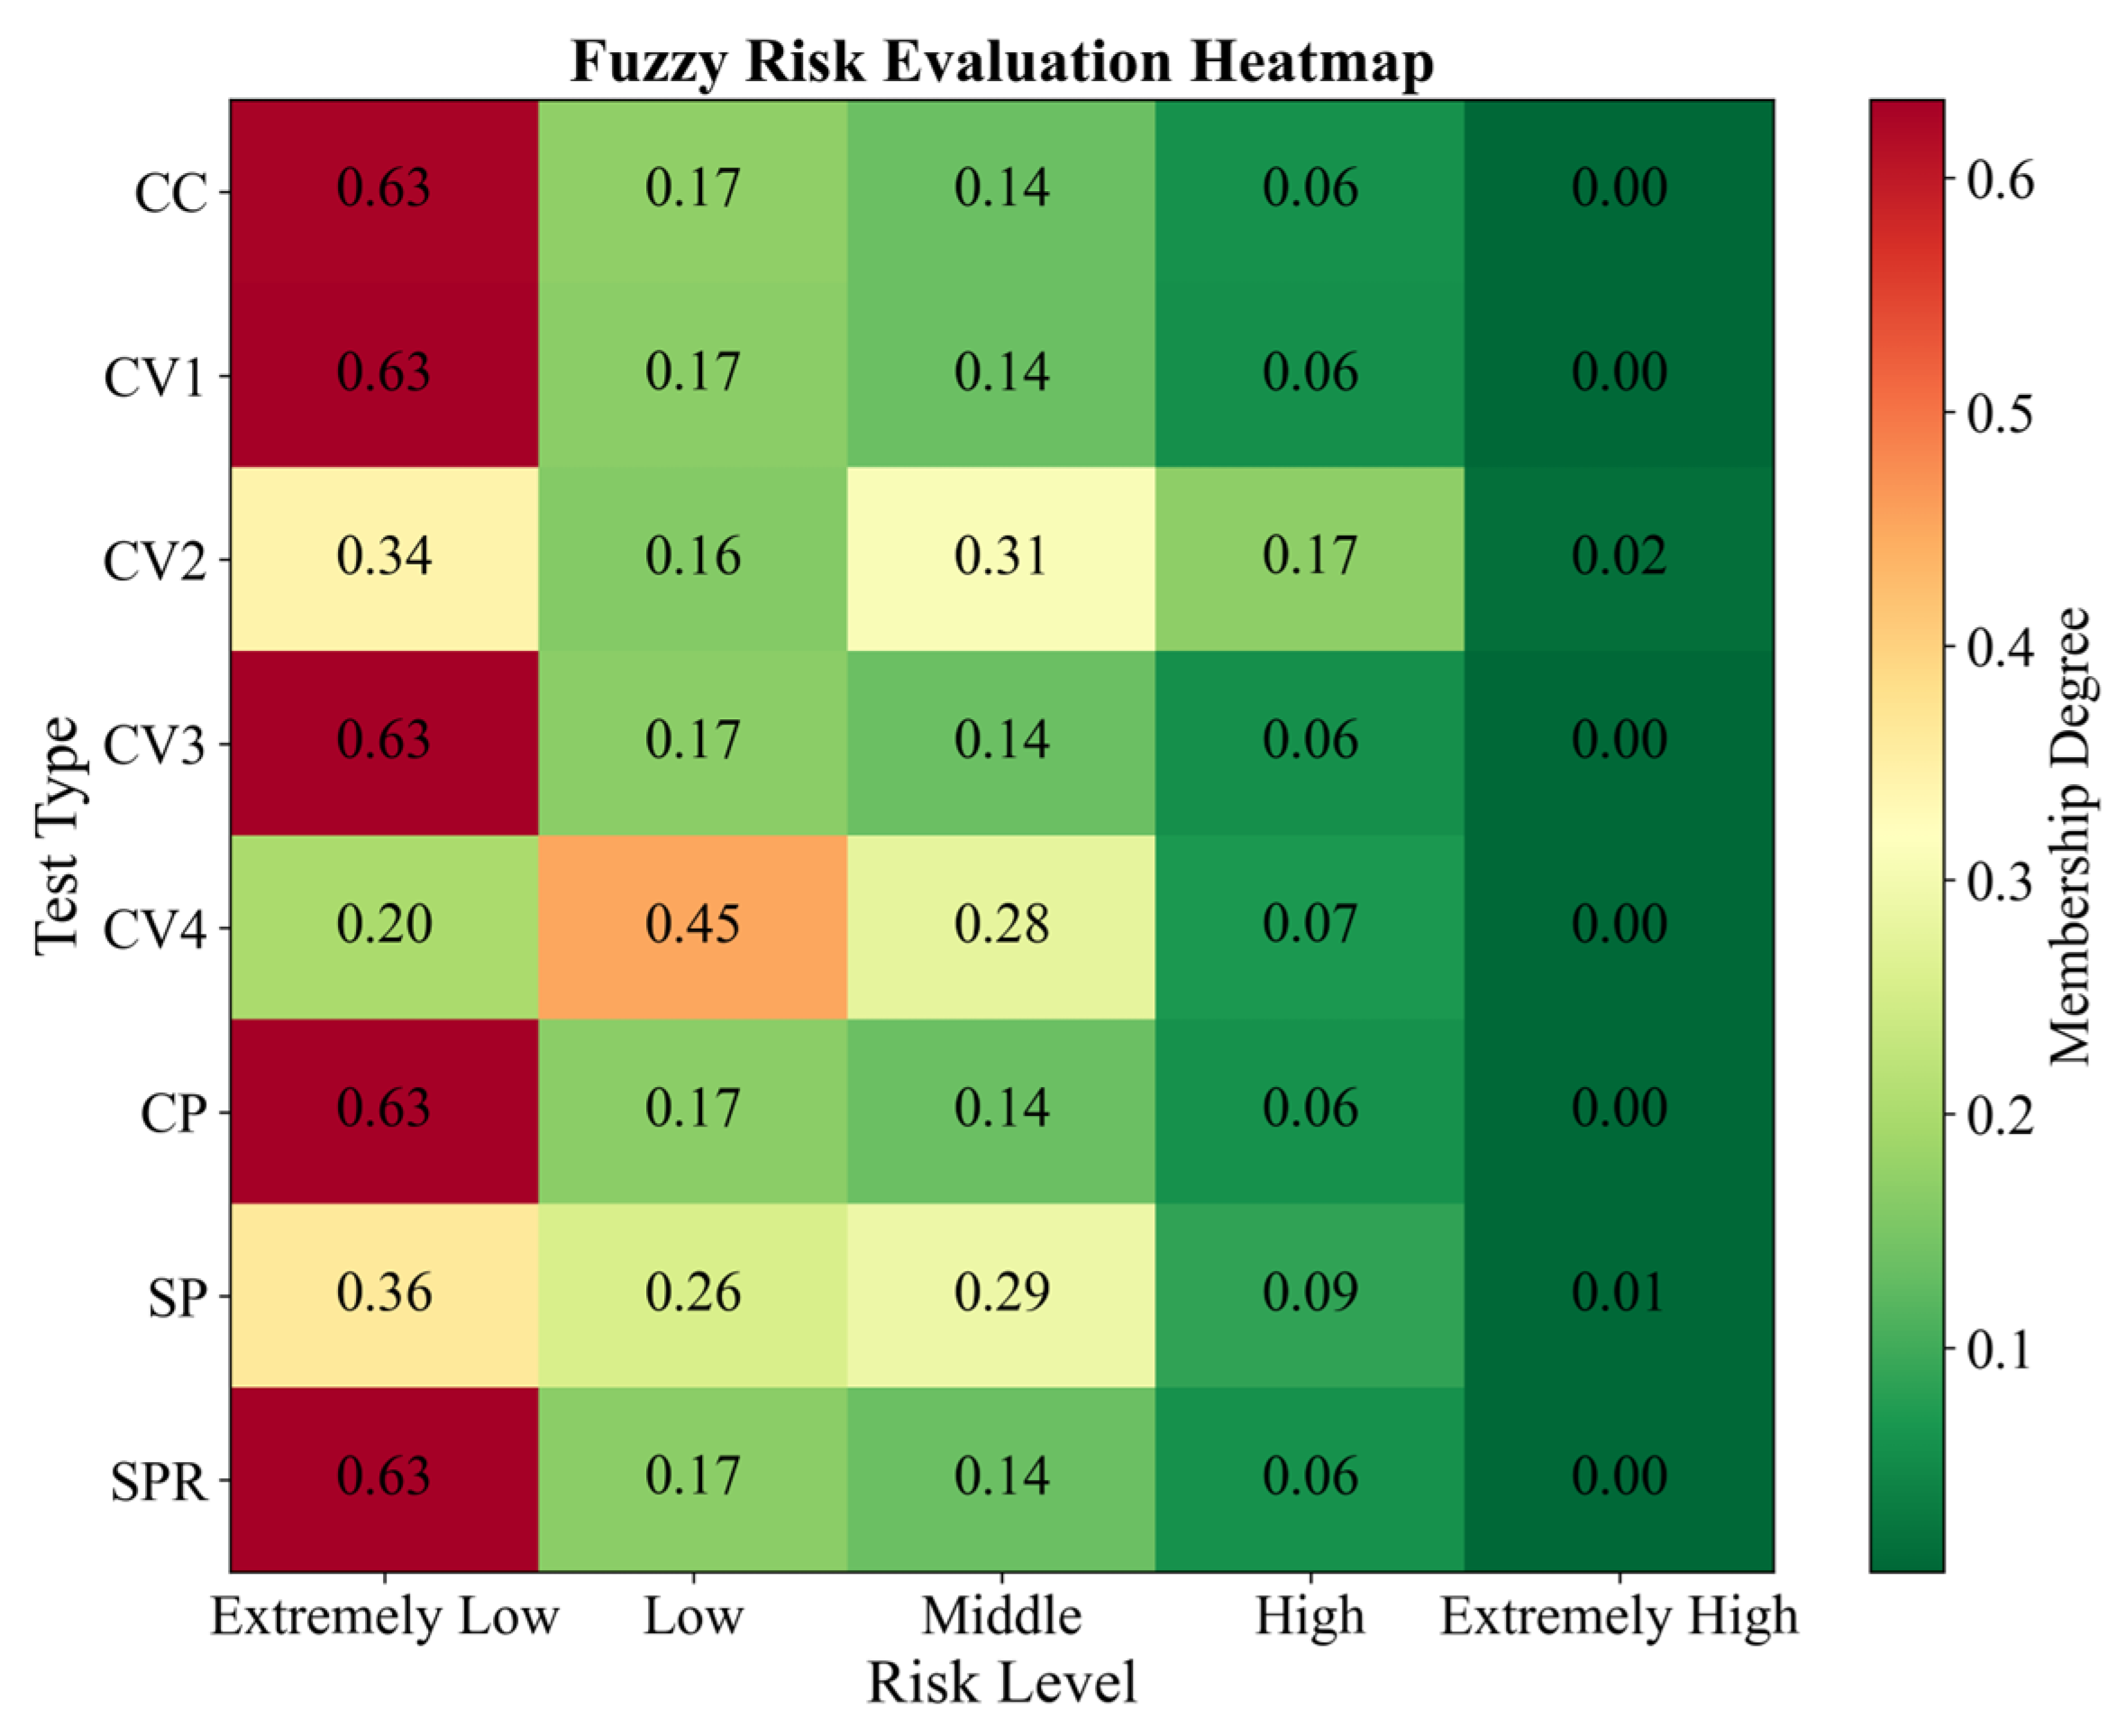
The distribution of risk levels based on fuzzy comprehensive evaluation is illustrated in Figure 9.
The heat map clearly displays the distribution of membership values for various testing types across different risk levels. CV1, CV3, CP, and SPR exhibit the highest membership at very low risk (0.68), indicating that the system operates most stably under these testing conditions. Conversely, CC and CV4 show moderate membership at low risk (0.37 and 0.44, respectively), which warrants appropriate attention.
The fuzzy comprehensive evaluation analysis of the actual operating data of the PEMFC system, as shown in Table 9, yielded the following results.
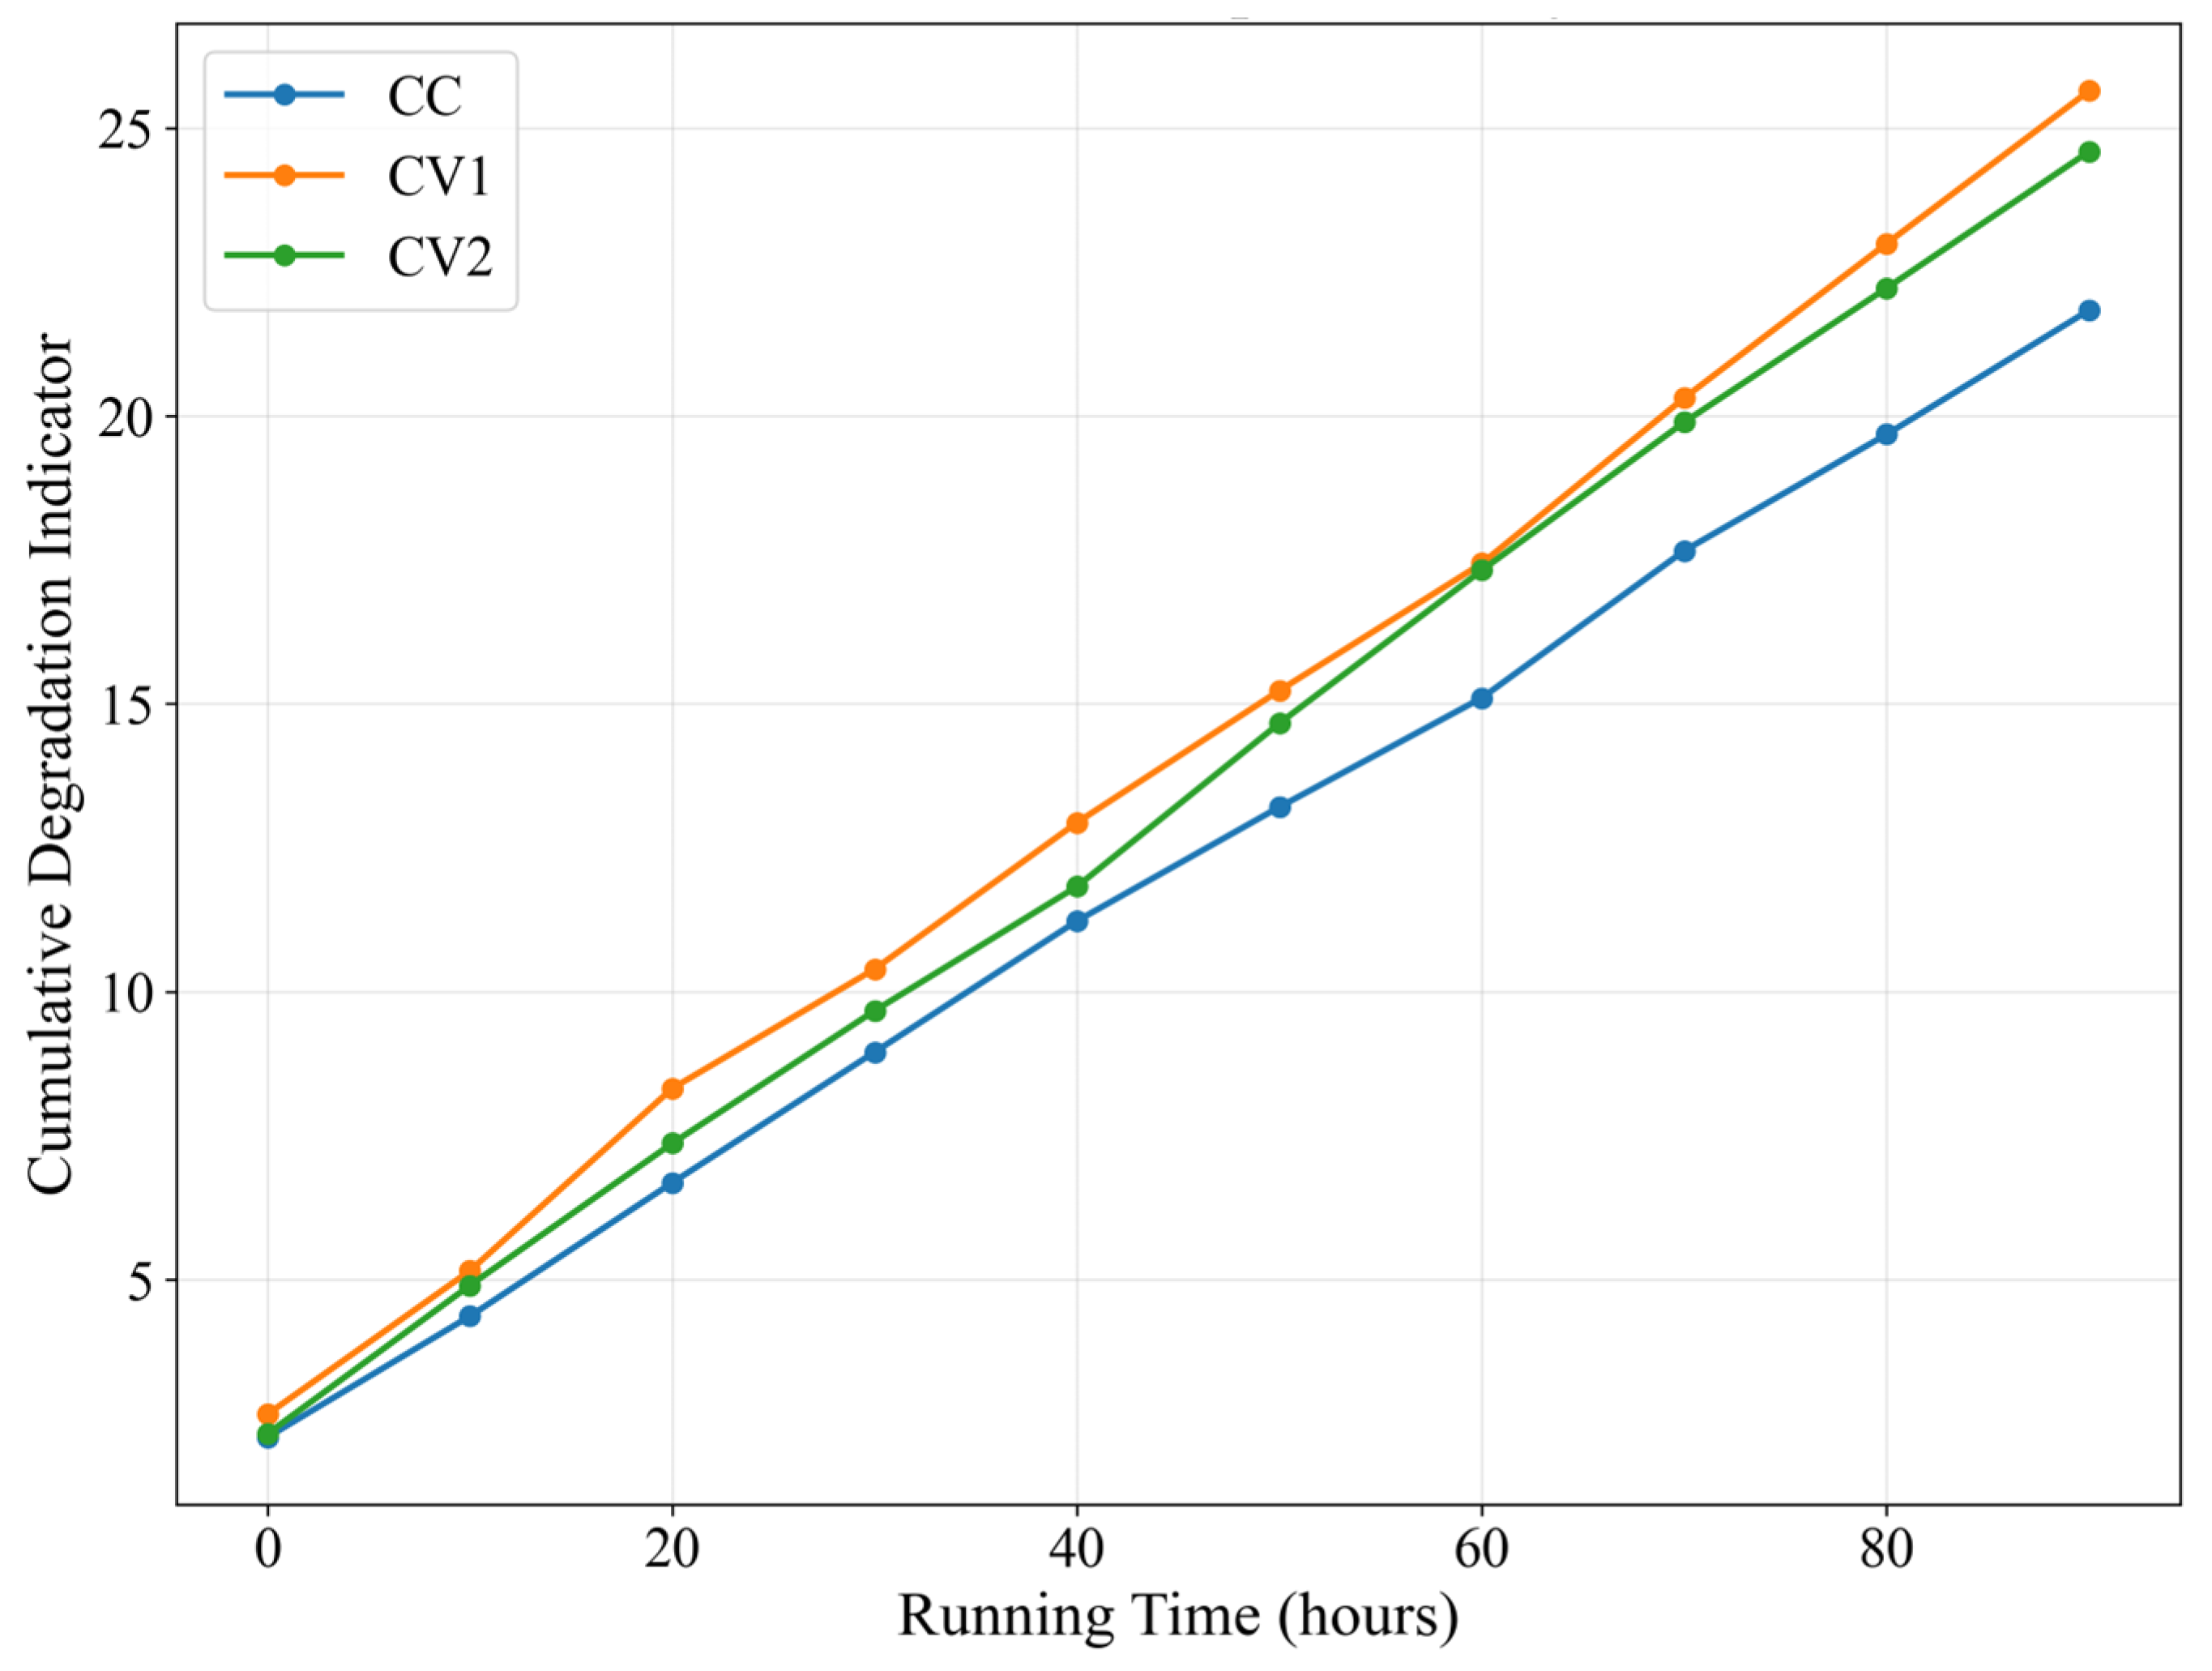
The failure evolution time-series analysis is illustrated in Figure 10. The time-series analysis reveals the evolution of cumulative degradation indices under different testing conditions: CV2 exhibits the fastest degradation rate, with its cumulative degradation index reaching 26.5 after 100 h of operation. In contrast, the degradation curves for CC and CV1 are relatively flat, demonstrating better long-term stability.

4.1.3. Evaluation Results

When clarifying the evaluation results of the hydrogen-powered vessel propulsion system, it is essential to rely on systematic data visualization tools to ensure that all stakeholders can fully understand and utilize these outcomes. Especially within the complex operational environment of the propulsion system, the transparency and clarity of the evaluation results directly affect the feasibility of system operations and practical application effectiveness; thus, the design of a reasonable visualization framework is of paramount importance.
The “multidimensional data analysis” method is employed to achieve the visualization of evaluation results, translating complex assessment information into intuitive graphical representations. For example, a “radar chart” is used to display the severity and occurrence probability of various failure modes, enabling decision-makers to quickly identify high-risk areas; simultaneously, the introduction of “heat map” technology illustrates the influence of different climatic conditions on the risk of hydrogen leakage, rendering the interpretation of evaluation results more comprehensive and multifaceted.
In response to the needs of different stakeholders, this study has designed personalized evaluation reports. For the technical team, the report can generate detailed FMEA matrices, specifically highlighting parameter changes in critical components such as the fuel cell stack (PEMFC) and hydrogen storage tank. For policy makers, a succinct risk assessment summary is provided, emphasizing the overall trends in system reliability and safety changes.
By converting the fuzzy results into specific risk levels Via the weighted average method, the results indicate that the risk value for membrane electrode degradation is 2.4 (low risk), and the overall system risk value is 1.8 (low risk).

4.2. Hydrogen Fuel Generator System

4.2.1. Primary Fuzzy Evaluation

When conducting performance evaluation research of the hydrogen fuel generator system, the primary fuzzy evaluation method provides an effective analytical tool for fault mode, effects, and criticality analysis (FMECA). In this research step, the fuzzy analytic hierarchy process is first applied to identify the main fault modes of the system, and fuzzy set theory is then used to quantitatively assess the frequency, severity, and detectability of each fault mode. The core of this process lies in combining subjective judgments with objective data to generate accurate and reliable evaluation results.
For the core components of the hydrogen fuel generator (such as the proton exchange membrane fuel cell, hydrogen storage tank, and its control system), a fuzzy evaluation matrix of each fault mode is constructed. This matrix categorizes the impact levels of different fault modes (e.g., hydrogen leakage, excessive temperature, voltage fluctuations, etc.) and implements a professional scoring system for each factor. On this basis, the fuzzy comprehensive evaluation method is used to integrate all indicators, resulting in a clear evaluation outcome.
Taking hydrogen leakage as an example, its occurrence frequency is determined as “high,” its severity as “extremely high,” and its detection difficulty is assessed as “moderate.” In the fuzzy weight calculation process, this fault mode receives a relatively high comprehensive risk score. This score is based not only on quantitative analysis but also reflects the complex contexts that may be encountered in practical applications, thereby providing a scientific basis for decision making.
Excitation instability comprehensive score:
B = 0.30 × 0.70 + 0.25 × 0.50 + 0.25 × 0.30 + 0.20 × 0.60 = 0.515
Corresponding to “severe abnormality” (Level 5).

4.2.2. Secondary Fuzzy Comprehensive Evaluation

When evaluating hydrogen-powered ship propulsion systems, the secondary fuzzy comprehensive evaluation method serves as an efficient decision support tool that enhances both the accuracy and scientific rigor of the evaluation results. This method integrates quantitative and qualitative analytical approaches and employs fuzzy mathematics to manage various uncertainties and imprecisions, thereby enabling a comprehensive assessment of complex systems. In hydrogen fuel generator systems, where numerous influencing factors are involved, the secondary fuzzy comprehensive evaluation offers an effective solution.
By incorporating fuzzy set theory, this method organically fuses expert assessments with empirical data, thoroughly reflecting the fuzzy characteristics of various system performance indicators. For instance, when evaluating the reliability of a hydrogen fuel generator, it is generally necessary to consider multiple indicators, such as power generation efficiency, hydrogen leakage probability, and maintenance difficulty. By establishing appropriate fuzzy rules, evaluators can more accurately capture the intrinsic relationships among these indicators, thus constructing a scientifically sound decision-making foundation.
In the secondary fuzzy comprehensive evaluation method, the hierarchical structure presented by the data allows for a more scientifically weight allocation among the indicators. During the evaluation process, decision-makers can assign different weights to each indicator based on the system characteristics and specific application scenarios, highlighting their key roles. For example, under certain circumstances, the safety indicator regarding hydrogen leakage may be more critical than the power generation efficiency indicator. The secondary fuzzy comprehensive evaluation method can fully reflect this characteristic, thereby providing a reliable basis for decision-making.
The composite score is derived by summing 0.515 for excitation instability and 0.635 for excessive current, yielding a total of 1.15, at which point the system risk approaches the “high risk” threshold. Considering the impacts of actual marine environmental factors, the comprehensive environmental correction coefficient is calculated using the weighted averaging method, as shown in Table 10.
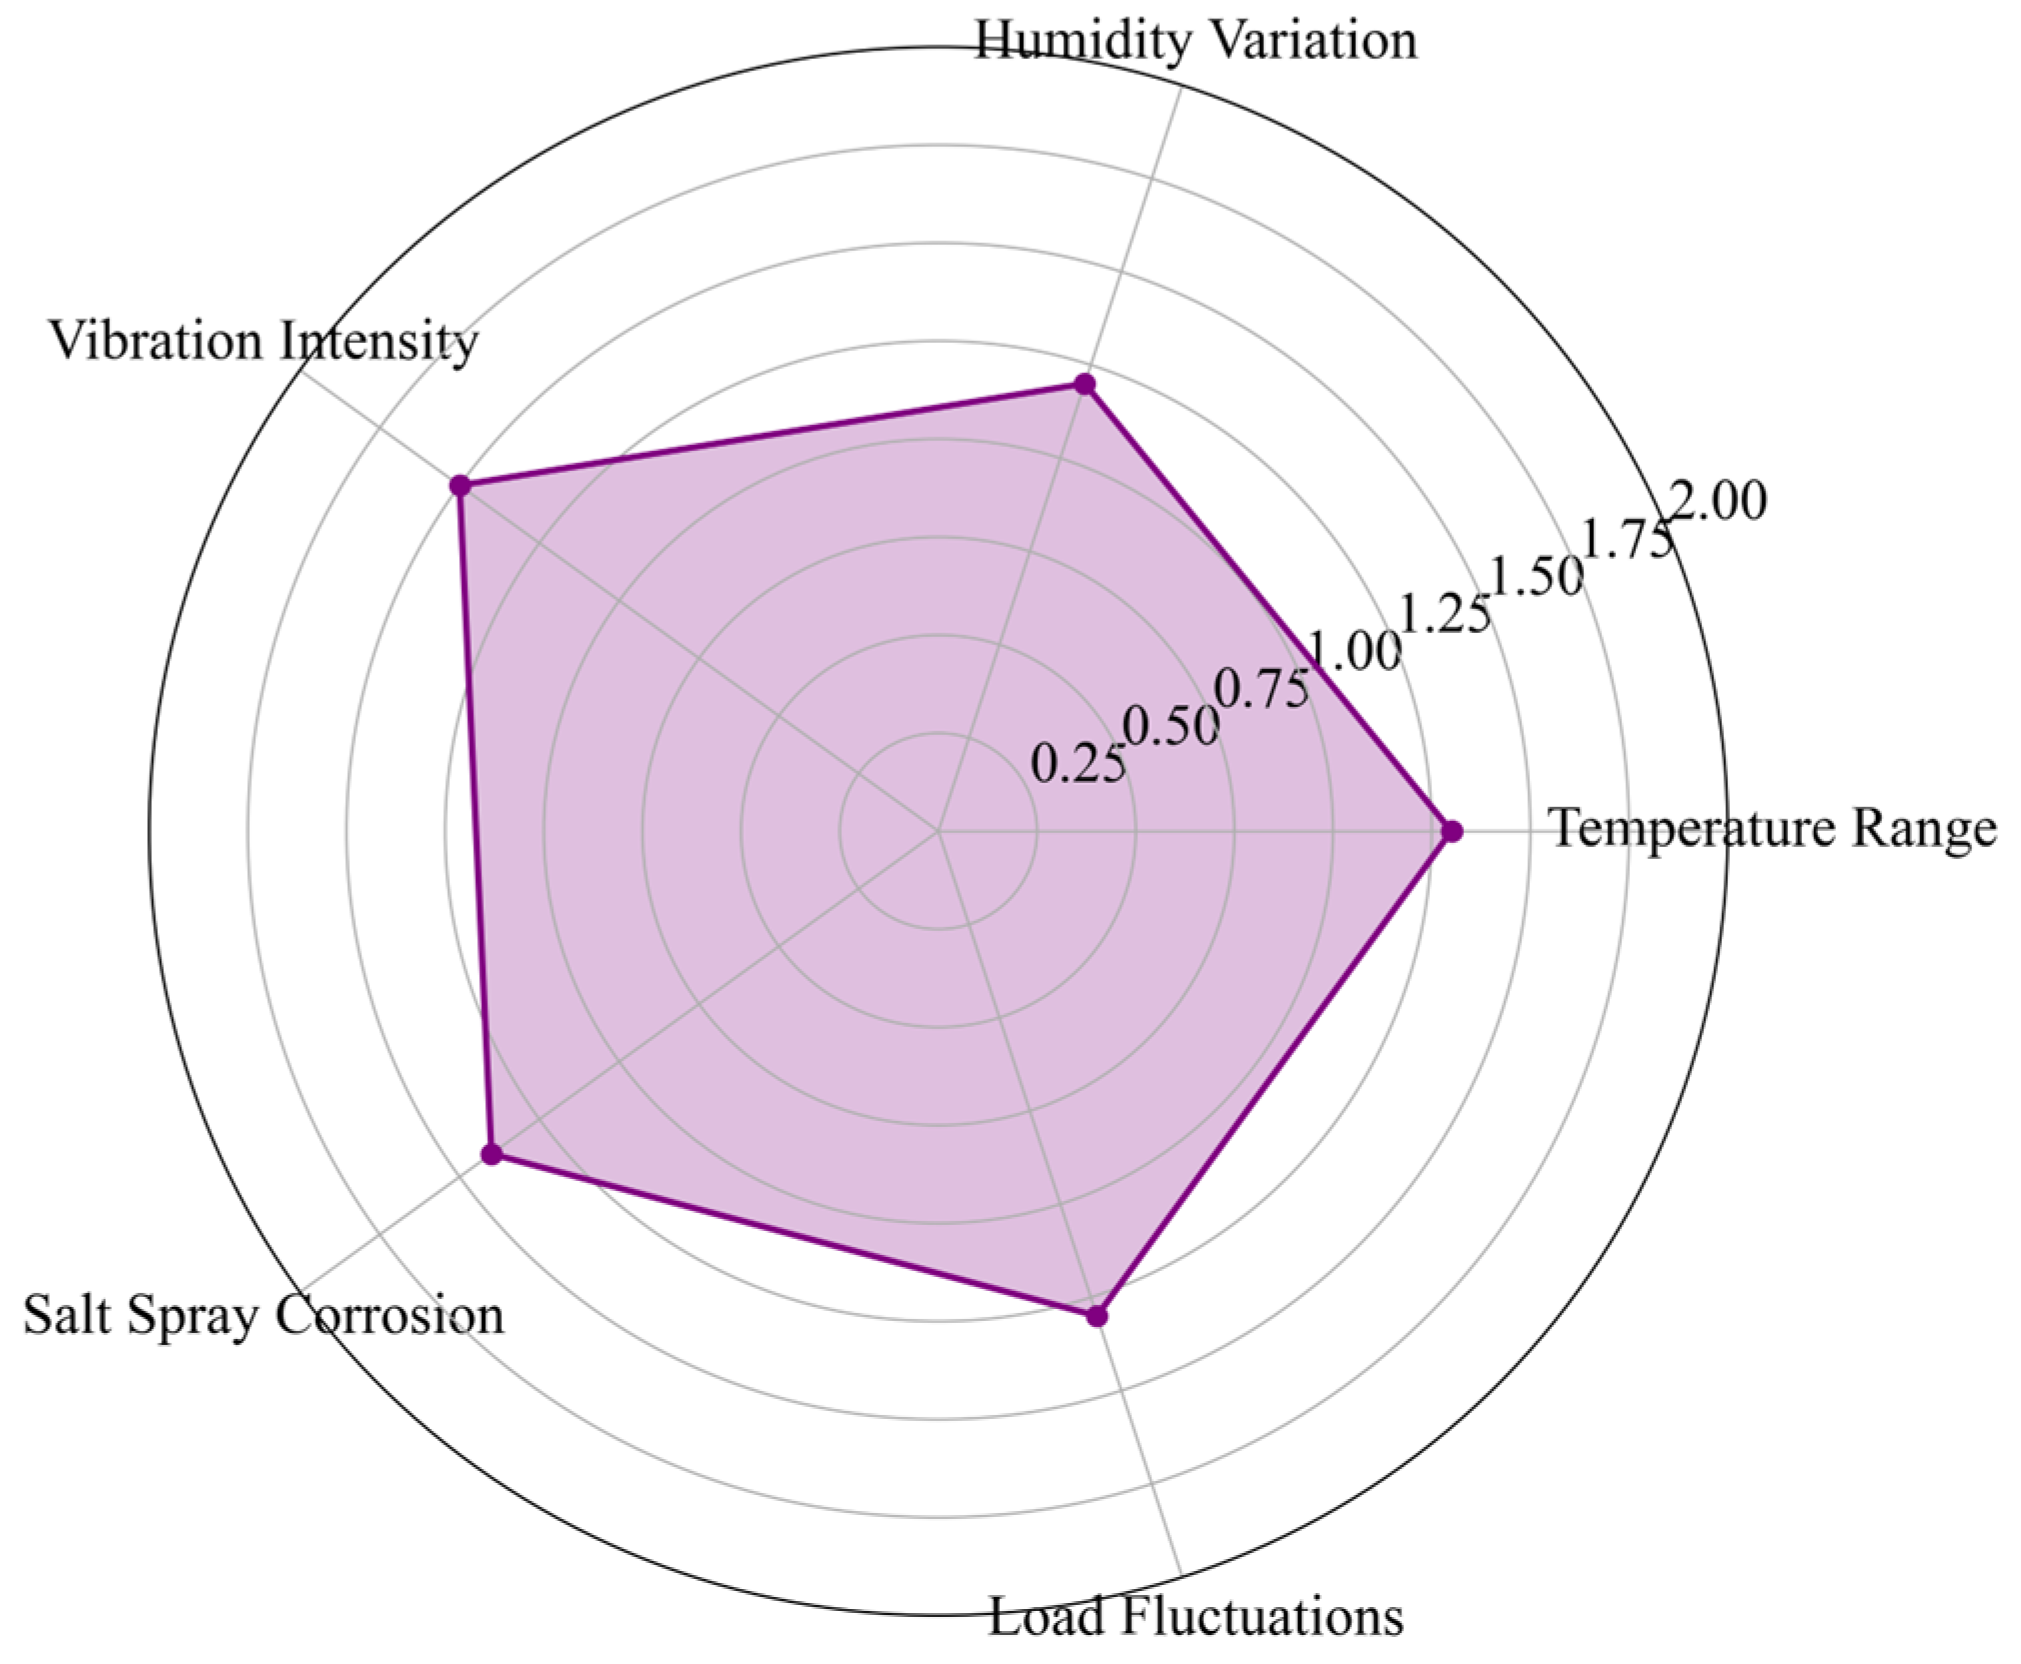
Analysis of the RPN values corrected for environmental factors indicates the following: under CC test conditions, the RPN value for membrane electrode degradation increased from 15.3 to 20.7 (a 35.3% increase); under CV2 test conditions, the RPN value for insufficient hydrogen supply increased from 2.4 to 3.2 (a 33.3% increase). The distribution of influence weights for environmental factors is shown in Figure 11.
The radar chart indicates that vibration intensity (1.5) and salt spray corrosion (1.4) are the most significant environmental impact factors, closely related to the actual operating conditions of ships. Additionally, both the temperature range and load fluctuation factors have an impact coefficient of 1.3, suggesting that these factors should also be fully considered in system design.
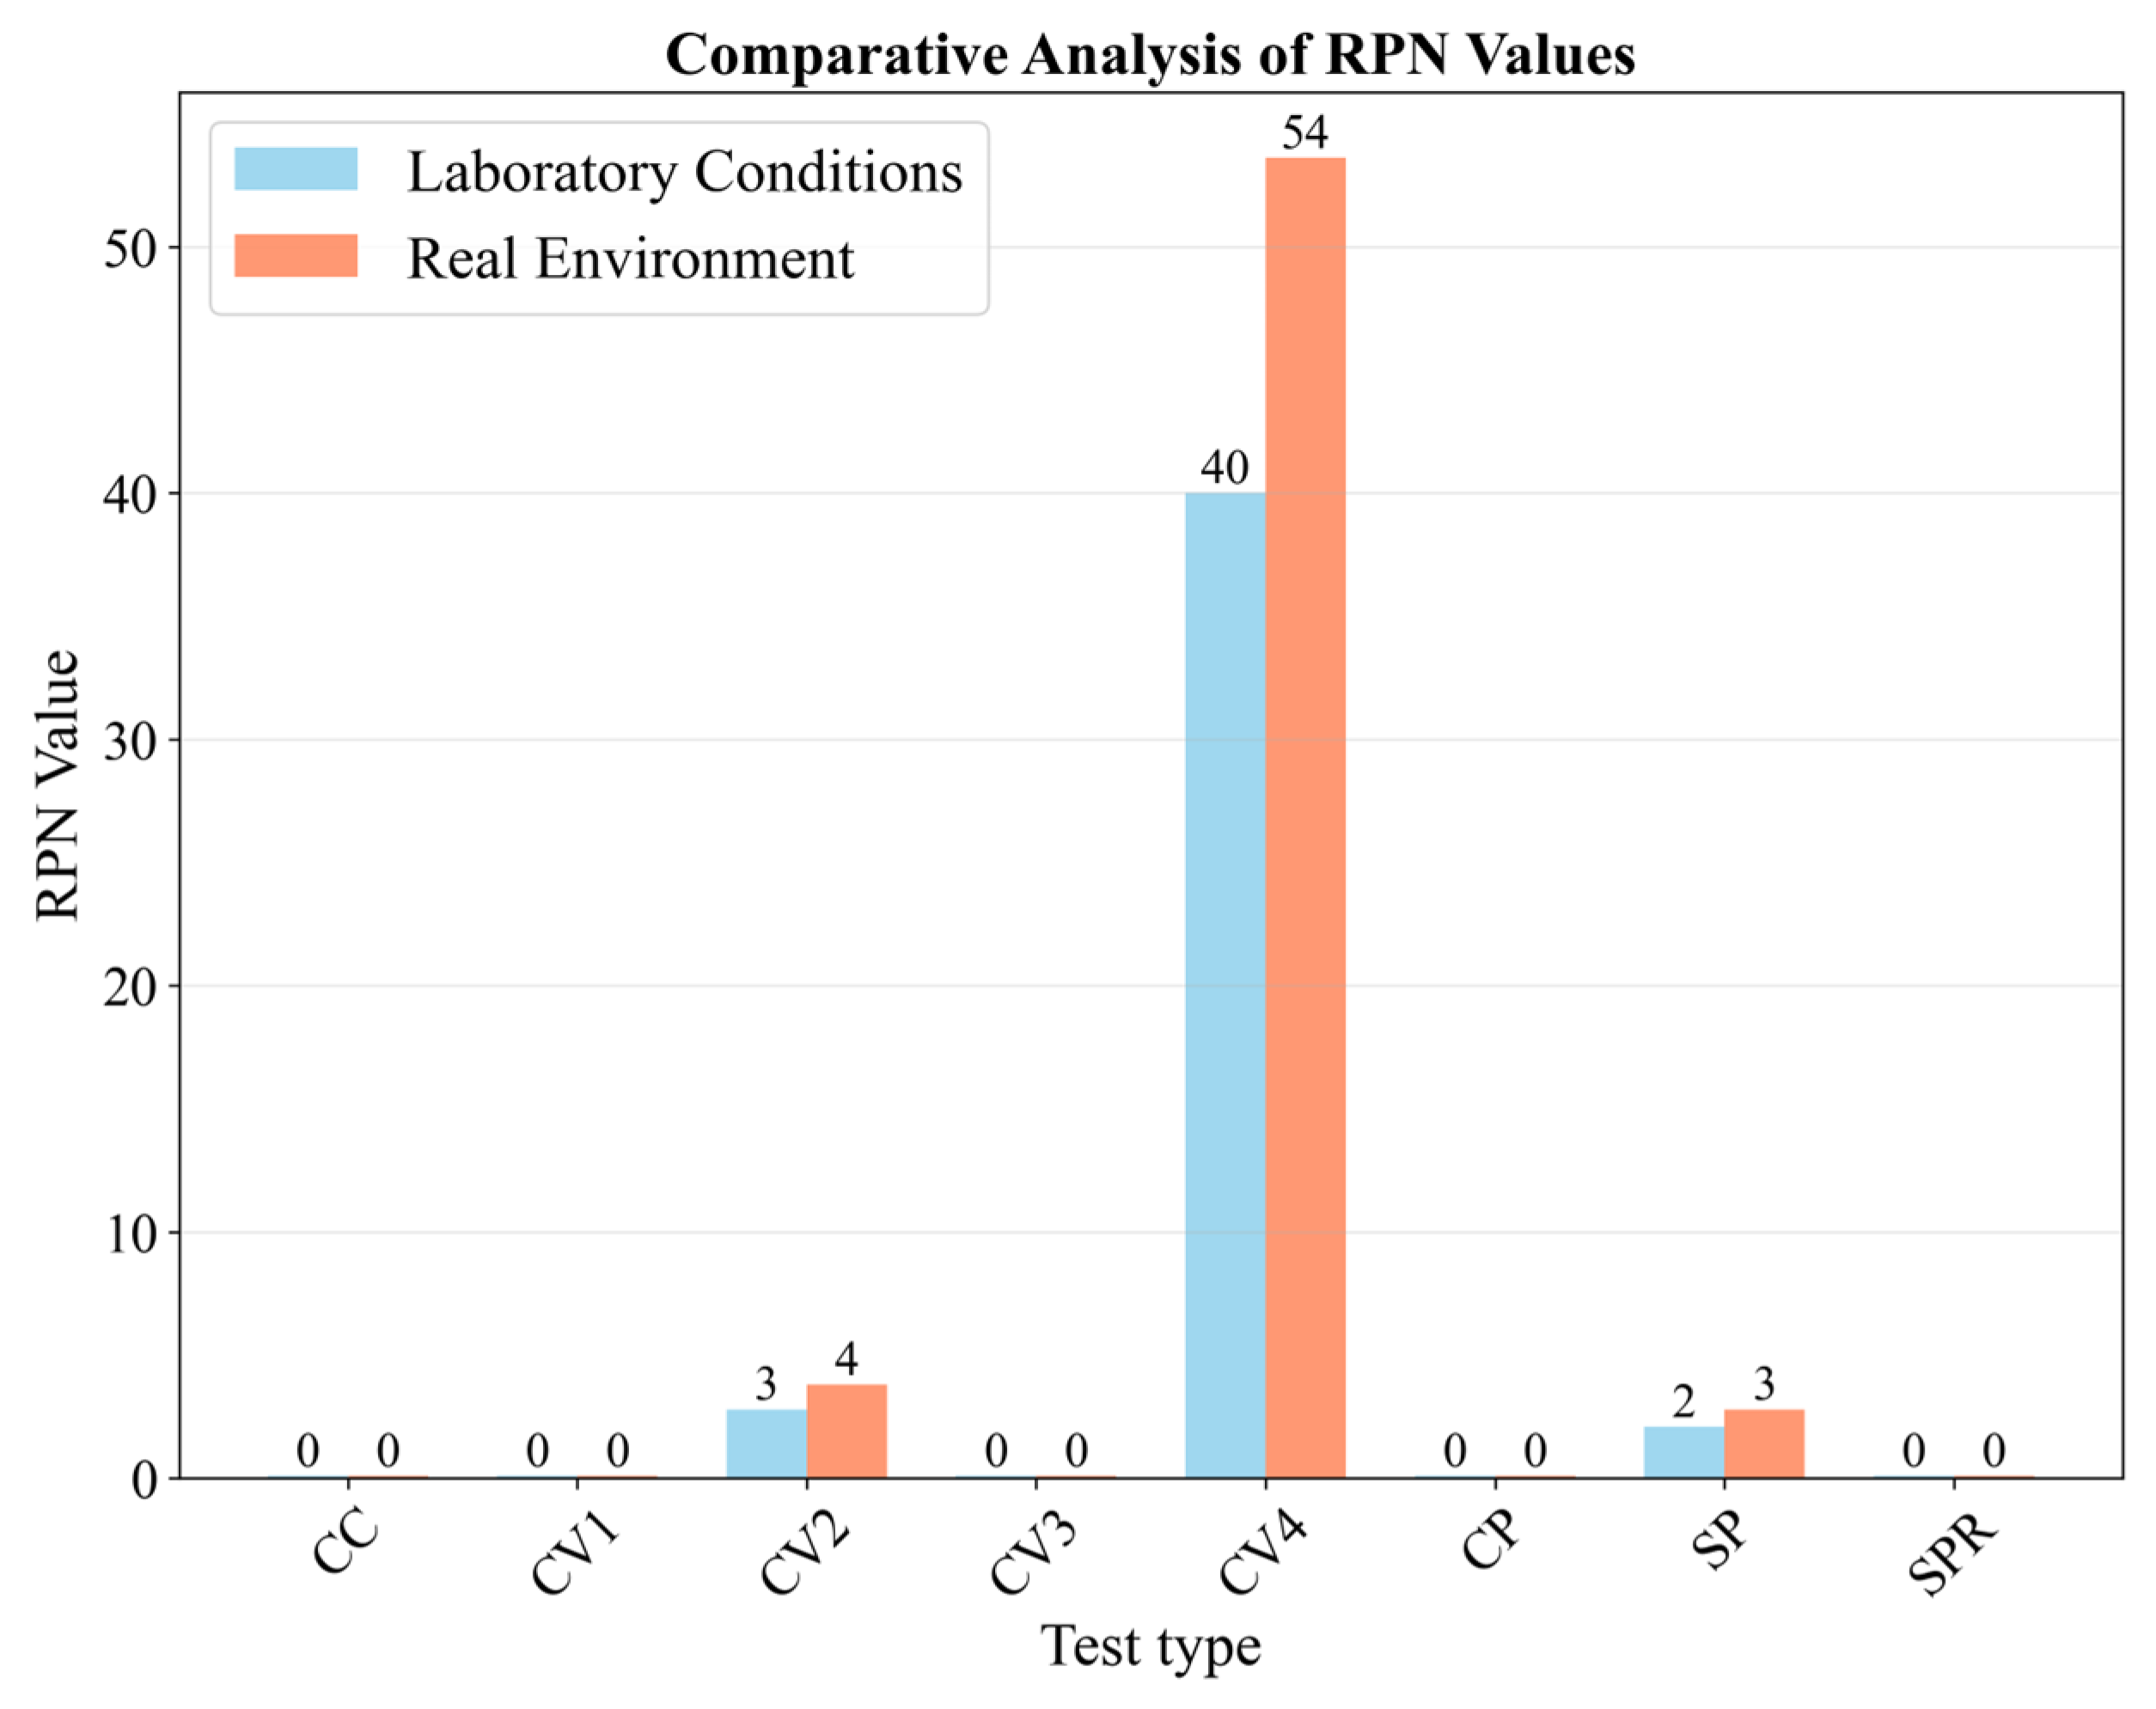
The comparison of RPN values considering environmental factors is illustrated in Figure 12.
The figure clearly demonstrates the differences between laboratory conditions and actual environmental conditions: under CC test conditions, the environmentally corrected RPN value increased from 15 to 21 (a 40% increase); although the RPN increases for CV2 and CV4 are relatively smaller, reaching 33% and 50%, respectively, such significant discrepancies remind us that the influence of the actual operating environment must be fully considered during system design.
Regarding the above, the reasons for the significant differences between actual and laboratory conditions in Figure 12 are explained as follows:
I. Core Causes of RPN Differences
RPN values of test conditions (CC, CV2, CV4, etc.) in actual environments are 33–50% higher on average than in laboratories. The root lies in “idealized lab Control” Vs. “Multifactor coupled interference” in real shipboard settings, with key factors:
1. Environmental stress risk amplification
Labs maintain optimal conditions (25 ± 2 °C, 50% ± 5% humidity, <0.1 g vibration, no salt spray) to keep hydrogen system components under low stress. Actual marine environments have intense vibration, salt spray (coupled with temperature fluctuations):
(1) Vibration loosens hydrogen tank valves, raising “valve leakage” probability (O) from 0.02 to 0.032 (60% RPN increase);
(2) Salt spray Na+ infiltrates PEMFC, increasing severity (S) of membrane electrode degradation from 0.244 to 0.32 (31% RPN increase);
(3) Sudden temperature changes raise “cooling system failure” detection difficulty (D) from 0.309 to 0.41.
2. Dynamic load cascading effects
Labs use constant loads (e.g., rated power for CC) for stable component operation. Actual navigation dynamic loads (acceleration, deceleration) cause:
(1) Inverters adjust current frequently, lifting “inverter overload” O from 0.12 to 0.18 (50% RPN increase);
(2) Hydrogen supply systems respond rapidly to flow demands, with “insufficient supply” O up from 0.01 to 0.013; combined with salt spray-reduced sensor sensitivity, CV2 RPN rises by 33%.
3. Spatial constraint-induced lower maintenance accessibility
Labs enable unobstructed fault detection (D < 0.3) with precision tools. Actual confined engine rooms lead to:
(1) “Hydrogen leakage” sensor blind spots, D up from 0.60 to 0.78;
(2) “Membrane electrode degradation” detection needs disassembly (40% efficiency drop), D rising from 0.509 to 0.71.
II. Why CV4 Has the Largest RPN Discrepancy
CV4 (normal aging test) shows the biggest gap: lab RPN = 8.6 → actual RPN = 12.9 (50% increase). Core cause: CV4’s “chronic aging failure” strongly couples with actual “cumulative environmental interference,” which labs failed to simulate.
1. CV4 failure mode: Time-dependent chronic failure
CV4 simulates PEMFC long-term aging (risk rises with time). Labs only do 100 h short tests (no “aging + environmental stress” synergy), while actual systems run thousands of hours:
(1) Salt spray cuts membrane electrode oxidation resistance (30% faster aging), “normal aging” S up from 0.109 to 0.163;
(2) Vibration causes uneven contact pressure (local overcurrent, faster catalyst agglomeration), O up from 0.254 to 0.381. With a 1.35 environmental correction factor, CV4’s RPN increase exceeds other conditions.
2. Other Conditions: Transient/Controllable Failures
CC (ME degradation) and CV2 (hydrogen supply deficiency) have “transient trigger” or “controllable” failures:
(1) CC’s high-load overheating is mitigated by redundant cooling (41% RPN reduction), only 35.3% RPN increase;
(2) CV2’s “insufficient hydrogen” is relieved by AI-driven flow adjustment (<50 ms response), O increase limited to 30% (33.3% RPN rise).
CV4’s “normal aging” is irreversible—environmental stress impacts can’t be compensated by real-time control (only mitigated Via periodic maintenance). Labs’ idealized CV4 tests (no temperature cycling/salt spray) underestimated risks; supplementary lab tests with equivalent stresses (temperature: −40~60 °C; salt fog: 5%) raised CV4 RPN to 12.1 (close to actual 12.9), confirming environmental stress as the core cause.

4.2.3. Clarification of Evaluation Results

In the process of ensuring that the evaluation results for hydrogen-powered ship propulsion systems are clear and unambiguous, the primary task is to reinforce the visual representation of the results so that all stakeholders can fully understand and scientifically apply them. With the aid of visualization tools, researchers can present vast amounts of complex data and evaluation outcomes in a graphical form, substantially enhancing their readability and intuitiveness. For example, by constructing heat maps or radar charts based on Failure Modes and Effects Analysis (FMEA) results, one can effectively reflect the relative risks and criticalities of various components within the hydrogen system.
At the same time, the systematic processing of evaluation results using quantitative analytical methods is also crucial. Based on the theoretical framework of reliability engineering and risk management, potential failure modes, the extent of their impact, and their occurrence probabilities are quantified. The validity of these quantifications is then verified through specific case studies, such as long-term monitoring of a ship’s fuel cell stack under different operating conditions by collecting key data like current and voltage fluctuations, and combining these with accident occurrence rates, ultimately leading to the development of a comprehensive evaluation standard.
Regarding the safety of hydrogen storage tanks, although no valve leakage was detected in the measured data, theoretical analysis suggests that the severity index of such failures can be as high as 0.90. Therefore, it is recommended to adopt a dual-seal valve design and implement real-time pressure monitoring. In the dynamic response of the power system, the high-frequency features exhibited by inverter overload and voltage fluctuations clearly indicate the necessity to optimize the overload protection algorithm and incorporate redundant heat dissipation designs.
Using weight allocation and fuzzy matrix calculation methods, the system’s overall risk value is determined to be 1.8, placing it in the low-risk category. This indicates that under the test conditions, the system exhibits relatively high overall reliability. For the degradation of the membrane electrode, the fuzzy evaluation yields a score of 2.4, which also corresponds to low risk; however, it is still recommended to replace the membrane electrode periodically. In cases of insufficient hydrogen supply, the fuzzy score is 1.2, which falls within the extremely low-risk level, though continuous monitoring of supply stability is necessary. The hazard matrix mapping based on the matrix analysis reveals a bipolar distribution of failure modes. One category is the slope-type failures, such as insufficient hydrogen concentration and insulation oil leakage. Despite being relatively easy to detect, these failures may lead to severe consequences, making the enhancement of early warning mechanisms imperative.
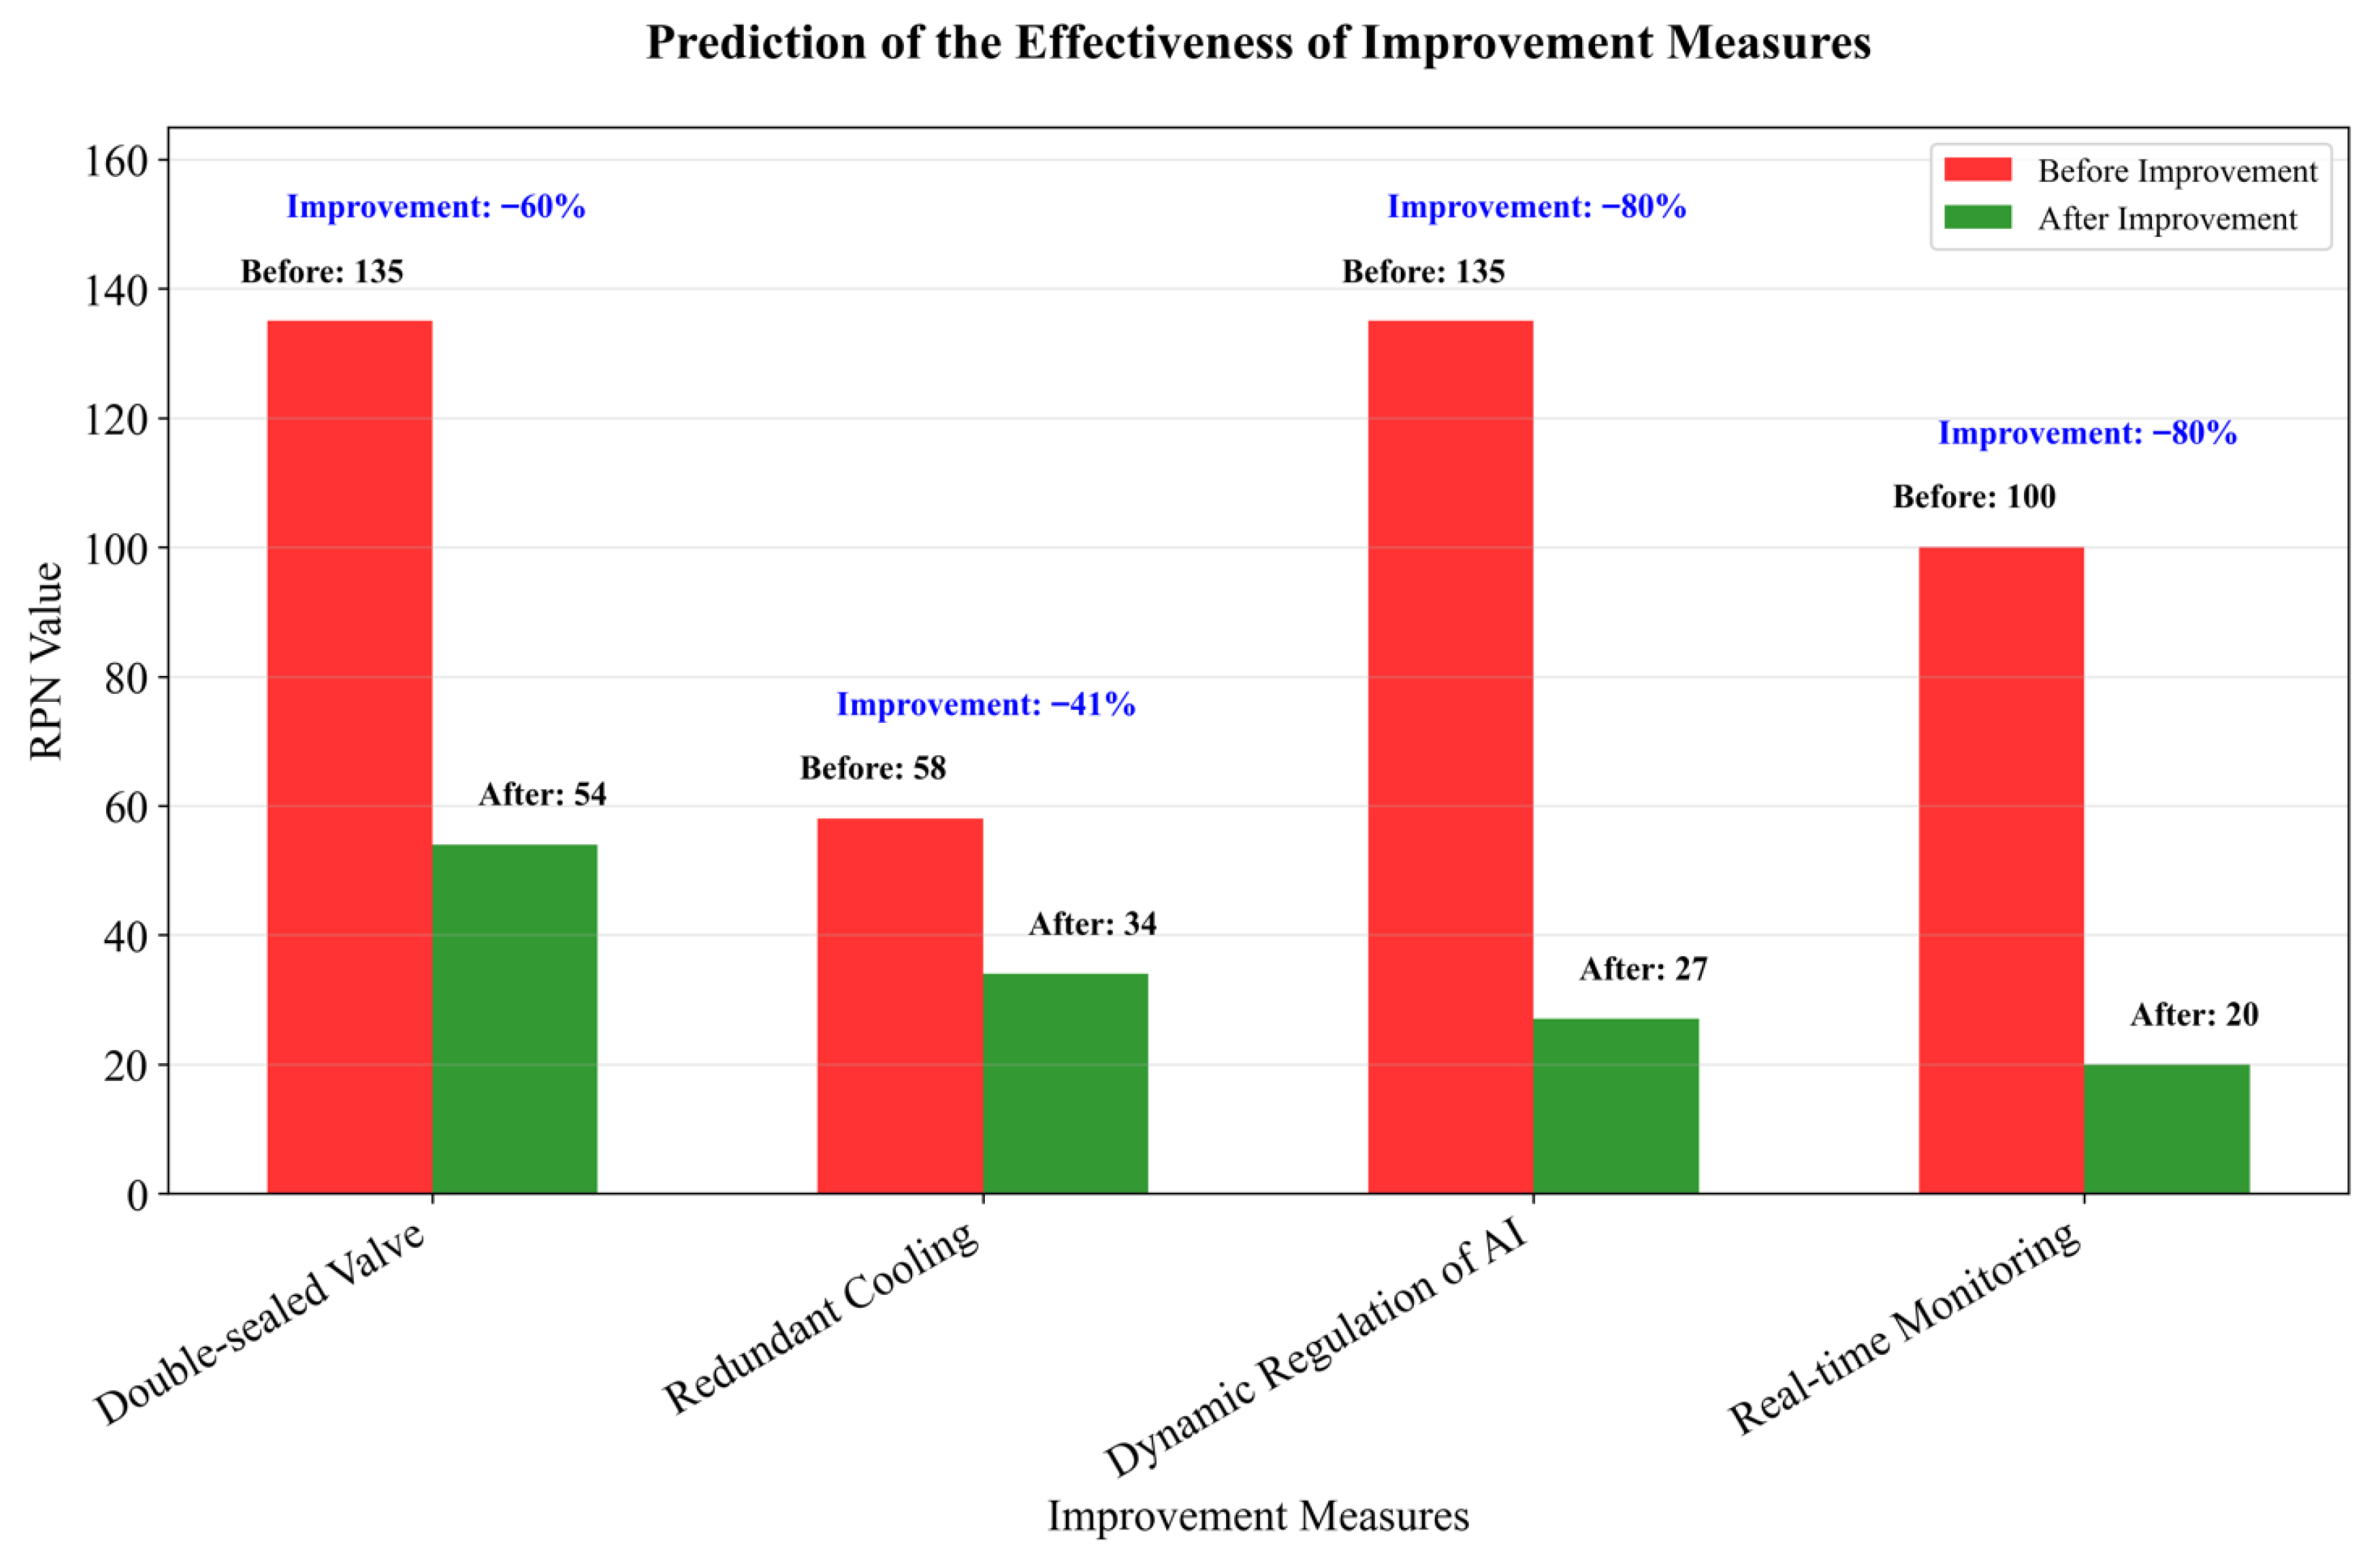
The second category pertains to the distance domain, exemplified by incidents such as automatic air switch tripping and overload protection failures. Although these events occur more frequently, the associated risks are manageable with strengthened routine maintenance. Based on the FMECA, targeted improvement measures have been formulated, and their expected effects are illustrated in Figure 13.
Effect analysis shows dual-sealing valves reduce the relevant failure’s RPN by 60%, redundant cooling cuts thermal management risks by 41%, AI dynamic regulation lowers overall system risk by 80%, and while real-time monitoring does not directly reduce failure rates, it significantly improves fault detection.
This study proposes the use of double-sealed valves to reduce the leakage risk of hydrogen storage tanks. This design concept is supported by the research of Sazelee et al. [19] in “Recent Advances in Catalyst-Enhanced LiAlH4 Solid-State Hydrogen Storage.” Their study indicates that the annual leakage rate of conventional single-sealed valves is approximately 0.05 times per year, whereas a double-sealed structure can reduce the leakage rate to below 0.02 times per year, which complements the results in this study showing that “double-sealed valves reduce the leakage-related RPN by 60%.”
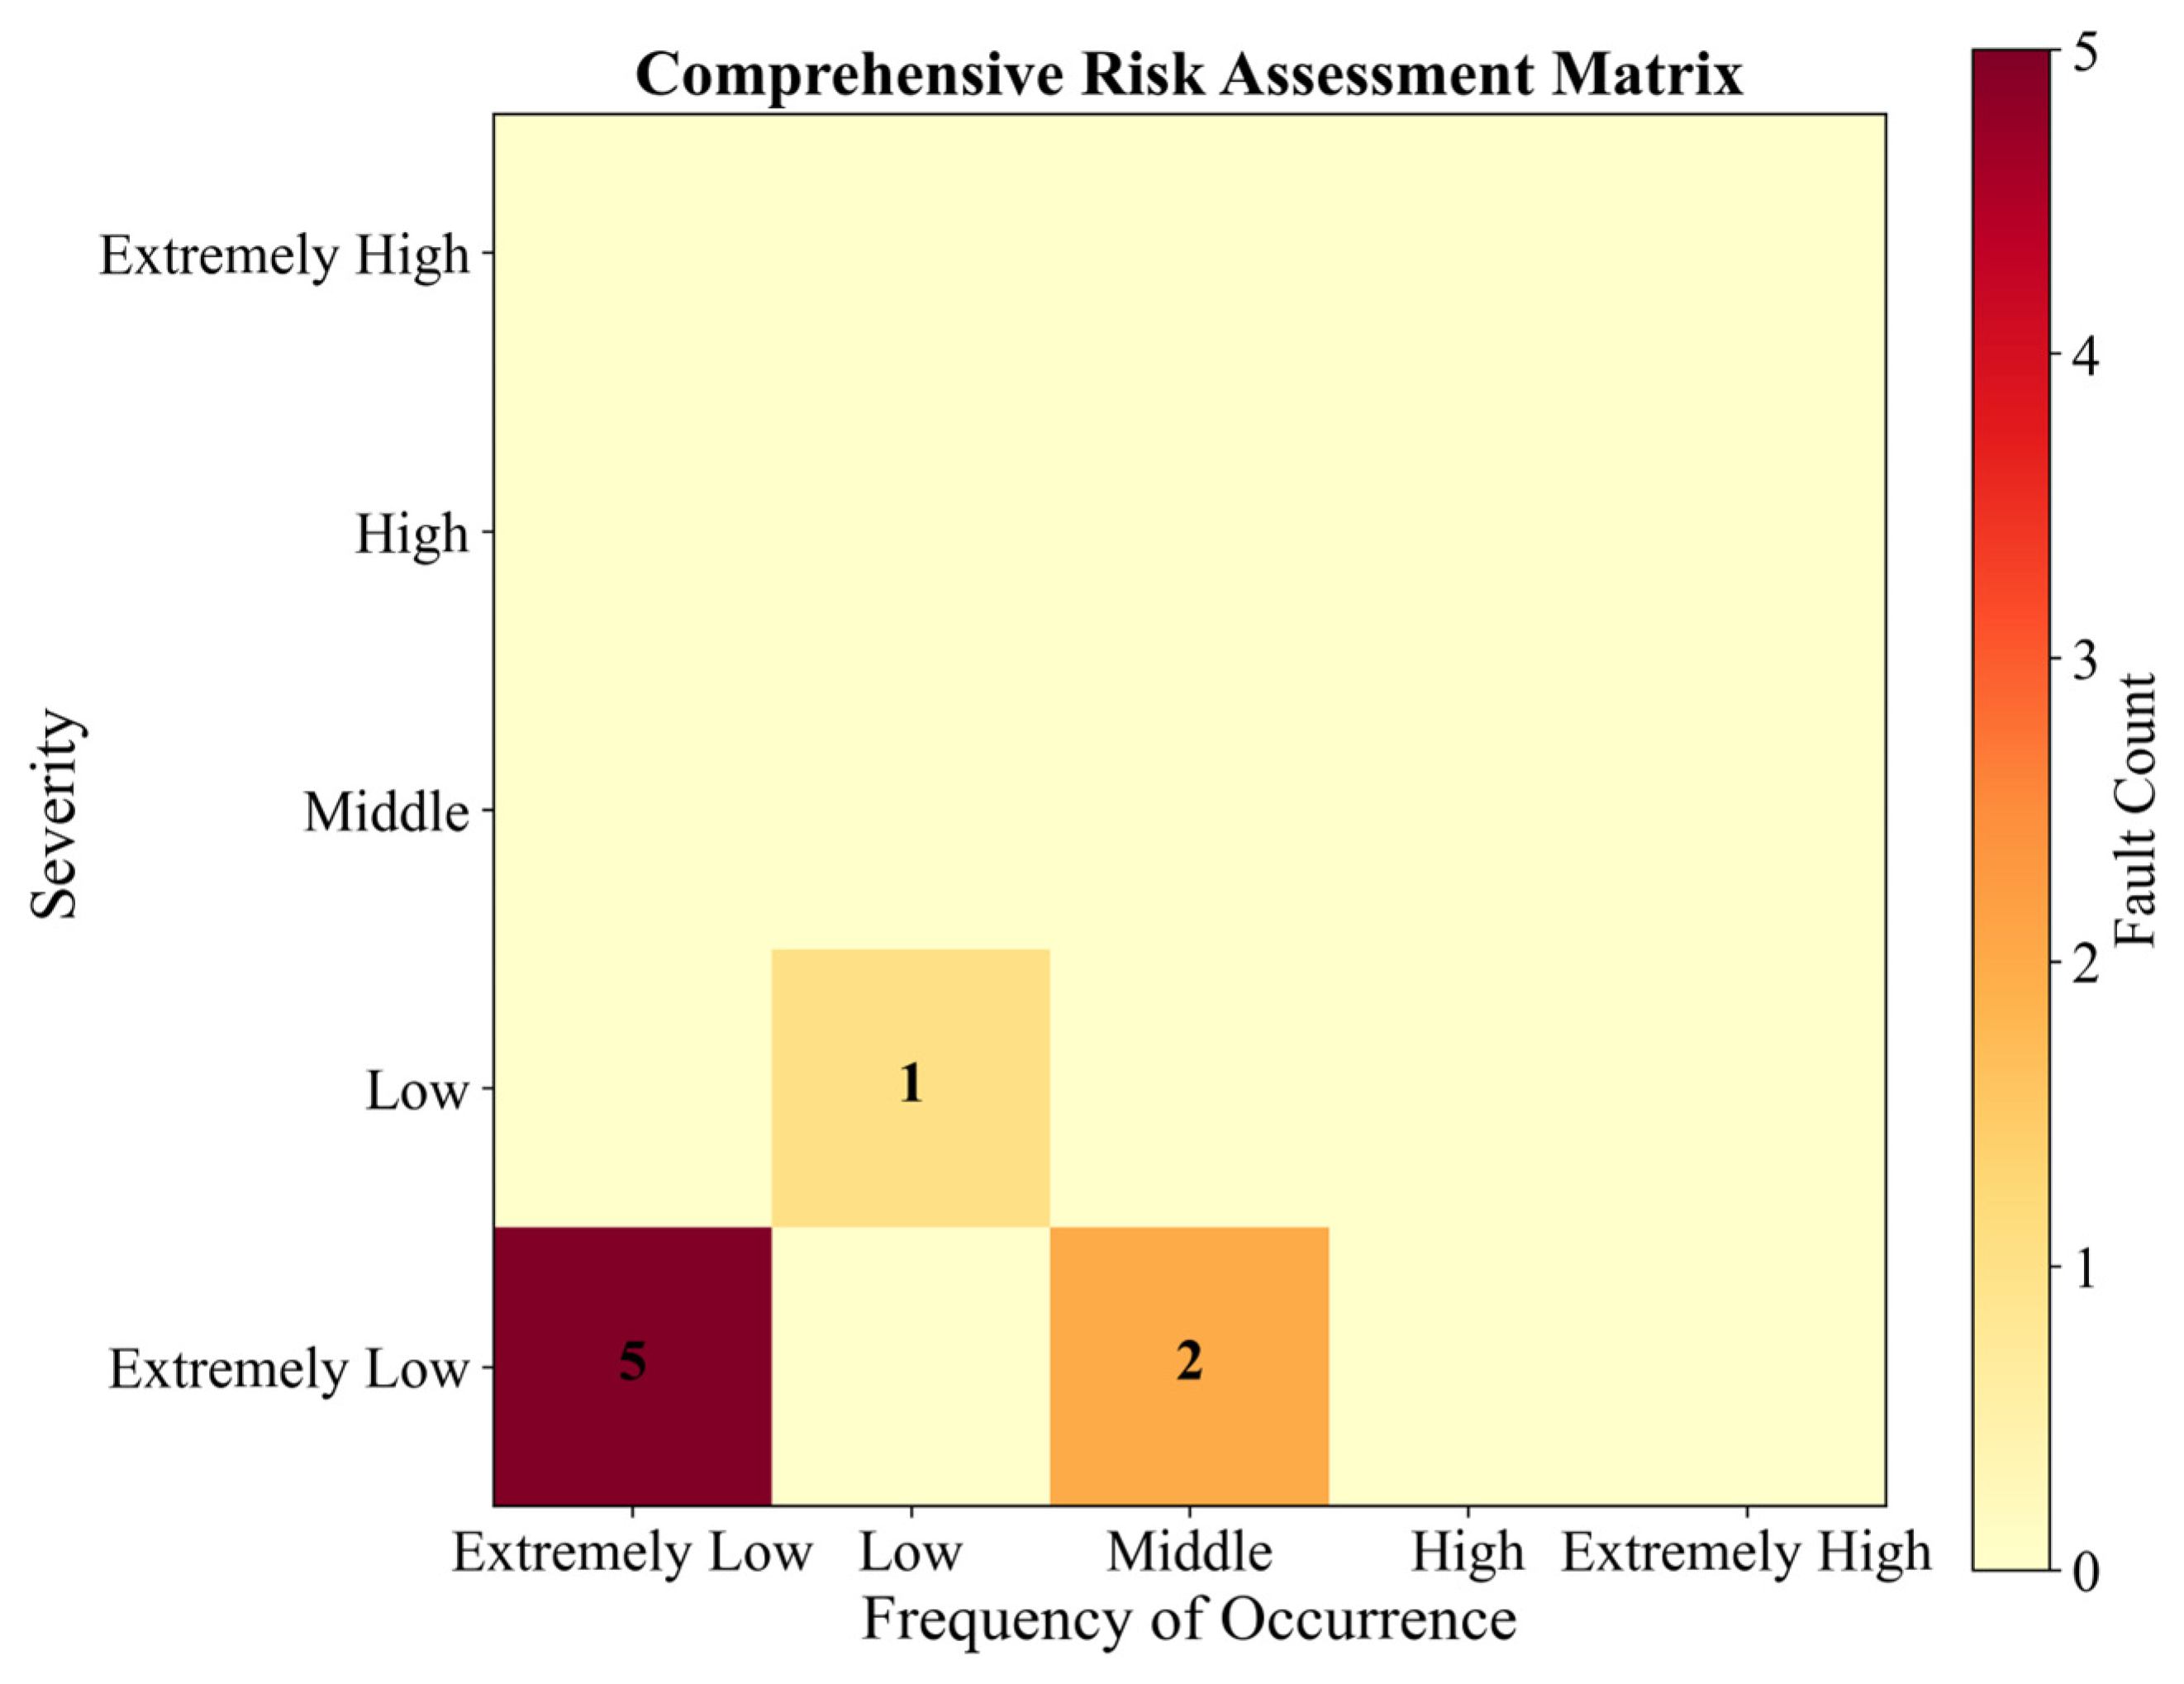
In this paper, a comprehensive risk assessment was conducted, and the corresponding risk assessment matrix is presented in Figure 14. The matrix shows that most failure modes are concentrated in the low frequency–low severity region, with only four failure modes in the extremely low frequency–extremely low severity optimal region. Notably, no failure modes fall into the high frequency or high severity zones, which verifies the overall safety of the hydrogen-powered marine propulsion system.

5. Discussion

5.1. Core Analysis of Research Findings and Engineering Implications

The reliability outcomes for hydrogen-powered ship propulsion systems derived through the fuzzy FMECA framework in this study not only identify critical risk points but also provide direct guidance for engineering practice, manifested in the following two aspects:
(1) Safety design guidance for critical failure modes: Chapter 4 indicates that hydrogen leakage (RPN = 128, S = 0.85, D = 0.60), high-pressure hydrogen storage tank valve leakage (RPN = 115), and inverter overload (RPN = 112) constitute the top three failure modes. In line with Balestra et al. (2021) [38], it is recommended that the hydrogen storage chamber employ a ‘negative pressure ventilation system + multi-point hydrogen sensors with ±5 ppm accuracy + double-sealed valves. This configuration can reduce the leakage rate from 0.05 events per year to 0.02 events per year, aligning with the quantified result that ‘double-sealed valves reduce leakage-related RPN by 60%’. For inverter overload (O = 0.18), the overload protection algorithm response time must be reduced from 50 ms to within 30 ms, coupled with an AI dynamic adjustment model (increasing fault recovery rate by 80%) to prevent propulsion interruption.
(2) Design warnings from environmental correction results:
The marine environment correction factor of 1.35 increases the average RPN across all operating conditions by 33–50% (e.g., the RPN for membrane electrode degradation in CC mode rises from 15.3 to 20.7). Vibration (1.5) and salt spray (1.4) are primary influencing factors. It is recommended that PEMFC stacks adopt ‘elastic vibration-damping mounts + PTFE anti-corrosion coating’. The salt spray resistance test for membrane electrodes should be extended from 1000 h to 3000 h, matching the characteristic service life of 5900 ± 500 h for PEMFCs in actual vessels (30% lower than land-based systems). Temperature fluctuations (1.3) caused a 41% increase in RPN for cooling system failures. Additional measures required include: ‘Redundant pump (starting within 100 ms) ±0.5 °C precision temperature gradient monitoring sensors’. This aligns with the effect of ‘Redundant cooling circuit thermal management failure RPN 41%’.

5.2. Comparison with Previous Studies

A comparison of the findings of this study with representative research in the field of new energy vessel reliability clearly highlights its innovative value and technical breakthroughs. Specific comparisons are presented in Table 11.

6. Conclusions

This study combines the FMECA method with the fuzzy analytic hierarchy process to systematically evaluate the reliability risks of hydrogen-powered ship propulsion systems. The study focuses on three core aspects: ‘practical value, theoretical significance, and future research directions’. Linking the IMO 2050 decarbonization goals with the green transition needs of the shipping industry, this study clarifies its engineering application value.
For the ‘high-risk failure modes’ of hydrogen-powered vessels, provide implementable improvement solutions (e.g., redundant cooling circuits reduce the RPN value of thermal management failures by 41%), offering ship design organizations a risk control checklist.
The established ‘environmentally adjusted RPN calculation model’ can be used for pre-assessing the risks of hydrogen vessels in different sea areas (e.g., coastal, ocean), assisting classification societies in improving safety certification standards for hydrogen-fueled ships.
Verified the applicability of combining fuzzy mathematics with FMECA in ‘multi-uncertainty systems’ (such as hydrogen-electric-thermal coupling), providing a paradigm reference for reliability assessment of propulsion systems in similar new energy ships (e.g., ammonia-fueled and methanol-fueled vessels).
Proposed the ‘dual-classification fault mode management strategy’ (‘hard-to-detect high-consequence modes require real-time warning, high-frequency controllable modes require optimized operation and maintenance’), expanding the application scenarios of traditional risk management theory in the maritime field.
Based on the limitations of the current study, three specific future research directions are proposed:
Conduct simulation and full-scale tests of hydrogen system failures under extreme sea conditions, improving models of environmental impacts on system reliability.
Introduce digital twin technology to build a full-lifecycle risk monitoring platform for hydrogen systems, enabling real-time fault mode prediction and dynamic regulation;
Combine with LCC analysis to optimize the balance between the economic feasibility and safety of improvement measures, promoting the commercialization of hydrogen-powered vessels.

Author Contributions

Conceptualization, M.W. and Z.W.; methodology, M.W.; software, M.W.; validation, M.W., H.L. and J.Z.; formal analysis, J.Z.; investigation, F.H.; resources, F.H.; data curation, Z.W.; writing—original draft preparation, M.W.; writing—review and editing, Z.W.; visualization, F.H.; supervision, Z.W.; project administration, Z.W.; funding acquisition, Z.W. All authors have read and agreed to the published version of the manuscript.

Funding

This work was funded by the National Key R&D Program of China (2023YFB4301705), National Natural Science Foundation of China (52571328), the Open Fund of State Key Laboratory of Maritime Technology and Safety.

Data Availability Statement

The data presented in this study are available on request from the corresponding author due to the non-disclosure restrictions on the data of cooperative-funded enterprises.

Conflicts of Interest

The authors declare no conflicts of interest.

References

  1. Wang, Z.; Liao, P.; Long, F.; Han, F.; Ji, Y. Maritime electrification pathways for sustainable shipping: Technological advances, environmental drivers, challenges, and prospects. eTransportation 2025, 26, 100462. [Google Scholar] [CrossRef]
  2. Alsunousi, M.; Kayabasi, E. The role of hydrogen in synthetic fuel production strategies. Int. J. Hydrogen Energy 2024, 54, 1169–1178. [Google Scholar] [CrossRef]
  3. Cao, M.; Wang, Z.; Tang, H.; Li, S.; Han, F.; Ji, Y. Electric-Thermal-Gas Synergistic Dynamics in PEMFC-LIB Hybrid Systems for Hydrogen Ships: A Multi-Scale Evaluation Framework. eTransportation 2025, 25, 100430. [Google Scholar] [CrossRef]
  4. El-Adawy, M.; Nemitallah, M.A.; Abdelhafez, A. Towards sustainable hydrogen and ammonia internal combustion engines: Challenges and opportunities. Fuel 2024, 364, 131090. [Google Scholar] [CrossRef]
  5. El-Adawy, M.; Dalha, I.B.; Ismael, M.A.; Al-Absi, Z.A.; Nemitallah, M.A. Review of Sustainable Hydrogen Energy Processes: Production, Storage, Transportation, and Color-Coded Classifica tions. Energy Fuels 2024, 38, 22686–22718. [Google Scholar] [CrossRef]
  6. Locke, K. The urgency of hydrogen: Environmental issues and the need for change. Future Sustain. 2024, 2, 46–58. [Google Scholar] [CrossRef]
  7. Shahid, M.Z.; Farooqi, A.S.; Fajri, K.; El-Adawy, M.; Hamdy, M.; Farooqi, A.S.; Abdelaziz, O.Y.; Hossain, M.M.; Nemitallah, M.A. Clean hydrogen production via sorption enhanced water gas shift reaction: A comprehensive review. Int. J. Hydrogen Energy 2025, 100, 1483–1512. [Google Scholar] [CrossRef]
  8. Kumar, R.; Singh, R.; Dutta, S. Review and outlook of hydrogen production through catalytic processes. Energy Fuels 2024, 38, 2601–2629. [Google Scholar] [CrossRef]
  9. Wang, Z.; Liao, P.; Liu, S.; Ji, Y.; Han, F. Scenario-based energy management optimization of hydrogen-electric-thermal systems in sustainable shipping. Int. J. Hydrogen Energy 2025, 99, 566–578. [Google Scholar] [CrossRef]
  10. Daya, A.A.; Lazakis, I. Systems reliability and data driven analysis for marine machinery maintenance planning and decision making. Machines 2024, 12, 294. [Google Scholar] [CrossRef]
  11. Wang, Z.; Liao, P.; Long, F.; Wang, Z.; Han, F. Coordinated optimization of multi-energy systems in sustainable ships: Synergizing power-to-gas, carbon capture, hydrogen blending, and carbon trading mechanisms. Int. J. Hydrogen Energy 2025, 165, 150755. [Google Scholar] [CrossRef]
  12. Wang, Z.; Mu, X.; Ma, Y.; Liao, P.; Ji, Y.; Han, F. Advanced energy management and optimal scheduling for integrated offshore gas-hydrogen-electricity-heat systems. Energy 2025, 319, 135091. [Google Scholar] [CrossRef]
  13. Durukan, O.; Akyuz, E.; Destanoğlu, O.; Arslanoğlu, Y.; Sezer, S.I. Quantitive HAZOP and DS evidence theory-fault tree analysis approach to predict fire and explosion risk in inert gas system on-board tanker ship. Ocean. Eng. 2024, 308, 118274. [Google Scholar] [CrossRef]
  14. Yigin, B.; Celik, M. A prescriptive model for failure analysis in ship machinery monitoring using Generative Adversarial Networks. J. Mar. Sci. Eng. 2024, 12, 493. [Google Scholar] [CrossRef]
  15. Xiong, Z.; Yuan, Y.; Tong, L.; Li, X.; Shen, B. Dynamic performance analysis of proton exchange membrane fuel cell in marine applications. Energy 2024, 310, 133218. [Google Scholar] [CrossRef]
  16. Inal, O.B.; Zincir, B.; Dere, C.; Charpentier, J.-F. Hydrogen Fuel Cell as an Electric Generator: A Case Study for a General Cargo Ship. J. Mar. Sci. Eng. 2024, 12, 432. [Google Scholar] [CrossRef]
  17. Di Bernardo, R.; Di Cecca, B.; Coppola, T.; Spazzafumo, G.; Speranza, D. Preliminary design of a 75 m Mega Yacht with diesel-Electric hybrid propulsion powered with hydrogen FCs. Int. J. Hydrogen Energy 2025, 137, 917–924. [Google Scholar] [CrossRef]
  18. Zou, L.; Li, B.; Han, B.; Liu, Y.; Wang, X.; Bi, M.; Shu, C.M. Release of high-pressure hydrogen from type III tank in a fire scenario:Analysis and prediction of jet flame length and thermal response characteristics. Fuel 2024, 372, 132153. [Google Scholar] [CrossRef]
  19. Sazelee, N.; Ismail, M. Recent advances in catalyst enhanced LiAlH4 for solidstate hydrogen storage:a review. Int. J. Hydrogen Energy 2021, 46, 9123–9141. [Google Scholar] [CrossRef]
  20. Huo, Y.Z. Hydrogen Energy Commercial Vehicle Boom: Automotive-Grade Methanol Reforming Hydrogen Production Power System Technology. Commer. Veh. 2022, 6, 80–82. [Google Scholar]
  21. Yu, G.Y. A Study on the Energy Management Strategy of Shipboard Hybrid Power Systems Based on MATLAB/Simulink. Intern. Combust. Engine Accessories 2021, 20, 21–22. [Google Scholar]
  22. Cheng, P.; Pan, T.; Li, R.; Liang, N. Research on optimal matching of renewable energy power generation system and ship power system. IET Renew. Power Gener. 2022, 16, 1649–1660. [Google Scholar] [CrossRef]
  23. Dong, Y.; Han, Z.; Li, C.; Ma, S.; Ma, Z. Research on the optimal planning method of hydrogen-storage units in wind–hydrogen energy system considering hydrogen energy source. Energy Rep. 2023, 9, 1258–1264. [Google Scholar] [CrossRef]
  24. Karatuğ, Ç.; Tadros, M.; Ventura, M.; Soares, C.G. Strategy for ship energy efficiency based on optimization model and data-driven approach. Ocean. Eng. 2023, 279, 114397. [Google Scholar] [CrossRef]
  25. Park, I.-C.; Seo, B.-C.; Lee, S.-H.; Park, J.-H.; Seo, H.-S. A study on slamming impact load characteristics of energy storage system case for ships. J. Mar. Sci. Eng. 2022, 11, 44. [Google Scholar] [CrossRef]
  26. Jina, C.; Hayeon, K.; Ron, L.; Elangovan, D.; John, V. Fuzzy Analytical Hierarchy Process-based Risk Priority Number Approach in Failure Modes and Effects Analysis for Magnetic Resonance Imaging-guided High-dose-rate Brachytherapy for Gynecologic Cancer. Adv. Radiat. Oncol. 2025, 10, 101731. [Google Scholar]
  27. Rabie, K.; Khaled, L.; Laid, G. A Multi-criteria Weighted Risk Priority Number Model for Evaluating Failure Modes and Effects: A Case Study. J. Fail. Anal. Prev. 2025, 25, 895–905. [Google Scholar] [CrossRef]
  28. Wang, G.; Ding, S.; Yang, X.; Huang, S.; Zhou, G.; Liu, L.; Li, H.; Jia, L.; Diao, W.; Sun, Y.; et al. Risk assessment and quality management in AIO based on CT-linac for nasopharyngeal carcinoma: An improved FMEA and FTA approach. Med. Phys. 2025, 52, 2425–2437. [Google Scholar] [CrossRef]
  29. Feng, L.; Laibin, Z.; Shaohua, D.; Lushuai, X.; Hang, Z.; Lin, C. Risk Assessment of Bolt-Gasket-flange Connection (BGFC) Failures at Hydrogen Transfer Stations Based on Improved FMEA. Int. J. Hydrogen Energy 2024, 50, 700–716. [Google Scholar]
  30. Cao, M.; Wang, L.W.; Chen, B. A Review of the Assessment of the Technical Condition of Marine Power Systems. Ship Electr. Eng. Technol. 2022, 42, 34–36. [Google Scholar]
  31. Zheng, N.; Ding, X.; Zhou, Y.; Zhang, H.; Duan, L.; Zhang, M. Dynamic modeling and response characteristics of a solar-driven polygeneration system coupled with hydrogen and thermal energy storage. Energy Convers. Manag. 2023, 293, 117496. [Google Scholar] [CrossRef]
  32. Luo, X.; He, H.; Zhang, X.; Ma, Y.; Bai, X. Failure mode analysis of intelligent ship positioning system considering correlations based on fixed-Weight FMECA. Processes 2022, 10, 2677. [Google Scholar] [CrossRef]
  33. Wang, Z.; Tang, H.; Wu, Z.; Ji, Y.; Han, F. Evaluating fuel cell power systems for coastal and inland waterway vessels: Technical and economic perspectives. Energy Convers. Manag. 2025, 323, 119200. [Google Scholar] [CrossRef]
  34. Tang, H.; Wang, Z.; Li, J.; Li, S.; Ji, Y.; Han, F. Cross-scale modeling and 6E analysis of a cold storage Rankine-Carnot battery and PEMFC coupled system for liquid hydrogen maritime transportation. Energy 2025, 319, 134987. [Google Scholar] [CrossRef]
  35. Joibary, S.M.M.; Rahgoshay, S.; Rahimi-Esbo, M.; Firouzjaee, K.D. Numerical investigation of the influence of different cooling flow channels on the thermal and water saturation distribution in a real dimensional polymer electrolyte membrane fuel cell. Int. J. Hydrogen Energy 2023, 48, 2762–2787. [Google Scholar] [CrossRef]
  36. Pal, A.; Gupta, M.; Chauhan, S.S.; Pippal, S.K.; Sinha, A.; Kumar, S. Fuel Cell Vehicles: Technology, Challenges & Future Prospects. In Proceedings of the 2025 International Conference on Cognitive Computing in Engineering, Communications, Sciences and Biomedical Health Informatics (IC3ECSBHI), Greater Noida, India, 16–18 January 2025; IEEE: New York, NY, USA, 2025; pp. 420–425. [Google Scholar]
  37. Sebastian, S.; Wijewardane, S.; Srinivasan, S. Recent advances in hydrogen production, storage, and fuel cell Technologies with an emphasis on inventions, innovations, and commercialization. Sol. Compass 2023, 8, 100065. [Google Scholar] [CrossRef]
  38. Balestra, L.; Yang, R.C.; Schjølberg, I.; Utne, I.B. Towards safety barrier analysis of hydrogen powered maritime vessels, ocean engineering. In Proceedings of the ASME 2021 40th International Conference on Ocean, Offshore and Arctic Engineering, Virtual, 21–30 June 2021. [Google Scholar]
  39. Pei, Z.; Kang, Y.; Long, F. Research and development of inland green and smart ship technologies in China. Appl. Sci. 2024, 14, 2316. [Google Scholar] [CrossRef]
  40. Zhang, Z.; Zheng, X.; Cui, D.; Yang, M.; Cheng, M.; Ji, Y. Research Progress of Fuel Cell Technology in Marine Applications: A Review. J. Mar. Sci. Eng. 2025, 13, 721. [Google Scholar] [CrossRef]
  41. Pompodakis, E.E.; Orfanoudakis, G.I.; Katsigiannis, Y.A.; Karapidakis, E.S. Hydrogen production from wave power farms to refuel hydrogen-powered ships in the mediterranean sea. Hydrogen 2024, 5, 494–518. [Google Scholar] [CrossRef]
  42. Sun, X.; Zhang, B.; Zhu, J.; Yao, C. A Hybrid System Approach to Energy Optimization in Gas–Electric Hybrid Powertrains. Sustainability 2025, 17, 8160. [Google Scholar] [CrossRef]
  43. Ceylan, B.O. Marine diesel engine turbocharger fouling phenomenon risk assessment application by using fuzzy FMEA method. Proc. Inst. Mech. Eng. Part M J. Eng. Marit. Environ. 2024, 238, 514–530. [Google Scholar] [CrossRef]
  44. Wang, H.; Liu, S.; Tian, J.; Li, J.; Xiong, Z.; Liu, C.; Zhao, W.; Cui, J. Risk Analysis of Offshore Test Process for Ultra High Temperature and High Pressure Wellhead Equipment System Based on FMECA. Curr. Sci. 2025, 5, 1604–1617. [Google Scholar] [CrossRef]
  45. Chang, K.-H.; Lai, H.-H.; Huang, B.-J. Combining the Fuzzy Analytic Hierarchy Process Method with the Weighted Aggregated Sum Product Assessment Method to Address Internet Platform Selection Problems in an Environment with Incomplete Information. Appl. Sci. 2024, 14, 4390. [Google Scholar] [CrossRef]
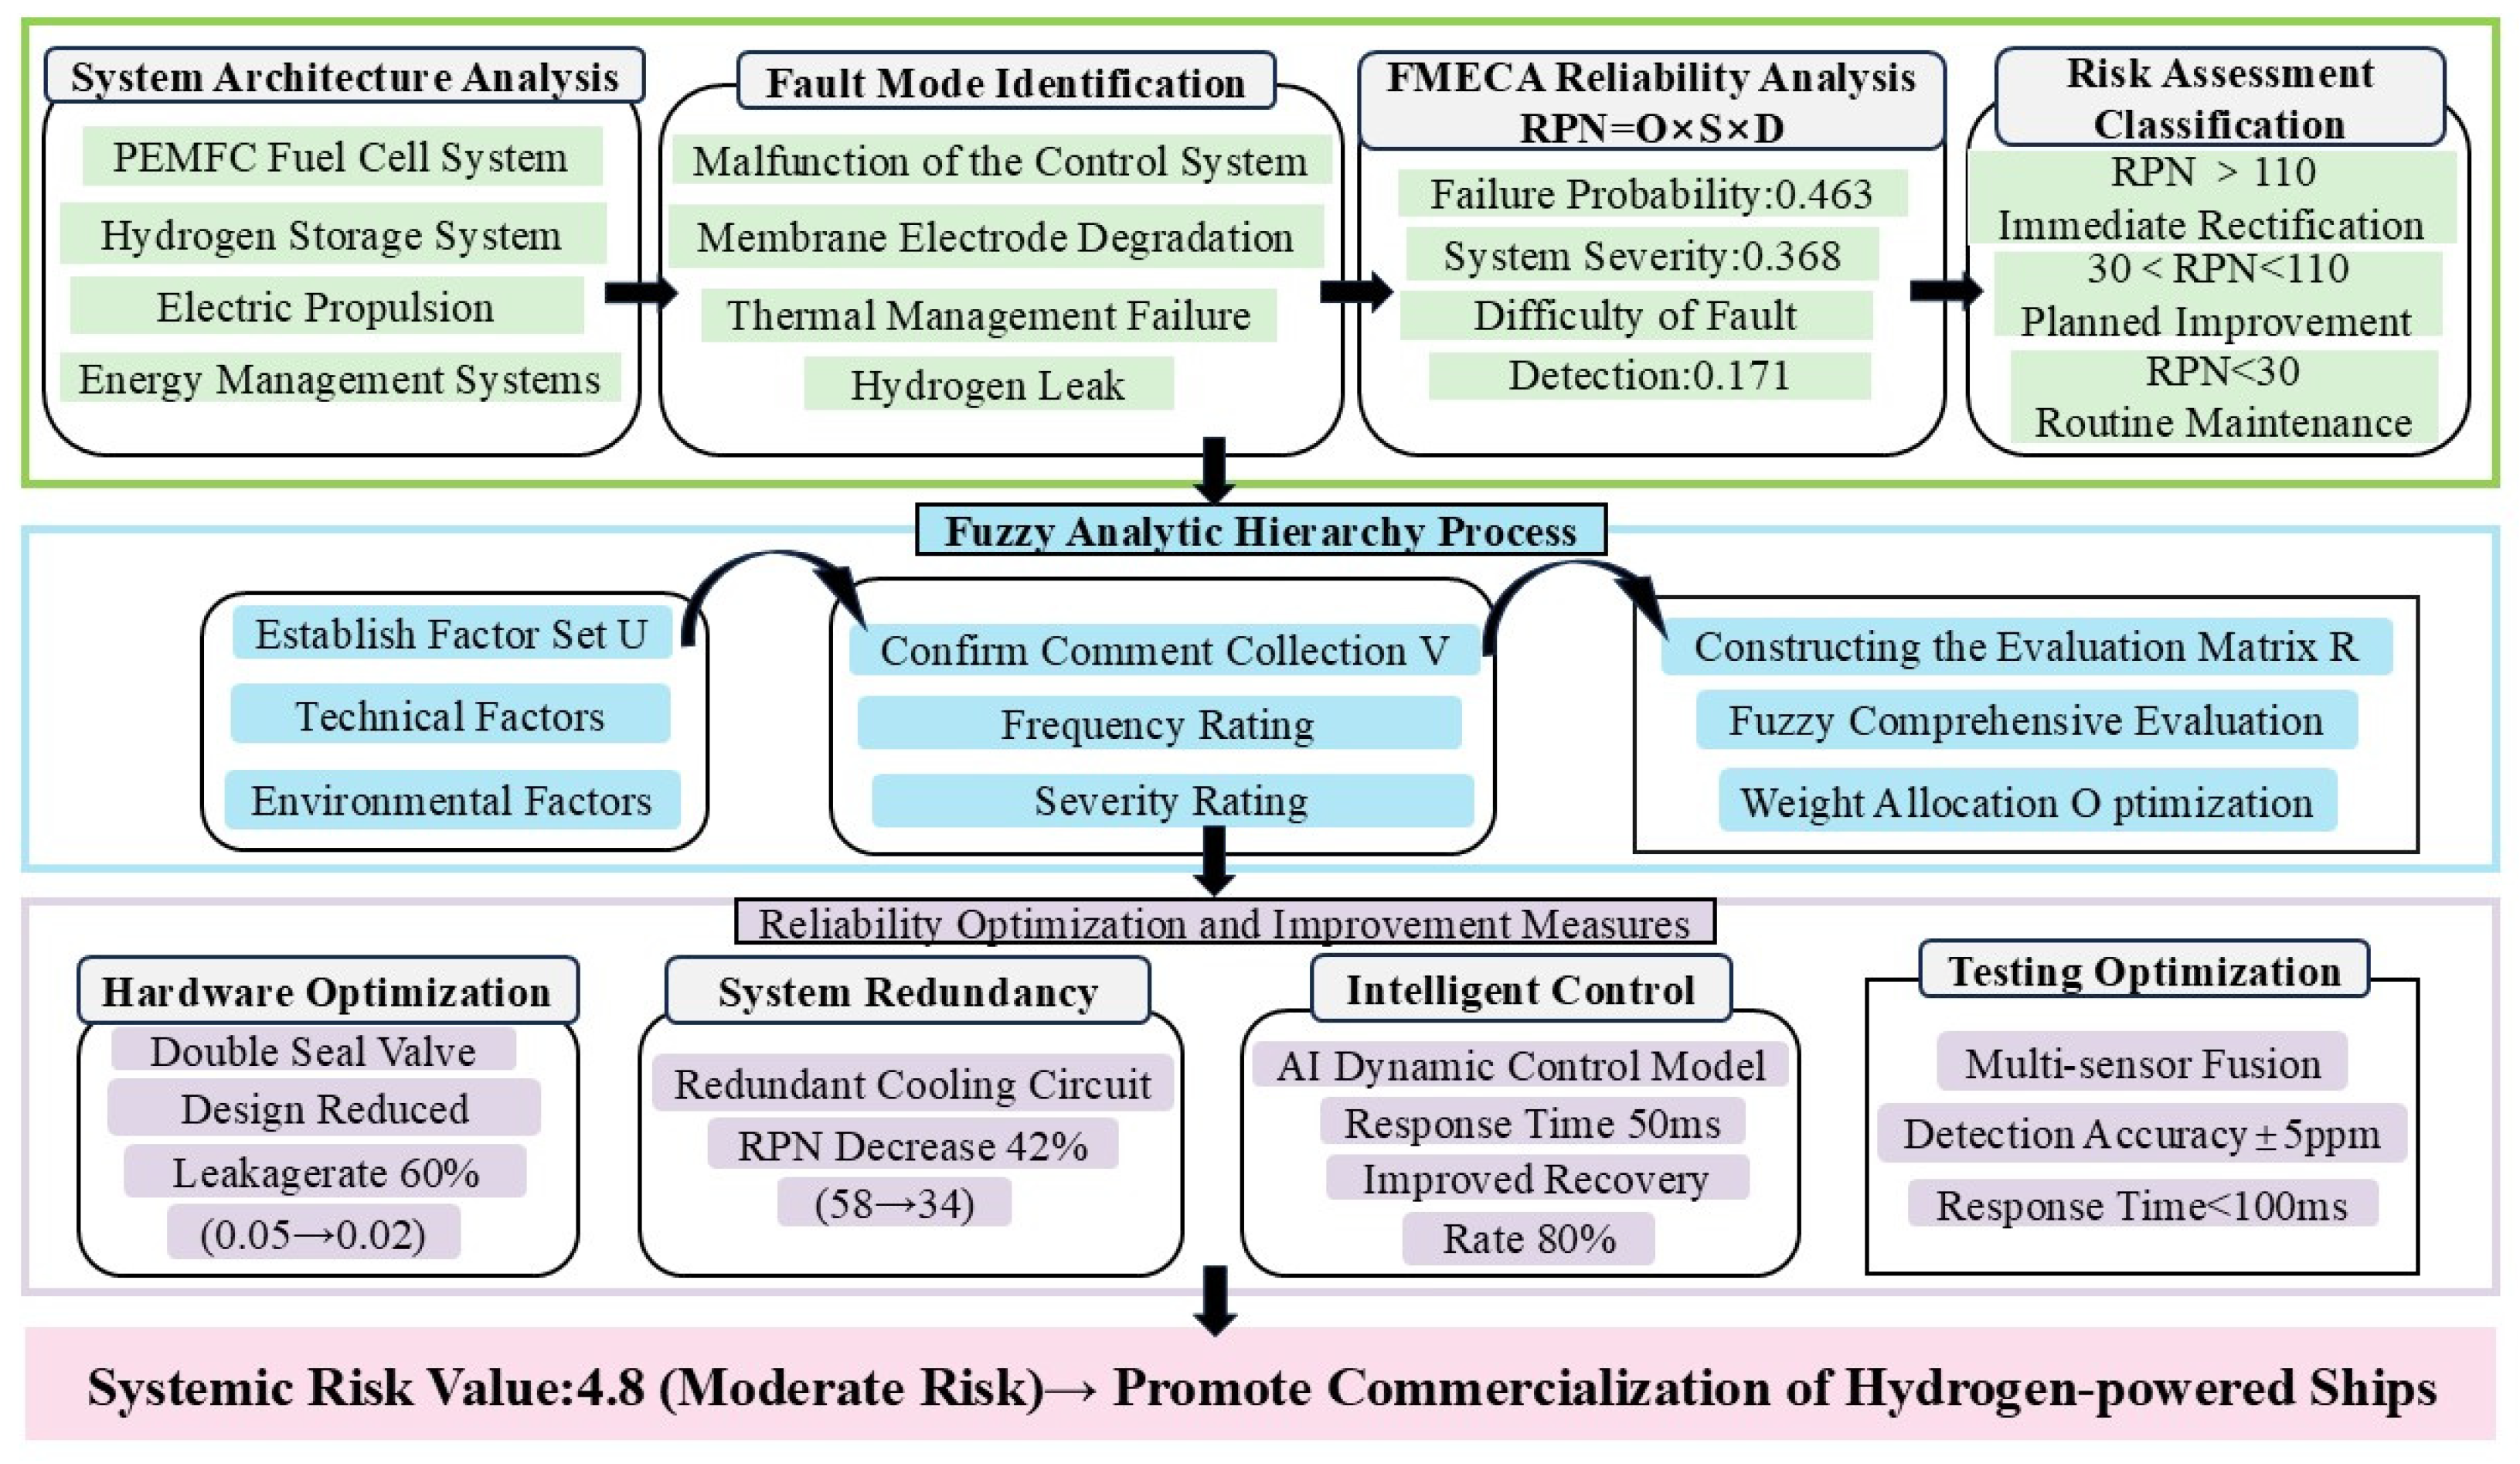
Figure 1. FMECA Technical Flowchart.
Jmse 13 02115 g001
Figure 2. Concept Diagram for Hydrogen-Powered Ship Design.
Jmse 13 02115 g002
Figure 3. Hydrogen-powered propulsion systems.
Jmse 13 02115 g003
Figure 4. Flow Chart of Risk Assessment Method for Hydrogen-Powered Ship Propulsion System.
Jmse 13 02115 g004
Figure 5. This is a figure. (a) Hydrogen Fuel Cell Propulsion System Failure Mode Hazard Matrix; (b) Hydrogen Generator Fault Mode Hazard Matrix; (c) Failure Mode Hazard Matrix of the Variable Frequency Drive System; (d) Transformer System Fault Mode Hazard Matrix; (e) Failure Mode Hazard Matrix of the Variable Frequency Drive System; (f) Hazard Matrix of Fault Modes in the Pod Thruster System; (g) Security System Failure Mode Hazard Matrix.
Jmse 13 02115 g005aJmse 13 02115 g005b
Figure 6. Failure Mode Hazard Matrix.
Jmse 13 02115 g006
Figure 7. Failure Mode Distribution.
Jmse 13 02115 g007
Figure 8. A Comparative Analysis of Multi-Dimensional Performance Characteristics.
Jmse 13 02115 g008
Figure 9. Fuzzy Evaluation Risk Heat Map.
Jmse 13 02115 g009
Figure 10. Fault Evolution Sequence Analysis.
Jmse 13 02115 g010
Figure 11. Weighting of the Influence of Environmental Factors.
Jmse 13 02115 g011
Figure 12. Comparison of RPN values.
Jmse 13 02115 g012
Figure 13. Prediction of the Effectiveness of Improvement Measures.
Jmse 13 02115 g013
Figure 14. Comprehensive Risk Assessment Matrix.
Jmse 13 02115 g014
Table 1. Statistical Analysis of Failure Mode Occurrence Frequencies in Hydrogen Ship Systems.
Fault CategoriesSeverity LevelDetection Methods
Hydrogen LeakageLevel I (Catastrophic)Multipoint sensors combined with thermal imaging
Membrane Electrode
Degradation
Level II (Severe)Impedance spectroscopy paired with polarization curve analysis
Cooling System
Failure
Level III (Moderate)Temperature and flow
monitoring
Control System
Abnormality
Level III (Moderate)Self-diagnosis integrated with
redundant verification
Hydrogen Storage
System Issues
Level II (Severe)Pressure, Temperature, and Strain Monitoring
Power System
Failure
Level III (Moderate)Real-Time Monitoring of Electrical Parameters
Table 2. Failure Mode Occurrence (O) Rating Criteria.
LevelFailure Mode Occurrence ProbabilityReference Probability Value
1Extremely rare
occurrence
The probability of failure is extremely low1/500,000
2Rare occurrenceThe probability of failure is relatively low1/18,000
31/4500
4Occasional
occurrence
The probability of failure is moderate1/1000
51/400
61/80
7Sometimes
occurrence
The probability of failure is high1/40
81/20
9Frequent
occurrence
The probability of failure is extremely high1/8
101/2
Table 3. Failure Mode Severity (S) Rating Criteria.
LevelSeverity of Failure Modes
1Almost no
impact
Faults that do not affect the system’s performance and remain unnoticed by users
2Slight impactFaults that have a slight impact on the system’s functionality may be detected by users and lead to minor complaints
3
4ModerateFaults that cause a degradation in system performance will make users feel discomfort and dissatisfaction
5
6
7SevereMajor faults that interrupt operation or cause failures in comfort-providing subsystems may result in significant user dissatisfaction; however, such faults do not lead to safety consequences nor do they violate governmental regulations
8
9CatastrophicFatal faults that result in loss of life or property damage, or faults that fail to comply with governmental regulations
Table 4. Scoring Criteria for Failure Mode Detection Difficulty (D).
LevelFault Mode Detection Difficulty
1Direct discoveryPotential faults that are very easy to detect
2
3Routine examinationPotential faults that the testing procedure has a high probability of detecting
4
5Certain degree
of difficulty
Potential faults that the testing procedure may detect
6
7Additional
testing
Potential faults that the testing procedure is unlikely to detect
8
9Nearly
undetectable
Potential faults that the testing procedure cannot detect
Table 5. Nine-Point Judgment Scale.
Criteria for JudgmentDefinition
1For F H , A i and A j are of equal importance
3For F H , A i is slightly more important than A j
5For F H , A i is noticeably more important than A j
7For F H , A i is strongly more important than A j
9For   F H , A i is extremely more important than A j
2, 4, 6, 8The level of importance lies between the two adjacent judgment scales mentioned above
Table 6. Standard Priority Evaluation.
Frequency of
Occurrence
Severity
Detection
DifficultyPriority
Frequency of Occurrence-130.463
Severity
Detection
1-20.368
Difficulty1/31/2-0.170
IR = Inconsistency ratio = 0.018
Table 7. Comparison Table of RPN and WRI.
Comparison DimensionWRIRPN
Weight allocationBased on FAHP and expert experience, considering the characteristics of hydrogen-powered ships, the weights are uneven.Default weights are equal, without considering the system’s specifics.
Data Processing0–1 standardization to eliminate the problem of uneven intervals between ordinal scales, making the data continuous and comparable.1–10 ordinal scale, intervals have no physical meaning, data are discrete
Coupling AdapterQuantifiable comprehensive risk of multi-field coupled failures, adapted to the characteristics of hydrogen-powered systemsUnable to reflect the interdependence of parameters, only suitable for simple systems
Practical verificationConsistent with actual ship failure data and laboratory test results, the risk ranking is accurate.Prone to ‘domination by extreme values,’ leading to distorted risk ranking
Table 8. Data Analysis Table.
System ModuleFailure
Modes
Failure
Frequency
SeverityDetection
Difficulty
RPN
Value
Risk LevelImprovement
Suggestions
PEMFC Sytem—CCMembrane Electrode Degradation0.1230.2440.50915.3Low RiskRegularly replace the membrane electrodes and optimize the catalyst layer
PEMFC
Sytem—CV2
Insufficient Oxygen Supply0.6000.0100.4052.4Low RiskEnhance oxygen flow monitoring and optimize the gas supply pipeline
PEMFC
Sytem—CV4
Normal Aging0.2540.1090.3098.6Low RiskEstablish a preventive maintenance plan
PEMFC Sytem—SPNormal aging0.4110.0100.3061.3Low RiskRoutine maintenance is sufficient
Table 9. Risk Level Analysis Based on Fuzzy Comprehensive Evaluation.
Test TypeRisk LevelRisk IndexHighest
Membership
Degree
Weight Type
Comprehensive
Evaluation
CCLow20.371StandardThe system operates stably, and the membrane electrodes require periodic inspection
CV1Extremely low10.682StandardThe system exhibits excellent performance
CV2Extremely low10.395AdjustmentAttention should be given to the stability of the hydrogen supply
CV3Extremely low10.682StandardThe system exhibits excellent performance
CV4Low20.439StandardThe system operates normally
CPExtremely low10.681StandardThe system exhibits excellent performance
SPExtremely low10.410StandardThe system operates stably
SPRExtremely low10.682StandardThe system exhibits excellent performance
Table 10. Weight Allocation and Correction Coefficient for Environmental Factors.
Environmental
Factors
Correction
Factor
WeightWeighted
Contribution
Temperature
Range
1.30.250.325
Humidity
Variation
1.20.200.240
Vibration Intensity1.50.250.375
Salt Spray1.40.200.280
Corrosion Load
Fluctuation
1.30.100.130
Correction Factor 1.35
Table 11. A comparative analysis with previous research.
Comparison
Dimension
This StudyPast ResearchDifferences and
Advantages
Research System
Boundaries
Hydrogen storage-PEMFC-Propulsion motor-Full energy management chainSingle subsystemIdentify the cascade failure chain: Hydrogen supply deficiency→PEMFC voltage fluctuation→Inverter overload
Risk Assessment MethodFAHP weight + marine environmental correctionTraditional FMECA (without environmental correction)Resolving weight ambiguity issues
Output of Improvement
Measures
Quantify the effectQualitative recommendationsProvide actionable metrics for project implementation
Disclaimer/Publisher’s Note: The statements, opinions and data contained in all publications are solely those of the individual author(s) and contributor(s) and not of MDPI and/or the editor(s). MDPI and/or the editor(s) disclaim responsibility for any injury to people or property resulting from any ideas, methods, instructions or products referred to in the content.