Abstract
Analysis of NMR data reported for constituents found in the invasive soft coral Carijoa (Telesto) riisei has been used to develop a model that can identify punaglandins in C. riisei extracts. Principal component analysis of 1H and 13C NMR data showed that the model can be used to identify the presence of various subclasses of punaglandins that possess different oxidations states of the cyclopentane ring. The application of this model through analysis of covariant HMBC data obtained from dichloromethane extracts showed that C. riisei has significant variability in punaglandin concentration, with many colonies being completely devoid of punaglandins. To verify the identity of compounds predicted by the model, purification of an extract obtained from C. riisei collected from an artificial reef in southeast Queensland led to the isolation of one new compound, 7Z-punaglandin 4-epoxide (1), a series of known punaglandins (2–6), and the known pregnanes 7–9. The absolute configurations of 7Z-punaglandin 4 epoxide (1), punaglandin 6 (4), and carijenone (6) were determined for the first time by comparison of experimental and TDDFT calculated ECD data. All the isolated punaglandins reported herein were predicted to be present using the NMR fingerprint model.
1. Introduction
The discovery of new marine natural products (MNPs) has been an important contributor to the discovery and documentation of marine invertebrate biodiversity and their associated chemical diversity. This is largely due to the potential of marine invertebrates as sources of novel therapeutics [1]. As a result, approximately 43,318 marine-derived compounds have been discovered and catalogued in the MarinLit database [2]. Traditional natural products research often relies on time-consuming workflows, where compounds are purified and isolated prior to structural elucidation. However, when target compounds occur at low concentrations or are inconsistently present across samples, such approaches can also be inefficient. With an increasing number of marine-derived compounds, there is a need for rapid analytical tools capable of assessing chemical structures directly within complex mixtures. These tools can save significant time and resources, particularly when targeted isolation leads only to the rediscovery of known compounds [3]. Furthermore, the ability to identify specific known compounds or compound classes within complex mixtures can provide valuable insights into chemical ecological interactions, such as allelopathy or chemical defences [4,5], and can also support taxonomic investigations by serving as chemotaxonomic markers that help differentiate closely related species [6,7,8,9,10].
Dereplication methods involve identifying known compounds in crude extracts or semi-pure fractions to streamline the isolation workflow by focusing on unknowns [11,12]. Marine organisms often possess complex metabolomes with many thousands of structurally diverse compounds in varying concentrations, which make them challenging to work with when using dereplication methods. Dereplication strategies usually involve Mass spectrometry (MS) or Nuclear Magnetic Resonance (NMR) Spectroscopy or a combination of both. MS primarily provides molecular weight (MW) and fragmentation patters (MS/MS) and can detect a wide range of compounds with high sensitivity. However, MS workflows typically require extensive interpretation that often fails to distinguish structural variants and confirm the structure of compounds [13]. Additionally, MS dereplication relies on the availability and quality of MS2 data in databases, which can be limited, while the few publicly available MNP databases do not always contain MS2 data and will as such often return many false positives. In contrast, NMR spectroscopy is a powerful and informative technique for elucidating molecular structures, particularly where detailed connectivity and functional group information is essential for resolving isomeric or closely related compounds [13]. Furthermore, multidimensional experiments may tease apart correlations between 1H and 13C resonances, even in overlapping or unresolved mixtures [13]. NMR may also facilitate the identification of the structural class a putative new compound belongs to directly from small amounts of an extract [14,15,16]. For this reason, NMR is essential for dereplication of compounds with high confidence in the results.
A rapid and inexpensive tool using diagnostic 1H and 13C NMR data to identify compounds in complex mixtures was developed by Baxter et al. [14], who used this approach to successfully revise the structures of several phloroglucinol compounds and detect them in Myrtaceae plants. Moreover, in a subsequent study, this tool was applied to correct the structures of two formyl phloroglucinols that had been previously misassigned [17]. The method maps NMR fingerprints through principal component analysis (PCA) using literature-derived data, enabling the evaluation of structures and prediction of compounds and subclasses in complex mixtures. In the same study, analysis of covariance of HMBC spectra further aided in identifying and grouping structurally related molecules in mixtures. The main challenge when using NMR as a dereplication tool is the ability to distinguish resonances that are associated with one compound from those associated with another compound. Covariance NMR methods can be used to aid in this process; for example, covariance HMBC can be used to construct a matrix using 1H and 13C NMR that have common HMBC correlations. However, for this method to work effectively, the chemical shift of 13C NMR must be distinct and not shared with other compounds present in the mixture [14]. When these key conditions are met, covariance NMR analysis becomes an effective tool for linking 1H and 13C signals within the same compound, increasing confidence in identification. The NMR fingerprint method [14] incorporates predictive spectroscopic interpretation early in the discovery workflow, helping researchers to prioritise both sample selection and target compounds, while also informing choices related to downstream purification.
The soft coral Carijoa (Telesto) riisei (Duchassaing & Michelotti, 1860) [18] (subclass Octocorallia, family Clavulariidae) has a pantropical distribution and has been reported from natural and artificial reefs (AR) in the Hawai’ian Islands [19,20], the Caribbean Sea [21], the Tropical Easters Pacific (TEP) [22,23,24,25,26], the Indian Ocean [27,28,29], the Pacific Ocean [30], and more recently the Mediterranean Sea [31]. Its rapid spread and influence on the distribution and abundance of species have garnered attention, both negative and positive. In Hawai’i, Carijoa riisei (C. riisei) has caused the mortality of black corals through overgrowth resulting in economic and ecological implications [32,33]. As such, in some geographic locations it has been labelled an invasive species; however, some argue that this status might have been assigned too hastily. C. riisei has been reported as a biomultiplier on reefs [34] and it has been suggested that it might be a native species recolonising its historical range [35]. The last hypothesis stems from a study that revealed that the Hawai’ian population was not an Atlantic invader, as assumed previously, but is of Indo-Pacific origin [36]. However, despite these insights, a key taxonomic question remains unresolved—whether the genetically distinct lineages of C. riisei represent separate species or are simply divergent populations of C. riisei [31,36,37]. But no matter the status or origin, C. riisei has a significant impact on species and the environment and its competitive characteristics make it an important organism to study, not only for understanding its ecological impact but also for exploring potential biomedical applications. Research into NPs produced by species within the genus Carijoa has uncovered a wide range of bioactive compounds, including pregnane steroids [38,39,40,41,42,43,44,45,46] and chlorinated prostanoids called punaglandins [47].
Halogenated prostanoids are a unique class of bioactive compounds derived primarily from marine organisms such as soft corals, particularly within the genus Clavularia and Carijoa (Telesto). These compounds are structurally related to prostaglandins but feature halogen atoms, including bromine, iodine, and chlorine (Figure 1), introduced through halogenation of polyunsaturated fatty acid precursors. Among them, punaglandins, which represent a distinct subclass of chlorinated prostanoids, have attracted attention for their anti-inflammatory (U.S. Patent No. 4612330) [48] and antitumour activities [49]. Findings suggest that the chlorinated cyclopentenone structure enhances bioactivity to potencies 15-fold more than non-halogenated prostanoids like the clavulones [47,49,50,51]. Punaglandins were first isolated from C. riisei in the early 1980s [47] and later in the 1990s [48], and are often polyhydroxylated, polyacetylated, or contain multiple double bonds, with one bicyclic punaglandin, carijenone [52], and featuring two fused rings.
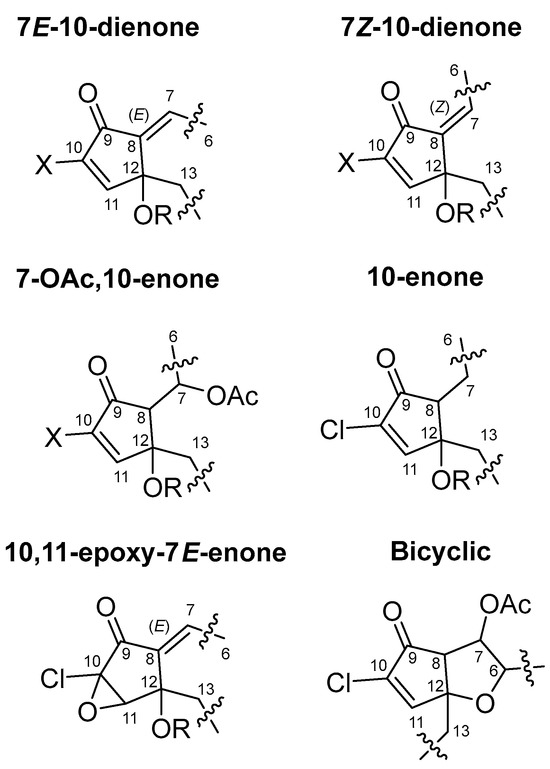
Figure 1.
Partial structures grouped into structure classes of previously isolated halogenated prostanoids; punaglandins, chlorovulones, bromovulones, and iodovulones.
Studying punaglandins presents several challenges: they are not consistently present across all sample collections, as described in ref. [48], often occur at low natural abundance, and exhibit poor MS ionisation efficiency. The presence of multiple acetate groups along the alkyl side chain further reduces ionisation efficiency by suppressing proton affinity, thereby diminishing protonation during MS analysis and complicating conventional MS-guided dereplication. In this context, predictive approaches incorporating NMR data may provide a more reliable means of detecting punaglandins. The development of targeted NMR methods would therefore enable more focused and efficient identification of these compounds within complex mixtures.
In Australia, C. riisei has been reported in abundance on artificial reefs (AR) across the country, from the Northern Territory to Busselton Jetty in southern Western Australia, extending along the southern and eastern coastline into New South Wales [36,53]. Over the past decade, we have increasingly observed it in southeast Queensland; although this has not yet been formally recognised, it has been mentioned in several theses [54,55] and in the Wild Guide to Moreton Bay [56]. Research focusing on the ecological impacts of C. riisei on Australian reefs is lacking and while the soft coral has not yet been classified as a significant invasive threat in Australia [53], monitoring its distribution is crucial due to its highly competitive nature. Information obtained from 1D and 2D NMR data could offer an alternative approach to determine the presence of punaglandins based on their specific NMR fingerprints and this could provide early insights into whether these compounds are likely to occur in an extract. This analytical analysis could allow for better surveillance of newly established C. riisei colonies on natural and artificial reefs where a colony’s virulence may be linked to the presence of specific NP constituents. Subclass predictions could also help prioritise extracts for downstream purification and bioactivity studies. As a result, a predictive NMR method has the potential to streamline the workflow for discovering and characterising punaglandins, reducing time and resources while enhancing the chances of successful identification. This study therefore aimed to develop an NMR-based prediction method to detect punaglandins and predict their structural subclasses in extracts of C. riisei. Collections from multiple locations across southeast Queensland were used to validate the effectiveness of the predictive model. We further anticipated that this approach could be used to monitor the NP profiles of C. riisei collected from different locations and that this could then be used in future to monitor the coral’s invasive potential.
2. Materials and Methods
General Experimental Procedures. UV spectra were measured using a Shimadzu UV-1800 UV spectrophotometer (Kyoto, Japan). Optical rotations were acquired on a JASCO P1020 polarimeter (Kingsgrove, NSW, Australia) with [α]D values given in 10−1 deg cm2 g −1. ECD spectra were recorded on a JASCO J-1500 CD spectrophotometer (JASCO, Tokyo, Japan). IR spectra were measured using a Thermo Scientific Nicolet iS5 iD5 ATR spectrometer (Parkville, Victoria, Australia). Nuclear Magnetic Resonance (NMR) spectra were recorded at 25 °C on a Bruker Avance III 500 MHz spectrometer (BBFO Smartprobe, 5 mm 31P-109Ag) and a Bruker BioSpin GmbH 800 MHz spectrometer with a triple (TCl) resonance 5 mm cryoprobe (all Bruker equipment from Bruker Pty Ltd., Preston, Victoria, Australia). NMR solvents DMSO-d6; referenced to δH 2.50 and δC 39.52, and CDCl3; referenced to δH 7.26 and δC 77.16, were sourced from Cambridge Isotopes (Cambridge isotope Laboratory, Inc., Heidelburg West, Victoria, Australia). High resolution ESI-TOF data were recorded on an Agilent 6530-accurate mass Q-TOF LC/MS mass spectrometer with a 1200 Series autosampler and 1290 Infinity HPLC (Agilent Technologies, Mulgrave, Victoria, Australia) and a Waters Xevo G3 QTOF MS equipped with an affinity FTN sample manger and an affinity quaternary solvent manager and using a Acquity Premier HSS T3 1.8 µm 2.1 × 100 mm column (Milford, MA, USA). The solvents used for chromatography were Scharlau HPLC grade, and H2O was Millipore Milli-QPF filtered (Bayswater, Victoria, Australia). All solvents used for HRESIMS were MS grade. A Merck Hitachi L7100 pump and a L7455 PDA detector were used for HPLC (Bayswater, Victoria, Australia). Preparative HPLC columns used included a Thermo Betasil C18 5 µm, 100 Å, 150 mm × 21.2 mm (Thermo Fisher Scientific Inc., Waltham, MA, USA), and a YMC diol-bonded HPLC column (150 mm × 20 mm) (YMC Co. Ltd. Kokufudai, Komatsu City, Ishikawa Pref. Japan). All solvents used for chromatography and MS were HPLC grade and H2O was Millipore Milli-Q PF filtered. Trifluoroacetic acid (TFA) was spectroscopy grade from Alfa Aesar (Bayswater, Victoria, Australia). RP SPE cartridges were sourced from Phenomenex (Lane Cove West, New South Wales, Australia).
Material. Samples of C. riisei were collected via SCUBA from three artificial reef sites within Moreton Bay and two artificial reef sites within the Great Sandy Marine Park, Hervey Bay, Southeast Queensland, Australia. The samples were freeze-dried and stored at room temperature until extractions. The samples were taxonomically identified by Dr. Merrick Ekins from the Queensland Museum and taxonomic identification of the coral samples was further supported by chemotaxonomic analysis using LCMS, HPLC, and NMR.
Extraction and Isolation. The freeze-dried samples of C. riisei were exhaustively extracted with CH2Cl2 to yield crude extracts. The crude extracts were allocated into preliminary analysis using RP SPE and isolation and elucidation using HPLC. RP SPE was performed using C18 silica gel disposable syringe barrel cartridges. Prior to use, the silica gel cartridge was pre-conditioned with 6 mL of 100% MeOH, followed by 50% MeOH/50% H2O. After loading the extract onto the cartridge, it was conditioned again with 50% MeOH/50% H2O. The elution conditions were 80% MeOH/20% H2O and then washed with 100% MeOH.
For the HPLC, the extract (1.68 g, North Stradbroke AR) was absorbed to C18 silica gel and loaded into a refillable guard column (10 mm × 20 mm) and subjected to RP HPLC using a Betasil C18 bonded silica HPLC column (21 mm × 150 mm) eluting a solvent gradient from 30% MeOH/70% H2O to 100% MeOH over 70 min at a flow rate of 9 mL/min with fractions collected each minute. The column was then further eluted with 100% MeOH for 10 min. A total of 68 fractions were collected at one min intervals. Fractional 1H NMR analysis found fraction 46 contained pregna-1,4,20-trien-3-one (7), while fractions 36–44 were recombined (90.0 mg). The recombined fractions 36–44 were injected (100 μL in CH2Cl2) onto a preparative YMC diol-bonded silica HPLC column (21 mm × 150 mm) for NP HPLC eluting from 100% n-hexane to 100% CH2Cl2 to 90% CH2Cl2/10% MeOH over 80 min at a flow rate of 9 mL/min. A total of 80 fractions were collected at one min intervals with fraction 34 affording 7Z-punaglandin 4-epoxide (1), while fractions 20, 25, 29, 36, and 39 contained punaglandin 8 (5), carijenone (6), 7E-punaglandin 3-epoxide (2), punaglandin 6 (4), and 7Z-punaglandin 4 (3), respectively. Finally, fraction 23 and 35 yielded the known steroids 18-acetyl-18-hydroxymethyl-1,4,20-pregnatrien-3-one (8) and (5α,14α,17β)-pregna-1,20-dien-3-one (9).
7Z-pungalandin 4-epoxide 1: white colourless oil; [α] +24.9 (c 0.13, MeOH); UV/ vis λmax MeOH (log ε) 269.00 (5.71) nm; ECD (c 0.18 mM, MeOH) λext nm (Δε) 364 (0.0), 258 (−8.0), 227 (−4.4), 210 (−7.4), 204 (0.0); 1H and 13C NMR data, (see later); (+) HRMS [M+Na]+ m/z 537.1865 (calcd for C25H3535ClO9Na+ 537.1862) and 539.1845 (calcd for C25H3537ClO9Na+ 539.1832).
7E-punaglandin 3-epoxide 2: [α] +15.2 (c 0.13, MeOH); Lit.: [α]D +16 (c 3.0, MeOH) [48]; ECD (c 0.17 mM, MeOH) λext nm (Δε) 278 (0.0), 258 (3.0), 249 (0.0), 225 (−22.7); 1H data, Table S1, (+) HRMS [M+Na]+ m/z 535.171 and 537.1681 (calcd for C25H3337ClO9Na+ 537.1676).
7Z-punaglandin 4 3: [α] +29.9 (c 0.08, CHCl3); Lit. [α]D +73 (c 0.39, CHCl3) [57]; ECD (c 0.21 mM, MeOH) λext nm (Δε) 344 (8.4), 289 (0.0), 258 (−13.2), 239 (0.0), 228 (6.3), 218 (0.0), 209 (−5.4), 203 (0.0); 1H data, Table S1; (+) HRMS [M+Na]+ m/z 521.192 and 523.1896 (calcd for C25H3537ClO8Na+ 523.1883).
Punaglandin 6 4: [α] +13 (c 0.1, CHCl3); Lit. [α]D +14 (c 0.9 CHCl3) [48]; ECD (c 0.20 mM, MeOH) λext nm (Δε) 316 (4.5), 256 (0.0), 232 (−20.0), 209 (0.0); 1H data, Table S1; (+) HRMS [M+Na]+ m/z 523.2075 (calcd for C25H3735ClO8Na+ 523.2069) and 525.2036 (calcd for C25H3737ClO8Na+ 523.2040).
Punaglandin 8 5: [α] +24.2 (c 0.11, CHCl3); Lit. [α]D +45 (c 0.04, CHCl3) [48]; ECD (c 0.21 mM, MeOH) λext nm (Δε) 301 (8.5), 261 (0.0), 246 (−9.8), 234 (0.0); 1H and 13C NMR data, Table S1; (+) HRMS [M+Na]+ m/z 463.1873 (calcd for C23H3335ClO6Na+ 463.1858) and 465.1847 (calcd for C23H3337ClO6Na+ 463.1828).
Carijenone 6: [α] +18 (c 0.14, CHCl3); Lit. [α] +22.2 (c 0.1 CHCl3) [52]; ECD (c 0.24 mM, MeOH) λext nm (Δε) 317 (7.4), 265 (0.0), 247 (−6.0), 230 (0.0), 221 (2.8), 203 (0.0); 1H and 13C NMR data, Table S1; (+) HRMS [M+Na]+ m/z 521.1915 (calcd for C25H3535ClO8Na+ 521.1913) and 523.1899 (calcd for C25H3537ClO8Na+ 521.1883).
Visualisation, Statistical, and Principal Component Analysis. 1H and 13C NMR chemical shifts acquired from the literature were visualised and analysed using the open-source software OSIRIS DataWarrior (v6.1.0) [58]. The principal component analysis function was utilised to analyse the 1H and 13C chemical shifts along the cyclopentanone ring for 20 punaglandins published in CDCl3. PCA (PC1 and PC2) was plotted using the function included in the software package.
Covariance Processing of HMBC NMR Data. MestreNova v14.3.1 (Mestrelab Research, Santiago de Compostela, Spain) was used to process 1H/13C HMBC NMR data. The raw data (2048 data points in T2 and 512 increments in T1) were Fourier transformed using sine bell apodization in both dimensions and linear prediction up to 2048 data points in F1. The integrals were peak picked and manually edited before being exported into an excel document for further analysis. The data were transformed into a covariance matrix using three different functions (details in Baxter et al. [14]). After extracting the final coordinates, the final output file was imported and visualised in OSIRIS DataWarrior. Unknowns were annotated by assigning 13C NMR data associated with chemical shifts predicted for the subclass.
Computational methods. Conformer searches for all quantum chemical calculations were performed using the Schrödinger Macromodel software suite (version 10.7), with the Monte Carlo Minimum method (MCMM) molecular mechanics, and the OPLS3. The step count was set so that all low-energy conformers (energy windows < 21.0 kJ/mol for NMR and <16.0 kJ/mol for ECD calculations) were found at least 10 times for accurate conformer representation. For GIAO density functional theory (DFT) NMR calculations, model compound 10-chloro-10, 11-epoxy-cyclopentanone (46) underwent gas-phase geometry optimisation (GO) at the B3LYP/6-31G* level of theory using Gaussian 16 (Revision C.01) [59]. The GO conformer set was filtered for duplicate and high-energy conformers (>3.0 kcal/mol above the energy minimum) after which GIAO DFT 13C NMR chemical shifts were calculated at the mPW1PW91/6−311+G(d,p) level of theory (Tables S2–S4). TDDFT ECD calculations for truncated punaglandins 1a–6a (Figures S1–S7) initiated with sequential DFT geometry optimisation (GO) calculations performed using Gaussian 16 software. The first GO was performed at the B3LYP/6-31g (d) level of theory with D3 empirical dispersion, while the second GO incorporated a higher level of theory using B3LYP/6-311G(d,p) and the polarizable continuum model (PCM)for methanol [60]. Duplicate and high-energy conformers (above 3.0 kcal/mol) were removed from each of the second DFT GO sets (Tables S5–S16), after which electronic transition and rotational strength calculations were performed using the TDDFT method at the CAM-B3LYP/6-311+G(d,p) level of theory with D3 empirical dispersion and the PCM solvent effect for methanol. Boltzmann-weighted UV and ECD spectra were generated using the freely available SpecDis software (version 1.71) [61]. Experimental and TDDFT calculated ECD spectra were matched according to their respective UV spectra and further refined using gaussian band shapes and sigma gamma values (eV). Automation processes were made using modified Python scripts (version 3.13.8) based upon the Willoughby protocol [62] with a Windows 10 PC and Griffith University’s Gowonda HPC cluster were used to carry out all calculations. SpectroIBIS (v1.01) was used to scale NMR shielding tensors, identify duplicate conformers, and to tabulate output data pertaining to conformer energies and coordinates [63].
3. Results
The development of a predictive NMR fingerprint model first required the tabulation of all 1H and 13C NMR data associated with coral derived prostanoids and pregnanes (commonly co-isolated from Carijoa sp.) reported in the literature. We have included 35 halogenated prostanoids (Figures S8–S12) and 8 pregnane steroids (Figure S13),that have both 1H and 13C NMR data acquired in CDCl3 reported in the literature. These data were included in the initial analysis (Tables S16 and S17). Many compounds only had lists of chemical shifts without full assignments to specific atom positions and so the initial cleanup of the data required assigning resonances to specific atoms based upon comparisons with those compounds fully assigned using 2D NMR methods. While generating these data, we found some anomalies in the 13C NMR data reported for 7E punaglandin 3 epoxide (2). Only one (instead of two) non-protonated oxygenated sp3 carbon resonances were reported (C-10 and 12) at δC 93.1, a chemical shift too deshielded to be assigned logically at either of these positions. This led us to suspect that the chemical shift in this resonance was likely a typographical error. To confirm this, we examined the predicted chemical shifts in all carbons for a 10-chloro-10,11-epoxy-cyclopentanone model compound (46) using GIAO DFT NMR methods. The results indicated that C-10 and C-12 should resonate at δC 71.4 and 79.6, respectively (Table S2); values that closely align with a series of natural and semisynthetic chlorinated steroids containing the same epoxycyclopentanone moiety—hocarnoid B, 16-chloro-3β,14β-dihydroxy-15β,16β-epoxyandrost-5-en-17-one, and 16-chloro-15β,16β-epoxy-14β-dihydroxyandrost-5-en-3,17-dione [64]. We therefore used the DFT-predicted 13C chemical shifts for C-10 and C-12 in our downstream NMR data analyses. Preliminary investigation of NMR chemical shift trends and relationships associated with the cyclopentyl ring core was conducted using principal component analysis (PCA) available in the open-source software Osiris DataWarrior (v6.1.0) [58]. The δC and δH NMR data assigned to specific atom positions listed below were used for this analysis (Table 1). These atoms were chosen because our initial analysis indicated that they are sensitive to changes in the chemical environment, leading to chemical shift variation thus providing valuable diagnostic information for punaglandin substructure class classification (Figure 1).

Table 1.
1H and 13C NMR assignments used to investigate the chemical shift trends and relationships of punaglandins. ✓.
Principal component analysis was undertaken using 15 key NMR (6 δH and 9 δC) obtained from 43 compounds (Tables S17 and S18) and visualised using PC1 and PC2 and colour coded based on six halogenated prostanoid and seven pregnane steroid subclasses (Figure 2). Because some chemical shifts in pregnane steroids and punaglandins overlap, we included pregnane steroids in the PCA to verify that the selected chemical shifts could serve as reliable diagnostic features. Given their structural differences, it was unsurprising that pregnane steroids were clearly separated from halogenated prostanoids. Notably, halogenated prostanoids are divided into two distinct groups (Figure 2), with additional separations within each group corresponding to specific structural features (Figure 2).
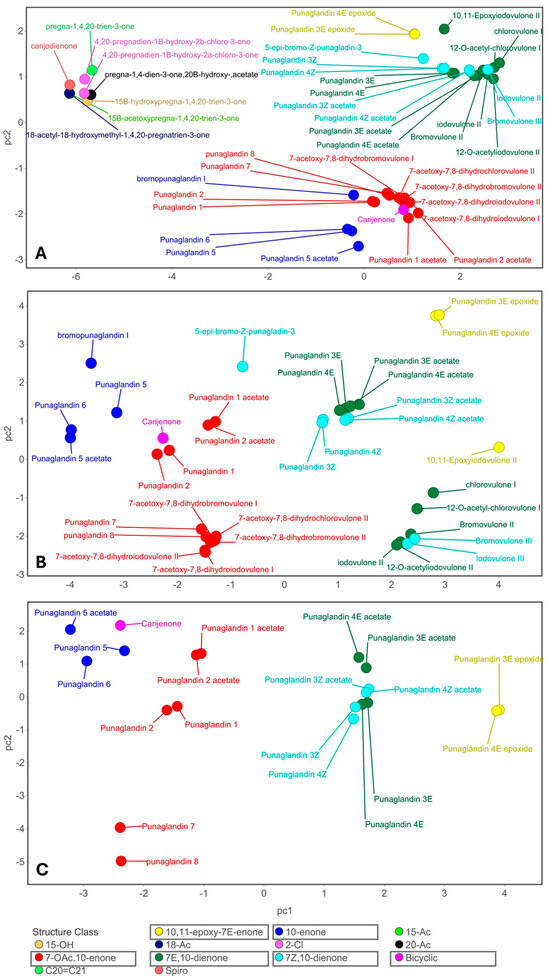
Figure 2.
Principal component analysis (PCA). PC1 plotted against PC2 and visualised using chemical shifts (CDCl3) from reported literature, colour coded based on structure classes; boxes highlight prostanoid subclasses, and shapes are based on stereochemistry. Visualisation of (A) pregnane steroids and halogenated prostanoids (PC1 explains 63.6% and PC2 16.3% of variance), (B) halogenated prostanoids (PC1 explains 40.2% and PC2 24.1% of variance), and (C) punaglandins (PC1 explains 43.8% and PC2 22.0% of variance). For loading plots see Figure S14, and NMR data and structures for all prostanoids and pregnane steroids see Tables S17 and S18 and Figures S8–S13.
Chlorovulones, bromovulones, and iodovulones cluster together while the chlorinated and brominated punaglandins form a separate cluster, indicating that chemical shift differences set the punaglandins apart from other halogenated prostanoids. This is likely due to punaglandins possessing oxygenated methines (C-5 and C-6 or C-7) (Figure 3) which most other halogenated prostanoids lack. In addition, bromine or iodine instead of chlorine substitution at C-10 changes its chemical environment and influences the chemical shifts at and near to this carbon (Table S17). Differences were also observed within the punaglandin subclasses (Figure 2). There are clear trends among subclasses. For instance, although subclass 10-enone share the presence of an alkyl carbon at C-8 with 7-OAc,10-enone, they are separated in the PCA plot. This separation appears to be driven by the loss of ester groups attached to C-5 and C-6. The PCA also successfully discriminated between C-7 E and Z regioisomers since the position of C-6 relative to C-9 and C-12 leads to either shielding or deshielding effects. Trends were also observed in compounds containing additional functional groups, such as an acetate attached to C-12 replacing a hydroxy or an epoxide at C-10–C-11 replacing the double bond. Finally, carijenone is singled out due to its bicyclic ring system. This exploratory phase of the study highlighted that PCA of targeted 1H and 13C NMR data provided a method to detect NMR fingerprints with the potential to predict subclasses of punaglandins from a mixture of similarly structured molecules.
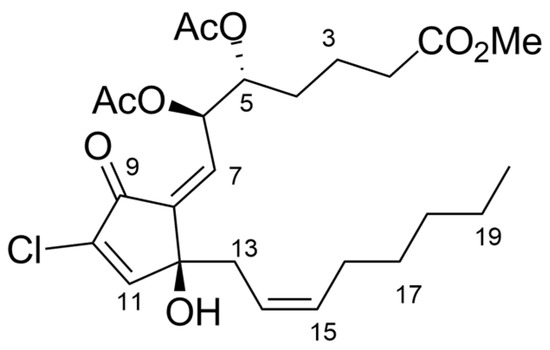
Figure 3.
Full structure of 7Z-punaglandin 4 (3).
The characteristic NMR fingerprints for each punaglandin subclass were visualised with box plots and this allowed us to generate a structure prediction model [14] based on a presence/absence matrix for specific groupings of 1H and 13C resonances assigned to individual compounds in 2D NMR data. The chemical shifts associated with the five-membered ring revealed predictable trends between the punaglandin subclasses. Comparison of 1H and 13C NMR data (Figure 4, Table S17) revealed three substructures classes (bicyclic ring system, 10-enone, and 7-OAc,10-enone) each have an alkyl substituent at H-8/C-8 with chemical shifts ranges between δH 2.6 and δH 3.2 and δC 58.0, δC 52.2–55.1, and δC 52.9–56.9 (C-8), respectively. By contrast, subclasses where C-8 is a non-protonated olefin contained 13C chemical shift ranges between δC 139.9–142.5, and no associated 1H resonance. The presence of a C-7–C-8 double bond can also affect the 13C chemical shift for the carbonyl carbon (C-9).
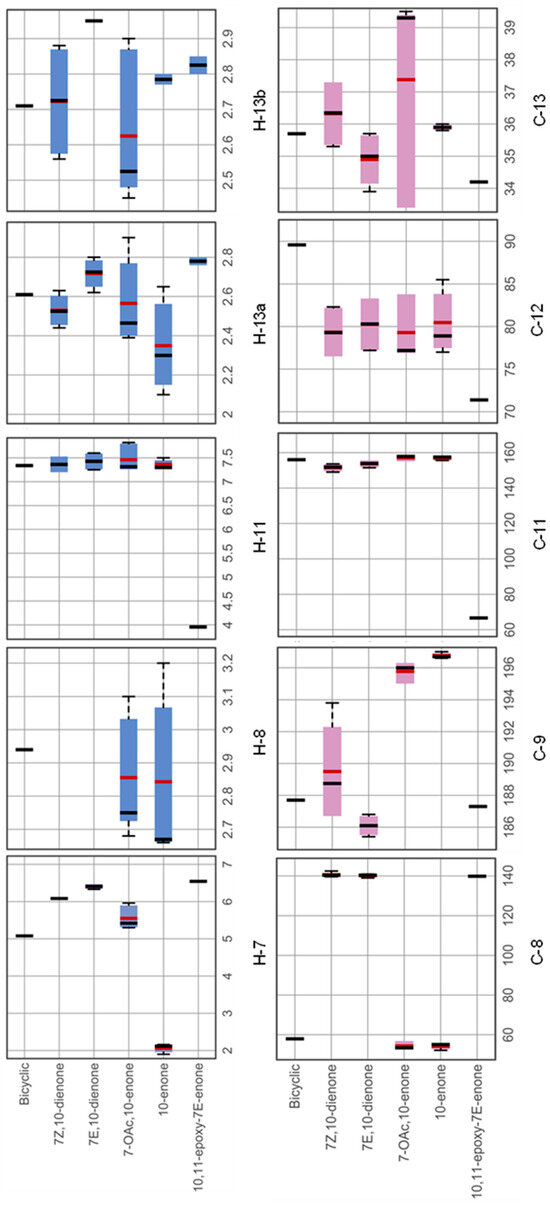
Figure 4.
Ranges of reported 1H and 13C chemical shift trends (box plot 75% percentile with mean (red line) and median (black line) values highlighted) for 6 subclasses of punaglandins.
More shielded resonances for C-9 (δC 185.4–193.8) are associated with compounds possessing a C-7–C-8 double bond while more deshielded resonances for C-9 (δC 195–197) can be assigned to compounds lacking a C-7–C-8 double bond. This is because the C-7–C-8 double bond affects the electron density at the carbonyl carbon. Compounds containing a 10,11-epoxide characteristically have a proton singlet between δH 3.96 and δH 3.98 assigned to H-11 with a carbon resonance between δC 66.5 and δC 66.7 assigned to C-11. Subclasses acetylated at C-12 have a more deshielded resonance for C-12 (between δC 82.3 and 85.5) compared to those that have a hydroxy group attached to C-12 (between δC 71.4 and 77.3). Based on this observation, punaglandins acetylated at C-12 in four of the subclasses were subdivided into separate subclasses (12-acetoxy 10-enone, 12-acetoxy-7E, 10-dienone, 12 acetoxy-7-OAc-10-enone, and 12-acetoxy-7Z,10-dienone) leading to 10 subclasses being used for subsequent analysis. The chemical shift in the methylene protons (H2-13) and carbon (C-13) varies depending on the presence or absence of an olefinic or alkyl carbon (C-8) or the addition of an epoxide at C-10–C-11 or acetate at C-12. Compounds can be divided into two groups based on the substitution at C-8; those where C-8 is an alkyl carbon (bicyclic ring system, 10-enone, and 7-OAc,10-enone subclasses) and those where C-8 is an olefinic carbon (7Z- and 7E,10-dienone subclasses). For the first group, C-13 resonates between δC 39.3 and δC 39.4; however, when an acetate is attached to C-12, C-13 shifts to a more shielded resonance at δC 33.4. In contrast, in the second group C-13 resonates further upfield, ranging between δC 37.3 and δC 35.6. In these subclasses, additional substituents induce further shielding with an acetate at C-12 shifting C-13 to between δC 33.9 and δC 34.2, while an epoxide across C-10–C-11 shifts it to δC 35.3 to δC 35.4. Finally, the bicyclic subclass has a unique feature with a deshielded resonance observed at δC 89.9 for C-12, which is the result of it being an ether carbon.
Chemical shift ranges (or bins) for each carbon (C-5, C-6, C-7, C-8, C-9, C-11, C-12, and C-13) and proton (H5, H6, H-7, H-8, H-11, H-13) resonance within each of 10 subclasses were created based on analysis of the box plots (Figure 4) and NMR data (Table S17). When a subclass contained only one compound, the chemical shift ranges used for the chemical shift bins were set to ±0.02 ppm and ± 0.5 ppm of the reported 1H and 13C chemical shifts, respectively. A match (1)/no match (0) score was assigned to each of the 150 discrete chemical shift bins (15 resonances × 10 subclasses) by fitting published NMR data for each known punaglandin (Table S17). In total, this generated 3000 bins (20 punaglandins × 15 resonances × 10 subclasses) each containing a score of 1 or 0. Tallying chemical shift bin matches for each compound in each subclass and dividing these totals by the total number of resonances (15) generated a probability fit for each punaglandin towards each of the 10 subclasses. Details are described in Baxter et al. [14]. A heat map (Figure 5) shows the precision of this approach since very low cross over matching occurs between subclasses. Together with PCA visualisations, this provides the basis for the identification of compounds from different punglandin subclasses.
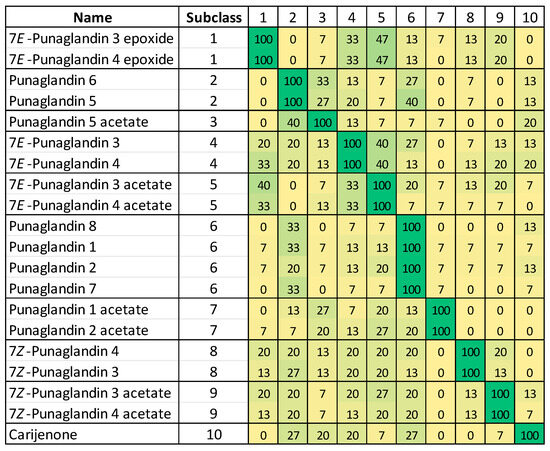
Figure 5.
Heat map of matches of published NMR data for 20 punaglandins to predicted chemical shifts assigned to 10 punaglandin subclasses. Subclass numbers represent 1: 10,11-epoxy-7E-enone, 2: 10-enone, 3: 12-acetoxy-10-enone, 4: 7E,10-dienone, 5: 12-acetoxy-7E,10-dienone, 6: 7-OAc,10-enone, 7: 12-acetoxy-7-OAc,10-enone, 8: 7Z,10-dienone, 9: 12-acetoxy-7Z,10-dienone, and 10: bicyclic.
Analysis of HMBC data from the literature indicated that the methine proton H-7, (or methylene group in the 10-enone subclass) consistently correlates with C-9 and C-12; H-11 shows correlations to C-8 and C-13, and the methylene protons (H2-13) showed correlations to C-8 and C-11 (Figure 6). Based on these observations, two of the punaglandin subclasses would have six plausible HMBC correlations and the other eight subclasses would each have eight plausible correlations (76 in total). The chemical shift trends highlighted in the PCA (Figure 2) and the heat map analyses (Figure 5) combined with HMBC data (Figure 6) suggested that the presence of a compound in a specific punaglandin subclass could be predicted without any prior knowledge regarding assignment of resonances to specific carbons/protons. Out of the 76 plausible HMBC correlations, a total of 51 unique 1H/13C bin areas were created for plausible HMBC correlations within each of the 10 different punaglandin subclasses.
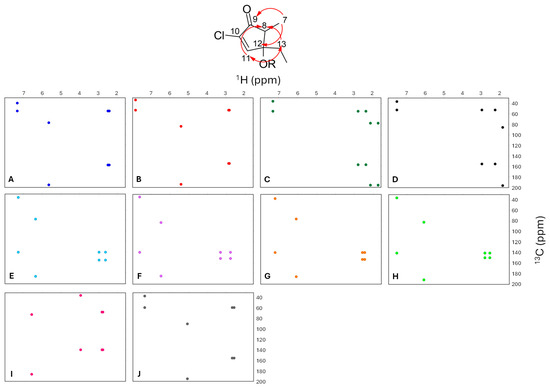
Figure 6.
Predicted HMBC correlations (red arrows) and bins for punaglandin subclasses. Dots represent the mean chemical shift for 1H and 13C within each subclass range. (A) 7-OAc,10-enone, (B) 12-acetoxy-7-OAc,10-enone, (C) 10-enone, (D) 12-acetoxy-10-enone, (E) 7E,10-dienone, (F) 12-acetoxy-7E,10-dienone, (G) 7Z,10-dienone, (H) 12-acetoxy-7Z,10-dienone, (I) 10,11-epoxy-7E-enone, and (J) bicyclic.
This approach generated a 51 bitstring fingerprint for each subclass (Figure 7). These bitstring fingerprints were used to assess similarities based on Jaccard similarity scores. The Jaccard similarity scores for the combined HMBC correlations in each subclass pairwise assessed against every other subclass (45 pairwise analyses) showed that 41 of 45 pairs were less than 14% similar. A hierarchical cluster dendrogram generated from dissimilarity (1-similarity) scores highlight the relationships between the 10 subclasses based in their HMBC fingerprints. The heights of the branches were all greater than 0.73 indicating that all subclass HMBC fingerprints are very different from each other. This suggested that even if not all plausible HMBC correlations for a specific punaglandin subclass are observed in a HMBC spectrum, the probability of a match to a specific subclass can still be confidently obtained because the likelihood of the combined observed HMBC correlations matching to a different punaglandin subclass is low. A confidence score was created by tallying all HMBC correlation areas that matched with the 51 bitstring bin areas. These tallied matches were then divided by the total plausible HMBC correlations expected for any given punaglandin subclass. HMBC correlations associated with the methylene proton resonances (H2-13) may be challenging to assign or may not be observable in a complex mixture due to their weak intensities. Furthermore, there is a propensity for chemical shift overlap in this shielded region of the 1H dimension of the HMBC spectrum with 1H resonances associated with a variety of primary metabolites such as fatty acids, triglycerides, and steroids that are commonly encountered in soft coral extracts. We therefore anticipated that not all predicted HMBC correlations would be observed and as such, a confidence score of ≥75% was assigned as a match (details regarding the match score formula can be found in the paper by Baxter et al. [14]).
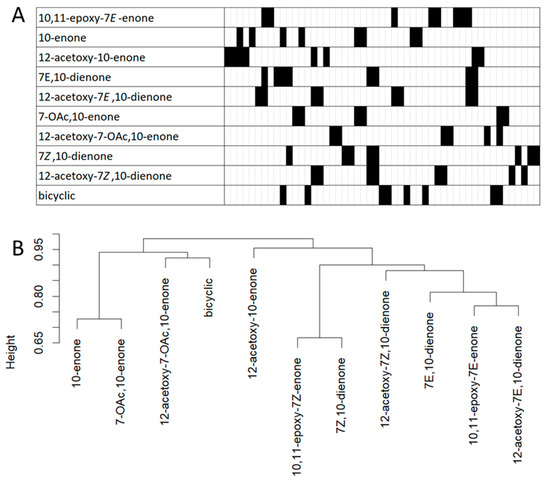
Figure 7.
(A) Bitstring fingerprint of plausible HMBC correlations. Each cell represents a unique H/C chemical shift area and blacked out cells represent areas where an HMBC correlation is predicted for a specific subclass ((bit 1 on the left through to bit 51 on the right) refer to Table S19 for more details). (B) Hierarchical clustering dendrogram produced from pairwise Jaccard similarity analysis of the bitstrings. The y-axis shows the dissimilarity heights or distance between clusters.
The very low Jaccard similarity for all HMBC correlations observed within a subclass to those observed in a different subclass gave us confidence that generating match scores from HMBC correlations in mixtures to predicted HMBC correlations would prove effective to identify the presence (or absence) of compounds assignable to specific punaglandin subclasses. This is indeed what we found (see below), highlighting how effective an HMBC analysis approach is to assess NMR de novo to identify and assign correlated resonances to punaglandin subclasses.
Before we could test the utility of the matrix model, we needed to have purified punaglandins on hand to acquire experimental HMBC data to apply to the matrix. A large sample was collected from South Stradbroke AR and exhaustively extracted using CH2Cl2. The South Stradbroke collection site was chosen because it was readily accessible and contains hundreds of kg of C. riisei on all AR structures. The CH2Cl2 extract obtained from the freeze-dried soft coral (1.48 g) was subjected to reverse-phase high-pressure liquid chromatography (HPLC) eluting from 30% MeOH/70% H2O to 100% MeOH over 70 min. This resulted in the isolation of the known compound pregna-1,4,20-trien-3-one (7). Analysis of the 1H NMR spectroscopic data for the other fractions led us to combine fractions 36–44 containing similar resonance fingerprints. The combined fraction that contained resonances tentatively assigned to punaglandin type molecules was repeatedly purified by normal phase HPLC on diol-bonded silica gel eluting with a gradient from n-hexane to CH2Cl2, then to 90% CH2Cl2/10%MeOH. Comprehensive analysis of 1H NMR spectroscopic data obtained for all fractions indicated that eight additional compounds were successfully purified. Extensive analysis of 1D and 2D NMR and mass spectrometric data established that the nine compounds isolated from C. riisei were one new punaglandin, named 7Z-punaglandin 4-epoxide (1), alongside eight known compounds; 7E-punaglandin 3-epoxide (2), 7Z-punaglandin 4 (3), punaglandin 6 (4), punaglandin 8 (5), carijenone (6), pregna-1,4,20-trien-3-one (7), 18-acetyl-18-hydroxymethyl-1,4,20-pregnatrien-3-one (8), and (5α,14α,17β)-pregna-1,20-dien-3-one (9) (Figure 8). The known compounds were identified by a combination of 2D NMR/MS data analysis and comparison of their spectroscopic data with that reported in the literature.
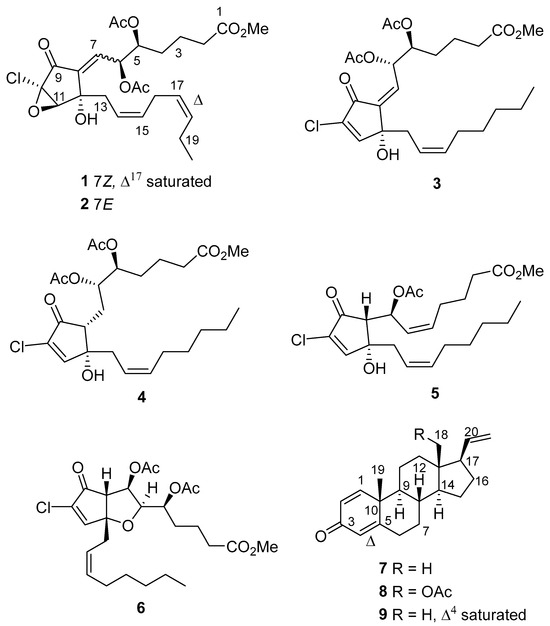
Figure 8.
New punaglandin 7Z-punaglandin 4-epoxide (1) and known compounds; 7E-punaglandin 3-epoxide (2), 7Z punaglandin 4 (3), punaglandin 6 (4), punaglandin 8 (5), carijenone (6), pregna-1,4,20-trien-3-one (7), 18-acetyl-18-hydroxymethyl-1,4,20-pregnatrien-3-one (8), and (5α,14α,17β)-pregna-1,20-dien-3-one (9).
Of the five known punaglandins and three known pregnane steroids, 7Z-punaglandin 4 (3) was originally reported in 1985 [47], 7E-punaglandin 3-epoxide (2), punaglandin 6 (4), and punaglandin 8 (5) were reported in 1994 [48], carijenone (6) was described a decade later in 2004 [52], and pregnane steroids pregna-1,4,20-trien-3-one (7) and (5α,14α,17β)-pregna-1,20-dien-3-one (9) [65] were reported in 1977 while 18-acetyl-18-hydroxymethyl-1,4,20-pregnatrien-3-one (8) was reported in 2004 [39]. Using the HMBC fingerprint prediction model, the five known punaglandins matched to their predicted subclasses, with match scores ≥ 75% (Table 2) and did not match with any other subclass, precisely as expected by the dissimilarity of HMBC fingerprints between each subclass. Interestingly, the new compound (1) registered a 50% match with both the 7Z,10-dienone and 10,11-epoxy-7E-enone subclass. We reasoned 1 did not achieve an acceptable match score (≥75%) for 7Z,10-dienone because it contains resonances at δH3.96 and δC 66.7, characteristic for C-10–C-11 epoxides rather than the characteristic deshielded olefinic proton and carbon resonances. Likewise, the lower-than-acceptable match of 1 for the 10,11-epoxy-7E-enone subclass is because it possesses more shielded 1H resonances at H2-13 and C-12 and more deshielded 13C resonances at C-13. This suggested that 1 is an epoxide that possesses a Z configuration of the double bond at C-7. This would make 1 a member of a punaglandin subclass that has not previously been reported and suggested that 1 is a new compound. To confirm if this hypothesis was correct, the structure of 1 was established through detailed analysis of MS, 1D, and 2D NMR data.
Table 2.
Structure class match score (%) for HMBC data obtained from isolated punaglandins (1–6). Match score ≥75% is highlighted in green.
The new compound, 7Z-punaglandin 4-epoxide (1, 1.0 mg), was isolated as a white colourless oil displaying [M+Na]+ peaks at m/z 537.1865 and 539.1844 in (+) HRESIMS which is consistent with a compound containing one chlorine atom, the molecular formula C25H35O9Cl, and eight degrees of unsaturation. Analysis of the 1H NMR data (Table 3, Figure S15) shows that it contains 16 proton resonances integrating to 34 protons, and HSQC data (Figure S16) for 1 established six methines; δH 6.22 (H-7), 6.04 (H-6), 5.64 (H-15), 5.22 (H-14), 5.19 (H-5), and 3.96 (H-11), nine methylene groups; δH 2.57 (H-13a), 2.38 (H-13b), 2.35 (H-2), 2.04 (H-16), 1.67 (H-4a), 1.68 (H-4b), 1.65 (H-3a), 1.69 (H-3b), 1.36 (H-17), 1.30 (H-18), and 1.27 (H-19), one oxygenated methyl group that formed part of an ester at δH 3.67 (OMe), two methyl groups consistent with assignment as acetates at δH 2.10 (5-OAc) and 2.04 (6-OAc), and a terminal methyl group at δH 0.88 (H3-20) (Table 3). The 13C NMR data (Table 3, Figure S17) for 1 displayed 25 resonances including 4 deshielded resonances assigned to carbonyls at δC 187.8 (C-9), 173.6 (C-1), 170.3 (C-5 and C-6), 1 non-protonated olefinic carbon resonance at δC 139.9 (C-8), and 2 oxygenated quaternary carbon resonances at δC 75.8 (C-10) and 75.1 (C-12).
Table 3.
NMR spectroscopic data for 7Z-punaglandin 4-epoxide (1) recorded in CDCl3.
Analysis of HMBC data (Figure S18) indicated that 1 contained a substituted cyclopentanone moiety as the most deshielded proton at δH 6.22 (H-7) displayed HMBC correlations with an unsaturated ketone carbon resonance at δC 187.6 (C-9) and an oxygenated quaternary carbon resonance at δC 75.1 (C-12), while the oxygenated methine proton at δH 3.96 (H-11) and methylene protons at δH 2.57 and δH 2.38 (H2-13) both correlated with the olefinic carbon resonance at δC 139.9 (C-8) (Figure 9). The ester methine resonance at δH 6.05 (H-6) also correlated with carbon at δC 139.9 (C-8). This indicated that 1 contained a trisubstituted double bond with a ketone, an ester methine, and a quaternary oxygenated carbon assigned to the three substituents. This evidence also placed the double bond to be directly attached to the cyclopentanone group. Analysis of COSY data (Figure S19) established a side chain from C-7 to C-2 since correlations were observed between δH 6.22 (H-7) and H-6, H-6 and H-5, H-5, and δH 1.67/1.68 (H2-4), and H-3 and δH 2.35 (H-2) and δH 1.67/1.68 (H2-4). The second side chain attached to the cyclopentanone was assigned from analysis of contiguous COSY correlations between the methyl proton resonance at δH 0.88 (H3-20), the methylene proton resonances at δH 1.30 (H2-18), δH 1.36 (H2-17), and δH 2.04 (H2-16), the olefinic resonances δH 5.64 (H-15), and δH 5.22 (H-14), and finally the methylene resonances at δH 2.57/2.38 (H2-13).
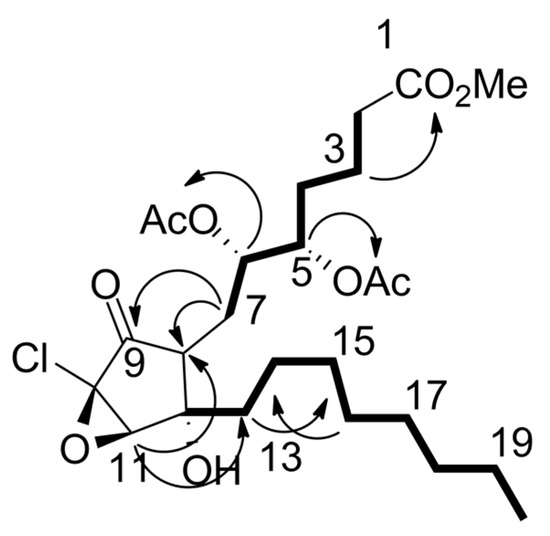
Figure 9.
Experimental HMBC (black arrows) and COSY (bolded lines) data observed for 7Z-punaglandin 4-epoxide (see Figure S18–S20 for NMR spectra).
Analysis of HMBC data assigned a terminal methyl ester to one side chain, since the methoxy proton resonance at δH 3.67 (1-OMe) and the methylene protons at δH 2.35 (H2-2) both correlated to an ester carbon resonance at δC 173.6 (H-1). A HMBC correlation between δH 6.05 (H-6) and the cyclopentyl carbon at δC 139.9 (C-8) further supported that the alkyl methyl ester side chain is connected to the α, β unsaturated cyclopentanone at C-7. Two acetate ester carbonyl resonances (δC 170.3; 5-OCOMe, 6-OCOMe) correlated with proton resonances at δH 5.19 (H-5) and δH 6.05 (H-6), establishing their positions in the molecule. The H2-13 protons had previously been established to be directly attached to the cyclopentanone from HMBC correlations. The Z configuration of the C-14 − C-15 double bond was assigned based on a 10.5 Hz coupling between H-14 and H-15. The remaining unassigned non-protonated carbon resonated at δC 75.8 (C-10) but showed no HMBC correlations. Given that the HRESIMS data for 1 clearly contained one chlorine atom and that molecular formula requires one additional element of unsaturation, a C-10-C-11 epoxy group was logically assigned. The chemical shift of C-10 and C-11 were in excellent agreement with assignments based on our DFT NMR data obtained for model compound (46) and literature comparisons with the related compounds [64].
The relative configurations for C-10 to C-12 were established through analysis of ROESY NMR data (Figure 10 and Figure S20). Key correlations between δH 3.96 (H-11) and δH 2.72 (12-OH) indicated that both protons are on the β-face of the cyclopentanone (Figure 8). By inferrance, the epoxide oxygen is therefore on the α-face and the chlorine atom attached to C-10 is on the β-face. The C-5 and C-6 relative configurations were established from analysis of a combination of 1H-1H coupling constants, ROESY correlations, and comparison of these data with that reported for related compounds. A 3.3 Hz coupling between H-5 and H-6 suggested that these protons are likely to be gauche orientated. This was supported by a strong ROESY correlation between δH 5.19 (H-5) and δH 6.05 (H-6). These observations are also consistent with those observed for related compounds 7Z-punaglandin 3, 7Z-punaglandin 3 acetate, 7Z-punaglandin 4, and 7Z-punaglandin 4 acetate, all of which share a H-5–H-6 coupling constant between 3.4 and 3.9 Hz. The 8.1 Hz coupling constant between H-6 and H-7 in 1 suggested that H-6 and H-7 are parially eclipsed and this too is consistent with coupling constants between 7.7 and 7.8 Hz reported for the four known punaglandins mentioned above [48]. Further analysis of ROESY data indicated that H-7 and H-5 are coplanar and H-6 and H-4b are coplanar because strong ROESY correlations were observed between H-5 and 6.22 (H-7) and between δH 6.05 (H-6) and δH 1.68 (H-4b). This provided additional support for 5S*6S* relative configuration in 1. The regiochemistry of the C-7–C-8 double bond was assigned Z configuration based on ROESY correlations between δH 6.22 (H-7) and δH 2.57 and 2.38 (H2-13), while the Z configuration for the C-14–C-15 double bond, already assigned based on a 10.5 Hz coupling constant, was further corroborated by a strong ROESY between H-14 and H-15 and between H2-13 and H2-16. This combined evidence established 1 to as a new 7-Z isomer of punaglandin 4 epoxide.
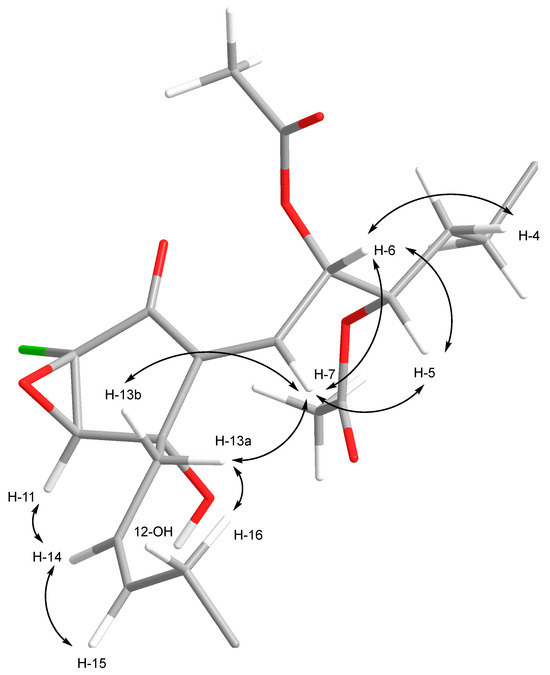
Figure 10.
ROESY correlations used to assigned the relative configurations at C-5, C-6, C-7,C-10, C-11, C-12, and C-14 in 1.
From the 1D and 2D NMR data obtained for the punaglandins isolated from C. riisei, we conclude that compounds 1 and 2 are chlorinated prostanoid epoxides, with the former featuring a 7Z-double bond instead of 7E. Compounds 3–5 are chlorinated prostanoids, with 3 featuring a 7Z-double bond, while 4 and 5 are saturated at C-7-C-8 lacking the double bond featured at this position in 3, with 5 also containing a C-7 acetate group. Compound 6 was identified as a chlorinated bicyclic prostanoid. This matches with the predicted subclasses presented in Table 2. Furthermore, we added the NMR data for the new compound (1) to our PCA, and this showed that it follows the same trend for Z vs. E configuration at C-7 that we have seen for E/Z punaglandins 3 and 4 with a shift of Z regioisomers to a higher PC1 and lower PC2 value compared to their 7E counterparts (Figure 11). We also updated the HMBC fingerprint bitstring to include predicted HMBC correlations for the 7Z-enone-10,11-epoxide. This expanded the bitstring to 53 unique HMBC correlation area bins. Jackard similarlity analysis of the bitstrings for 11 subclasses showed that 50 out of 55 pairs were <14% similar.
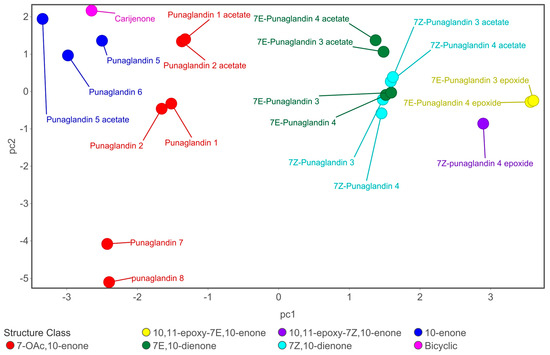
Figure 11.
Principal component analysis (PCA). PC1 plotted against PC2 and visualised using chemical shifts (CDCl3) from the reported literature and experimental data for the isolated compounds, including the new 7Z-punaglandin 4-epoxide. The plot is colour coded based on structure classes (PC1 explains 40.1% and PC2 24.7% of variance). For loading plots see Figure S21.
To test the utility of these HMBC fingerprints to identify compound classes in mixtures, C. riisei extracts from five artificial reef sites within Moreton Bay and the Great Sandy Marine Park in southeast Queensland, Australia (Figure S22) were exhaustively extracted using CH2Cl2. Given that soft coral extracts typically contain substantial amounts of lipids and, in some cases, sugars, applying a method that effectively removes these components can significantly enrich the extract in natural products of interest, thereby enhancing the quality and interpretability of the resulting HMBC spectroscopic data. We anticipated that once a SPE protocol was established, multiple samples could be processed in a controlled and reproducible manner within a single day, enabling the acquisition of NMR data as early as the following day. Therefore, the extracts were subjected to a reverse-phase (RP) solid-phase extraction (SPE) step for preliminary profiling. This RP SPE prefractionation step separated ~200 mg of extract with the following stepped elution gradient conditions. The extract was loaded onto the SPE cartridge in H2O and then eluted with 50% MeOH/50% H2O; 80% MeOH/20% H2O and 100% MeOH. Analysis of the 1H NMR spectroscopic data for all fractions confirmed that the punaglandins and pregnane steroids eluted in the 80% MeOH/20% H2O fraction. When this method was applied to the five extracts obtained from C. riisei collected from various locations in southeast Queensland, extracts from South Stradbroke and Simpsons AR’s contained a mixture of punaglandins (Figures S23–S26), while the other three extracts from Simpson (another site) and South Stradbroke (another site) and North Moreton AR’s contained no trace of punaglandins (Figures S27–S33).
Extensive analysis of 1H and 13C NMR data (HSQC and HMBC) of all five extracts enabled us to confirm which extracts contained punaglandins and which did not (Figure S27–S33). The highlighted areas in the HMBC spectra in Figure 12 represent areas of interest for the punaglandins. Additionally, HMBC is less sensitive than other NMR experiments like HSQC; however, it is more powerful in showing the relevant correlations needed to assign subclasses to grouped resonances. To obtain higher signal-to-noise HMBC data, we acquired the data with non-uniform sampling (NUS) (35%) to increase the scan numbers while decreasing the acquisition time. The correlations in the HMBC spectra and corresponding HSQC resonances were extracted and plotted into the prediction model. The prediction model allowed us to match subclasses present in the extracts containing punaglandins (Table 4): bicyclic, 7E,10-dienone, 10-11-epoxy-7E-enone, 7Z,10-dienone, 7-OAc,10-enone, and 10-enone. As seen in the table, some extracts did not contain punaglandins and the absence of punaglandins in some collections of C. riisei have previously been reported by Baker & Scheuer [48]. For the following analysis, we continued to work with C. riisei collected from South Stradbroke (SS) and Simpson AR (SI_1) as they contained punaglandins, while the other extracts did not. The SS sample contained a broader range of punaglandins, whereas the sample SI_1 AR contained fewer punaglandins, all of which overlapped with those identified the SS sample used for the isolations reported above.
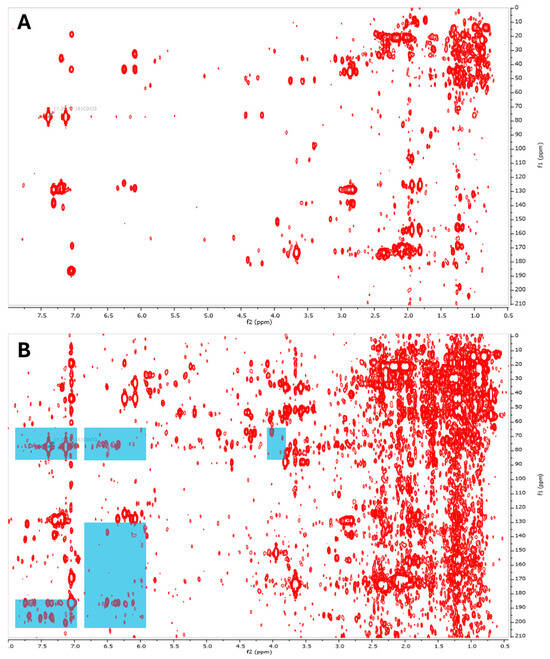
Figure 12.
HMBC spectra of two extracts that contain (A) only a pregnane steroid and (B) multiple punaglandins. Areas where distinct signatures of punaglandins can be observed are highlighted in blue.
Table 4.
Structure class match score (%) for HMBC and HSQC data obtained from five different C. riisei extracts collected at South Stradbroke (SS), Simpson Site 1 (SI_1), Simpson Site 2 (SI_2), North Moreton (NM), and South Stradbroke Site 2 (SS_2). Match score ≥ 75% is highlighted in green.
A diagnostic HMBC correlation between H-7 and C-9 provides a distinct NMR fingerprint for punaglandins, while also providing some indication of how many are present in the sample. We labelled these H-7–C-9 correlations as ‘unknowns,’ since their structural class could not yet be determined, and assigned them Roman numerals (I–VIII). These ‘unknowns’ comprised a set of eight correlations between protons at distinct chemicals shift (6.1–7.5 ppm) with carbons in the range between 185 and 200 ppm. However, we still faced the challenge of assigning these groups of diagnostic correlations to specific compounds in the mixture. For instance, other HMBC correlations from H-7 exhibited overlap in the mixture. In the HMBC spectrum, δH 3.96 was associated with both unknown (I) and unknown (II), as δH 6.22/6.56 (H-7) correlated into δC 76.1/76.9 (C-12), which in turn correlated with δH 3.96 (H-11) for both unknowns. The signal at δH 3.96 appeared noticeably broader than others in the HMBC data, suggesting that it could represent correlations associated with two different molecules belonging to distinct subclasses, thereby preventing a confident structural assignment. To overcome this problem, we applied indirect 13C − 13C covariance analysis of the data obtained from the HMBC experiment to help tease out what groups of correlations belonged to each individual compound in the mixture. By applying covariance HMBC analysis, we were able to annotate core chemical shifts and associate each of the eight unknowns to compounds within a specific subclass (Figure 13). We found that unknown (I) and (II) both possessed resonances at δC 66.7 directly coupled to δH 3.96/3.98 in the HSQC data.
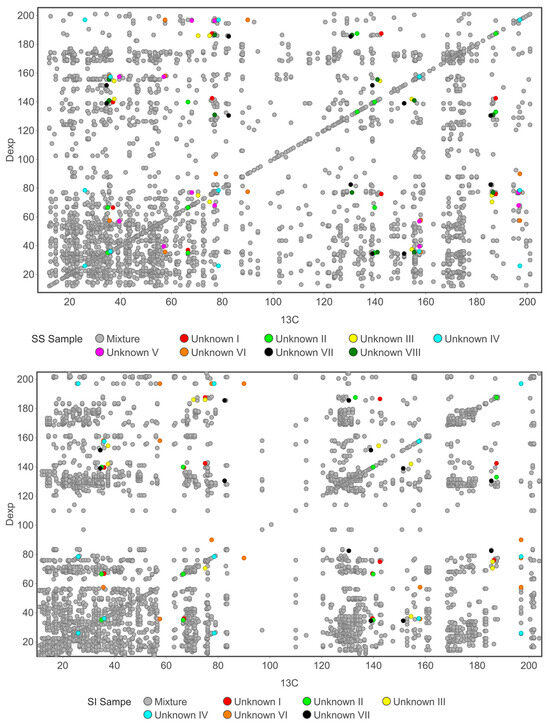
Figure 13.
Indirect-covariance HMBC (13C) spectra obtained for the South Stradbroke (SS) and Simpson (SI_1) extracts. Unknown components detected in the SS sample are numbered I–VIII, with the same numbering applied to the SI_1 sample where matching chemical shifts were observed. Matching labels indicate compounds exhibiting equivalent or very similar chemical shifts, implying that they represent the same metabolites occurring in both sample locations.
Groups of experimental HMBC correlations assigned to each of the unknown compounds through covariance analysis were compared to predicted HMBC correlations (Figure 14).
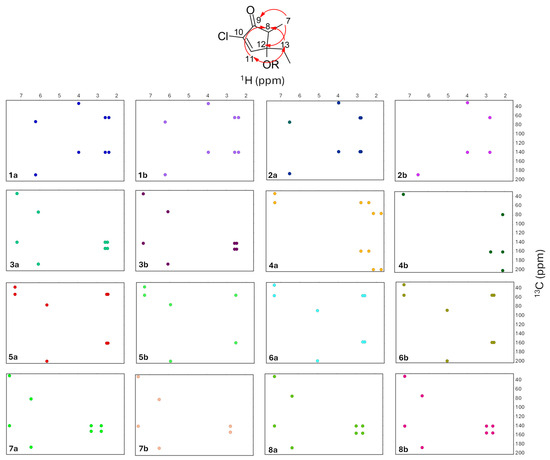
Figure 14.
Observed and predicted HMBC correlations (red arrows) for subclasses of punaglandins (a) matched to experimental HMBC correlations of unknowns (b), where dots represent the mean chemical shift for 1H and 13C within each subclass range (a) and observed 1H and 13C of each unknown (b). (1a) 10,11-epoxy-7Z-enone and (1b) unknown I, (2a) 10,11-epoxy-7E-enone and (2b) unknown II, (3a) 7Z,10-dienone and (3b) unknown III, (4a) 10-enone and (4b) unknown IV, (5a) 7-OAc,10-enone and (5b) unknown V, (6a) bicyclic and (6b) unknown VI, (7a) 12-acetoxy-7E,10-dienone and (7b) unknown VII, and (8a) 7E,10-dienone and (8b) unknown VIII.
The 53 bit bitstring HMBC correlation fingerprints for the predicted HMBC correlations for each subclass, the experimental HMBC correlations observed in the two punaglandin containing C. riisei extracts, and the indirect covarienace-assisted assignment of these experimental HMBC correlations to individual molecules in the mixture provided a simple visual representation for matching experimental correlation to subclasses (Figure 15). A pairwise Jaccard similarity analysis of the 53 bit bitstrings assigned to each subclass with the 53 bit bitstrings experimentally derived from covariance analysis of HMBC data for the eight unknown compounds generated matching scores that allowed each unknown to be confidently assigned to a specific punaglandin subclass. This was visualised in a heat map (Figure 15). These scores provided compariable results to those obtained when the correlations assigned to each unknown were analysed using the prediction tool, where scores of ≥75% (Table 5) were obtained. A hierarchical clustering dendroagam of dissimilarity between the paired data obtained from the Jaccard similarity analysis showed nodes close to 0.2 for each unknown paired to a specific subclass and then the distance between these nodes to their next node was an average 0.6 (Figure 15). This clearly shows, with high confidence, that the observed HMBC correlations in the experimental data aligned well with the predicted correlations for the corresponding subclasses, supporting the structural matches. Additionally, the inclusion of the new bin for the new subclass (10,11-epoxy-7Z-enone) allowed unknown (I), which includes the resonance at δH 3.96 and δC 66.7, to score a ≥75% match for this subclass. Even though unknowns II, V, VII, VIII were present in low abundance and lacked complete sets of 1H/13C correlations that would be expected for a given punaglandin subclass, they still generated overall match scores equal to or exceeding 75% (Table 5).
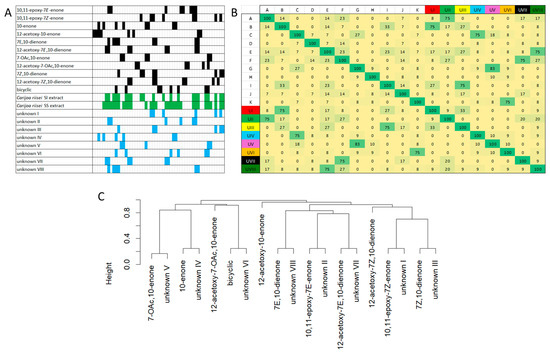
Figure 15.
(A) 53 bit bistrings fingerprints (bit 1 on the left through to bit 53 on the right) for the predicted HMBC correlations for 11 subclasses (black bits have a score of 1), experimental 53 bit bitstring fingerprints for two C. riisei extracts (SI_1 and SS_1) (green bits have a score of 1), and 53 bit bitstring fingerprints assigned to eight unkown compounds in the two C. riisei extracts through indirect-covariance HMBC (blue bits have a score of 1) (refer to Table SXX for more details). (B) Jaccard similarity analysis represented as a heat map. A: 10,11-epoxy-7E-enone, B: 10,11-epoxy-7Z-enone, C: 10-enone, D: 12-acetoxy-10-enone, E: 7E,10-dienone, F: 12-acetoxy-7E,10-dienone, G: 7-OAc,10-enone, H: 12-acetoxy-7-OAc,10-enone, I: 7Z,10-dienone, J: 12-acetoxy-7Z,10-dienone, K: bicyclic, UI: unknown I, UII: unknown II, UIII: unknown III, UIV: unknown IV, UV: unknown V, UVI: unknown VI, UVII: unknown VII, UVIII: unknown VIII. (C) Hierarchical clustering dendrogram obtained from dissimilarity data obtainded from Jaccard similarity scores. The y-axis represent dissimilairity (0 = 100% similar, 0 = 100% dissimilar).
Table 5.
Structure class match score (%) for HMBC and HSQC data obtained from C.riisei extracts. Match score ≥ 75% is highlighted in green.
Based on the 1H and 13C NMR signals in the mixture, we could match several of the unknowns within assigned substructure classes to data acquired on the previously isolated compounds. (Figure 16). As such, unknown (I) belongs to a new subclass 10,11-epoxy-7Z-enone and was identified as the new compound discussed above, 7Z-punaglandin 4-epoxide (1), and unknowns II, III, IV, V, and VI were matched to 7E-punaglandin 3-epoxide (2), 7Z-punaglandin 4 (3), punaglandin 6 (4), punaglandin 8 (5), and carijenone (6), respectively. The two remaining unknowns, VII and VIII, were predicted to be a 7E,10-dienone and a 12-acetoxy-7E,10-dienone, respectively.
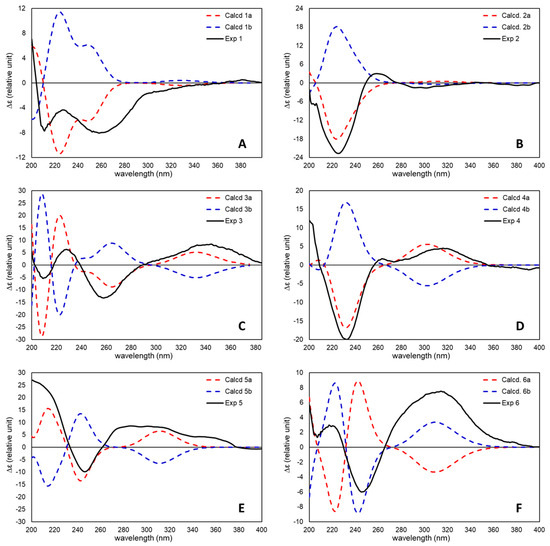
Figure 16.
Comparison of experimental (black lines) and TDDFT-calculated ECD spectra (dashed red and blue lines) for (A) 7Z-punaglandin 4-epoxide (1) [60] (red line = 5S,6S,10S,11R,12S, blue line = 5R,6R,10R,11S,12R), (B) 7E-punaglandin 3-epoxide (2) (red line = 5S,6S,10S,11R,12S, blue line =5R,6R,10R,11S,12R), (C) 7Z-punaglandin 4 (3) (red line = 5S,6S,12R, blue line = 5R,6SR,12S), (D) punaglandin 6 (4) (red line = 5S,6S,8R,12S, blue line = 5R,6R,8S,12R), (E) punaglandin 8 (5) (red line = 7S,8R,12S, blue line = 7R,8S,12R), and (F) carijenone (6) (red line = 5R,6S,7S,8S,12R, blue line = 5S,6R,7R,8R,12S).
The optical rotations obtained for all the known compounds matched those previously reported in the literature. This provided confidence that comparative electronic circular dichroism (ECD) analysis using time-dependent density functional theory (TDDFT) quantum chemical calculations would yield absolute configuration assignments consistent with those previously determined using other analytical methods for 7Z-punaglandin 4 (3) and punaglandin 8 (5), while also enabling absolute configuration assignments for those compounds isolated herein not previously characterised. The TDDFT-calculated ECD spectra for truncated punaglandins (whose structures are shown in Figure S1) 1 (5S,6S,10S,11R,12S), 2 (5S,6S,10S,11R,12S), 3 (5S,6S,12R), 4 (5S,6S,8R,12S), 5 (7S,8R,12S), and 6 (5S,6R,7R,8R12S) matched their respective experimental ECD spectra (Figure 16 and Figures S2–S7). The lowest energy conformers that contributed mostly to the average calculated ECD data were good matches to the 3D structures assigned based on NMR analysis. From the comparison of experimental and TDDFT-calculated ECD data for the new compound, 7Z-pungalandin 4 epoxide (1) indicates that it is in the same enantiomeric series as its putative biosynthetic precursors 7Z or 7E punaglandins 3 and 4. The absolute configuration of 7Z punaglandin 4 (3) (5S,6S,12R), which is in agreement with our assignment, was previously established by X-ray crystallographic analysis and supported by ECD measurements, and it was assumed that 7E and 7Z punaglandin 3 share the same absolute configuration due to their structural similarity [57,66]. Our ECD analysis of 7E-punaglandin 3 epoxide (2) confirms that it bears the same absolute configuration at C-12 as that in the C-10–C-11 double bond congeners (although the addition of an epoxide at C-10–C-11 changes the atom priority order rendering configuration at C-12 S in the epoxides compared to R in the C-10–C-11 double bond congeners, even though in both series 12-OH is α oriented).
Dorta et al. [52] determined the relative configuration of carijenone (5R*,6S*,7S*,8S*,12R*) based on NMR data and modelling, and hypothesised its absolute configuration (5R,6S,7S,8S,12R) based on a proposed biosynthesis that relies on the lipoxygenase, 5R-LOX, that is found in other marine invertebrates as well as vertebrates to catalyse the oxidation at C-5. However, its absolute configuration was not established experimentally. We have now established that the absolute configuration of 6 is opposite to that proposed (5S,6R,7R,8R,12S); a configuration that puts 6 in the same C-12 configurational series as 1, 2, and 3. Verbitski et al. [50] isolated punaglandins 2, 3, 7E- 4, 7Z- 4, and 6 with their structures and relative configurations assigned using NMR and EIMS, supported by DFT-GIAO NMR calculations. However, the absolute configurations for the compounds were not determined, and so our analysis provides the absolute configuration for punaglandin 6 (4), in the same C-12 configurational series as punaglandins 1, 2, 3, and 6, for the first time. The absolute configuration of punaglandin 8 (5) was not reported in the original paper [48], but Watanabe et al. [67] later assigned its relative configuration by detailed NMR analysis and its absolute configuration by ECD spectroscopy through comparison with a reference compound (7-acetoxy-7,8-dihydroiodovulone I, 7S,8R,12R) of known configuration. However, the structure of punaglandin 8 drawn in the paper does not match with the assigned configurations reported (7S,8R,12R) making it difficult to draw a conclusion. The confusion in the cited paper arises from the authors not considering that saturating of the C-7–C-8 double bond alters the atom priority order. Consequently, molecules possessing a C-7–C-8 double bond with the same orientation of 12-OH as molecules saturated at C-7–C-8 undergo a change in configuration at C-12 from R to S. Therefore, the correct configuration for punglandin 8 established by Watanabe et al. is 7S,8R,12S. Our study is the first to report the absolute configuration of punaglandin 8 (5) using the TDDFT method and we can confirm that its absolute configuration is 7S,8R,12S. In summary, all six punaglandins (1–6) reported herein contain α oriented C-12 hydroxy groups, consistent with a common enzymatic biosynthesis; however, this configuration is either R or S depending on the oxidation state of the neighbouring atoms.
4. Discussion
This study demonstrates how integrating predictive NMR models allows for accurate identification punaglandins in complex mixture in addition to categorising compound specific resonances to punaglandin subclasses. This was validated by the successful isolation and structure elucidation of compounds predicted from heteronuclear 2D NMR data obtained for mixtures. PCA of 1H and 13C NMR data enabled recognition of diagnostic fingerprints, allowing for rapid assessment of chemical composition in crude extracts. Using the predictions, we aimed to streamline the discovery process by focusing efforts on samples most likely to contain punaglandins. This resulted in the isolation of the new punaglandin 7Z-punaglandin 4-epoxide (1), a series of known punaglandins; 7E-punaglandin 3-epoxide (2), 7Z-punaglandin 4 (3), punaglandin 6 (4), punaglandin 8 (5), carijenone (6), and three known pregnane steroids; pregna-1,4,20-trien-3-one (7), 18-acetyl-18-hydroxymethyl-1,4,20-pregnatrien-3-one (8), and (5α,14α,17β)-pregna-1,20-dien-3-one (9). Carijenone (6) has previously only been isolated from Carijoa multiflora [52]. This experimental verification supports the model’s reliability and highlights its use as a dereplication tool. By rapidly identifying and detecting structural subclasses based on diagnostic NMR fingerprints, this workflow enables researchers to prioritise compounds of interest. In complex mixtures where the traditional natural products isolation workflow can be time-consuming and costly, this model offers a rapid and cost-effective process that can be added to the existing isolation workflows. Furthermore, we reported the absolute configuration of six punaglandins using the TDDFT method. ECD analysis has established the absolute configuration for compounds 1–6 and our discoveries align with earlier reports suggesting punaglandins have conserved configurations at C-12 [50].
While the chemistry of C. riisei has been explored over the decades, using predictive tools to classify subclasses could significantly increase the chances of discovering new compounds, saving both time and effort in the process. We analysed published 1H and 13C NMR data to detect punaglandins in complex mixtures and were able to accurately predict the structural classes of unknown compounds and assign them to specific subclasses of punaglandins by comparing predicted and experimental HMBC correlations. Confidence in these structural matches was further enhanced through the application of covariance HMBC, which enabled the grouping of chemical shifts corresponding to individual compounds within the mixture. We confirmed these predictions experimentally through the isolation and elucidation of compounds 1–6.
C. riisei is a species known for its impacts and competitive dominance in benthic ecosystems. The ability to detect and monitor these compounds with minimal sample requirements positions the NMR model as a powerful tool for monitoring chemical profiles. Given the significant anti-inflammatory and antiproliferative properties exhibited by the two major groups of compounds (pregnane steroids and punaglandins), it is possible that these metabolites contribute to the coral’s ecological success, potentially serving as chemical defence against predators or as allelochemicals for competition. Furthermore, previous research has shown that punaglandins are not present in all samples [48], further supported by our study, which could be a reflection on the transcriptome at a given time (i.e., environmental pressures, etc.). More work is needed to explore this phenomenon and the potential linking of NPs to C. riisei’s competitive dominance. The presence and absence of punaglandins might seem like a minor detail but is, in fact, crucial. Relying on traditional isolation workflows in such cases can become more labour-intensive, wasting time attempting to isolate compounds that may not be present and the patchy occurrence of punaglandins and pregnane steroids could be attributed to various factors (species-specificity, environment, gender, etc.); however, the ecological role of these compounds remains poorly understood and warrants further study.
Outside of its use in NP dereplication, this predictive NMR model may be able to serve as a tool in ecological monitoring by rapid chemical profiling of unknown or suspected invasive species on reefs. Chemotaxonomy is a method of classifying and identifying organisms based on their chemical composition [6,7,9] and has been used in studies to gain chemotaxonomic evidence to differentiate and even identify new species [8,10]. Many soft-bodied, sessile, or slow-moving benthic marine invertebrates rely on secondary metabolites for defence or competition through allelopathy [4,5], giving them an advantage in colonising new environments [4,5,68,69,70], and these interactions are usually species-specific. This species specificity can be used as distinct fingerprints for identification and monitoring [9,71]. One challenge with studying marine invertebrates, especially early colonisers or cryptic species, is that they may only be present in low biomass [72]. This predictive NMR model offers both a practical and scalable approach to field-based ecological and chemical monitoring as it only requires a small amount of sample material to do chemical analysis, without the need for large-scale purification. This could allow for the possibility of rapid and early detection of chemically distinct species, guiding further taxonomic or ecological investigations.
Chemical profiling could identify novel or unexpected profiles, physiological responses to stressors [73], and potentially invasive or ecologically disruptive species. Furthermore, ongoing chemical monitoring may reveal insights into species interactions, offering insights into how these organisms persist and interact in the environment. Integration with visual observations, MS and genomic data enhances resolution and confidence in identification [10,71]. This multi-omics approach could provide a robust framework for long-term monitoring of species presence, community dynamics, and ecological interactions.
5. Conclusions
This paper demonstrates the value of integrating predictive NMR tools into the isolation process where target compounds are not consistent across all samples or when it is important to filter out low-priority compounds, especially in high-throughput studies or resource-limited NP screening efforts. The rapid and cost-effective prediction model developed by Baxter et al. [14] is particularly applicable for this purpose owing to its versatility, and in this present study we have successfully applied this model to a distinct class of compounds unrelated to those previously. It can accurately predict and distinguish both 1H and 13C chemical shifts within closely related subclasses of compounds, assisting in the correction of misassigned or prediction of missing chemical shifts. Moreover, it can be employed to monitor specific compounds within a mixture, increasing the efficiency of the isolation workflow.
Supplementary Materials
The following supporting information can be downloaded at https://www.mdpi.com/article/10.3390/jmse13112082/s1. Figures S1–S7: TDDFT NMR and ECD data; Figures S8–S13: structures of compounds used to create the fingerprint model; Figure S14: Loading plots for PCA; Figures S15–S20: experimental NMR spectra for 1; Figure S21: Loading plots for PCA including 7Z-punaglandin 4-epoxide; Figure S22: collection locations for C. riisei; Figures S23–S33: NMR spectra associated with C. riisei extracts; Table S1: NMR data for known punaglandins isolated from C. riisei in this study; Table S2–S4: TDDFT predicted 13C NMR data for model epoxycyclopentenone; Tables S5–S16: DFT Geometry Optimised Coordinates calculated for punglandins; Tables S17–S18: Published NMR data for prostanoids and pregnanes [39,41,45,48,50,52,57,65,66,67,74,75,76,77,78].
Author Contributions
Conceptualization: P.E.L. and A.R.C.; methodology: P.E.L., D.C.H. and A.R.C.; analysis and writing: P.E.L., D.C.H., J.B.H., T.S. and A.R.C.; draft, review, and editing: P.E.L., D.C.H., J.B.H., T.S. and A.R.C. All authors have read and agreed to the published version of the manuscript.
Funding
This work was funded by an Australian Postgraduate Award (APA) provided by the Australian Commonwealth Government to PEL.
Data Availability Statement
The original contributions presented in this study are included in the article/Supplementary Materials.
Acknowledgments
We thank W. Loa-Kum-Cheung and A. Boyle for their technical assistance. Further thanks are extended to Jody Kreuger for his support in the field as the Diving and Boating Officer. DCH would like to acknowledge the Griffith University eResearch services team for the use of the ‘Gowonda’ high performance computing cluster for quantum chemical calculations.
Conflicts of Interest
The authors declare no competing financial interests.
Abbreviations
The following abbreviations are used in this manuscript:
| MNPs | Marine natural products |
| MS | Mass spectrometry |
| NMR | Nuclear Magnetic Resonance |
| C. riisei | Carijoa riisei |
| AR | Artificial Reefs |
| ECD | Electronic circular dichroism |
| TDDFT | Time dependent density functional theory |
| HSQC | Heteronuclear single quantum coherence |
| HMBC | Heteronuclear multiple bond correlation |
| COSY | Correlation spectroscopy |
| ROESY | Rotational Overhauser spectroscopy |
| HPLC | High performance liquid chromatography |
| PCA | Principal component analysis |
| SPE | Solid-phase extraction |
| RP | Reverse-phase |
| LCMS | Liquid chromatography mass spectrometry |
| CDCl3 | Deuterated chloroform |
| CH2Cl2 | Dichloromethane |
| MeOH | Methanol |
References
- Kiuru, P.; D’Auria, M.V.; Muller, C.D.; Tammela, P.; Vuorela, H.; Yli-Kauhaluoma, J. Exploring Marine Resources for Bioactive Compounds. Planta Med. 2014, 80, 1234–1246. [Google Scholar] [CrossRef]
- Blunt, J.; Munro, M.H.G. MarinLit: A Database of the Marine Natural Products Literature; Royal Society of Chemistry: Cambridge, UK, 2015. [Google Scholar]
- Zani, C.L.; Carroll, A.R. Database for Rapid Dereplication of Known Natural Products Using Data from MS and Fast NMR Experiments. J. Nat. Prod. 2017, 80, 1758–1766. [Google Scholar] [CrossRef]
- La Barre, S.; Coll, J.; Sammarco, P. Competitive strategies of soft corals (Coelenterata: Octocorallia): III. Spacing and aggressive interactions between alcyonaceans. Mar. Ecol. Prog. Ser. 1986, 28, 147–156. [Google Scholar] [CrossRef]
- Gross, E.M. Allelochemical Reactions. In Encyclopedia of Inland Waters; Likens, G.E., Ed.; Academic Press: Oxford, UK, 2009; pp. 715–726. [Google Scholar]
- Bergquist, P.; Wells, R. Chemotaxonomy of the Porifera: The Development and Current Status of the Field; Academic Press: New York, NY, USA, 1983; Volume 5. [Google Scholar]
- van Soest, R.W.; Braekman, J.-C. Chemosystematics of Porifera: A review. Mem. Qld. Mus. 1999, 44, 569–589. [Google Scholar]
- Erpenbeck, D.; Hooper, J.N.A.; Bonnard, I.; Sutcliffe, P.; Chandra, M.; Perio, P.; Wolff, C.; Banaigs, B.; Wörheide, G.; Debitus, C.; et al. Evolution, radiation and chemotaxonomy of Lamellodysidea, a demosponge genus with anti-plasmodial metabolites. Mar. Biol. 2012, 159, 1119–1127. [Google Scholar] [CrossRef]
- Santacruz, L.; Thomas, O.P.; Duque, C.; Puyana, M.; Tello, E. Comparative Analyses of Metabolomic Fingerprints and Cytotoxic Activities of Soft Corals from the Colombian Caribbean. Mar. Drugs 2019, 17, 37. [Google Scholar] [CrossRef]
- Jaramillo, K.B.; Guillén, P.O.; Abad, R.; León, J.A.R.; McCormack, G. Contribution of metabolomics to the taxonomy and systematics of octocorals from the Tropical Eastern Pacific. PeerJ 2025, 13, e19009. [Google Scholar] [CrossRef] [PubMed]
- Van Middlesworth, F.; Cannell, R.J. Dereplication and Partial Identification of Natural Products. In Natural Products Isolation; Cannell, R.J., Ed.; Humana Press: Totowa, NJ, USA, 1998; pp. 279–327. [Google Scholar]
- Butler, M.S. The role of natural product chemistry in drug discovery. J. Nat. Prod. 2004, 67, 2141–2153. [Google Scholar] [CrossRef] [PubMed]
- Kleks, G.; Holland, D.C.; Porter, J.; Carroll, A.R. Natural products dereplication by diffusion ordered NMR spectroscopy (DOSY). Chem. Sci. 2021, 12, 10930–10943. [Google Scholar] [CrossRef]
- Baxter, J.R.; Holland, D.C.; Gavranich, B.; Nicolle, D.; Hayton, J.B.; Avery, V.M.; Carroll, A.R. NMR Fingerprints of Formyl Phloroglucinol Meroterpenoids and Their Application to the Investigation of Eucalyptus gittinsii subsp. gittinsii. J. Nat. Prod. 2023, 86, 1317–1334. [Google Scholar] [CrossRef]
- Reher, R.; Kim, H.W.; Zhang, C.; Mao, H.H.; Wang, M.; Nothias, L.-F.; Caraballo-Rodriguez, A.M.; Glukhov, E.; Teke, B.; Leao, T.; et al. A Convolutional Neural Network-Based Approach for the Rapid Annotation of Molecularly Diverse Natural Products. J. Am. Chem. Soc. 2020, 142, 4114–4120. [Google Scholar] [CrossRef] [PubMed]
- Kim, H.W.; Zhang, C.; Reher, R.; Wang, M.; Alexander, K.L.; Nothias, L.-F.; Han, Y.K.; Shin, H.; Lee, K.Y.; Lee, K.H.; et al. DeepSAT: Learning Molecular Structures from Nuclear Magnetic Resonance Data. J. Cheminform. 2023, 15, 71. [Google Scholar] [CrossRef]
- Holland, D.C.; Carroll, A.R. Structure Revision of Formyl Phloroglucinol Meroterpenoids: A Unified Approach Using NMR Fingerprinting and DFT NMR and ECD Analyses. Molecules 2024, 29, 594. [Google Scholar] [CrossRef]
- Duchassaing de Fonbressin, P.; Michelotti, G. Mémoire sur les Coralliaires des Antilles; De l’imprimerie Royale: Turin, Italy, 1860. [Google Scholar]
- Kahng, S.E.; Grigg, R.W. Impact of an alien octocoral, Carijoa riisei, on black corals in Hawaii. Coral Reefs 2005, 24, 556–562. [Google Scholar] [CrossRef]
- Evans, E.C., III; Buske, N.L.; Grovhoug, J.G.; Guinther, E.B.; Jokiel, P.L.; Kam, D.T.; Kay, E.A.; Key, G.S.; Peeling, T.J.; Smith, S.V. Pearl Harbor Biological Survey; NUC TN 1128; U.S. Navy, Naval Undersea Center, Hawaii Laboratory: San Diego, CA, USA, 1974. [Google Scholar]
- Bayer, F.M. The shallow-water Octocorallia of the West Indian region. Stud. Fauna Curaçao Other Caribb. Isl. 1961, 12, 1–373. [Google Scholar]
- Cárdenas-Calle, M.; Pérez-Correa, J.; Uzca-Sornoza, C.; Bigatti, G.; Diez, N.; Lozada, M.; Coronel, J.; Herrera, I.; Torres, G.; De la Cuadra, T. Invasion and current distribution of the octocoral Carijoa riisei (Duchassaing & Michelotti, 1860) in the Ecuadorian coast (Eastern Tropical Pacific). Aquat. Invasions 2021, 16, 62–76. [Google Scholar] [CrossRef]
- Galván-Villa, C.M.; Ríos-Jara, E. First detection of the alien snowflake coral Carijoa riisei (Duchassaing and Michelotti, 1860) (Cnidaria: Alcyonacea) in the port of Manzanillo in the Mexican Pacific. Bioinvasions Rec. 2018, 7, 1–6. [Google Scholar] [CrossRef]
- Quintanilla, E.; Wilke, T.; Ramírez-Portilla, C.; Sarmiento, A.; Sanchez, J.A. Taking a detour: Invasion of an octocoral into the Tropical Eastern Pacific. Biol. Invasions 2017, 19, 2583–2597. [Google Scholar] [CrossRef]
- Sánchez, J.A.; Ballesteros, D. The invasive snowflake coral (Carijoa riisei) in the Tropical Eastern Pacific, Colombia. Rev. Biol. Trop. 2014, 62, 199–207. [Google Scholar] [CrossRef]
- Vargas, J.A.; Breedy, O. The snowflake soft coral Carijoa riisei (Cnidaria: Octocorallia) in Costa Rica. Cuad. Investig. UNED 2022, 14, e4213. [Google Scholar] [CrossRef]
- Raghunathan, C.; Venkataraman, K.; Satyanarayana, C.; Rajan, R. An Invasion of Snowflake Coral Carijoa riisei (Duchassaing and Michelotti 1860) in Indian Seas: Threats to Coral Reef Ecosystem. Ecol. Cons. Trop. Mar. Faun. Comm. 2013, 45, 381–393. [Google Scholar] [CrossRef]
- Padmakumar, K.; Retnaraj, C.; Yogesh Kumar, J.S.; Sornaraj, R. Carijoa riisei (Cnidaria: Octocorallia: Clavulariidae), a newly observed threat to Gulf of Mannar coral biodiversity? Curr. Sci. 2011, 100, 35–37. [Google Scholar]
- Yogesh Kumar, J.S.; Raghunathan, C.; Mahapatra, P.; Panda, P.; Sen, A. Range extension of Snowflake soft coral, Carijoa riisei, (octocorallia: Alcyonacea) along Digha coast, West Bengal, India. J. Mar. Biol. Assoc. India. 2023, 65, 131–133. [Google Scholar] [CrossRef]
- Barbosa, T.M.; Gomes, P.B.; Bergeron, A.-S.; Santos, A.M.; Chagas, C.; Freitas, E.M.; Perez, C.D. Comparisons of sexual reproduction in Carijoa riisei (Cnidaria, Alcyonacea) in South Atlantic, Caribbean, and Pacific areas. Hydrobiologia 2014, 734, 201–212. [Google Scholar] [CrossRef]
- Kletou, D.; Benayahu, Y.; Michail, C.; Kleitou, P.; Constantinou, G.; McFadden, C.S. The non-indigenous tropical octocoral Carijoa established in the eastern Mediterranean Sea. Mar. Environ. Res. 2025, 210, 107327. [Google Scholar] [CrossRef] [PubMed]
- Kahng, S.E.; Benayahu, Y.; Wagner, D.; Rothe, N. Sexual reproduction in the invasive octocoral Carijoa riisei in Hawaii. Bull. Mar. Sci. 2008, 82, 1–17. [Google Scholar]
- Grigg, R.W. Invasion of a deep black coral bed by an alien species, Carijoa riisei, off Maui, Hawaii. Coral Reefs 2003, 22, 121–122. [Google Scholar] [CrossRef]
- de Pádua, S.M.F.; Botter-Carvalho, M.L.; Gomes, P.B.; de Oliveira, C.S.; dos Santos, J.C.P.; Pérez, C.D. The alien octocoral Carijoa riisei is a biogenic substrate multiplier in artificial Brazilian shipwrecks. Aquat. Ecol. 2022, 56, 183–200. [Google Scholar] [CrossRef]
- Patro, S.; Krishnan, P.; Gopi, M.; Raja, S.; Sreeraj, C.R.; Ramachandran, P.; Ramesh, R. Snowflake coral, Carijoa riisei from Grand Island, Goa: A case of invasion of an alien species or re-establishment of a native species? Curr. Sci. 2015, 109, 1028–1030. [Google Scholar]
- Concepcion, G.; Kahng, S.; Crepeau, M.; Franklin, E.; Coles, S.; Toonen, R. Resolving natural ranges and marine invasions in a globally distributed octocoral (genus Carijoa). Mar. Ecol. Prog. Ser. 2010, 401, 113–127. [Google Scholar] [CrossRef]
- Vicente, O.O.; Bethencourt, D.C.; Hoyos, O.M.; Rosales, A.; Ross, A.C.; Herrera, R.; Abad, L.M.; Díaz, M.G.; Febles, S.C.; Barrera, C.T. One ancient endemic species and five new exotic crypto-species of Carijoidae family (Anthozoa: Octocorallia) from Canary Islands sea-bottoms, caused by global shipping. Rev. Acad. Canar. Cienc. 2023, 35, 87–130. [Google Scholar]
- Almeida, M.; Tonini, M.L.; Guimaraes, T.d.R.; Bianco, E.M.; Moritz, M.I.; Oliveira, S.Q.; Cabrera, G.M.; Palermo, J.A.; Reginatto, F.H.; Steindel, M. Anti-infective pregnane steroid from the octocoral Carijoa riisei collected in South Brazil. Lat. Am. J. Pharm. 2012, 31, 1489–1495. [Google Scholar]
- Ciavatta, M.L.; Lopez Gresa, M.P.; Manzo, E.; Gavagnin, M.; Wahidulla, S.; Cimino, G. New C21 Δ20 pregnanes, inhibitors of mitochondrial respiratory chain, from Indopacific octocoral Carijoa sp. Tetrahedron Lett. 2004, 45, 7745–7748. [Google Scholar] [CrossRef]
- Liu, C.-Y.; Hwang, T.-L.; Lin, M.-R.; Chen, Y.-H.; Chang, Y.-C.; Fang, L.-S.; Wang, W.-H.; Wu, Y.-C.; Sung, P.-J. Carijoside A, a Bioactive Sterol Glycoside from an Octocoral Carijoa sp. (Clavulariidae). Mar. Drugs. 2010, 8, 2014–2020. [Google Scholar] [CrossRef]
- Díaz-Marrero, A.R.; Porras, G.; Aragón, Z.; de la Rosa, J.M.; Dorta, E.; Cueto, M.; D’Croz, L.; Maté, J.; Darias, J. Carijodienone from the Octocoral Carijoa multiflora. A Spiropregnane-Based Steroid. J. Nat. Prod. 2011, 74, 292–295. [Google Scholar] [CrossRef]
- Sung, P.-J.; Liu, C.-Y. New 3beta,5alpha,6beta-trihydroxysteroids from the octocorals Bebryce sp. (Plexauridae) and Carijoa sp. (Clavulariidae). Chem. Pharm. Bull. 2010, 58, 1240–1242. [Google Scholar] [CrossRef]
- Maia, L.F.; Epifanio, R.d.A.; Fenical, W. New Cytotoxic Sterol Glycosides from the Octocoral Carijoa (Telesto) riisei. J. Nat. Prod. 2000, 63, 1427–1430. [Google Scholar] [CrossRef]
- Nguyen Hoai, N.; Nguyen Thi, H.; Tran Thi Hong, H.; Nguyen Van, T.; Nguyen Xuan, C.; Do Cong, T.; Phan Van, K.; Chau Van, M. Pregnane steroids from the Vietnamese octocoral Carijoa riisei. Nat. Prod. Res. 2017, 31, 2435–2440. [Google Scholar] [CrossRef] [PubMed]
- Dorta, E.; Díaz-Marrero, A.R.; Cueto, M.; D’Croz, L.; Maté, J.L.; San-Martín, A.; Darias, J. Unusual chlorinated pregnanes from the eastern Pacific octocoral Carijoa multiflora. Tetrahedron Lett. 2004, 45, 915–918. [Google Scholar] [CrossRef]
- Zhao, H.-Y.; Shao, C.-L.; Li, Z.-Y.; Han, L.; Cao, F.; Wang, C.-Y. Bioactive pregnane steroids from a South China Sea gorgonian Carijoa sp. Molecules 2013, 18, 3458–3466. Molecules 2013, 18, 3458–3466. [Google Scholar] [CrossRef]
- Baker, B.J.; Okuda, R.K.; Yu, P.T.; Scheuer, P.J. Punaglandins: Halogenated antitumor eicosanoids from the octocoral Telesto riisei. J. Am. Chem. Soc. 1985, 107, 2976–2977. [Google Scholar] [CrossRef]
- Baker, B.J.; Scheuer, P.J. The punaglandins: 10-chloroprostanoids from the octocoral Telesto riisei. J. Nat. Prod. 1994, 57, 1346–1353. [Google Scholar] [CrossRef]
- Fukushima, M.; Kato, T. Antitumor marine icosanoids: Clavulones and punaglandins. Adv. Prostaglandin Thromboxane Leukot. Res. 1985, 15, 415–418. [Google Scholar]
- Verbitski, S.M.; Mullally, J.E.; Fitzpatrick, F.A.; Ireland, C.M. Punaglandins, Chlorinated Prostaglandins, Function as Potent Michael Receptors To Inhibit Ubiquitin Isopeptidase Activity. J. Med. Chem. 2004, 47, 2062–2070. [Google Scholar] [CrossRef] [PubMed]
- Dominguez, J.N.; Taddei, A.; Cordero, M.; Blanca, I. Synthesis of C (10)-halogenated prostaglandins. J. Pharm. Sci. 1994, 83, 472–475. [Google Scholar] [CrossRef] [PubMed]
- Dorta, E.; Díaz-Marrero, A.-R.; Cueto, M.; D’Croz, L.; Maté, J.L.; Darias, J. Carijenone, a Novel Class of Bicyclic Prostanoid from the Eastern Pacific Octocoral Carijoa multiflora. Org. Lett. 2004, 6, 2229–2232. [Google Scholar] [CrossRef]
- MPSC. Australian Priority Marine Pest List: Process and Outcomes, Prepared by ABARES; Australian Government: Canberra, ACT, Australia, 2018; pp. 135–136.
- Janes, R. Benthic Assemblage Structure of Artificial Reefs in South East Queensland, Australia; Griffith University: Gold Coast, QLD, Australia, 2019. [Google Scholar]
- Harris, D. Impacts of Invasive Octocoral Carijoa riisei on Sessile Benthic Organism Communities in South East Queensland Reef Systems; Griffith University: Gold Coast, QLD, Australia, 2021. [Google Scholar]
- Davie, P.; Corporation, P.o.B.; Museum, Q. Wild Guide to Moreton Bay, 2nd ed.; Queensland Museum: Brisbane, AU, Australia, 2010. [Google Scholar]
- Suzuki, M.; Morita, Y.; Yanagisawa, A.; Baker, B.J.; Scheuer, P.J.; Noyori, R. Prostaglandin synthesis 15. Synthesis and structural revision of (7E)-and (7Z)-punaglandin 4. J. Org. Chem. 1988, 53, 286–295. [Google Scholar] [CrossRef]
- Sander, T.; Freyss, J.; von Korff, M.; Rufener, C. DataWarrior: An open-source program for chemistry aware data visualization and analysis. J. Chem. Inf. Model. 2015, 55, 460–473. [Google Scholar] [CrossRef]
- Frisch, M.J.; Trucks, G.W.; Schlegel, H.B.; Scuseria, G.E.; Robb, M.A.; Cheeseman, J.R.; Scalmani, G.; Barone, V.; Petersson, G.A.; Nakatsuji, H.; et al. Gaussian 16 Rev. C.01. 2016. Available online: https://gaussian.com/citation/ (accessed on 28 October 2025).
- Tomasi, J.; Mennucci, B.; Cammi, R. Quantum Mechanical Continuum Solvation Models. Chem. Rev. 2005, 105, 2999–3094. [Google Scholar] [CrossRef]
- Bruhn, T.; Schaumlöffel, A.; Hemberger, Y.; Bringmann, G. SpecDis: Quantifying the Comparison of Calculated and Experimental Electronic Circular Dichroism Spectra. Chirality 2013, 25, 243–249. [Google Scholar] [CrossRef]
- Willoughby, P.H.; Jansma, M.J.; Hoye, T.R. A guide to small-molecule structure assignment through computation of (1H and 13C) NMR chemical shifts. Nat. Protoc. 2014, 9, 643–660. [Google Scholar] [CrossRef]
- Bulcock, B.W.; Chooi, Y.-H.; Flematti, G.R. SpectroIBIS: Automated Data Processing for Multiconformer Quantum Chemical Spectroscopic Calculations. J. Nat. Prod. 2025, 88, 495–501. [Google Scholar] [CrossRef]
- Mi, Y.; Ren, Y.-H.; Li, Y.; Zhang, R.-C.; Zhao, J.-X.; Zhou, B.; Yue, J.-M. Rare Chlorinated C19 Steroids Hocarnoids A and B from Hoya carnosa: Isolation, Semisynthesis, and Anti-inflammation. J. Org. Chem. 2025, 90, 4714–4724. [Google Scholar] [CrossRef]
- Higgs, M.D.; Faulkner, D.J. 5α-Pregna-1, 20-dien-3-one and related compounds from a soft coral. Steroids 1977, 30, 379–388. [Google Scholar] [CrossRef]
- Suzuki, M.; Morita, Y.; Yanagisawa, A.; Noyori, R.; Baker, B.J.; Scheuer, P.J. Prostaglandin synthesis. 12. Synthesis of (7E)-and (7Z)-punaglandin 4. Structural revision. J. Am. Chem. Soc. 1986, 108, 5021–5022. [Google Scholar] [CrossRef]
- Watanabe, K.; Sekine, M.; Takahashi, H.; Iguchi, K. New Halogenated Marine Prostanoids with Cytotoxic Activity from the Okinawan Soft Coral Clavularia viridis. J. Nat. Prod. 2001, 64, 1421–1425. [Google Scholar] [CrossRef]
- Maida, M.; Sammarco, P.; Coll, J.C. Effects of soft corals on scleractinian coral recruitment. I: Directional allelopathy and inhibition of settlement. Mar. Ecol. Prog. Ser. 1995, 121, 191–202. [Google Scholar] [CrossRef]
- Maida, M.; Sammarco, P.W.; Coll, J.C. Preliminary evidence for directional allelopathic effects of the soft coral Sinularia flexibilis (Alcyonacea: Octocorallia) on scleractinian coral recruitment. Bull. Mar. Sci. 1995, 56, 303–311. [Google Scholar]
- Maida, M.; Sammarco, P.W.; Coll, J.C. Effects of Soft Corals on Scleractinian Coral Recruitment. II: Allelopathy, Spat Survivorship and Reef Community Structure. Mar. Ecol. 2001, 22, 397–414. [Google Scholar] [CrossRef]
- Aratake, S.; Tomura, T.; Saitoh, S.; Yokokura, R.; Kawanishi, Y.; Shinjo, R.; Reimer, J.D.; Tanaka, J.; Maekawa, H. Soft Coral Sarcophyton (Cnidaria: Anthozoa: Octocorallia) Species Diversity and Chemotypes. PLoS ONE 2012, 7, e30410. [Google Scholar] [CrossRef] [PubMed]
- Hill, R.T.; Fenical, W. Pharmaceuticals from marine natural products: Surge or ebb? Curr. Opin. Biotechnol. 2010, 21, 777–779. [Google Scholar] [CrossRef] [PubMed]
- Vohsen, S.A.; Fisher, C.R.; Baums, I.B. Metabolomic richness and fingerprints of deep-sea coral species and populations. Metabolomics 2019, 15, 34. [Google Scholar] [CrossRef] [PubMed]
- Řezanka, T.; Dembitsky Valery, M. Brominated Oxylipins and Oxylipin Glycosides from Red Sea Corals. Eur. J. Org. Chem 2003, 2003, 309–316. [Google Scholar] [CrossRef]
- Shen, Y.-C.; Cheng, Y.-B.; Lin, Y.-C.; Guh, J.-H.; Teng, C.-M.; Ko, C.-L. New Prostanoids with Cytotoxic Activity from Taiwanese Octocoral Clavularia viridis. J Nat Prod 2004, 67, 542–546. [Google Scholar] [CrossRef] [PubMed]
- Iguchi, K.; Kaneta, S.; Mori, K.; Yamada, Y.; Honda, A.; Mori, Y. Chlorovulones, new halogenated marine prostanoids with an antitumor activity from the stolonifer Clavularia viridis Quoy and Gaimard. Tetrahedron Lett. 1985, 26, 5787–5790. [Google Scholar] [CrossRef]
- Watanabe, K.; Sekine, M.; Iguchi, K. Isolation and Structures of New Halogenated Prostanoids from the Okinawan Soft Coral Clavularia viridis. J. Nat. Prod. 2003, 66, 1434–1440. [Google Scholar] [CrossRef]
- Ross, R.A.; Scheuer, P.J. 18-acetoxy- and 18-hydroxypregna-1,4,20-trien-3-one from the telestacean octocoral Telesto riisei (Duchassaing & Michelotti). Tetrahedron Lett. 1979, 20, 4701–4702. [Google Scholar] [CrossRef]
Disclaimer/Publisher’s Note: The statements, opinions and data contained in all publications are solely those of the individual author(s) and contributor(s) and not of MDPI and/or the editor(s). MDPI and/or the editor(s) disclaim responsibility for any injury to people or property resulting from any ideas, methods, instructions or products referred to in the content. |
© 2025 by the authors. Licensee MDPI, Basel, Switzerland. This article is an open access article distributed under the terms and conditions of the Creative Commons Attribution (CC BY) license (https://creativecommons.org/licenses/by/4.0/).