1. Introduction
The imperative to achieve the United Nations Sustainable Development Goals (SDGs), particularly SDG 7 (Affordable and Clean Energy) and SDG 13 (Climate Action), along with global commitments to carbon neutrality, is driving a profound transformation across the maritime industry [
1,
2]. This transition is critical not only for decarbonizing international shipping but also for enhancing the energy security and sustainable economic development of remote island communities. In these contexts, abundant solar PV resources offer a promising pathway to clean energy generation [
3]. However, a significant challenge persists in many coastal and island regions of China, where the vast potential of solar power often surpasses local immediate electricity consumption capacity. While this natural endowment provides a solid foundation for clean energy development, it also leads to considerable energy wastage due to the inherent limitations of traditional battery storage in terms of capacity, scale, and duration [
4]. Therefore, the effective utilization of this surplus energy is crucial for building a genuinely green and self-sufficient marine energy ecosystem.
Hydrogen energy storage technology has emerged as a pivotal innovation to support the green marine vision, enabling the conversion of surplus PV electricity into green hydrogen through electrolysis for storage in tanks [
5,
6,
7]. Although the “power-to-hydrogen-to-power” cycle exhibits a relatively low round-trip efficiency of 25–35% compared to 85–95% for modern battery systems, its principal value lies in providing seasonal and large-scale energy buffering. This capability positions hydrogen as a “green bridge” that links renewable generation with consumption across extended periods, enhancing system flexibility and resilience [
8,
9].
Unlike batteries, which are suited for short- to medium-term storage (hours to days) but face limitations in cost and self-discharge over longer durations, hydrogen is ideally suited for long-term (weeks to seasons) and massive energy storage. It thereby ensures a reliable power supply during periods of PV intermittency, such as at night or during prolonged cloudy weather. Through reconversion of hydrogen into electricity via fuel cells or HGTs [
10,
11], this approach makes otherwise curtailed solar energy usable, thus improving the self-sufficiency of the microgrid. Hydrogen storage does not replace but complements batteries, forming a hybrid architecture that synergistically combines intra-day power reliability with seasonal energy assurance.
Further in-depth analysis reveals that the significant fluctuation of PV power generation and the time-varying nature of load demand pose complex challenges for power generation system scheduling and control [
12]. Especially when the system faces sharp load changes or unexpected situations, since the electric-hydrogen-electric conversion process essentially relies on chemical reactions, its instantaneous response speed is relatively slow, making it difficult to quickly fill power gaps in the grid or effectively absorb surplus power. Therefore, it is necessary to introduce energy storage systems with fast response characteristics to balance system power in real time, mitigate fluctuations, and collaborate with hydrogen energy systems to maintain the voltage stability of islanded microgrids [
13,
14]. The supercapacitor energy storage system, with its excellent rapid charging and discharging capabilities and efficient mitigation of high-frequency fluctuations, becomes the key to addressing this shortcoming. Meanwhile, the introduction of lithium batteries can effectively maintain the stability of the DC bus [
15,
16]. The synergistic operation of supercapacitors, batteries, and electrolyzers not only flexibly addresses power fluctuations in the system but also optimizes energy allocation, ensuring stable operation of the hydrogen microgrid under dynamic changes [
17,
18].
Currently, scholars all over the world have achieved numerous research results regarding hydrogen-coupled DC microgrid systems. Han et al. [
19] put forward a dual-layer control strategy used in a DC microgrid powered by PV and fuel cells. In terms of device control, a control method that switches between maximum power point tracking (MPPT) and droop control modes for PV is put forward to keep the system reliable. In terms of system control, an equivalent consumption minimization strategy is adopted to achieve a rational power distribution within the system. Fabrice et al. [
20] put forward a control strategy used in a microgrid with PV power generation and hydrogen storage. The strategy allocates power within the system among fuel cells, electrolyzers, and batteries through a model predictive control approach in a rational manner. The SOC of the battery is maintained within a reasonable range, ensuring that there is sufficient energy stored for the system. The aforementioned method achieves coordinated stability and reliable operation of the system through a reasonable control strategy. However, under conditions of large power fluctuations, such as significant changes in PV power generation or load demand, it is unable to achieve stable system operation.
Tang et al. [
21] considered possible power mutations within the system and proposed an energy management framework based on HESS combining electric and hydrogen. This framework optimizes hydrogen flow between the microgrid and hydrogen fueling stations by dividing the load power into high- and low-frequency parts. The components are allocated to supercapacitors, electrolyzers and fuel cells, smoothing the power within the system and achieving power distribution between the power and hydrogen systems.
While fuel cells offer distinct benefits for small- and medium-sized hydrogen microgrids, they face limitations in large-scale applications. Their application in large-scale scenarios presents limitations, especially in scenarios such as large islands with abundant wind and solar resources, where peak shaving is crucial and the required power levels can reach multiple megawatts. This far exceeds the several-hundred-kilowatt range of typical high-power fuel cell systems. Scaling fuel cells to meet this demand is hindered by significant technical and economic challenges [
22].
In this context, hydrogen-fueled gas turbines (HGTs) present a compelling alternative for marine applications. Industrial-grade HGTs readily achieve megawatt-scale outputs, offering a combination of high efficiency, operational flexibility, and excellent load regulation [
10,
23]. These attributes make HGTs exceptionally well-suited for critical roles such as grid peaking and backup power, particularly in managing sudden load shifts or compensating for renewable intermittency [
24,
25]. Furthermore, from a cost perspective, HGTs have lower manufacturing, operating, and maintenance costs in large-scale applications. Moreover, existing gas turbine equipment can be retrofitted, further reducing overall costs [
26]. These reasons make HGTs more cost-effective and competitive in large-scale marine and island hydrogen microgrid systems.
According to the analysis presented above, research on the application of HGTs in large-scale PV hydrogen production systems is necessary. By optimizing the control strategy of HGTs, it is possible to better meet the needs of peak shaving and valley filling applications, achieve flexible regulation and efficient utilization of power output, and provide robust support for the stable operation of large-scale PV power generation systems. Wang et al. [
27] constructed a hydrogen production micro gas turbine DC microgrid system model and proposed a power allocation strategy that comprehensively considers the SOC of the battery and the state of hydrogen. Through the coordination control layer power judgment module for coordinated control, the service life of lithium batteries is effectively extended.
An analysis of existing energy management strategies reveals several common approaches, each with distinct trade-offs between performance, complexity, and implementability, as summarized in
Table 1 [
28].
Based on the complex, nonlinear, and time-varying nature of the island microgrid, which is characterized by fluctuating PV output, slow HGT response, and the need for real-time HESS management, a fuzzy logic-based control strategy is selected. This approach strikes a favorable balance, delivering adaptive and robust performance comparable to more complex methods while maintaining the computational feasibility essential for practical implementation. Although global optimality, as achieved by some optimization methods, is not guaranteed, the fuzzy controller effectively fulfills the core control objectives of voltage stabilization and HESS lifespan preservation, as validated in the case studies.
To evaluate this strategy, a DC microgrid model integrating PV, HGT, electrolyzer, and HESS is established in Matlab/Simulink, enabling an in-depth investigation into the coordinated operation and control of the island PV-HGT power generation system. Compared with the existing literature, the main contributions of this paper are reflected in the following aspects:
(1) A two-layer coordinated control framework combining primary power distribution and secondary power correction is proposed. A fuzzy logic-based secondary correction strategy to a complex island microgrid encompassing PV, HGT, and HESS is applied in this paper, achieving dynamic and adaptive management of DC bus voltage and SOCs of the HESS.
(2) The collaborative response characteristics between HGT and HESS have been thoroughly explored. Most existing literature focuses on the coordination between fuel cells and HESS, while research on coordinated control and power smoothing strategies between HGT and HESS remains inadequate. Through the established island microgrid based on a hydrogen gas turbine, this paper analyzes the power distribution logic of HGT under various operating modes.
(3) A secondary correction strategy for supercapacitors based on DC bus voltage thresholds has been designed. The strategy provides the system with crucial dynamic voltage regulation capability. Not only can it smoothly cope with the random fluctuations in load and PV power, but it can also effectively suppress the transient power surges generated during operating mode transitions, thereby comprehensively improving the voltage quality of the DC bus.
3. Control Strategy of the System
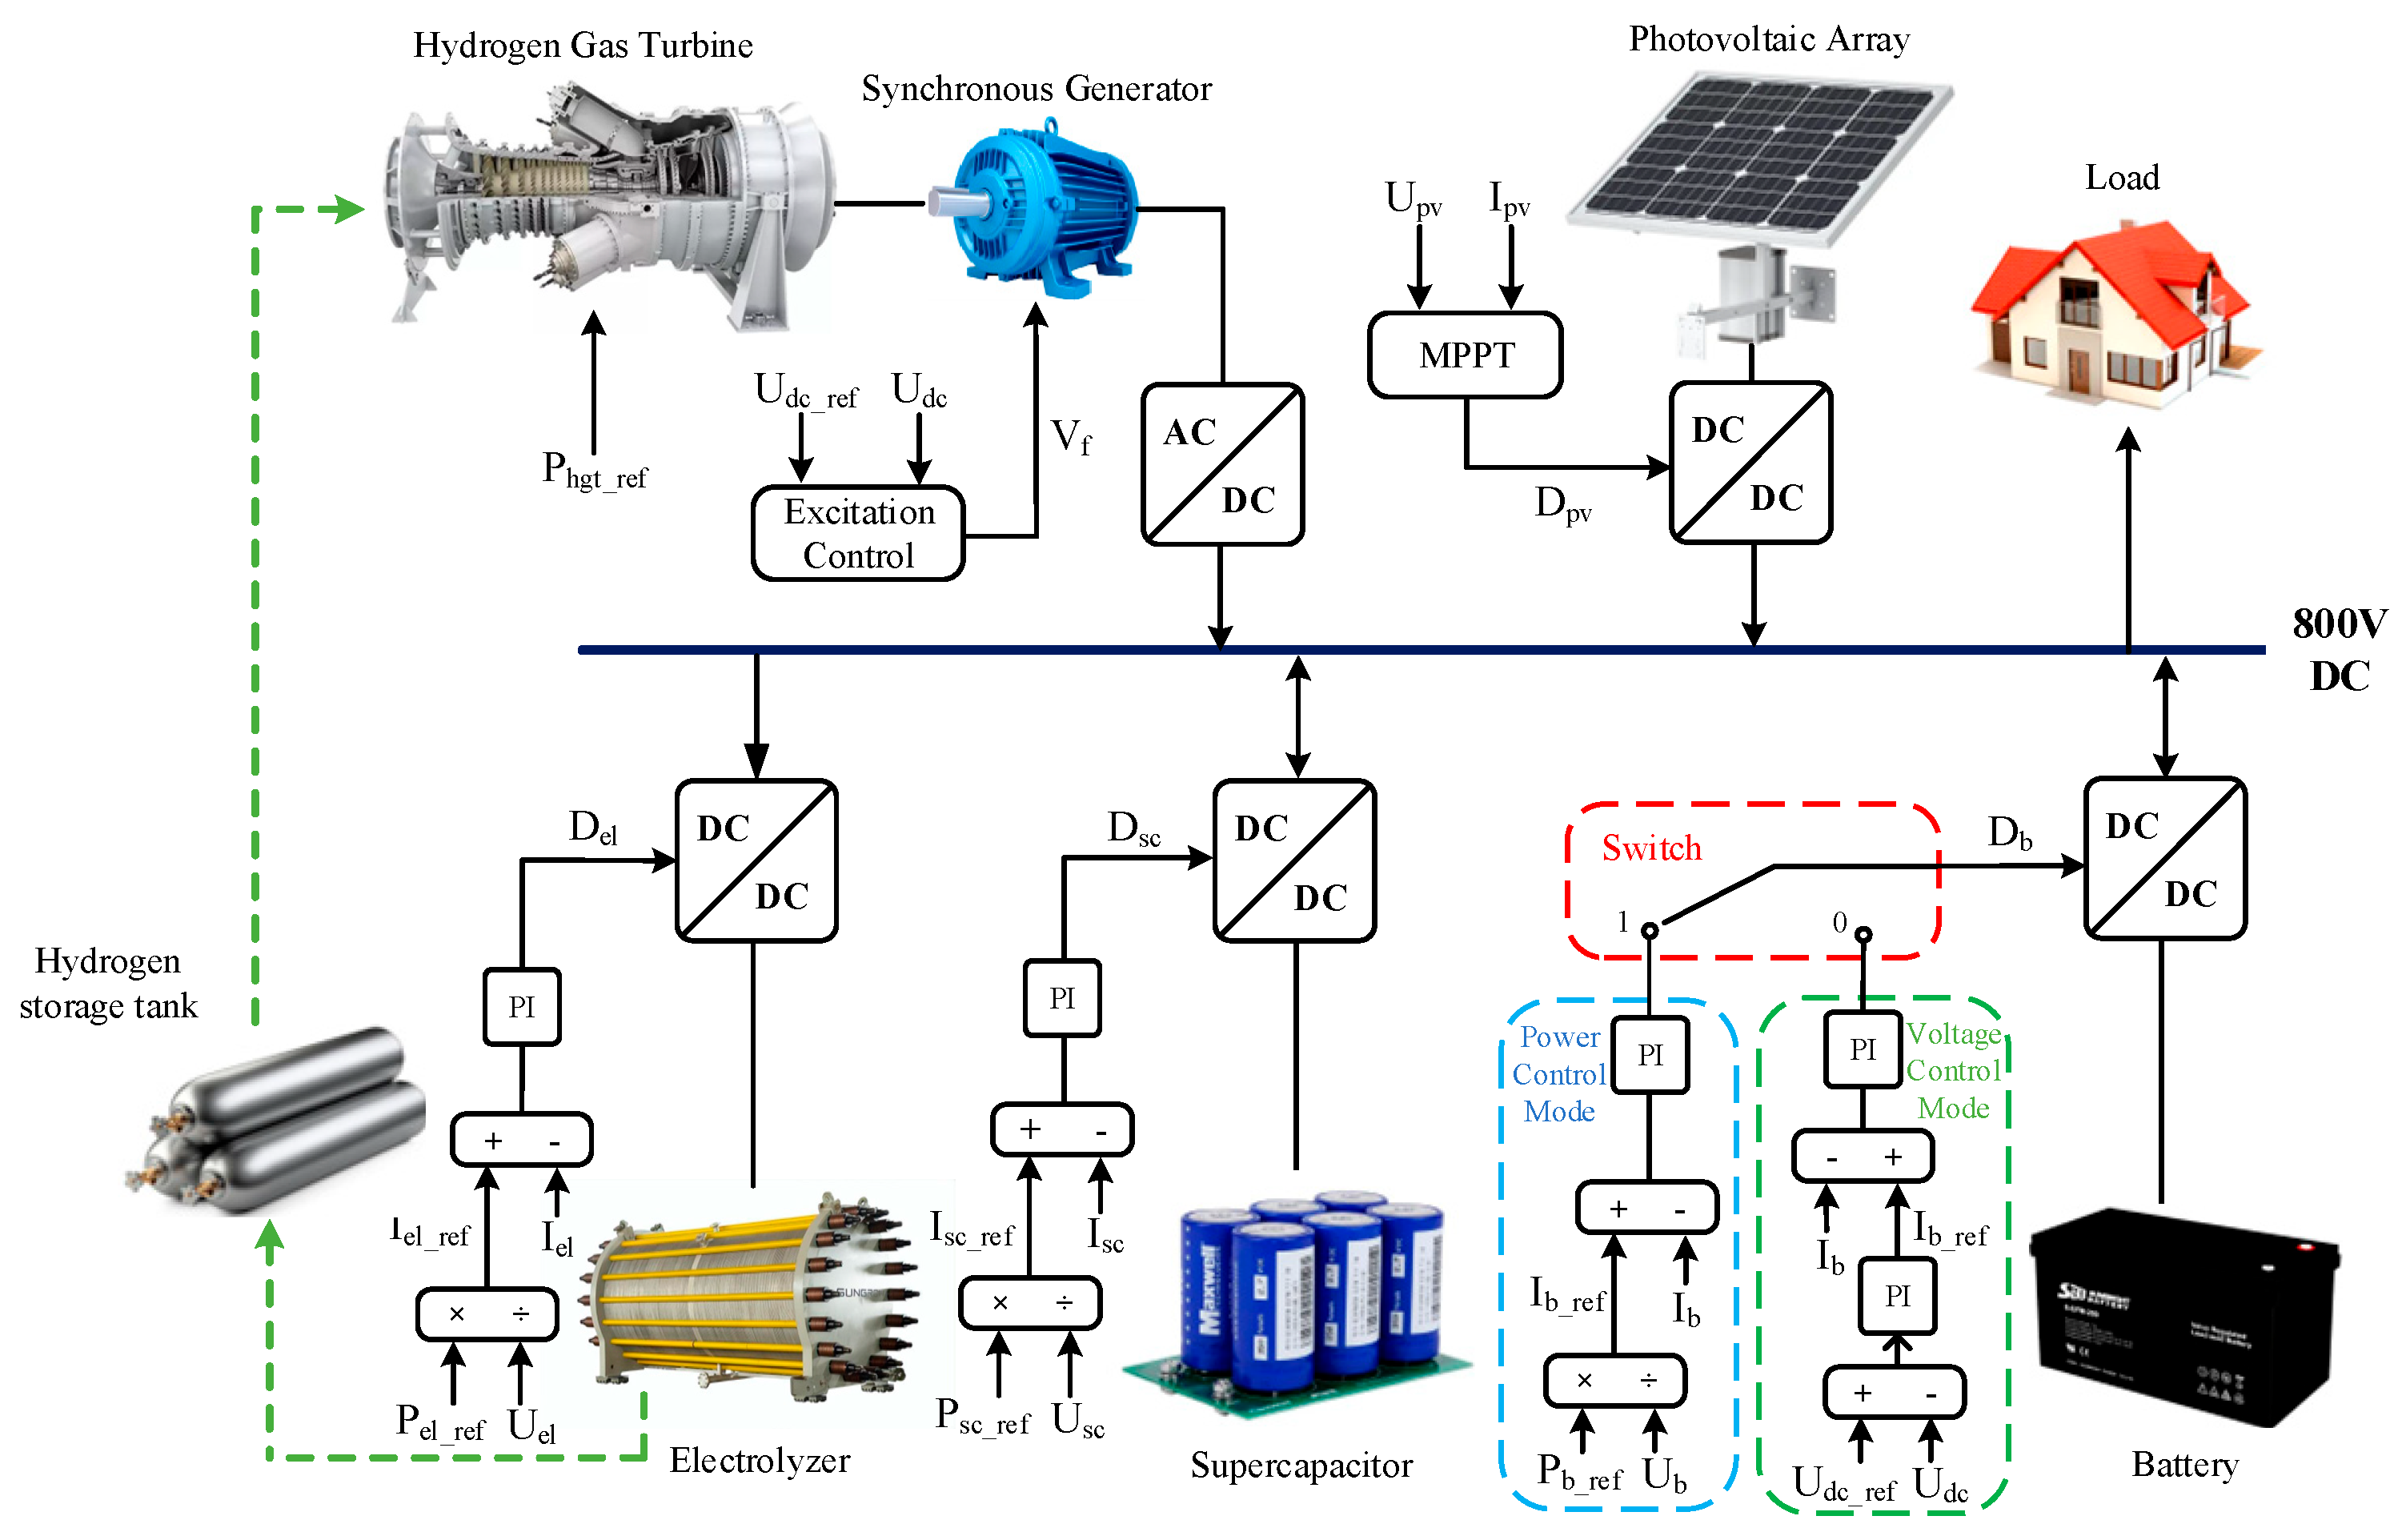
Taking into account the different dynamic response capabilities of the supercapacitor, battery, electrolyzer and HGT, a power allocation strategy that includes primary power frequency division using a low-pass filter and secondary power correction for battery and supercapacitor is proposed. This strategy aims to meet the requirements for stable system operation and coordinated control of each component. The operating state is determined based on three factors: PV generation power , load power and the minimum operating power of the HGT . To obtain more clarity about the system performance characteristics, the operating states are classified into three modes in this paper.
The switching signal for the battery control mode is obtained through the preset Switch module:
When the PV output power exceeds the load demand power, the HGT is not activated, and the Switch signal is 0. At this time, since there is no specific controller that maintains stable voltage, the battery operates in voltage control mode, utilizing a PI control system of voltage to maintain stable bus voltage. However, in voltage control mode, it is difficult to directly regulate the power of the battery. When the PV power is lower than the load demand, the system bus voltage stability can be maintained through supercapacitor power correction or excitation control of the synchronous generator of HGT. Therefore, the battery control mode switches to power control mode at this time, allowing for more flexible control of the battery through a single PI control of the current loop.
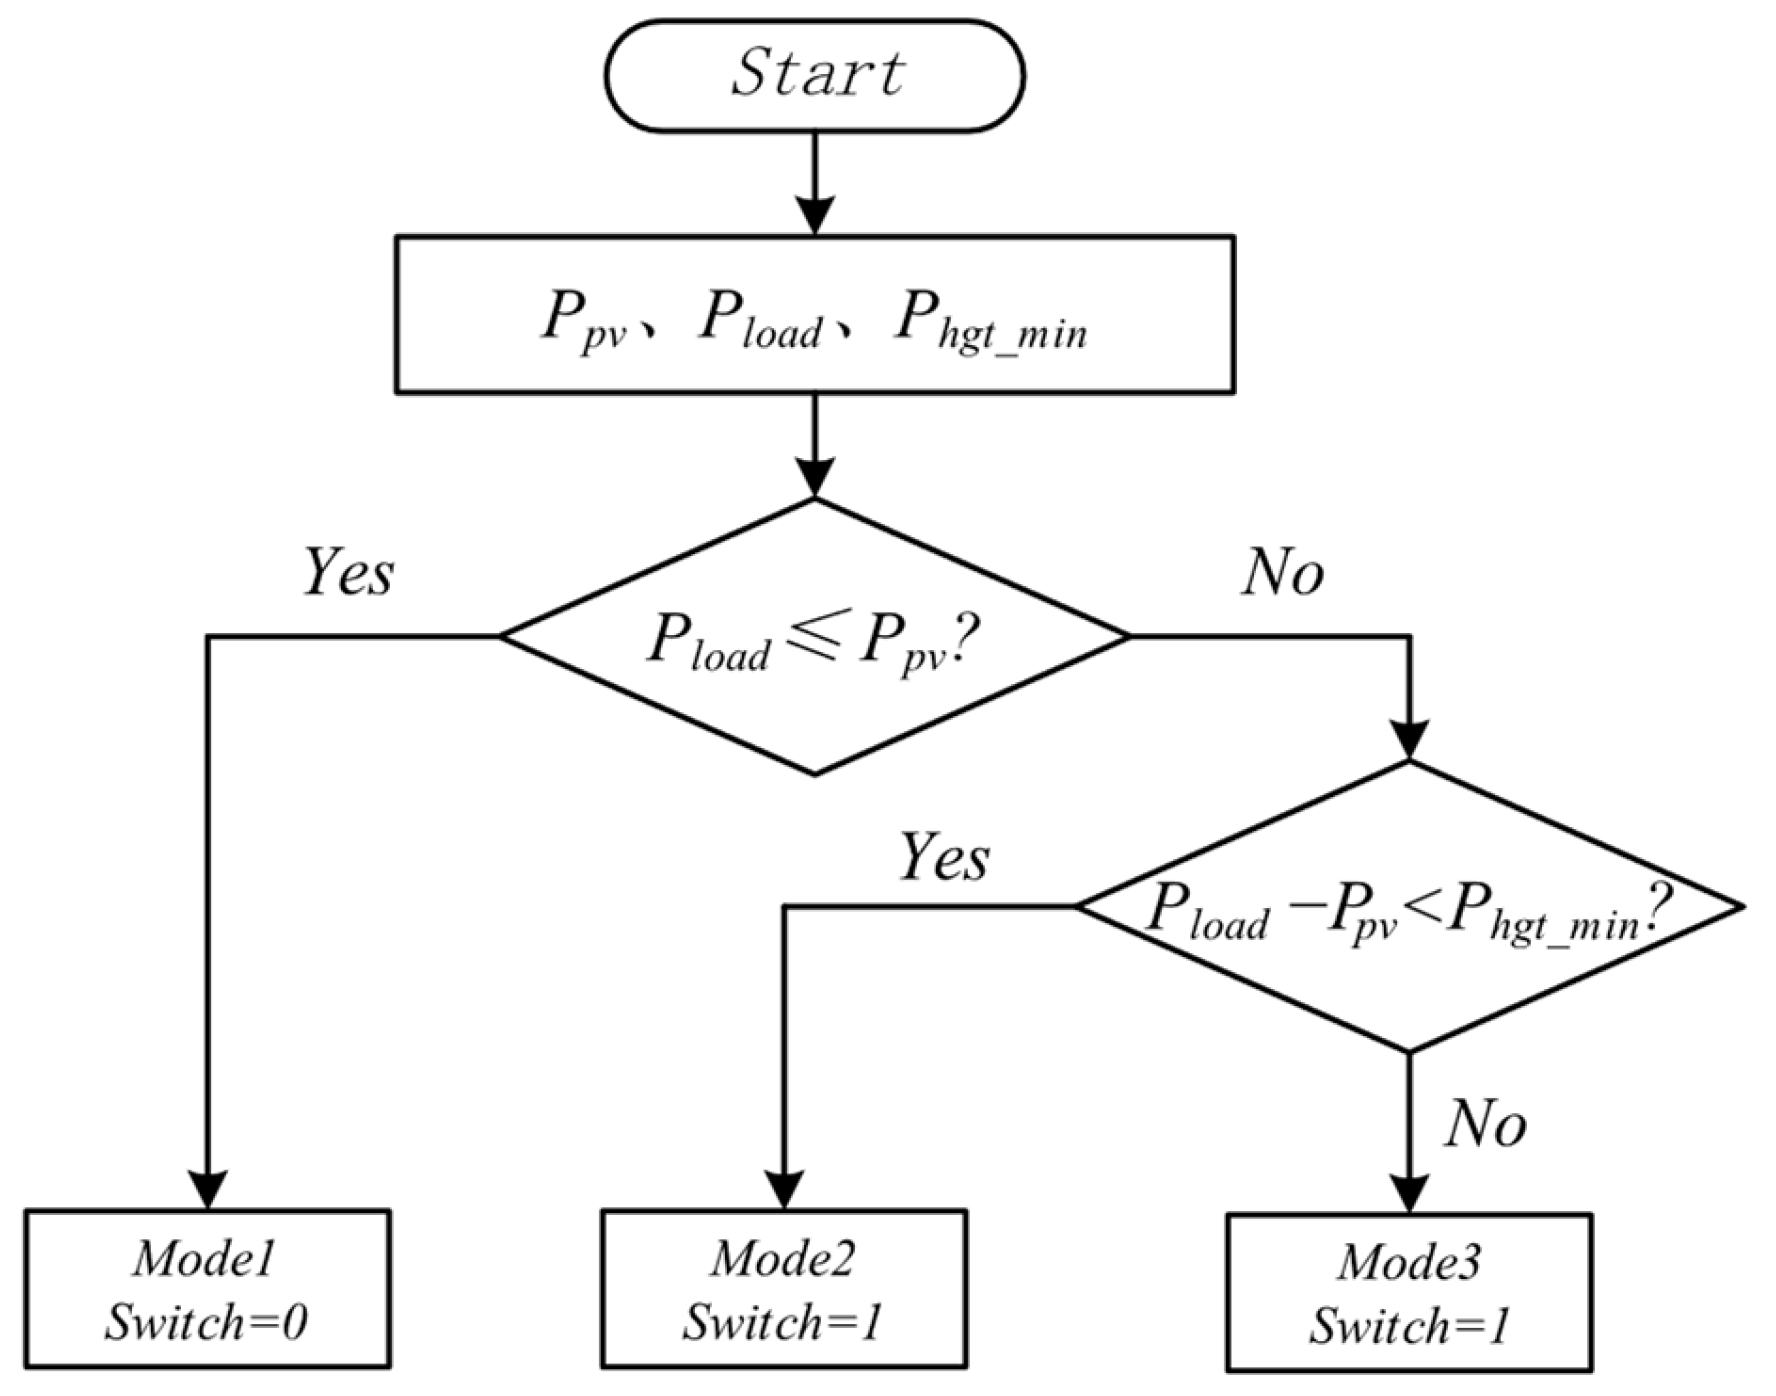
The mode of the system is determined by the following equation:
The flow chart of the system mode judgment is shown in
Figure 3.
If the power difference hovers near the minimum operating power of the HGT, the system mode would switch repeatedly under the ideal logic described by expressions (14) and (15). This would lead to undesirable and damaging repeated starts and stops of the hydrogen gas turbine, severely impacting its operational lifespan. To prevent this in a practical implementation, the proposed control strategy framework is fully compatible with and would incorporate hysteresis control and/or a time-delay judgment mechanism. For instance, a transition from Mode 2 to Mode 3 would only be triggered if the condition is satisfied continuously for a preset duration. Conversely, a return to Mode 1 would require to hold true for a separate, defined period. This introduces a necessary “dead band” that filters out transient fluctuations. In this study, the idealized switching condition was adopted to simplify the simulation analysis and to more clearly demonstrate the fundamental power allocation principles and the performance of the secondary correction strategy under defined modes.
When the power generated by PV exceeds the load demand, the system works in Mode 1. In this mode, any excess power is utilized by the electrolyzer, with the Switch signal being 0. Meanwhile, the battery works in a voltage-controlled manner to keep the DC bus voltage at its rated level.
When the power generated by PV is slightly below the load demand and the power shortfall has not yet reached the HGT minimum operating power , the system works in Mode 2. During this period, the electrolyzer ceases operation, and the HGT remains inactive. The Switch signal is 1, and the battery switches to power control mode, where it automatically adjusts to fill in the power deficit within the system.
When the power generated by PV is far below the load demand and the power shortfall is greater than or equal to the minimum operating power of the HGT, the system works in Mode 3. At this time, the HGT starts to burn hydrogen, driving the synchronous generator to generate electricity. Excitation control is used to maintain stable bus voltage.
3.1. Control Strategy of Mode 1
To maintain stable and efficient operation of the battery and supercapacitor during the operation in Mode 1, it is necessary to dynamically adjust the power required by the electrolyzer and HESS based on actual SOC of the supercapacitor
and actual SOC of the battery
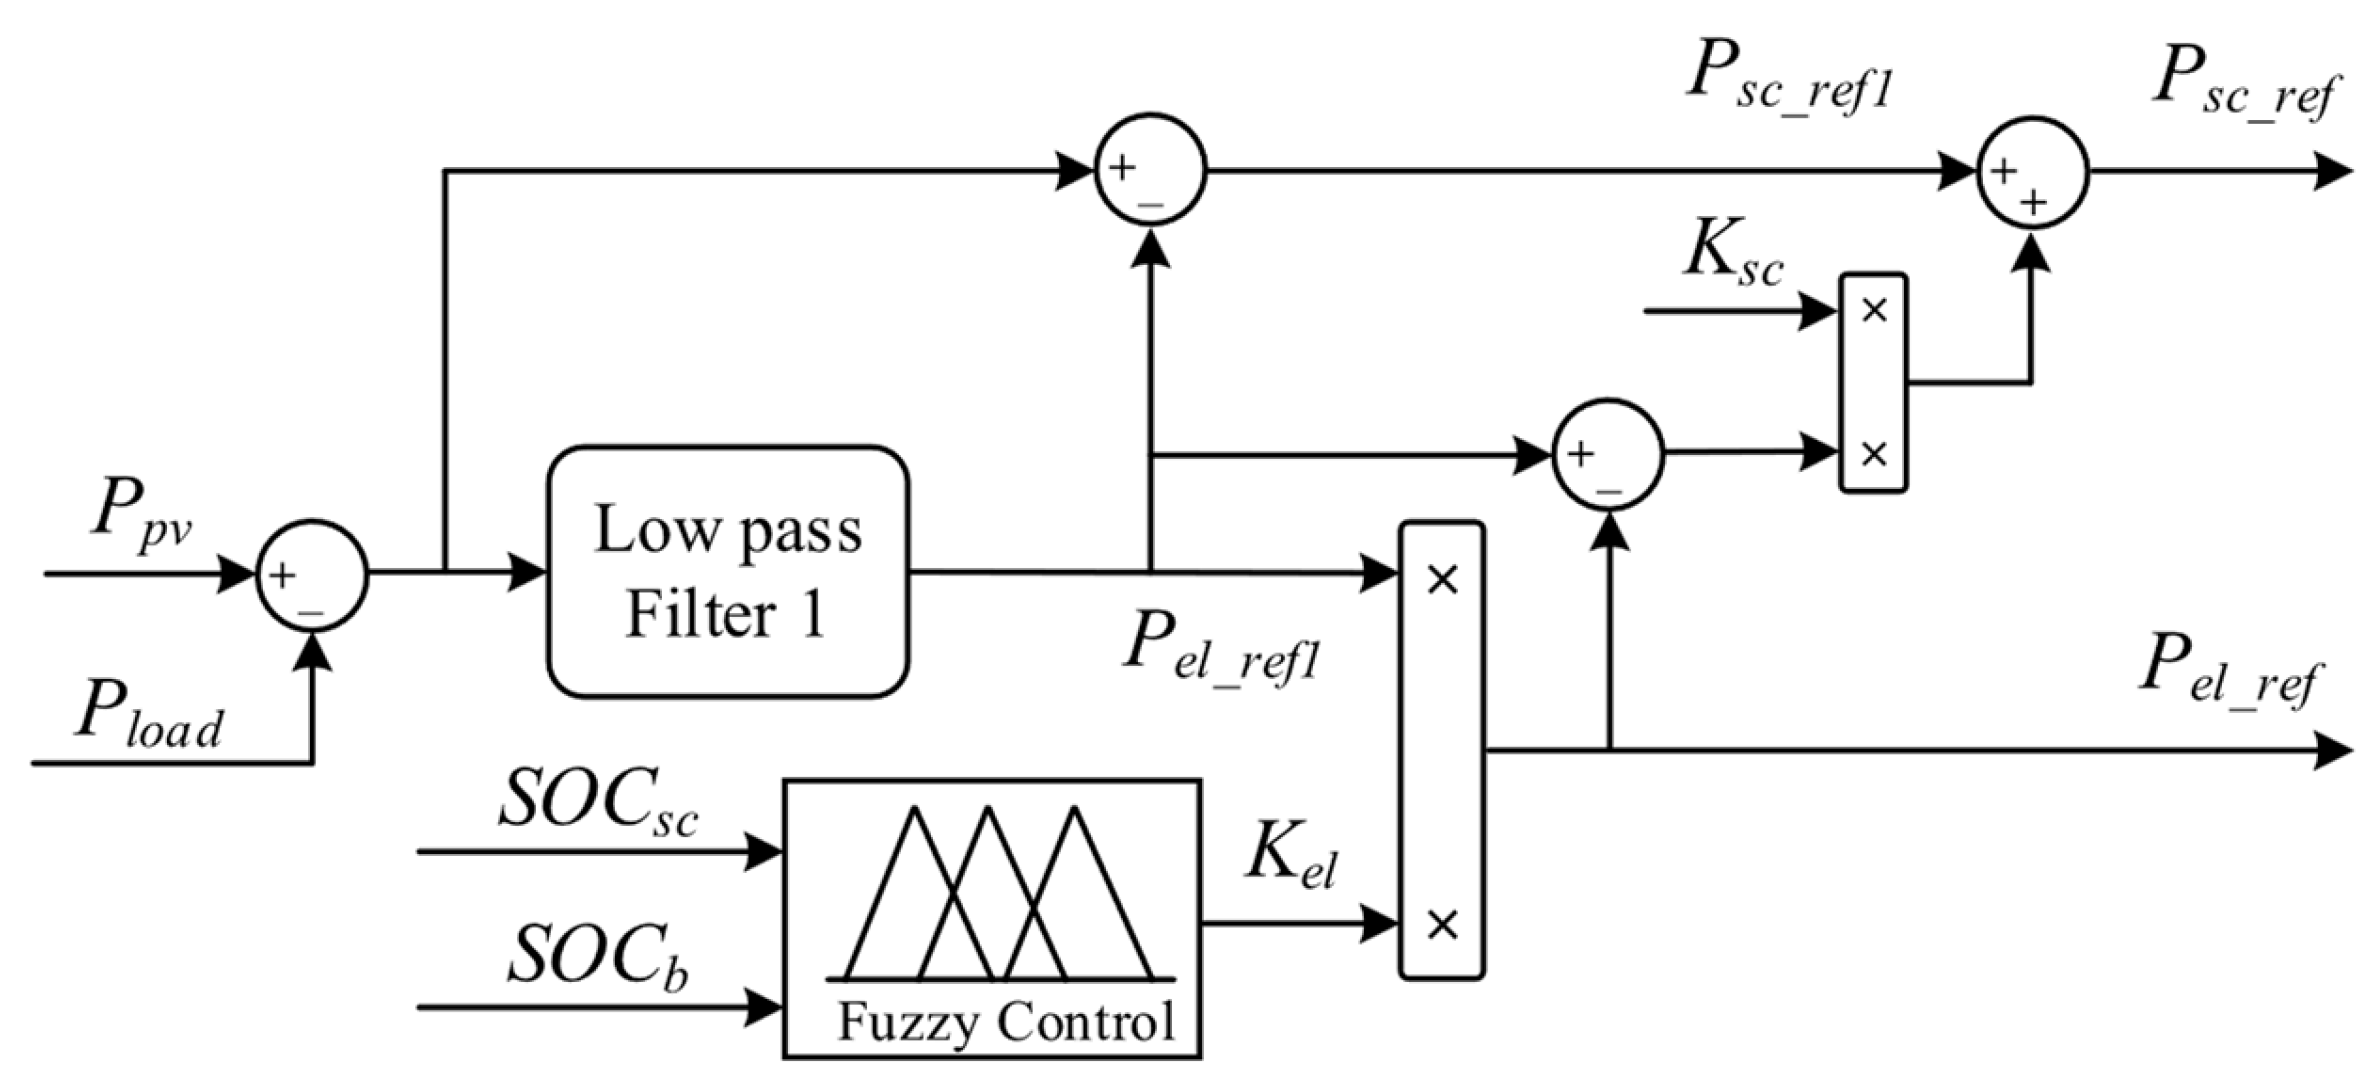
. When the SOC of the HESS falls below a low threshold, the set strategy is implemented to charge the hybrid energy storage. It can maintain the SOC of HESS within a reasonable range, avoid overcharging or over-discharging of the HESS, and maximize the coordinated and stable operation of the system. A fuzzy logic controller is proposed to optimize power allocation in the system under mode 1 [
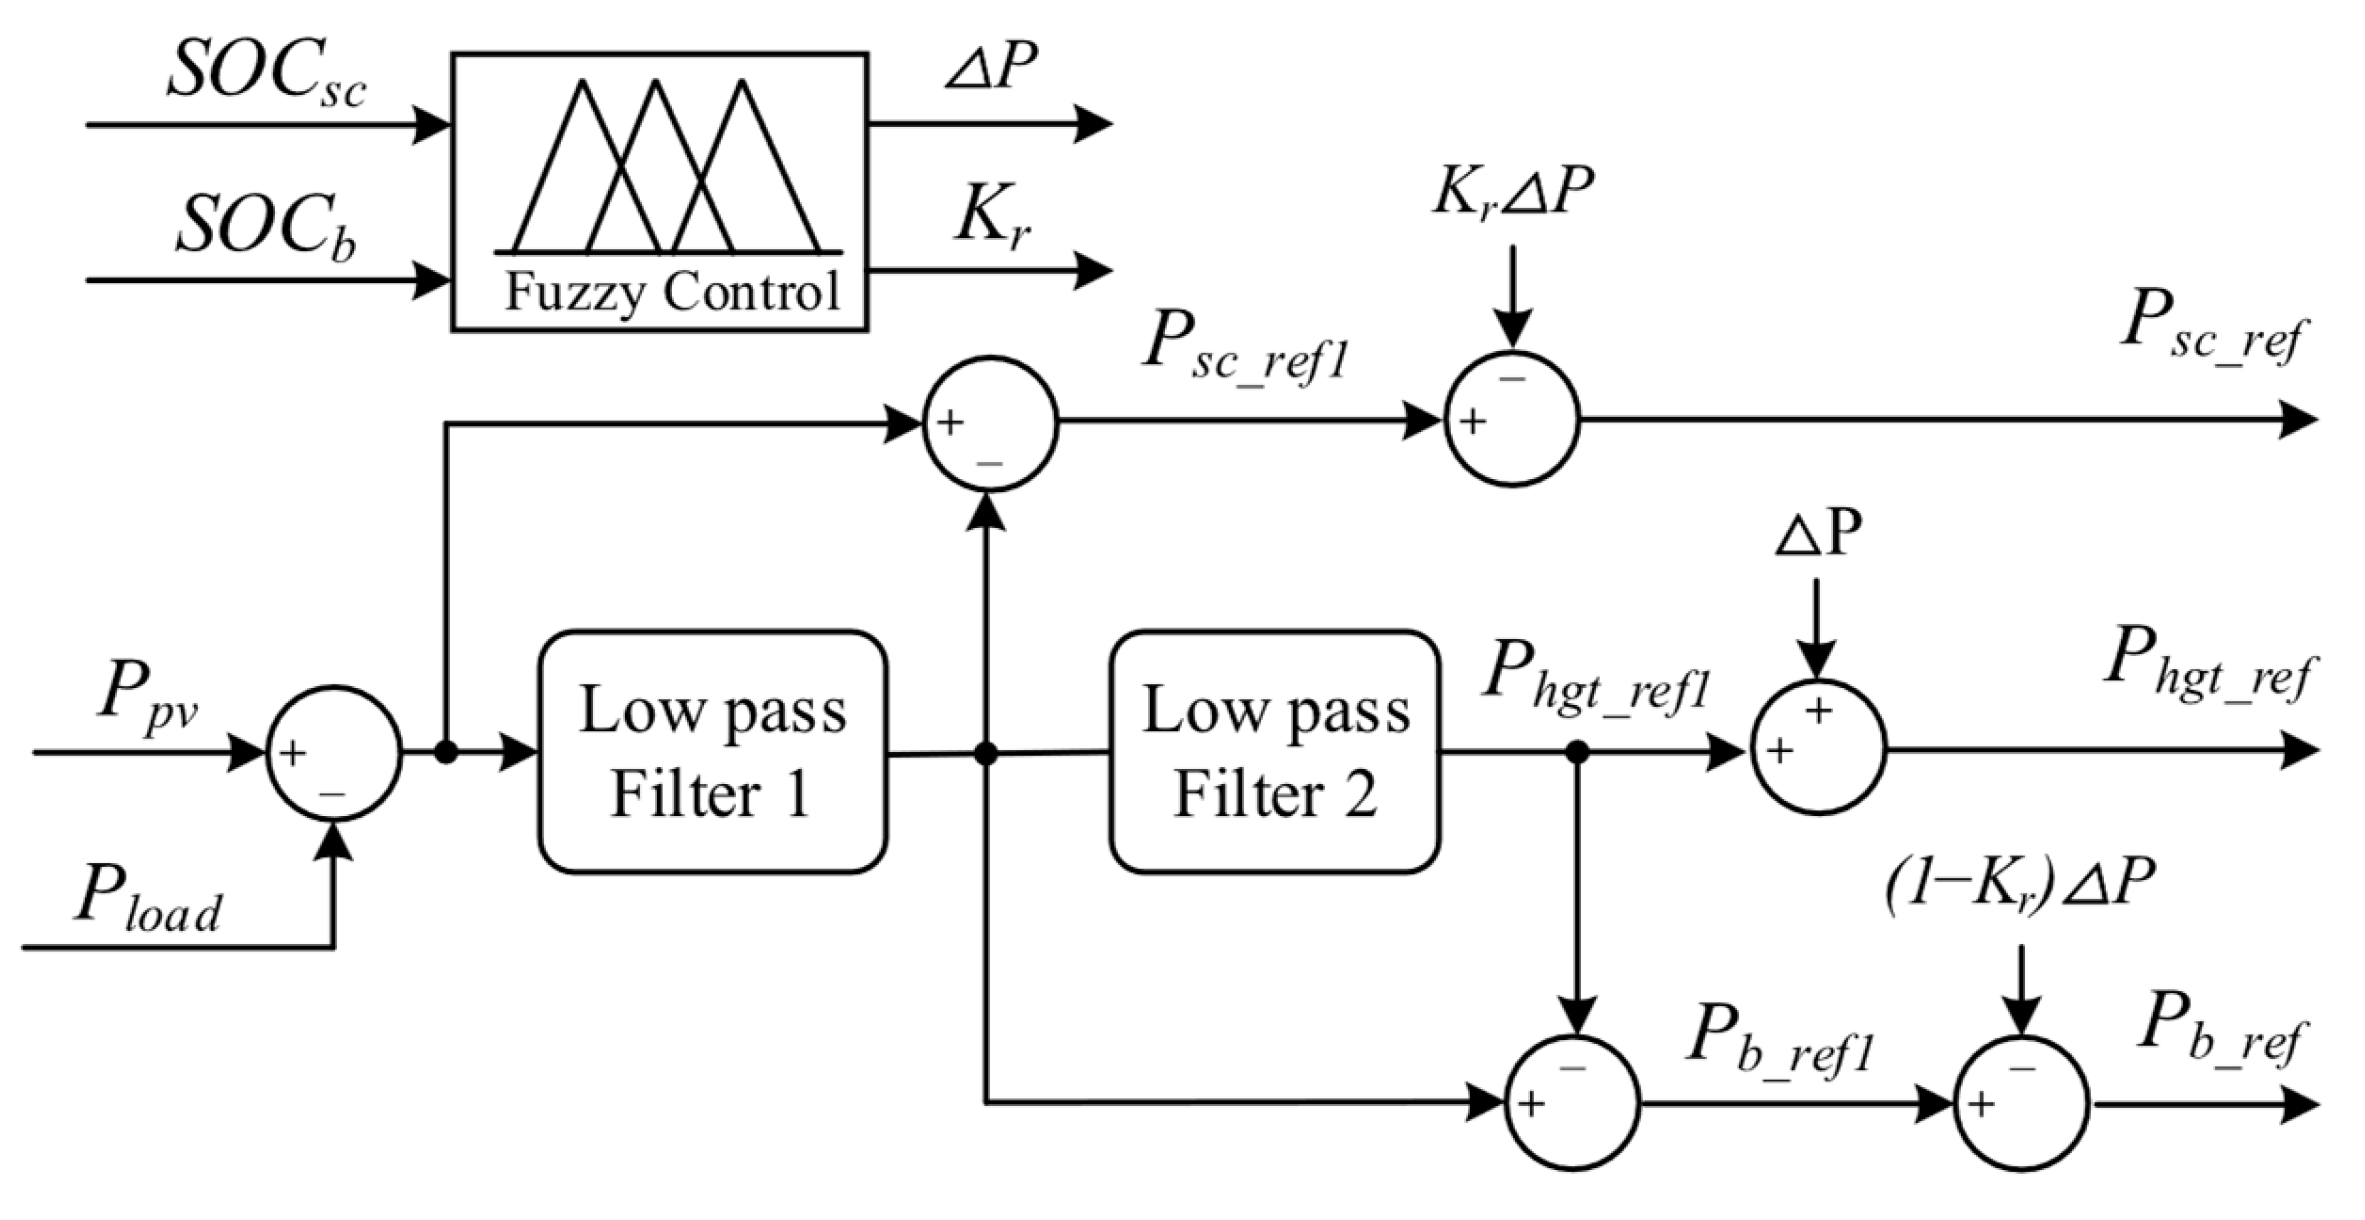
39]. The specific allocation mode is illustrated in
Figure 4.
As shown in
Figure 4, the difference in power between the PV system and the load is divided into high- and low-frequency parts by a low-pass filter 1. The low-frequency power part is taken as the primary reference power
for the electrolyzer, while the high-frequency power part is taken as the primary reference power
for the supercapacitor. The fuzzy controller dynamically adjusts the power correction coefficient
for the electrolyzer based on
and
. The system power allocation is derived from the following equations:
where
,
,
are the actual reference powers of the electrolyzer, supercapacitor, and battery. The variable
is the power correction coefficient for the supercapacitor, which enables the allocation of power between the supercapacitor and the battery. Its value is determined by the following equation:
where
is the minimum threshold of the SOC of the battery and
is the lower threshold of the battery SOC. The fuzzy controller takes in two input variables, namely
and
, and produces an output variable
, which serves as the power correction coefficient for the electrolyzer. The input variable fuzzy sets are categorized as {VL, L, M}, representing {very low, low, medium}, with a universe of discourse of [0.2, 0.6]. The fuzzy set for the output variable is categorized as {VS, S, M, B, VB}, representing {very small, small, medium, large, very large}, with a universe of discourse of [0.7, 1].
The rule setting for fuzzy control logic is as follows: If the SOCs of both the battery and supercapacitor are low, the power consumption by the electrolyzer is appropriately reduced, and then the extra power is allocated to the supercapacitor and battery for charging. This is performed to prevent the SOC of both from dropping to their lower limit values, thus avoiding over-discharge and prolonging the lifespan of the HESS. The specific fuzzy rule table is shown in
Table 2.
3.2. Control Strategy of Mode 2
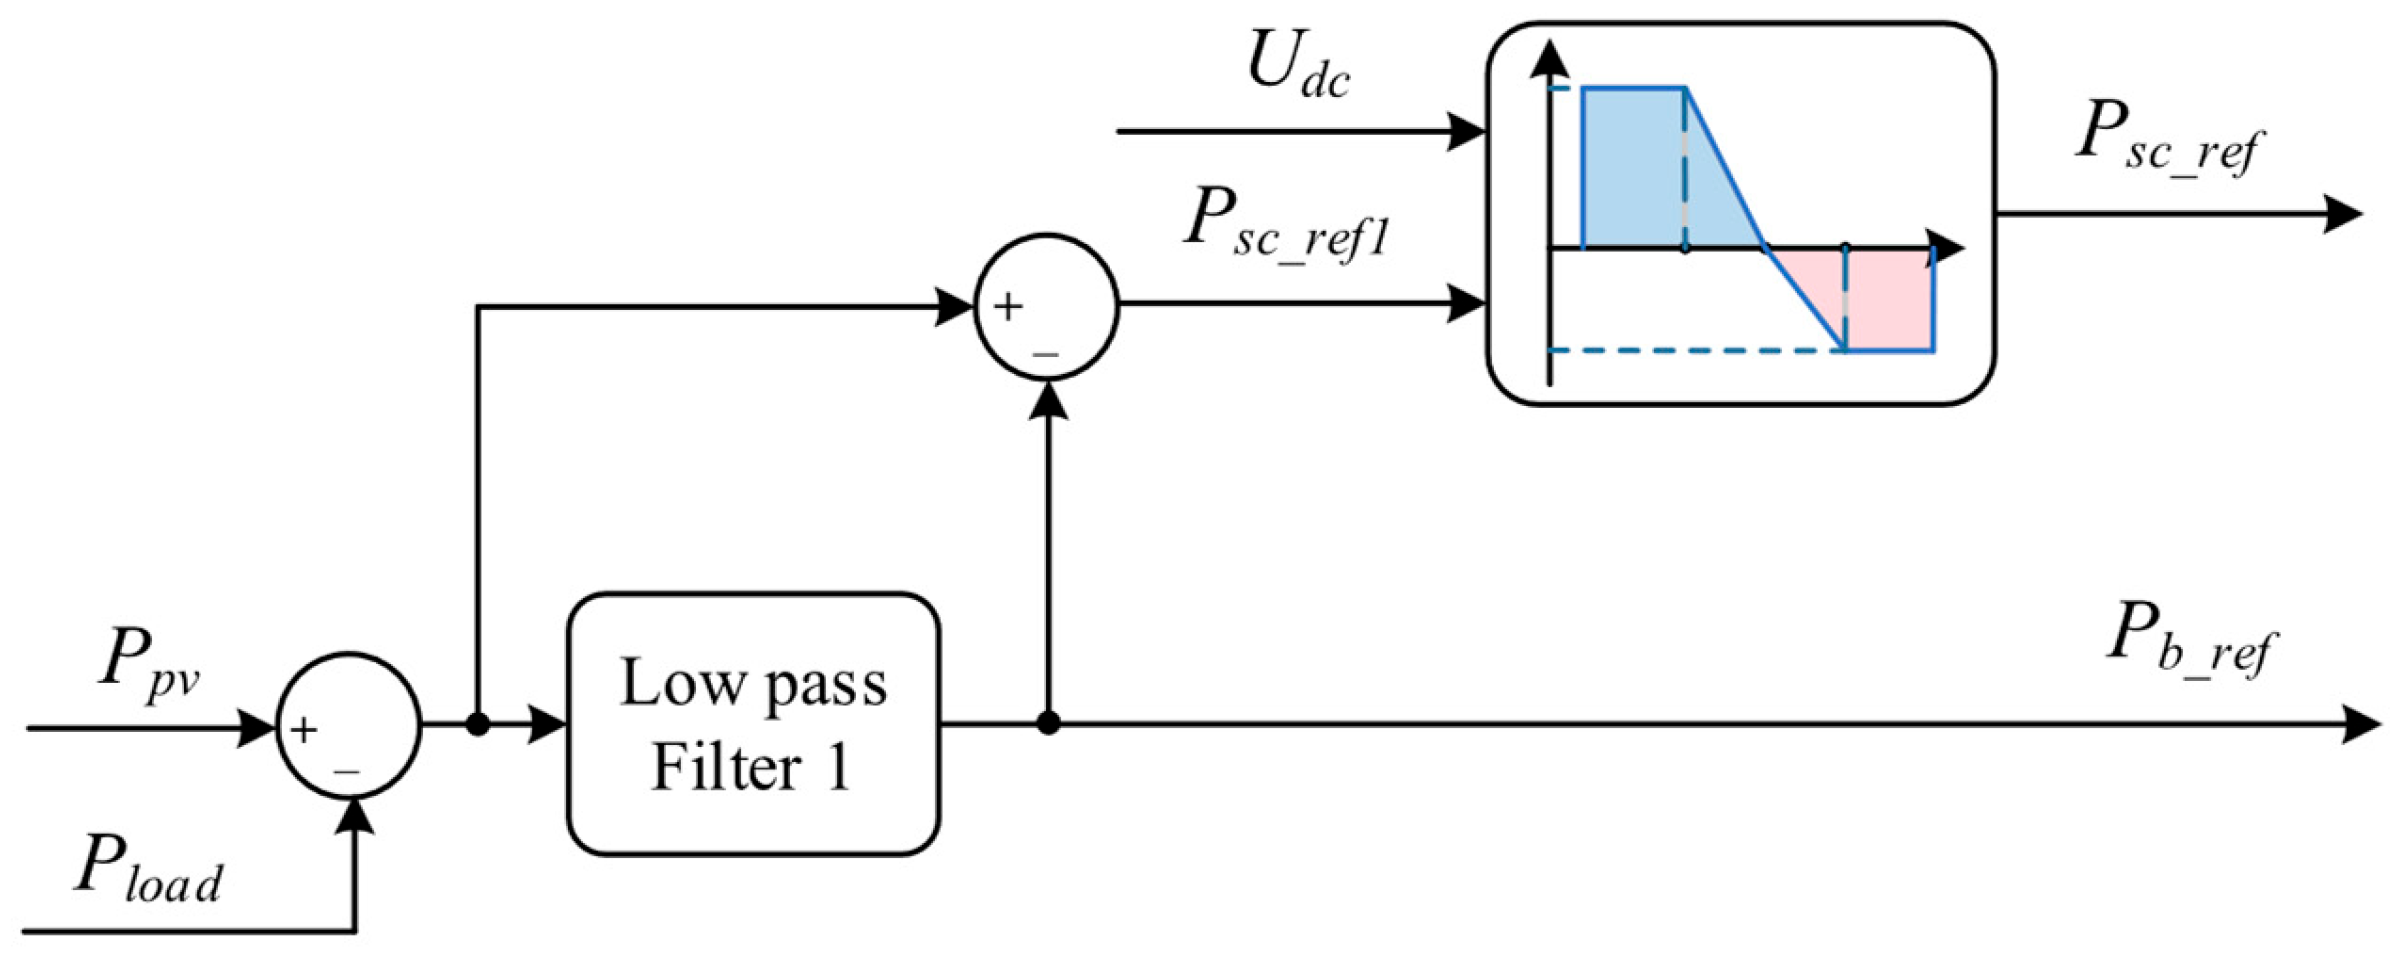
When the system is operating in Mode 2, the battery needs to continuously discharge through a power-controlled mode to maintain the power balance within the system. Since there are no components in the system to maintain voltage stability, a secondary correction strategy for supercapacitor power based on different threshold values of the bus voltage is proposed under this condition to keep the bus voltage stable. The power allocation of the system under Mode 2 is shown in
Figure 5.
As shown in
Figure 5, the difference in power between the PV system and the load is divided into high- and low-frequency parts. The low-frequency part is handled by the battery, while the high-frequency part serves as the primary reference power
for the supercapacitor. The actual reference power of the supercapacitor
is obtained after modifying the value of
. The power correction can be expressed by the following equations:
where
is the power correction value for the supercapacitor to keep the bus voltage stable.
and
are the maximum powers for the supercapacitor to charge and discharge, respectively.
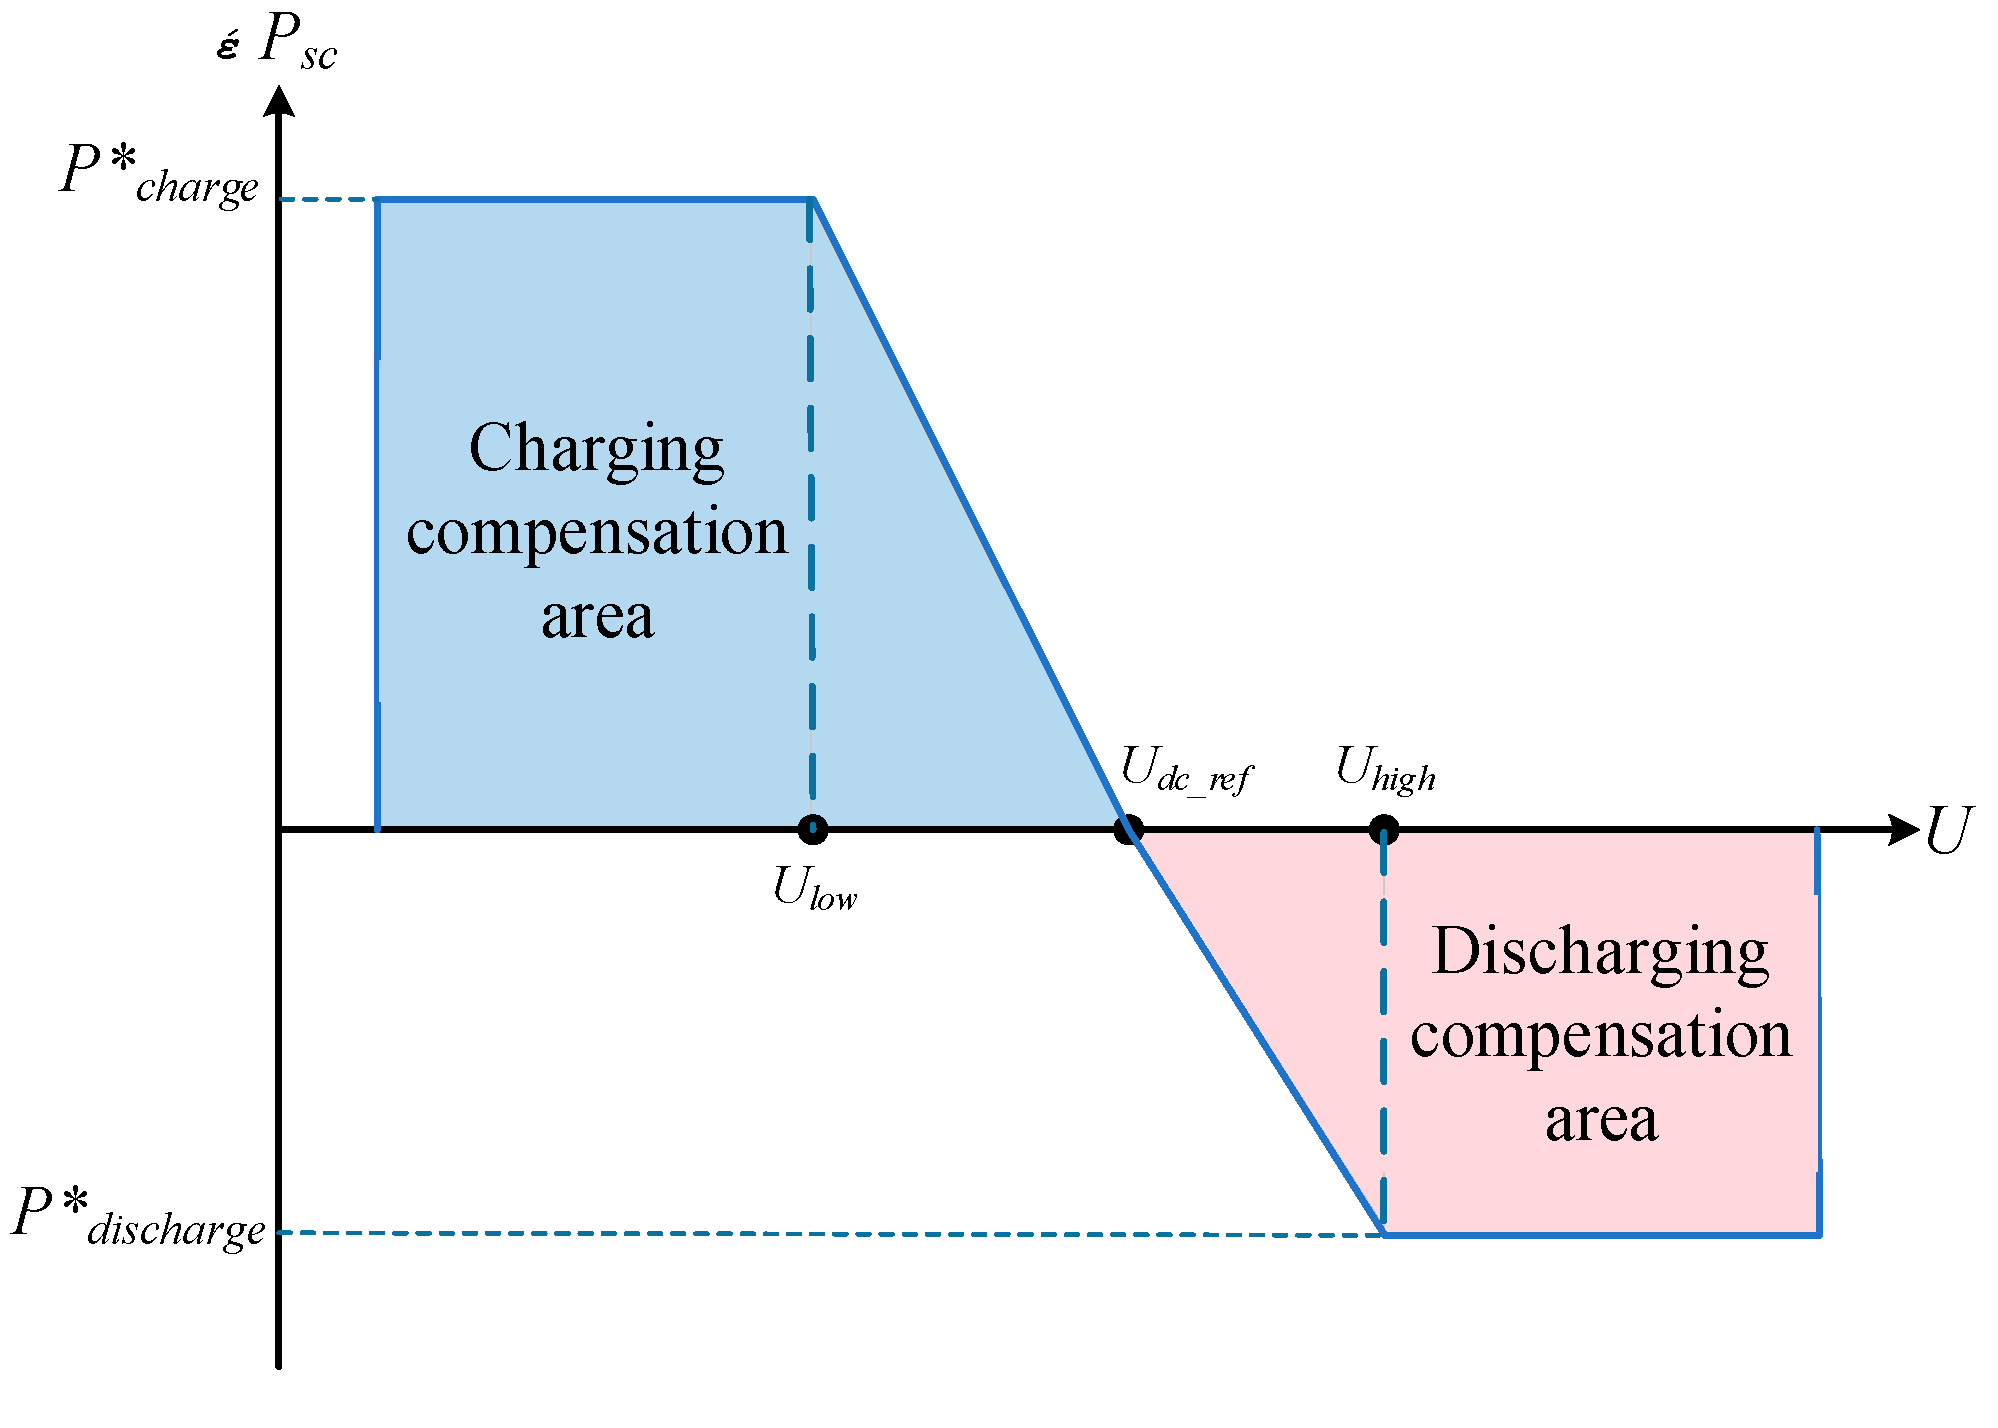
and
are the preset low and high thresholds for the bus voltage, respectively. The power correction curve for the supercapacitor based on bus voltage thresholds is shown in
Figure 6.
One can see from
Figure 6 that when the bus voltage is less than
or greater than
, the supercapacitor operates in a constant power compensation mode. When the bus voltage is between
and
, the compensation power increases as the voltage deviation increases. By adjusting the power of the supercapacitor based on bus voltage thresholds, the system can maintain bus voltage stability to a greater extent and improve power supply quality.
Under Mode 2, if drops below its low threshold, indicating low battery power, prolonged discharge may lead to deep discharge. To avoid this situation, the gas turbine is started in advance and operates at low power to supply power to the load while charging the battery and supercapacitor.
3.3. Control Strategy of Mode 3
Under Mode 3, the filtering mode of the system switches to a second-order filtering mode, where the required power is divided into three parts according to their frequency bands: high, medium and low. The high-frequency part is still handled by the supercapacitor, the medium-frequency part is borne by the battery, and the most gradual low-frequency part is undertaken by the HGT. The power allocation method through second-order filtering can better suppress voltage fluctuations caused by load variations and enable smoother power changes in HGT. The power allocation strategy of the system under Mode 3 is illustrated in
Figure 7.
In
Figure 7, the low-frequency power obtained after passing through the second-order low-pass filter serves as the primary power reference value
for the HGT. In cases where the SOC of the supercapacitor or battery is low, the fuzzy control power correction is employed to dynamically adjust the power that needs to be borne by the HGT and the HESS, based on
and
. The power correction of the system is determined by the following equations:
where
,
and
are the actual reference powers of the HGT, supercapacitor and battery;
is the power correction coefficient;
is the additional power required to be output by the HGT.
The fuzzy controller takes in two input variables, namely and , and produces two output variables, and . The fuzzy sets for the input variables are {VL, L, M}, representing {Very Low, Low, Medium}, with a universe of discourse of [0.2, 0.6]. The fuzzy sets for the output variables are {VS, S, M, B, VB}, representing {Very Small, Small, Medium, Big, Very Big}, with a universe of discourse of [10,000, 30,000] for and [0, 1] for .
The set fuzzy control logic is as follows: If the SOCs of both the battery and the supercapacitor are low, the operating power of the HGT is appropriately increased, and the excess power is allocated to the supercapacitor and the battery for charging. The strategy is set up to prevent their states of charge from dropping to the lower limit, reducing the depth of discharge time for the energy storage devices, and thereby improving the service life of the HESS. The specific fuzzy rule table is shown in
Table 3.
4. Analysis of Simulation Results
4.1. Design Parameters of Island PV and HGT Power Generation System
The system model is established on the Matlab/Simulink platform in this paper. The design parameters are presented in
Table 4 [
30].
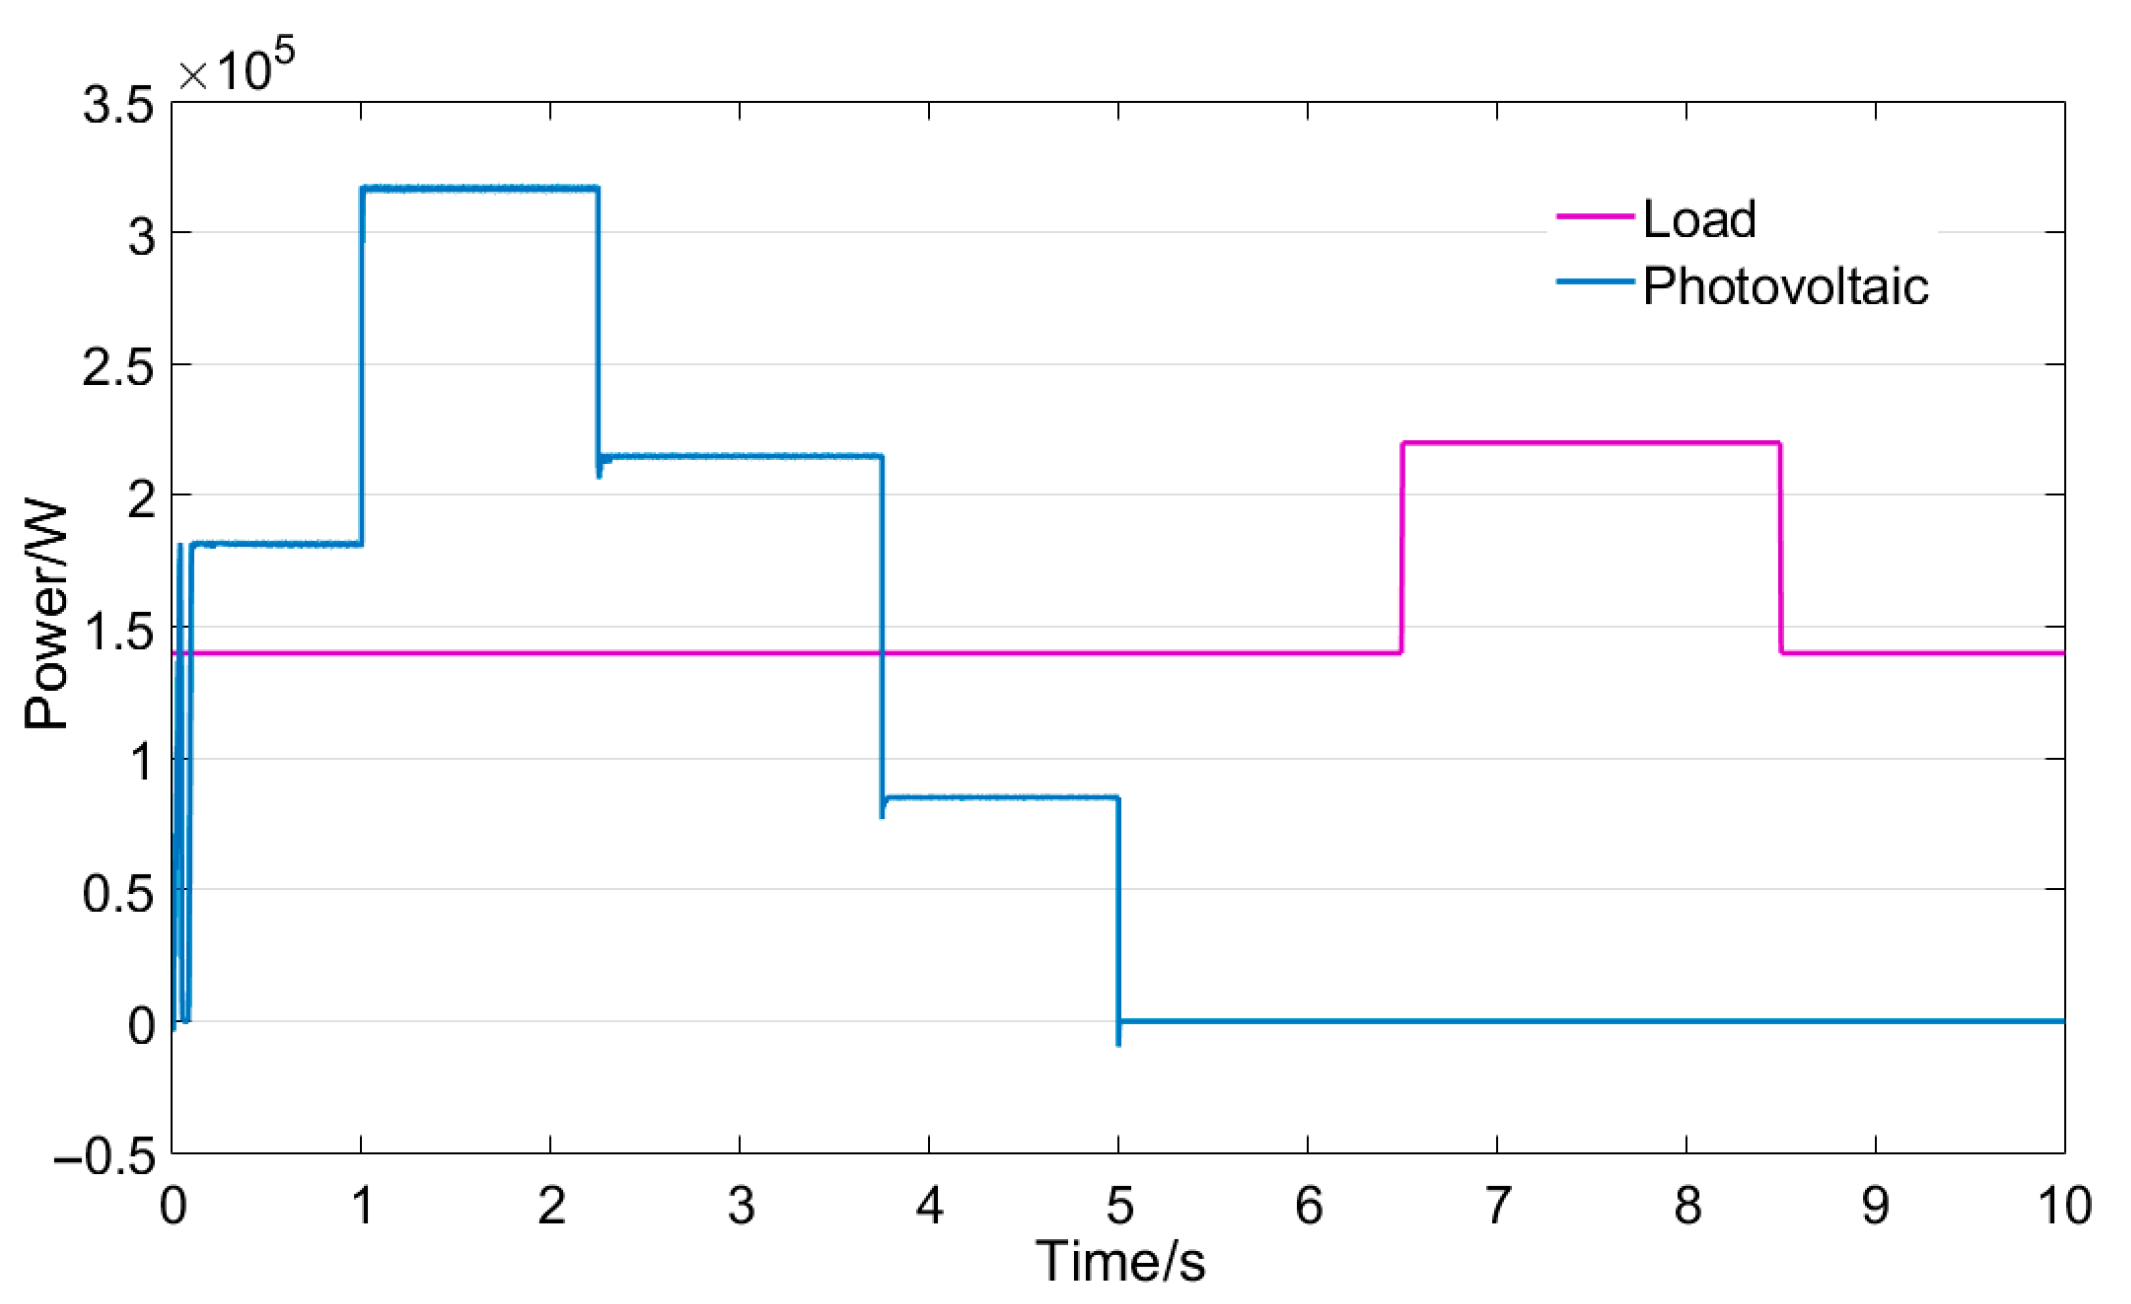
The variation characteristics of the PV system and load power are illustrated in
Figure 8.
As shown in
Figure 8, the simulated PV and load power profiles are designed to represent a scenario with high PV penetration, such as that found in the coastal areas of southern China, where a significant surplus of solar power is typically available during daytime hours and requires effective consumption [
40]. To accurately emulate real-world operating conditions where PV output is subject to sudden variations due to cloud cover and other meteorological factors [
35], the simulation incorporates deliberate mutational signals in both generation and load.
Within this defined operational context, the sizing of the system components is specifically justified. The battery capacity is determined to address the identified power deficit during periods of low PV generation, ensuring reliable energy supply. The supercapacitor is sized to provide the necessary power response for suppressing high-frequency fluctuations, thereby maintaining power quality. Furthermore, the capacities of the PV array and the electrolyzer are scaled in accordance with the characteristic daytime power surplus of the chosen scenario, ensuring that the system is appropriately dimensioned to validate the proposed control strategy under realistic and dynamic conditions.
4.2. Analysis of System Characteristics Performance
In order to more intuitively analyze and verify the overall control strategy of the system, while taking into account the slow change in the SOC of the HESS within a short simulation period, four different initial SOCs of the HESS are set. The operating characteristics of the system under these four cases are analyzed and discussed.
(1) Case 1: Normal initial SOCs of the HESS
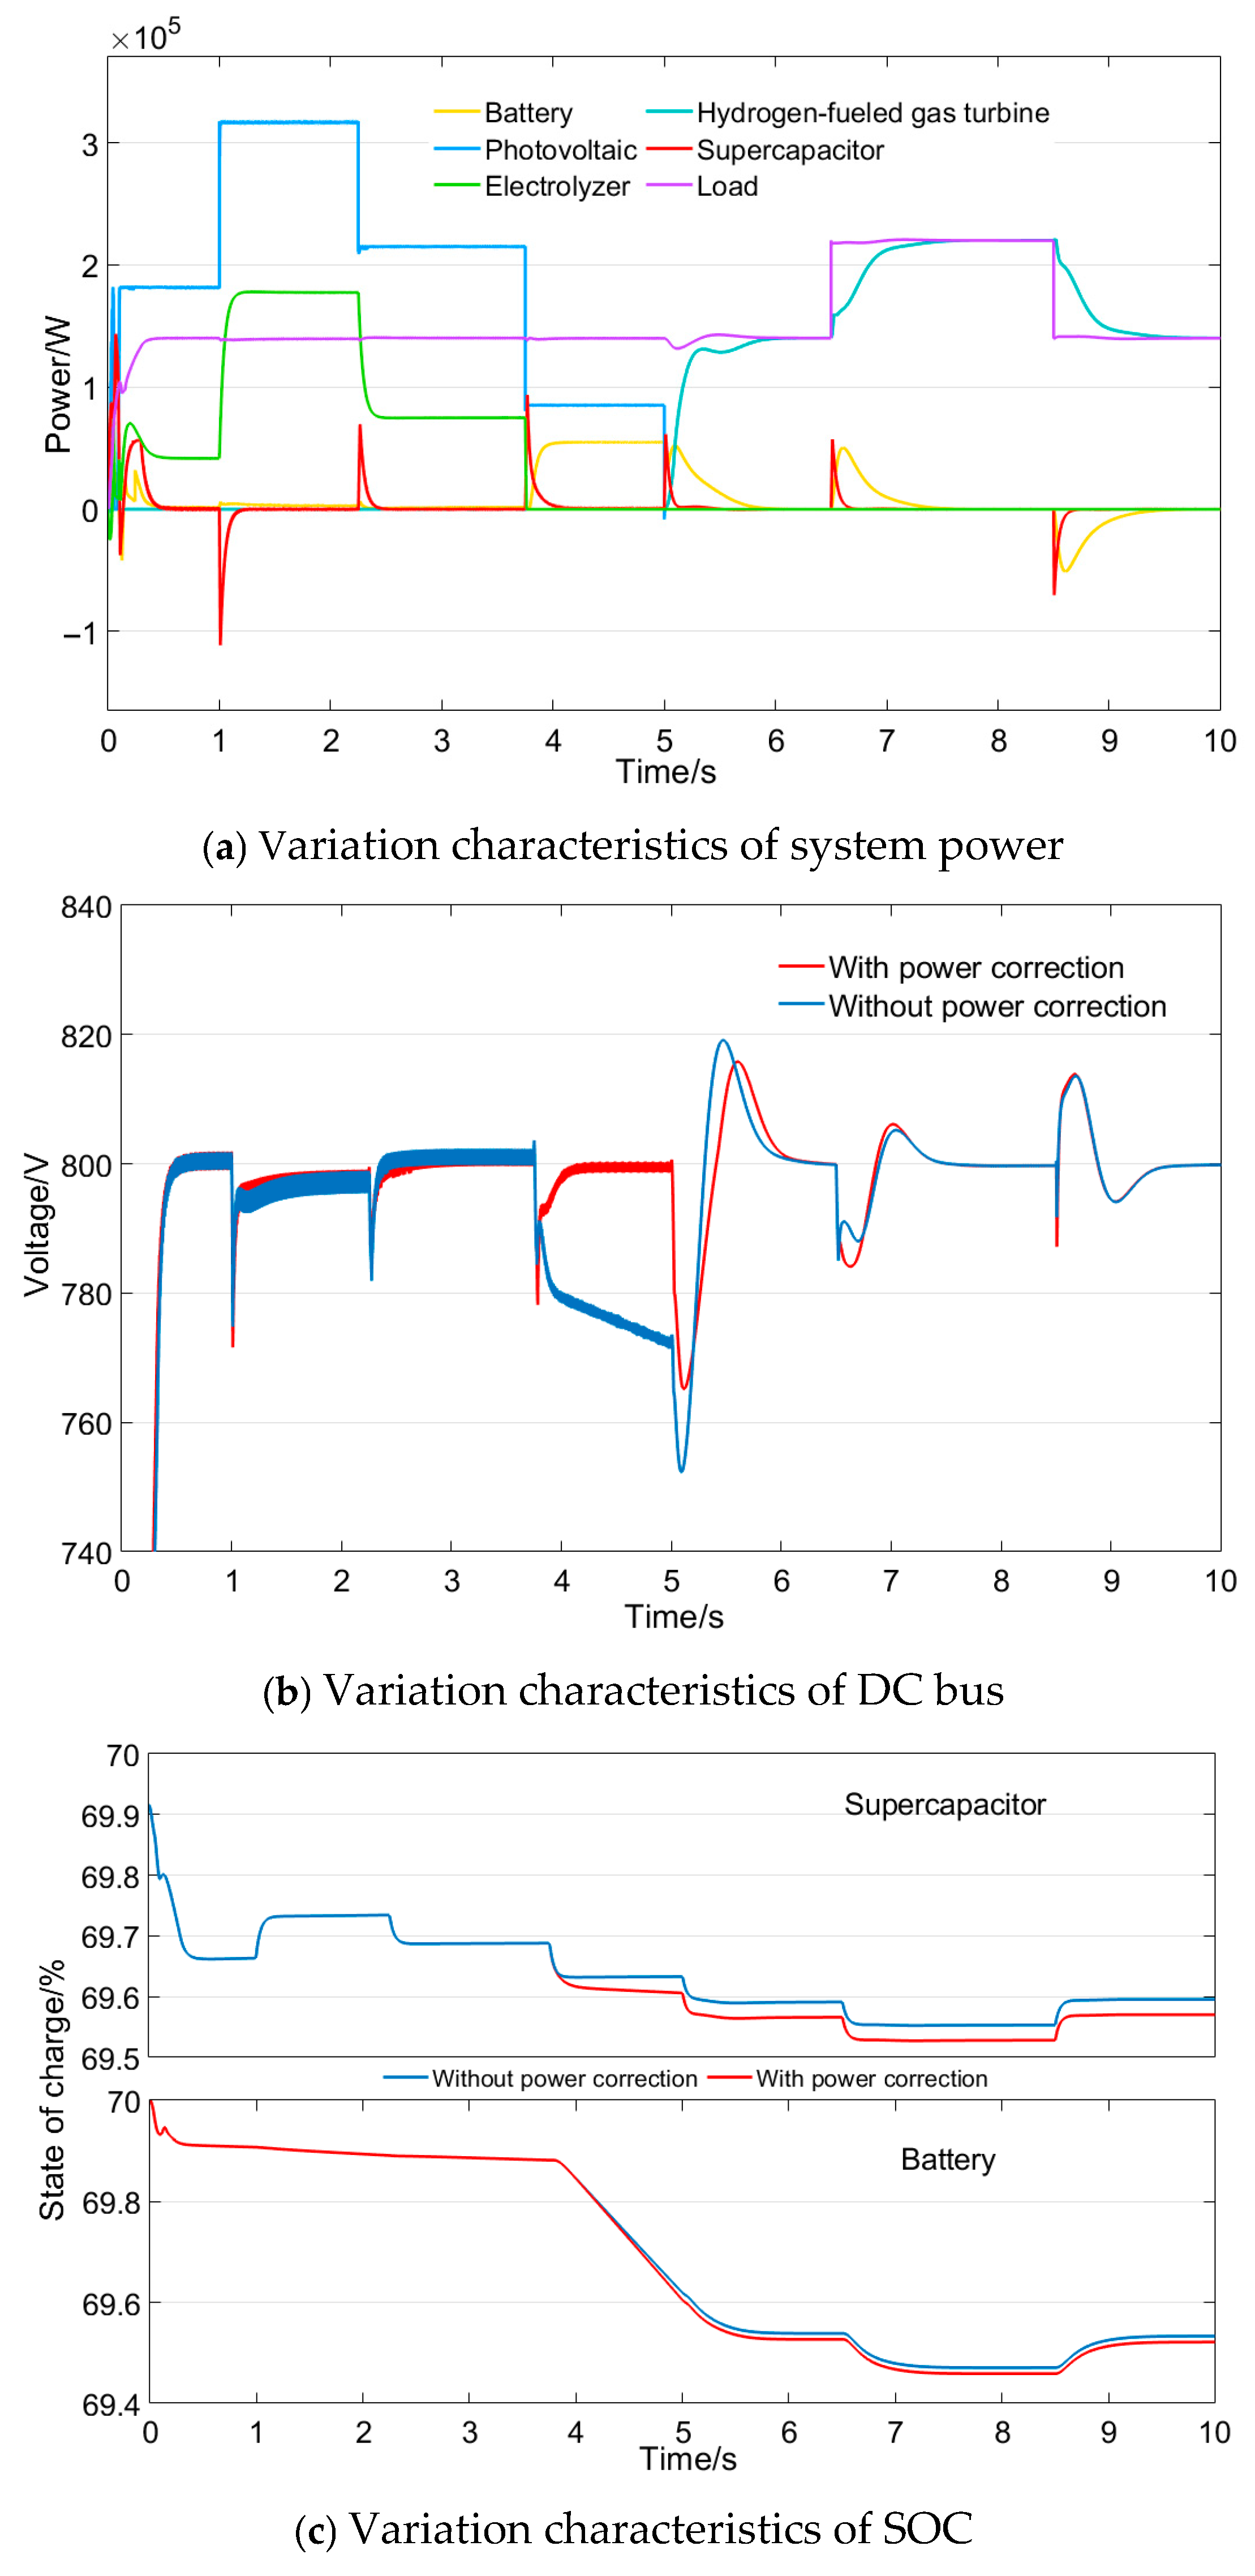
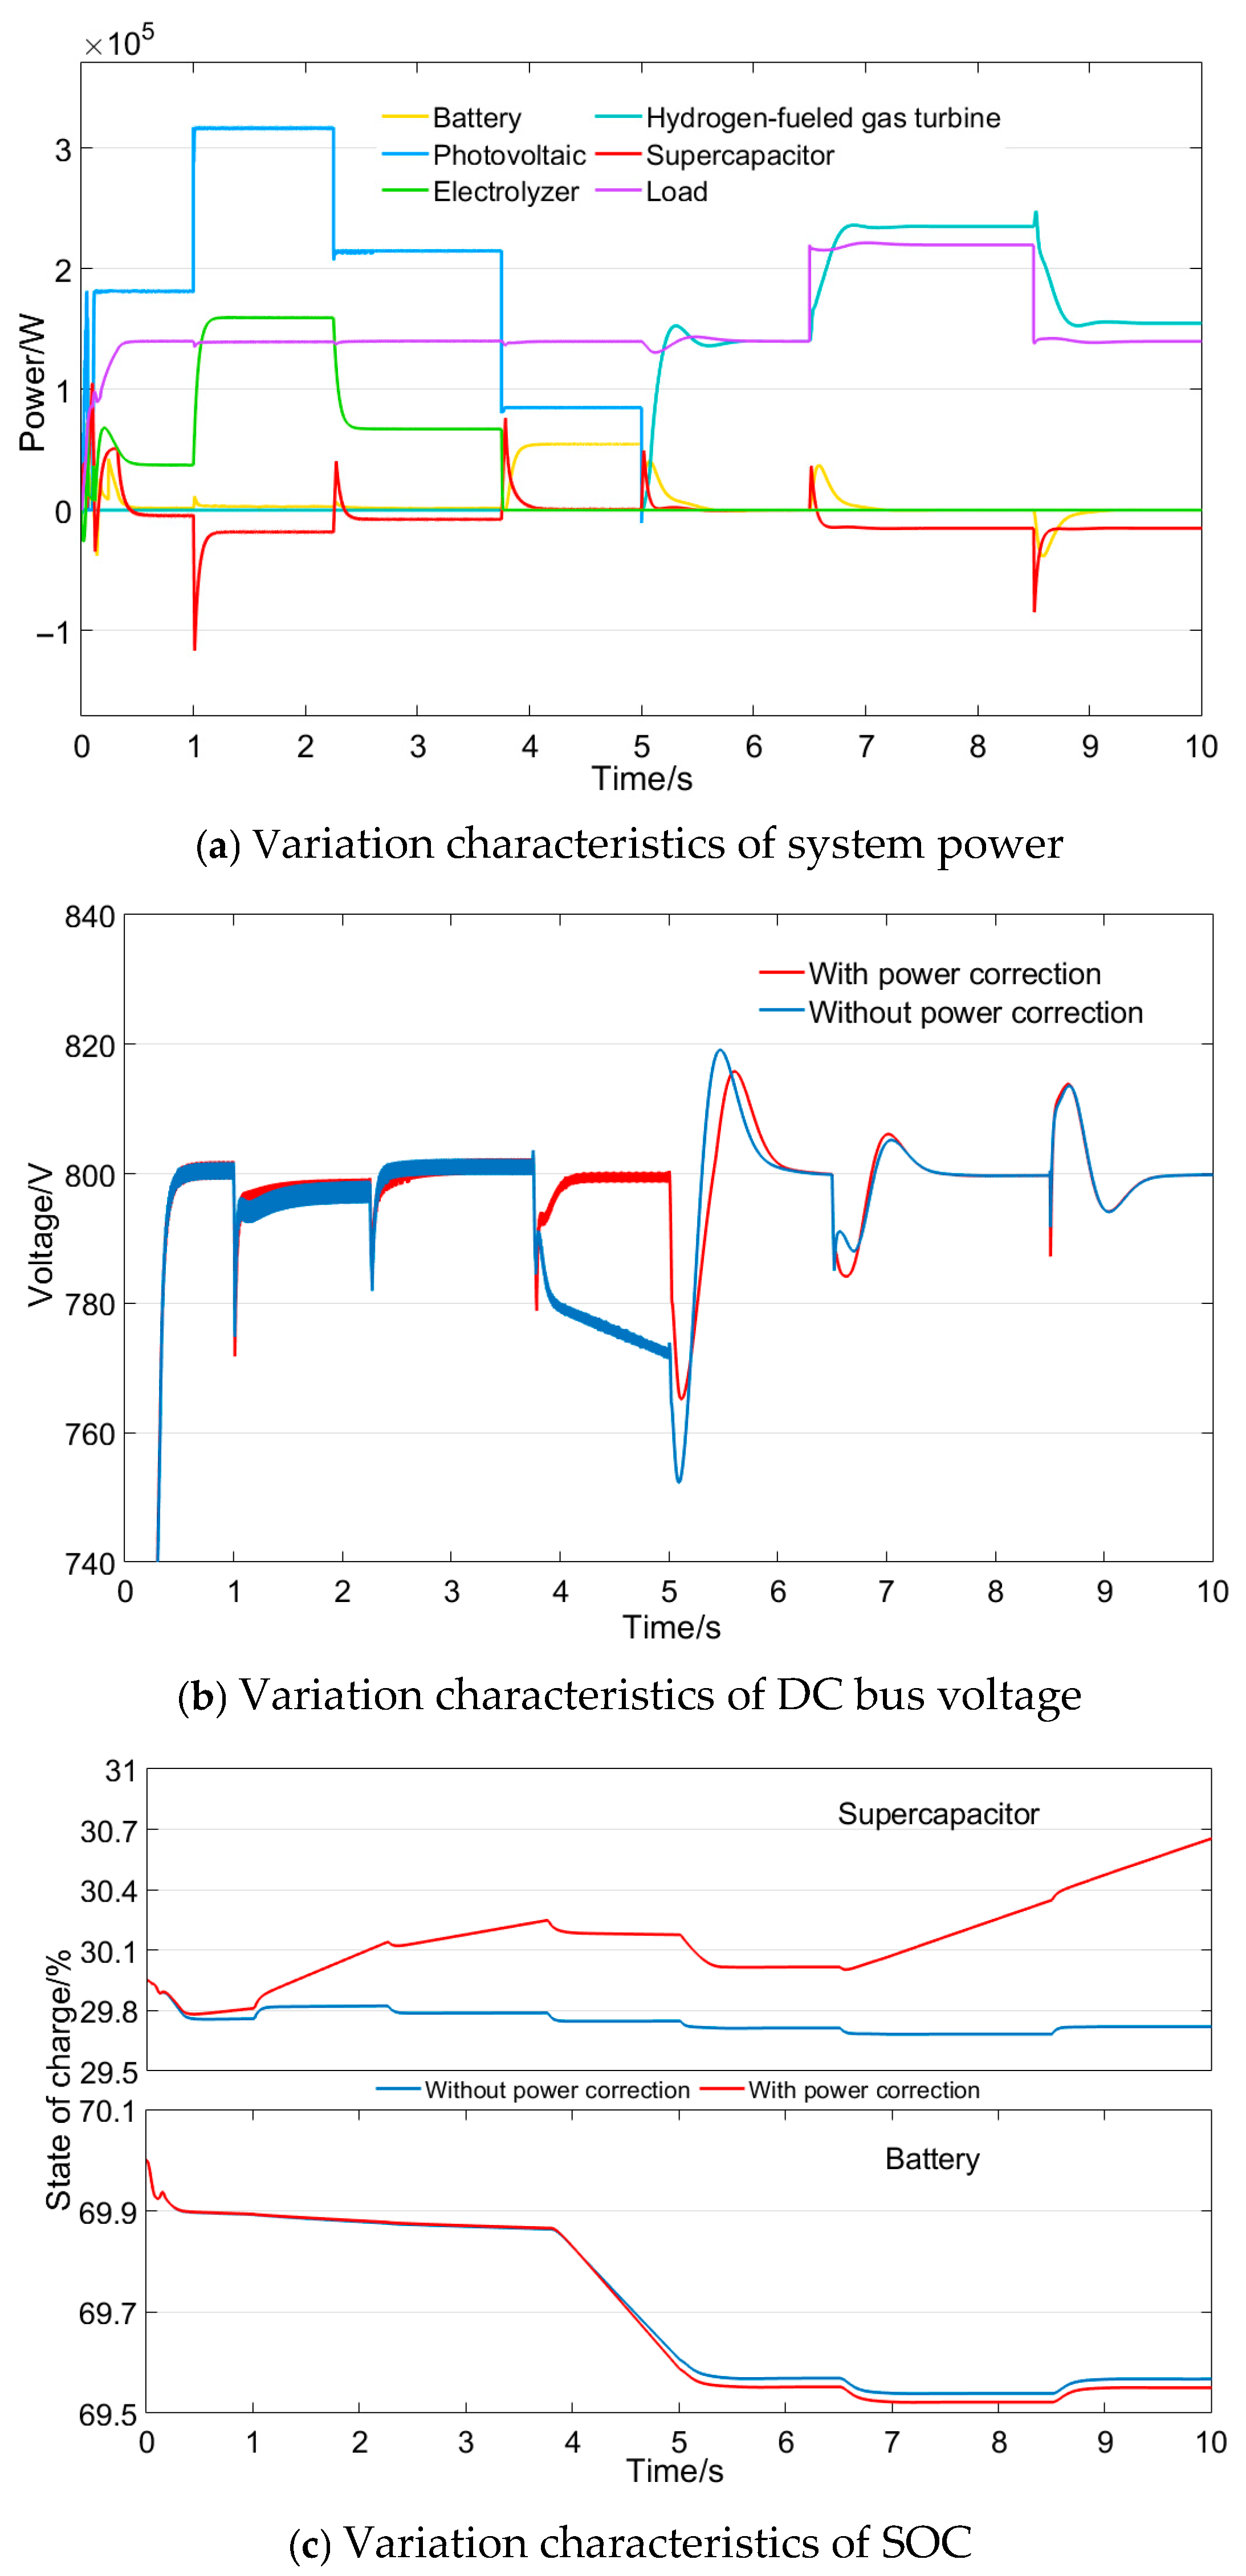
The variation characteristics of overall power, DC bus voltage and SOC during system operation under Case 1 are shown in
Figure 9.
As shown in
Figure 9a, during normal operation from 0 to 3.75 s, the system operates in Mode 1, where excess PV power is fully utilized for hydrogen production through electrolysis. The battery maintains bus voltage stability by discharging at a low power level, while the supercapacitor suppresses high-frequency PV power fluctuations. At 1 s, PV power increases from 182 kW to 317 kW, then drops sharply to 215 kW at 2.25 s. When PV power decreases to 85 kW at 3.75 s, falling below the load demand of 140 kW, the system requires an additional 55 kW from other sources. Since this deficit is below the minimum operating power of the HGT, the system switches to Mode 2, where the battery discharges to compensate for the power deficit. At 5 s, the system transitions to Mode 3, with the supercapacitor and battery handling high- and medium-frequency power components, respectively, to enable smooth HGT operation.
From
Figure 9b, without supercapacitor power correction in Mode 2, continuous battery discharge causes the bus voltage to decrease continuously after 3.75 s, failing to recover promptly. The mode transition at 5 s produces the largest voltage fluctuation, reaching 756.2 V (5.48%). With power correction, the bus voltage recovers to its rated value within 0.5 s after the Mode 1 to Mode 2 transition. Consequently, the subsequent transition from Mode 2 to Mode 3 at 5 s shows reduced fluctuation amplitude of 768 V (4%). During other periods, the bus voltage remains within 780–820 V with fluctuation rates below 2.5%, meeting the power quality requirement [
41].
As shown in
Figure 9c, both the supercapacitor and battery experience SOC reductions after operation. Without power correction, the supercapacitor SOC decreases from 69.92% to 69.6%. With power correction, the supercapacitor consumes additional power after 3.75 s to maintain system stability, resulting in a slightly larger SOC reduction to 69.57%. The battery SOC decreases from 70% to approximately 69.52% in both cases.
(2) Case 2: Low initial SOC of the supercapacitor and normal initial SOC of the battery
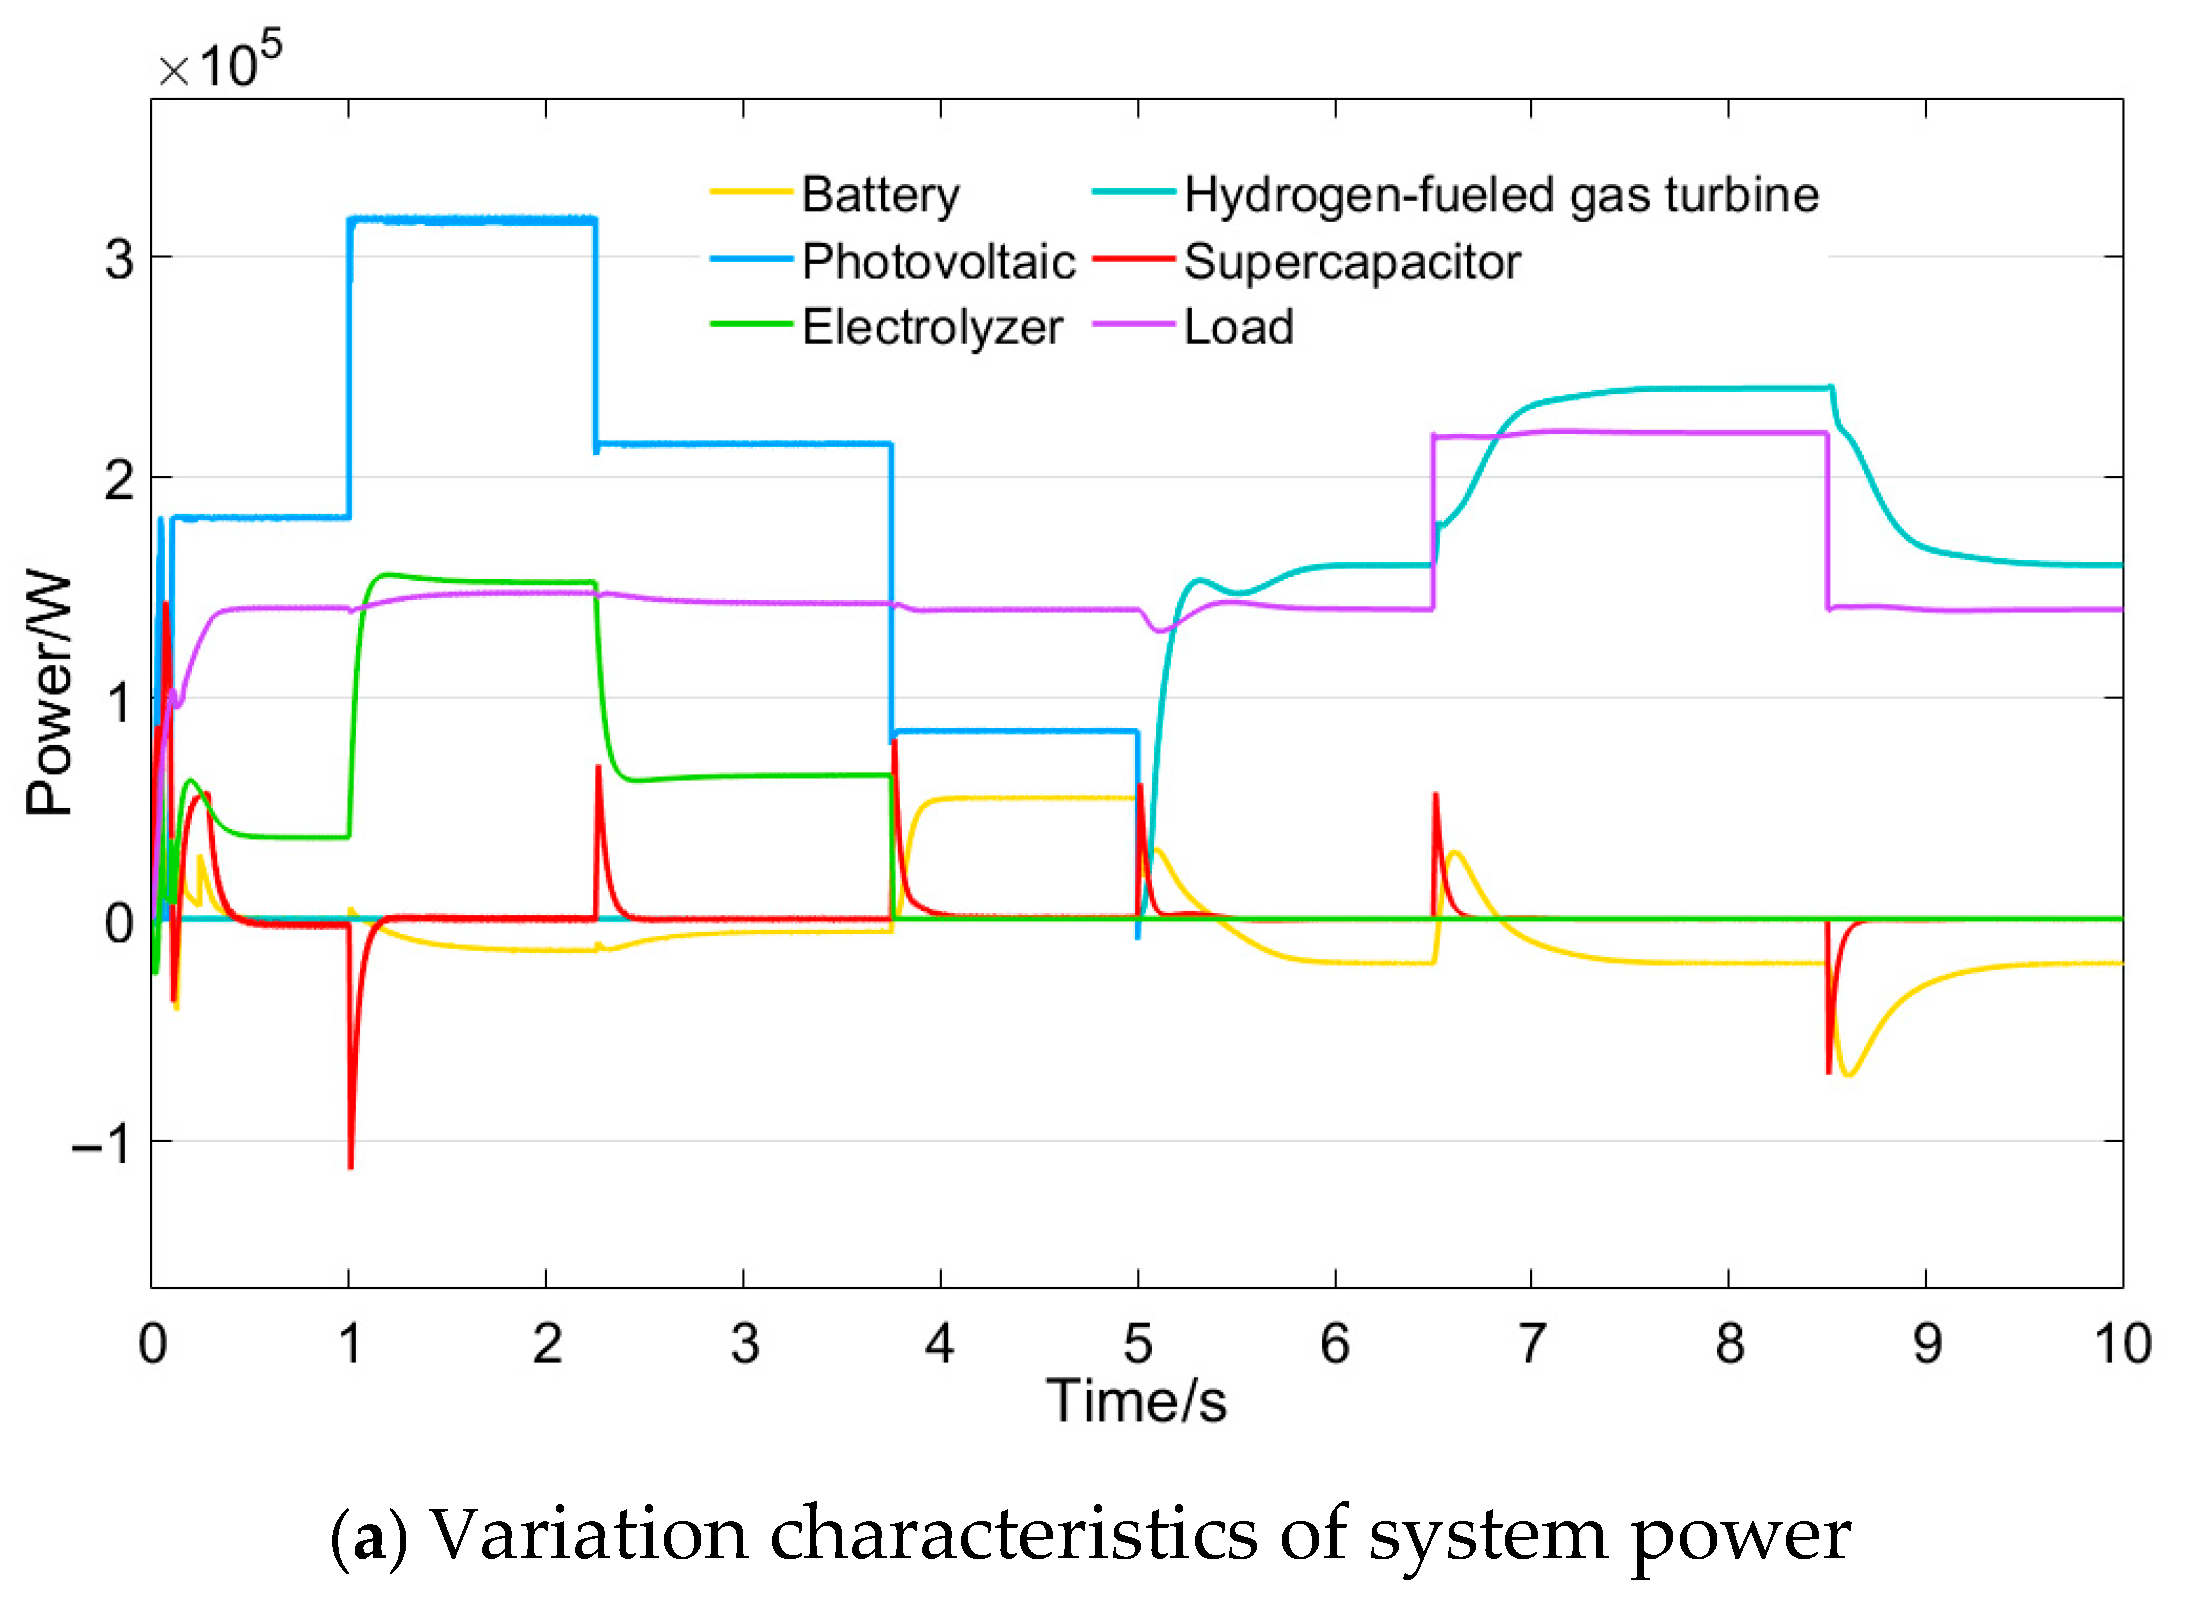
The variation characteristics of overall power, DC bus voltage and SOC during system operation under Case 2 are shown in
Figure 10.
As shown in
Figure 10a, the supercapacitor has a low SOC and thus requires timely charging. During Mode 1 (0–3.75 s), the fuzzy controller detects this low SOC and reduces the electrolyzer power correction coefficient, thereby decreasing the PV power allocated to the electrolyzer. The excess power is consequently absorbed by the supercapacitor, which undergoes a brief charging phase at about 18 kW between 1 and 2.25 s. From 3.75 to 5 s (Mode 2), the system operates normally with the battery compensating for the power deficit. At 5 s, the system enters Mode 3, where the supercapacitor and battery jointly support the smooth start-up of the hydrogen gas turbine. After stabilization at 6.5 s, the supercapacitor begins continuous charging via fuzzy logic control.
As shown in
Figure 10b, a PV power increase at 1 s causes a bus voltage fluctuation to 771.6 V (a 3.55% fluctuation rate). Without power correction, the voltage would continue to drop slightly after 3.75 s, reaching 772.5 V just before the gas turbine starts at 5 s. The subsequent mode transition causes the largest fluctuation, with the voltage dropping to 752.8 V (a 5.9% rate). With power correction, however, the voltage only momentarily drops to 780.0 V at 3.75 s and recovers to 800.0 V by 4.1 s. The fluctuation during the 5 s mode transition is also reduced, with the voltage reaching 765.2 V (a 4.35% rate), indicating significantly improved stability. During other periods, the bus voltage remains between 780.0 V and 820.0 V, with fluctuations under 2.5%.
As shown in
Figure 10c, without power correction, the supercapacitor SOC continues to decline from 29.95% to 29.74%, entering a deep discharge state. With power correction, the SOC instead increases from 29.95% to 30.67%, thus avoiding over-discharge. The battery SOC decreases from 70% to approximately 69.57% in both scenarios, showing nearly identical behavior.
(3) Case 3: Normal initial SOC of the supercapacitor and low initial SOC of the battery
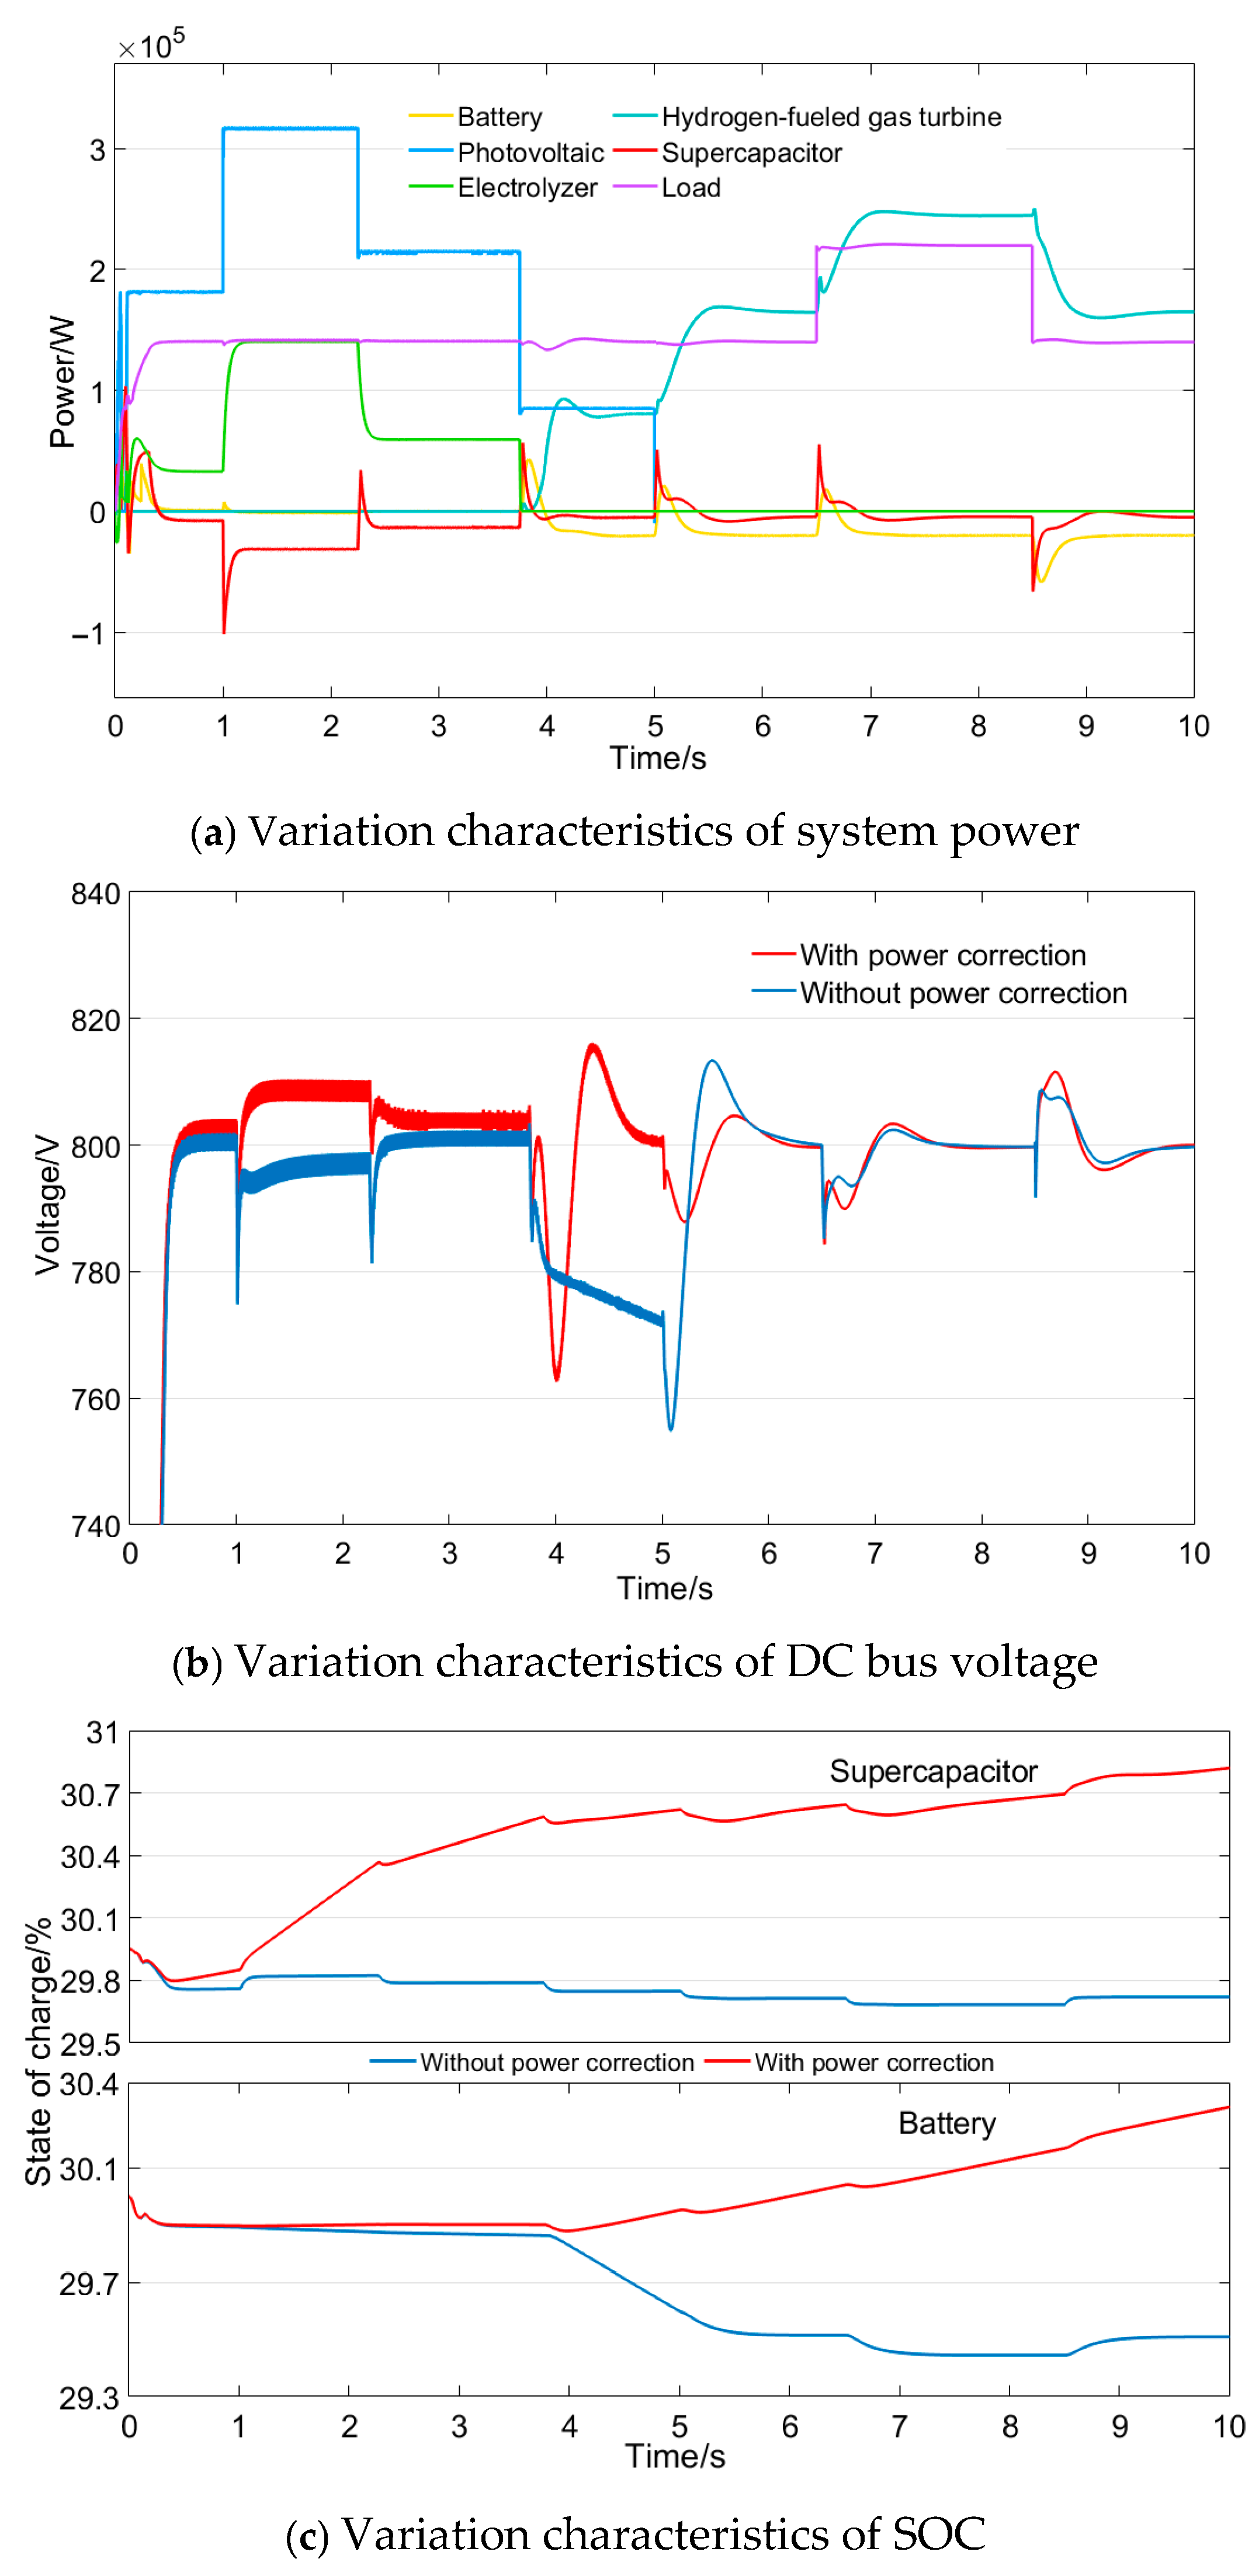
The variation characteristics of overall power, DC bus voltage and SOC during system operation under Case 3 are shown in
Figure 11.
As shown in
Figure 11a,b, during 0–3.75 s, the fuzzy logic control corrects the electrolyzer power due to the low battery SOC. Part of the unconsumed PV power is thus allocated to charge the battery, raising its SOC in Mode 1. Meanwhile, as the battery operates in voltage control mode, charging elevates the bus voltage to 815 V during stable operation (a 1.88% deviation, still within the acceptable range). At 2.25 s, the PV power decrease reduces the battery charging compensation, causing the bus voltage to drop to around 806 V. By 3.75 s, supercapacitor power compensation restores the bus voltage to the rated 800 V. At 5 s, the transition from Mode 2 to Mode 3 results in a bus voltage fluctuation to 762.3 V (4.71%). Without secondary power correction, the bus voltage fails to maintain the rated value after 3.75 s and continues to drop to about 780 V by 5 s. The subsequent mode switch and HGT start-up then cause a further voltage drop to 754.7 V (5.67%). After 5 s, during Mode 3, fuzzy logic control increases the HGT output slightly above load demand, directing all excess power to charge the battery.
As shown in
Figure 11c, without power correction, the battery SOC further decreases from 30% to 29.51%, entering deep discharge despite already being below the low threshold. With power correction, the battery is charged, and its SOC increases from 30% to 30.05%, effectively avoiding over-discharge. The supercapacitor SOC decreases normally in both scenarios.
It should be noted that in Case 3, although the battery SOC rises during the initial charging stage in Mode 1, it must still discharge during Mode 2 (3.75–5 s) to maintain system stability. Should the battery SOC fall below the low threshold in Mode 2, it can no longer supply power, prompting the gas turbine to start early and charge both the supercapacitor and battery. This operating mode is consistent with that of Case 4, where both HESS units start with low SOC. The corresponding power, voltage, and SOC profiles for Case 4 are provided in
Figure 11.
(4) Case 4: Low initial SOCs of the HESS
As shown in
Figure 12a, during the first 3.75 s under Case 1, the power of the electrolyzer is the lowest compared to the other cases. The battery and supercapacitor are charged with a certain amount of power. At 3.75 s, since the battery cannot continue to supply power as usual, the gas turbine is started early and operates at its minimum power. Then the combined power of the HGT and PV generation exceeds the load demand, which results in a surplus of power. The additional power is then allocated to the supercapacitor and battery through the preset strategy to charge the HESS.
As shown in
Figure 12b, without energy storage power correction, there is still a drop trend of the bus voltage between 3.75 s and 5 s, reaching 765 V at 5 s. Subsequently, due to the start-up of the gas turbine, the bus voltage suddenly drops to 755 V, with a maximum fluctuation rate of 5.63%. After considering energy storage power correction, the gas turbine starts up earlier at 3.75 s and causes a similar sudden voltage drop. The voltage reaches its lowest value of 762.8 V at 4 s, with a fluctuation rate of 4.65%. Under other system power fluctuations, the bus voltage remains within the range of 780 V to 820 V, indicating that the system is in a stable state.
One can see from
Figure 12c that after the system has reached stable operation, if energy storage power correction is not considered, the SOC of the supercapacitor and battery will continue to decline below the low threshold. The SOC of the supercapacitor decreases from 29.95% to 29.71%, and the SOC of the battery decreases from 30% to 29.51%, indicating that the HESS enters a deep discharge stage. When power correction is taken into account, the SOC of the battery remains constant until 3.75 s, while the supercapacitor begins to charge continuously. After 3.75 s, due to the start-up of the HGT, both the battery and the supercapacitor continue to charge. At last, the SOCs of both the supercapacitor and the battery have increased to some degree. The SOC of the supercapacitor rises from 29.95% to 30.82%, and the SOC of the battery increases from 30% to 30.31%. This reduces the deep discharge time of the HESS when it is in a low SOC state, thereby preventing over-discharge of the HESS.
4.3. Discussion
The primary power allocation employs low-pass filtering to distribute the net system power into high-, medium-, and low-frequency components, effectively utilizing the distinct response characteristics of the supercapacitor, battery, and HGT. The PV system operates under MPPT control, while the electrolyzer and supercapacitor are managed in power control mode to facilitate secondary correction. The battery switches between control modes according to system conditions, and the HGT regulates its output through fuel supply control.
To verify the performance of the proposed control strategy,
Table 5 summarizes the differences in the SOCs of the HESS and bus voltage fluctuations with and without power corrections for 4 cases.
As illustrated in
Table 5, the implementation of secondary power correction markedly enhances the charge state recovery capability of the HESS. The SOC for both the supercapacitor and battery is effectively maintained within an appropriate range, thereby preventing deep discharge and extending the operational lifespan of the HESS. More notably, the strategy significantly improves DC bus voltage stability. Across all cases, the maximum voltage fluctuation rate is reduced from above 5% to below 5%, with the most substantial improvement observed in Case 2, where the fluctuation rate is lowered by 1.55%.
This enhancement in voltage stability carries important practical implications. First, maintaining the voltage fluctuation within 5% ensures compliance with international power quality standards, which is essential for the reliable integration of the microgrid with other power sources and sensitive loads. Second, the nearly 1% reduction in voltage fluctuation directly mitigates electrical stress on power electronic converters and connected loads. Studies indicate that such a reduction can decrease the failure rate of power electronics, thereby extending equipment service life.
Beyond marine applications, the proposed control strategy offers valuable insights for utility-scale and grid-connected renewable energy systems. The approach demonstrates significant potential for maintaining DC bus voltage stability under challenging grid conditions characterized by high renewable energy penetration and fluctuating power generation. The HESS management approach, which effectively prevents overcharging and over-discharging, provides a scalable solution for large-scale energy storage deployment. The multi-mode operation strategy and fuzzy logic-based power allocation framework could be adapted to manage power fluctuations on a utility scale. The hydrogen component offers seasonal energy storage potential, while the battery–supercapacitor HESS provides rapid response to short-term fluctuations, creating a comprehensive solution for grid stability management.
5. Conclusions
This study focuses on the problems of energy self-supply capability and the need for increased green energy use in islanded microgrids, along with the complexities of variable solar generation, delayed hydrogen fuel gas turbine response, and changing load patterns. A PV and HGT power generation system is modeled on the Matlab/Simulink platform, incorporating a two-stage control strategy to address stability challenges under high renewable energy penetration. The strategy combines primary power allocation via low-pass filtering and secondary power correction for hybrid energy storage (HESS). Key conclusions are as follows:
The coordinated power allocation mechanism achieves significant improvement in voltage stability. The proposed strategy reduces DC bus voltage fluctuations by up to 1.55% through coordinated power allocation among PV, HGT, and HESS. By prioritizing low-frequency power dispatch to HGTs and high-frequency compensation via supercapacitors, the system maintains voltage within 4.71% deviation under dynamic operating conditions.
The HESS SOC is dynamically regulated to prevent overcharging and over-discharging. The secondary correction dynamically adjusts HESS charging/discharging based on predefined SOC thresholds. This prevents overcharging and over-discharging, maintains SOC within safe ranges (40–80%), and enhances the operational lifespan of the HESS.
These findings validate the strategy’s robustness in stabilizing islanded microgrids with high PV curtailment, offering a scalable solution for renewable-hydrogen integration.
Although the simulation in this paper is not a full-day operating condition simulation, its focus lies on the implementation of the control strategy. Changes in the operating conditions and control strategies in this paper cover all typical operating conditions and load change situations during the daily operation of the power grid. Our subsequent work will include daily simulations to further evaluate the system’s performance over a full operational cycle. Additionally, we will leverage the existing 100 kW gas turbine generator unit in our laboratory [
42], retrofitting it for hydrogen operation and integrating it with key components such as a PV array simulator, an electrolyzer, and a battery–supercapacitor HESS to establish a complete experimental platform. This platform will be used to empirically validate the effectiveness and robustness of the proposed coordinated control strategy under realistic dynamic conditions.
