Article

Self-Organizing of Waves and Sandy Bottom Relief—Laboratory Experiments

Shirshov Institute of Oceanology, Russian Academy of Sciences, Moscow 117997, Russia
*
Author to whom correspondence should be addressed.
J. Mar. Sci. Eng. 2025, 13(11), 2066; https://doi.org/10.3390/jmse13112066
Submission received: 30 September 2025 / Revised: 24 October 2025 / Accepted: 27 October 2025 / Published: 29 October 2025
(This article belongs to the Section Coastal Engineering)

Abstract

Many studies suggest that, as waves propagate toward the shore, mutual adaptation (self-organization) occurs between the wave transformation and the bottom relief. However, the details of this process are unknown. Is nonlinear transformation or wave breaking the primary factor influencing bottom relief deformation? The main goal of this study is to assess the impact of nonlinear wave transformation on bottom relief changes and to identify the key patterns of mutual adaptation between bottom topography and waves. A specialized laboratory experiment was conducted for this purpose. Based on an analysis of the evolution of wave spectra, changes in wave asymmetry, phase shift between harmonics and bottom relief deformations, it was revealed that self-organization occurs primarily due to the nonlinear properties of wave transformation. The nonlinear wave transformation scenario (the spatial evolution of the amplitudes of nonlinear wave harmonics toward the shore) determines the positions of the main minima and maxima of the first and second harmonic amplitudes, corresponding to sediment flow divergence points, which are maintained throughout the period of constant wave action. Wave breaking does not change this scenario, but it does affect the absolute values of the amplitudes and biphases, accelerating bottom change.

1. Introduction

Coastal waves are a major factor influencing the accumulation and erosion of sand deposits, as well as morphodynamic changes in bottom topography, such as the formation of underwater bars. Modern research has demonstrated the leading role of nonlinear wave transformation in these processes [1,2,3,4,5,6,7,8,9,10]. Nonlinear wave transformation leads to an increase in the energy of higher and lower (infragravity) wave harmonics, which, for example, can lead to phenomena such as the amplification of long-wave resonant oscillations in ports, the influence of Bragg reflection from bottom undulations on resonance in harbors, etc. The presence of higher nonlinear harmonics alters the wave shape to become asymmetrical. A change in wave symmetry leads to a change in the symmetry of the orbital wave velocities near the bottom, which affects the direction and magnitude of sediment discharge. There are many empirical and semi-empirical sediment transport models that use this concept, e.g., [6,11,12,13,14,15,16,17,18,19,20]. However, many verifications of this parameterization on various experimental datasets are not always in good agreement due to inaccurate parameterization of the biphase itself, the influence of wind on waves, etc. [21,22,23]. It was noted that periodic fluctuations of the biphase are the main reason for the impossibility of the unambiguous parameterization of changes in wave symmetry in the coastal zone [23]. Given the influence of many factors on the empirical parameterizations of wave asymmetry, they are constantly being improved.
As shown in many studies, the shape of the bottom relief at sediment transport in the cross-shore direction depends on the position of the second wave harmonic maximum setting the divergence point of sediment flux. Thus, for example, an underwater bar can be formed. The hypothesis that spatial fluctuations of the second harmonic amplitude can be the mechanism for the formation of underwater sand bars was first suggested in [24]. It was confirmed by comparing field and model (a monochromatic wave with typical storm parameters was used) underwater bottom profiles of Georgian Bay in Lake Ontario, as well as in coastal zones of Australia and the North Sea [25,26]. Similar results were obtained for two selected underwater profiles on the coast of Lake Huron and on the Atlantic coast of Canada [27]. Later, this hypothesis was confirmed in the Black Sea on the field data of simultaneous measurements of wave chronograms and the evolution of the underwater profile at 15 points of the coastal zone [28].
As waves propagate in shallow water towards the shore, spatial fluctuations between the first and second nonlinear harmonics (visible energy exchange between the first and second harmonics) arise due to the existence of free and bound waves [29]. This effect is typical for nonlinear wave transformations over a gentle bottom slope and often observed in experiments. Such spatial fluctuation of the first and second nonlinear harmonics was defined in [30] as a scenario of nonlinear wave transformation. The main characteristic scenarios of nonlinear wave transformation have been identified, in which a periodic energy exchange between harmonics inside the coastal zone is observed or not [29]. The variant of the scenario depends on the bottom slope and wave steepness according to the threshold [30]. If
tgα < 7 × (H/L)3/2,
where tgα is the tangent of average slope (α) of the coastal zone, H is the height and L is the wavelength at the entrance to the coastal zone, then scenarios with a second harmonic maximum inside of the coastal zone and periodic energy exchange between the 1st and 2nd harmonics are predicted.
Based on these characteristic scenarios, an empirical model for determining the position of an underwater bar depending on the wave climate has been proposed. It has been verified using field observations in the Baltic Sea [31].
In general, it is assumed that, as waves propagate toward the shore, a mutual adaptation or self-organization of wave transformation and bottom topography occurs. Waves impact the bottom topography and then change above it, and these changes lead to further changes in the bottom topography. There is no doubt that this occurs when the wave regime changes. However, it is unknown how self-organization occurs in detail, for example, even under the influence of a single wave regime with a constant period and wave height. Is the mutual adaptation between waves and bottom topography realistic, and how quickly does self-organization occur within a single constant wave regime? How do the waves themselves change, for example, the scenario of nonlinear transformation, and to what extent does the original bottom topography change? Is the nonlinear transformation scenario the determining morphological factor for a given bottom at a constant wave regime? Or is wave breaking such a factor? Detailed field and laboratory experiments to answer these questions have not been conducted. This is due to the difficulty of simultaneously measuring changes in waves and bottom topography, especially in the field.
Therefore, research is conducted using numerical experiments. For example, a recent study examined the influence of wave breaking on bar formation [8]. However, the process of wave modification due to changes in bottom topography was not considered in this study. Meanwhile, laboratory experiments in wave flumes demonstrate the possibility of obtaining a similar bottom relief when applying the same wave regime to an arbitrary topography [32,33,34,35].
The main goal of this study is to evaluate the influence of nonlinear wave transformation (scenarios, wave asymmetry, phase shift between harmonics, etc.) on bottom topography changes and to identify the main patterns of mutual adaptation between bottom topography and waves. For this purpose, a special laboratory experiment was conducted.

2. Experiment and Methods

A laboratory experiment was performed in a wave flume of Gidrotekhnika LLC in Sochi, Russia, in 2023. The flume is 22 m long and 1 m deep and wide. The flume is equipped with a wave generator manufactured by HR Wallingford (Wallingford, UK) and Data Acquisition software (HR DAQ, HR Wallingford, UK). Fifteen string capacitive wave gauges were installed along the flume to simultaneously record waves at a sampling rate of 50 Hz. The experiments were conducted over an initially horizontal sand bottom. The uniform sand layer was 15 cm thick for a distance of 9.9 m. The experimental setup is shown in Figure 1.
The sand characteristics are presented in Table 1. Overall, the sand can be characterized as fine-grained (Md = 0.18 mm) and well sorted (S < 2.5).
The experiment studied the propagation of monochromatic waves. Three consecutive tests of the impact of different monochromatic waves on the original flat sand bottom were selected for analysis. A description of the tests is given in Table 2.
Wave propagation above a horizontal bottom, according to criterion (1), will have a scenario of nonlinear wave transformation with a second harmonic maximum and a periodic energy exchange between the 1st and 2nd harmonics.
Changes in the bottom topography were assessed through direct measurements at 22 points along the length of the flume using a special lot. The value obtained at one point was averaged over three measurement points along the width of the flume. Changes in the topography were additionally assessed based on video and photo data. A comparison of the bottom topography obtained from direct measurements with that obtained through digital analysis of photo and video materials revealed good agreement. The description of the wave breaking was based on visual observations and video shooting.
The main wave parameters were determined through spectral analysis. The spectrum was constructed using the Welch method with a Hamming window [36]. The Welch method averages spectral estimates over overlapping segments of the wave record. Thus, the frequency resolution of the spectral estimates is determined by the length of these segments. In the study, it was constant and equal to 0.02 Hz. The wave period was determined as the spectrum peak frequency; the significant wave height was determined as follows:
h s = 4 S ( f ) d f ,
where S is the spectrum and f is the frequency.
Estimates of the variability of higher wave moments, which are indicators of nonlinear wave transformation—asymmetry relative to the vertical axis (As, “asymmetry”) and asymmetry relative to the horizontal axis (Sk, “skewness”)—were made using the formulas:
A s = H ( ξ ) 3 ξ 2 3 / 2
S k = ξ 3 ξ 2 3 / 2
where ξ is the free surface elevation (waves) and the angle brackets mean averaging over time. The skewness and asymmetry play an important role in sediment transport, particularly in shallow water wave-dominated conditions [6,7].
Bottom relief deformations depend on the sediment discharge gradient and can be calculated as follows:
dq/dxdh/dt,
where h is the depth.
A positive sign (+) of the gradient corresponds to an increase in depth, i.e., bottom erosion, while a negative sign (−) corresponds to a decrease in depth, i.e., sand accumulation.
To assess the influence of nonlinear wave transformation on bottom changes, Bailard’s formula for sediment discharge was used [14]:
q = 1 2 f w ρ ε b tan σ u | u | 2 ¯ + ε s W s u | u | 3 ¯ ,
where fw = 0.01 is the coefficient of bottom friction, ρ is the sand density, εb = 0.1 and εs = 0.01 are the coefficients of turbulent viscosity and turbulent diffusion, tan σ = 0.5 is the coefficient of particles’ inner friction, w is the sediment fall velocity and u u 2 ¯ and u u 3 ¯ are the third and fourth moments of near-bottom velocity. This formula is based on the nonlinear properties of waves (through moments of near-bottom velocity) and, as was shown previously, effectively describes cross-shore directed sediment transport [5,6].
Near-bottom velocity was recalculated from free surface elevations using linear wave theory, and then the third and fourth moments were calculated [37]. The first term of Formula (2) describes suspended sediments and the second describes bed load sediments.
For simplicity, comparisons were made only qualitatively as changes in the gradients of the third and fourth moments. Gradients describe changes in the direction of sediment discharge and qualitative changes in bathymetry (increase/decrease in depth), with an accuracy of constant coefficients for Bailard’s formula, sand density and sediment fall velocity. These constant coefficients do not affect the signs of the gradients characterizing erosion and accumulation. From Formula (5), it follows that gradients are a kind of analog of the velocity of bottom deformation. Although the gradients of the moments analyzed here do not strictly have the dimension of velocity, for the convenience of qualitative description we will mention and use this further as “the rate of bottom deformation”.
As was shown in [38,39], these moments can be approximated as follows:
u | u | 2 ¯ = 3 4 u 1 2 u 2 cos φ
u | u | 3 ¯ = 16 5 π u 1 3 u 2 cos φ ,
where u1 and u2 are the amplitudes of first and second nonlinear harmonics, φ is the shift in phases between them (biphase).
From Formulas (7) and (8), it follows that the biphase is an important parameter. Bispectral analysis was used to calculate the biphase [40]:
φ ω 1 , ω 2 = a r c t a n I m { B ω 1 , ω 2 } R e { B ω 1 , ω 2 }
where B ω 1 , ω 2 = E A ω 1 A ω 2 A * ω 2 is the bispectrum, ω is the angular frequency, A values are the complex Fourier amplitudes of free surface elevations and E is the averaging operator.
As demonstrated in previous studies [40,41], a high level of bicoherence is a criterion for the accuracy of biphasic assessment. Bicoherence was calculated using the following formula [40]:
b 2 ( f 1 , f 2 ) = B ( f 1 , f 2 ) 2 E [ | W ( f 1 ) W ( f 2 ) | 2 ] E [ W ( f 1 + f 2 ) f 2 ] b 2 = B ( ω 1 , ω 2 ) 2 E A ω 1 A ω 2 2 E A ω 1 + ω 2 2
For all calculations performed, the squared bicoherence function was no lower than 0.86. This means that the obtained biphase values are statistically significant (95% confidence interval). Some results demonstrating the reliability of the biphase assessment for Test 1 can be found in the Supplementary Materials.
The frequencies of the first and second harmonics were determined by the local maxima of the wave spectrum.
As can be seen from Formulas (6)–(8), sediment discharge q depends on the amplitudes of the first and second nonlinear wave harmonics and the phase shift between them. The biphase (its cosine) determines (a) the points where sediment discharge is zero and (b) the direction of sediment discharge. Taking this into account, changes in the amplitudes of the first and second harmonics, as well as the biphase, will be analyzed. To analyze all of these parameters, 2 min long recordings will be used; that is, the entire wave recording will be divided into 2 min segments, after which the dynamics of the parameters in these segments will be analyzed over the entire wave action period in each test. To assess the change in the rate of bottom deformation, 10 min long recording segments were also used.

3. Results and Discussions

3.1. Wave Transformation and Bottom Deformation, Test 1

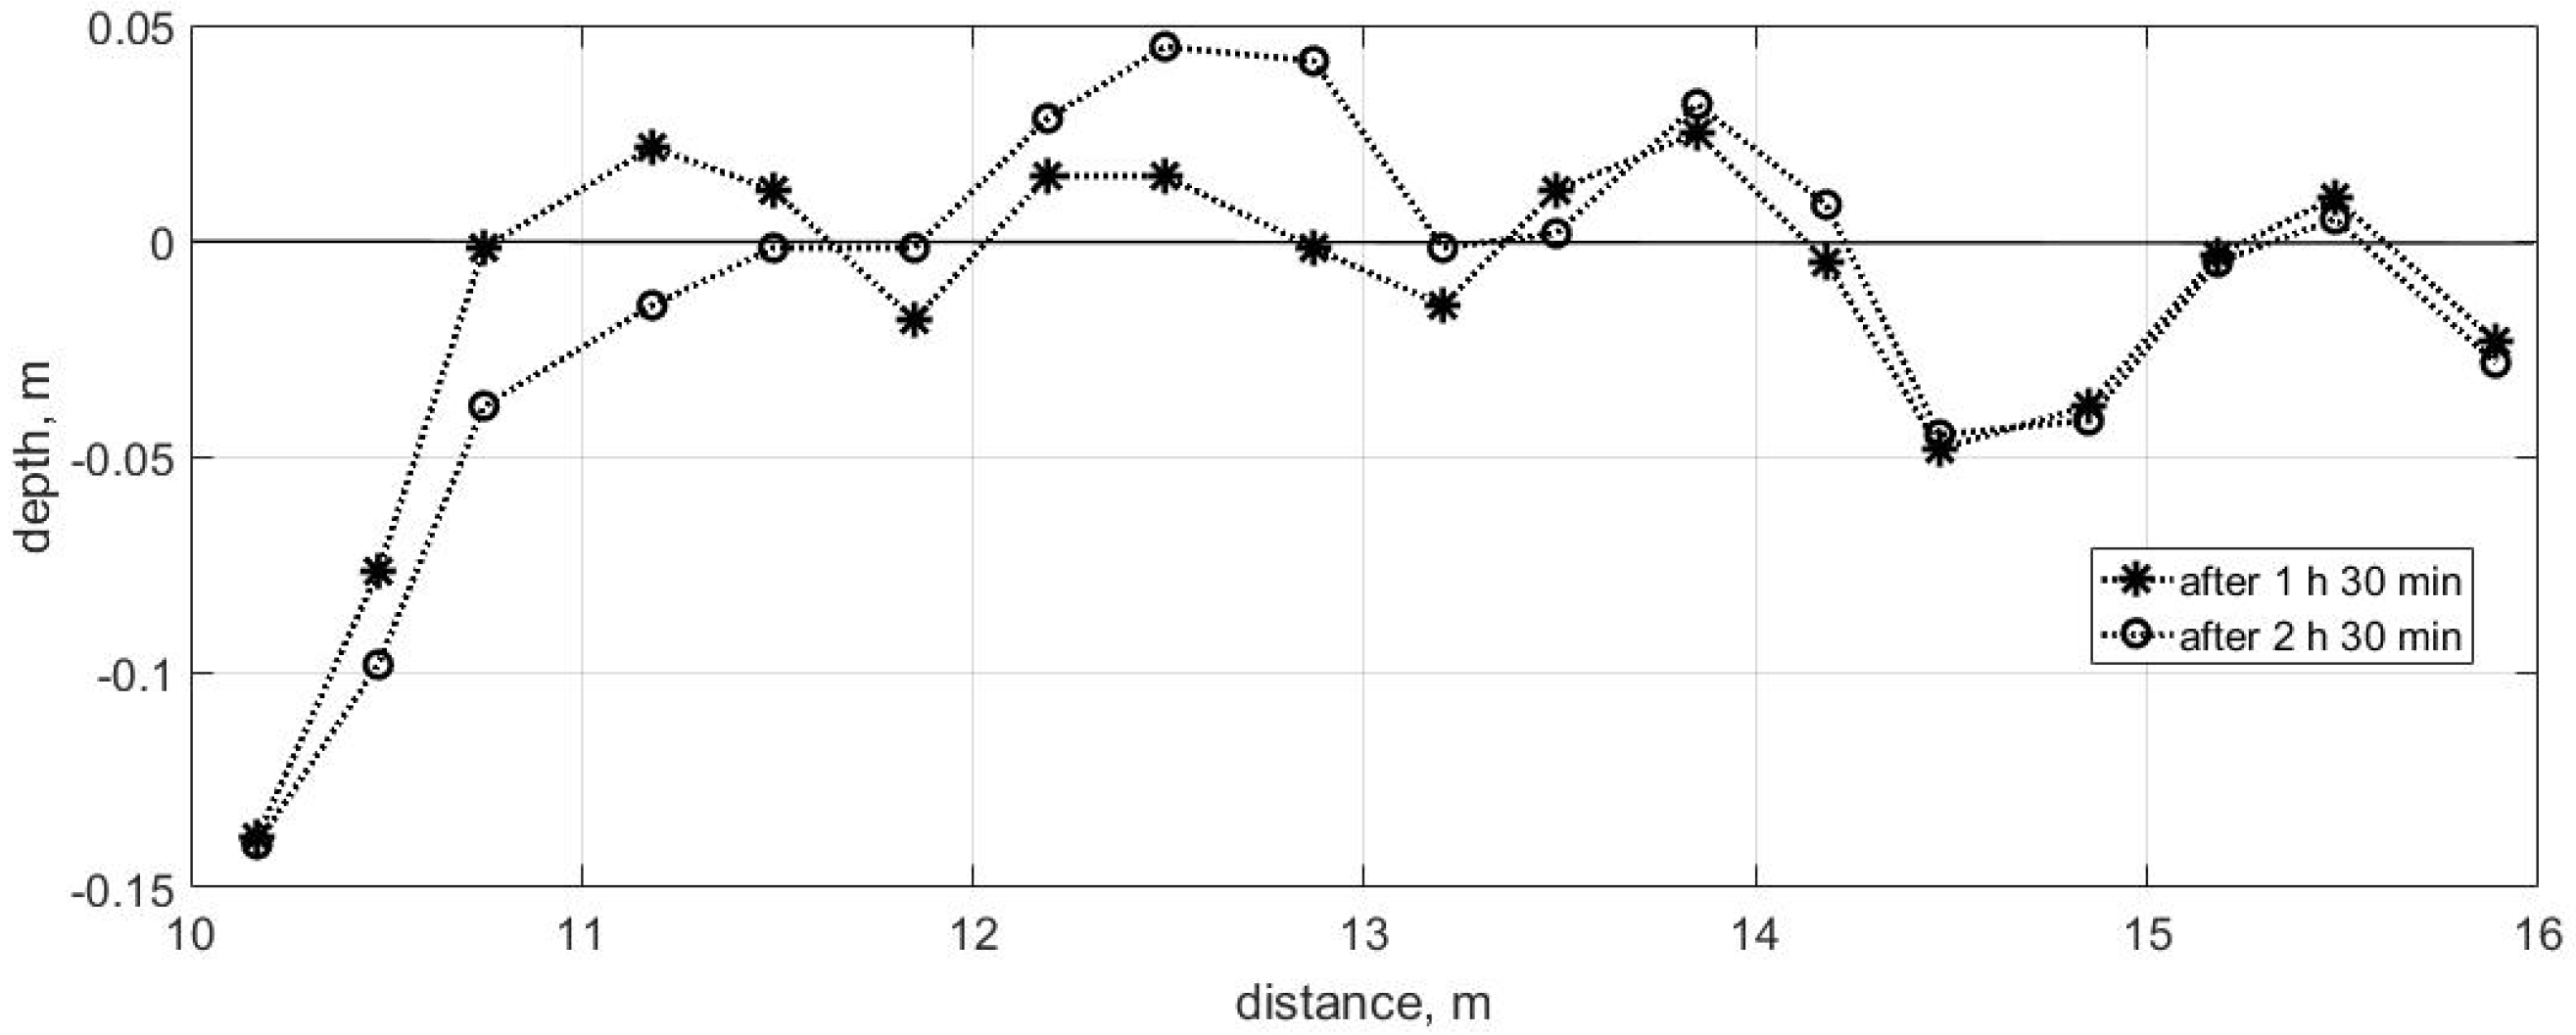
To understand whether mutual adaptation or self-organization occurs between waves and the bottom relief, we consider wave transformation (Test 1, Table 1) over an initially flat, horizontal sandy bottom (Figure 1) and evaluate how the relief and waves change over different time periods. The change in the bottom relief during different periods of wave action is shown in Figure 2.
It is clearly visible that, within the first 30 min, a bar forms with an almost constant top position at a distance of approximately 13.8–14 m (Figure 2). Over time, under the influence of waves, the bar top grows, the forward trough deepens, and the seaward trough fills slightly. Another bar forms at a distance of 12–13 m. Over time, it becomes higher, and its top shifts toward the shore. At a distance of 15.5 m, the bottom relief remains unchanged. This area may be slightly affected by reflected waves, as the wavelength is about 4m and the distance to the inclined wave absorber is about 19 m. Thus, when monochromatic waves impact a flat, horizontal sandy bottom, sediment accumulation is observed in the 11.8–14.5 m region, with erosion occurring in the 10–11.8 m and 14.2–15.5 m regions. The relief features two bars with tops at 12.5 and 13.8 m.
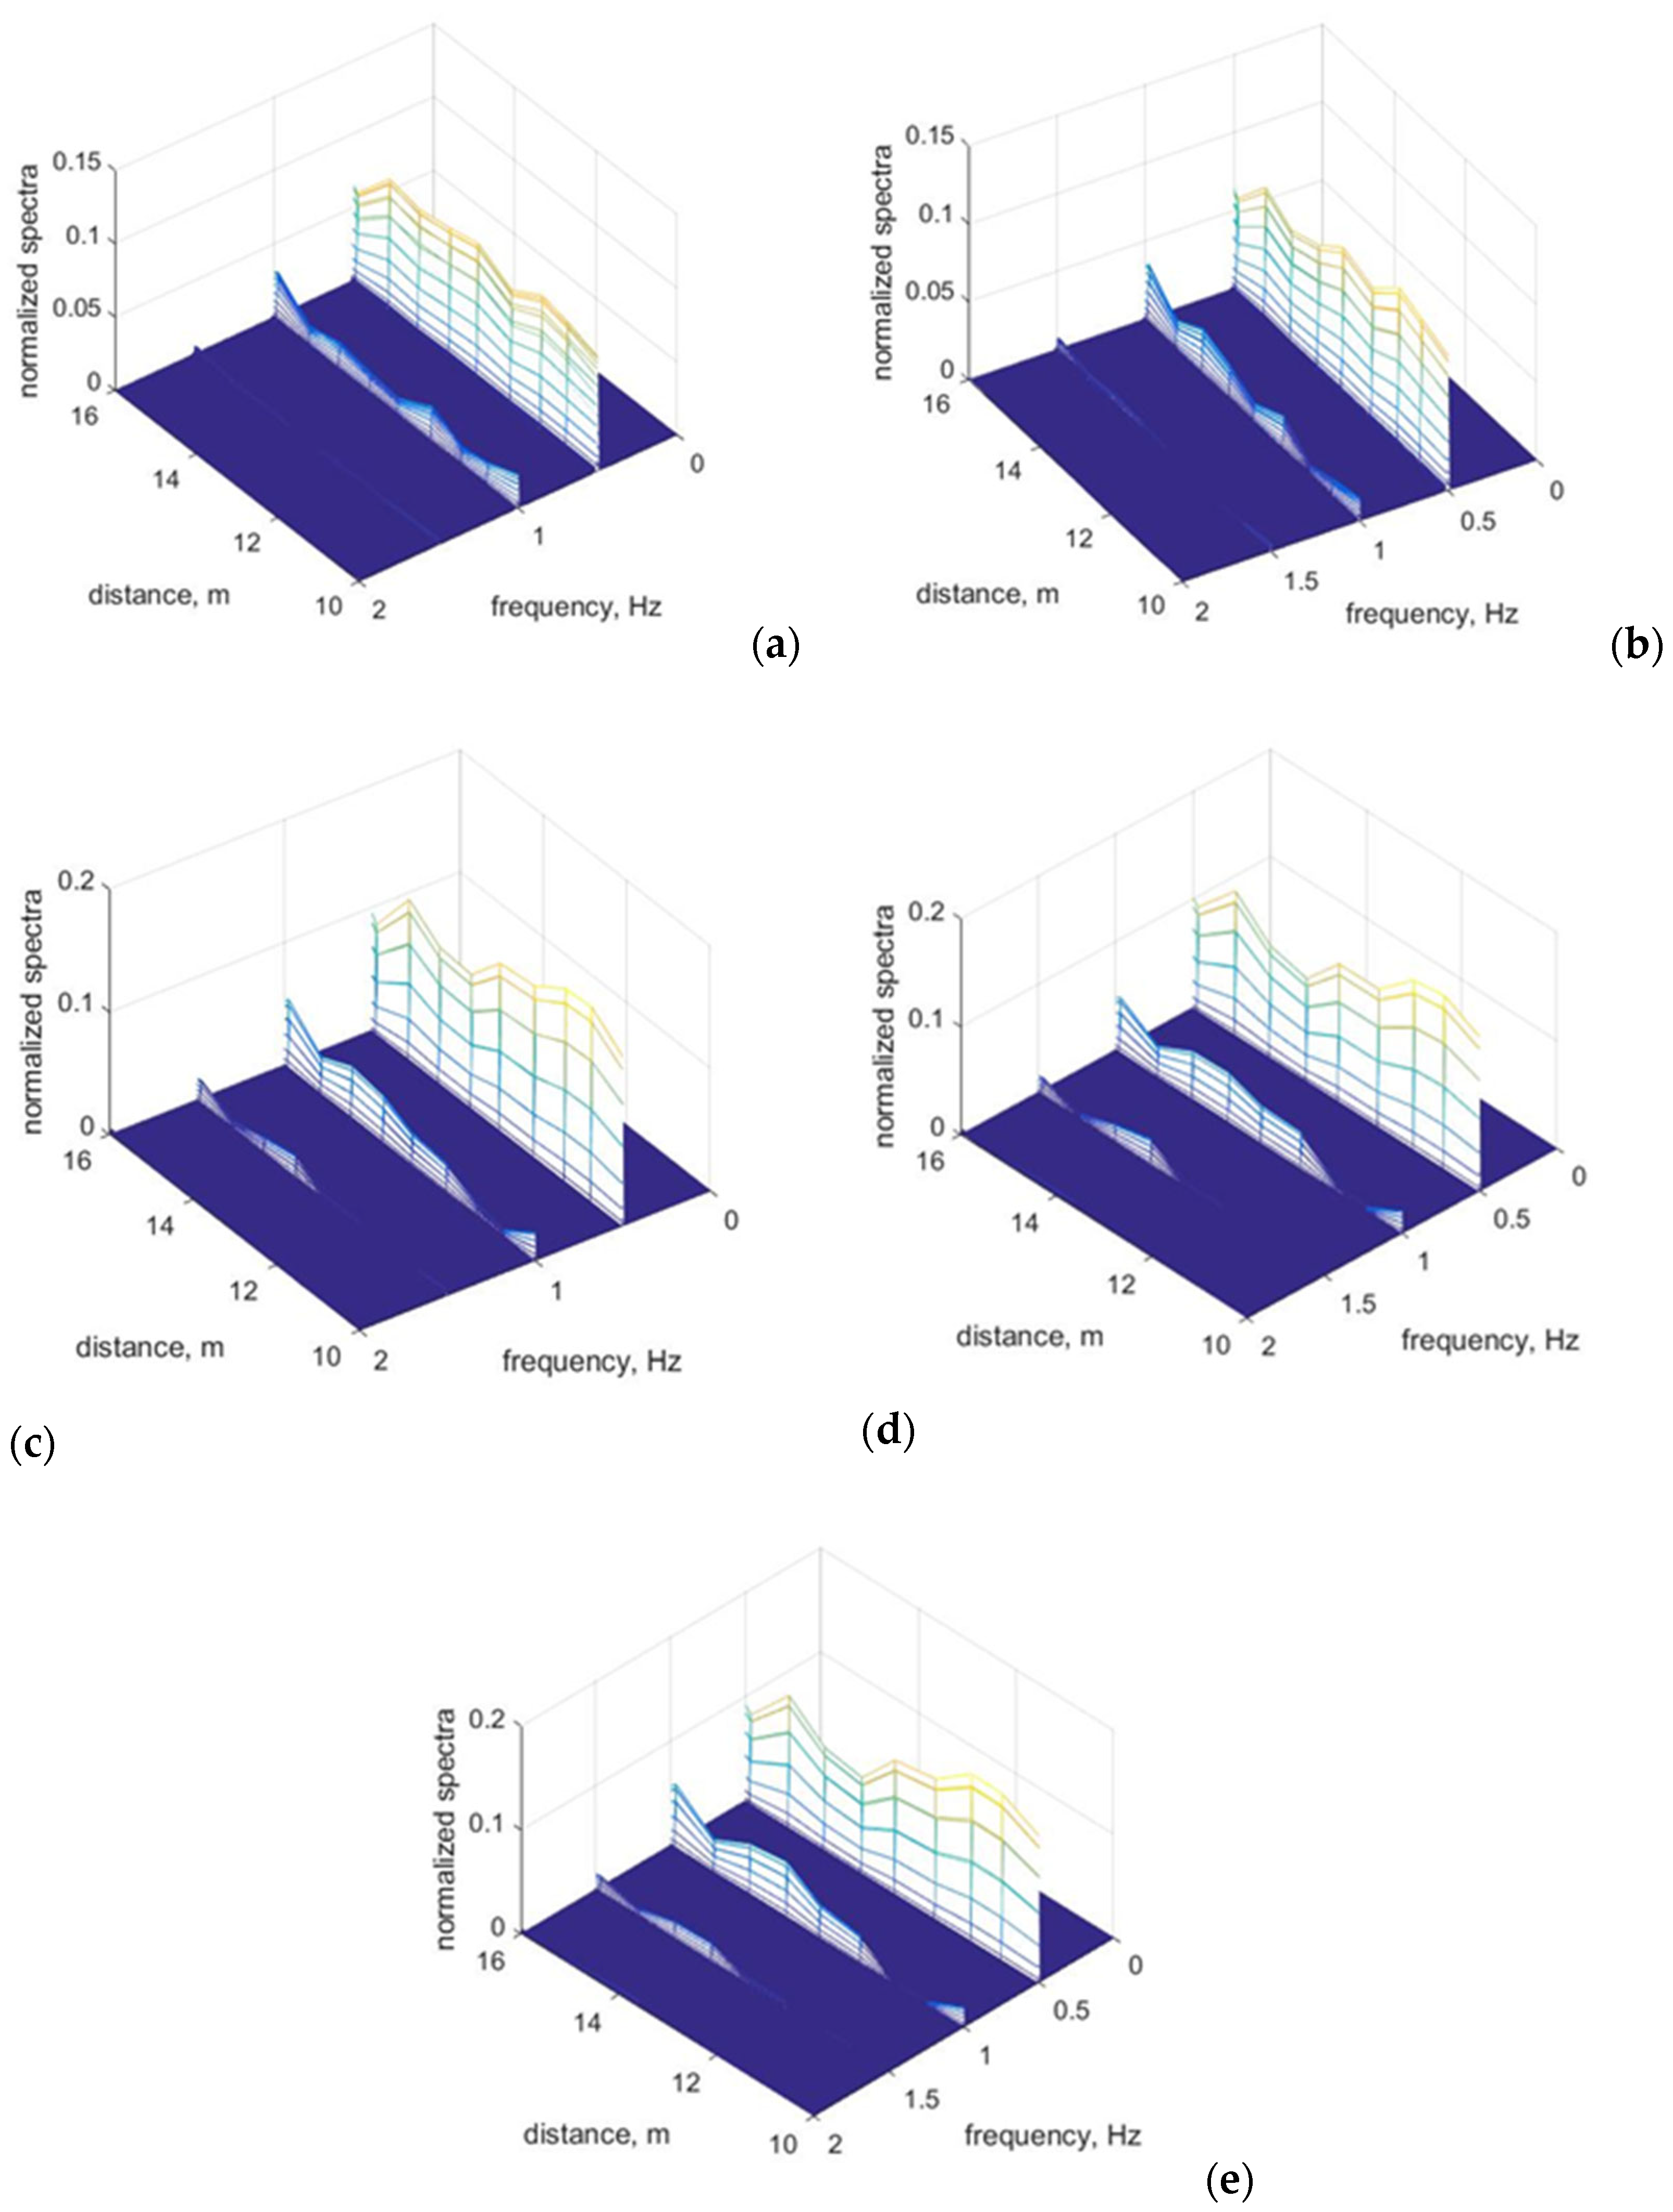
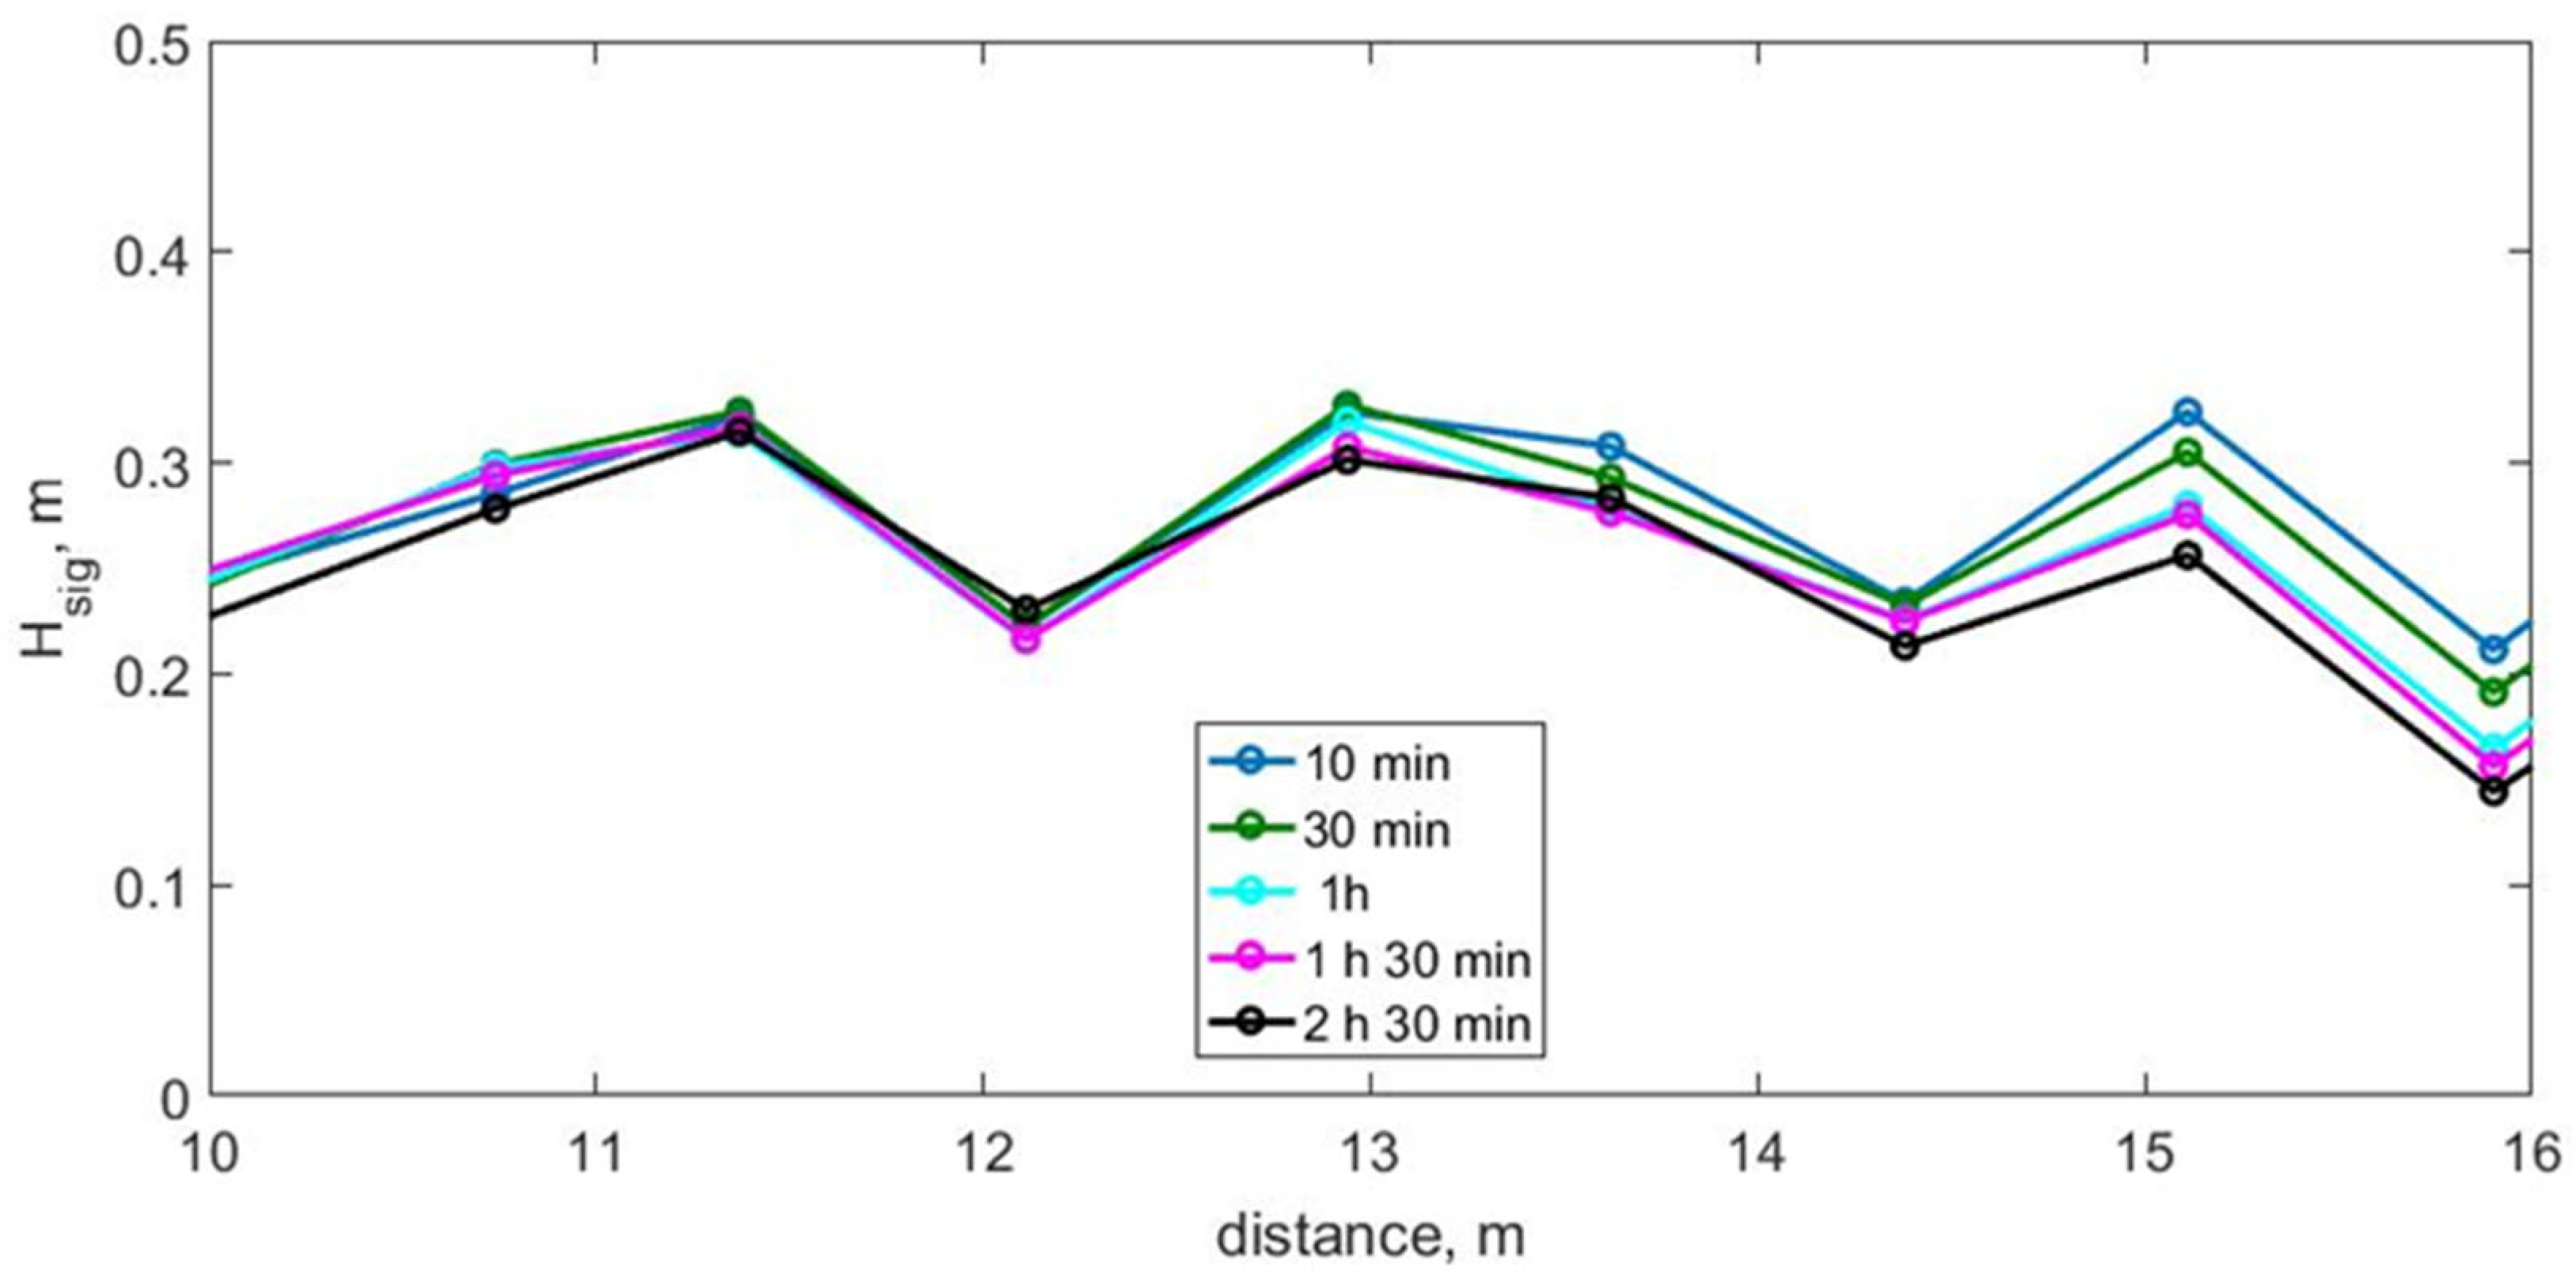
The changes in the wave spectrum, calculated from two-minute chronograms at some time intervals of wave impact are shown in Figure 3. It is clearly evident that the main period (the peak period of the spectrum) of the waves does not change, i.e., changes in the bottom topography do not affect the wave period. It is also evident that, as the waves propagate and the bottom relief changes, higher harmonics increase, and the ratio of the first and second harmonic energies changes both spatially and temporally. Periodic fluctuations in the amplitudes of the first and second harmonics are caused by the peculiarities of nonlinear wave transformation at shallow and intermediate water depths and are associated with the simultaneous presence of free and bound waves [29]. These fluctuations along the flume length are there also in the significant wave height, and are shown in Figure 4 at various times during wave action. It is evident that the wave height generally decreases over time, which may be related to changes in the bottom relief and the impact of wave breaking. The greatest decrease is observed at a distance of 14.5–16 m. At a distance of 11.5–12.5 m, the significant wave height remains almost unchanged.
Let us consider how the waves change as they propagate over the changing bottom relief in detail. As was noted above, the nonlinear transformation of waves is characterized by an increase in higher multiple wave harmonics. As shown by previous studies, the most important factors, both in terms of the contribution to sediment transport processes and for determining the wave transformation scenario, are the first (main) and second wave harmonics [28,30].
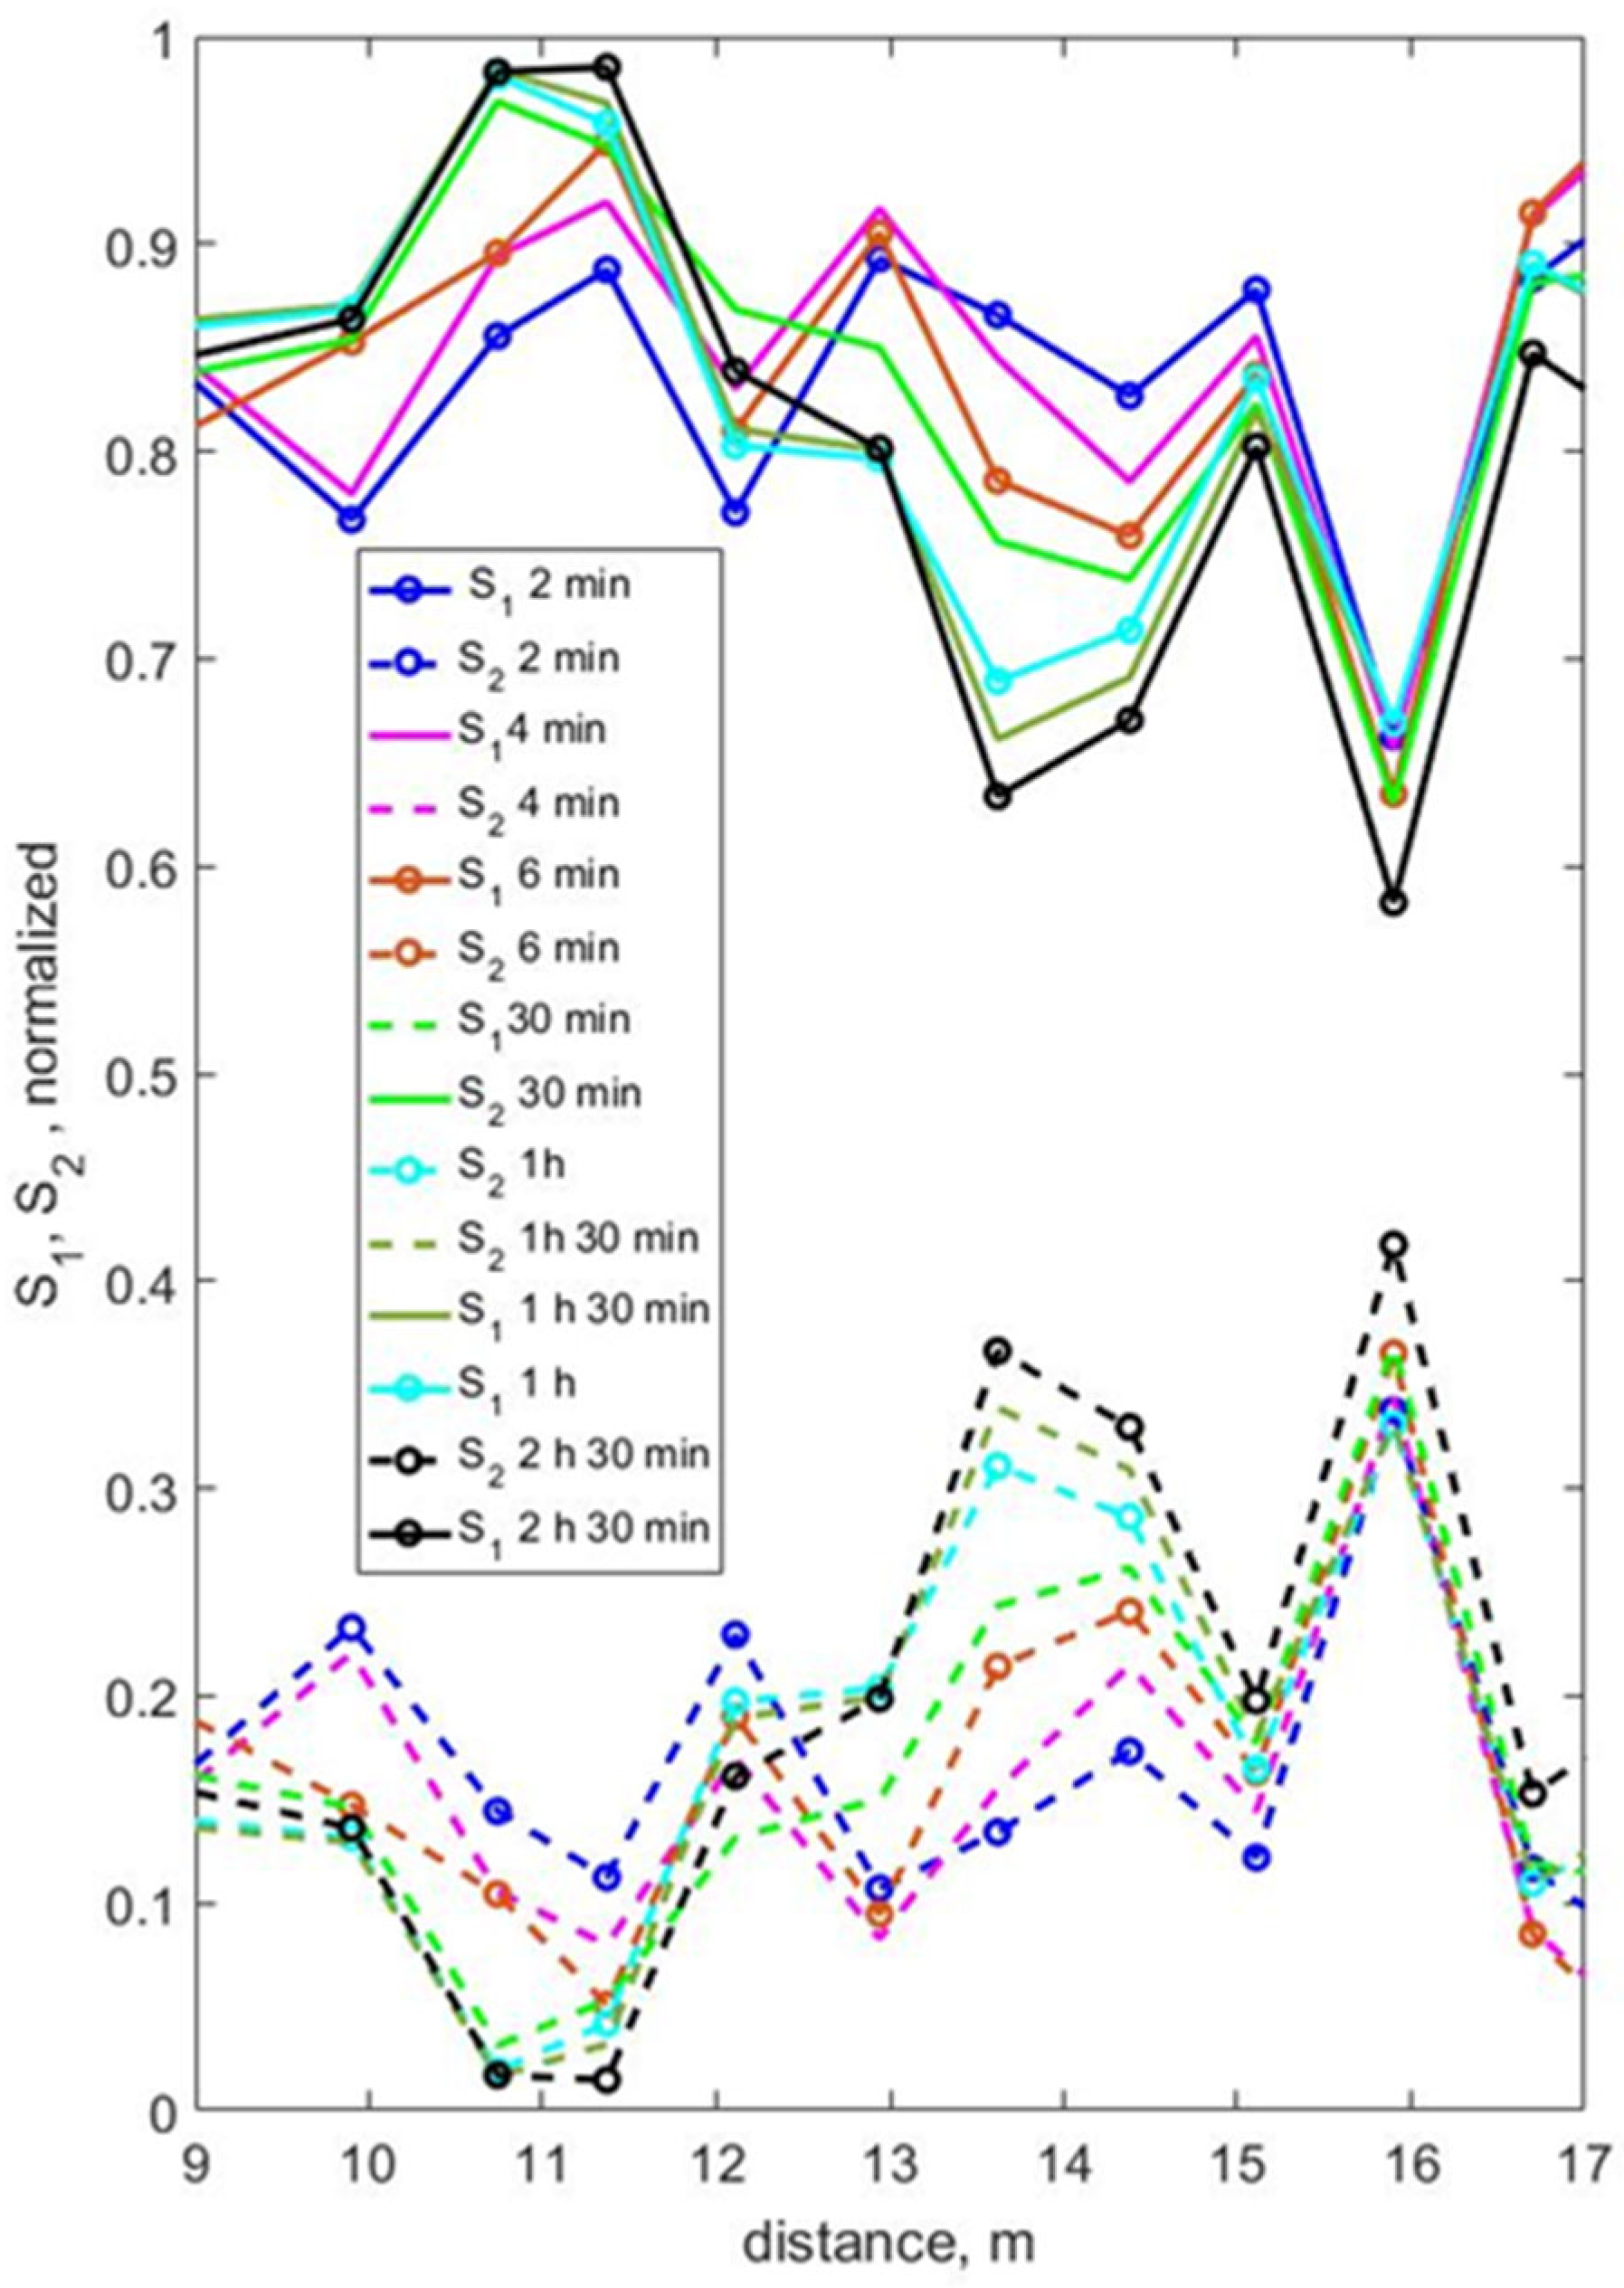
Figure 5 shows the changes in the amplitudes of the first and second harmonics in space at some time intervals in the experiment Test 1. The amplitudes are presented in dimensionless form and calculated as the ratio of the spectral energy at the corresponding frequency to the total spectral energy.
It is evident from Figure 5 that the locations of the maxima and minima of the second harmonic amplitudes generally remain unchanged over time. The maximum of the second harmonic amplitude at a distance of 15.8 m, unchanged in position but increasing in value, may be due to the reflection of waves from the end of the flume. The greatest changes occur in the first 6 min of wave action. The initial maxima of the second harmonic amplitudes at distances of 10 and 12.2 m gradually disappear. For the second harmonic, the maximum amplitude at a distance of 14.5 m prevails, where the amplitude begins to grow due to the formation of a bar and a decrease in water depth. After an hour of wave action, the maximum of the second harmonic amplitude shifts to a distance of 13.5 m due to a change in the bottom relief and the formation of a higher top of the second bar (shallower depth). A stable minimum is formed, with a decrease in the absolute value of the amplitude of the second harmonic at a distance of 11.2 m. Over time, it shifts to a distance of 10.8 m. Stable minima of the amplitude of the second harmonic are also observed, but with an increase in the absolute value of the amplitude at distances of 15 and 16.5 m. The minimum of the amplitude of the second harmonic at a distance of 13 m disappears after half an hour of wave action, which is associated with the formation of an underwater bar in the region of 13.5 m and a decrease in depth in this area, leading to an increase in the amplitude of the second harmonic when the waves propagate over a decreasing water depth.
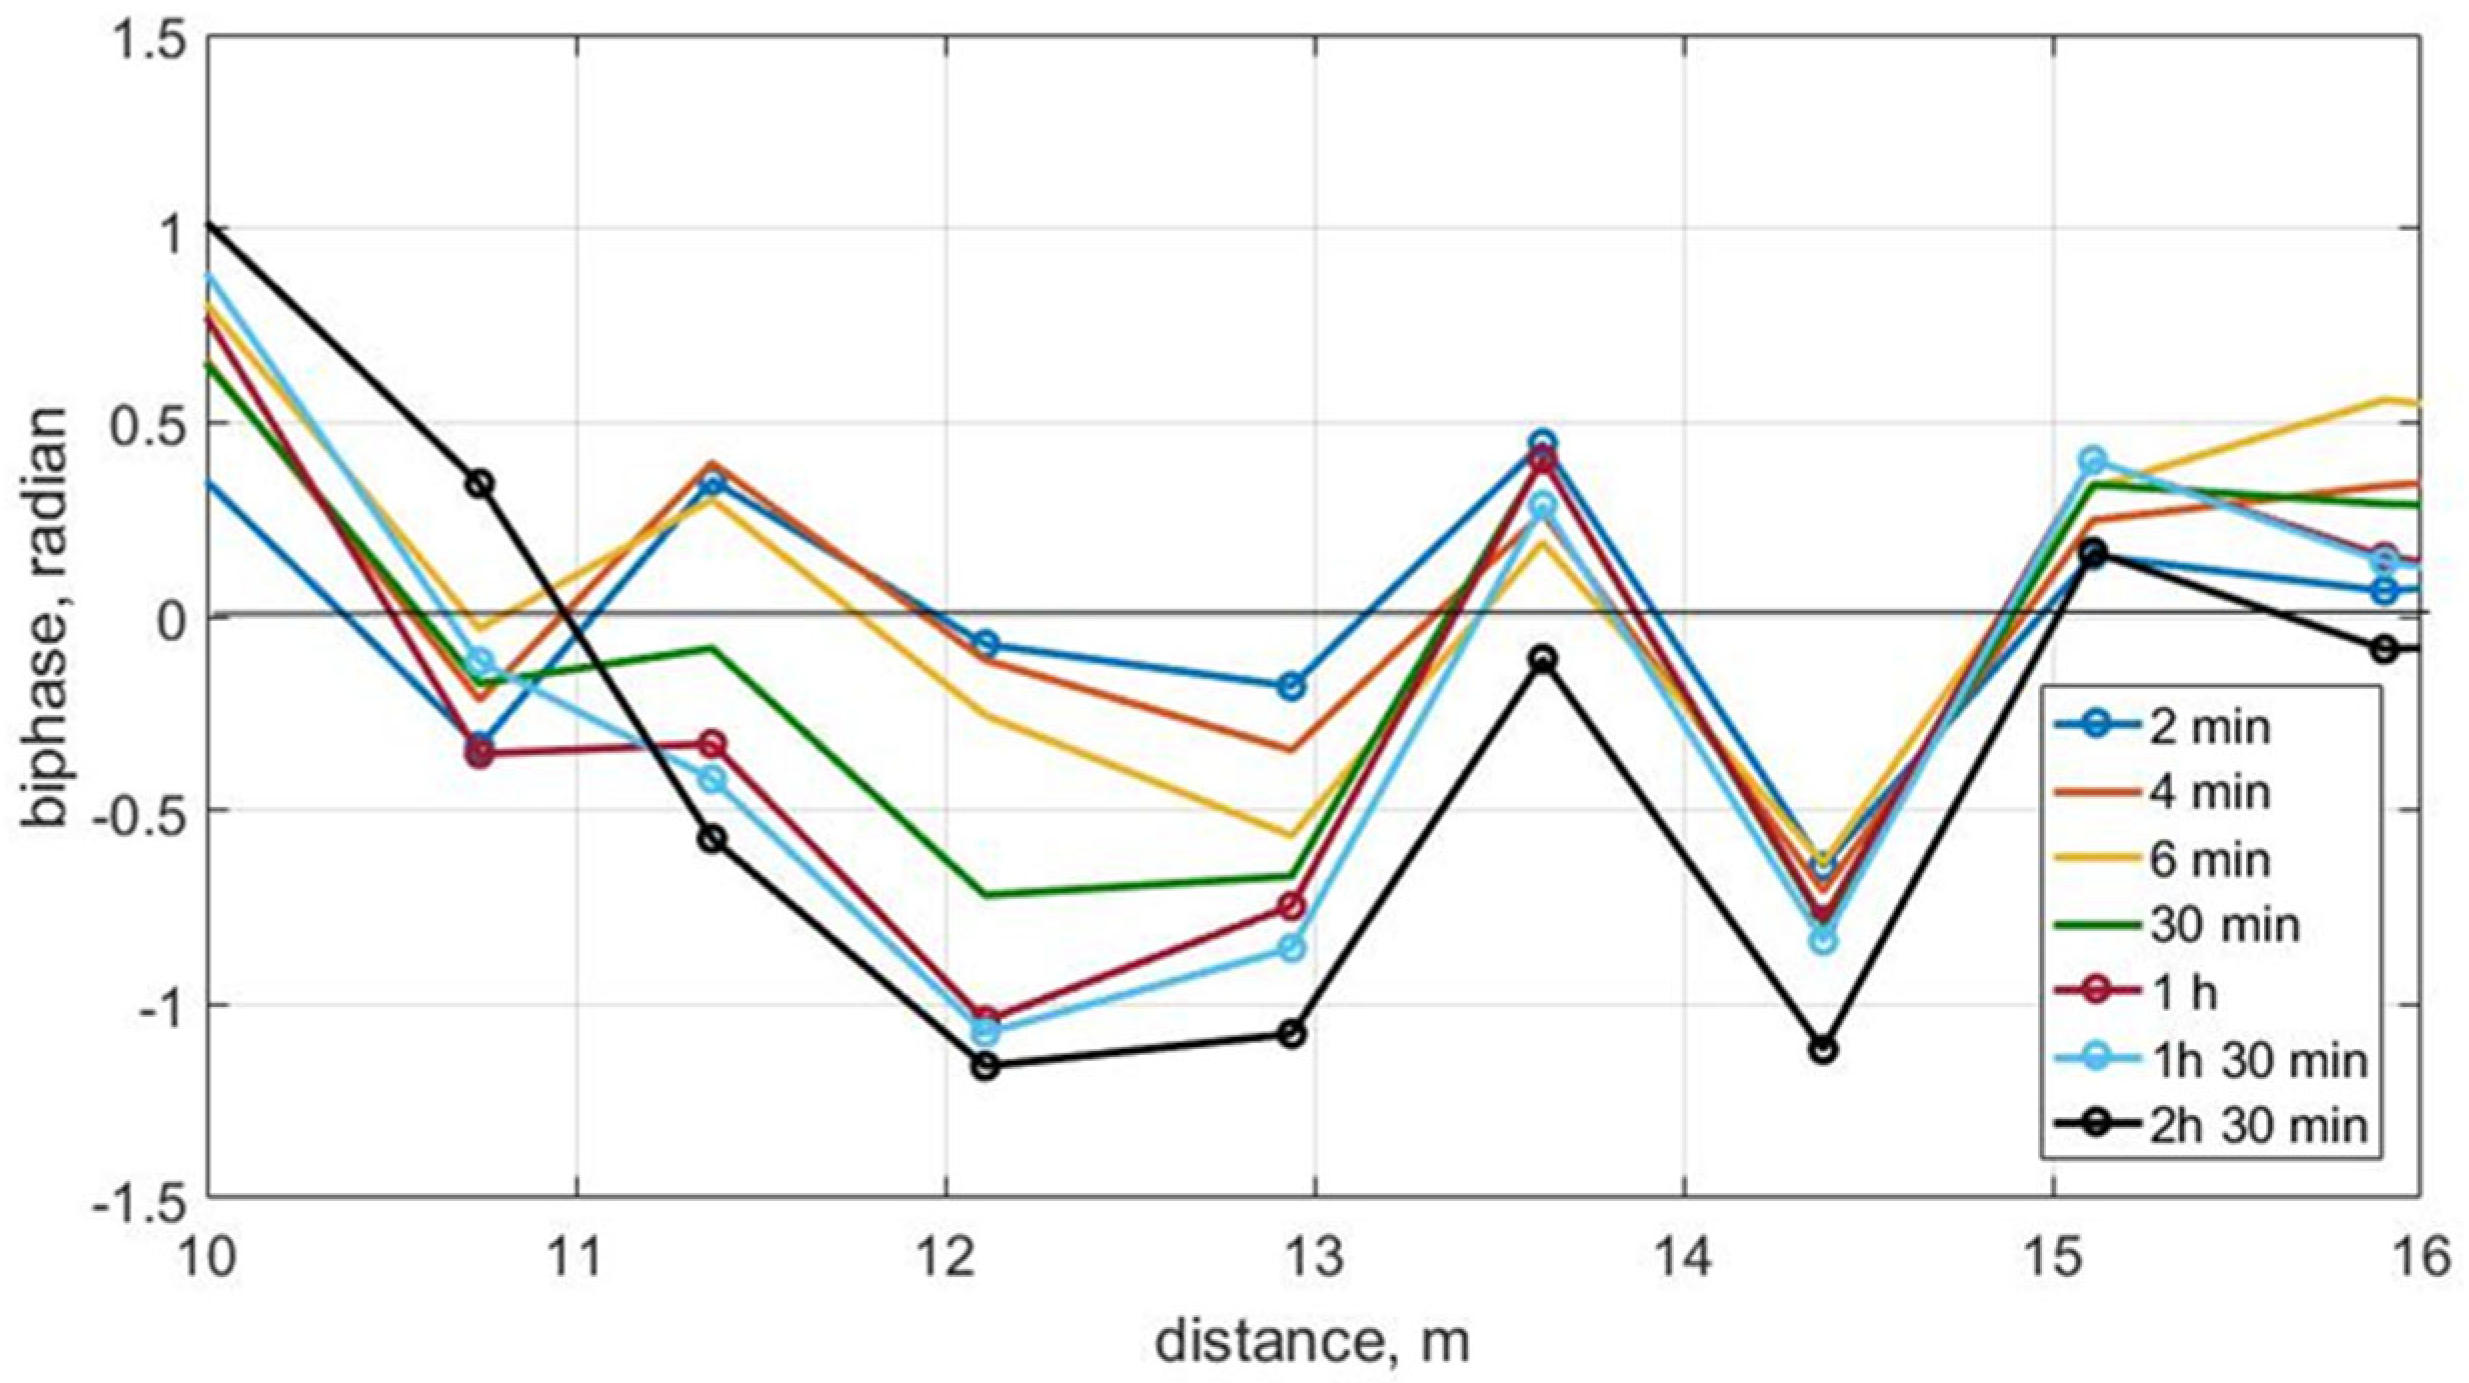
The change in the biphase over the time of wave action is shown in Figure 6. Overall, the spatial evolution of the biphase changes insignificantly at a qualitative level. As with the wave transformation scenario, the main changes occur in the first 6 min: biphase values change from positive to negative over a distance of 11–12 m. According to previous studies, erosion is typical for bottom sections where the biphase is negative. Such sections in the first 30 min of wave action are 10.5, 12–13 and 14.5 m. Qualitatively, this corresponds well with the formed bottom topography (Figure 2). Over time, the wave action increases the absolute negative values of the biphase, and a slight spatial shift occurs in the starting point of the negative biphase values in the 12–13 and 15.8–16.8 m sections. This is due to changes in the bottom topography and the observed plunging breaking, characterized by a negative biphase [42].
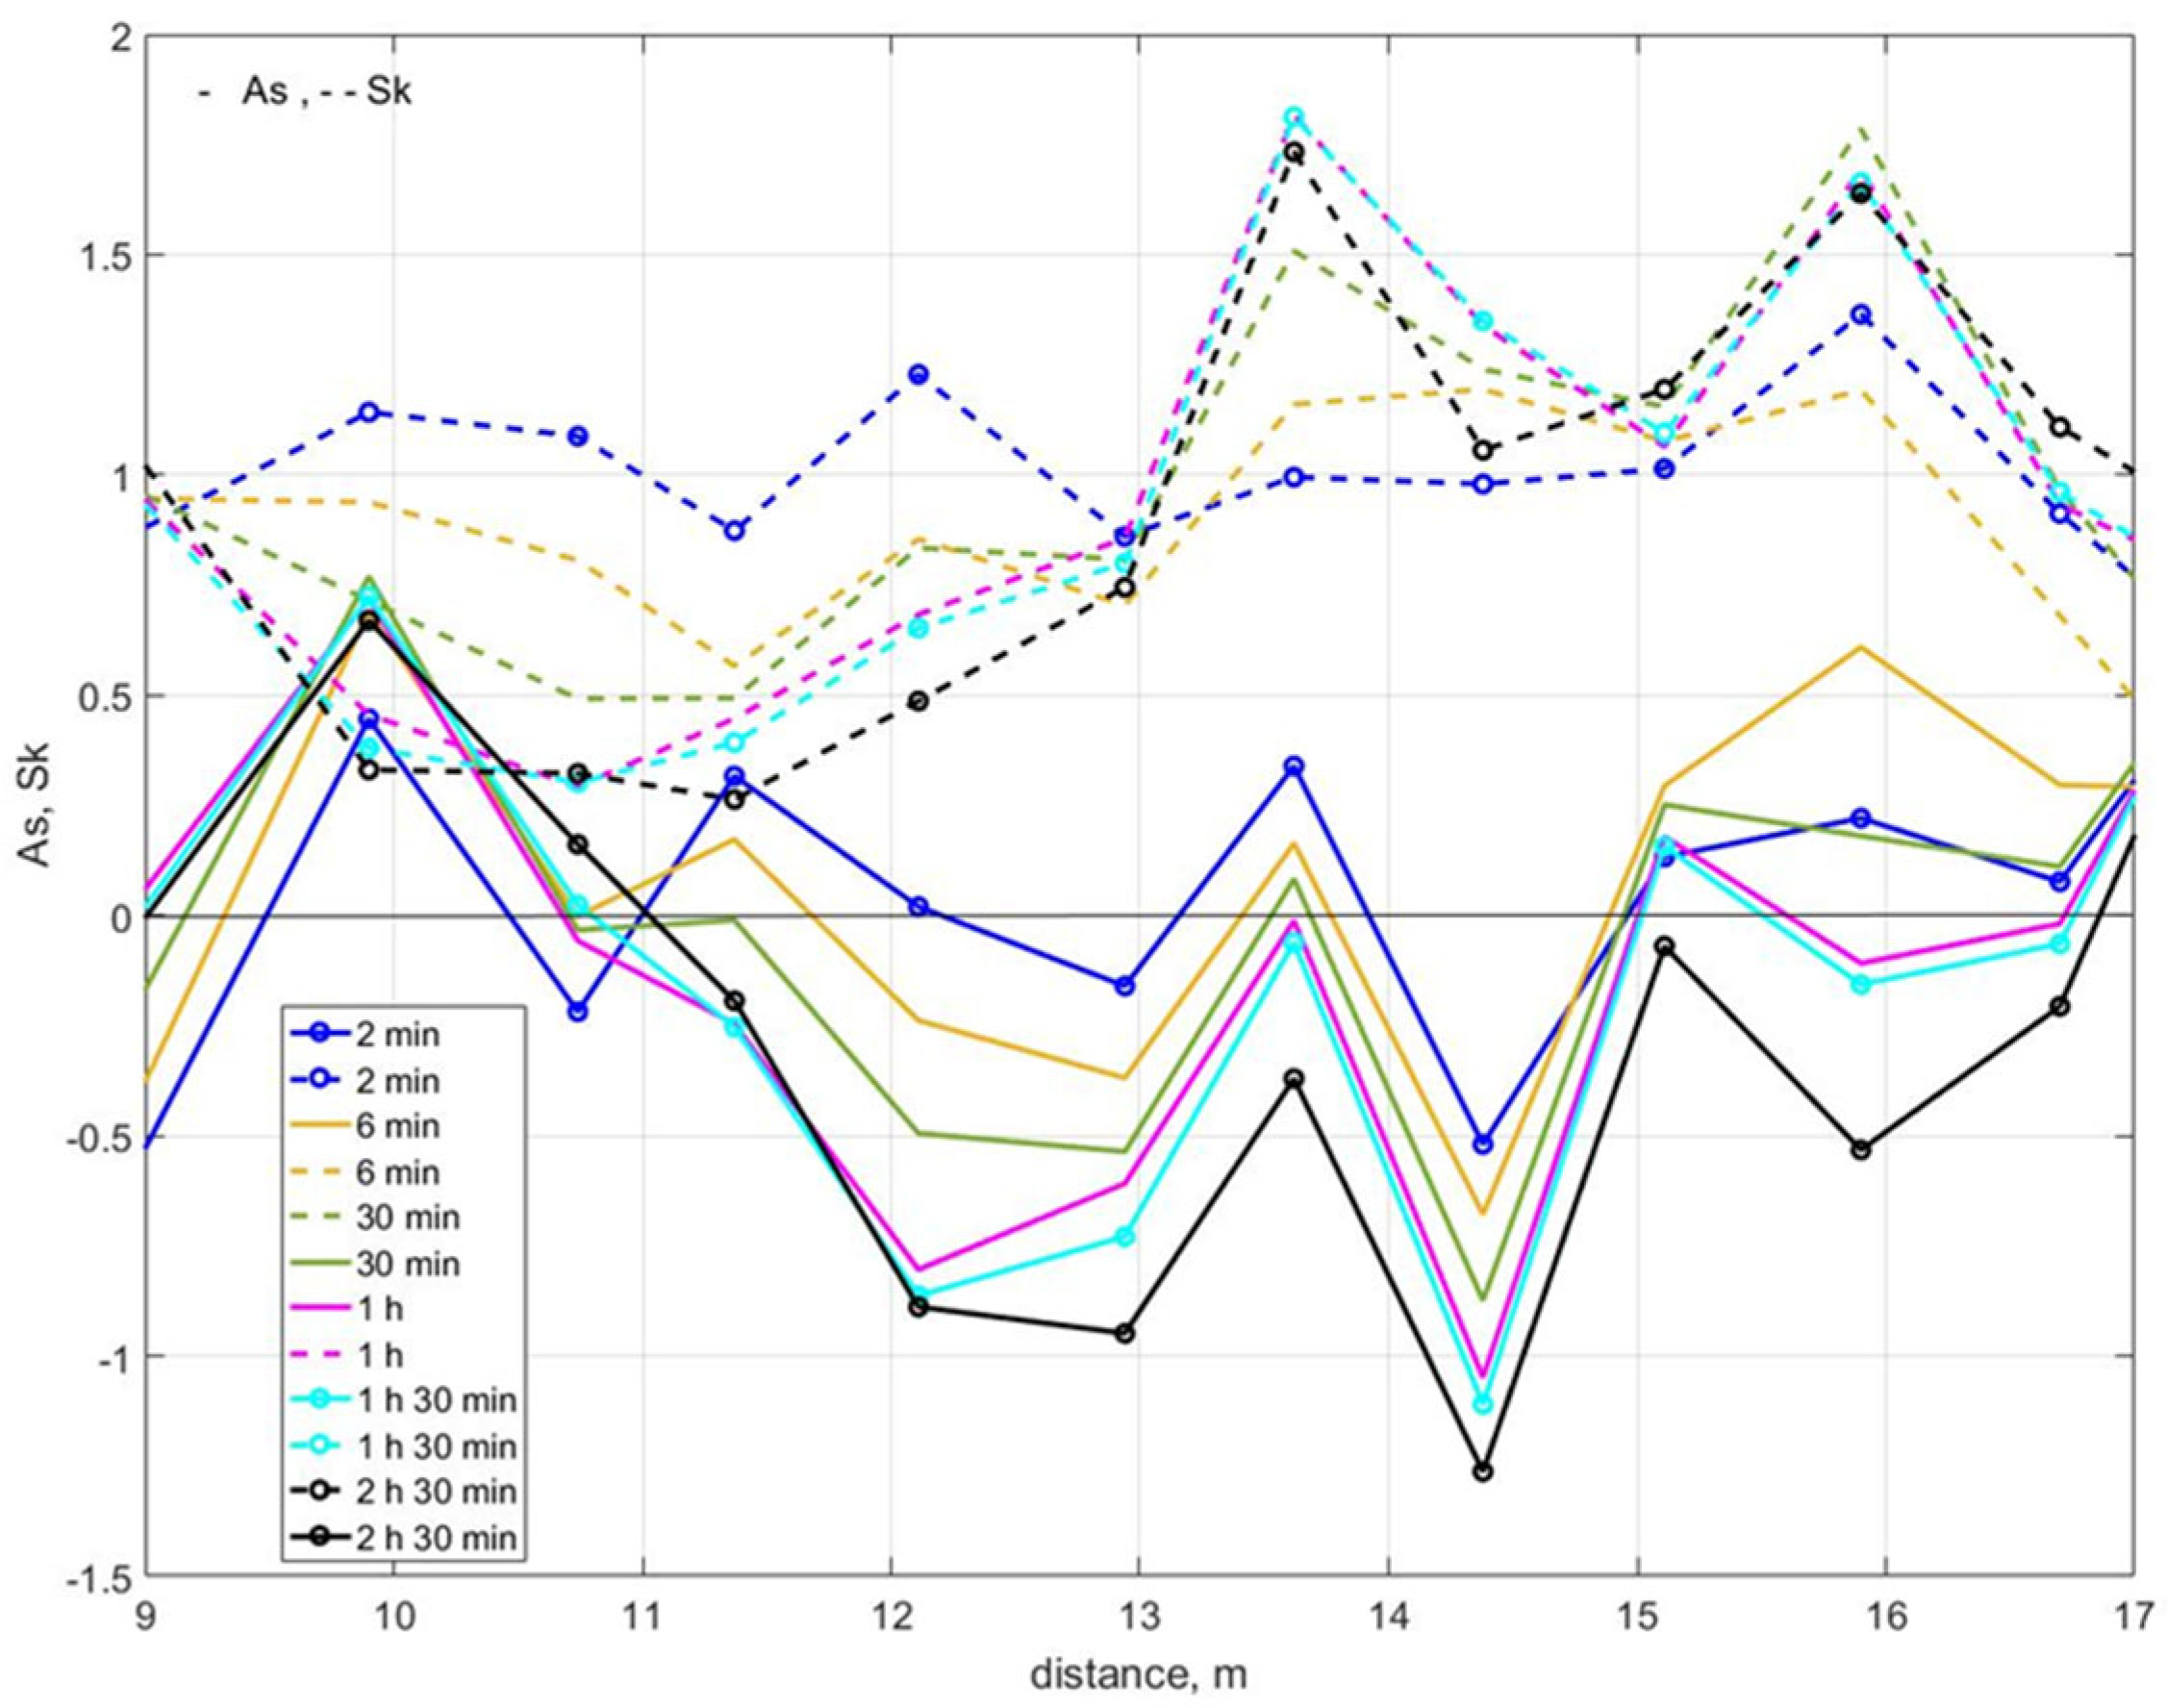
A visible change in the wave symmetry relative to the vertical (As) and horizontal (Sk) axes also occurs in the first 6 min of wave action (Figure 7). With further wave action and relief changes, the positions of their maxima and minima remain virtually unchanged. The absolute values of As decrease, and the absolute values of change insignificantly. This means that, while propagating over the modified relief, the waves become increasingly asymmetrical with a steep front. This corresponds to the observed plunging breaking. The wave symmetry does not change at a distance of 10–11 m, since the bottom does not change there. It can be noted that the change in As follows the change in the biphase, which once again confirms their linear relationship revealed earlier [43]. changes significantly at a distance of 10–12 m; this is due to an increase in the water depth and the erosion of this area.
As the flat bottom changes, the wave breaking begins. According to visual observations from the video and photo data, the wave breaking point changed over time. Thus, during the first 30 min of wave impact on the relief, a slight wave breaking (spilling type) was sometimes observed at a distance of 15–16.7 m, which was apparently due to the accumulation of sediment in the area of 15.5 m and a decrease in the water depth. After 45 min of wave impact, the breaking point moved to a distance of 13–13.5 m and the spilling breaking type was replaced by plunging. This is due to the formation of bars with tops at 12.5 and 13.8 m. The position of the second bar’s top shifts to the shore over time. In addition, the waves before the top of the bars propagate not above a flat bottom, but above an inclined bottom, which contributed to a more rapid increase in wave height due to the shoaling effect. After an hour and a half, the waves sometimes began to break by spilling at the entrance to the underwater slope at a distance of 10–11 m, as a small ridge was formed here. With further wave action, the plunging breaking occurs at a distance of 13–15 m, which corresponds to the positions of the two formed bars. Waves as a bore propagate to about 17 m. At the same time, the top of the seaward bar grows faster. It is possible that the trough between the bars observed at a distance of 13.5 m is also the result of the breaking. The trough in the area of 14.5 m is gradually washed; perhaps this is the result of the action of the bore. Thus, the wave breaking occurs in the accumulation zone; the breaking point migrates as the bottom relief changes. In the first hour, it migrates quite strongly, and then its location is practically the same.
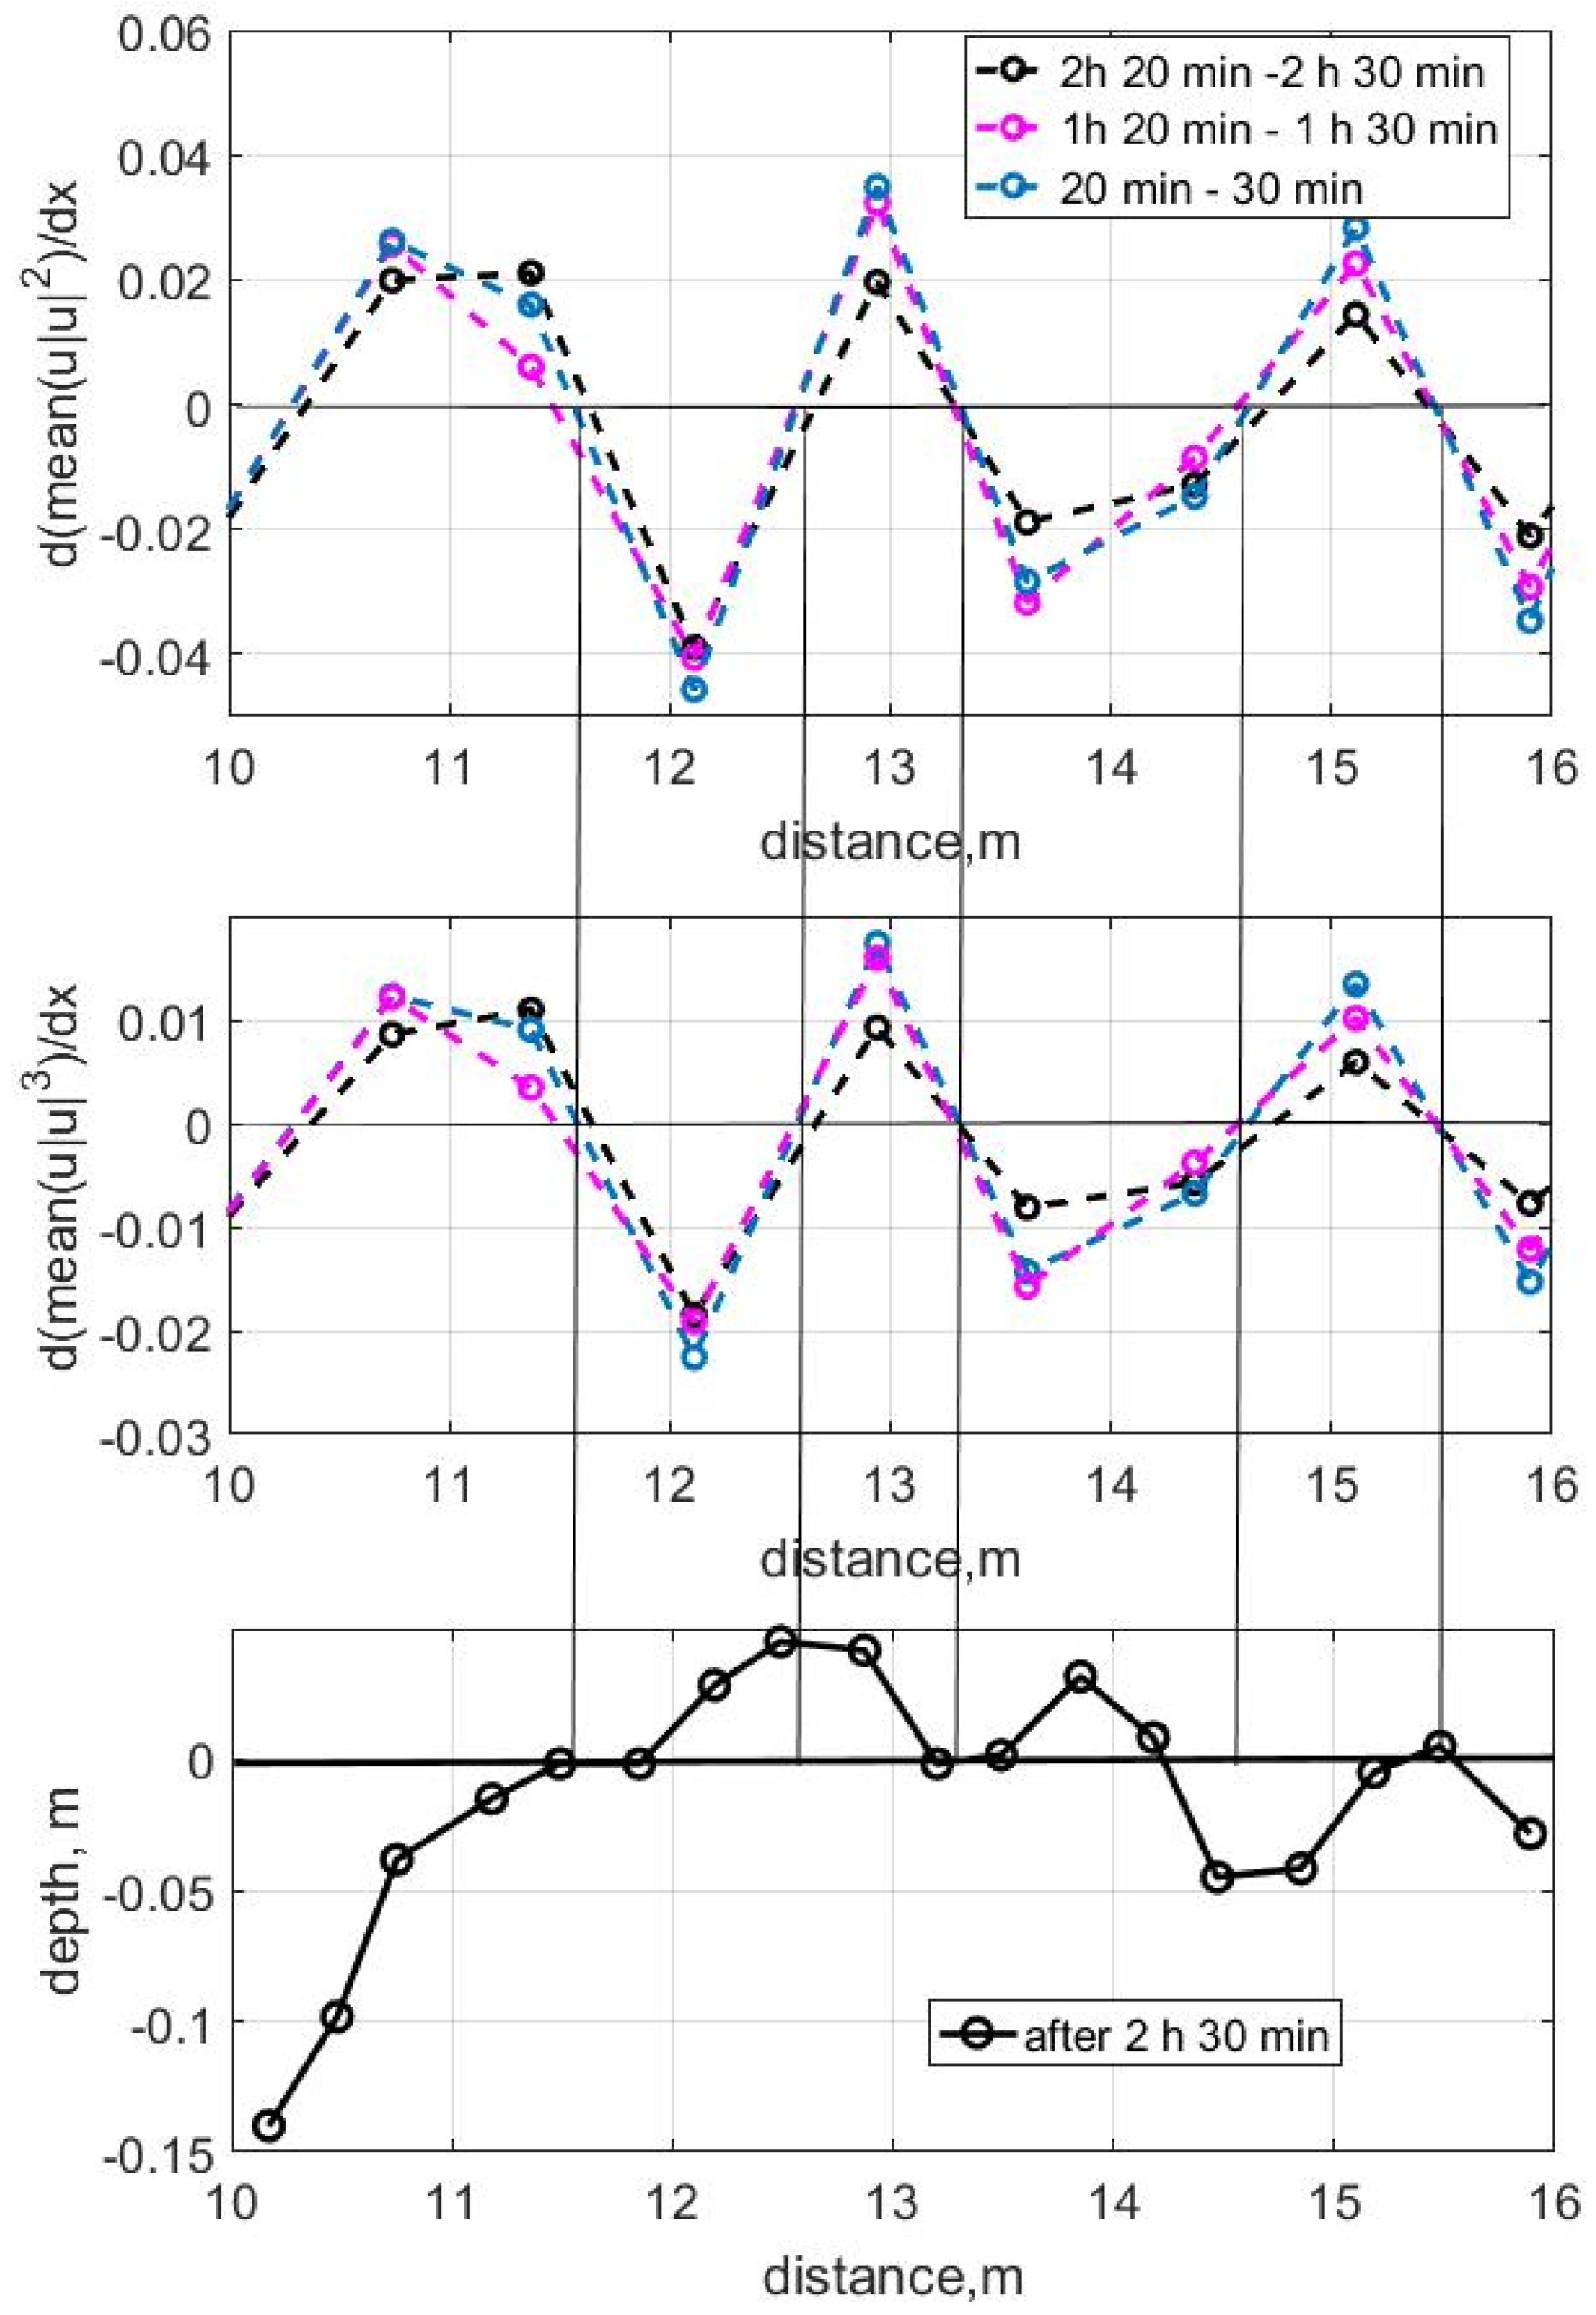
Qualitative assessments of the deformations of the bottom relief as a result of wave action, calculated for bedload and suspended sediment discharges as the gradients (Formula (5)) of the third and fourth moments of the near-bottom velocity in Bailard’s Formula (2), are shown in Figure 8. Vertical lines are drawn for ease of comparison of the accumulation and erosion areas with a change in the sign of the gradient. The negative values of the gradients correspond to sediment accumulation, and positive values correspond to erosion. It is clearly seen that, in general, due to the influence of undertow and wave breaking, the resulting bottom relief corresponds to wave sediment transport. Sediment accumulation and erosion occur approximately in the places predicted by the gradients. The influence of breaking is visible at a distance about 13.5 m—erosion occurred after 2 h 30 min of wave action. The influence of the undertow and breaking is observed at a distance of 14.5–15 m: erosion occurred in the trough that appeared after an hour and a half of wave action. It should be noted that, from 30 min of wave action, the positions of the erosion and sediment accumulation areas do not change with increasing wave action time. The magnitude of the rate of bottom deformations decreases with increasing time, except for the dynamic section at the distance 10.5–11.5 m, corresponding to the beginning of the sandy bottom, where the deformations are approximately the same in time, but slightly different in space. A decrease in the deformation rate may indicate the gradual formation of an equilibrium bottom topography. The hysteresis effect, where a decrease in the wave height does not lead to a decrease in erosion, noted in [34], was not observed. Apparently, in Test 1, the equilibrium conditions under which this effect could have manifested itself were not achieved [34]. A decrease in the erosion and accumulation rate (distance 12–16 m) was observed in accordance with the decrease in wave height (Figure 4 and Figure 8).
Thus, the bottom relief mainly changes under the action of nonlinear wave transformation. The main points of convergence and divergence are formed very quickly and follow the main scenario of wave transformation. Adapting to the new relief, the wave transformation scenario does not change qualitatively. The bars are formed in places corresponding to the change in the second harmonic and the biphase. Plunging breaking further influences the bottom relief, leading to new erosion on the existing topography. Previous laboratory and field experiments have shown that plunging can cause erosion, as the biphase in such waves is close to −π/2. According to Formulas (7) and (8), this means that the sediment transport is close to zero. Taking into account the influence of undertow, this will lead to erosion and to a seaward sediment transport [42]. Furthermore, the physical mechanism of sediment transport under breaking waves differs, as the movement occurs due to the sheet flow processes under the influence of turbulence.

3.2. Wave Transformation and Bottom Deformations, Test 2

What is more important for the formation of the bottom relief due to wave action: nonlinear wave transformation (a scenario determining the location of convergence points for sediment discharge on the bottom profile) or wave breaking?
Let us consider experimental Test 2, where the waves propagated without breaking. The main parameters of this test are in Table 1. Test 2 was conducted after Test 1, and the initial bottom profile corresponded to the resulting bottom relief in Test 1. Thus, the initial bottom profile in this test had two underwater bars. Figure 9 shows the changes in amplitudes, biphases, asymmetry, skewness and the bottom relief at different moments of wave action.
As in Test 1, amplitude fluctuations are observed. These manifested as a visible periodic exchange of energy between them. The positions of the main amplitude maxima and minima (scenario) are preserved during the entire two-hour wave action. The amplitude of the second harmonic generally decreases, and the first increases. The bottom relief affects the scenario, leading to additional amplitude fluctuations. Thus, the amplitude of the second harmonic increases in the region of 12 m due to a decrease in the depth above the underwater bar; the biphase here is negative. Over time, this leads to erosion in the area at 11.5 m (Figure 9). The increase in amplitude in the area at 15 m is also associated with the presence of a bar; the biphase is negative, which also leads to erosion in the area at 15.5 m over time. The sediment accumulation in the areas at 14.5 m, 13.5 m and 11 m is associated with a decrease in the amplitude as a result of an energy exchange with the first harmonic and the corresponding positive biphase. At a distance of 11.5–12.5, the asymmetry coefficient has a negative value, which corresponds to an increase in the amplitude of the second harmonic, and erosion occurs. The observed slight shift in the areas of accumulation and erosion relative to the points of minima and maxima of the amplitudes can be explained by the possible influence of undertow. It is clearly seen that the positions of the maxima and minima of the biphase, asymmetry and skewness do not change over time, with the exception of the biphase peak at 10.8 m, which after 1 h 50 min of impact moved to 11.2 m, which is associated with a change in the bottom relief (sediment accumulation) in this place.
The asymmetry and skewness absolute values change insignificantly. In general, the absolute values of the asymmetry coefficient increase for both positive and negative values. Almost symmetrical relative to the vertical axis, the waves in the section of 14.2–15.1 m after two hours of wave impact have a steep backward front (positive coefficient As), which is associated with a change in relief. Over two hours of wave impact, the skewness values have practically not changed. A slight decrease is observed in the area of 15–16 m.
Analyzing changes in the bottom topography, it is clear that erosion and accumulation generally correspond to amplitude fluctuations and biphase changes. Erosion was observed at distances of 11.5–13 m and in the 14 m region, while accumulation occurred at the distances of 10–11.5 m, 13–13.5 m and 14.2–15 m.
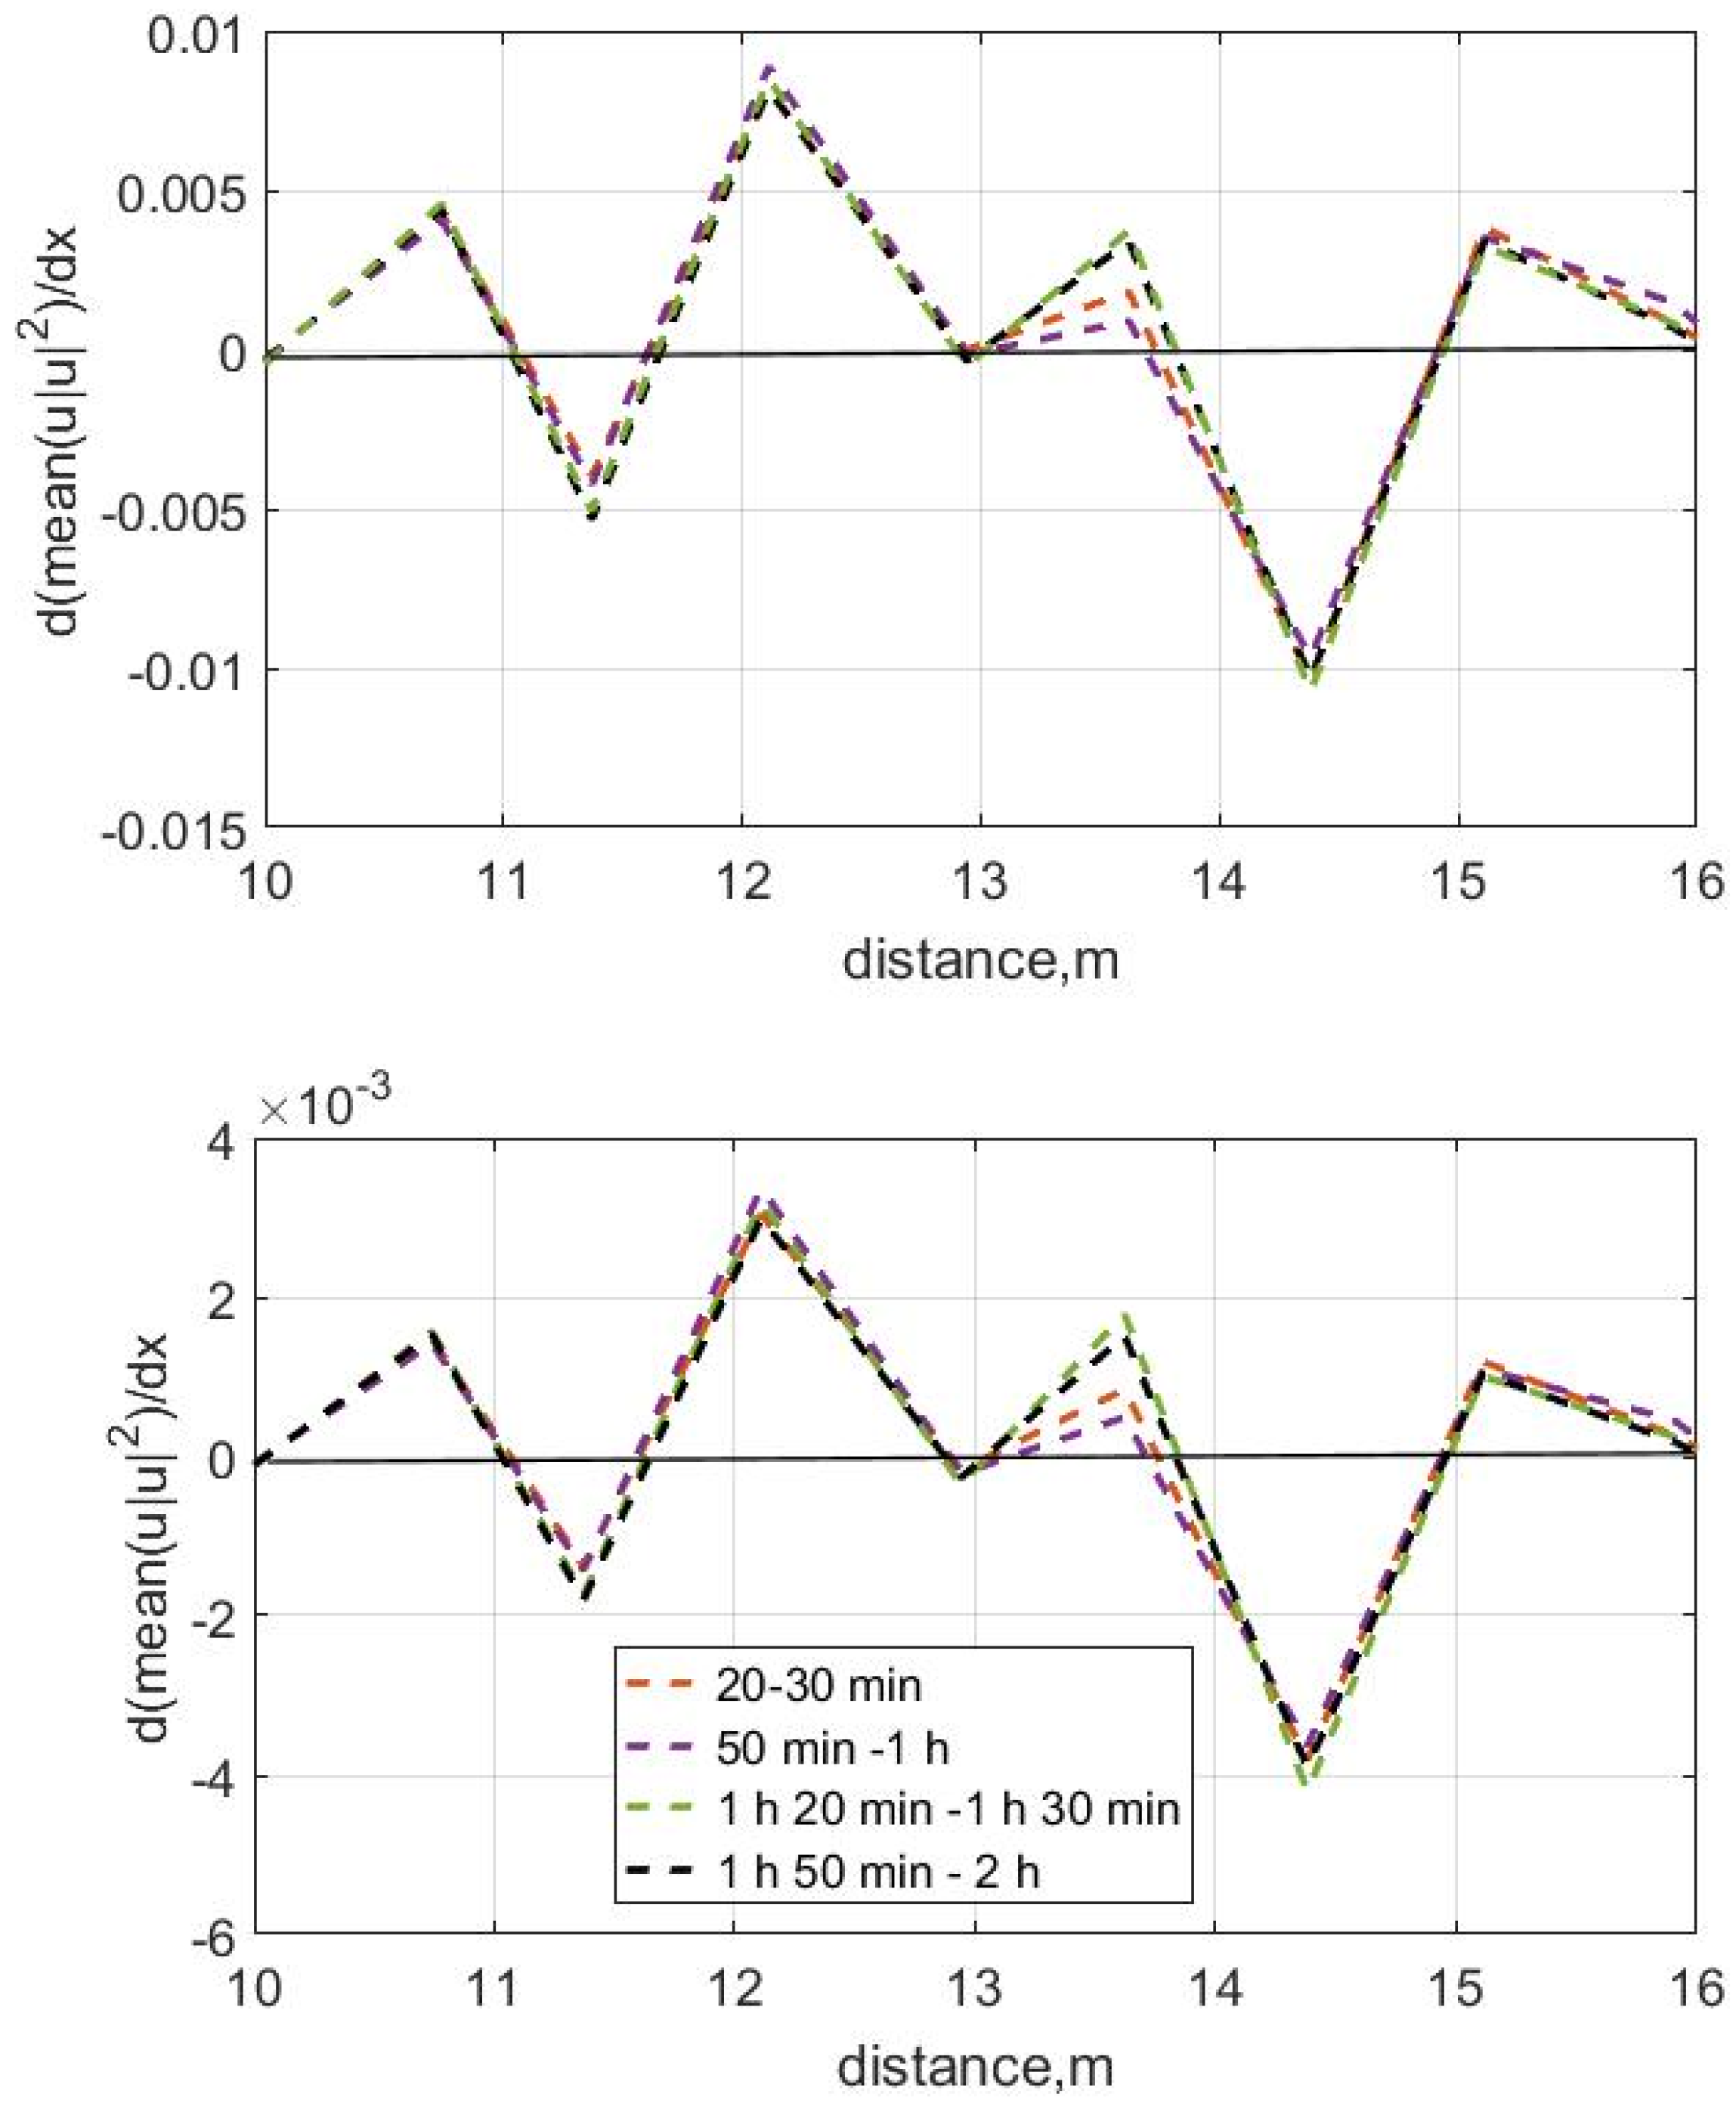
The rate of bottom deformations, defined as the gradient of the third and fourth moments of near-bottom velocity at different times during wave action for Test 2, are shown in Figure 10. It is clearly seen that sediment accumulation occurs at the distances of 11 and 13.5–15 m, while erosion occurs at a distance of 11.5–14 m. Due to the influence of undertow and reflected waves, the bottom relief deformations are described fairly well at a qualitative level (Figure 9 and Figure 10). A nonlinear transformation scenario determines the relief changes. Analyzing the bottom relief changes, it is clear that erosion and accumulation, on average, correspond to amplitude fluctuations and biphase changes. Erosion was observed at a distance of 11.5–13 m and around 14 m, accumulation at 10–11.5 m, 13–13.5 m and 14.2–15 m and continuous sediment accumulation at 12, 13.5 and 14.5 m. Over time, the rate of bottom deformations decreases in the 11, 14.5 and 17 m areas and increases at 12 m and, especially, at 13.5 m. Because the depth varies there, it decreases and increases. Thus, it can be concluded that the nonlinear transformation (scenario) primarily determines the bottom relief, and wave breaking plays a secondary role. Wave breaking accelerates bottom relief change and perhaps determines additional features on the bottom topography, such as the creation of a breaking bar.

3.3. Wave Transformation and Bottom Deformations, Test 3

What happens if the waves are changed to the previous or a similar one? Will the relief return to that which was formed under the influence of the previous waves?
For this purpose, Test 3 was conducted, in which the waves had the same period as in Test 1 but were higher, so that the relief would form faster, including due to wave breaking. Test 3 was conducted after Test 2, and the initial bottom profile corresponded to the resulting bottom relief in Test 2.
Figure 11 shows the changes in amplitudes, biphases, asymmetry, skewness and bottom relief for half an hour of wave action. The positions of the amplitude maxima and minima during the periodic exchange of energy between them depend primarily on the wave period through the dispersion relation [30,31]; therefore, the scenarios for nonlinear wave transformation in Test 1 and Test 3 will be similar.
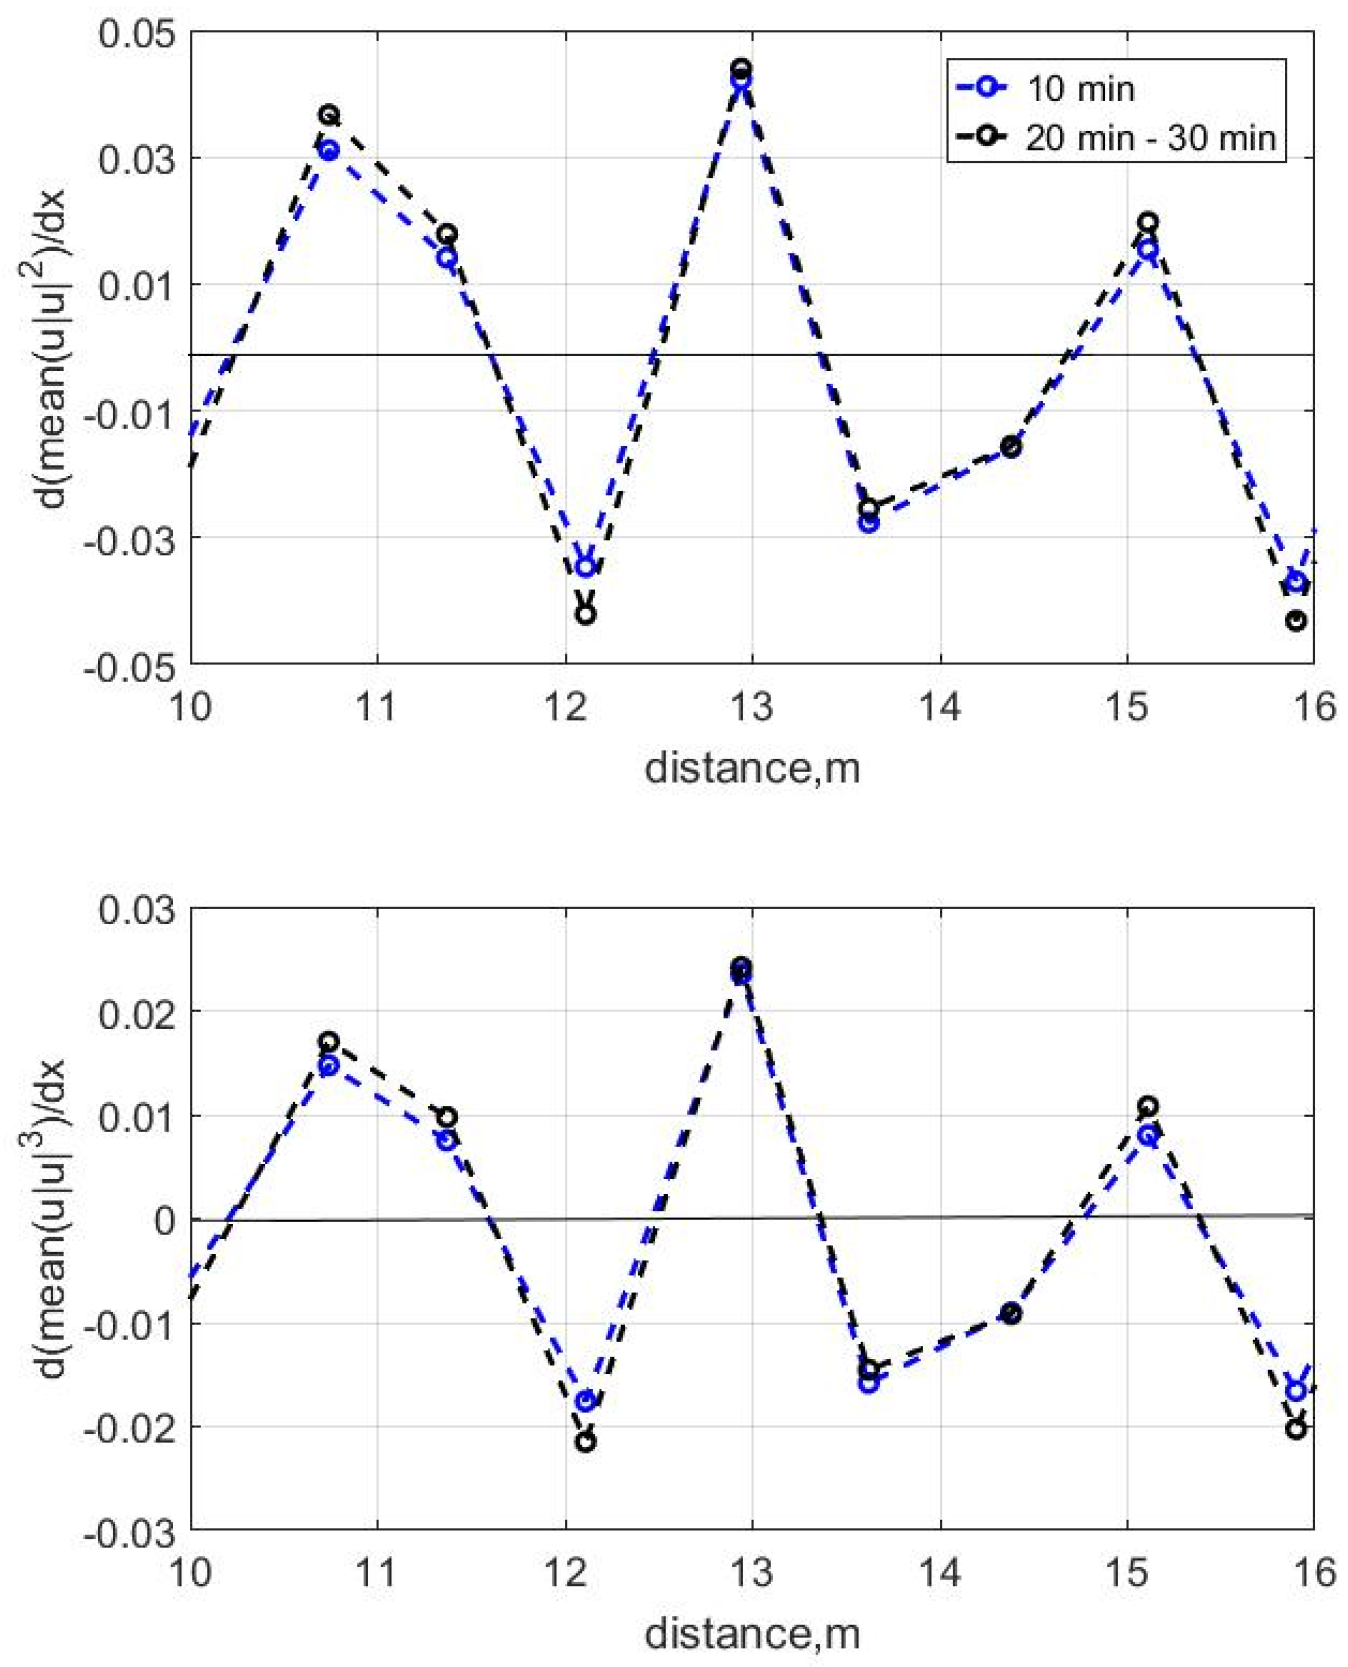
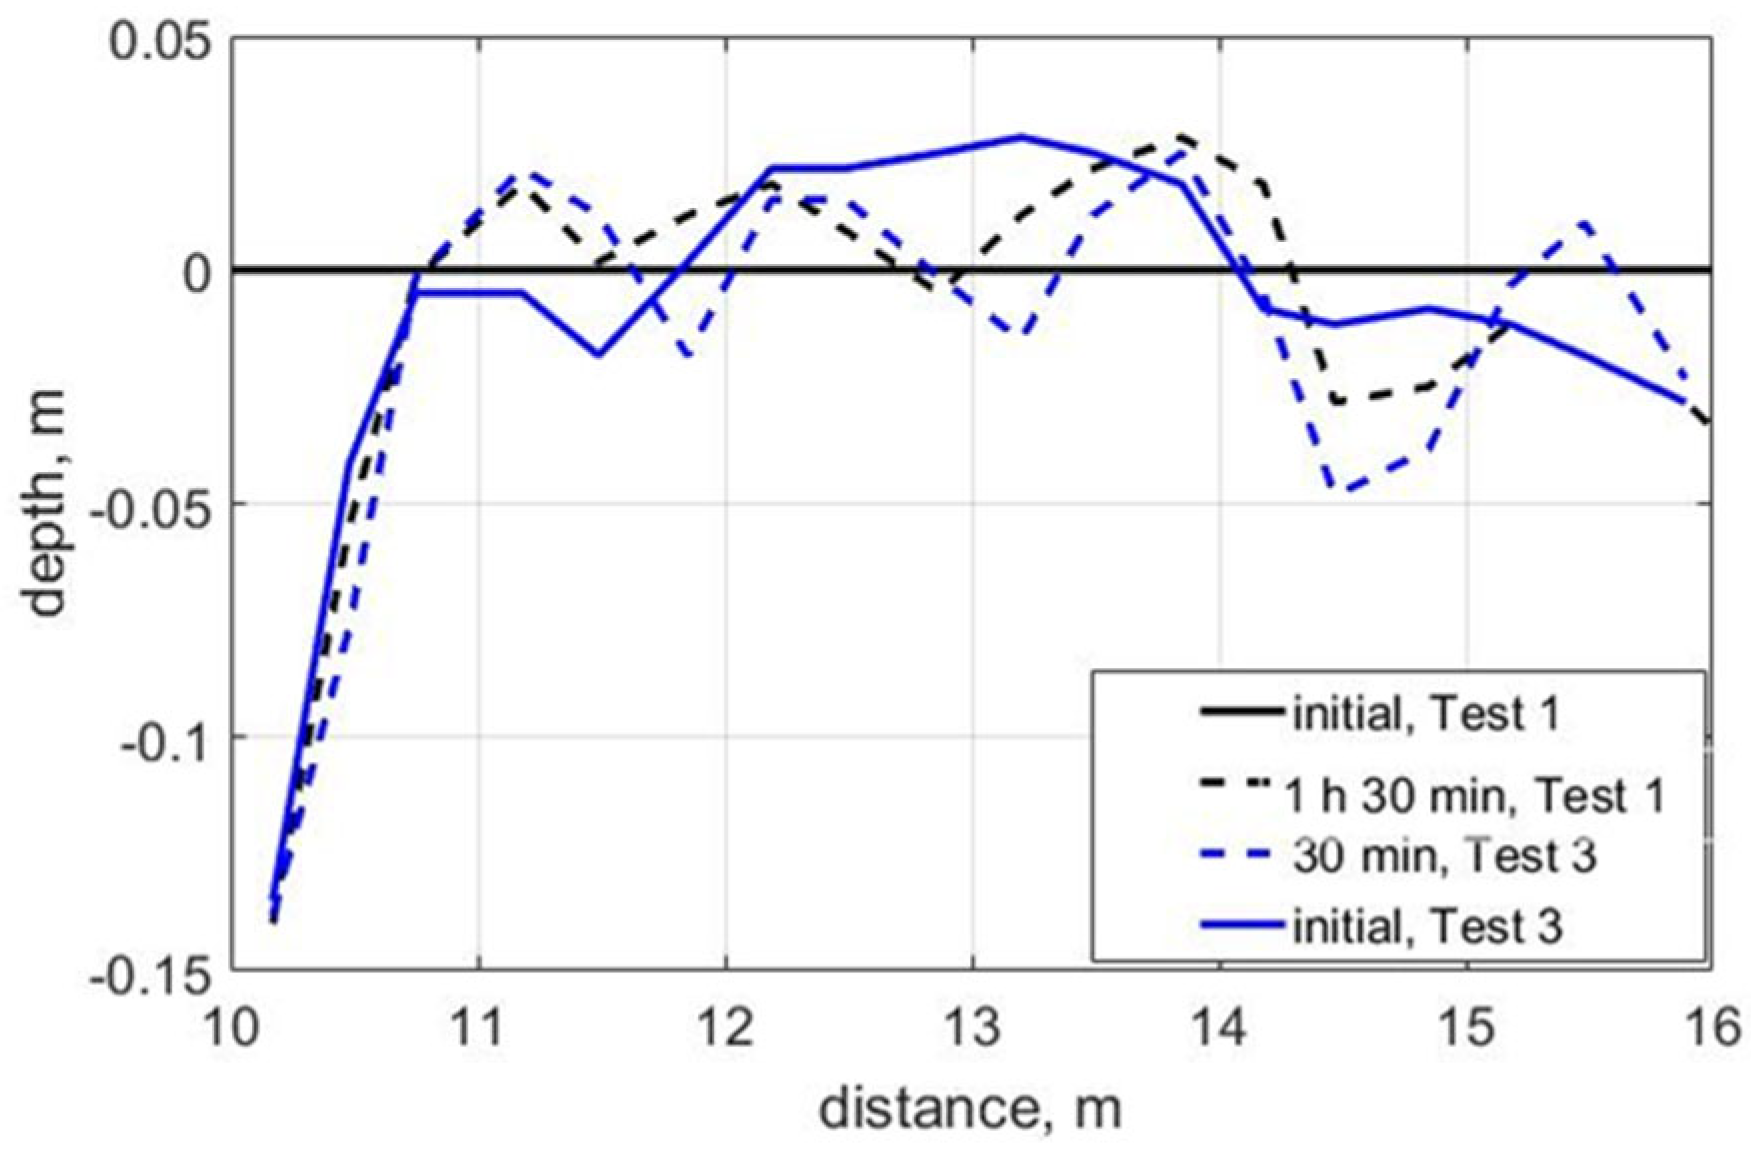
Comparing Figure 2 and Figure 11, one can notice that the wave transformation scenarios are quite similar. The amplitudes and biphases fluctuate approximately in the same manner; some differences are explained by the different initial bottom relief over which the waves propagate. The same can be said about the bottom deformation rates in Tests 1 and 3, comparing Figure 8 and Figure 12. Note that, although the positions of the accumulation and erosion zones coincide, the absolute values of the deformation rates in Test 3 are higher, which is associated with the greater initial wave height, and, accordingly, the relief changes faster. In general, there are the same selected points of bottom relief deformations, which lead after 30 min of wave action to a bottom relief that practically coincides with the bottom relief obtained after an hour and a half of action in Test 1 (Figure 13).
Wave breaking occurring at distances of 10.74–12.11 m (spilling) and 14.38–15.11 m (plunging) additionally affects changes in the bottom relief. Washout occurs where the waves break by plunging, and sediment accumulation occurs in the area of the wave breaking by spilling, corresponding with the results obtained in [42].
This result indicates that the initial bathymetry does not play a significant role in the final changes in bottom topography under the influence of a similar wave regime. The primary influence is exerted by nonlinear wave properties—variations in the amplitudes of the first and second harmonics and biphase. The initial bathymetry only influences the duration of wave action, after which a similar profile can be obtained. The same experimental results were obtained in [35], with constant wave conditions applying to different initial bottom profiles. Despite the fact that the bottom profile evolved somewhat differently during individual time intervals of wave action (determined by the initial bathymetry), the same bottom profile ultimately formed.
To confirm the identified relationships, we additionally conducted a correlation analysis between the bottom deformation rates (moments gradient) and the experimental bottom deformations. For all tests, the absolute values of the correlation coefficients were quite high, ranging from 0.7 to 0.8. Additionally, correlations were obtained between the bottom deformations obtained in each test and the changes in the amplitudes of the first and second harmonics and the biphase. For all tests, the correlations of these quantities were also high, with absolute values of the correlation coefficient in the range of 0.6–0.7, 0.7–0.9 and 0.8–0.9, respectively.
Thus, variations in the amplitude of the second harmonic and changes in the biphase make the greatest contribution to topography changes.

4. Conclusions

Thus, as a result of the experiments and the analysis of the data obtained, the following can be concluded. For each wave regime, there is a scenario of its nonlinear transformation based on the space positions of the maxima and minima of the second harmonic amplitude and the corresponding biphase changes. This scenario generally depends on the wave steepness and the mean bottom slope, and may additionally have fluctuations associated with the local features of the bottom relief. In general, an increase in the second harmonic amplitude and the corresponding negative biphase leads to erosion, and a decrease in the second amplitude of the second harmonic and the corresponding positive biphase leads to accumulation. The positions of the main minima and maxima of the amplitudes are maintained throughout the all-time wave action. A small “correction” of the position of the maxima was observed only in the first minutes of wave action. The scenario of nonlinear transformation determines the main changes in the bottom relief and the positions of underwater bars. At the same time, the wave breaking does not change the position of the maxima and minima, but only changes their absolute values and biphase values. In this sense, the breaking additionally affects the bottom relief and accelerates the rate of bottom change. Based on the analysis of the experimental data, it can be concluded that the bottom relief adapts to the scenario of nonlinear wave transformation. Therefore, in the coastal zone, one can expect the formation of a similar relief under the influence of similar wave regimes. This can explain the periodic repetition of relief forms in the same coastal zone at different times. It should be noted that the obtained results may have a number of limitations related to the small number of tests, specific experimental equipment, single type of sand, etc. However, since they are confirmed by other studies, their comprehensive verification is necessary, especially for the field experiment data.

Supplementary Materials

The following supporting information can be downloaded at: https://www.mdpi.com/article/10.3390/jmse13112066/s1, Figure S1: Bicoherence on some locations, Test 1.

Author Contributions

Conceptualization, Y.S. and S.K.; methodology, Y.S.; formal analysis, Y.S.; investigation, Y.S. and S.K.; writing—original draft preparation, Y.S.; writing—review and editing, Y.S. and S.K.; visualization, Y.S. All authors have read and agreed to the published version of the manuscript.

Funding

This research received no external funding.

Data Availability Statement

All data are available in Saprykina, Yana (2025). Selected raw data of laboratory experiment of monochromatic waves transformation above flat sandy bottom. figshare. Dataset. https://doi.org/10.6084/m9.figshare.30265696.v1.

Acknowledgments

The research was carried out within the state assignment of Ministry of Science and Higher Education of the Russian Federation for IO RAS (theme No. FMWE-2024-0018).

Conflicts of Interest

The authors declare no conflicts of interest.

References

  1. Masselink, G.; Puleo, J.A. Swash-zone morphodynamics. Cont. Shelf Res. 2006, 26, 661–680. [Google Scholar] [CrossRef]
  2. Alsina, J.M.; Van Der Zanden, J.; Cáceres, I.; Ribberink, J.S. The influence of wave groups and wave-swash interactions on sediment transport and bed evolution in the swash zone. Coast. Eng. 2018, 140, 23–42. [Google Scholar] [CrossRef]
  3. Mendes, D.; Pinto, J.P.; Pires-Silva, A.A.; Fortunato, A.B. Infragravity wave energy changes on a dissipative barred beach: A numerical study. Coast. Eng. 2018, 140, 136–146. [Google Scholar] [CrossRef]
  4. King, E.; Conley, D.; Masselink, G.; Leonardi, N.; McCarroll, R.J.; Scott, T. The impact of waves and tides on residual sand transport on a sediment-poor, energetic, and macrotidal continental shelf. J. Geophys. Res. Oceans 2019, 124, 4974–5002. [Google Scholar] [CrossRef]
  5. Abreu, T.; Silva, P.A.; Sancho, F.; Temperville, A. Analytical approximate wave form for asymmetric waves. Coast. Eng. 2010, 57, 656–667. [Google Scholar] [CrossRef]
  6. Abreu, T.; Michallet, H.; Silva, P.A.; Sancho, F.; van der A, D.A.; Ruessink, B.G. Bed shear stress under skewed and asymmetric oscillatory flows. Coast. Eng. 2013, 73, 1–10. [Google Scholar] [CrossRef]
  7. Malarkey, J.; Davies, A.G. Free-stream velocity descriptions under waves with skewness and asymmetry. Coast. Eng. 2012, 68, 78–95. [Google Scholar] [CrossRef]
  8. García-Maribona, J.; Lara, J.L.; Maza, M.; Losada, I.J. Analysis of the mechanics of breaker bar generation in cross-shore beach profiles based on numerical modelling. Coast. Eng. 2022, 177, 104172. [Google Scholar] [CrossRef]
  9. Pellón, E.; Aniel-Quiroga, I.; González, M.; Medina, R.; Vidal, C. Working with nature to enhance beach accretion: Laboratory experiments of beach ploughing. Coast. Eng. 2023, 180, 104267. [Google Scholar] [CrossRef]
  10. Derek, W.T.J.; Short, A.D. Sandy Beach Morphodynamics; Elsevier: Amsterdam, The Netherlands, 2020. [Google Scholar] [CrossRef]
  11. Van Rijn, L.C.; Ribberink, J.C.; van der Werf, J.; Walstra, D.J.R. Coastal sediment dynamics: Recent advances and future research needs. J. Hydraul. Res. 2013, 51, 475–493. [Google Scholar] [CrossRef]
  12. Bergillos, R.J.; Masselink, G.; Ortega-Sánchez, M. Coupling cross-shore and longshore sediment transport to model storm response along a mixed sand-gravel coast under varying wave directions. Coast. Eng. 2017, 129, 93–104. [Google Scholar] [CrossRef]
  13. Ostrowski, R. Influence of Wave Shape on Sediment Transport in Coastal Regions. Arch. Hydro-Eng. Environ. Mech. 2018, 65, 73–90. [Google Scholar] [CrossRef]
  14. Bailard, J.A. An energetics total load sediment transport model for a plane sloping beach. J. Geophys. Res. 1981, 86, 10938–10954. [Google Scholar] [CrossRef]
  15. Ribberink, J.S. Bed-load transport for steady flows and unsteady oscillatory flows. Coast. Eng. 1998, 34, 59–82. [Google Scholar] [CrossRef]
  16. Soulsby, R.L.; Damgaard, J.S. Bedload sediment transport in coastal water. Coast. Eng. 2005, 52, 673–689. [Google Scholar] [CrossRef]
  17. Van Rijn, L.C. Unified view of sediment transport by currents and waves, I: Initiation of motion, bed roughness, and bed-load transport. J. Hydraul. Eng. 2007, 133, 649–667. [Google Scholar] [CrossRef]
  18. Van Rijn, L.C. Unified view of sediment transport by currents and waves, II: Suspended transport. J. Hydraul. Eng. 2007, 133, 668–689. [Google Scholar] [CrossRef]
  19. Ruessink, B.G.; van der Berg, T.J.J.; van Rijn, L.C. Modeling sediment transport beneath skewed asymmetric waves above a plane bed. J. Geophys. Res. 2009, 114, C11021. [Google Scholar] [CrossRef]
  20. Ruessink, B.G.; Ramaekers, G.; van Rijn, L.C. On the parameterization of the free-stream non-linear wave orbital motion in nearshore morphodynamic models. Coast. Eng. 2012, 65, 56–63. [Google Scholar] [CrossRef]
  21. Rocha, M.V.L.; Michallet, H.; Silva, P.A. Improving the parameterization of wave non-linearities—The importance of wave steepness, spectral bandwidth and beach slope. Coast. Eng. 2017, 121, 77–89. [Google Scholar] [CrossRef]
  22. Rocha, M.V.L.; Silva, P.A.; Michallet, H.; Abreu, T.; Moura, D.; Fortes, C.J. Parameterizations of wave non-linearity from local wave parameters: A comparison with field data. J. Coast. Res. 2013, 65, 374–379. [Google Scholar] [CrossRef]
  23. Saprykina, Y.V.; Shtremel, M.N.; Kuznetsov, S.Y. On the possibility of biphase parametrization for wave transformation in the coastal zone. Oceanology 2017, 57, 253–264. [Google Scholar] [CrossRef]
  24. Boczar-Karakiewicz, B.; Davidson-Arnott, R. Nearshore bar formation by non-linear process—A comparison of model results and field data. Mar. Geol. 1987, 77, 287–304. [Google Scholar] [CrossRef]
  25. Boczar-Karakiewicz, B.; Jackson, L.A. The Analysis and Role of Bars on the Protection of a Beach System Gold Coast, Queensland, Australia. Coast. Eng. Proc. 1990, 22, 2265–2278. [Google Scholar]
  26. Capalain, C.; Boczar-Karakiewicz, B. Modeling of hydrodynamics and sedimentary processes related to unbroken progressive shallow water waves. J. Coast. Res. 1992, 8, 419–441. [Google Scholar]
  27. Chapalain, G.; Boczar-Karakiewicz, B. Modelling of multicomponent sandy beds evolution under shallow water waves. Coast. Eng. Proc. 1990, 22, 2213–2226. [Google Scholar]
  28. Saprykina, Y. The Influence of Wave Nonlinearity on Cross-Shore Sediment Transport in Coastal Zone: Experimental Investigations. Appl. Sci. 2020, 10, 4087. [Google Scholar] [CrossRef]
  29. Kuznetsov, S.; Saprykina, Y. Nonlinear Wave Transformation in Coastal Zone: Free and Bound Waves. Fluids 2021, 6, 347. [Google Scholar] [CrossRef]
  30. Saprykina, Y.V.; Kuznetsov, S.Y.; Andreeva, N.; Shtremel, M.N. Scenarios of nonlinear wave transformation in coastal zone. Oceanology 2013, 53, 422–431. [Google Scholar] [CrossRef]
  31. Shtremel, M.; Saprykina, Y.; Ayat, B. The Method for Evaluating Cross-Shore Migration of Sand Bar under the Influence of Nonlinear Waves Transformation. Water 2022, 14, 214. [Google Scholar] [CrossRef]
  32. Blenkinsopp, C.E.; Hunter, A.J.; Baldock, T.E.; Bayle, P.M.; Bosboom, J.; Conley, D.; Masselink, G. Repeatability of beach morphology change under identical wave forcing. Coast. Eng. 2024, 189, 104485. [Google Scholar] [CrossRef]
  33. Grossmann, F.; Hurther, D.; Sánchez-Arcilla, A.; Alsina, J.M. Influence of the initial on the sediment transport processes during post-storm on shorebar migration. J. Geophys. Res. Ocean. 2023, 128, e2022JC019299. [Google Scholar] [CrossRef]
  34. Baldock, T.E.; Birrien, F.; Atkinson, A.; Shimamoto, T.; Wu, S.; Callaghan, D.P.; Nielsen, P. Morphological hysteresis in the evolution of beach profiles under sequences of wave climates—Part 1; observations. Coast. Eng. 2017, 128, 92–105. [Google Scholar] [CrossRef]
  35. Grasso, F.; Michallet, H.; Certain, R.; Barthélemy, E. Experimental Flume Simulation of Sandbar Dynamics. J. Coast. Res. 2009, 56, 54–58. [Google Scholar]
  36. Marple, S.L., Jr. Digital Spectral Analysis with Applications; Prentice-Hall: Englewood Cliffs, NJ, USA, 1987; 492p. [Google Scholar]
  37. Herbers, T.; Lowe, R.; Guza, R. Field observations of orbital velocities and pressure in weakly nonlinear surface gravity waves. J. Fluid Mech. 1992, 245, 413–435. [Google Scholar] [CrossRef]
  38. Stive, M.J.F. A model for cross-shore sediment transport. Coast. Eng. Proc. 1986, 20, 1550–1564. [Google Scholar] [CrossRef]
  39. Roelvink, J.A.; Stive, M.J.F. Bar-generating cross-shore flow mechanism on a beach. J. Geophys. Res. 1989, 94, 4785–4800. [Google Scholar] [CrossRef]
  40. Kim, Y.; Powers, E. Digital bispectral analysis and its application to non-linear wave interaction. IEEE Trans. Plasma Sci. 1979, 1, 120–131. [Google Scholar] [CrossRef]
  41. Elgar, S.; Guza, R.T. Observation of bispectra of shoaling surface gravity waves. J. Fluid Mech. 1985, 161, 425–448. [Google Scholar] [CrossRef]
  42. Saprykina, Y.V.; Kuznetsov, S.Y.; Kuznetsova, O.A.; Shugan, I.V.; Chen, Y.-Y. Wave Breaking Type as a Typical Sign of Nonlinear Wave Transformation Stage in Coastal Zone. Phys. Wave Phen. 2020, 28, 75–82. [Google Scholar] [CrossRef]
  43. Saprykina, Y.V.; Kuznetsov, S.Y.; Divinskii, B.V. Influence of processes of nonlinear transformations of waves in the coastal zone on the height of breaking waves. Oceanology 2017, 57, 383–393. [Google Scholar] [CrossRef]
Figure 1. Setup of the laboratory experiment. The triangles indicate the positions of the wave gauges.
Jmse 13 02066 g001
Figure 2. The change in the bottom relief; Test 1. Zero line corresponds to initial flat bottom.
Jmse 13 02066 g002
Figure 3. Spatial evolution of wave spectra during different periods of wave action; Test 1: (a) 2 min, (b) 10 min, (c) 30 min, (d)1 h, (e) 2 h 30 min.
Jmse 13 02066 g003
Figure 4. Significant wave height at various times during wave action; Test 1.
Jmse 13 02066 g004
Figure 5. The changes in the amplitudes of the first and second harmonics at some time intervals; Test 1.
Jmse 13 02066 g005
Figure 6. The change in biphases at various times during wave action; Test 1.
Jmse 13 02066 g006
Figure 7. Change in wave symmetry relative to the vertical (As) and horizontal (Sk) at various times during wave action; Test 1.
Jmse 13 02066 g007
Figure 8. Rate of the bottom deformations on the base of the third and fourth moments of the near-bottom velocity and experimental bottom deformations at various times during wave action; Test 1.
Jmse 13 02066 g008
Figure 9. The change in amplitudes, biphases, asymmetry (solid lines), skewness (dotted lines) and the bottom relief at different times of wave action; Test 2.
Jmse 13 02066 g009
Figure 10. The rate of the bottom deformations determined by the third (top) and fourth (bottom) moments of the near-bottom velocity at various times during wave action; Test 2.
Jmse 13 02066 g010
Figure 11. The change in amplitudes, biphases, asymmetry, skewness and the bottom relief at different times of wave action; Test 3.
Jmse 13 02066 g011
Figure 12. The rate of the bottom deformations determined by the third (top) and fourth (bottom) moments of the near-bottom velocity at various times during wave action; Test 3.
Jmse 13 02066 g012
Figure 13. Bottom reliefs in Test 1 and Test 3.
Jmse 13 02066 g013
Table 1. Sand characteristics.
d10, mmd25, mmMd, mmd75, mmd90, mmS (Sorting
Coefficient)
0.010.130.180.220.251.32
Table 2. Wave tests.
TestWave Height, mWave Period, sDurationWave Breaking
10.3622 h 30 minSpilling 15–16.7 m (first 30 min)
Plunging 13–13.5 m, bore up to 16.7 m (50–60 min of wave action)
Spilling 10–11 m, plunging 14–15 m, bore up to the wave absorber (1 h 30 min of wave action)
Plunging 13–15 m, bore up to 16.7 m (2 h of wave action)
20.132 hNo breaking
30.4230 minSpilling 10.74 m, plunging 13.62 m (first 4 min of wave action)
Spilling 10.74–12.11 m, plunging 14.38–15.11 m, bore up to 16.7 (5–30 min of wave action)
Disclaimer/Publisher’s Note: The statements, opinions and data contained in all publications are solely those of the individual author(s) and contributor(s) and not of MDPI and/or the editor(s). MDPI and/or the editor(s) disclaim responsibility for any injury to people or property resulting from any ideas, methods, instructions or products referred to in the content.