An Evaluation of Port Environmental Efficiency Considering Heterogeneous Abatement Capacities: Integrating Weak Disposability into the Epsilon-Based Measure Model
Abstract
1. Introduction
2. Literature Review
2.1. DEA Application in Port Efficiency Evaluation
2.2. DEA Based on Weak Disposability (WD) Assumption
3. Methodology and Data Descriptions
3.1. An EBM Model with Non-Uniform Abatement Factors
3.2. The Global Malmquist Index
3.3. Dagum Gini Coefficient
3.4. Data Collection and Descriptions
4. Empirical Analysis
4.1. Comparisons of the PEE Under Different Models
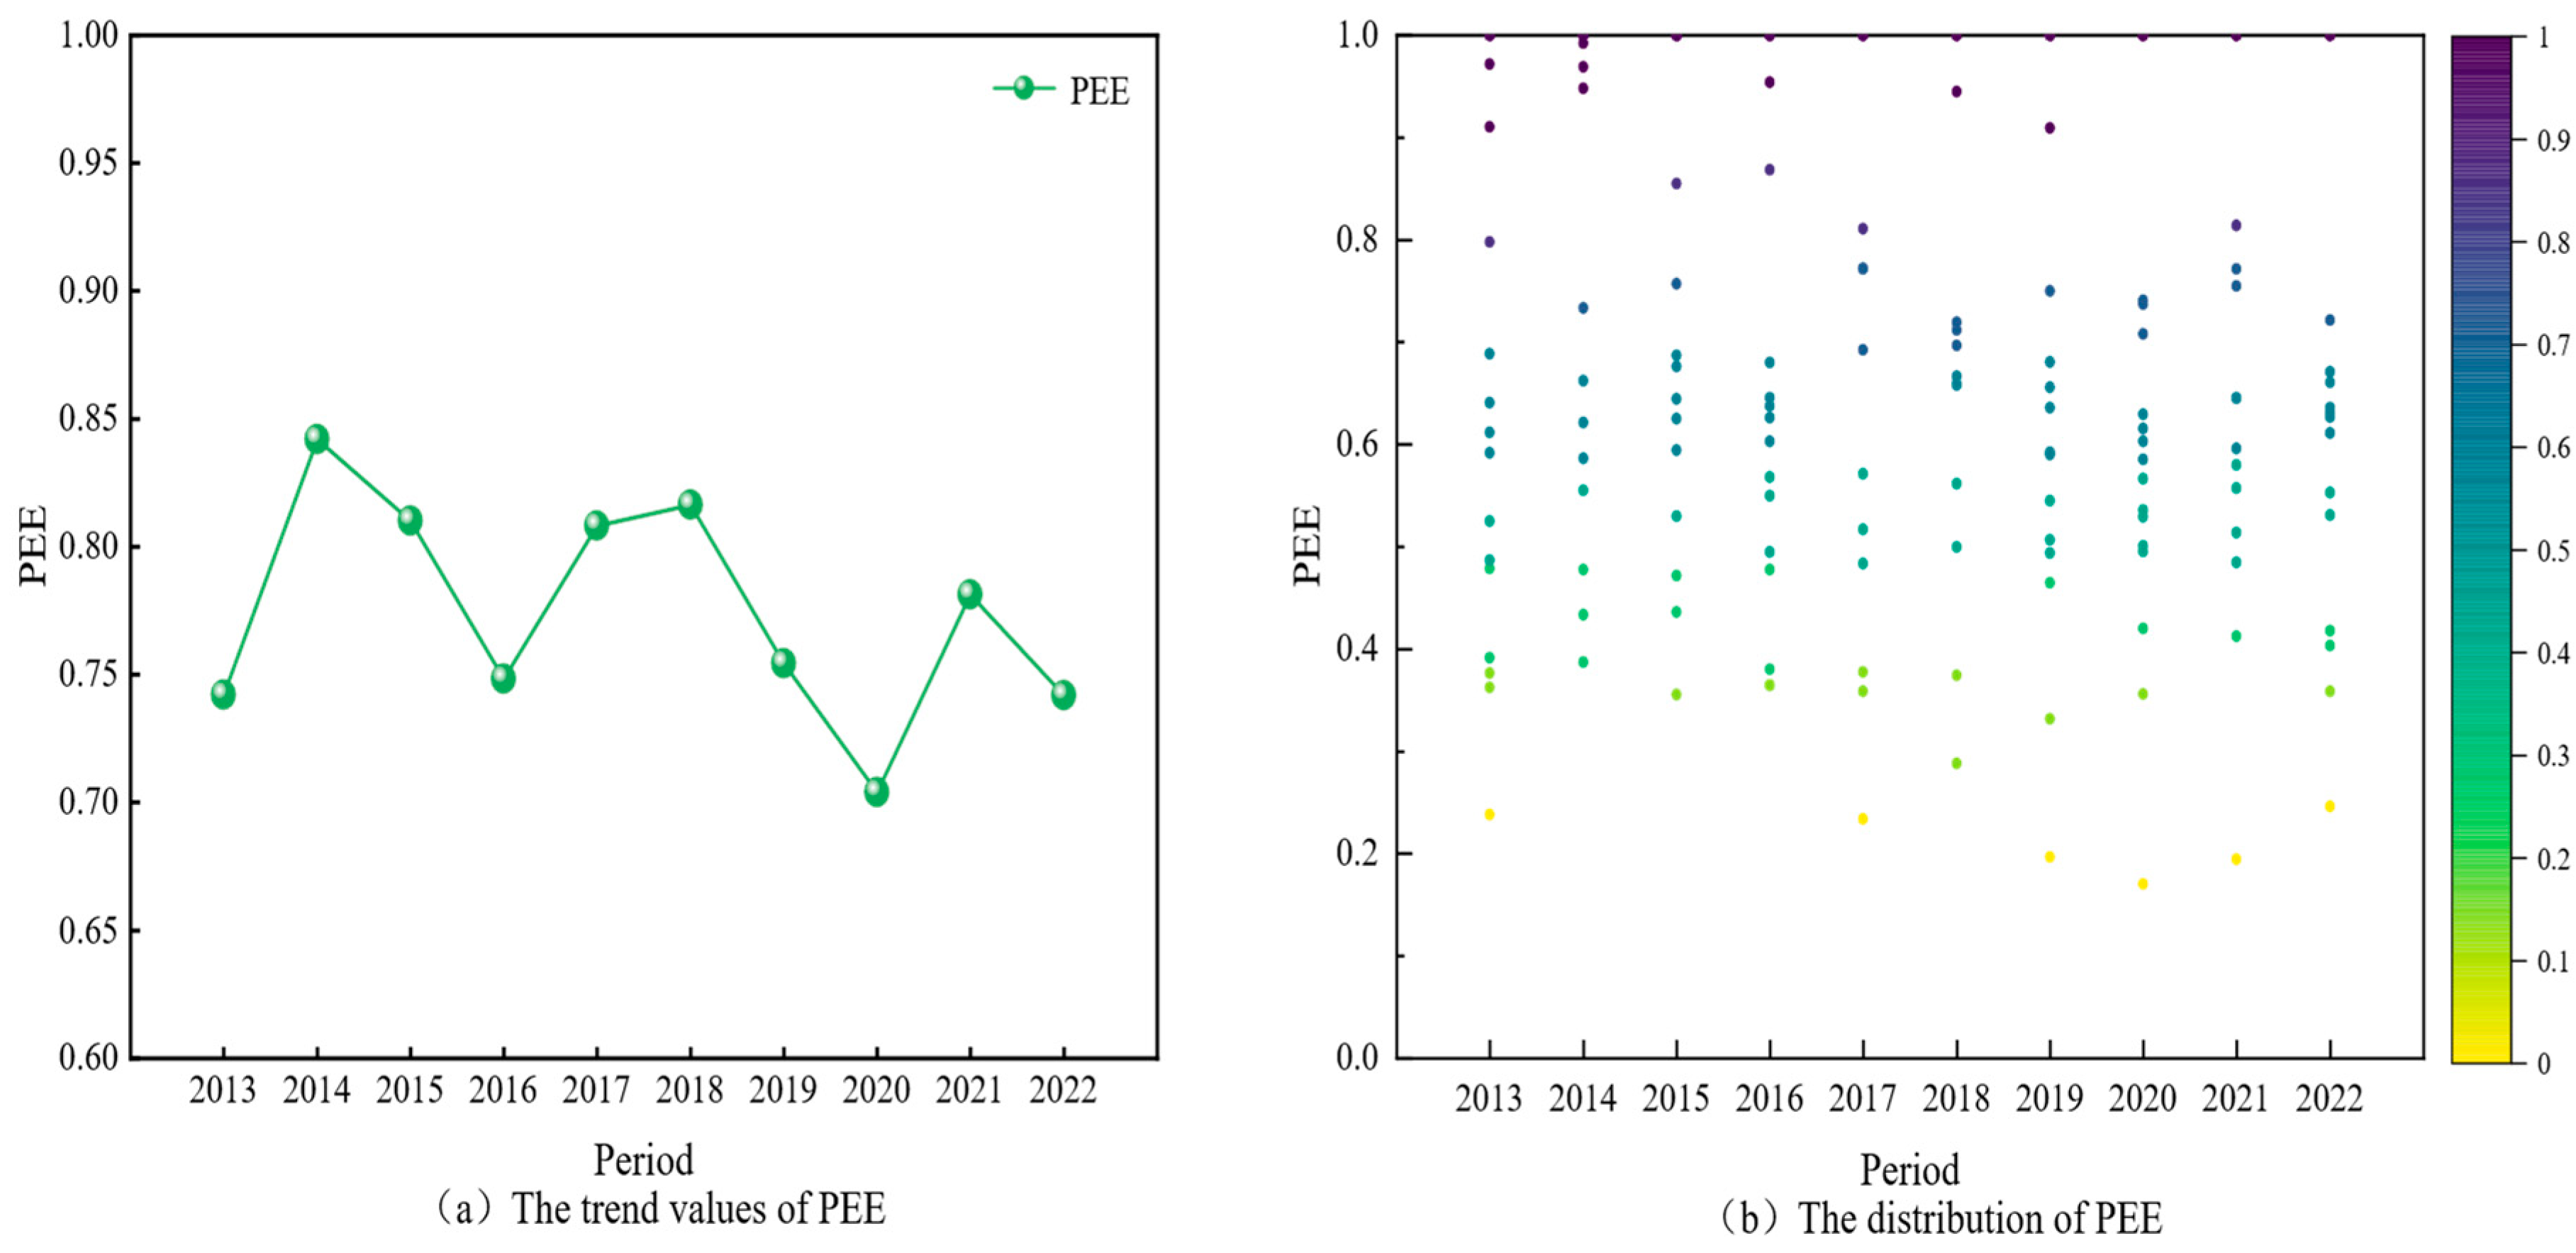
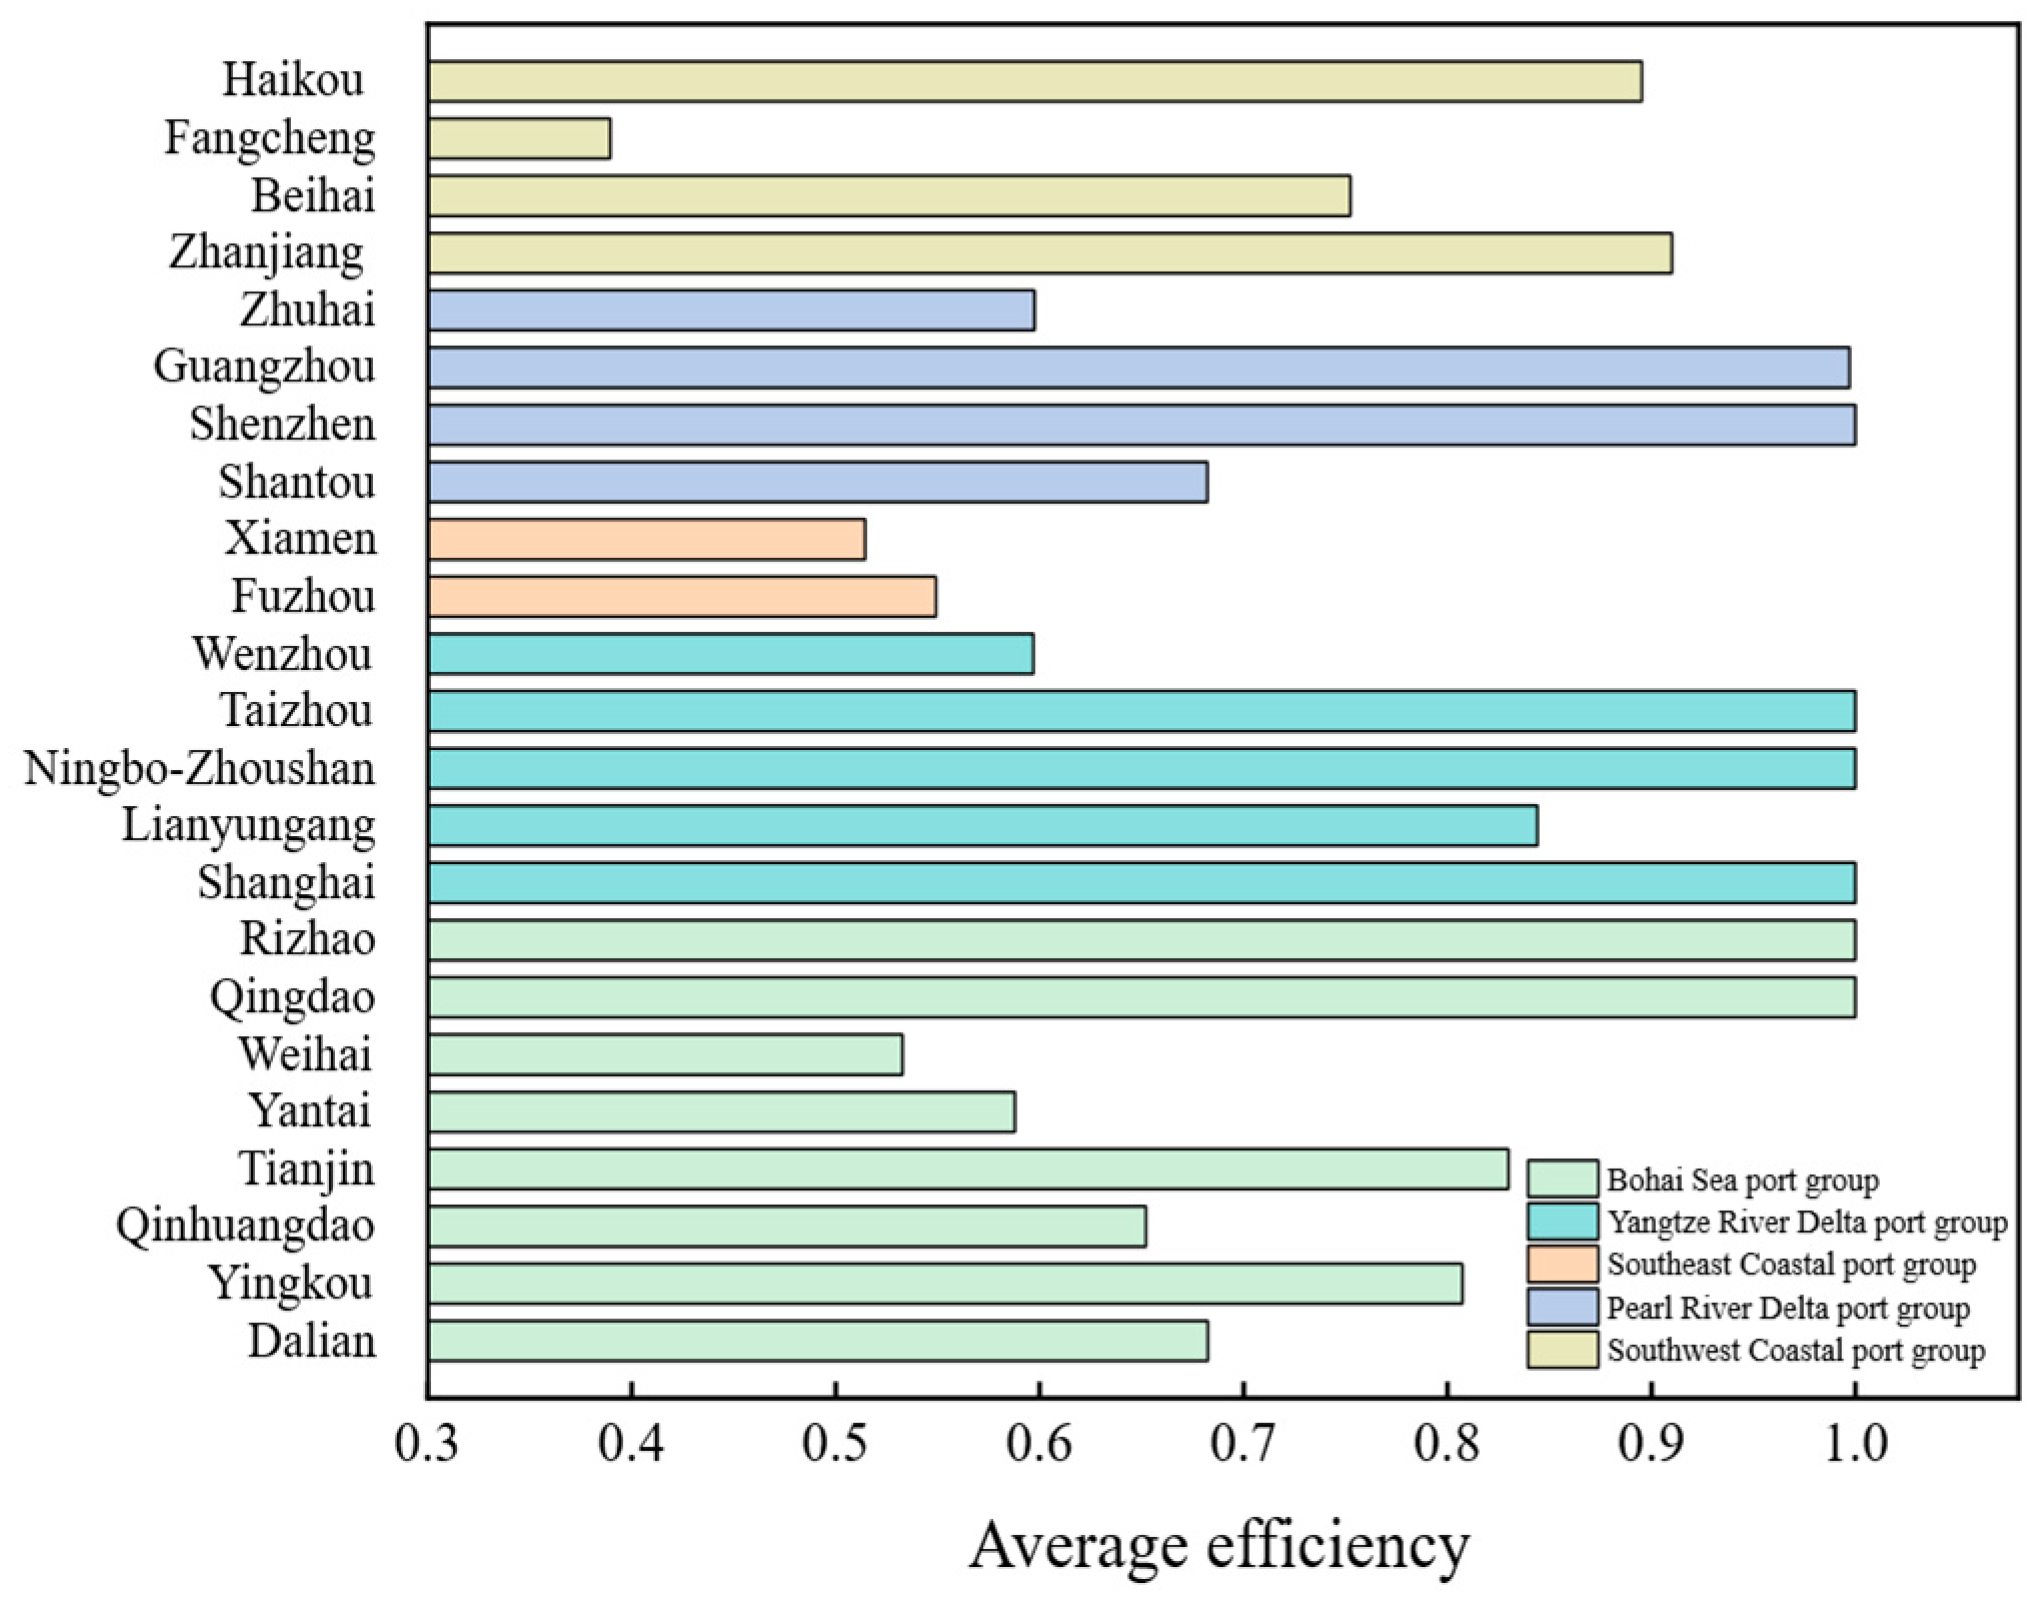
4.2. Overall Analysis of Port Environmental Efficiency
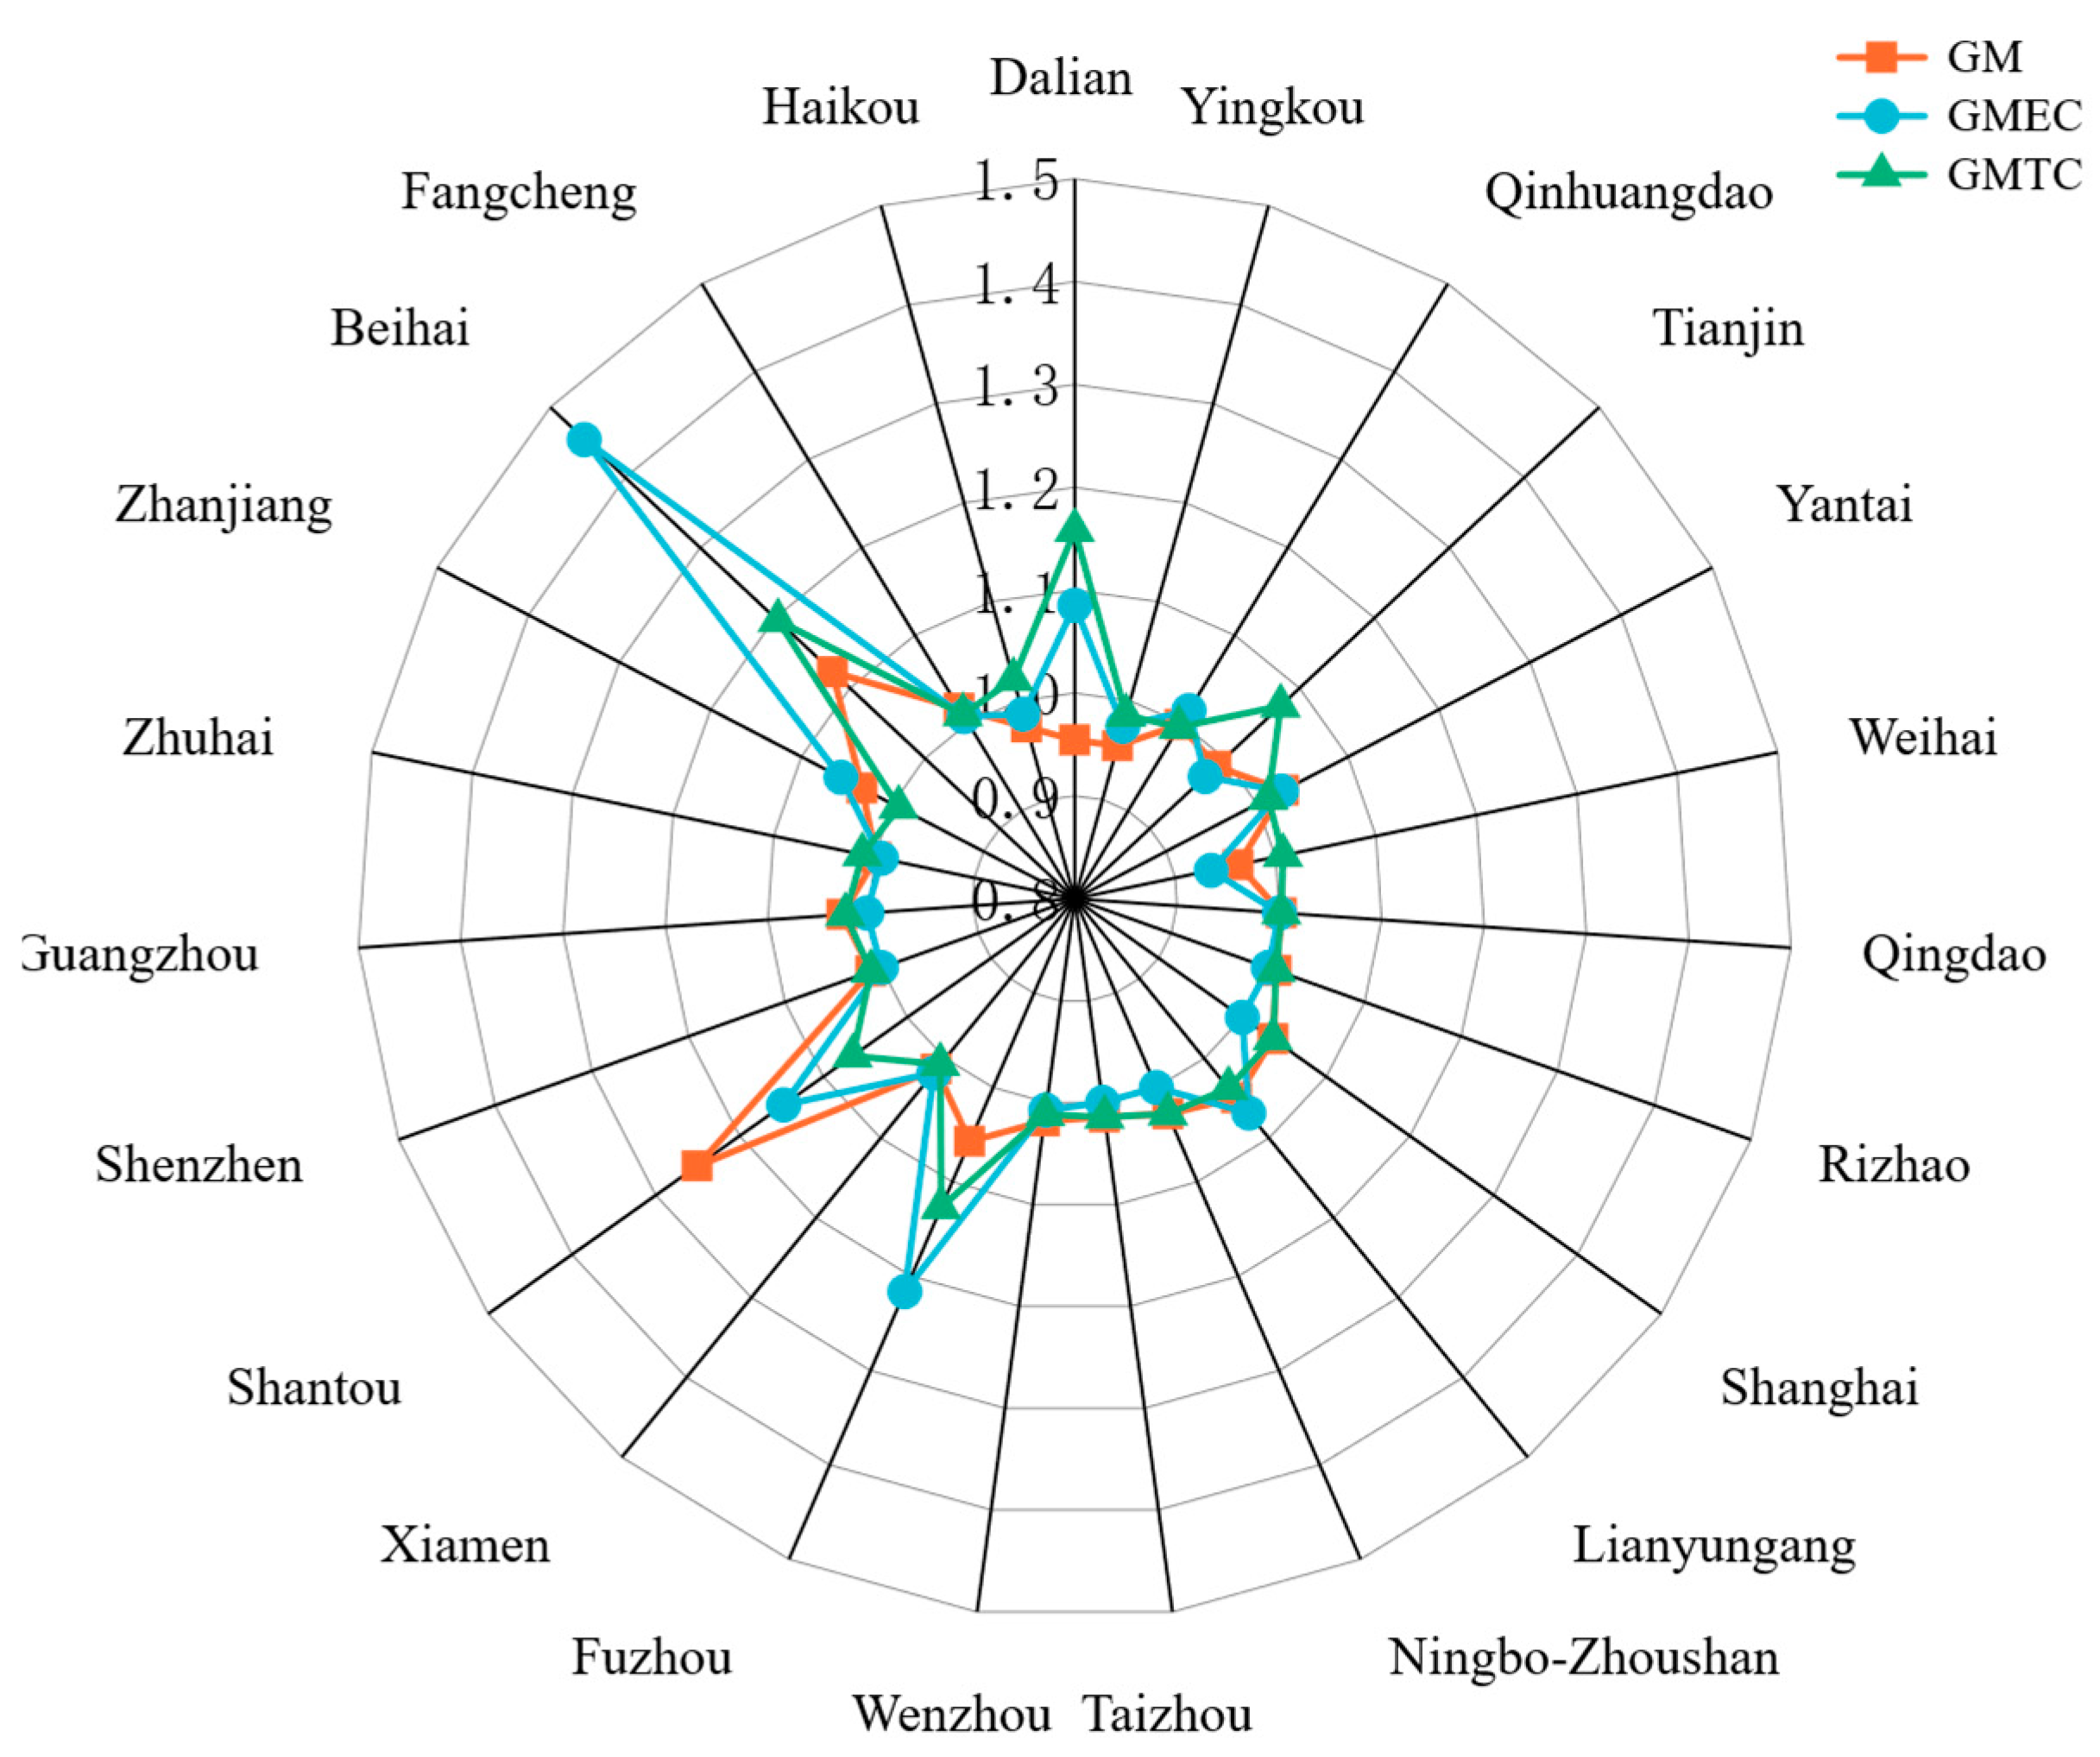
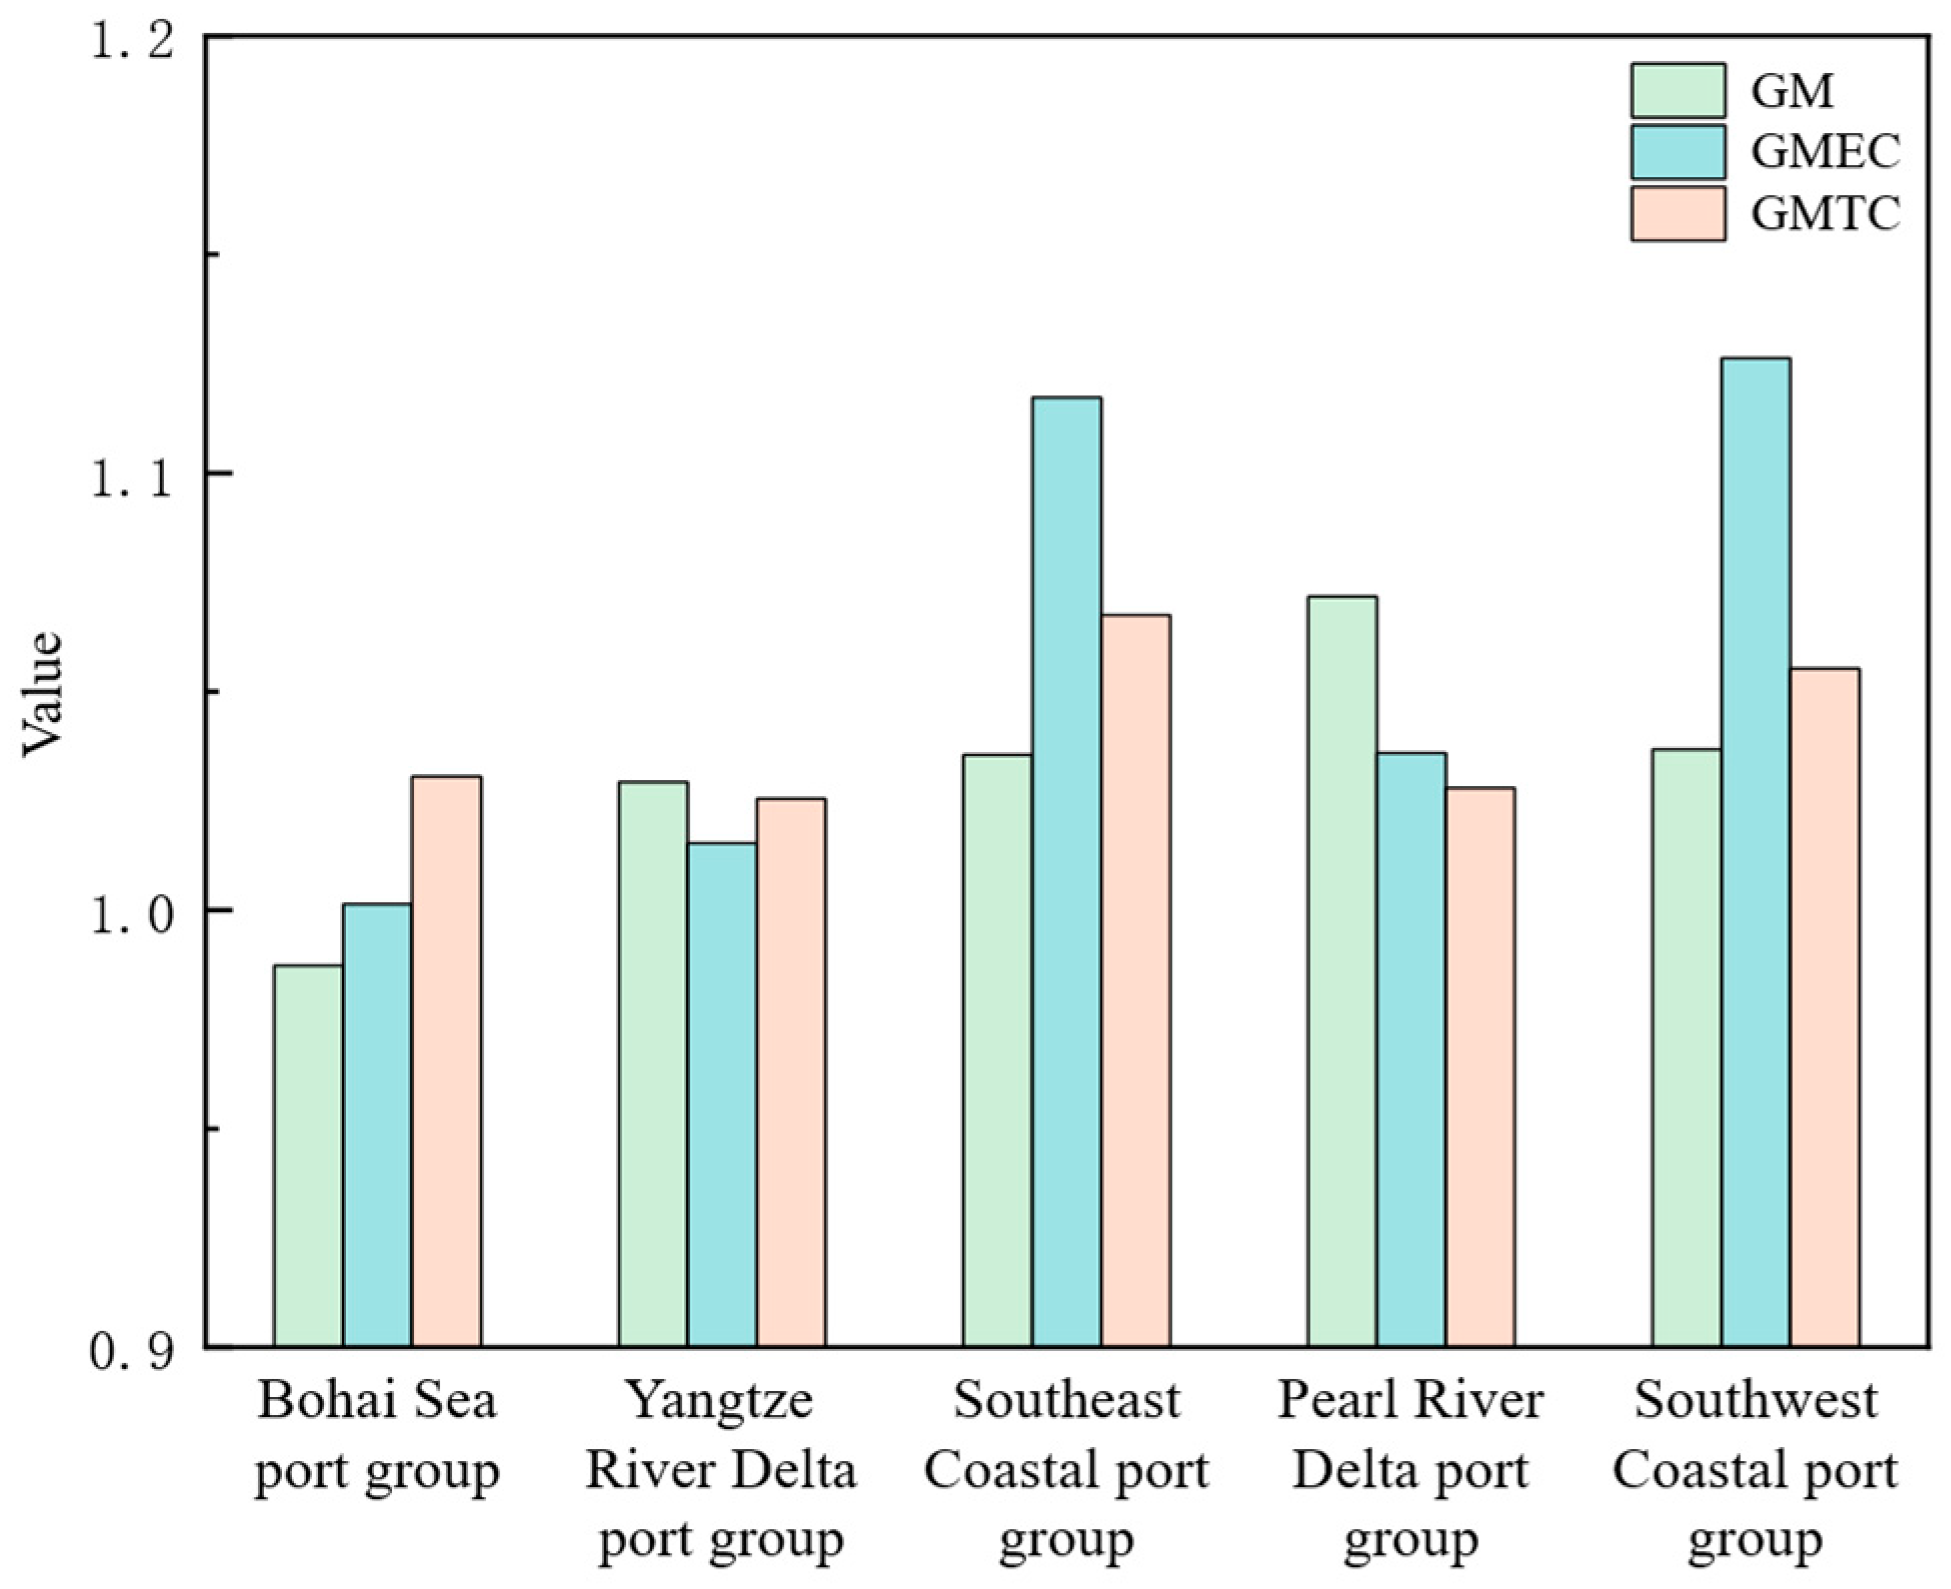
4.3. Dynamic Characteristics Analysis of Port Environmental Efficiency
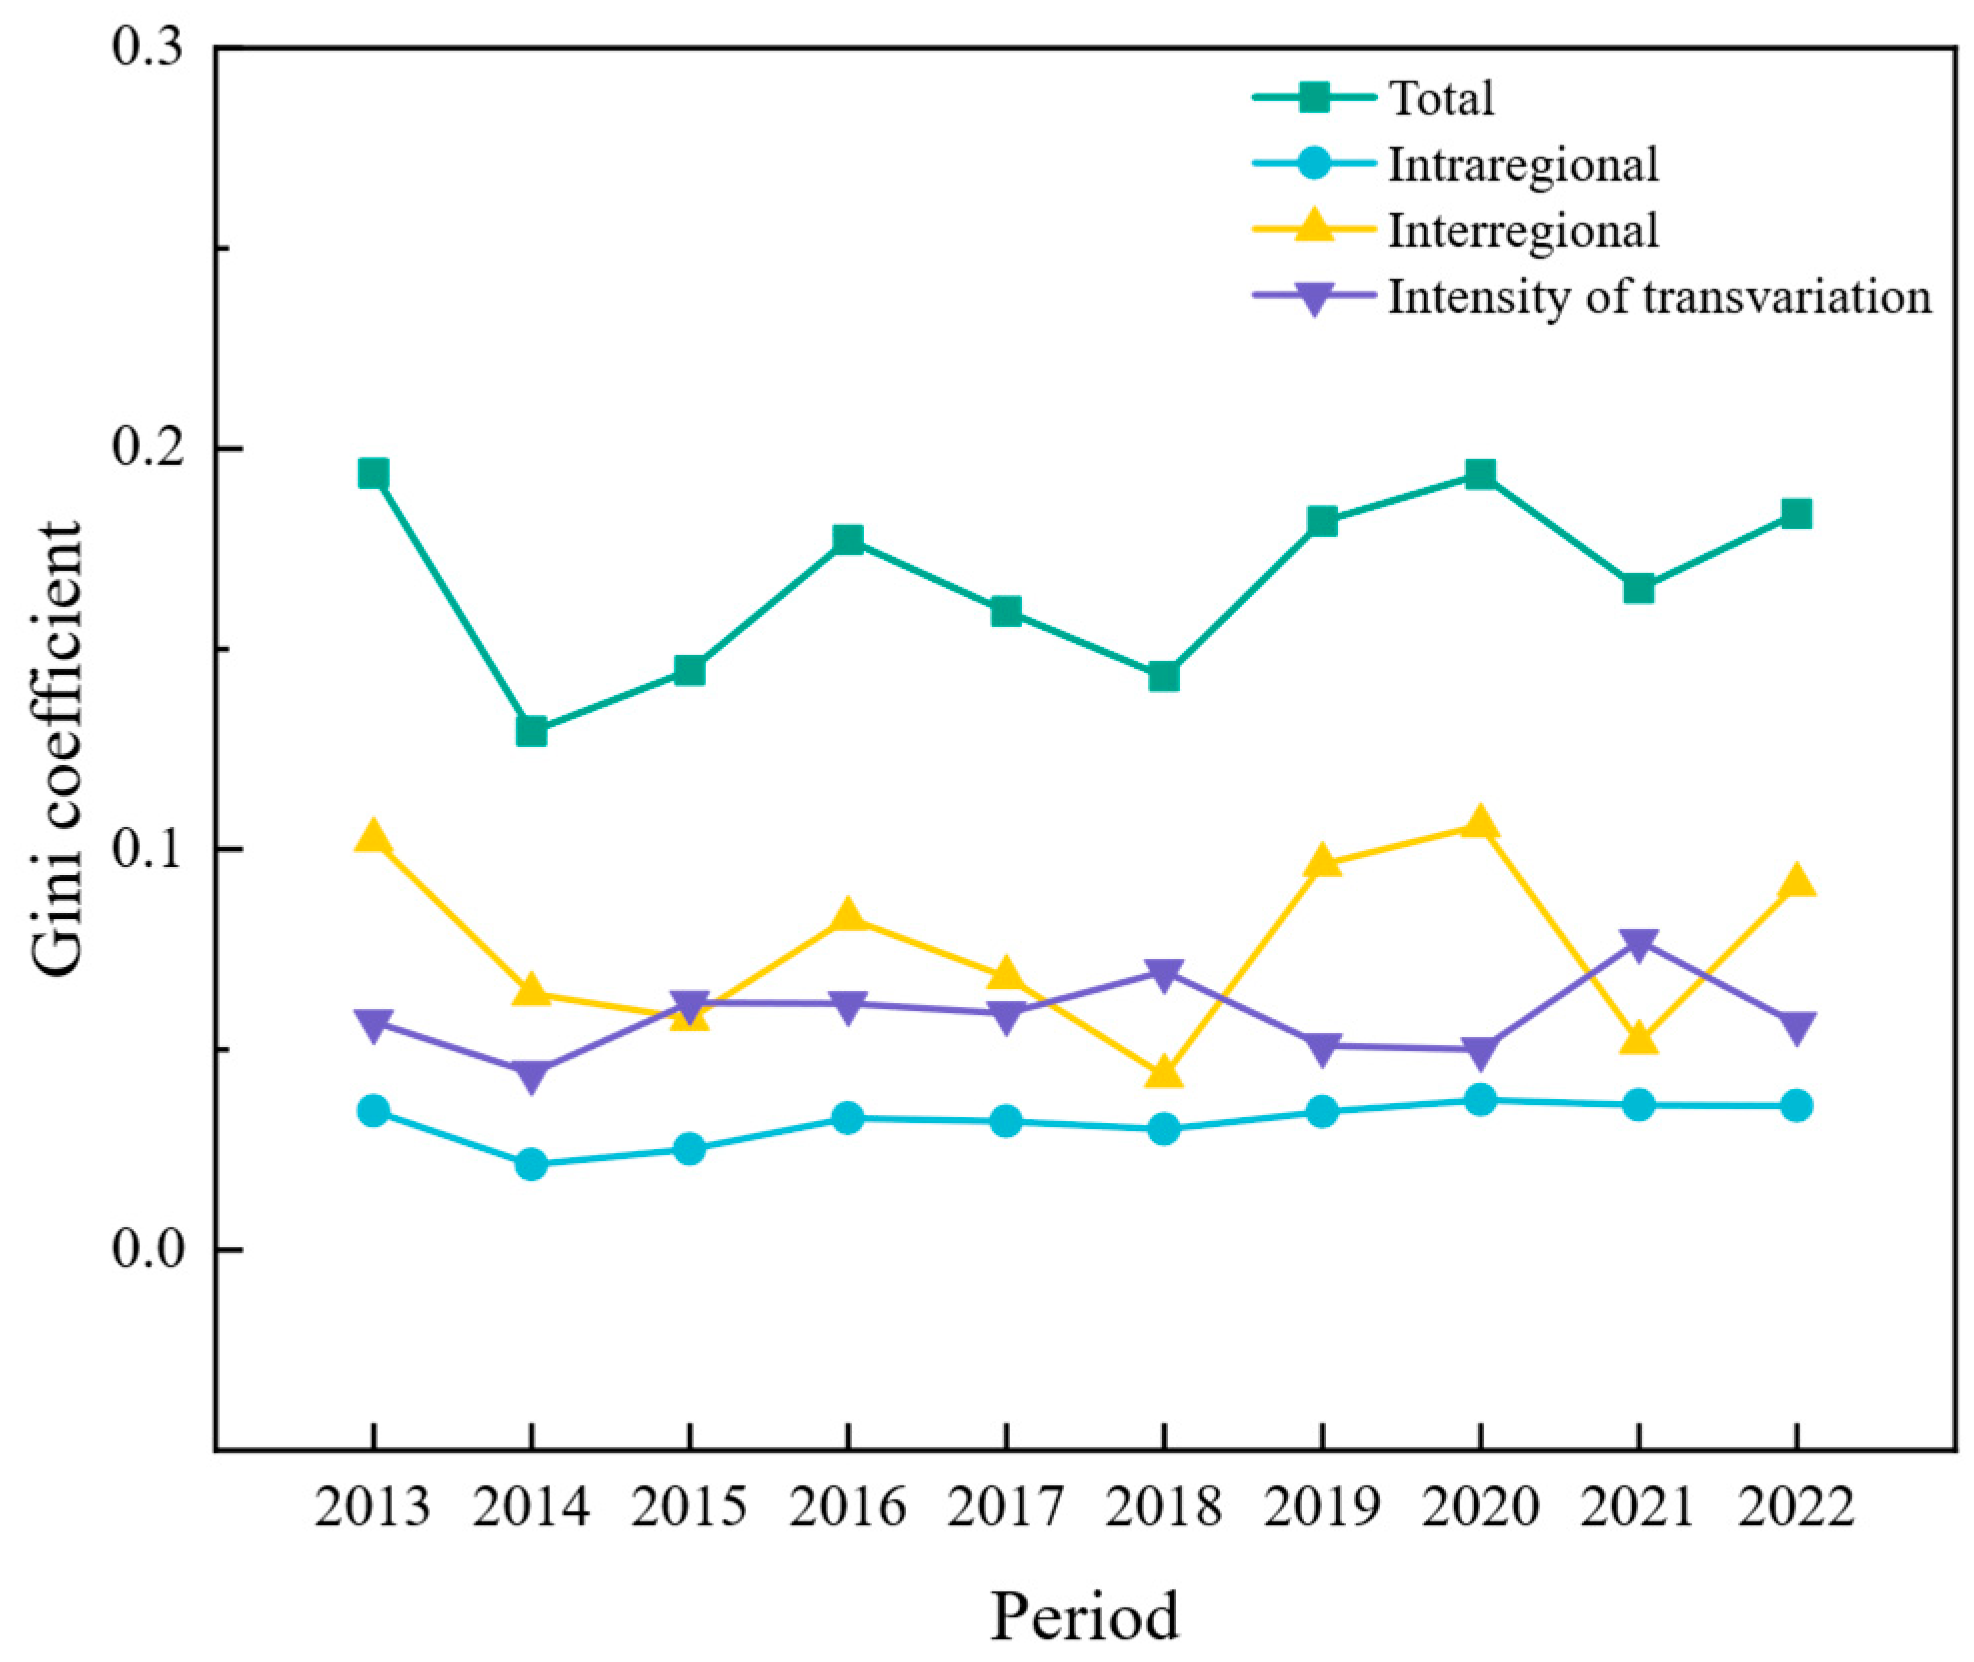
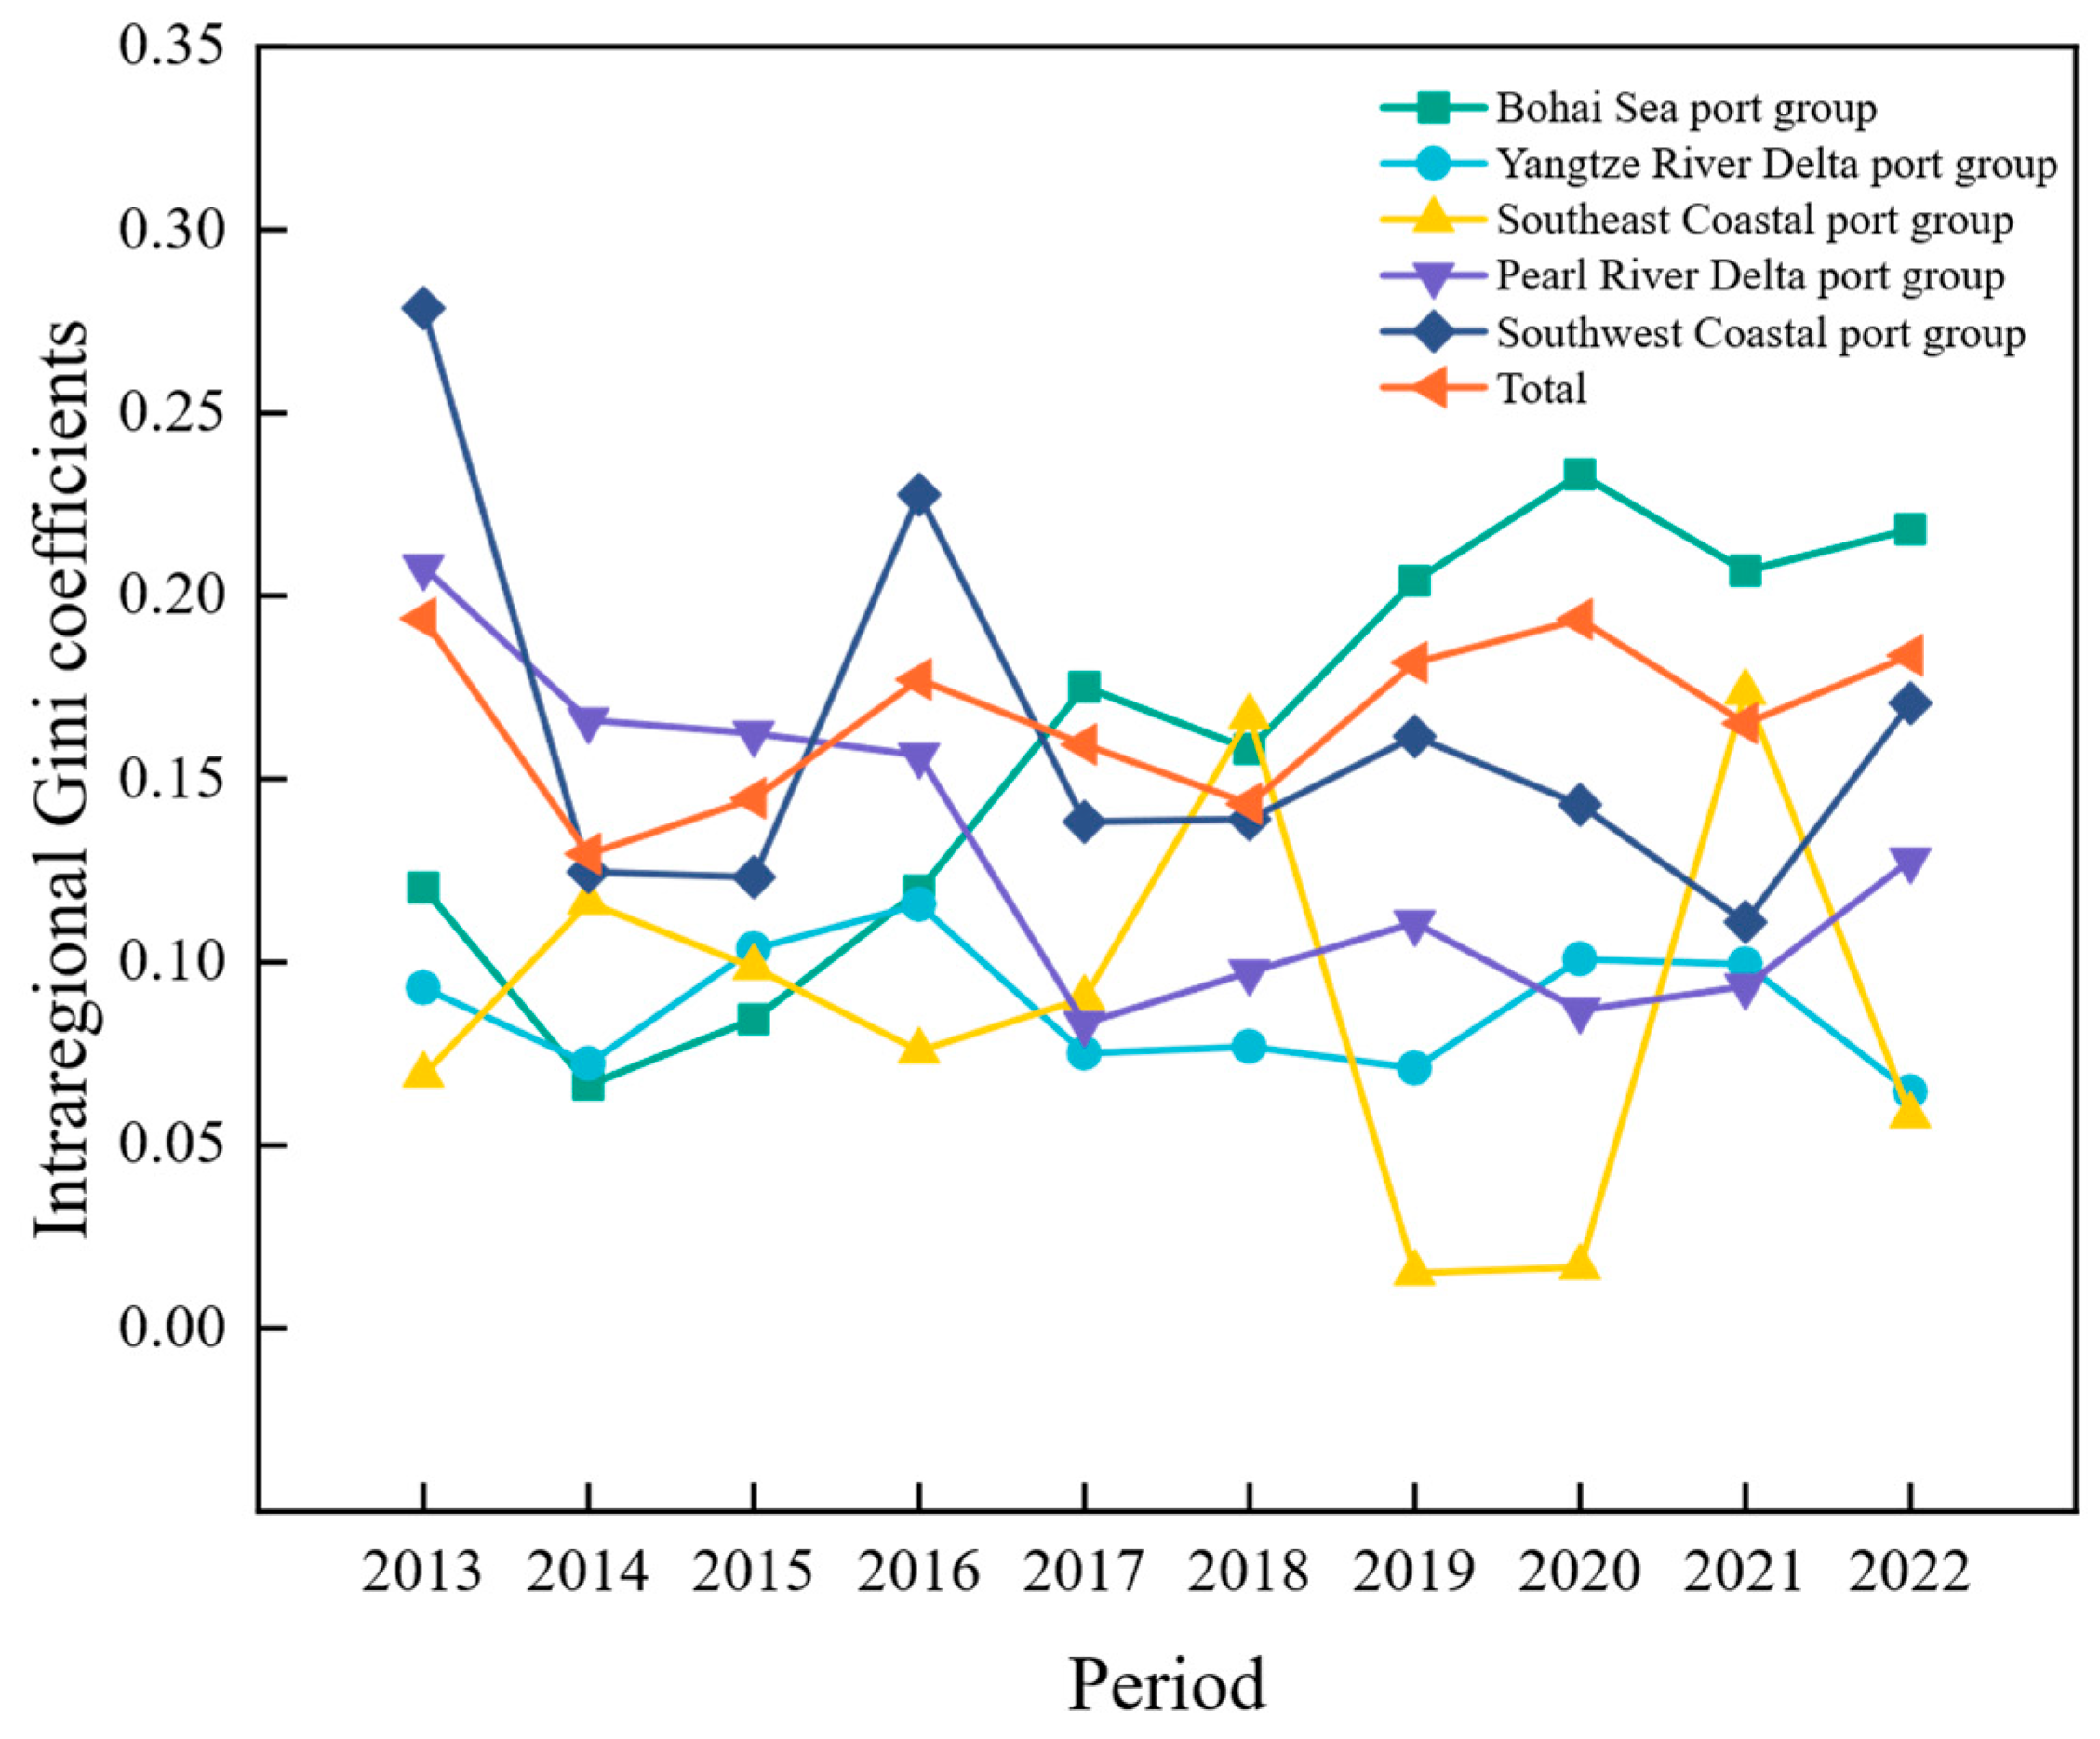
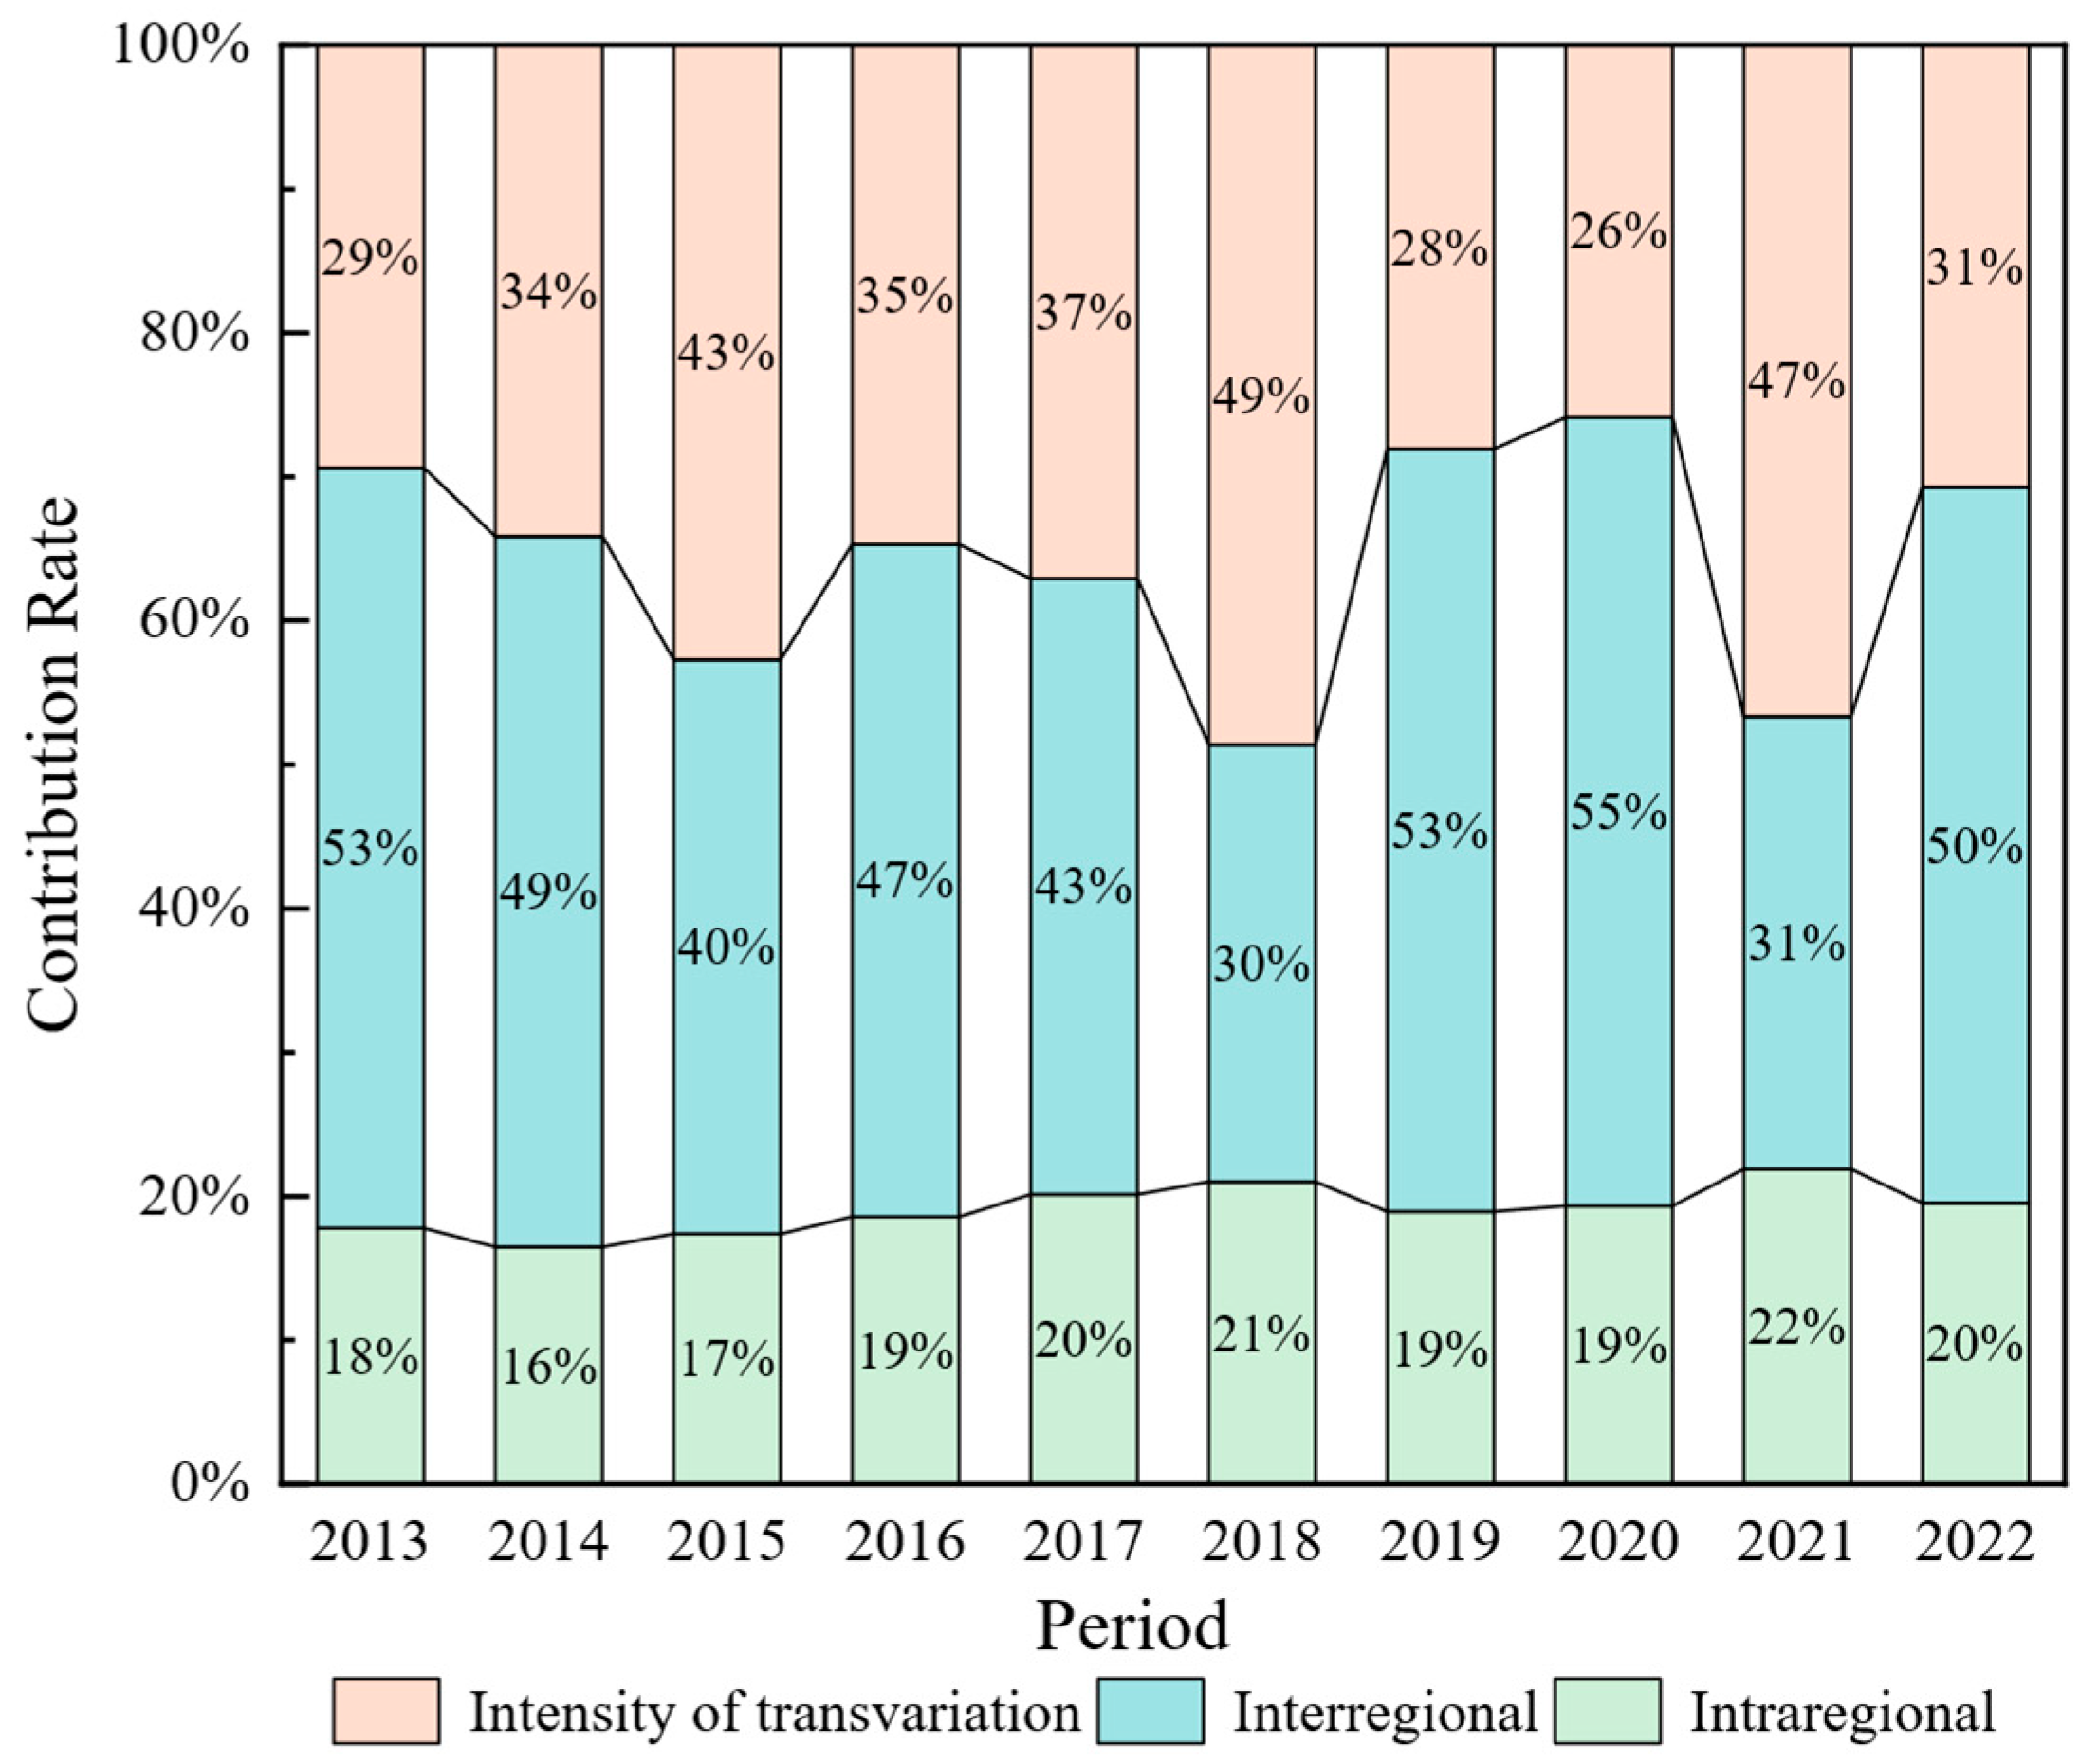
4.4. Regional Differences Analysis of Port Environmental Efficiency
5. Conclusions and Policy Implications
5.1. Main Conclusions
5.2. Policy Implications
5.3. Research Limitations and Further Expansions
Author Contributions
Funding
Data Availability Statement
Acknowledgments
Conflicts of Interest
Abbreviations
| PEE | Port Environmental Efficiency |
| DEA | Data Envelopment Analysis |
| SFA | Stochastic Frontier Analysis |
| DMU | Decision-Making Unit |
| DDF | Directional Distance Function |
| NDEA | Network DEA |
| SBM | Slack Based Measure |
| RAM | Range Adjusted Measure |
| EBM | Epsilon-based Measure |
| SD | Strong Disposability |
| WD | Weak Disposability |
| TFP | Total Factor Productivity |
| MI | Malmquist Productivity Index |
| GMI | Global Malmquist Productivity Index |
| PPS | Production Possibility Set |
| EC | Efficiency Change |
| TC | Technological Change |
References
- Chen, X.; Ma, F.; Wu, Y.; Han, B.; Luo, L.; Biancardo, S.A. MFMDepth: MetaFormer-Based Monocular Metric Depth Estimation for Distance Measurement in Ports. Comput. Ind. Eng. 2025, 207, 111325. [Google Scholar] [CrossRef]
- Xiao, G.; Wang, Y.; Wu, R.; Li, J.; Cai, Z. Sustainable Maritime Transport: A Review of Intelligent Shipping Technology and Green Port Construction Applications. J. Mar. Sci. Eng. 2024, 12, 1728. [Google Scholar] [CrossRef]
- Xu, J.; Chen, J.; Li, J.; Shi, J.; Jiang, H.; Mei, Q.; Liu, Y.; Liu, J. Transitioning to Clean Energy in Global Shipping: Country-Based Differences and Industrial Chain Collaboration. Ocean Coast. Manag. 2025, 269, 107752. [Google Scholar] [CrossRef]
- Buonomano, A.; del Papa, G.; Giuzio, G.F.; Palombo, A.; Russo, G. Future Pathways for Decarbonization and Energy Efficiency of Ports: Modelling and Optimization as Sustainable Energy Hubs. J. Clean. Prod. 2023, 420, 138389. [Google Scholar] [CrossRef]
- Cammin, P.; Brüssau, K.; Voß, S. Classifying Maritime Port Emissions Reporting. Marit. Transp. Res. 2022, 3, 100066. [Google Scholar] [CrossRef]
- Zhang, J.; Yang, D.; Luo, M. Port Efficiency Types and Perspectives: A Literature Review. Transp. Policy 2024, 156, 13–24. [Google Scholar] [CrossRef]
- Durán, C.; Derpich, I.; Moreno, F.; Karbassi Yazdi, A.; Tan, Y. Modelling Sustainable Port Operations: Balancing Inputs and Outputs with the Cobb–Douglas Function. J. Mar. Sci. Eng. 2024, 12, 2285. [Google Scholar] [CrossRef]
- Sun, J.; Yuan, Y.; Yang, R.; Ji, X.; Wu, J. Performance Evaluation of Chinese Port Enterprises under Significant Environmental Concerns: An Extended DEA-Based Analysis. Transp. Policy 2017, 60, 75–86. [Google Scholar] [CrossRef]
- Pérez-López, G.; Prior, D.; Zafra-Gómez, J.L. Temporal Scale Efficiency in DEA Panel Data Estimations. An Application to the Solid Waste Disposal Service in Spain. Omega 2018, 76, 18–27. [Google Scholar] [CrossRef]
- Almawsheki, E.S.; Shah, M.Z. Technical Efficiency Analysis of Container Terminals in the Middle Eastern Region. Asian J. Shipp. Logist. 2015, 31, 477–486. [Google Scholar] [CrossRef]
- Hsu, W.K.K.; Huang, S.H.S.; Huynh, N.T. An Assessment of Operating Efficiency for Container Terminals in a Port—An Empirical Study in Kaohsiung Port Using Data Envelopment Analysis. Res. Transp. Bus. Manag. 2023, 46, 100823. [Google Scholar] [CrossRef]
- Tovar, B.; Wall, A. Environmental Efficiency for a Cross-Section of Spanish Port Authorities. Transp. Res. Part D Transp. Environ. 2019, 75, 170–178. [Google Scholar] [CrossRef]
- Chao, S.L.; Yu, M.M.; Hsieh, W.F. Evaluating the Efficiency of Major Container Shipping Companies: A Framework of Dynamic Network DEA with Shared Inputs. Transp. Res. Part A Policy Pract. 2018, 117, 44–57. [Google Scholar] [CrossRef]
- Zhu, J.; Zhao, Y.; Yang, Q.; Jiang, J. Analysis of Regional Differences and Evolution Features for Waterway Transport Efficiency in the Yangtze River Economic Belt Considering Undesired Outputs. Ocean Coast. Manag. 2024, 253, 107122. [Google Scholar] [CrossRef]
- Cui, Q. Environmental Efficiency Measures for Ports: An Application of RAM-Tobit-RAM with Undesirable Outputs. Marit. Policy Manag. 2017, 44, 551–564. [Google Scholar] [CrossRef]
- Yang, L.; Wang, K.-L.; Geng, J.-C. China’s Regional Ecological Energy Efficiency and Energy Saving and Pollution Abatement Potentials: An Empirical Analysis Using Epsilon-Based Measure Model. J. Clean. Prod. 2018, 194, 300–308. [Google Scholar] [CrossRef]
- Wu, P.; Wang, Y.; Chiu, Y.; Li, Y.; Lin, T.-Y. Production Efficiency and Geographical Location of Chinese Coal Enterprises—Undesirable EBM DEA. Resour. Policy 2019, 64, 101527. [Google Scholar] [CrossRef]
- Jo, A.H.; Chang, Y.T. Environmental Efficiency of Seaports Correcting Estimation Biases: Weak Disposability and Bootstrapping Method. Transp. Res. Part D Transp. Environ. 2023, 122, 103884. [Google Scholar] [CrossRef]
- Piao, S.; Li, J.; Ting, C. Assessing Regional Environmental Efficiency in China with Distinguishing Weak and Strong Disposability of Undesirable Outputs. J. Clean. Prod. 2019, 227, 748–759. [Google Scholar] [CrossRef]
- Fei, H.; Shi, H.; Pan, X. A Systematic Review of Green Port Evaluation: Methods, Subjects, and Indicators. J. Mar. Sci. Eng. 2025, 13, 604. [Google Scholar] [CrossRef]
- Krmac, E.; Mansouri Kaleibar, M. A Comprehensive Review of Data Envelopment Analysis (DEA) Methodology in Port Efficiency Evaluation. Marit. Econ. Logist. 2023, 25, 817–881. [Google Scholar] [CrossRef]
- Tovar, B.; Wall, A. Are Larger and More Complex Port More Productive? An Analysis of Spanish Port Authorities. Transp. Res. Part A Policy Pract. 2019, 121, 265–276. [Google Scholar] [CrossRef]
- Liu, J.; Wang, X.; Guo, J. Port Efficiency and Its Influencing Factors in the Context of Pilot Free Trade Zones. Transp. Policy 2021, 105, 67–79. [Google Scholar] [CrossRef]
- Agüero-Tobar, M.A.; González-Araya, M.C.; González-Ramírez, R.G. Assessment of Maritime Operations Efficiency and Its Economic Impact Based on Data Envelopment Analysis: A Case Study of Chilean Ports. Res. Transp. Bus. Manag. 2023, 46, 100821. [Google Scholar] [CrossRef]
- Martínez-Moya, J.; Mestre-Alcover, A.; Sala-Garrido, R.; Furió-Pruñonosa, S. Are Transhipment Ports More Efficient in the Mediterranean Sea? Analysing the Role of Time at Ports Using DEA Metafrontier Approach. J. Transp. Geogr. 2024, 116, 103866. [Google Scholar] [CrossRef]
- Kong, Y.; Tian, X.; Sun, J.; Zhou, H. Charting Sustainable Vistas: Analysis of Internal and External Sustainability Performance of Chinese Ports. Transp. Policy 2025, 161, 31–43. [Google Scholar] [CrossRef]
- Chin, A.T.H.; Low, J.M.W. Port Performance in Asia: Does Production Efficiency Imply Environmental Efficiency? Transp. Res. Part D Transp. Environ. 2010, 15, 483–488. [Google Scholar] [CrossRef]
- Li, Y.; Li, J.; Gong, Y.; Wei, F.; Huang, Q. CO2 Emission Performance Evaluation of Chinese Port Enterprises: A Modified Meta-Frontier Non-Radial Directional Distance Function Approach. Transp. Res. Part D Transp. Environ. 2020, 89, 102605. [Google Scholar] [CrossRef]
- Wang, Z.; Wu, X.; Guo, J.; Wei, G.; Dooling, T.A. Efficiency Evaluation and PM Emission Reallocation of China Ports Based on Improved DEA Models. Transp. Res. Part D Transp. Environ. 2020, 82, 102317. [Google Scholar] [CrossRef]
- Castellano, R.; Ferretti, M.; Musella, G.; Risitano, M. Evaluating the Economic and Environmental Efficiency of Ports: Evidence from Italy. J. Clean. Prod. 2020, 271, 122560. [Google Scholar] [CrossRef]
- Wang, L.; Zhou, Z.; Yang, Y.; Wu, J. Green Efficiency Evaluation and Improvement of Chinese Ports: A Cross-Efficiency Model. Transp. Res. Part D Transp. Environ. 2020, 88, 102590. [Google Scholar] [CrossRef]
- Sun, J.; Zhao, R. Analysis of Environmental Performance and Interactivity of Ports and Regions. Ocean Coast. Manag. 2023, 239, 106602. [Google Scholar] [CrossRef]
- Lin, X.; Jing, X.; Cheng, F.; Wang, M. Exploration of Port Environmental Efficiency Measurement and Influential Factors in the Yangtze River Delta Pilot Free Trade Zone. Mar. Pollut. Bull. 2024, 206, 116766. [Google Scholar] [CrossRef]
- Nguyen, P.N.; Woo, S.H.; Beresford, A.; Pettit, S. Competition, Market Concentration, and Relative Efficiency of Major Container Ports in Southeast Asia. J. Transp. Geogr. 2020, 83, 102653. [Google Scholar] [CrossRef]
- Kong, Y.; Liu, J. Sustainable Port Cities with Coupling Coordination and Environmental Efficiency. Ocean Coast. Manag. 2021, 205, 105534. [Google Scholar] [CrossRef]
- Zhang, W.; Wu, X.; Guo, J. CO2 Emission Efficiency Analysis of Rail-Water Intermodal Transport: A Novel Network DEA Model. J. Mar. Sci. Eng. 2022, 10, 1200. [Google Scholar] [CrossRef]
- Jiang, X.; Zhan, Z.; Ren, W.; Tao, X.; Zheng, S.; Luo, M. Balancing Economic and Environmental Strategies in Regional Hinterland Transport: A Dynamic Network Cross Efficiency Analysis. Transp. Policy 2025, 162, 128–154. [Google Scholar] [CrossRef]
- Zhang, W.; Chen, W.; Wu, X.; Chen, J.; Zhang, Z. Evaluation and Spatiotemporal Analysis of Low-Carbon Efficiency of the “Ship-Port” System. Marit. Policy Manag. 2025, 1–33. [Google Scholar] [CrossRef]
- Faere, R.; Grosskopf, S.; Lovell, C.K.; Pasurka, C. Multilateral Productivity Comparisons When Some Outputs Are Undesirable: A Nonparametric Approach. Rev. Econ. Stat. 1989, 71, 90–98. [Google Scholar] [CrossRef]
- Färe, R.; Grosskopf, S. Nonparametric Productivity Analysis with Undesirable Outputs: Comment. Am. J. Agric. Econ. 2003, 85, 1070–1074. [Google Scholar] [CrossRef]
- Kuosmanen, T. Weak Disposability in Nonparametric Production Analysis with Undesirable Outputs. Am. J. Agric. Econ. 2005, 87, 1077–1082. [Google Scholar] [CrossRef]
- Chang, Y.T.; Park, H.; Jeong, J.; Lee, J. Evaluating Economic and Environmental Efficiency of Global Airlines: A SBM-DEA Approach. Transp. Res. Part D Transp. Environ. 2014, 27, 46–50. [Google Scholar] [CrossRef]
- Taleb, M.; Khalid, R.; Emrouznejad, A.; Ramli, R. Environmental Efficiency under Weak Disposability: An Improved Super Efficiency Data Envelopment Analysis Model with Application for Assessment of Port Operations Considering NetZero. Environ. Dev. Sustain. 2023, 25, 6627–6656. [Google Scholar] [CrossRef]
- Gu, G.; Zhang, J.; Pan, X. A Meta-Frontier Approach to Evaluating the Environmental Efficiency of Coastal Ports: Implications for Port Sustainability. J. Mar. Sci. Eng. 2025, 13, 1272. [Google Scholar] [CrossRef]
- Yu, M.M.; See, K.F. Evaluating the Efficiency of Global Airlines: A New Weighted SBM-NDEA Approach with Non-Uniform Abatement Factor. Res. Transp. Bus. Manag. 2023, 46, 100860. [Google Scholar] [CrossRef]
- Wang, J.; Wang, S.; Li, S.; Cai, Q.; Gao, S. Evaluating the Energy-Environment Efficiency and Its Determinants in Guangdong Using a Slack-Based Measure with Environmental Undesirable Outputs and Panel Data Model. Sci. Total Environ. 2019, 663, 878–888. [Google Scholar] [CrossRef] [PubMed]
- Tone, K. A Slacks-Based Measure of Efficiency in Data Envelopment Analysis. Eur. J. Oper. Res. 2001, 130, 498–509. [Google Scholar] [CrossRef]
- Tone, K.; Tsutsui, M. An Epsilon-Based Measure of Efficiency in DEA—A Third Pole of Technical Efficiency. Eur. J. Oper. Res. 2010, 207, 1554–1563. [Google Scholar] [CrossRef]
- Janmontree, J.; Zadek, H.; Ransikarbum, K. Analyzing Solar Location for Green Hydrogen Using Multi-Criteria Decision Analysis. Renew. Sustain. Energy Rev. 2025, 209, 115102. [Google Scholar] [CrossRef]
- Wu, D.; Wang, Y.; Qian, W. Efficiency Evaluation and Dynamic Evolution of China’s Regional Green Economy: A Method Based on the Super-PEBM Model and DEA Window Analysis. J. Clean. Prod. 2020, 264, 121630. [Google Scholar] [CrossRef]
- Färe, R.; Grosskopf, S.; Roos, P. Productivity and Quality Changes in Swedish Pharmacies. Int. J. Prod. Econ. 1995, 39, 137–144. [Google Scholar] [CrossRef]
- Pastor, J.T.; Lovell, C.K. A Global Malmquist Productivity Index. Econ. Lett. 2005, 88, 266–271. [Google Scholar] [CrossRef]
- Dagum, C. A New Approach to the Decomposition of the Gini Income Inequality Ratio. Empir. Econ. 1997, 22, 515–531. [Google Scholar] [CrossRef]
- Gao, K.; Yuan, Y. Spatiotemporal Pattern Assessment of China’s Industrial Green Productivity and Its Spatial Drivers: Evidence from City-Level Data over 2000–2017. Appl. Energy 2022, 307, 118248. [Google Scholar] [CrossRef]
- Li, X.; Li, F.; Zhao, N.; Zhu, Q. Measuring Environmental Sustainability Performance of Freight Transportation Seaports in China: A Data Envelopment Analysis Approach Based on the Closest Targets. Expert Syst. 2020, 37, e12334. [Google Scholar] [CrossRef]
- Huang, T.; Chen, Z.; Wang, S.; Jiang, D. Efficiency Evaluation of Key Ports along the 21st-Century Maritime Silk Road Based on the DEA–SCOR Model. Marit. Policy Manag. 2021, 48, 378–390. [Google Scholar] [CrossRef]
- Cui, L.; Chen, L.; Yang, X. Evaluation and Analysis of Green Efficiency of China’s Coastal Ports under the “Double Carbon” Goal: Two Improved DEA Models with CO2 Emissions. Environ. Dev. Sustain. 2023, 26, 29099–29128. [Google Scholar] [CrossRef]
- Wang, L.; Li, Y. Estimation Methods and Reduction Strategies of Port Carbon Emissions—What Literatures Say? Mar. Pollut. Bull. 2023, 195, 115451. [Google Scholar] [CrossRef]
- Xu, X.; Liu, X.; Feng, L.; Yap, W.Y.; Feng, H. Emission Estimation and Spatiotemporal Distribution of Passenger Ships Using Multi-Source Data: A Case from Zhoushan (China). J. Mar. Sci. Eng. 2025, 13, 168. [Google Scholar] [CrossRef]
- Kuang, H.; Zhu, J.; Bai, Z. Study on the Interaction between Green Competitiveness of Coastal Ports and Hinterland Economy. Sustainability 2023, 15, 1364. [Google Scholar] [CrossRef]
- Mo, R.; Huang, H.; Zhang, J.; Liu, Y.; Zhao, X. Green Economic Efficiency and Productivity for Sustainable Development in China: A Ray Epsilon-Based Measure Model Analysis. Environ. Sci. Policy 2024, 160, 103860. [Google Scholar] [CrossRef]
- Zhou, Y.; Li, Z.; Duan, W.; Deng, Z. The Impact of Provincial Port Integration on Port Efficiency: Empirical Evidence from China’s Coastal Provinces. J. Transp. Geogr. 2023, 108, 103574. [Google Scholar] [CrossRef]
- Zhang, C.; Hu, H.; Yang, Y.; Wang, N. Optimizing the Portfolio of Smart Technologies to Maximize Port Carbon Emission Efficiency: A Configurational Theory Approach. Marit. Policy Manag. 2025, 1–39. [Google Scholar] [CrossRef]
- Nguyen, P.N.; Kim, H. The Effects of the COVID-19 Pandemic on Connectivity, Operational Efficiency, and Resilience of Major Container Ports in Southeast Asia. J. Transp. Geogr. 2024, 116, 103835. [Google Scholar] [CrossRef]
- Xu, L.; Yang, S.; Chen, J.; Shi, J. The Effect of COVID-19 Pandemic on Port Performance: Evidence from China. Ocean Coast. Manag. 2021, 209, 105660. [Google Scholar] [CrossRef]
- Chen, J.R.; Choi, J.W.; Seo, Y.J. Environmental Efficiency Assessment of Coastal Ports in China: Implications for Sustainable Port Management. Mar. Pollut. Bull. 2025, 211, 117436. [Google Scholar] [CrossRef] [PubMed]
- Liu, P.; Pan, Q.; Zhu, B. Dynamic Evolution of Green Total Factor Productivity Growth of China’s Coastal Ports. Marit. Policy Manag. 2024, 51, 1535–1557. [Google Scholar] [CrossRef]


| Research Object | Method | Type | Inputs | Outputs | |
|---|---|---|---|---|---|
| [10] | 19 container ports | CCR, BCC | R | Terminal area, Quay length, Quay crane, Yard equipment, Maximum draft | Throughput |
| [11] | Kaohsiung Port | CCR, BCC | R | Gantry crane capacity, Gantry crane number, Berth length, Container yard area, Fixed costs, Variable costs | Total loading and unloading capacity |
| [12] | 26 Spanish ports | DDF | R | Labor, Capital, Intermediate | Ships, Cargo traffic, Passenger traffic, CO2 emissions |
| [13] | 13 global ports | Dynamic NDEA | NR | Fleet capacity, Expenses, Employees | Lifting, Revenue |
| [14] | 11 Chinese ports | SBM | NR | Employees, Motor ship, Urban fixed asset investment | NOx emission, Passenger volume, Cargo volume |
| [15] | 10 Chinese ports | RAM | NR | Staff members, Annual cash investment, Production berths | Container throughput, Cargo throughput, Main business income, CO2 emissions |
| [22] | 26 Spanish ports | DEA-Malmquist | R | Labor, Intermediate consumption expenditures, Capital assets, Deposit surface area | Liquid bulk cargo, Solid bulk cargo, Container cargo, General non-container cargo, Passengers |
| [23] | 6 Chinese ports | Super-SBM | NR | Berth number, Terminal length, Net asset, Cost of goods sold, Employees | Cargo throughput, Container throughput, Sales revenue, SO2 emission, NOₓ emission |
| [24] | 12 Chilean ports | CCR, BCC | R | Maximum draft, Quay length, Berth number | TEUs transferred, Number of vessels |
| [25] | 19 Mediterranean ports | CCR | R | Berth length, Yard area, Quay cranes number | Number of TEU handled per hour |
| [27] | 13 East Asian ports | SBM | NR | The frequency of shipping services, Bilateral trade flows | Container capacity flows, Gaseous emissions |
| [28] | 16 Chinese ports | SBM | NR | Labor, Fixed assets | Container throughput, Cargo throughput, CO2 emission |
| [29] | 11 Chinese ports | DDF | R | Terminal length, Berth quantity, Labor, Total assets | Container throughput, PM emission |
| [30] | 24 Italian ports | CCR, BCC | R | Investments, Terminal area, Employees, Green Port Efforts (GPE) | Solid bulk, Liquid bulk, Containers, Environmental Quality Index (EQI) |
| [31] | 18 Chinese ports | Cross-efficiency model | NR | Berth number, Terminal length, Employees, Total fixed assets | Cargo throughput, NOx emissions, SOx emissions, Solid waste containers |
| [32] | 22 Chinese ports | DDF | NR | Berth number, Terminal length, Employees, Barges | Cargo throughput |
| [36] | 14 Chinese ports | NDEA | NR | Length of railways, Railway labor, Berth quantity, Port labor | Railway-port freight volumes, Cargo throughput, CO2 emission |
| Port Group | Contains Port | |
|---|---|---|
| 1 | Bohai Sea port group | Dalian Port, Yingkou Port, Qinhuangdao Port, Tianjin Port, |
| Yantai Port, Weihai Port, Qingdao Port, Rizhao Port | ||
| 2 | Yangtze River Delta port group | Shanghai Port, Lianyungang Port, Ningbo-Zhoushan Port, Taizhou Port, Wenzhou Port |
| 3 | Southeast Coastal port group | Fuzhou Port, Xiamen Port |
| 4 | Pearl River Delta port group | Shantou Port, Shenzhen Port, Guangzhou Port, Zhuhai Port |
| 5 | Southwest Coastal port group | Zhanjiang Port, Beihai Port, Fangcheng Port, Haikou Port |
| Variable | Unit | |
|---|---|---|
| Inputs | Quay length | m |
| Berth number | pcs | |
| 10,000 Ton Class Berth number | pcs | |
| Desirable outputs | Cargo throughput | 10,000 tons |
| Container throughput | 10,000 TEU | |
| Undesirable outputs | CO2 emission | 10,000 tons |
| Period | 2013 | 2014 | 2015 | 2016 | 2017 | 2018 | 2019 | 2020 | 2021 | 2022 |
|---|---|---|---|---|---|---|---|---|---|---|
| SC | 2.9 | 2.7 | 2.6 | 2.5 | 2.4 | 2.3 | 2.1 | 2.0 | 1.9 | 1.75 |
| Variable | Min | Max | Mean | SD | |
|---|---|---|---|---|---|
| Total | Quay length | 3949 | 126,921 | 29,714.89 | 25,957.33 |
| Berth number | 15 | 1238 | 217.3 | 243.2 | |
| 10,000 Ton Class Berth number | 7 | 224 | 64.41 | 46.84 | |
| Cargo throughput of port | 2078 | 126,134 | 29,260.64 | 24,637.02 | |
| Container throughput of port | 9 | 4730 | 853.47 | 1088.55 | |
| CO2 emission | 14,817.82 | 613,273.5 | 164,683.9 | 137,513.4 | |
| Bohai Sea port group | Quay length | 3949 | 48,211 | 26,177.74 | 12,195.15 |
| Berth number | 15 | 257 | 128.4375 | 66.87071 | |
| 10,000 Ton Class Berth number | 12 | 131 | 72.5375 | 30.82821 | |
| Cargo throughput of port | 3730 | 65,754 | 34,804.93 | 16,447.94 | |
| Container throughput of port | 39 | 2567 | 730.6 | 699.9425 | |
| CO2 emission | 18,997.46 | 358,520.9 | 196,752 | 93,388.28 | |
| Yangtze River Delta port group | Quay length | 11,361 | 126,921 | 50,856.74 | 44,364.47 |
| Berth number | 53 | 1238 | 451.46 | 398.7322 | |
| 10,000 Ton Class Berth number | 7 | 224 | 89.7 | 77.7196 | |
| Cargo throughput of port | 4901 | 126,134 | 41,503.86 | 39,115.48 | |
| Container throughput of port | 15 | 4730 | 1434.8 | 1640.272 | |
| Southeast Coastal port group | CO2 emission | 25,036.52 | 613,273.5 | 233,099.5 | 216,859 |
| Quay length | 23,025 | 33,274 | 28,414.95 | 3054.073 | |
| Berth number | 158 | 207 | 180.1 | 12.2942 | |
| 10,000 Ton Class Berth number | 48 | 81 | 68.85 | 9.852998 | |
| Cargo throughput of port | 12,759 | 30,164 | 20,158.35 | 4500.461 | |
| Container throughput of port | 198 | 1243 | 663.6 | 392.3723 | |
| CO2 emission | 87,564.38 | 136,126.7 | 111,955.4 | 17,475.09 | |
| Pearl River Delta port group | Quay length | 5013 | 56,055 | 27,764.78 | 16,000.29 |
| Berth number | 34 | 621 | 235.925 | 187.8966 | |
| 10,000 Ton Class Berth number | 11 | 96 | 49.1 | 26.95657 | |
| Cargo throughput of port | 3155 | 62,906 | 24,258.18 | 20,197.23 | |
| Container throughput of port | 88 | 3004 | 1236.175 | 1125.693 | |
| CO2 emission | 16,291.44 | 336,395.2 | 136,400.3 | 112,017.4 | |
| Southwest Coastal port group | Quay length | 4563 | 23,577 | 12,961.98 | 5504.1 |
| Berth number | 32 | 177 | 102.3 | 44.48117 | |
| 10,000 Ton Class Berth number | 11 | 51 | 29.625 | 12.04199 | |
| Cargo throughput of port | 2078 | 30,185 | 12,421.68 | 7857.261 | |
| Container throughput of port | 9 | 215 | 84.75 | 61.18142 | |
| CO2 emission | 14,817.82 | 170,710.4 | 69,676.27 | 44,401.43 |
| Model | 2013 | 2014 | 2015 | 2016 | 2017 | 2018 | 2019 | 2020 | 2021 | 2022 |
|---|---|---|---|---|---|---|---|---|---|---|
| BCC | 0.809 | 0.827 | 0.834 | 0.811 | 0.858 | 0.853 | 0.846 | 0.773 | 0.785 | 0.761 |
| SBM | 0.652 | 0.704 | 0.726 | 0.673 | 0.742 | 0.799 | 0.705 | 0.578 | 0.660 | 0.648 |
| EBM | 0.744 | 0.836 | 0.821 | 0.750 | 0.807 | 0.827 | 0.752 | 0.703 | 0.778 | 0.740 |
| EBM-WD | 0.742 | 0.842 | 0.810 | 0.748 | 0.808 | 0.816 | 0.754 | 0.704 | 0.781 | 0.742 |
| Port | BCC | SBM | EBM | EBM-WD |
|---|---|---|---|---|
| Dalian | 0.571 | 0.517 | 0.679 | 0.683 |
| Yingkou | 0.829 | 0.738 | 0.815 | 0.807 |
| Qinhuangdao | 0.814 | 0.226 | 0.655 | 0.652 |
| Tianjin | 0.798 | 0.819 | 0.829 | 0.830 |
| Yantai | 0.584 | 0.294 | 0.583 | 0.588 |
| Weihai | 0.734 | 0.657 | 0.534 | 0.533 |
| Qingdao | 1.000 | 1.000 | 1.000 | 1.000 |
| Rizhao | 1.000 | 1.000 | 1.000 | 1.000 |
| Shanghai | 1.000 | 1.000 | 1.000 | 1.000 |
| Lianyungang | 0.819 | 0.851 | 0.885 | 0.844 |
| Ningbo-Zhoushan | 1.000 | 1.000 | 1.000 | 1.000 |
| Taizhou | 1.000 | 1.000 | 1.000 | 1.000 |
| Wenzhou | 0.711 | 0.302 | 0.592 | 0.597 |
| Fuzhou | 0.487 | 0.377 | 0.545 | 0.549 |
| Xiamen | 0.557 | 0.534 | 0.514 | 0.514 |
| Shantou | 0.850 | 0.786 | 0.683 | 0.682 |
| Shenzhen | 1.000 | 1.000 | 1.000 | 1.000 |
| Guangzhou | 0.999 | 0.954 | 0.997 | 0.997 |
| Zhuhai | 0.682 | 0.373 | 0.596 | 0.597 |
| Zhanjiang | 0.920 | 0.615 | 0.906 | 0.910 |
| Beihai | 0.927 | 0.825 | 0.751 | 0.752 |
| Fangcheng | 0.542 | 0.100 | 0.381 | 0.389 |
| Haikou | 0.935 | 0.875 | 0.900 | 0.895 |
| Mean | 0.816 | 0.689 | 0.776 | 0.775 |
| Port | 2013 | 2014 | 2015 | 2016 | 2017 | 2018 | 2019 | 2020 | 2021 | 2022 | Mean | SD |
|---|---|---|---|---|---|---|---|---|---|---|---|---|
| Dalian | 0.611 | 0.948 | 0.687 | 0.637 | 1.000 | 0.658 | 0.506 | 0.420 | 1.000 | 0.358 | 0.683 | 0.220 |
| Yingkou | 0.910 | 0.969 | 0.855 | 0.868 | 1.000 | 0.944 | 0.655 | 0.615 | 0.596 | 0.661 | 0.807 | 0.150 |
| Qinhuangdao | 0.641 | 0.662 | 0.676 | 0.550 | 0.811 | 0.719 | 0.680 | 0.566 | 0.580 | 0.636 | 0.652 | 0.074 |
| Tianjin | 1.000 | 1.000 | 1.000 | 0.954 | 0.772 | 0.696 | 0.636 | 0.629 | 1.000 | 0.611 | 0.830 | 0.167 |
| Yantai | 0.525 | 0.733 | 0.757 | 0.603 | 0.483 | 0.666 | 0.545 | 0.501 | 0.513 | 0.553 | 0.588 | 0.093 |
| Weihai | 1.000 | 1.000 | 1.000 | 1.000 | 0.233 | 0.288 | 0.196 | 0.170 | 0.195 | 0.246 | 0.533 | 0.383 |
| Qingdao | 1.000 | 1.000 | 1.000 | 1.000 | 1.000 | 1.000 | 1.000 | 1.000 | 1.000 | 1.000 | 1.000 | 0.000 |
| Rizhao | 1.000 | 1.000 | 1.000 | 1.000 | 1.000 | 1.000 | 1.000 | 1.000 | 1.000 | 1.000 | 1.000 | 0.000 |
| Shanghai | 1.000 | 1.000 | 1.000 | 1.000 | 1.000 | 1.000 | 1.000 | 1.000 | 1.000 | 1.000 | 1.000 | 0.000 |
| Lianyungang | 0.797 | 1.000 | 0.644 | 0.646 | 1.000 | 1.000 | 1.000 | 0.708 | 0.645 | 1.000 | 0.844 | 0.162 |
| Ningbo-Zhoushan | 1.000 | 1.000 | 1.000 | 1.000 | 1.000 | 1.000 | 1.000 | 1.000 | 1.000 | 1.000 | 1.000 | 0.000 |
| Taizhou | 1.000 | 1.000 | 1.000 | 1.000 | 1.000 | 1.000 | 1.000 | 1.000 | 1.000 | 1.000 | 1.000 | 0.000 |
| Wenzhou | 0.591 | 0.586 | 0.625 | 0.568 | 0.571 | 0.561 | 0.592 | 0.603 | 0.645 | 0.627 | 0.597 | 0.026 |
| Fuzhou | 0.362 | 0.387 | 0.355 | 0.364 | 0.359 | 1.000 | 0.465 | 0.529 | 1.000 | 0.670 | 0.549 | 0.245 |
| Xiamen | 0.478 | 0.621 | 0.530 | 0.495 | 0.517 | 0.499 | 0.494 | 0.495 | 0.485 | 0.531 | 0.514 | 0.039 |
| Shantou | 0.376 | 0.477 | 0.471 | 0.478 | 0.772 | 0.659 | 0.590 | 1.000 | 1.000 | 1.000 | 0.682 | 0.233 |
| Shenzhen | 1.000 | 1.000 | 1.000 | 1.000 | 1.000 | 1.000 | 1.000 | 1.000 | 1.000 | 1.000 | 1.000 | 0.000 |
| Guangzhou | 0.972 | 1.000 | 1.000 | 1.000 | 1.000 | 1.000 | 1.000 | 1.000 | 1.000 | 1.000 | 0.997 | 0.009 |
| Zhuhai | 0.486 | 0.555 | 0.594 | 0.626 | 0.692 | 0.712 | 0.750 | 0.585 | 0.557 | 0.418 | 0.597 | 0.097 |
| Zhanjiang | 0.688 | 0.992 | 1.000 | 1.000 | 1.000 | 1.000 | 0.909 | 0.740 | 0.771 | 1.000 | 0.910 | 0.120 |
| Beihai | 0.238 | 1.000 | 1.000 | 0.364 | 1.000 | 1.000 | 1.000 | 0.536 | 0.755 | 0.630 | 0.752 | 0.280 |
| Fangcheng | 0.391 | 0.433 | 0.436 | 0.380 | 0.377 | 0.374 | 0.332 | 0.356 | 0.412 | 0.403 | 0.389 | 0.031 |
| Haikou | 1.000 | 1.000 | 1.000 | 0.680 | 1.000 | 1.000 | 1.000 | 0.737 | 0.814 | 0.721 | 0.895 | 0.132 |
| Average | 0.742 | 0.842 | 0.810 | 0.748 | 0.808 | 0.816 | 0.754 | 0.704 | 0.781 | 0.742 | 0.775 | 0.041 |
| Port Group | 2012 | 2013 | 2014 | 2015 | 2016 | 2017 | 2018 | 2019 | 2020 | 2021 | 2022 | Mean | SD |
|---|---|---|---|---|---|---|---|---|---|---|---|---|---|
| Bohai Sea port group | 0.841 | 0.836 | 0.914 | 0.872 | 0.826 | 0.787 | 0.746 | 0.652 | 0.613 | 0.735 | 0.633 | 0.769 | 0.097 |
| Yangtze River Delta port group | 0.881 | 0.878 | 0.917 | 0.854 | 0.843 | 0.914 | 0.912 | 0.918 | 0.862 | 0.858 | 0.925 | 0.888 | 0.029 |
| Southeast Coastal port group | 0.411 | 0.420 | 0.504 | 0.443 | 0.430 | 0.438 | 0.750 | 0.479 | 0.512 | 0.742 | 0.601 | 0.521 | 0.118 |
| Pearl River Delta port group | 0.743 | 0.709 | 0.758 | 0.766 | 0.776 | 0.866 | 0.843 | 0.835 | 0.896 | 0.889 | 0.854 | 0.812 | 0.061 |
| Southwest Coastal port group | 0.565 | 0.579 | 0.856 | 0.859 | 0.606 | 0.844 | 0.844 | 0.810 | 0.592 | 0.688 | 0.689 | 0.721 | 0.117 |
| Period | GM | GMEC | GMTC |
|---|---|---|---|
| 2013–2014 | 0.992 | 1.254 | 0.864 |
| 2014–2015 | 0.988 | 0.966 | 1.037 |
| 2015–2016 | 0.991 | 0.929 | 1.103 |
| 2016–2017 | 0.997 | 1.155 | 0.915 |
| 2017–2018 | 1.048 | 1.070 | 1.035 |
| 2018–2019 | 0.972 | 0.916 | 1.094 |
| 2019–2020 | 1.092 | 0.951 | 1.148 |
| 2020–2021 | 1.050 | 1.159 | 0.957 |
| 2021–2022 | 1.085 | 0.980 | 1.176 |
| Mean | 1.024 | 1.042 | 1.037 |
| Port Group | 2013/2014 | 2014/2015 | 2015/2016 | 2016/2017 | 2017/2018 | 2018/2019 | 2019/2020 | 2020/2021 | 2021/2022 | Mean |
|---|---|---|---|---|---|---|---|---|---|---|
| Bohai Sea port group | 0.967 | 1.001 | 1.012 | 0.877 | 1.123 | 0.857 | 0.984 | 1.020 | 1.043 | 0.987 |
| Yangtze River Delta port group | 0.956 | 0.951 | 1.029 | 1.075 | 0.991 | 1.018 | 0.941 | 1.100 | 1.203 | 1.029 |
| Southeast Coastal port group | 1.026 | 0.974 | 0.987 | 1.012 | 1.012 | 1.132 | 1.102 | 1.048 | 1.027 | 1.036 |
| Pearl River Delta port group | 1.039 | 1.008 | 1.000 | 1.058 | 0.955 | 1.059 | 1.516 | 0.967 | 1.043 | 1.072 |
| Southwest Coastal port group | 1.023 | 0.994 | 0.892 | 1.070 | 1.081 | 0.979 | 1.069 | 1.131 | 1.091 | 1.037 |
| Period | Total | Intraregional | Interregional | Intensity of Transvariation | Subgroup | ||||
|---|---|---|---|---|---|---|---|---|---|
| 1 | 2 | 3 | 4 | 5 | |||||
| 2013 | 0.194 | 0.035 | 0.102 | 0.057 | 0.120 | 0.093 | 0.069 | 0.208 | 0.279 |
| 2014 | 0.129 | 0.021 | 0.064 | 0.044 | 0.066 | 0.072 | 0.116 | 0.166 | 0.125 |
| 2015 | 0.145 | 0.025 | 0.058 | 0.062 | 0.084 | 0.104 | 0.098 | 0.162 | 0.123 |
| 2016 | 0.177 | 0.033 | 0.083 | 0.062 | 0.119 | 0.116 | 0.076 | 0.156 | 0.228 |
| 2017 | 0.159 | 0.032 | 0.068 | 0.059 | 0.175 | 0.075 | 0.090 | 0.083 | 0.138 |
| 2018 | 0.143 | 0.030 | 0.043 | 0.070 | 0.158 | 0.077 | 0.167 | 0.097 | 0.139 |
| 2019 | 0.182 | 0.034 | 0.096 | 0.051 | 0.204 | 0.071 | 0.015 | 0.111 | 0.162 |
| 2020 | 0.194 | 0.037 | 0.106 | 0.050 | 0.233 | 0.101 | 0.017 | 0.087 | 0.143 |
| 2021 | 0.165 | 0.036 | 0.052 | 0.077 | 0.207 | 0.099 | 0.174 | 0.093 | 0.111 |
| 2022 | 0.184 | 0.036 | 0.091 | 0.056 | 0.218 | 0.065 | 0.058 | 0.128 | 0.171 |
| Mean | 0.167 | 0.032 | 0.076 | 0.059 | 0.159 | 0.087 | 0.088 | 0.129 | 0.162 |
Disclaimer/Publisher’s Note: The statements, opinions and data contained in all publications are solely those of the individual author(s) and contributor(s) and not of MDPI and/or the editor(s). MDPI and/or the editor(s) disclaim responsibility for any injury to people or property resulting from any ideas, methods, instructions or products referred to in the content. |
© 2025 by the authors. Licensee MDPI, Basel, Switzerland. This article is an open access article distributed under the terms and conditions of the Creative Commons Attribution (CC BY) license (https://creativecommons.org/licenses/by/4.0/).
Share and Cite
Zhang, J.; Gu, G. An Evaluation of Port Environmental Efficiency Considering Heterogeneous Abatement Capacities: Integrating Weak Disposability into the Epsilon-Based Measure Model. J. Mar. Sci. Eng. 2025, 13, 2064. https://doi.org/10.3390/jmse13112064
Zhang J, Gu G. An Evaluation of Port Environmental Efficiency Considering Heterogeneous Abatement Capacities: Integrating Weak Disposability into the Epsilon-Based Measure Model. Journal of Marine Science and Engineering. 2025; 13(11):2064. https://doi.org/10.3390/jmse13112064
Chicago/Turabian StyleZhang, Jiewei, and Gaofeng Gu. 2025. "An Evaluation of Port Environmental Efficiency Considering Heterogeneous Abatement Capacities: Integrating Weak Disposability into the Epsilon-Based Measure Model" Journal of Marine Science and Engineering 13, no. 11: 2064. https://doi.org/10.3390/jmse13112064
APA StyleZhang, J., & Gu, G. (2025). An Evaluation of Port Environmental Efficiency Considering Heterogeneous Abatement Capacities: Integrating Weak Disposability into the Epsilon-Based Measure Model. Journal of Marine Science and Engineering, 13(11), 2064. https://doi.org/10.3390/jmse13112064


