Abstract
This paper presents a 16 MW typhoon-resistant Tension Leg Platform floating offshore wind turbine (TLP FOWT) designed for the South China Sea. The survivability of the TLP FOWT under extreme environmental conditions is investigated through an integrated time-domain coupled analysis numerical model. The accuracy of the numerical model is calibrated by comparing its results with experimental data. In comparisons of mooring system static stiffness tests and white noise tests, the results from the calibrated numerical model show good agreement with the experimental data. Regarding the free decay tests and the statistical time-domain response results, the most significant discrepancies are only 1.17% and 6.91%, respectively. Subsequently, the time-domain response of the numerical model was investigated under extreme South China Sea conditions, configured according to the IEC 61400-3-2 design load conditions. The safety of the design was then evaluated against ABS specifications. The analysis yielded maximum platform motion amplitudes and inclinations of 34.99 m (less than 30% of water depth) and below 1°, respectively. Under both 50-year and 500-year return period conditions, the platform maintained stable TLP motion characteristics with no tendon slackness, evidenced by a minimum tendon tension of 107.23 kN. All motion responses and tendon tensions complied with the ABS safety factors, confirming the design’s capability to ensure safe operation throughout its service life. The present work provides valuable insights for the design and risk assessment of future large-scale TLP FOWTs.
1. Introduction
The global demand for clean, renewable energy has driven the rapid expansion of offshore wind power, as offshore regions offer more consistent wind speeds and avoid land-use conflicts associated with onshore installations [1,2,3]. Conventional fixed-bottom offshore wind turbines, however, are economically and technically limited to water depths below 50 m; beyond this range, their foundation costs surge exponentially, restricting access to the vast deep-water wind resources that account for over 75% of global offshore wind potential [4,5,6]. This limitation has spurred the development of floating offshore wind turbine (FOWT) systems, with tension leg platforms (TLPs) emerging as a standout concept due to their unique motion stability and structural efficiency. Adapted from mature offshore oil and gas technology, TLPs use taut, pretensioned tendons to constrain vertical (heave) and rotational (pitch/roll) motions—critical for maintaining wind turbine aerodynamic performance and reducing fatigue loads on towers, blades, and nacelles [7].
Early FOWT demonstrations, such as the spar-buoy Hywind system, validated floating wind technology, but TLPs address key shortcomings of other floating concepts (e.g., semi-submersibles, barges) by minimizing motions without requiring excessive ballast or deep drafts. For instance, Zhao et al. [7] proposed the multi-column WindStar TLP, a lightweight design with a displacement of 5466 ton that maintains stability in 160 m water depth, outperforming heavier mono-column TLPs in both cost and efficiency. As the offshore wind industry targets deeper waters (100–200 m) and larger turbines (5–15 MW), TLPs have become a focus of research, with studies exploring mooring optimization, load coupling, and extreme condition resilience to unlock their commercial potential [8].
Contemporary TLP FOWT research prioritizes optimizing hull geometry, mooring systems, and load-coupling models to enhance performance and reduce costs. Zhao et al. [7] developed the WindStar TLP with three corner columns and a central tower-mounted column, achieving a pitch natural frequency of 0.248 Hz—strategically positioned between the NREL 5 MW turbine’s 1P and 3P frequencies to avoid resonance. Ren et al. [6] further improved TLP stability by adding mooring chains to the tendon system, reducing surge displacement by 40% and tendon tension fluctuations by 20% in 1:60 scale wind-wave tunnel tests. These design innovations address the core challenge of balancing stiffness and flexibility to mitigate wave and turbine-induced loads.
A critical focus of current research is capturing the complex coupled dynamics of TLP FOWTs, which involve interactions between wind-induced aerodynamic loads, wave hydrodynamics, and mooring structural responses. Bae and Kim [9] highlighted the importance of second-order sum-frequency wave loads, showing that these loads can excite TLP natural frequencies to cause resonance, increasing pitch accelerations by 27% and tendon tensions by 7–10% compared to linear wave models. Model testing remains essential to validate numerical models and resolve scaling challenges in TLP FOWT design. Oguz et al. [10] conducted 1:36.67 scale tests of the Iberdrola TLPWIND concept using a software-in-the-loop approach, where a modified FAST code calculated real-time aerodynamic thrust, and a fan applied these loads to the model. This method resolved Reynolds number mismatches (a common issue with scaled rotors) and confirmed that the TLP’s surge natural period avoided wave resonance, aligning with numerical predictions. Song and Lim [11] used 1:200 scale tests in a wave flume to evaluate a modified TLP with additional mooring lines, finding that the design reduced wave-induced surge acceleration by 30% and platform loads by 25%—validated via modified Morison equations for wave force calculation. Walia et al. [12] further advanced experimental validation by comparing 1:50 scale tank tests of the GICON®-TLP with OpenFAST simulations. Their results showed good agreement in natural frequencies (e.g., surge: 0.021 Hz experimental vs. 0.0213 Hz numerical; heave: 0.97 Hz experimental vs. 1.02 Hz numerical), emphasizing the need for calibrated damping matrices to account for viscous effects neglected in potential flow models. Similarly, studies like [13] focused on irregular wave conditions, showing that TLP motion response amplitude operators (RAOs) in irregular seas are 15–20% lower than in regular waves due to wave energy dispersion. The cited literature underscores two critical requirements: firstly, numerical models must be calibrated against experimental data to ensure computational accuracy, and secondly, they must possess comprehensive functionality to guarantee result reliability. As such, this study first establishes a fully functional numerical model capable of simulating wind–wave–current coupling, which is subsequently calibrated against experimental data.
Tendon systems are the backbone of TLP stability, and current research addresses their reliability under operational, extreme, and failure scenarios. Wu et al. [14] simulated one-tendon failure in the WindStar TLP, finding that transient responses (e.g., pitch acceleration, adjacent tendon tension) under operational conditions exceeded 50-year extreme values, highlighting the need for accidental limit state (ALS) design. They also noted that turbine shutdown strategies—often assumed to mitigate loads—could increase adjacent tendon tensions by 10% if blade pitching is abrupt, underscoring the importance of coordinated control. Complementary research [15] explored progressive tendon failure, showing that self-stable TLP designs with optimized ballast can survive up to two tendon failures without capsizing, provided mooring pretension is balanced across remaining tendons. Extreme wave conditions, such as 50-year return period storms, are another key focus. Studies like [16] used computational fluid dynamics (CFD) to model nonlinear wave-tendon interactions in 15 MW TLPs, revealing that wave breaking increases tendon tensions by 18% due to impulsive loads—information critical for ultra-large turbine TLP design. For intermediate water (70–100 m), ref. [17] proposed a compact TLP with shortened tendons, showing that this design reduces tendon material costs by 25% while maintaining motion stability, expanding TLP applicability to shallower deep-water regions. Given that relevant research findings highlight the critical importance of tendon failure conditions, this study also incorporates tendon failure scenarios in the analysis of the TLP’s performance under extreme environments.
As wind turbines scale to 10–15 MW, TLP designs are evolving to accommodate increased loads. Kim et al. [18] presented a 1:60 scale model of a DTU 10 MW TLP, showing that the platform requires 30% higher tendon pretension to counteract increased rotor thrust, but benefits from reduced specific costs (cost per MW) due to economies of scale. Boo et al. [19] proposed a 15 MW TLP with a hexagonal hull and synthetic tendons, achieving a 12% reduction in displacement (6200 ton vs. 7000 ton for steel-tendon designs) and a 15% increase in fatigue life, leveraging polyester tendons’ corrosion resistance. Innovative concepts like fully flexible tendons [20] and smooth particle hydrodynamics (SPH) modeling [17] are also emerging. Ran et al. [20] demonstrated that flexible tendons reduce dynamic tension fluctuations by 40% compared to rigid tendons, while Tagliafierro et al. [17] used SPH to capture wave slamming on TLP columns—an effect that increases platform loads by 20% in extreme seas but is often neglected in potential flow models. Finally, [21] synthesized these advancements, identifying standardization (e.g., TLP-specific IEC 61400-3 guidelines) and cost reduction (e.g., self-installation methods) as key enablers for commercial TLP FOWT deployment. Compared to the TLP wind turbines mentioned in the aforementioned literature, the TLP floating wind turbine designed in this study features a larger individual capacity, therefore requiring a more robust design to ensure survivability under extreme environmental loads.
Current research also explores specialized TLP designs for unique environments and applications. Zhou et al. [22] proposed a cantilevered TLP for offshore wind-solar hybrid systems, showing that the extended deck (for solar panels) increases pitch stiffness by 10% without compromising motion stability. Li et al. [23] focused on shallow water hydrodynamics, finding that TLP added mass in heave is 15% higher in shallow waters due to seabed reflection, requiring adjusted tendon stiffness to maintain natural frequency targets. Liu et al. [24] introduced a tapered tendon design, reducing weight by 20% while maintaining breaking strength, a critical innovation for cost-sensitive projects. For tension load analysis, Mazarakos et al. [25] developed a probabilistic model to predict tendon tension extremes, showing that combining wind-wave loads increases the 50-year tension exceedance probability by 12% compared to wave-only loads—essential for safety factor calibration. Martynowicz et al. [26] provided a comprehensive dataset for the NREL 5 MW TLP, including load spectra and motion statistics, serving as a benchmark for future design optimization. These studies establish the research context for specialized TLP development and help highlight the innovation of our work in addressing the 16 MW ultra-large capacity challenge.
The main purpose of this study is to investigate the motion performance of a newly designed typhoon-resistant 16 MW TLP FOWT under extreme environmental conditions in the South China Sea. The numerical model developed in OrcaFlex is illustrated in Figure 1. A key advantage of the present numerical model lies in its fully coupled aero-hydro-servo-elastic formulation in the time domain. By adopting a virtual reverse reconstruction method for wind turbines, this study achieves a truly fully coupled analysis of FOWT systems in practical engineering applications [27]. This represents a significant advancement over conventional industry practices, where wind turbine and platform designs are typically decoupled and optimized through iterative processes. The high fidelity of the numerical model is ensured through two critical approaches. First, the model is rigorously calibrated against experimental data, effectively addressing inaccuracies inherent in potential flow theory for hydrodynamic calculations. The incorporation of Morison elements accounts for viscous damping effects, thereby enhancing simulation accuracy. Second, slender structural components are modeled using beam elements to capture structural deformation effects on global system responses. This is particularly important for large-capacity FOWTs, where tower flexibility significantly influences natural periods, platform motions, tendon tensions, tower base loads, and nacelle accelerations. The selection of a time-domain approach over frequency-domain methods enables accurate capture of nonlinear load effects [28]. The model advances beyond previous implementations by explicitly incorporating tower flexibility and fully coupled wind–wave–current loading. This foundation ensures the reliability of simulation results for the TLP FOWT’s response under extreme sea states, making the findings applicable for practical engineering design. Future work will utilize this validated model for detailed analysis of tendon vortex-induced vibrations (VIV) and fatigue life.
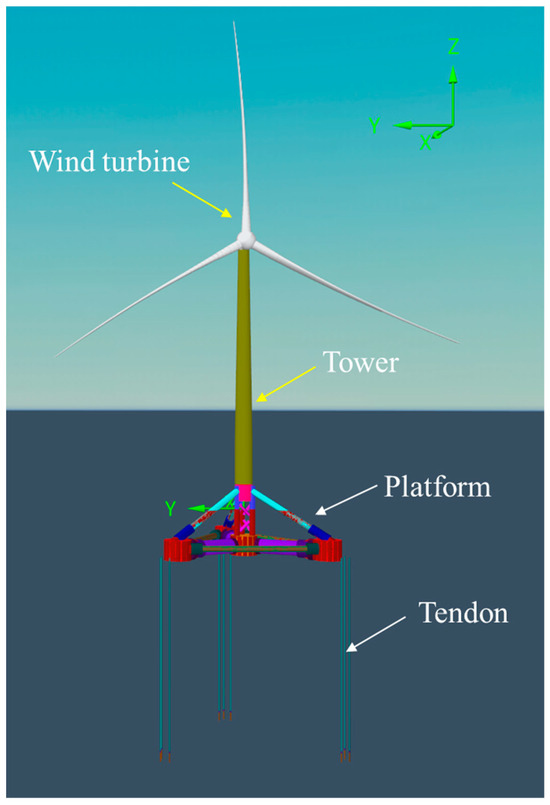
Figure 1.
The time-domain fully coupled model in OrcaFlex.
This study makes distinct contributions to TLP FOWT research. Unlike most existing studies that focus primarily on conceptual designs such as the NREL TLP, the platform and mooring system proposed herein are novel and intended for real-world application. The design, featuring a truss central column and vertical tendons, maintains characteristic semi-compliant and semi-rigid behavior while satisfying all safety factors. Consequently, it provides substantial reference value to the academic community and establishes a practical baseline for future research and development. This paper is structured as follows: Section 2 introduces the relevant calculation theories and the establishment of an integrated time-domain coupled analysis numerical model. In Section 3, the calculation accuracy of the numerical model is verified using experimental data, which ensures the reliability of subsequent analysis results. In Section 4, the motion performance and tension response of the TLP FOWT under extreme environmental conditions in the South China Sea are studied. The paper concludes with a discussion of the findings (Section 4), followed by the final Conclusions (Section 5).
2. Theories and Models
2.1. Load Calculation Theory
2.1.1. Motion Equation of FOWTs
The nonlinear system of an FOWT consists of four parts: the wind turbine, the tower, the floating platform, and the mooring system. Therefore, the expression of the nonlinear coupled time-domain motion equation for the FOWTs system can be written as follows [14]:
In the equation, represents the inertial mass matrix of the floating wind turbine system, where i, j = 1, 2, 3, …, 6. is the acceleration vector of the system in the j-th degree of freedom, denotes the aerodynamic load vector acting on the FOWT, stands for the hydrodynamic load vector of the floating platform, and is the mooring load vector.
2.1.2. Aerodynamic Loads
In the time-domain numerical model of this paper, the Blade–Element Momentum (BEM) theory is employed to calculate the aerodynamic loads. The thrust and torque endured by the floating wind turbine can be approximately calculated using the following expressions. For a detailed account of the aerodynamic load calculation of the wind turbine, reference can be made to document [29].
In the equations, and are the lift coefficient and drag coefficient, respectively, is the angle of attack, denotes the air density, represents the relative wind speed, and are the axial induction factor and tangential induction factor, respectively, c stands for the airfoil chord length, B is the number of blades, r is the distance from the blade section to the blade root, is the radial length of the blade section, and is the rotational angular velocity of the wind rotor.
2.1.3. Time-Domain Hydrodynamic Loads
The hydrodynamic loads acting on the floating platform mainly include hydrostatic restoring forces, wave radiation forces, wave-exciting forces, viscous forces, and current forces. Thus, the resultant hydrodynamic load is expressed as [14]:
For the wave-exciting forces, both the first-order wave-exciting force and the second-order wave-exciting force are taken into consideration, and their calculation expressions are, respectively, given as [14]:
In the equations, is the linear impulse response function, is the second-order impulse response function, and represents the wave surface elevation at time τ.
The radiation forces on the floating body are obtained by integrating the fluid pressure over its wetted surface:
In the equation, is the added mass, is the time delay function.
The hydrostatic load comprises two components: hydrostatic buoyancy and hydrostatic restoring force. The hydrostatic buoyancy is derived from Archimedes’ principle, while the hydrostatic restoring force is primarily determined by the waterplane area and the position of the center of buoyancy:
In the equation, is the displacement volume of the floating body at rest, is Kronecker-Delta function, is the linearized hydrostatic restoring matrix.
When calculating the hydrodynamic loads on the platform using potential flow theory, the viscous drag damping force arising from fluid viscosity is not accounted for, thus requiring further correction. According to Morison’s equation, the viscous damping force acting on the columns is proportional to the square of the relative velocity between the fluid and the structural motion, as well as the viscous damping coefficient. It can be specifically expressed as:
In the equation, A represents the projected area of the structure in the calculated direction, u denotes the undisturbed fluid particle velocity obtained from potential flow theory, is the velocity of the floating body at the calculated position, is the viscous damping coefficient.
The action of currents on the floating body is simplified as a drag force, which can be approximated using Morison’s equation by replacing the current velocity with the velocity of wave particles.
2.1.4. Dynamic Mooring Loads
There are mainly two methods for calculating mooring loads: the static method and the dynamic method. The static method primarily relies on the catenary theory, while the dynamic methods include the lumped mass method, the finite element method, and so on. The dynamic methods can take into account the inertial forces and drag forces of the mooring lines, thereby yielding more accurate calculation results. In the numerical model of this paper, the lumped mass method is adopted to model the mooring lines of the TLP FOWT. The principle of this method involves dividing the mooring line into n uniformly sized massless segments, which are connected using n + 1 nodes with mass. The mass of each element is evenly distributed to its adjacent nodes. The motion equation of the i-th node of the mooring line is as follows [14]:
Among them, is the mass matrix, is the added mass matrix, and are the normal and tangential drag forces of node i, respectively. represents the gravity of each node in water. denotes the axial tension of the mooring line within each element, and is the damping force.
2.2. Numerical Model
2.2.1. Implementation of Fully Coupled Model in Engineering
In the practical engineering design of FOWTs, the wind turbine and tower are designed by wind turbine manufacturers, while the floating platform and mooring system are designed by offshore engineering companies. Neither of these two companies’ shares their numerical models with the other, making it difficult to achieve full-coupled calculations for FOWTs. A common practice in practical engineering is to perform decoupled analysis between the upper wind turbine and the floating foundation.
To enable integrated coupled analysis of wind, wave, and current in practical engineering applications, Jia et al. [27] proposed a virtual reverse reconstruction method for wind turbines. This method reconstructs key parameters of the wind turbine blades and control system by performing trend fitting on various parameters. During the fitting process, all trend lines are represented by the function , where y is the dependent variable, x is the independent variable, and α and m are dimensionless fitting coefficients determined using the least squares method. Finally, Bézier curves are employed to achieve a smooth parametric representation of the blade geometry. By combining the virtually reverse-reconstructed wind turbine with the floating platform and mooring system designed by offshore engineering companies, full-coupled analysis can be realized in the practical engineering. In this paper, the publicly available IEA-15MW wind turbine is used as a prototype for scaling to obtain a 16 MW wind turbine. The parameters of the 16 MW wind turbine are shown in Table 1.

Table 1.
Information of the wind turbine and the tower.
2.2.2. Introduction of Floating Platforms and Mooring Systems
In this paper, OrcaFlex 11.4 software is used to conduct time-domain full-coupled analysis of the TLP FOWT, and the numerical model is shown in Figure 1. The structure of the platform is shown in Figure 2. The shape of the floating platform is triangular and has four cylindrical floaters, among which three are located at the corners of the triangle, and one is positioned at the center. The function of a floater is to provide buoyancy for the platform. The cylindrical floaters are interconnected via lateral braces, inclined braces, and radial pontoons. The central column is designed as a truss structure. The design parameters of the floating platform are presented in Table 2. The truss structure adopted for the central column of the platform has the following advantages:
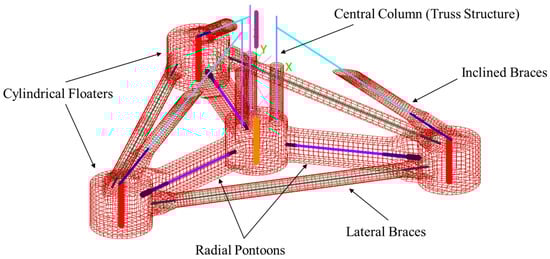
Figure 2.
Time-domain model of platform in OrcaFlex.
Table 2.
Platform dimensions.
- Under the action of waves, the truss column exhibits a “water-permeable” effect, thus bearing smaller wave loads.
- The truss structure has a small wetted surface near the water surface, leading to low contribution of second-order sum–frequency wave loads, which effectively avoids the occurrence of springing and ringing. At the same time, the small wetted surface also results in small changes in the platform’s displacement caused by tidal level variations, and the mooring tension is insensitive to tidal level changes, which reduces the design difficulty.
The TLP FOWT is fixed to the seabed through three groups of taut mooring lines, with each group consisting of three mooring lines, totaling 9 mooring lines. The tendon properties are summarized in Table 3. The angular spacing between each group of mooring lines is 120°. To maintain zero offset and zero inclination in the static equilibrium state, the pretension of all 9 mooring lines is evenly distributed. All 9 mooring lines are designed to be perpendicular to the seabed. Each mooring line will be made up of steel spiral strand wire rope segments, a mooring connecting arm, and mooring connectors between them. A cable stopper is used at the connection between the upper part of each mooring line and the fairlead of the floating platform to adjust the length of the mooring line. The numbering of the 9 mooring lines and the coordinate system setting of the floating platform are shown in Figure 3. In the coordinate system of the floating platform, the positive direction of the x-axis corresponds to mooring lines numbered 1,2,3. The incident direction of wind, waves and currents along the positive x-axis is defined as 0°, and other angles are specified in the counterclockwise direction.
Table 3.
Tendon system for 16 MW platform.
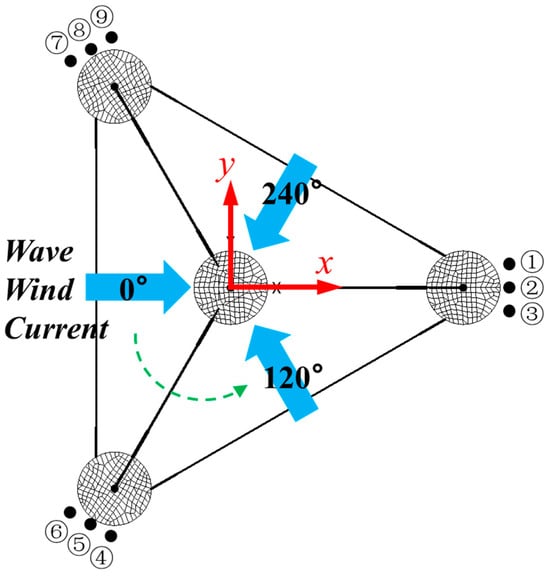
Figure 3.
Mooring number and platform coordinate system settings.
2.2.3. Modeling of FOWT
In the numerical model, the blades and tower are modeled using beam elements to account for structural deformation. Components such as the nacelle and hub are simplified as rigid bodies, considering only their mass and inertia. As the size of floating wind turbines increases, the deformation of the tower has a progressively more significant impact on the dynamic response. Therefore, in this study, the deformation of the tower during motion is considered to improve simulation accuracy. The wind field for numerical calculations is generated using TurbSim v2, and aerodynamic loads are computed based on the BEM method. The anchor is not explicitly modeled in the numerical simulations. The lower end of the tendon is set as fixed and located above the mudline of the seabed, and the upper end is connected to the fairlead of the platform. The tendon is discretized into elements with a length of 1 m, and hydrodynamic loads on the tendon are calculated using the Morison equation. The hydrodynamic parameters of the floating platform are obtained by conducting three-dimensional diffraction and radiation analysis in the frequency domain using the WADAM v9.2 program. In the OrcaFlex model, potential flow theory is used to calculate the platform’s hydrodynamic loads. However, since it does not account for fluid viscosity, Morison elements are incorporated into the time-domain model to capture its effects, as shown in Figure 2. The parameter settings of the Morison elements are calibrated using wave tank test data. In the time-domain calculation, both the first-order and second-order wave excitation forces on the platform are considered.
Since time-domain simulations are performed in OrcaFlex, it is essential to address the appropriateness of the time step [28]. With these details, the reliability of the time-domain responses under extreme conditions is deemed credible. A convergence study was conducted by testing different time steps of 0.05 s, 0.1 s, 0.2 s, and 0.5 s, with a focus on the surge motion of the platform. As illustrated in Figure 4, all the selected time steps ensure numerical stability in the computational results. Therefore, the time step of 0.1 s adopted in this study is considered appropriate and satisfies the convergence requirement.
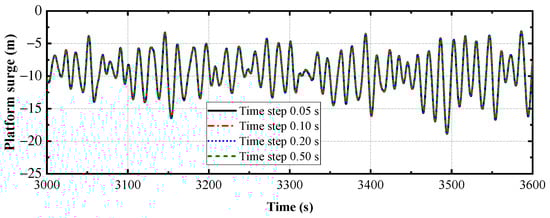
Figure 4.
Verification of temporal step size.
3. Validation of Numerical Model
3.1. Tank Test Setup
The basin model test has been carried out in the Ocean Engineering Water Tank of Shanghai Jiao Tong University, with dimensions of 50 × 30 × 6 m. The wave basin model of the FOWT is designed and built to preserve Froude number similitude with a scale ratio of 1:60. A multi-drive aerodynamic load simulator is used to model time-independent wind force, as shown in Figure 5. Due to the natural period of TLP is affected by tower and rotor–nacelle assembly (RNA). Thus, a flexible tower was used to model the deformation of tower under wind loads. The first-order mode natural period was used as a criterion in the tower and RNA. A photograph of the FOWT model is shown in Figure 6.
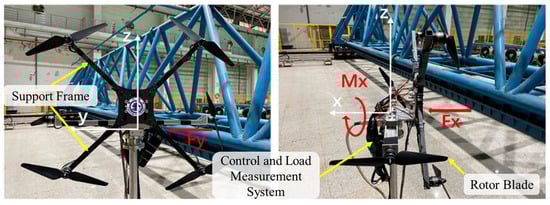
Figure 5.
The multi-channel aerodynamic load simulator.
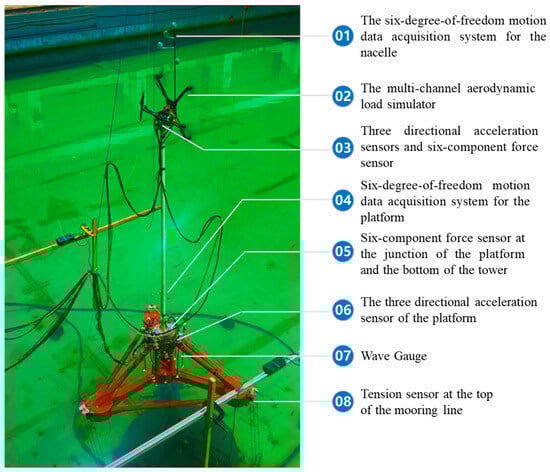
Figure 6.
FOWT basin test model.
3.2. Validation of Numerical Model by Test Model
3.2.1. Mooring Stiffness Comparison
The static offset tests were carried out for the configurations and corresponding mooring systems. Static offset tests are performed in calm water with the model in place and all mooring lines attached. The objective of these tests is to verify that the model has the designed stiffness of the mooring system and correct configuration of the mooring lines. The mooring stiffness checked in surge and sway are shown in Figure 7 and Figure 8. It can be seen from the figures that the mooring stiffness of the numerical model is in good agreement with the test results, indicating that the mooring simplification method and parameter selection in the numerical model are reasonable and can be further used to predict the mooring performance under actual working conditions.
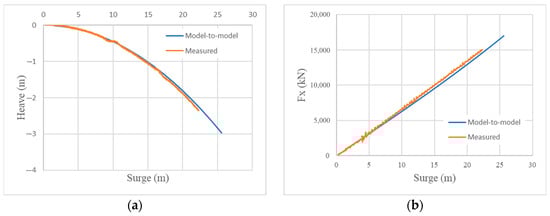
Figure 7.
Mooring stiffness checked in surge: (a) results of set-down; (b) results of .
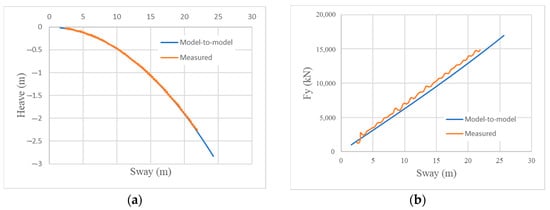
Figure 8.
Mooring stiffness checked in sway: (a) results of set-down; (b) results of .
3.2.2. Free Decay Comparison
The free decay tests were carried out to verify the natural period of TLP FOWT’s motion and obtain the linear damping coefficient for the viscous part. Initial forces/moments are separately set on the floating foundation for the time series of motions in six degrees of freedom. The results are normalized by the maximum value, as illustrated in Figure 9. The results of the 6-Dofs natural motion periods of the TLP FOWT are presented in Table 4. As can be seen from the table, the roll/pitch period of the model test is approximately 34 s, and the heave period is about 2 s. These natural motion periods avoid the main frequency range of waves and comply with the design standards for the natural period of TLP, thus ensuring good motion performance of the platform. In addition, the natural motion periods also stay clear of the main excitation load range of the wind turbine (avoiding the 1P and 3P frequencies of the wind turbine), which indicates that there is no resonance phenomenon between the wind turbine and the floating platform structure under operating conditions. The maximum error between the numerical results and the experimental results is 1.17%, and the overall agreement is good, which proves that the numerical model is relatively accurate in modeling. The decay rate of the curve in the experiment differs slightly from the numerical simulation results. This discrepancy arises because the damping simulation settings for the platform and mooring system in the numerical model still differ somewhat from the real-world experiment. Nevertheless, the difference is well within the acceptable range.
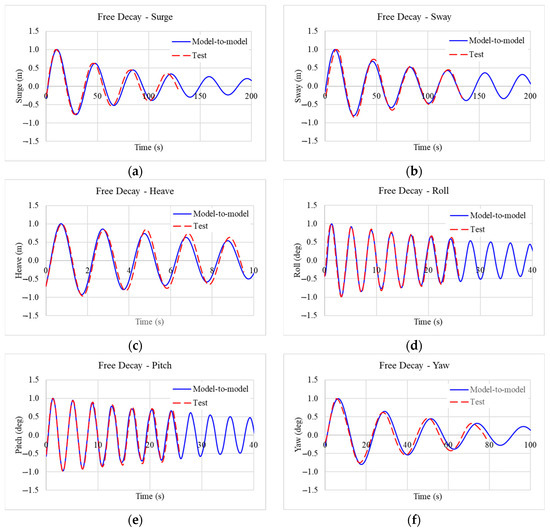
Figure 9.
Time series of free decay in six degrees of freedom: (a) surge; (b) sway; (c) heave; (d) roll; (e) pitch; (f) yaw.
Table 4.
Comparison of the value of the free decay period with the test results.
3.2.3. White Noise Comparison
The white noise tests were carried out to verify the RAO of TLP FOWT’s mooring line tensions. The comparison of each line tension by numerical results and measurement under the condition of white noise is conducted, respectively. According to the basin capability of wave generation, the range of wave frequency of 0.04 hz~0.2 hz is considered. The results of line 1, line 5 and line 7 are shown in Figure 10.
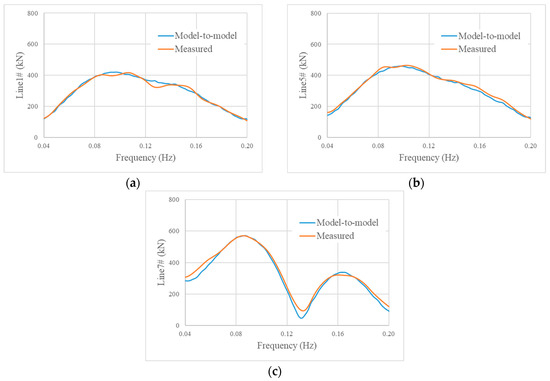
Figure 10.
RAO of Line Tension under White Noise Waves.: (a) Line 1; (b) Line 5; (c) Line 7.
3.2.4. Time-Domain Dynamic Load Case Comparison
The analysis shows that a wave direction of 120 degrees produces the most severe results; therefore, this heading under a 50-year tropical cyclone condition is selected for presentation. The extreme metocean conditions are defined based on the main extreme of wind, current, and wave parameters: the 10 min average wind speed at hub height is 59.9 m/s, the current speed is 2.03 m/s, the Hs is 12.7 m, the Tp is 14.7 s, the spectral shape parameter is 2.4, and the Hmax is 21.2 m. Six random wave seeds are then selected based on the Hmax from the corresponding test case, with the constraint that the absolute difference between the simulated and tested Hmax does not exceed 1%. A comparison of numerical and test results for the time-domain response parameters—Tendon Tension, Offset, and Set-Down statistical values—is presented in Table 5. The results from both methods demonstrate good overall agreement, with the most significant discrepancy observed in the relative error (6.91%) of the STD for Offset.
Table 5.
Comparison of statistical values.
4. Results and Discussion
4.1. Design Load Cases
The main work content in this section is to calculate the motion response of the 16 MW TLP FOWT under extreme environmental conditions and analyze whether the design scheme meets the design standards required by the ABS specification [30]. The setting of extreme environmental conditions adopts the design load conditions specified in IEC 61400-3-2 [31]. The descriptions of each condition are as follows:
DLC 6.1 primarily evaluates the security ability of FOWT under 50-year extreme environmental conditions. In this condition, the mooring system remains intact, and the wind turbine is in a parked state.
DLC 6.2 primarily evaluates the security ability of FOWT under 50-year extreme environmental conditions in the event of a loss of the electrical network. In this condition, the mooring system remains intact, and the wind turbine is parked.
DLC 10.2 primarily evaluates the security ability of FOWT under 50-year extreme environmental conditions in the event of a loss of the electrical network, with the mooring system experiencing a one-line failure and the wind turbine in a parked state. The cases of DLC 10.2 are derived from the critical cases identified in DLC 6.1.
SLC is employed to assess the robustness and safety performance of the FOWT under 500-year extreme environmental conditions. In this case, the mooring system remains intact, and the wind turbine is parked.
The environmental data adopts the Marine and climate environmental monitoring data of the South China Sea. In the time-domain calculation, all DLCs account for 16 incident wave directions with an angular interval of 22.5° (Figure 3) and 3 h simulations are used for each load case to obtain the results. For every load case 6 seeds are used to calculate the average amount.
4.1.1. Wave Spectrum
Typhoon-driven seas can be reasonably represented by a JONSWAP spectrum. Default values for the JONSWAP spectrum are listed below:
- = 0.07, ;
- = 0.09, ;
- = 2.4 ± 0.3
The central value of = 2.4 is applied for most storms.
4.1.2. Requirement for Mooring Line Maximum Tension
The mooring line tension shall be limited by the safety factor, S:
where T is the line pretension; MBS is the characteristic strength of the mooring line segment. The Safety Factor of the ABS specification is shown in Table 6.
Table 6.
Safety factors for steel mooring lines or tendons in ABS specification.
4.2. Platform Motion and Mooring Tension Response
4.2.1. DLC 6.1
The maximum offset and maximum inclination of the platform under the DLC6.1 are shown in Figure 11. As can be seen from the figure, the platform exhibits the largest offset and inclination when wind, waves, and currents incident at an angle of 157.5°. Specifically, the maximum offset of the platform is 23.17 m, which does not exceed 30% of the water depth (the water depth is 136 m), and the maximum inclination of the platform is 0.71°, which is less than 1°. TLP possesses the characteristic of being semi-compliant and semi-rigid: Due to the large pretension, the out-of-plane motions of TLP (roll, pitch, and heave) are small, showing an approximately rigid behavior. However, the in-plane motions of TLP (surge, sway, and yaw) are relatively significant, presenting a compliant behavior. The results in Figure 11 indicate that the TLP mainly undergoes horizontal motions and barely produces rotation under extreme sea conditions. This demonstrates that the TLP still maintains the semi-compliant and semi-rigid characteristic under extreme environmental conditions, thus proving that the design of parameters such as pretension and displacement of the TLP is relatively reasonable.
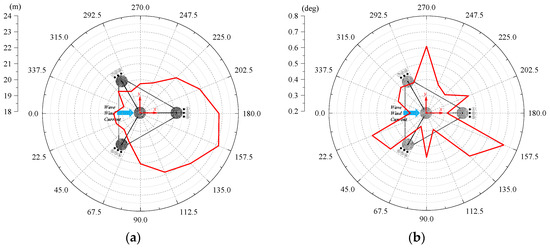
Figure 11.
The distribution of the platform movement maximum values in 16 directions for DLC 6.1: (a) Platform offset; (b) Platform inclination.
In addition, it can also be observed from the figure that when the incident angle of wind, waves, and currents ranges from 90° to 225°, the offset of the platform is relatively obvious. Nevertheless, the distribution of the maximum inclination with the incident angle shows no obvious regularity.
Figure 12a shows the variation of the maximum tension at the platform fairlead with the incident angle. It can be seen from the figure that when the incident angle of wind, waves, and currents is 135°, the mooring tension at the fairlead reaches its maximum value of 13,607.30 kN. The designed minimum breaking load of the mooring system is 25,000 kN. Therefore, the safety factor calculated using Equation (6) is 1.85, which is greater than the 1.75 required by the ABS specification.
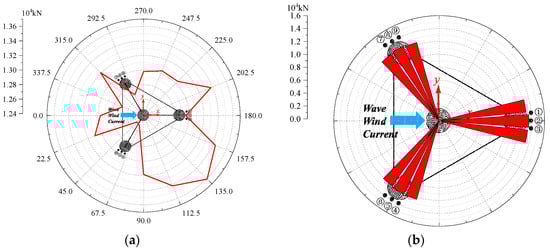
Figure 12.
The maximum mooring tension at the fairlead of the platform for DLC 6.1: (a) The maximum mooring tension is distributed with the incident angle; (b) Tension distribution of 9 mooring lines in the 135° incident direction.
Figure 13a presents the variation of the minimum tension at the line base with the incident angle. As observed from the figure, when the incident angle of wind, waves, and currents is 112.5°, the mooring tension at the line base is minimized at 653.18 kN. Since the minimum mooring tension is greater than 0, there is no risk of mooring slack under the DLC 6.1 condition. In addition, it can also be seen from the figure that when the incident angle is around 0°, 120°, and 240°, the mooring lines on the leeward side tend to have the minimum mooring tension.
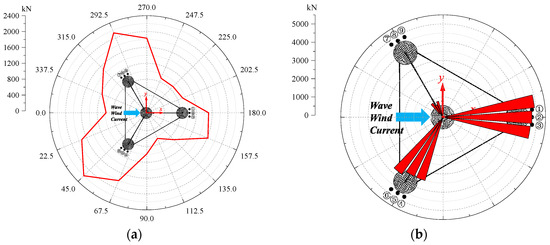
Figure 13.
The minimum mooring tension at the fairlead of the platform for DLC 6.1: (a) The minimum mooring tension is distributed with the incident angle; (b) Tension distribution of 9 mooring lines in the 112.5° incident direction.
Figure 12b illustrates the mooring tension distribution of the 9 mooring lines under the condition of an incident angle of 135°, from which it can be seen that the maximum mooring tension occurs in Line 2. Figure 13b shows the mooring tension distribution of the 9 mooring lines under the condition of an incident angle of 112.5°, and it can be observed that the minimum mooring tension appears in Line 8.
Figure 14 displays the nacelle acceleration results. It is evident from the figure that when the incident angle is 180°, the nacelle acceleration reaches its maximum value of 3.00 m/s2, which is less than 0.4 g and meets the specification requirements.
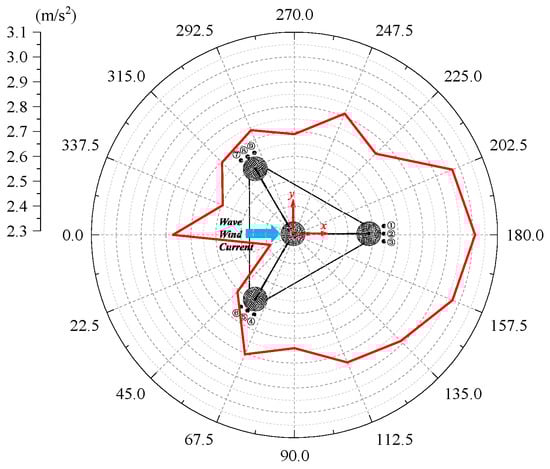
Figure 14.
The distribution of the maximum acceleration of the nacelle with respect to the incident angle for DLC 6.1.
The maximum and minimum mooring tensions, maximum platform offset and inclination, and maximum nacelle acceleration across all incident wave directions under the DLC 6.1 condition are summarized in Table 7.
Table 7.
Summary of important results for DLC 6.1.
4.2.2. DLC 6.2
The results of DLC 6.2 show a similar pattern to those of DLC 6.1. The maximum offset and inclination of the platform also occur at an incident angle of 157.5°. Specifically, the maximum platform offset is 24.82 m, which does not exceed 30% of the water depth, and the maximum platform inclination is 0.68°, which is less than 1°. This indicates that the TLP still maintains its semi-compliant and semi-rigid characteristics under DLC 6.2 (Figure 15).
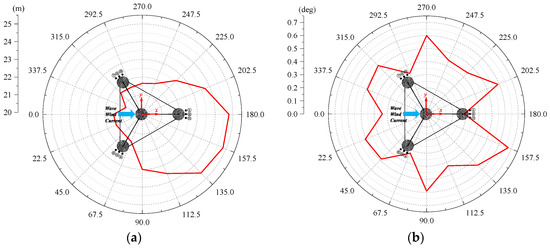
Figure 15.
The distribution of the platform movement maximum values in 16 directions for DLC 6.2: (a) Platform offset; (b) Platform inclination.
When the incident angle of wind, waves, and currents is 202.5°, the mooring tension at the fairlead reaches its maximum value of 14,021.62 kN, with a safety factor of 1.78, which is greater than the 1.75 required by the ABS specification (Figure 16). When the incident angle of wind, waves, and currents is 112.5°, the mooring tension at the line base is minimized at 107.23 kN. Since the minimum mooring tension is greater than 0, there is no risk of mooring slack under the DLC 6.2 condition either (Figure 17). The maximum mooring tension still occurs in Line 2, while the minimum mooring tension appears in Line 8. When the incident angle is 135°, the nacelle acceleration reaches its maximum value of 3.25 m/s2, which is less than 0.4 × g and meets the specification requirements (Figure 18).
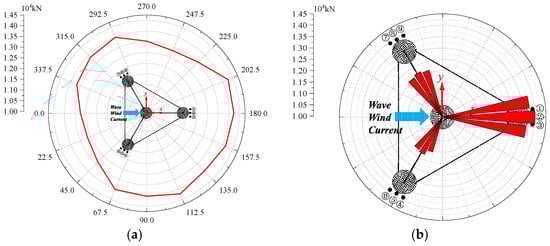
Figure 16.
The maximum mooring tension at the fairlead of the platform for DLC 6.2: (a) The maximum mooring tension is distributed with the incident angle; (b) Tension distribution of 9 mooring lines in the 202.5° incident direction.
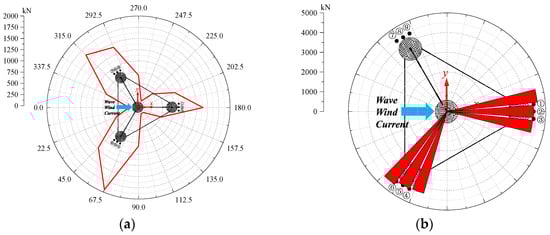
Figure 17.
The minimum mooring tension at the fairlead of the platform for DLC 6.2: (a) The minimum mooring tension is distributed with the incident angle; (b) Tension distribution of 9 mooring lines in the 112.5° incident direction.
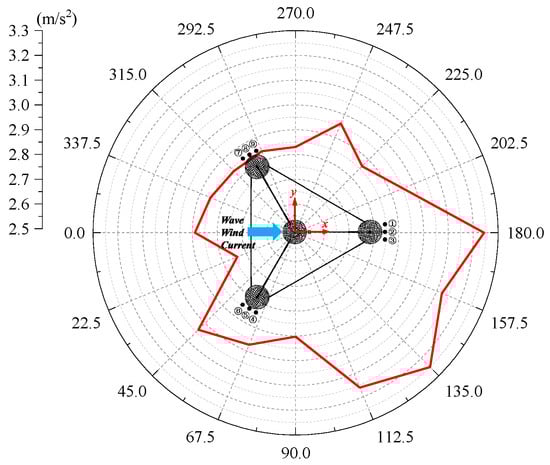
Figure 18.
The distribution of the maximum acceleration of nacelle with respect to the incident angle for DLC 6.2.
The maximum and minimum mooring tensions, maximum platform offset and inclination, and maximum nacelle acceleration across all incident wave directions under the DLC 6.2 condition are summarized in Table 8.
Table 8.
Summary of important results for DLC 6.2.
4.2.3. DLC 10.2
In DLC 6.1, the mooring tension reaches maximum when wind, waves, and currents incident at an angle of 135°, with the maximum value occurring in Line 2. Therefore, in DLC 10.2, it is assumed that Line 2 breaks, and the changes in the platform offset as well as the mooring tensions of Line 1 and Line 3 after the line breakage are observed. The results are presented in Table 9, Figure 19 and Figure 20. It can be seen from the results that after Line 2 breaks, the mooring tensions of Line 1 and Line 3 in the same group change significantly. Among them, Line 1 has the most obvious tension variation, with a change rate of 56.49%, and Line 3 has the maximum mooring tension value. This indicates that Line 3 becomes the most dangerous mooring line after Line 2 breaks.
Table 9.
Changes in mooring tension and platform motion before and after cable breakage.
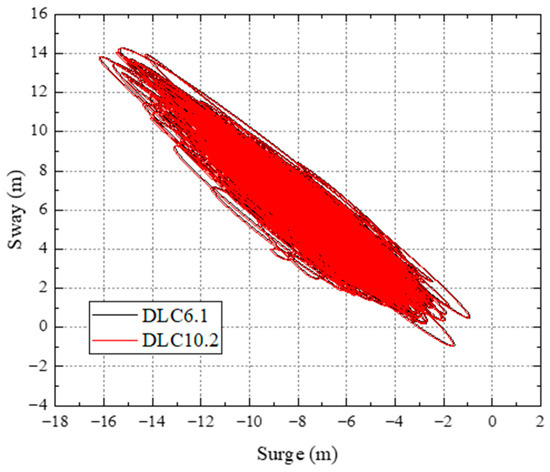
Figure 19.
The movement of the platform in the x-y plane in DLC 10.2.
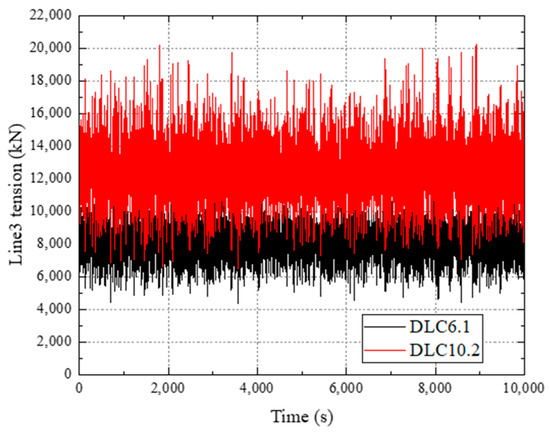
Figure 20.
The tension variation in Line3 in DLC 10.2.
The ABS specification requires the mooring safety factor in DLC 10.2 to be 1.12, while the actually calculated safety factor is 1.21. Thus, the mooring system remains in a safe state. For the mooring lines of the other two groups, their mooring tensions show no significant changes before and after the breakage of Line 2, with the relative change not exceeding 2%. This suggests that the line breakage condition only affects the tensions of adjacent mooring lines within the same group and has little impact on the mooring tensions of other groups. The change in platform motion after the line breakage is also not obvious: the platform offset changes by 0.11%, and the platform inclination changes from 0.57° to 0.73°.
4.2.4. SLC
In the SLC, with wind, waves, and current incident at an angle of 135°, the platform exhibits the maximum offset and inclination angle (Figure 21). The maximum offset is 34.99 m, which is still less than 30% of the water depth, and the maximum inclination is 1.25°. The results indicate that the TLP still maintains its semi-compliant and semi-rigid characteristics even under the 500-year return period extreme condition. When the incident angle of wind, waves, and currents is 135°, the maximum mooring tension at the fairlead is 17,373.03 kN, which occurs in Line 8 (Figure 22). When the incident angle is 112.5°, the minimum mooring tension at the line base is 125.73 kN, also appearing in Line 8 (Figure 23). The ABS specification stipulates that the safety factor for the SLC condition shall not be less than 1.36. The actual safety factor calculated here is 1.44, which is greater than 1.36 and meets the specification requirements. This demonstrates that the mooring system can withstand the 500-year return period extreme sea conditions.
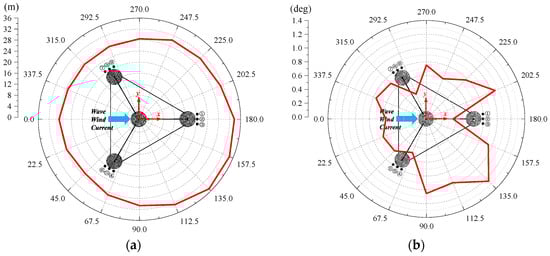
Figure 21.
The distribution of the platform movement maximum values in 16 directions in SLC: (a) Platform offset; (b) Platform inclination.
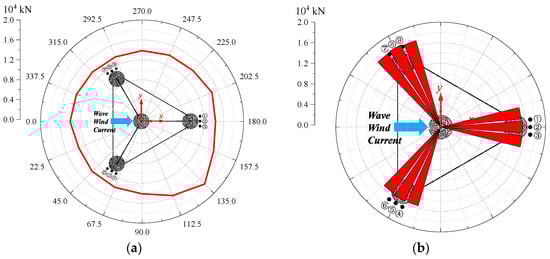
Figure 22.
The maximum mooring tension at the fairlead of the platform in SLC: (a) The maximum mooring tension is distributed with the incident angle; (b) Tension distribution of 9 mooring lines in the 135° incident direction.
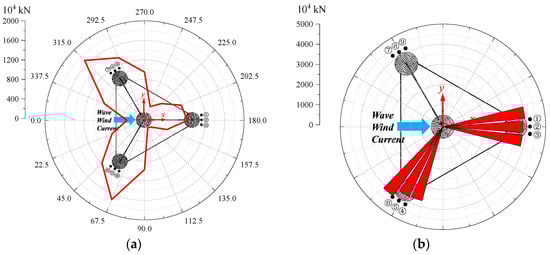
Figure 23.
The minimum mooring tension at the fairlead of the platform in SLC: (a) The minimum mooring tension is distributed with the incident angle; (b) Tension distribution of 9 mooring lines in the 112.5° incident direction.
When the incident angle of wind, waves, and currents is 135°, the nacelle acceleration reaches its maximum value of 6.95 m/s2 (Figure 24).
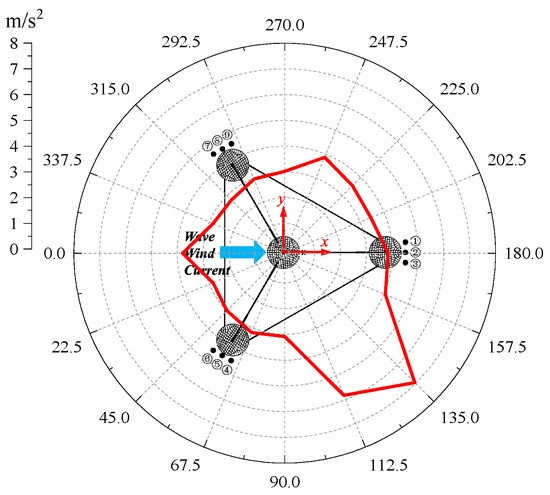
Figure 24.
The distribution of the maximum acceleration of nacelle with respect to the incident angle in SLC.
The maximum and minimum mooring tensions, maximum platform offset and inclination, and maximum nacelle acceleration across all incident wave directions under the SLC condition are summarized in Table 10.
Table 10.
Summary of important results for SLC.
4.3. Discussion
This study has presented a comprehensive numerical model and extreme response analysis for a 16 MW TLP FOWT. While the primary scope is the validation of the model and the assessment of ultimate limit states under extreme conditions, the findings offer broader implications and point toward necessary future work.
- Versatility and Applicability of the Design
A key consideration is the versatility of the proposed TLP design. The fundamental design principles, such as the adoption of a truss structure for the central column to reduce weight and wave loads, represent a transferable innovation. In principle, this design concept can be adapted to support wind turbines of different capacities. However, this adaptation is not a simple geometric scaling. It requires careful recalibration of key parameters, such as the pretension-to-displacement ratio, which would be notably lower for deployments in milder sea conditions than the extreme environment central to this study. Consequently, while the specific quantitative results presented here are tied to the 16 MW turbine and the South China Sea metocean data, the overall design methodology and the validated modeling framework provide a valuable foundation for designing TLPs across a range of turbine sizes and sites.
- Advantages and Innovations of the Proposed Design
This work introduces several distinct advantages in both platform design and numerical modeling. The platform is the first TLP design proposed for a 16 MW turbine intended for practical engineering application. A key innovation is the use of vertical tendons, which, compared to inclined configurations, significantly reduce the risk of tendon slackness and the associated nonlinear snap loads, thereby enhancing the system’s reliability. From a modeling perspective, the key advancements lie in the implementation of a fully coupled aero-hydro-servo-elastic simulation in a practical engineering context. Specifically, the model incorporates the flexibility of the tower by modeling it with beam elements, rather than simplifying it as a rigid body. This, combined with the fully coupled analysis, substantially improves the simulation accuracy of the global dynamic response, providing a more reliable tool for predicting extreme loads [32].
- Scope Regarding Fatigue Analysis
While this paper focuses on extreme loads, the critical importance of fatigue and long-term tendon tension response for TLP systems is acknowledged. A preliminary assessment of tendon fatigue life was conducted, and the results, presented in Table 11, confirm a service life exceeding 1000 years, which comfortably meets the project requirement of 125 years.
Table 11.
Fatigue life assessment of TLP tendons.
5. Conclusions
This study established a fully coupled time-domain analysis model for the TLP FOWT, which integrates the dynamic interactions between the platform, mooring system, and wind turbine components to accurately capture the complex load transmission and motion responses of the entire system. To validate the reliability of this numerical model, experimental data from model tests were adopted for comparison. Then, we systematically evaluated the dynamic performance and mooring safety of a TLP FOWT across four extreme environmental conditions. The key findings and conclusions are as follows:
The numerical model established in this study exhibits high accuracy, with a maximum error of 1.17% between numerical and experimental results. This confirms the model’s reliability for predicting TLP motion and mooring tension, providing a credible tool for future TLP floating wind turbine design optimization.
The TLP consistently maintains its semi-compliant and semi-rigid structural characteristics across all routine and extreme conditions, validating the rationality of its core design (a truss-type central column with a taut mooring system with grouped lines).
The mooring system demonstrates robust safety and fault tolerance across all scenarios. In DLC6.1 and DLC6.2, the calculated safety factors are 1.85 and 1.78, respectively, both exceeding the ABS-specified threshold of 1.75. Meanwhile, the minimum line base tension remains above zero, meaning there is no risk of mooring slack. Under DLC10.2, which simulates single mooring line breakage, load propagation is confined to moorings in the same group. Specifically, the tension variation of Line1 and Line3 reaches up to 56.49%, while the tension variation of moorings in other groups is no more than 2%. This result proves that the grouped mooring design effectively mitigates accidental failure risks.
Overall, the findings of this study confirm that the proposed TLP design successfully balances stability, safety, and adaptability, thereby meeting industry standards for offshore wind operations. Nevertheless, this work paves the way for several important research directions. Future studies could investigate the platform’s adaptability across various water depths, perform a detailed quantitative analysis of the impact of tendon length tolerances on safety factors and fatigue life, and conduct a dedicated VIV analysis to accurately quantify its contribution to tendon fatigue damage.
Author Contributions
Conceptualization, X.Y.; methodology, Y.Z.; software, S.Y.; validation, W.Y., S.Y. and Y.Z.; formal analysis, W.S.; investigation, Y.Z. and H.W.; resources, X.Y.; data curation, H.W. and S.L.; writing—original draft preparation, Y.Z. and S.L.; writing—review and editing, W.S.; visualization, X.Y.; supervision, X.Y.; project administration, X.Y. All authors have read and agreed to the published version of the manuscript.
Funding
This research is funded by the Ministry of Industry and Information Technology (Grant No. TC240AAKP-154) and the Ministry of Science and Technology of the People’s Republic of China (Grant No. 2024YFB4205405).
Data Availability Statement
The original contributions presented in this study are included in the article. Further inquiries can be directed to the corresponding author.
Acknowledgments
DeepSeek was used in the making of this paper, as an assisting tool, only for the creation of the English text and for spelling assistance. All the information was checked according to the references included in the paper.
Conflicts of Interest
Authors Xiaolong Yang, Yu Zhang, Shengwei Yan, Weihong Yu and Shunhang Lu were employed by the company Offshore Oil Engineering Co., Ltd. The remaining authors declare that the research was conducted in the absence of any commercial or financial relationships that could be construed as a potential conflict of interest.
Abbreviations
The following abbreviations are used in this manuscript:
| FOWT | Floating Offshore Wind Turbine |
| RAO | Response Amplitude Operator |
| TLP | Tension Leg Platform |
| WADAM | Wave Analysis by Diffraction and Morison Theory |
| RNA | Rotor–Nacelle Assembly |
| NREL | National Renewable Energy Laboratory |
| DTU | Danmarks Tekniske Universitet |
| BEM | Blade–Element Momentum |
| DLC | Dynamic Load Case |
| IEC | International Electrotechnical Commission |
| SPH | Smooth Particle Hydrodynamics |
| JONSWAP | Joint North Sea Wave Project |
| STD | Standard Deviation |
| CFD | Computational Fluid Dynamics |
| ALS | Accidental Limit State |
| ABS | American Bureau of Shipping |
| SLC | Survival Load Case |
| VIV | Vortex-Induced Vibration |
References
- Wang, J.; Ren, Y.; Shi, W.; Maurizio, C.; Venugopal, V.; Li, X. Multi-objective optimization design for a 15 MW semisubmersible floating offshore wind turbine using evolutionary algorithm. Appl. Energy 2025, 377, 124533. [Google Scholar] [CrossRef]
- Hu, L.; Shi, W.; Hu, W.; Chai, W.; Hu, Z.; Wu, J.; Li, X. Short-term prediction of mooring tension for floating offshore wind turbines under typhoon conditions based on the VMD-MI-LSTM method. Renew. Sustain. Energy Rev. 2025, 216, 115606. [Google Scholar] [CrossRef]
- Shi, W.; Wang, J.; Ren, Y.; Wang, S.; Venugopal, V.; Han, X. Novel conceptual design and performance analysis of a semi-submersible platform for 22 MW floating offshore wind turbine. Energy 2025, 334, 137605. [Google Scholar] [CrossRef]
- Fu, K.; Ren, Z. Multi-task prediction of wind speed and time-varying wind shear coefficient using dynamic graph interactive neural network. Inf. Fusion 2025, 125, 103478. [Google Scholar] [CrossRef]
- Cai, Y.; Zhao, H.; Li, X.; Shi, W.; Xiao, Q. Developing an OpenFOAM solver for coupled aero-hydrodynamic analysis of integrated structure with floating offshore wind turbine and aquaculture net cage. Coast. Eng. 2025, 198, 104720. [Google Scholar] [CrossRef]
- Ren, N.; Li, Y.; Ou, J. The Effect of Additional Mooring Chains on the Motion Performance of a Floating Wind Turbine with a Tension Leg Platform. Energies 2012, 5, 1135–1149. [Google Scholar] [CrossRef]
- Zhao, Y.; Yang, J.; He, Y. Preliminary Design of a Multi-Column TLP Foundation for a 5-MW Offshore Wind Turbine. Energies 2012, 5, 3874–3891. [Google Scholar] [CrossRef]
- Bachynski, E.E.; Moan, T. Design Considerations for Tension Leg Platform Wind Turbines. Mar. Struct. 2012, 29, 89–114. [Google Scholar] [CrossRef]
- Bae, Y.H.; Kim, M.H. Rotor-Floater-Tether Coupled Dynamics Including Second-Order Sum–Frequency Wave Loads for a Mono-Column-TLP-Type FOWT (Floating Offshore Wind Turbine). Ocean Eng. 2013, 61, 109–122. [Google Scholar] [CrossRef]
- Oguz, E.; Clelland, D.; Alexander, H.D.; Incecik, A.; Lopez, J.A.; Sanchez, G.; Almeria, G.G. Experimental and Numerical Analysis of a TLP Floating Offshore Wind Turbine. Ocean Eng. 2018, 147, 591–605. [Google Scholar] [CrossRef]
- Song, J.; Lim, H.-C. Study of Floating Wind Turbine with Modified Tension Leg Platform Placed in Regular Waves. Energies 2019, 12, 703. [Google Scholar] [CrossRef]
- Walia, D.; Schünemann, P.; Hartmann, H.; Adam, F.; Großmann, J. Numerical and Physical Modeling of a Tension-Leg Platform for Offshore Wind Turbines. Energies 2021, 14, 3554. [Google Scholar] [CrossRef]
- Vardaroglu, M.; Gao, Z.; Avossa, A.M.; Ricciardelli, M. Validation of a TLP Wind Turbine Numerical Model Against Model-Scale Tests Under Regular and Irregular Waves. Ocean Eng. 2022, 256, 111491. [Google Scholar] [CrossRef]
- Wu, H.; Zhao, Y.; He, Y.; Shao, Y.; Mao, W.; Han, Z.; Huang, C.; Gu, X.; Jiang, Z. Transient Response of a TLP-Type Floating Offshore Wind Turbine Under Tendon Failure Conditions. Ocean Eng. 2021, 220, 108486. [Google Scholar] [CrossRef]
- Jia, Z.; Wu, H.; Chen, H.; Li, W.; Li, X.; Lian, J.; He, S.; Zhang, X.; Zhao, Q. Hydrodynamic Response and Tension Leg Failure Performance Analysis of Floating Offshore Wind Turbine with Inclined Tension Legs. Energies 2022, 15, 8584. [Google Scholar] [CrossRef]
- Ha, Y.-J.; Kim, K.-H.; Park, J.-Y. CFD Study of the Non-Linear Physical Phenomena of the TLP of a 15-MW-Class FOWT under Extreme Waves. J. Mar. Sci. Eng. 2023, 11, 1915. [Google Scholar] [CrossRef]
- Tagliafierro, B.; Karimirad, M.; Martínez-Estévez, I.; Domínguez, J.M.; Viccione, G.; Crespo, A.J.C. Numerical Assessment of a Tension-Leg Platform Wind Turbine in Intermediate Water Using the Smoothed Particle Hydrodynamics Method. Energies 2022, 15, 3993. [Google Scholar] [CrossRef]
- Kim, T.; Madsen, F.J.; Bredmose, H.; Pegalajar-Jurado, A. Numerical Analysis and Comparison Study of the 1:60 Scaled DTU 10 MW TLP Floating Wind Turbine. Renew. Energy 2023, 202, 210–221. [Google Scholar] [CrossRef]
- Boo, S.Y.; Ha, Y.-J.; Shelley, S.A.; Park, J.-Y.; Lim, C.-H.; Kim, K.-H. Concept Design of a 15 MW TLP-Type Floating Wind Platform for Korean Offshore Installation. J. Mar. Sci. Eng. 2024, 12, 796. [Google Scholar] [CrossRef]
- Ran, X.; Bachynski-Polić, E.E. Time-Domain Simulation, Fatigue and Extreme Responses for a Fully Flexible TLP Floating Wind Turbine. Mar. Struct. 2025, 101, 103778. [Google Scholar] [CrossRef]
- Wang, Y.; Yao, T.; Zhao, Y.; Jiang, Z. Review of Tension Leg Platform Floating Wind Turbines: Concepts, Design Methods, and Future Development Trends. Ocean Eng. 2025, 324, 120587. [Google Scholar] [CrossRef]
- Zhou, Y.; Ren, Y.; Shi, W.; Li, X. Investigation on a Large-Scale Braceless-TLP Floating Offshore Wind Turbine at Intermediate Water Depth. J. Mar. Sci. Eng. 2022, 10, 302. [Google Scholar] [CrossRef]
- Li, S.; Deng, S.; Yu, W.; Zhang, S.; Mao, C. Experimental Study on the Hydrodynamic Properties of a TLP Floating Wind Turbine. In Proceedings of the 35th International Ocean and Polar Engineering Conference, Seoul, Republic of Korea, 1–6 June 2025. [Google Scholar]
- Liu, S.; Guo, X.; Yang, Y.; Wang, H.; Wei, S.; Ren, N.; Chen, C. Dynamic Response Analysis of a Novel Tension-Leg Dual-Module Offshore Wind Turbine System During Both Installation and Removal Processes. J. Mar. Sci. Eng. 2025, 13, 888. [Google Scholar] [CrossRef]
- Mazarakos, T.P.; Tsaousis, T.D.; Mavrakos, S.A.; Chatjigeorgiou, I.K. Analytical Investigation of Tension Loads Acting on a TLP Floating Wind Turbine. J. Mar. Sci. Eng. 2022, 10, 318. [Google Scholar] [CrossRef]
- Martynowicz, P.; Ślimak, P.; Katsaounis, G.M. TLP-Supported NREL 5MW Floating Offshore Wind Turbine Tower Vibration Reduction Under Aligned and Misaligned Wind-Wave Excitations. Energies 2025, 18, 2092. [Google Scholar] [CrossRef]
- Jia, Y.; Deng, S.; Li, S.; Cheng, Z.; Hu, Z.; Yang, C. A virtual reconstruction method of floating wind turbines based on scaling design and integrated simulation. China Offshore Oil Gas. 2024, 36, 139–148. [Google Scholar] [CrossRef]
- Amiri, M.; Ayani, M.; Ziolkowski, P.; Mikielewicz, D. Numerical analysis of vacuum drying of a porous body in the integrated domain. J. Food Process Eng. 2022, 45, e14006. [Google Scholar] [CrossRef]
- Sun, Z.; Chen, J.; Shen, W.Z.; Zhu, W.J. Improved Blade Element Momentum Theory for Wind Turbine Aerodynamic Computations. Renew. Energy. 2016, 96, 824–831. [Google Scholar] [CrossRef]
- ABS. Guide for Building and Classing Floating Offshore Wind Turbines; ABS: Spring, TX, USA, 2024. [Google Scholar]
- IEC 61400-3-2; Wind Energy Generation Systems-Part3-2: Design Requirements for Floating Offshore Wind Turbines. IEC: Geneva, Switzerland, 2019.
- Zhang, Y.; Li, S.; Deng, S.; Wang, H. Effect of Tower Flexibility on the Global Performance of a TLP Floating Wind Turbine. In Proceedings of the 35th International Ocean and Polar Engineering Conference, Seoul, Republic of Korea, 1–6 June 2025. [Google Scholar]


Disclaimer/Publisher’s Note: The statements, opinions and data contained in all publications are solely those of the individual author(s) and contributor(s) and not of MDPI and/or the editor(s). MDPI and/or the editor(s) disclaim responsibility for any injury to people or property resulting from any ideas, methods, instructions or products referred to in the content. |
© 2025 by the authors. Licensee MDPI, Basel, Switzerland. This article is an open access article distributed under the terms and conditions of the Creative Commons Attribution (CC BY) license (https://creativecommons.org/licenses/by/4.0/).