Article

Mesoscale Linear Elastic Modeling and Homogenization of Marine Energy Composites

by
Peter J. Creveling
1,*,
Evan M. Anderson
1,
Olivia Blank
2,
David Miller
2 and
Bernadette A. Hernandez-Sanchez
1
1
Sandia National Laboratories, Albuquerque, NM 87185, USA
2
Department of Mechanical and Industrial Engineering, Montana State University, Bozeman, MT 59717, USA
*
Author to whom correspondence should be addressed.
J. Mar. Sci. Eng. 2025, 13(11), 2043; https://doi.org/10.3390/jmse13112043
Submission received: 30 September 2025 / Revised: 21 October 2025 / Accepted: 21 October 2025 / Published: 24 October 2025

Abstract

The design of fiber-reinforced composite (FRC)-based components for marine energy applications necessitates a fundamental understanding of material properties and the resulting geometry to predict long-term performance. In this work, we present a modeling workflow to predict linear elastic and diffusive bulk properties at the mesoscale for an idealized geometry based on knowledge of fiber and resin properties. A parametric study was performed to identify the key model input parameters that influence bulk properties. Furthermore, we demonstrate how bulk properties can be leveraged in high-fidelity image-based simulations, where imperfections in tow geometry and voids captured during X-ray computed tomography imaging are explicitly represented within the simulation. Bulk properties of interest include moduli, Poisson’s ratios, hygroscopic swelling, diffusivity, and moisture uptake, which are key parameters for characterizing FRC performance within marine environments. Modeling predictions agreed well with experimental data, except for estimating swelling coefficients, likely due to crack accumulation as a function of moisture uptake. The mesoscale modeling workflow ultimately highlights a versatile framework for understanding the influence of material and geometric properties, which can be leveraged to rapidly assess new FRC-based components.

1. Introduction

The design of new components for offshore renewable energy applications, such as tidal power and wind farms, poses unique challenges due to combinations of ultraviolet radiation, biofouling, corrosion, and moisture absorption, to name a few. Typically, conventional metals have been leveraged for marine energy demonstrations due to their lower manufacturing costs and well-characterized material properties. These materials, however, are susceptible to environmental degradation, which severely limits their long-term performance [1].
Fiber-reinforced composites (FRCs) have many attractive properties that can address these challenges. They have been proven in industries like aerospace and automotive for their high stiffness-to-weight ratio, corrosion resistance, and tailorable material properties. In maritime applications, composites began emerging as early as World War II, although many obstacles and challenges preventing their widespread adoption have persisted to this day [2]. One difficulty is the continued lack of comprehensive and widely accessible data on the properties of composites that are deployed within marine environments. A shortage of empirical data and certainty of the material behavior in marine environmental conditions can lead to highly conservative safety factors and inefficiency in design [2,3]. As a result, many applications continue, resorting to conventional metals in spite of their shortcomings.
Due to their complex anisotropic properties, the development of accurate models of FRC is challenging, particularly when modeling intricate geometric designs such as tidal turbine blades. There is a need for modeling capabilities that can capture these complexities in geometry and the effects of long-term moisture absorption. FRCs are prone to absorbing moisture into the resin matrix and the fibers, depending on type, over long-term exposure to marine environmental conditions [4,5,6]. Adverse effects on mechanical properties can occur as a result of this absorption. In particular, swelling of the resin matrix due to moisture uptake and the internal stresses resulting from the mismatch in expansion coefficients between the fiber and matrix constituents have been identified as primary mechanisms of strength degradation [7,8,9,10]. More recent efforts have been conducted by Krauklis et al. [8], where the authors leveraged finite element analysis to determine effective hygrothermal swelling coefficients. Good agreement was found when compared to experimental data; however, this work was limited to the prediction of swelling coefficients at the microscale for idealized geometries.
Moisture-induced swelling is only one aspect of the complex effects seen in marine environments. Within renewable energy, the acquisition of reliable data is scarce and often limited to a handful of demonstration projects with FRCs, such as those from Verdant Power [11], and ORPC [12]. The development of effective models that capture damaging environmental effects across varying length scales is imperative and has been a research priority for some time [2,13,14,15,16]. But, to fully achieve this, models must not only account for changes in mechanical and diffusive properties but also incorporate these effects into a full range of length scales.
Based on the above, there remains a need for reliable data and modeling tools within marine-based mechanical design. A thorough understanding of the material behavior, particularly within the linear elastic regime, provides the foundational basis for predicting strength, failure, and service life. This work aims to lay a critical foundation by exploring the relationship between constituent material properties and behavior in the linear elastic regime using a mesoscale modeling approach for composites used within the marine renewable energy sector. Mesoscale modeling has been successfully leveraged within the aerospace community in recent years to investigate the effective thermal and mechanical properties of woven carbon and silica phenolic composite fabrics [17,18], and for lithium-ion battery electrodes to investigate the active area, pore phase tortuosity, and effective electrical conductivity electrochemically in as-manufactured geometries [19]. Recent studies have accounted for the effects of cracks, voids, and defects through models derived from X-ray computed tomography (CT) scan images [18,20,21]. Results have revealed a wealth of knowledge to be learned from high-resolution capture of realistic microstructural features of material systems. The extension of mesoscale modeling to marine-based materials and environments, however, has been limited.
In this study, experiments are first performed to characterize a common resin system and FRC used in marine energy environments. Experiments target characterizing elastic, diffusive, and expansion properties of neat resin, as well as stitched glass fiber composite coupons, after long-term submersion in distilled water. The experimental values obtained are then used to determine modeling input parameters and for validation. Mesoscale models are built with idealized geometry and material definitions to perform sensitivity analyses of constituent-level inputs on composite-level quantities of interest. Then, high-fidelity image-based models derived from X-ray CT scans to capture voids and defects as seen in the as-manufactured state are performed to observe the impact of these features, with inputs informed in part by the results of the idealized model parametric sweep.

2. Materials and Imaging

2.1. Manufacturing

Numerous samples and testing procedures are needed to characterize both the mechanical and hygroscopic properties of neat resin and glass FRCs. Coupons used in this study were manufactured according to the American Society for Testing and Materials (ASTM) standards to determine bulk moduli, Poisson’s ratios, and diffusivity. ASTM-D3039 [22] was used to determine the axial and transverse Young’s modulus and Poisson’s ratio with a coupon layup sequence of [0]2 and [90]4 for the axial and transverse directions, respectively. ASTM-D3518 [23] was used to determine the axial shear modulus with a coupon layup sequence of [±45]4. ASTM D638-14 [24] was used to determine the bulk Young’s modulus and Poisson’s ratio for the neat resin. Experimentally derived diffusivity coefficients for both the neat resin and composite coupons were determined using two methods. First, a linear slope method was used by leveraging ASTM-D5229 [25], where diffusivity is determined using
D = π h 4 M m 2 M 2 M 1 t 2 t 1 2 ,
where h is the coupon thickness, M m is the percentage of moisture equilibrium content, and ( M 2 M 1 ) / ( t 2 t 1 ) is the slope of moisture absorption during the initial linear portion of the curve. A second approach was implemented, based not only on the linear portion of the moisture uptake curve, but also by defining a diffusivity coefficient using a least squares approach on the experimental data from the initial moisture uptake until complete saturation based on Fick’s law [26]. This approach was leveraged for comparison due to potential error when defining the endpoint of the initial linear portion of the mass uptake curve. No ASTM standard exists for determining swelling coefficients. As such, swelling coefficients were determined from thick composites manufactured with a layup sequence of [0]24 to better measure the dimensional change due to moisture uptake. Samples were submerged in distilled water at 50 °C, and mass uptake was measured periodically until full saturation was achieved. Distilled water was used, as opposed to seawater, to ensure maximum moisture uptake and to reduce uncertainty in measurements due to salt formation on the composite surface, which must be removed prior to mass measurements. Limited diffusion is experienced with seawater exposure due to salt compounds having restricted mobility due to their size, and thus not diffusing into the polymer [27,28]. Mass measurements were performed after allowing the moisture on the sample surface to fully dry for approximately 30 min. The maximum percent mass uptake, M , was determined at the final measurement taken at 160 days. Furthermore, no experiments were performed using only fibers, and the values used for numerical modeling were obtained from the open literature.
Manufacturing of the glass FRC coupons was performed using Saertex® (Huntersville, NC, USA) 955 g/m2 stitched unidirectional glass fabric, and Saertex® 830 g/m2 stitched biaxial glass fabric. Both fabrics were infused with Westlake (Houston, TX, USA) 135/1366 epoxy resin using vacuum-assisted resin transfer molding. After infusion, the panels were cured on a heated aluminum plate at 50 °C for 24 h, then post-cured at 70 °C for 4 h. These temperatures are within the manufacturer’s suggested operational temperature [29]. Neat resin coupons were cast into a silicone mold using the same cure cycle applied to the FRC coupons. Figure 1 shows representative images of the samples/coupons after manufacturing: (a) neat resin dog bone, (b) in-plane shear, (c) swelling coefficient plate, and (d) swelling coupon. In this and all subsequent figures, the 1-direction represents the fiber direction, the 2-direction is the in-plane direction normal toward the fibers, and the 3-direction is the composite through-thickness direction. Additional neat resin dog bone samples were manufactured and subsequently machined into nominal 30 mm × 20 mm × 7 mm parallelepipeds for swelling tests. To obtain the swelling FRC coupons, the composite plate was cut along the 2-direction shown in Figure 1c to nominal dimensions of 6 mm × 130 mm × 15 mm in the first, second, and 3-directions, respectively. Since FRC coupons were cut against the fiber direction, a thin coating of the 135/1366 epoxy was applied to the cut surface to fill in any microcracks that developed. The epoxy coating was then cured at 50 °C for 24 h. The coating was applied to mitigate the effects of moisture absorption due to machining defects.
FRC swelling coupons were designed such that the smallest dimension was aligned with the fibers (i.e., 1-direction shown in Figure 1d) to target volume change measurements transverse to the fibers. As a result, hygroscopic expansion coefficients were only measured in the 2- and 3-directions. Prior to water submersion, swelling coupons were imaged using a Keyence (Itasca, IL, USA) VL-500 to determine initial sample dimensions. Dimensions were determined by virtually drawing two opposing planes that best aligned with the imaged surface, which provided an average of the length in that corresponding direction. The results from mechanical testing are shown in Table 1.

2.2. Image Acquisition and Segmentation

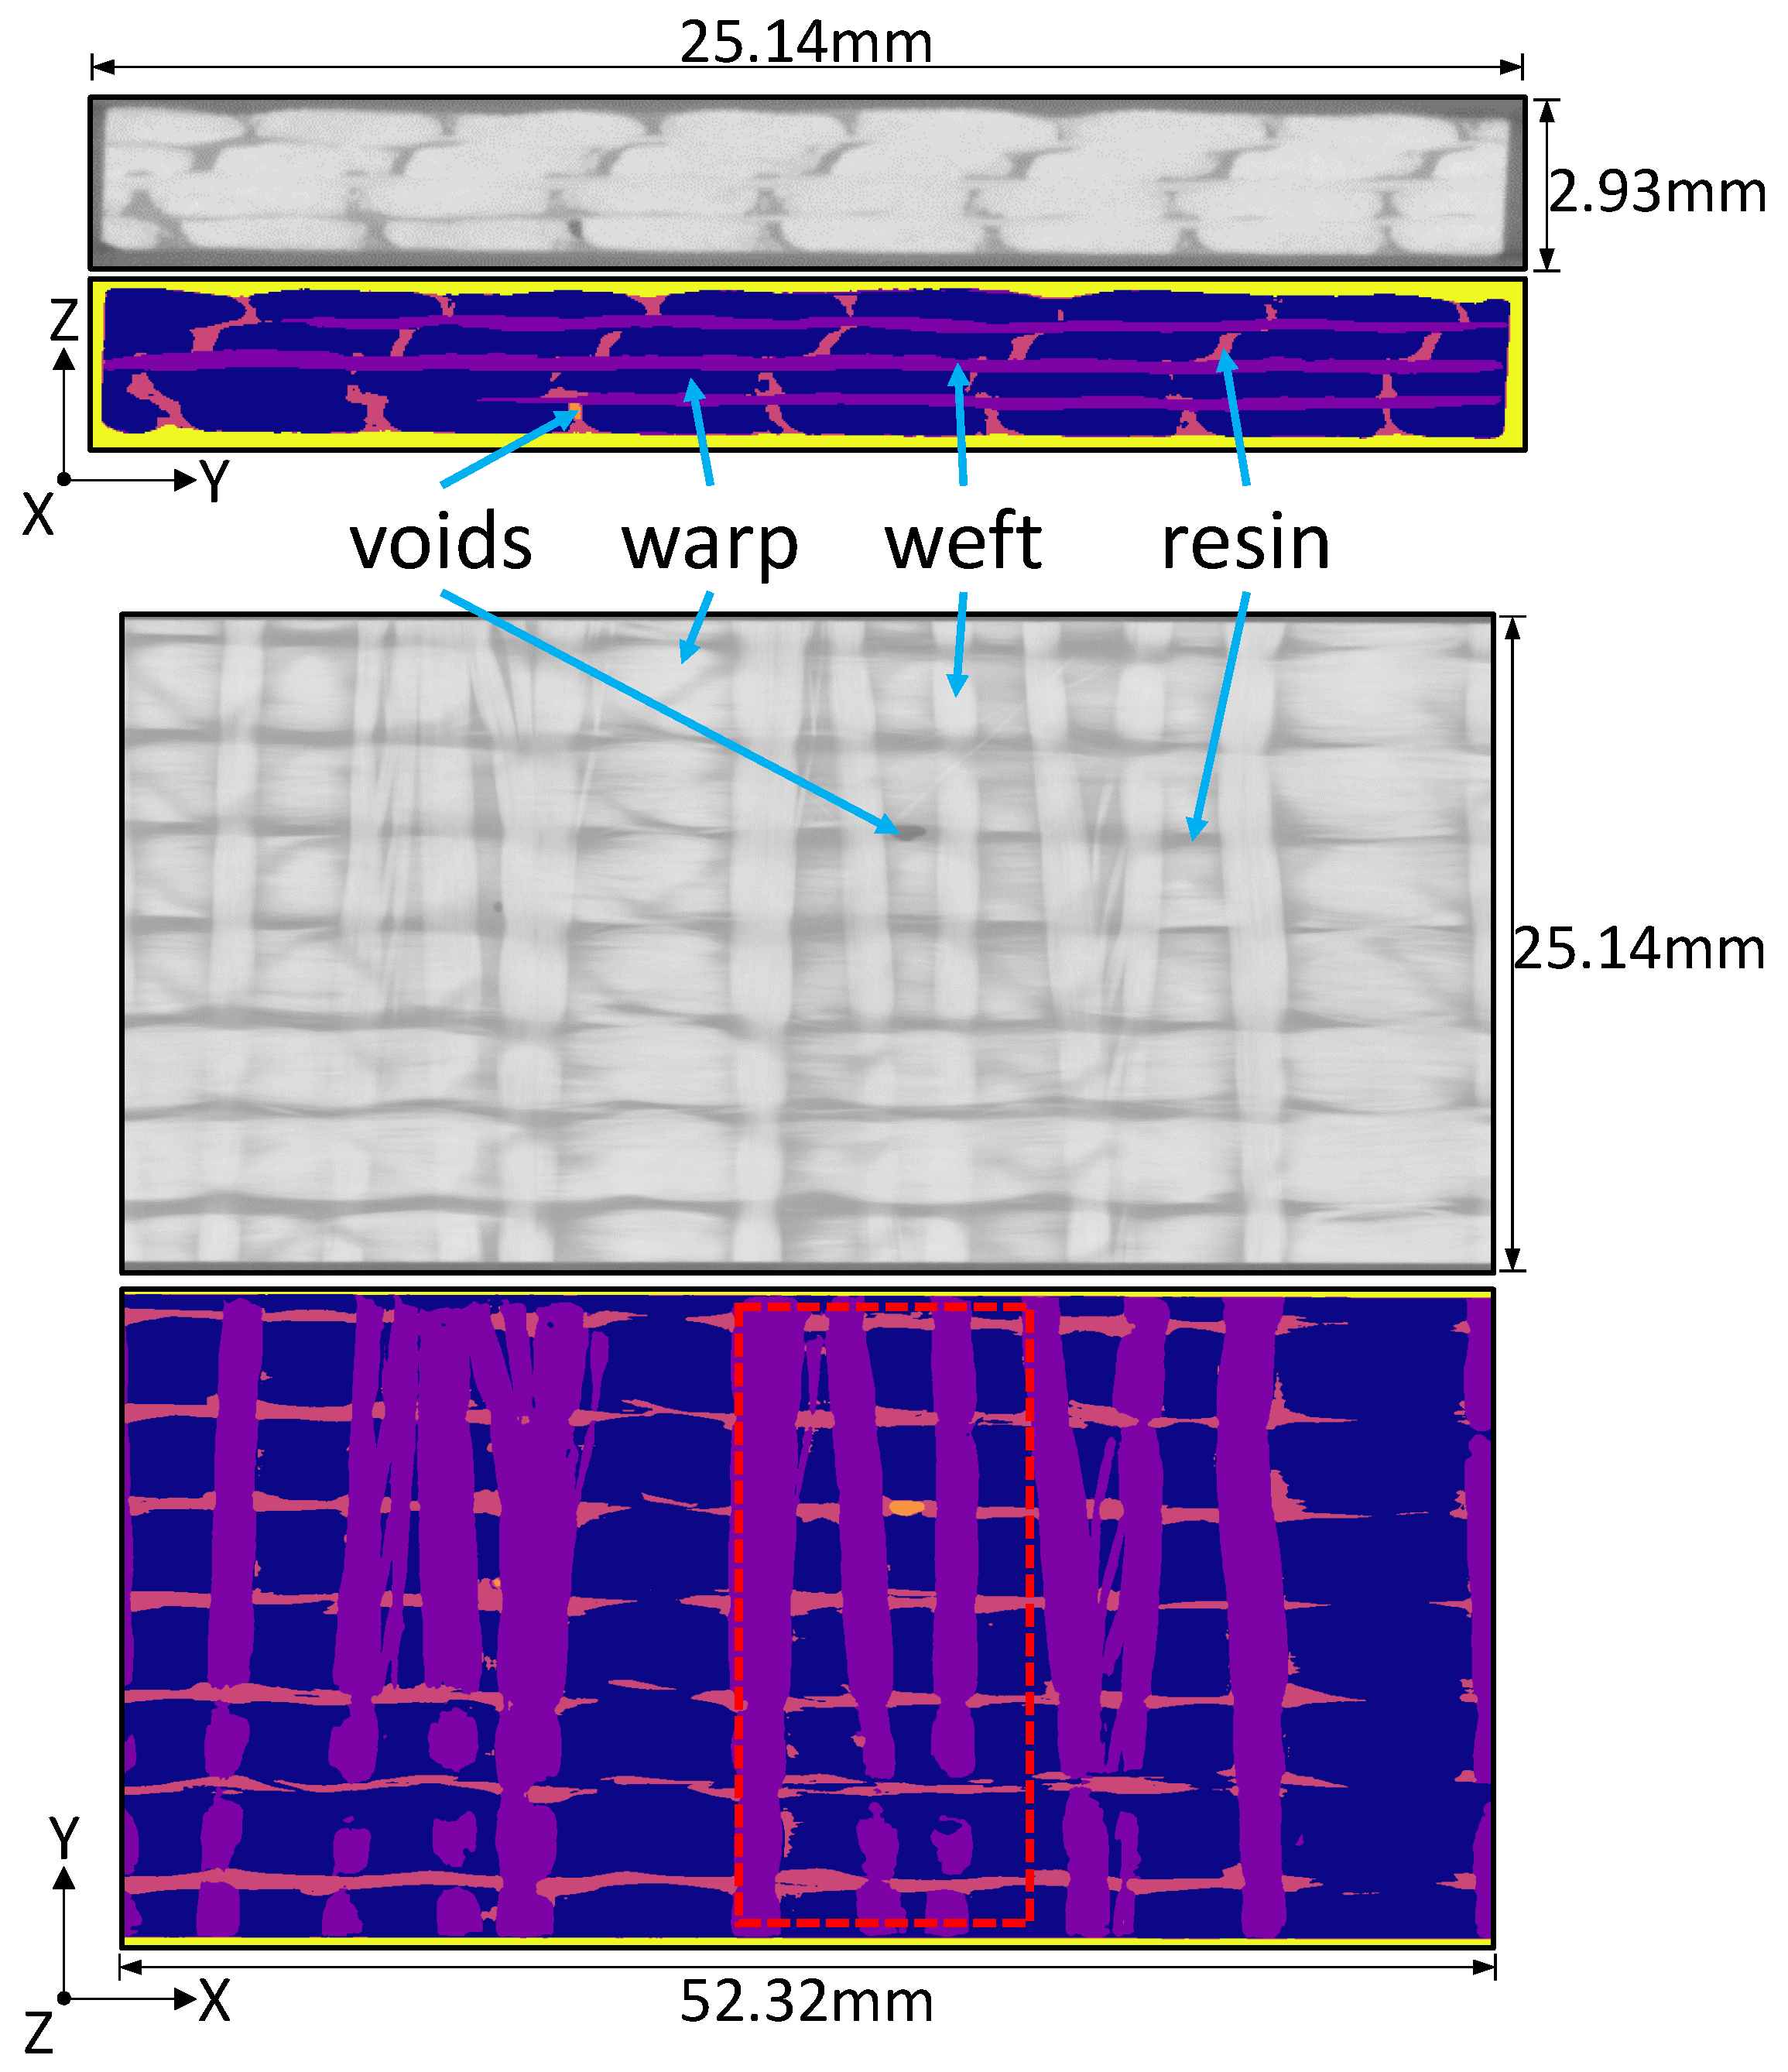
Imaging of the FRC coupons was performed using X-ray CT to resolve the 3D architecture of the coupons after manufacturing. X-ray CT was performed using an XRay WorX® (Garbsen, Germany) 225 kV microfocus Xray Tubehead, where a total of 2161 projections were collected over 180 degrees of rotation using a zoom factor of 4×, with an approximate exposure time of 1.17 s per projection. The X-ray source voltage and current were set to 220 kV and 150 µA, respectively. Reconstruction of attenuated imaged data using Volume Graphics® (Huntersville, NC, USA) resulted in 16-bit grayscale images with an image spatial resolution of 31.54 µm per voxel. Figure 2 shows representative reconstructed X-ray CT image slices obtained for two orientations: in-plane with the direction of the warp tows and the through-the-thickness direction. Based on the image results, very few voids were observed as a result of manufacturing.
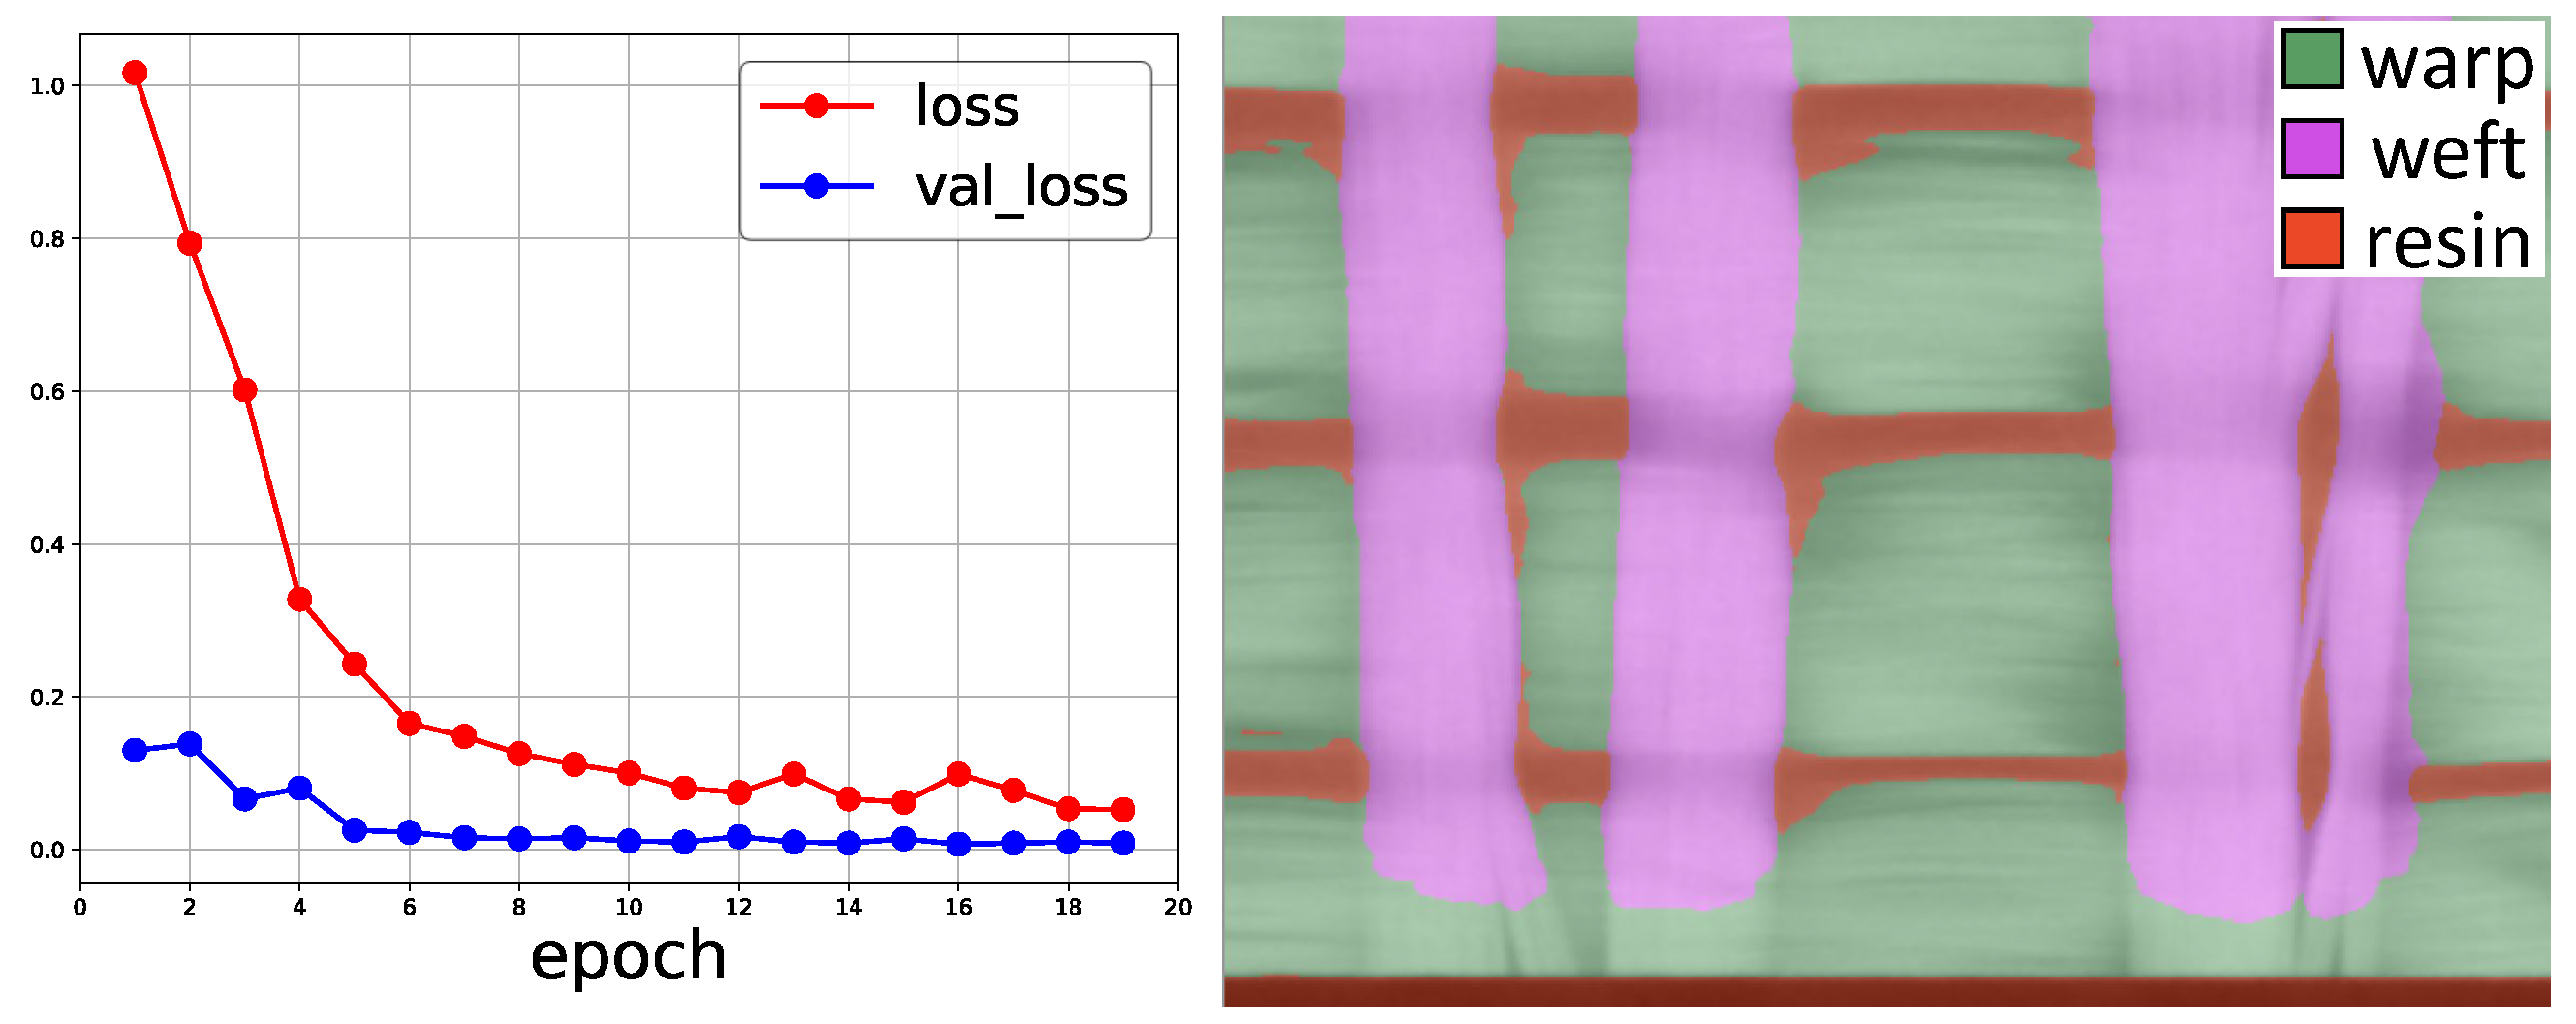
Segmentation was performed using a multi-step process to identify tows in the warp (primary) fiber direction, weft (secondary), resin, and voids. The first step includes semantic segmentation using the software Dragonfly 2022.2 by Comet [30] to identify tows in both directions and the surrounding resin. Within Dragonfly’s user interface, 10 unique frames of varying size (i.e., a single image slice or subset of a slice) were manually segmented. These frames were used as inputs into a deep learning-based segmentation model that leverages a 3-layer Sensor3D architecture [31] with an initial filter count of 64. Sensor3D is a robust U-Net-like hybrid architecture that is available within Dragonfly. Training was performed using a patch size of 80 with a stride ratio of 0.25, with a total of 100 epochs to allow for sufficient iterations to reduce the error. The loss function and optimization algorithm selected for segmentation were categorical cross-entropy and Adadelta [32], respectively. To increase the amount of training data, 10 data augmentation iterations were applied to the set of manually segmented frames, which includes horizontal/vertical flips, rotation, and shear between 0 and 10 degrees, scaling between 90–110% of the frame size, and image brightness between 0.9 and 1.1. Rotations and shear were limited to a small range such that warp/weft tows could be segmented separately. Figure 3 shows a snapshot of the loss function and validation of the loss function for unseen data converging within 100 epochs, and a visualization of the training progress classifying warp/weft tows and the resin after six frames were labeled. Areas of voxel misclassification can be seen from the visualization, particularly for warp-aligned voxels near the bottom edge of the sample, which suggests additional frames are needed to improve segmentation accuracy. For the 10 uniquely labeled frames used to achieve the segmentation results shown in Figure 2, approximately 1.1 million voxels were labeled before data augmentation, or approximately 0.85% of the total number of voxels in the image dataset.
The second step includes gray-scale thresholding to segment voids from the surrounding material. This step was performed separately, given the higher image contrast between voids and the surrounding material, and to prevent false negative identification of voids when included within the previous step. The segmentation results can be seen side-by-side with the X-ray CT images shown in Figure 2, where black, dark gray, light gray, and white colors correspond to warp tows, weft tows, resin, and voids, respectively. Note that the dashed box shown in Figure 2 is the sub-volume region of interest for image-based simulations presented later in Section 3.2. This location was selected to include multiple tows in each direction while also including voids that were present from manufacturing. Qualitatively, Figure 2 illustrates that the segmentation steps presented above performed well at identifying the features of interest. However, it can be seen that many resin-rich regions appear under-segmented compared to the other features. To explore the uncertainty associated with image segmentation, the EQUIPS workflow outlined in [33] was used to generate three sets of segmented image data from the resulting multi-class probability maps generated from Dragonfly: the nominal case (e.g., images shown in Figure 2), the 5-percentile segmentation of the resin that results in a higher resin volume fraction compared to nominal, and the 95-percentile segmentation of the resin that results in a lower resin volume fraction. These three datasets were used in the following steps to generate finite element meshes.

3. Methods

In this section, the modeling workflow for idealized geometry is presented first, which includes mesh generation steps, the simulation setup, and quantities of interest to be calculated from the model results. Then, the image-based modeling workflow is presented, which includes mesh generation steps, the simulation setup, and output quantities of interest.

3.1. Idealized Mesoscale Modeling Approach

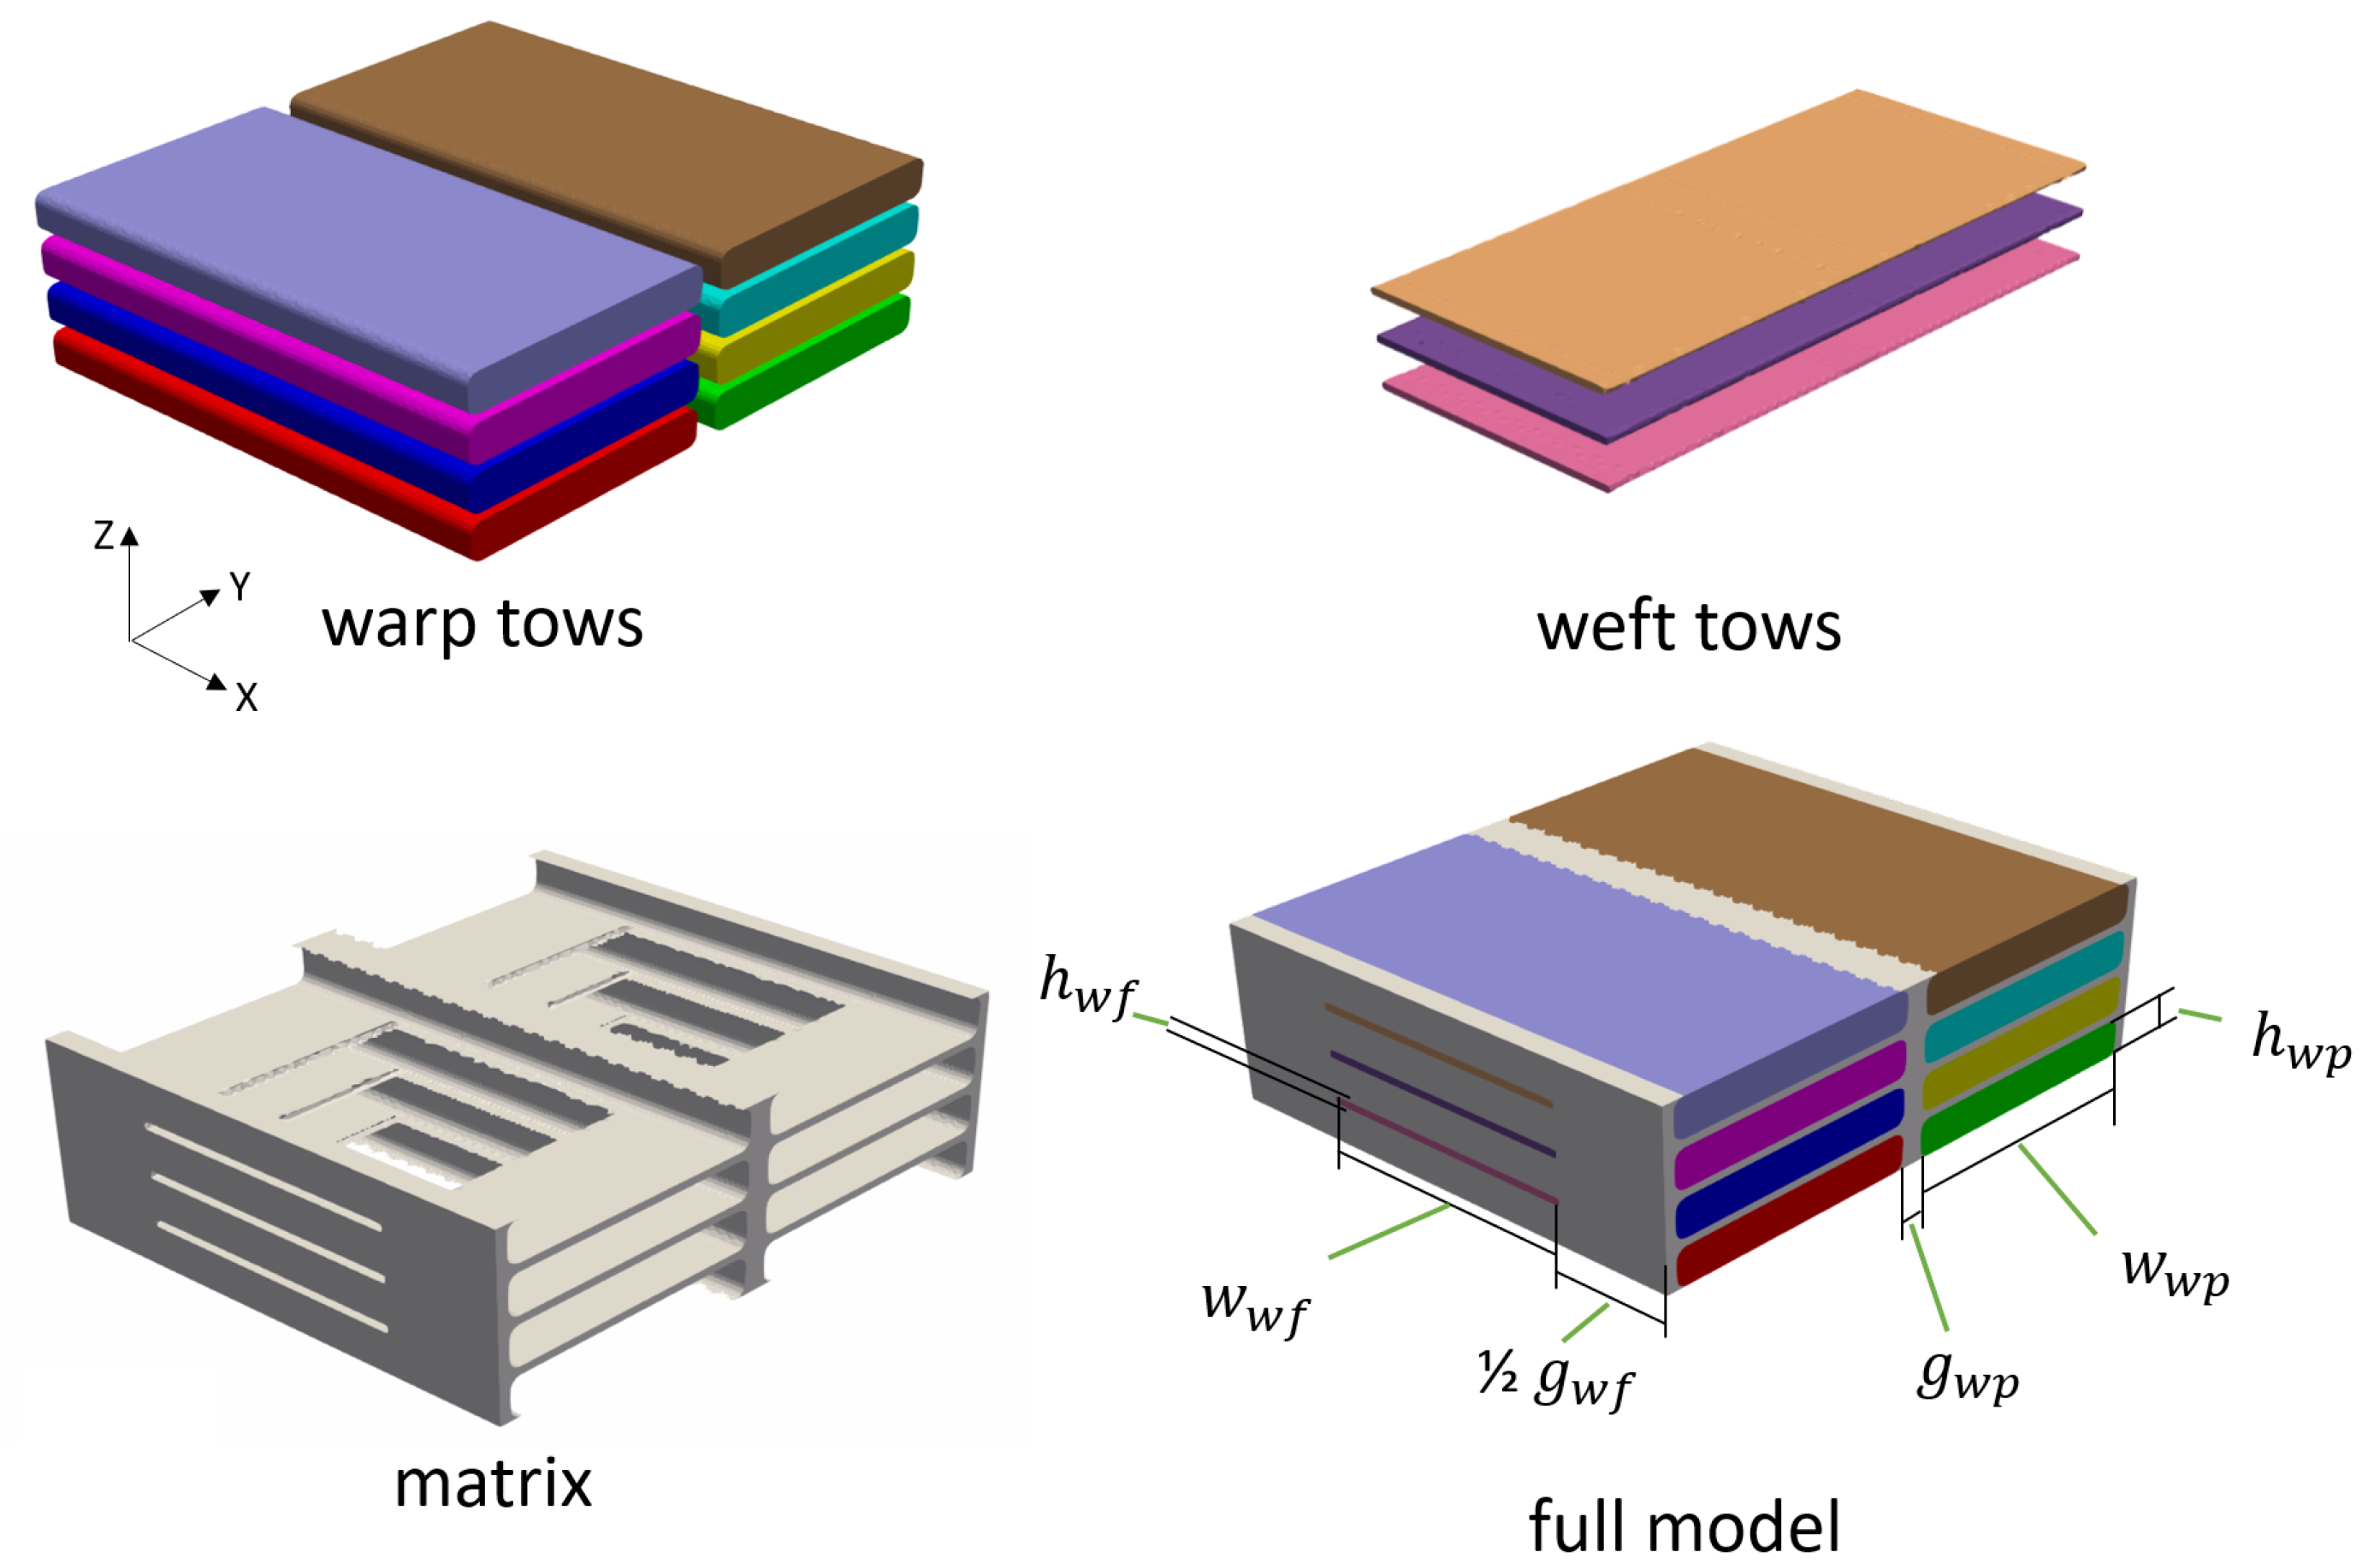
The first type of computational model utilized in this work represents the mesoscale structure and geometry of a stitched fiber composite in an idealized manner, as shown in Figure 4, to mimic the fabric used in Section 2.1. The idealized mesoscale model consists of multiple tows aligned in both the warp and weft directions, where individual tows are constructed as standard tessellation language (STL) files using straight prism extrusions with rounded rectangular cross-sections. Thick, densely packed warp tows are placed to run in the X-direction in layers stacked in the Z-direction. Thinner, more sparse weft tows were placed to run in the Y-direction, perpendicular to the warp tows between each layer.
Once the set of STL files for each tow was constructed, an unstructured, linear, tetrahedral finite element mesh was generated using the conformal decomposition finite element method (CDFEM) [34,35]. First, a signed level-set distance function was calculated for each STL surface. Then, a uniform background grid was decomposed such that new nodes and child elements were generated along the interface to conform to the level-set surface. The result was a mesh with separate volumes for each tow with a conformal volume surrounding the tows that corresponds to the matrix.
The matrix region of the model surrounding the fiber tow volumes was considered to be homogeneous, fully isotropic epoxy resin with no voids, gaps, or defects, and with perfect bonding at the fiber tow interfaces. Elastic and diffusive material properties were assigned as input parameters to the model. The fiber tows were considered to be homogeneous and transversely isotropic, composed of individual elastic glass fibers surrounded by epoxy resin, where effective properties were calculated following Chamis [36], as described in Table 2. In Table 2, k f is the fiber volume fraction in the tows. Properties of the resin matrix are denoted with a subscript m, while properties of the fiber are denoted with a subscript f. In this study, both the warp and weft tows were considered to have glass fibers, with the same fiber volume fraction in any given simulation. The effective properties for the tows were pre-computed from the inputs described later in Table 3, and assigned to the tow sections of the model.
The prediction of bulk Young’s moduli, shear moduli, Poisson’s ratios, and hygroscopic swelling coefficients for the idealized geometry began by calculating the Cauchy stress ( σ ) that satisfies the conservation of solid momentum equation for static, linear elasticity given by
· σ = 0 ,
where Cauchy stress is related to strain ( ε ) by the fourth-order elastic compliance tensor ( S ) through the constitutive relation ε = S σ and infinitesimal strain theory. To determine bulk engineering constants from the compliance tensor, the Hill–Mandel macro-homogeneity condition [37] is leveraged to determine the volume-averaged stresses ( σ ¯ ) and strains ( ε ¯ ) from six simulations with unique loading conditions: applied displacement for three normal (X, Y, and Z) and three shear (YZ, XZ, and XY) loading configurations for a 3D geometry. Periodic boundary conditions were applied for each loading configuration, enabling the simulation of the effective behavior of a material system as if it were embedded in an infinite, repeating expanse, while modeling a relatively small domain.
A seventh simulation is needed to determine the hygroscopic swelling coefficients. A uniform molar concentration (C) gradient is applied across the simulation domain with zero applied displacement. Based on the effective compliance tensor determined previously and the volume-averaged stress and strain resulting from the applied concentration change, the swelling coefficients could be deduced by solving for β in the constitutive relation ε ¯ = S σ ¯ + β Δ C .
In addition to mechanical properties, mass diffusion was modeled with the steady state conservation of chemical species equation, given as
· J = 0 ,
where J is the molar flux. Fick’s law of diffusion is used to approximate the molar flux defined as J = D C , where D is the diffusion coefficient. The effective diffusion coefficient in the X-direction was determined by leveraging Fick’s law, known dimensions of the geometry, applied concentration gradient, and flux as
D x = L x Δ C J x ,
where J x was determined across the low-concentration boundary ( Ω 0 ) with an outward normal vector ( n ^ ) using
J x = Ω 0 D C · n ^ d A Ω 0 d A .
Effective diffusion coefficients in the Y- and Z-directions were determined by repeating the above calculations with the appropriate changes in geometry. Finite element analysis for mechanical and diffusive properties was performed using Sierra/Aria [38]. Simulations utilized the generalized minimal residual (GMRES) method for the linear solution strategy with domain-decomposition incomplete LU factorization (DD-ILU) preconditioning, with the Newton method used for the nonlinear solution strategy.
Idealized models, such as these, have the advantage of computational savings, as they typically have notably fewer degrees of freedom compared to high-resolution models that capture features such as manufacturing defects and voids. The main role of the idealized models in this study is to cost-effectively run large sets of simulations with varying input parameters to perform sensitivity studies of the overall composite behavior with respect to these input parameters. The results are used to inform the high-resolution, or “as-manufactured” models in the next stage.
The parametric sensitivity studies were performed using Dakota [39]. The overall approach was to generate a large set of idealized models, where Latin hypercube sampling (LHS) was used to explore the set of model input parameters shown in Table 3. Elastic and diffusion simulations were performed on each input state, and the results were compiled to perform global variance-based sensitivity analysis and determine the influence of the model inputs on the output quantities of interest. In this study, the first-order Sobol’s sensitivity index [40,41] was used to quantify the relative influence among input variables, given by
S i = V i V ( y ) = V x i [ E ( y | x i ) ] V ( y ) ,
where S i measures the effect of varying x i on the output quantity of interest y as a fraction the total variance V ( y ) .
The nominal, lower bound, and upper bound values for each input parameter were informed by inspection of X-ray CT scans of actual composites, such as those shown in Figure 2, experimentally measured results for material properties, and the pre-existing literature.
Table 3. Input parameters of idealized models used as variables in the sensitivity analysis.
VariableUnitNominalLowerUpperReference
Warp tow width w w p cm0.350.300.40XCT
Warp tow height h w p cm0.060.050.07XCT
Weft tow width w w f cm0.350.300.40XCT
Weft tow height h w f cm0.0120.010.02XCT
Warp tow gap g w p cm0.030.00.04XCT
Weft tow gap g w f cm0.300.00.80XCT
Tow fiber volume fraction0.5750.550.70Exp., XCT
Matrix diffusivitymm2/s8.5 × 10−77.0 × 10−79.65 × 10−7Exp., [42]
Matrix modulusGPa2.502.103.60Exp., [43]
Matrix Poisson’s ratio0.3470.300.45Exp., [43]
Matrix exp. coef.0.300.17610.33Exp., [44]
Fiber modulusGPa73.065.085.0[45,46]
Fiber Poisson’s ratio0.220.100.30[45,46]

3.2. Image-Based Mesoscale Modeling Approach

From the image segmentation results shown in Figure 2, finite element meshes were generated using similar steps to those presented above and in [17,18]. First, images were cropped so the sub-volume of dimensions 11.36 mm × 24.3 mm × 2.93 mm shown in Figure 2, which was followed by the removal of small isolated regions of voxels (islands) containing a volume of 1000 voxels or less and applying a Gaussian blur to smooth the segmented images. Both steps were used to aid with solution convergence. A smaller region of interest was selected to generate a volume with sufficient mesh density while also maintaining tractability. Then, STL files were generated for each material using the marching cubes algorithm within Scikit-Image 0.22.0 [47]. The set of STL files was used as inputs to generate a tetrahedral finite element mesh using the CDFEM, as was carried out for the idealized geometry. The result of these steps is shown in Figure 5, where each material region is shown: voids (pink), weft-aligned tows (green), and surrounding resin (blue), which are combined with warp-aligned tows (red). The above steps were repeated for the 5th-percentile and 95th-percentile segmentation of the resin. The resulting finite element meshes each contained approximately 41 million linear tetrahedral elements.
Combined moisture absorption and hygroscopic swelling within a finite element model were included by leveraging the conservation of chemical species Equation (3) to resolve absorption and conservation of solid momentum Equation (2) to resolve stresses, strains, and displacements. The transient conservation of chemical species equation for a single species is given as
C t + v · C = · J ,
where t is the time, and v is the velocity. Again, Fick’s law of diffusion was used to approximate the molar flux. Here, the concentration was normalized by the saturated moisture concentration ( c s a t ) to ensure continuity across the interface between dissimilar materials using the approach presented in references [7,48]. For the image-based simulations, the linear elastic constitutive relation between stress and strain was defined as ε = S σ + β c s a t C I , where ε is the strain based on infinitesimal strain theory, S is the elastic compliance tensor, β is the hygroscopic expansion coefficient, and I is the identity tensor. Note, c s a t was included in the constitutive relation to account for the normalized concentration described above and within reference [49].
The input material properties for the image-based simulations were based on comparisons among experimental data and mesoscale modeling predictions using the analytical geometry. From the set of input constituents and geometric properties, as well as the effective quantities of interest, the input parameters that resulted in the best agreement with experimental data were then leveraged within the image-based simulations. The calculation of the best agreement was performed using the L1 norm between the experimental and predicted values. Next, comparisons between mechanical properties and hygroscopic expansion were made separately due to modeling disagreements discussed later in Section 4.1. Voids were included in the domain and were assigned a diffusivity of 0.26 cm2/s based on the diffusivity of water vapor into air [50] and reduced mechanical properties relative to fibers and resin: E = 100 Pa and ν = 0.001 (compressible). Lastly, the percent moisture uptake of the composite was determined based on the normalized concentration of each material region, the corresponding volume, and the maximum percent mass uptake of the resin determined experimentally. For the tow regions, the maximum percent mass uptake was determined using the available free volume approach presented in references [51,52] and knowledge of the matrix and fiber density and the fiber volume fraction in the tows. The resin density was determined experimentally to be about 1.14 g/cm3 on average across nine samples, and the fiber density was taken as 2.5 g/cm3 for typical E-glass fibers [53].
The boundary conditions used include removal of rigid body motion for the solid momentum equation through Dirichlet boundary conditions on displacement for three separate nodes. For the conservation of chemical species, a normalized concentration of 1 through Dirichlet boundary conditions was enforced on the top and bottom surfaces (Z+ and Z− surfaces, respectively, as shown in Figure 5). Only the top/bottom surfaces exhibited the specified concentration to represent a sub-volume within the composite domain, while the remaining sides exhibited no-flux boundary conditions. Simulations were performed until complete saturation was achieved.
Image-based simulations were performed within Sierra/Aria [38], where the governing equations were solved in a segregated manner to assist with solution convergence, as opposed to a fully coupled monolithic equation system. The solid momentum equation was solved first, then the conservation of chemical species for each time step. Simulations utilized the GMRES method for the linear solution strategy with DD-ILU preconditioning, with the Newton and line search methods used for the nonlinear solution strategy for the conservation of chemical species and momentum equations, respectively. Two nonlinear solution strategies were used to aid with solution convergence.

4. Results and Discussion

Results from the LHS study using the idealized geometry are presented first, which are followed by results from the simulations using image-based geometry.

4.1. Idealized Model Results and Sensitivity Analysis

From the results of the parametric study using LHS sampling with the idealized geometry, basic statistical behavior could be deduced. As a confirmation of the appropriate representative sample size for the range of input parameters defined in Table 3, the mean values of output quantities of interest were examined as a function of increasing sample size. Most output quantities converged to a stable mean within a few hundred samples. Shear modulus, however, reached convergence after about 700 samples, as plotted in Figure 6. For the main sample sweep in sensitivity analysis, a total size of 1200 samples was used, both to ensure representative statistical behavior and to allow a margin for the occasional simulation failure.
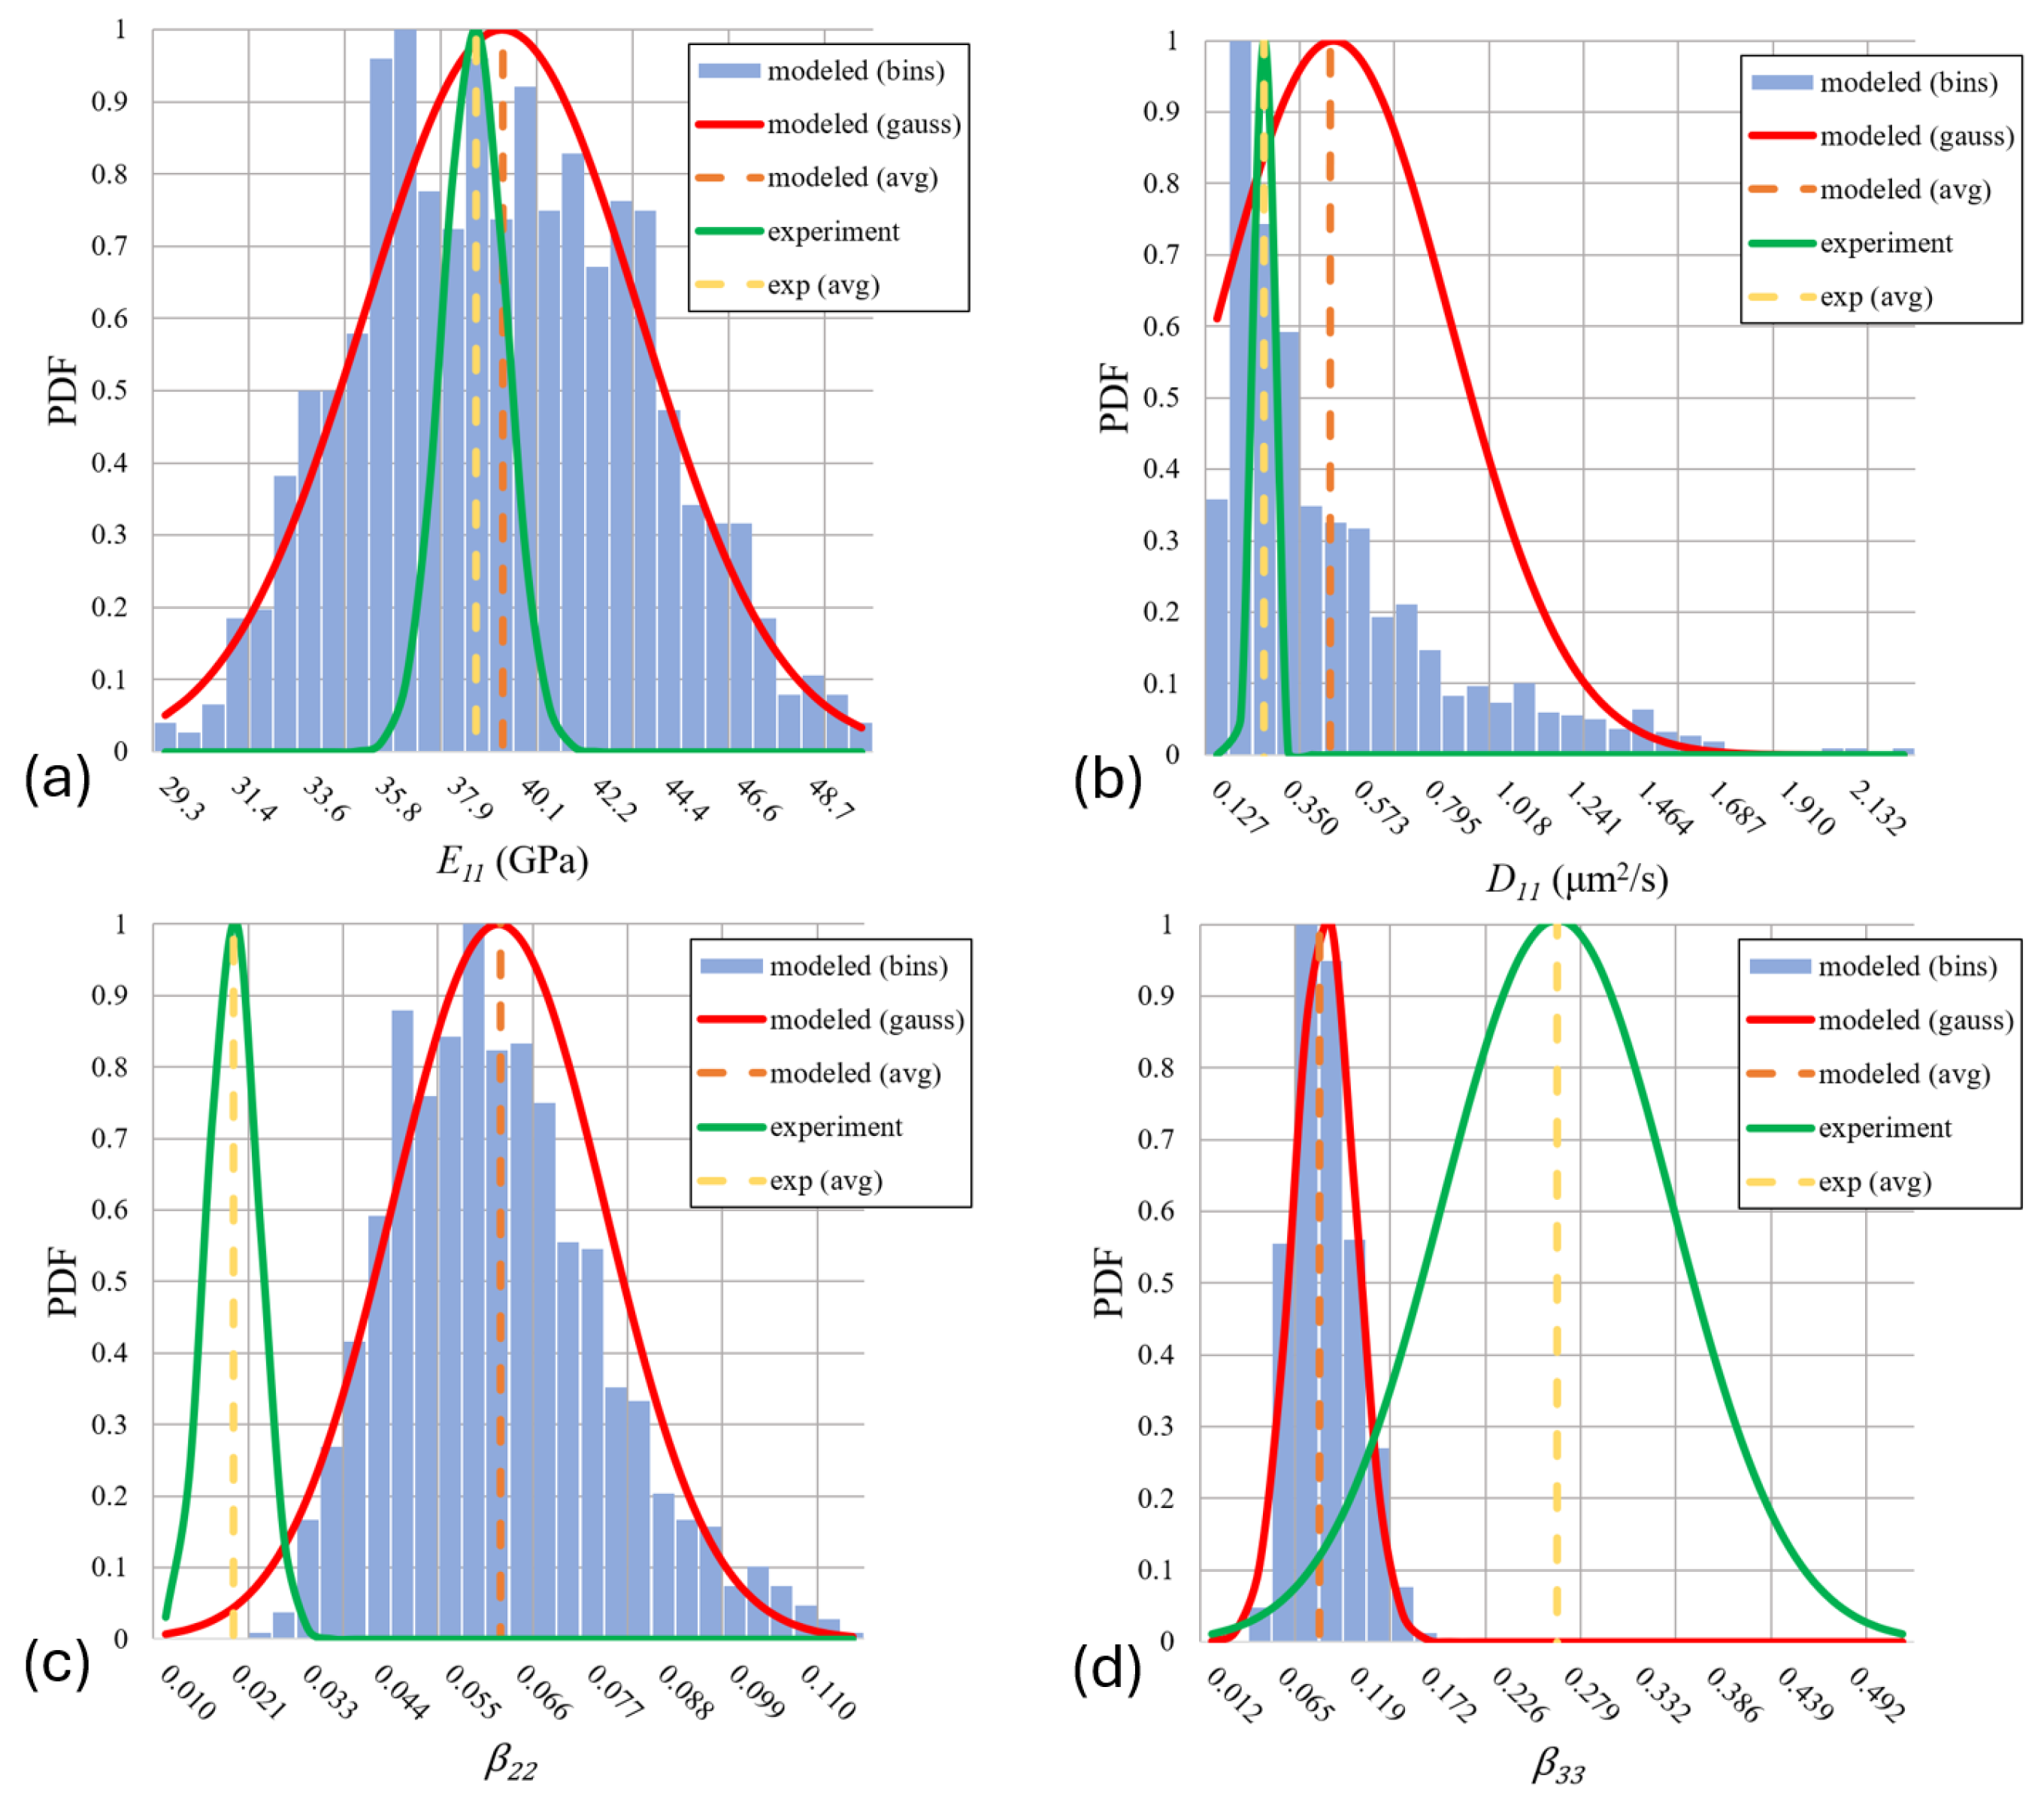
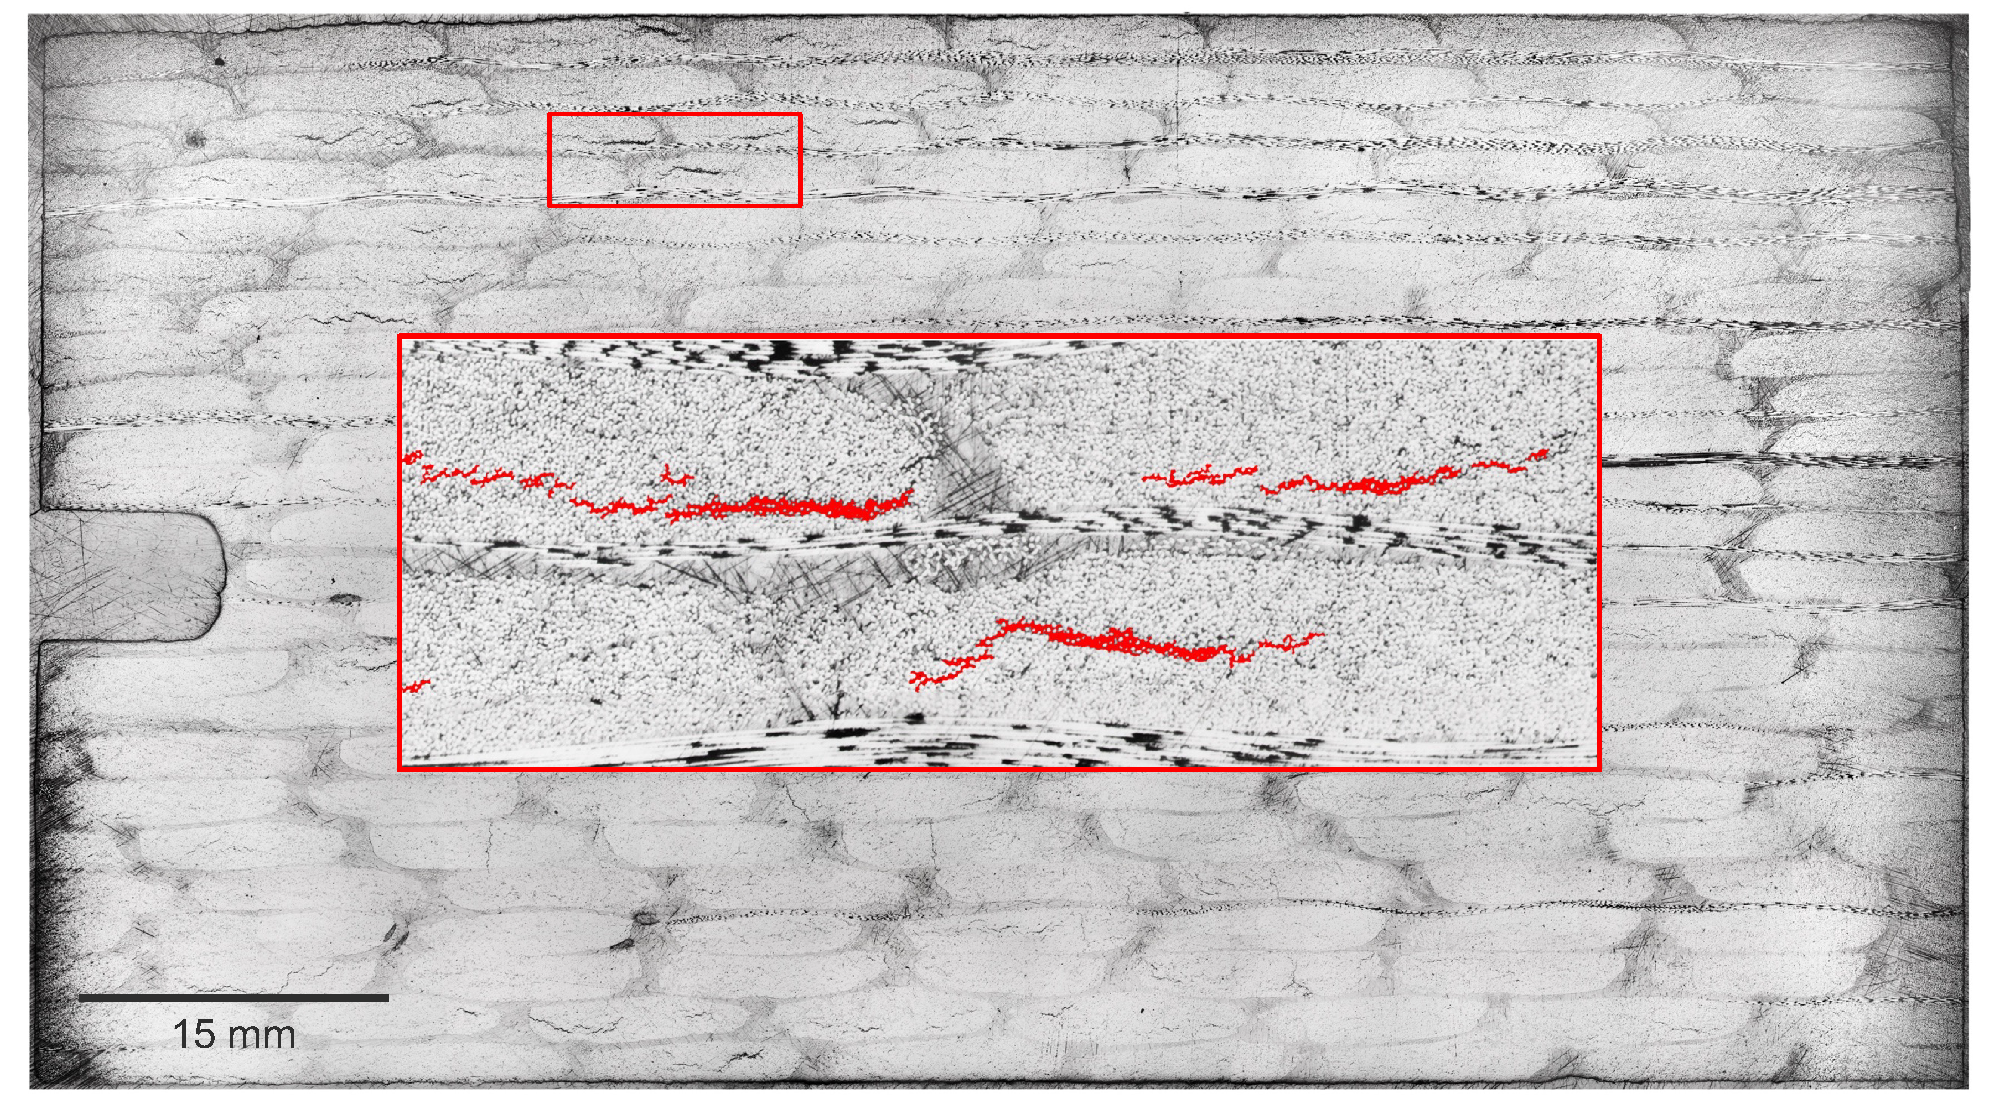
The mean and standard deviation of all output quantities of interest from the 1200-sample simulation are shown in Table 4. Where applicable, the corresponding experimentally measured values are included for comparison. Note that experimental values in Table 4 for longitudinal diffusivity correspond to values obtained from both the linear and least squares approaches shown in Table 1. The unit-scaled normal probability distributions of selected output quantities with experimentally measured means and standard deviations are overlaid with histograms of corresponding modeled results in Figure 7. There are varying levels of agreement between ideal modeled and experimentally measured values, with the most notable discrepancies in the hygroscopic expansion coefficients. For these properties, the precision in the method of measurement is limited, and factors such as cracking and imperfect interface bonding between fiber and matrix likely play a considerable role. Future efforts can focus on developing a standard (e.g., ASTM) to properly measure these material properties while mitigating damage formation and enhancing measurement precision. Figure 8 shows an image of a composite sample which has formed cracks due to moisture uptake. This cracking is unaccounted for in idealized models and could explain the nonlinear behavior leading to discrepancies between measured and modeled results. For diffusivity, however, there was good agreement between experimental values and the modeling predictions. This is due to diffusivity being primarily governed by the diffusivity of the matrix. As a result, the cracks observed within the tow regions shown in Figure 8 likely exhibit little influence on the effective diffusivity of the composite.
For most properties, the variance of the modeled results significantly exceeds that of the experimental data, with out-of-plane expansion coefficient as the only exception. This should not be surprising, since the parametric model sweep covers a whole range of possible input states, while the experimental data represent a small set of measurements from identically fabricated samples. It is noteworthy that while most properties display a visibly Gaussian probability distribution, the diffusivity histogram appears to take a more Weibull-like distribution. Further investigation into the reasons for this and what other properties it may apply to could be valuable for future predictive applications.
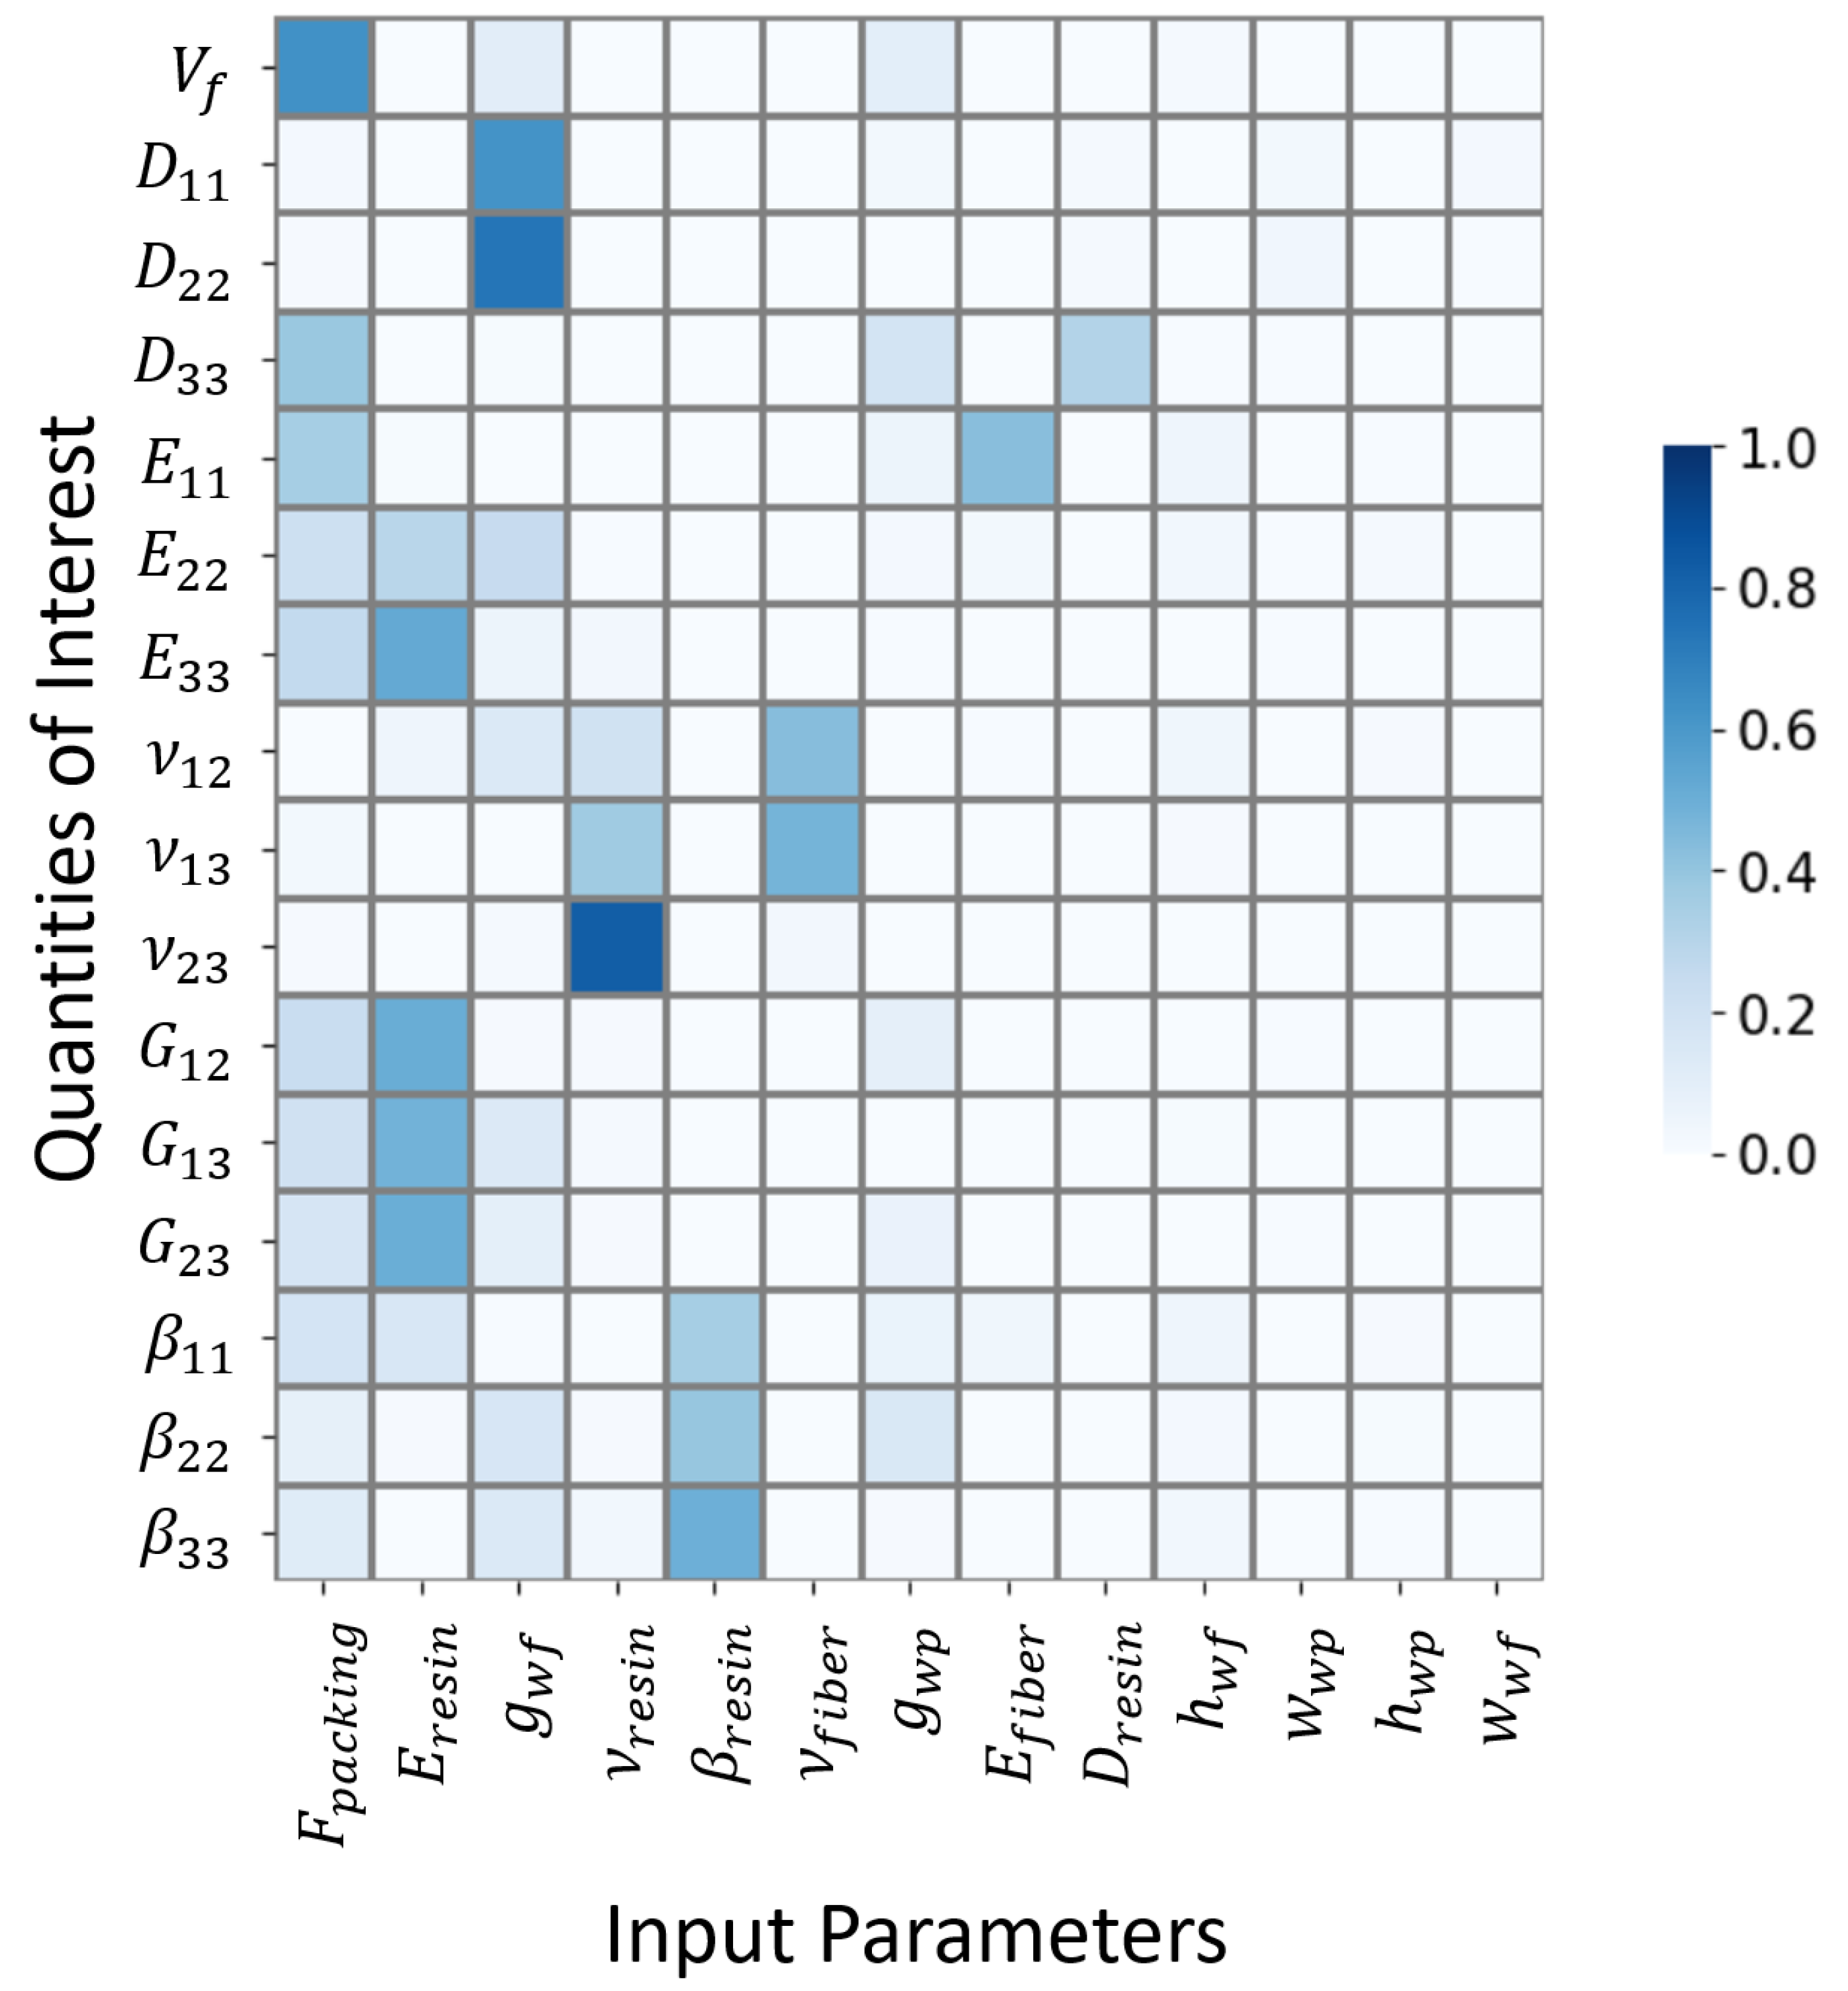
A mapping of Sobol’s sensitivity indexes between input parameters and output quantities of interest is shown in Figure 9. Many strong correlations seen are intuitive, such as the influence of the effective modulus of the warp tows on longitudinal modulus, or that of fiber packing on total fiber volume fraction. The cross-sectional dimensions of the tows have very little effect on the output quantities of interest. Only the gap between tows exhibits a larger influence on effective diffusion coefficients, as expected. Tow measurements that have low influence on output quantities may be overshadowed by large ranges of the material properties. If these material property ranges were further narrowed, tow dimensions may show greater sensitivity. These results can be leveraged to direct future studies with greater focus on a reduction in material property ranges to reduce prediction uncertainty. Furthermore, these results can be leveraged by manufacturers to target a specific effective property for optimization. For example, if a reduction in effective diffusivity is desired, these results suggest modifying the manufacturing process to minimize the gap among tows first, compared to reducing resin diffusivity.

4.2. Image-Based Modeling Results

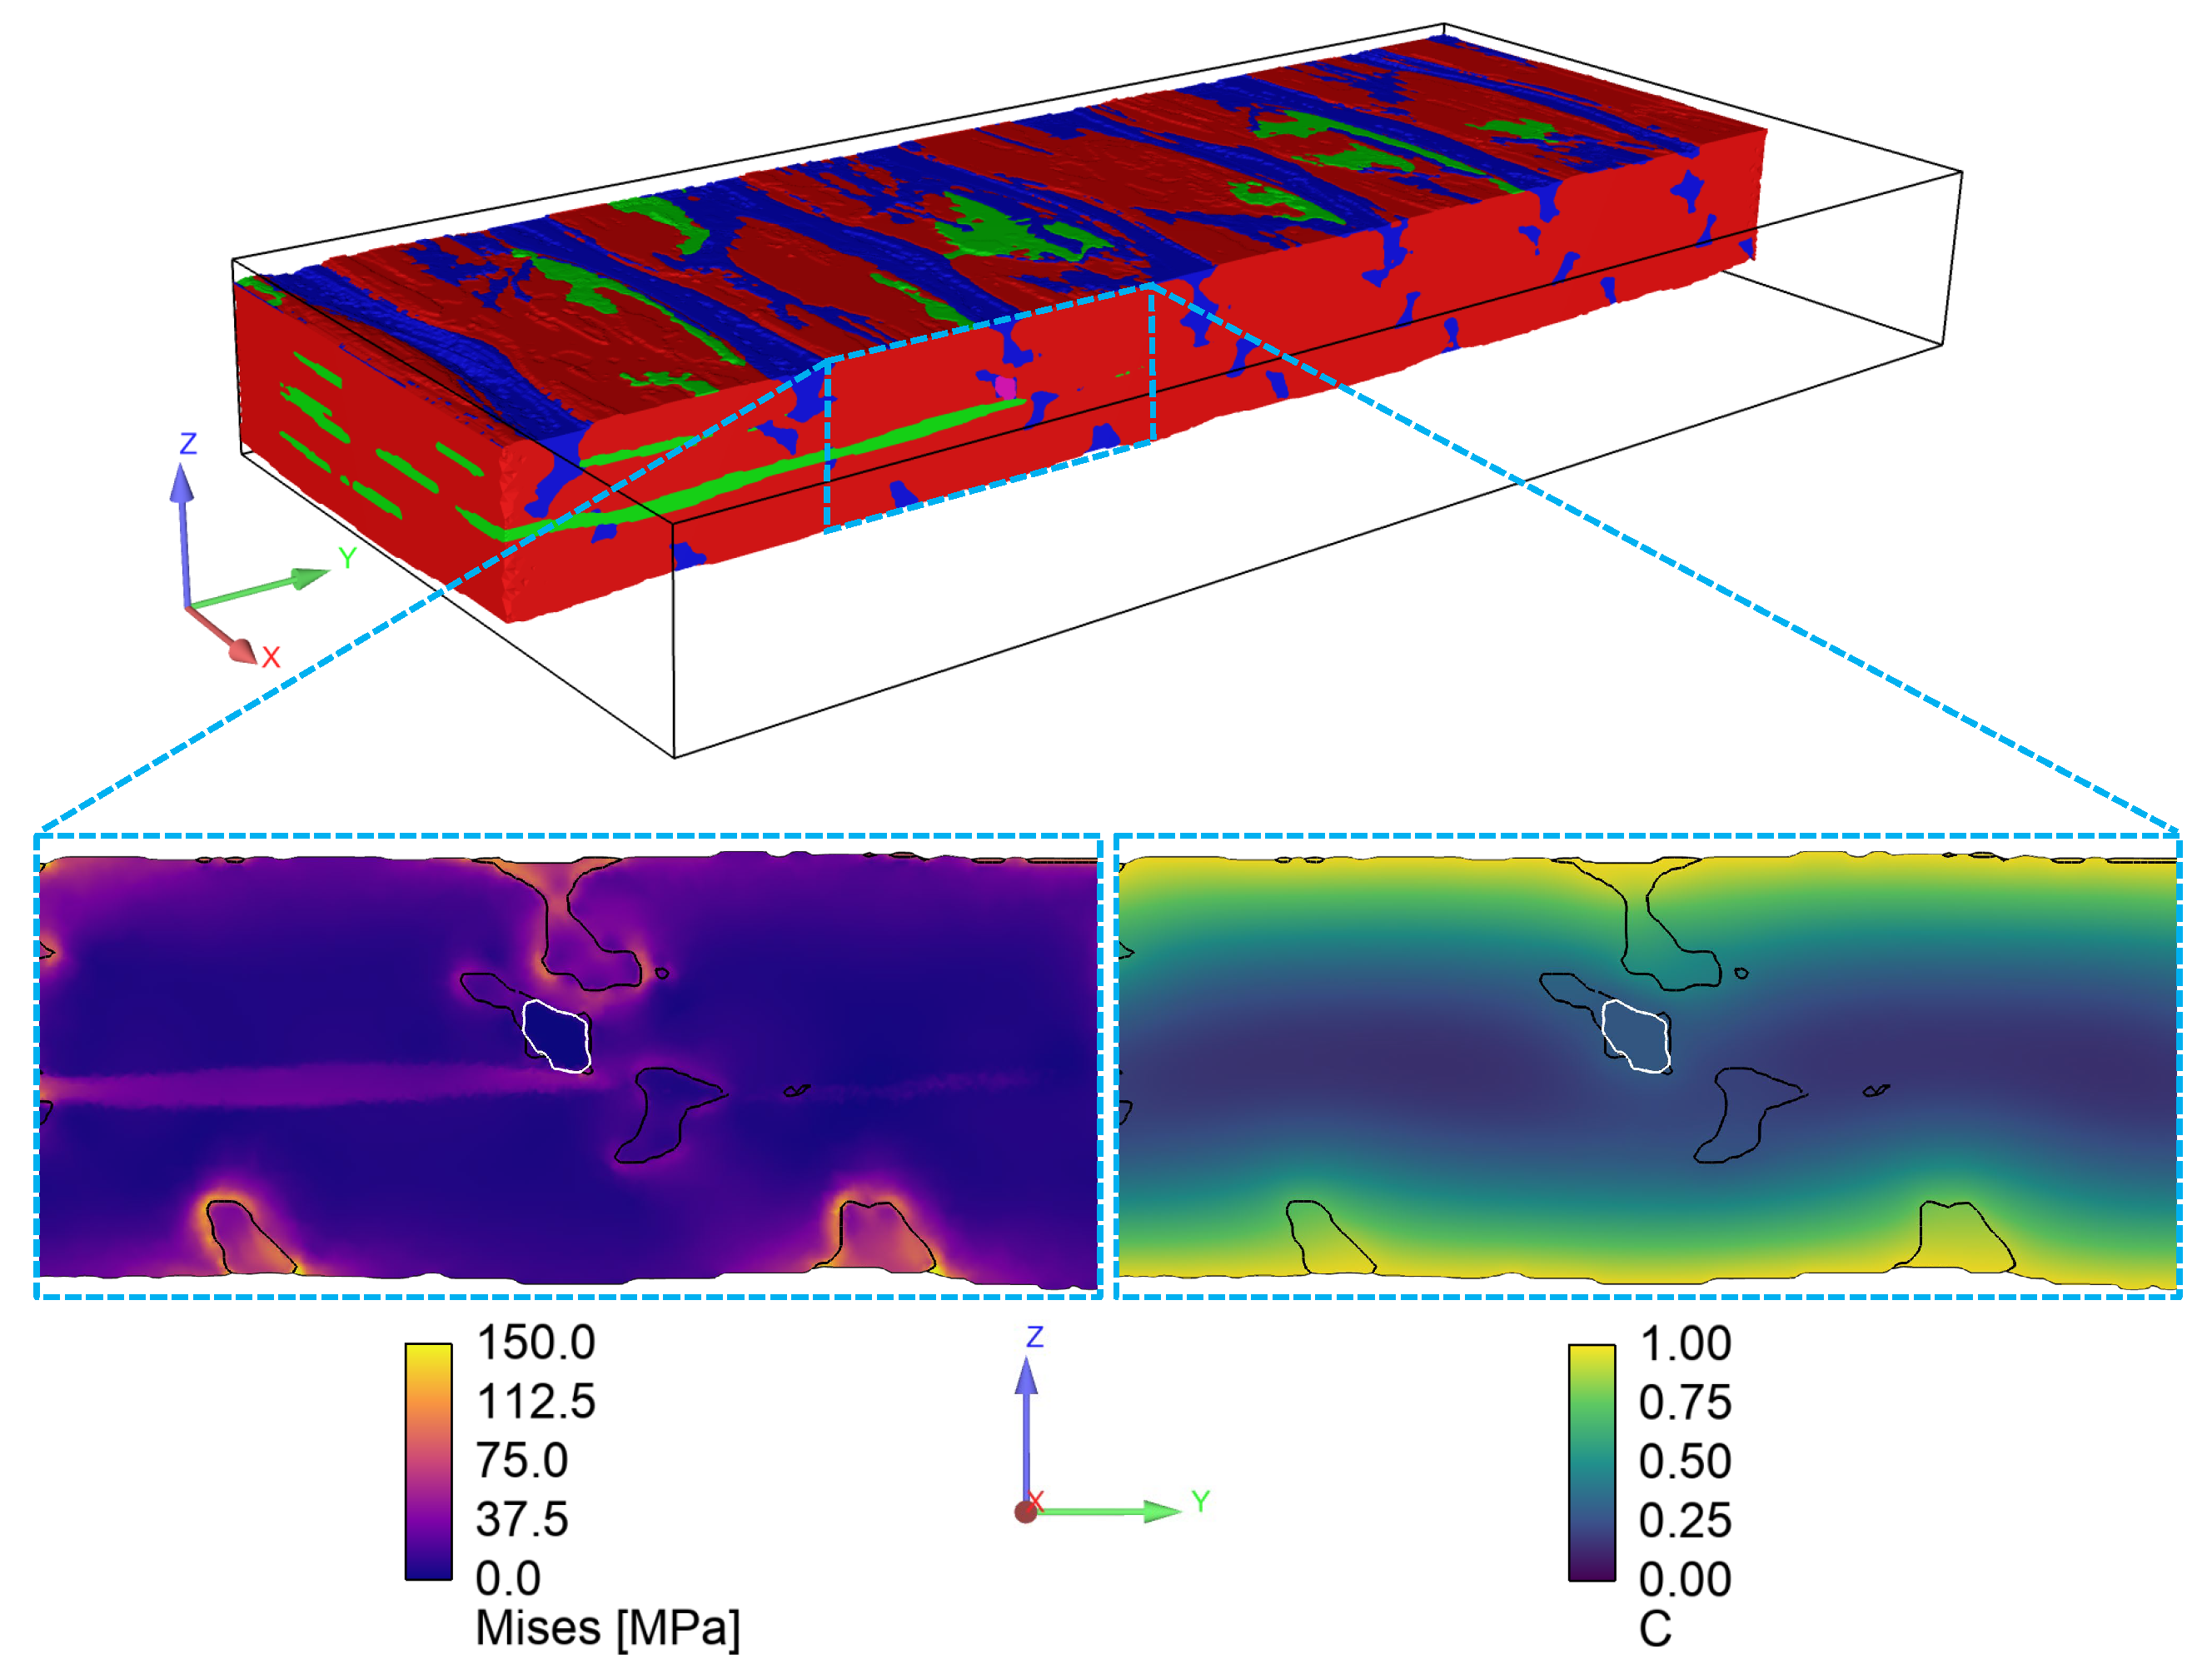
Figure 10 shows the resulting distribution of von Mises stresses (left) and normalized concentration (right) at t 855 (approximately 8.5 days). Cross-sections of the void phase are outlined in white, while the resin phase is outlined in black. From these images, two key items are shown to assess the influence of material properties on stress concentrations and moisture absorption. First, it can be seen that stress concentrations accumulate at the tow/resin interface and at the void interface. This accumulation of stress is expected, given the difference in material properties. As a result, these areas of high stress likely indicate where material failure could initiate. Future work can, for example, explore/predict failure in these regions by leveraging cohesive zone models or the eXtended finite element method implemented in the commercially available software Abaqus®.
Second, stress accumulation also occurs in regions of higher normalized concentration corresponding to the resin. This is a direct result of the hygroscopic expansion being higher for the resin compared to the tows, which ultimately leads to decreased durability of the composite due to degradation of the fiber/matrix interface [54]. Furthermore, we can observe the higher normalized concentration near the voids. Because of their assumed higher diffusivity (orders of magnitude greater), the voids act as preferential pathways for moisture absorption. The influence of voids in the simulation as a whole, however, is minimal due to the void volume fraction being approximately 0.03%. For composites containing greater porosity, the influence of voids is expected to be greater. In this case, careful consideration of void size, shape, and connectivity must be determined to understand how effective matrix diffusivity increases or decreases with voids acting as preferential pathways or as barriers to moisture diffusion, respectively [55,56].
These defects captured through imaging and directly represented within the simulation enable a better understanding of the extent to which these features influence stress and absorption over time, a phenomenon not accounted for in the idealized geometry. While simulations using idealized geometry are invaluable for parameterizing the design space, image-based simulations are essential to understand the effects of defects and composite heterogeneity.
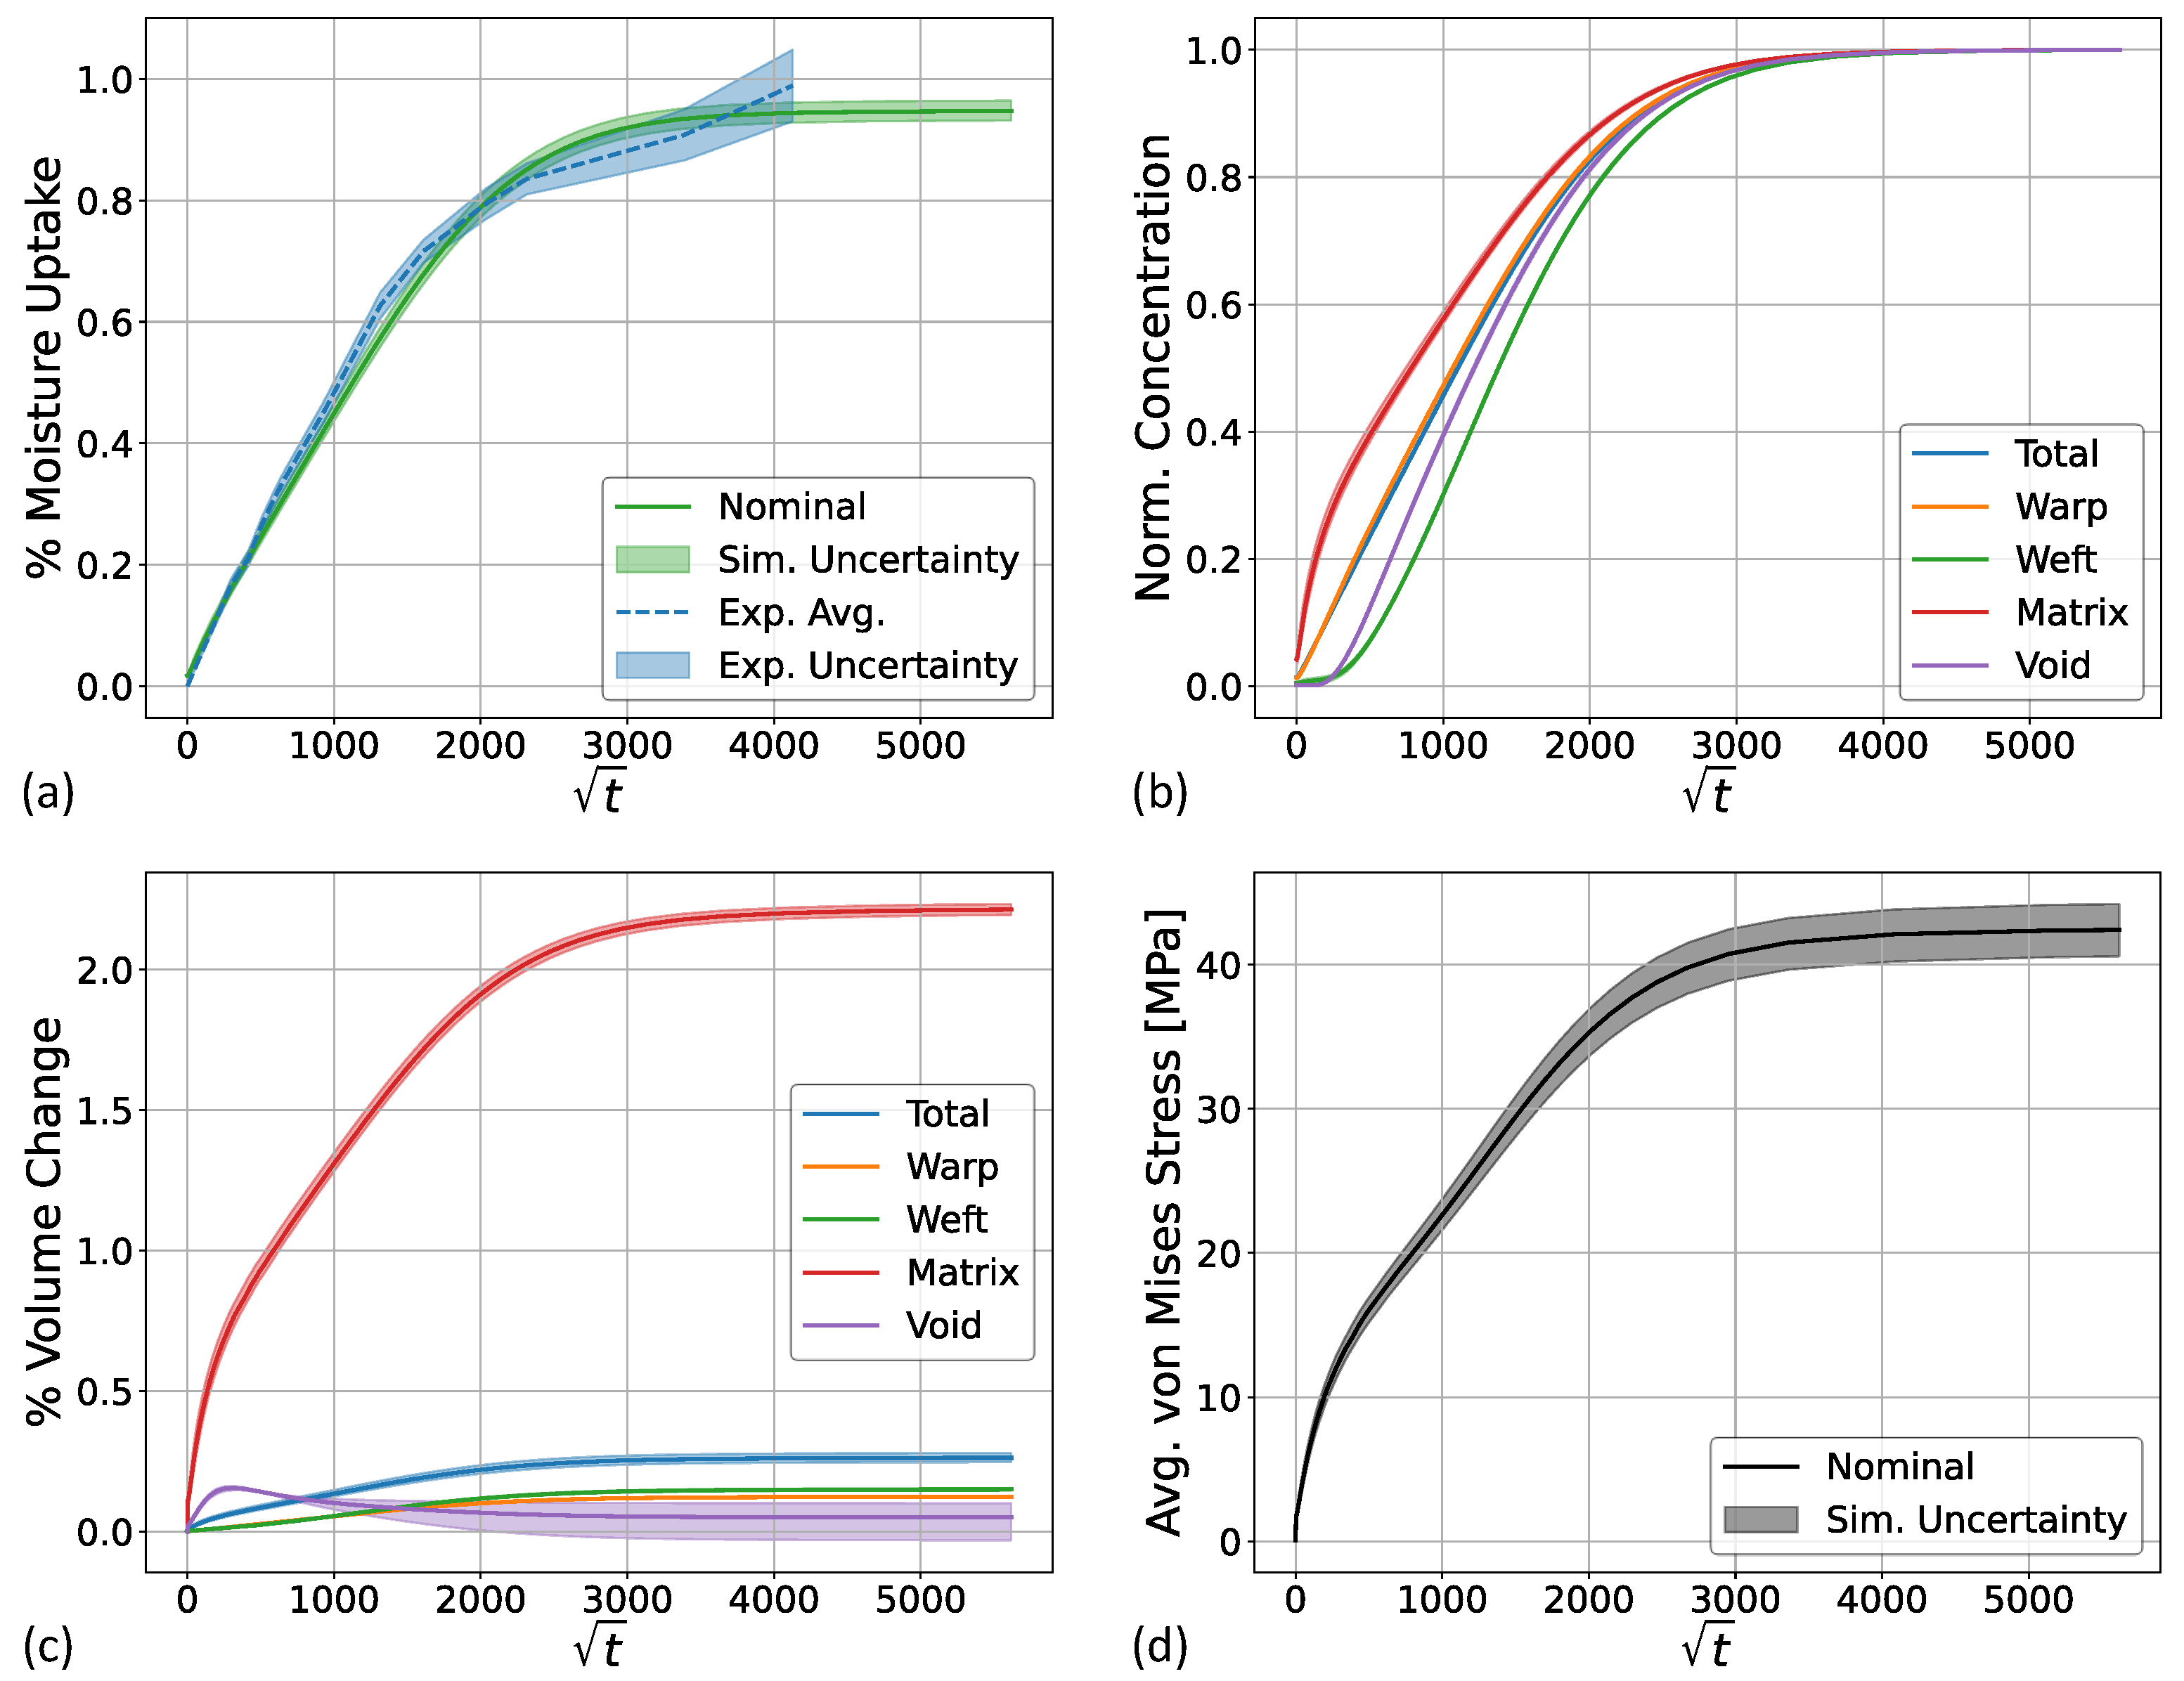
Beyond visualizing simulation results, additional quantities of interest can be determined from the image-based simulations. Figure 11 shows four quantities of interest extracted from the image-based simulations as described in Section 2.2: percent moisture uptake, volume-averaged von Mises stress, percent volume change for each region, and normalized concentration for the individual material regions and total. In each figure, the solid line corresponds to the simulations with the nominal mesh, while the shaded regions represent results bounded by solutions using the 5th-percentile and 95th-percentile segmentation of the resin.
First, in Figure 11a, we observe that simulation results agree well with experimental data, where the dashed experimental blue line corresponds to the mean across four samples and the shaded region for uncertainty corresponds to ± 2 standard deviations away from the mean. A slight under-prediction of percent moisture uptake occurs at early times with better agreement near full saturation. The under-prediction of percent moisture uptake likely stems from the under-segmentation of the resin. With increased resin volume from the 5th-percentile segmentation result (upper bound), there is better agreement with the experimental data. However, despite probing the probability maps of the resin region, errors in segmentation may still persist. This result demonstrates the critical need for high-resolution and high-contrast images from X-ray CT to make accurate segmentation of the material regions. Re-imaging the samples for a reduced region of interest with improved contrast and signal-to-noise ratio will help confirm the accuracy of the image segmentation results. Near full saturation at time t 3000 , a slight over-prediction of percent moisture uptake occurs. This may stem from the sample variability/uncertainty of the maximum percent mass uptake of the resin samples. Future work can explore the parametric uncertainty of mass uptake combined with segmentation uncertainty to quantify their joint effects on model prediction.
In general, these results demonstrate that the image-based simulation workflow presented is representative of the glass/epoxy composites of interest and can be used to make predictions of mass uptake. There is uncertainty as well in the composite experimental data, particularly at the final time, where the spread increases and moisture uptake exhibits a secondary increase (above t = 3500 or about 140 days). These results are likely influenced by the accumulation of damage exhibited in the composite at a later time, as shown in Figure 8 and discussed previously in Section 4.1, as opposed to non-Fickian diffusion behavior.
Second, Figure 11b,c shows the change in normalized concentration and percent volume change for each of the material regions of interest. In general, the shape of these curves closely follows that of moisture uptake, as expected. These images also show the differences for each material region. For example, concentration within voids does not increase until a later time due to the voids only being present away from the free surface. As moisture reaches the voids, however, their concentration increases at a faster rate. Furthermore, volume change within the material regions exhibits a non-linear relationship with time, where peak changes in volume closely correspond with large changes in concentration near the beginning of the simulation, as moisture is first introduced and at about t = 2250, where a majority of the composite is fully saturated. Each material region increases in volume with increasing time, except for the compressible voids. These regions are completely surrounded by the tows and matrix, which increase in volume due to hygroscopic expansion and subsequently begin to collapse the voids. For the lower bound, the final void volume is below the initial, which results in a negative volume percent change. Overall, the volume change due to hygroscopic expansion was relatively low for the entire composite domain, less than 0.5% in total.
Third, the volume average von Mises stress shown in Figure 11d closely matches the observed trends for volume change in Figure 11c with a non-linear change in stress with increasing time, and two large changes in slope near the beginning of the simulation and at about t = 2250. Additionally, as resin volume increases compared to the nominal case (e.g., upper bound from the 5th-percentile segmentation result), the average von Mises stress increases as expected due to the increased volume fraction and increased resin hygroscopic expansion compared to the tows. The volume-averaged von Mises stress overall is less compared to the concentrations observed in Figure 10 due to lower stress distribution away from the material interfaces. Nonetheless, these simulation results highlight the relationship between moisture uptake, deformation, and stress distributions, which can provide insight into estimating the residual stresses experienced by these composites when deployed in marine energy environments.

5. Conclusions

This study aims to advance the understanding of model input material and geometric parameters on performance of marine energy-based fiber-reinforced composites (FRCs) at the mesoscale. The mesoscale model consists of two geometries: an idealized geometry where individual tows exhibit no mesoscale flaws or defects, and an image-based geometry where defects such as voids and nonuniform tow shape or cross-section, as captured by X-ray computed tomography (CT), are explicitly represented. The idealized geometry was leveraged to quickly assess a range of material and geometric parameters collected from open literature and experimental testing to perform a parametric study and subsequently assess the influence of individual model input parameters on bulk/effective moduli, Poisson’s ratios, hygroscopic expansion coefficients, and diffusivity. The image-based geometry was leveraged to visualize and quantify the influence of an as-manufactured geometry on moisture uptake, volume change, and stress concentrations/distributions, whose input parameters were based on results from the idealized geometry. These quantities of interest were selected as key parameters for determining the long-term performance of FRCs within marine energy environments. The results from this study can ultimately be leveraged to quickly evaluate how key constituent properties affect the overall composite material properties. This insight is crucial for materials optimization when developing more durable components and for analyzing the potential cost-performance relationship when selecting materials prior to manufacturing. Furthermore, the workflow implemented is flexible to be applied to additional FRCs of interest within marine energy environments (e.g., carbon fiber or hybrid glass/carbon fiber composites). Lastly, the workflow implemented serves as a foundational analysis of linear elastic properties, from which future efforts can leverage the results presented to further investigate more complex phenomena such as damage modeling, cyclic fatigue, or saltwater degradation, for example.
The key findings from this work include the following:
  • The idealized geometry constructed in this work can easily be generated, which enables many hundreds of simulations to be executed and used to perform a parametric sensitivity analysis on model input parameters.
  • Based on the distribution of experimental data of effective properties, it was shown that the predicted values for moduli, Poisson’s ratios, and diffusion coefficients agreed well when utilizing the idealized geometry. Predicted hygroscopic swelling coefficients, however, exhibited greater disagreement. This disagreement likely stems from moisture absorption-induced damage, where cracks were observed after full saturation. Accounting for these damage features is the subject of future efforts.
  • Construction of the image-based geometry by leveraging deep learning based image segmentation is robust at identifying the key features of interest. Predicted moisture uptake from the image-based geometry showed good agreement with experimental data, but slightly under-predicted moisture uptake at early times.
  • Image segmentation uncertainty was explored by probing the 5- and 95-percentile probability map segmentation of the resin. Increased resin volume fraction generated from the 5th-percentile showed improved results compared to the nominal case. Moisture uptake, however, was still under-predicted at early times. One area of future improvement identified stems from acquiring additional X-ray CT images with enhanced resolution and contrast to validate the image segmentation accuracy. These results demonstrate the need for high-quality image data when performing image-based simulations.
  • Image-based simulation results further highlighted regions of stress concentration on fiber/resin interfaces as expected, which also correlated well with regions of high resin concentration. These results stem from the high hygroscopic swelling of the resin relative to the tows. These results ultimately inform areas/regions where failure is likely to initiate.

Author Contributions

P.J.C.: conceptualization, methodology, software, validation, visualization, formal analysis, investigation, writing—original draft, writing—review and editing, supervision, project administration, funding acquisition; E.M.A.: methodology, software, validation, visualization, formal analysis, investigation, writing—original draft, writing—review and editing; O.B.: resources, visualization, investigation, writing—review and editing; D.M.: resources, writing—review and editing; B.A.H.-S.: conceptualization, writing—review and editing, supervision, project administration, funding acquisition. All authors have read and agreed to the published version of the manuscript.

Funding

The authors thank the U.S. Department of Energy’s Water Power Technologies Office for funding. Sandia National Laboratories is a multimission laboratory managed and operated by National Technology & Engineering Solutions of Sandia, LLC, a wholly owned subsidiary of Honeywell International Inc., for the U.S. Department of Energy’s National Nuclear Security Administration under contract DE-NA0003525. This paper describes objective technical results and analysis. Any subjective views or opinions that might be expressed in the paper do not necessarily represent the views of the U.S. Department of Energy or the United States Government.

Data Availability Statement

Data will be made available upon reasonable request.

Acknowledgments

The authors thank Collin Shepard for fruitful discussions and input, as well as Troy Shilt and Jeffery Horner for support of this work through internal peer review.

Conflicts of Interest

The authors declare that no conflicts of interest pertaining to this work which may have inappropriately influenced the representation or interpretation of reported research results. The funders had no role in the design of the study, or in the collection, analyses, interpretation of data, in the writing of the manuscript, or in the decision to publish the results.

References

  1. Anderson, E.; Gunawan, B.; Nicholas, J.; Ingraham, M.; Hernandez-Sanchez, B.A. A multicontinuum-theory-based approach to the analysis of fiber-reinforced polymer composites with degraded stiffness and strength properties due to moisture absorption. J. Mar. Sci. Eng. 2023, 11, 421. [Google Scholar] [CrossRef]
  2. Rubino, F.; Nisticò, A.; Tucci, F.; Carlone, P. Marine application of fiber reinforced composites: A review. J. Mar. Sci. Eng. 2020, 8, 26. [Google Scholar] [CrossRef]
  3. Chen, N.Z.; Sun, H.H.; Soares, C.G. Reliability analysis of a ship hull in composite material. Compos. Struct. 2003, 62, 59–66. [Google Scholar] [CrossRef]
  4. Guo, K.; Deng, Y.; Ren, Y.; Jiang, H. Multi-scale moisture diffusion modeling and analysis of carbon/Kevlar-fiber hybrid composite laminates under the hygrothermal aging environment. Polym. Degrad. Stab. 2024, 229, 110952. [Google Scholar] [CrossRef]
  5. Ursache, Ş.; Cerbu, C.; Hadăr, A. Characteristics of Carbon and Kevlar Fibres, Their Composites and Structural Applications in Civil Engineering—A Review. Polymers 2023, 16, 127. [Google Scholar] [CrossRef]
  6. Shubha, M.; Parimala, H.; Vijayan, K. Moisture uptake by Keviar fibres. J. Mater. Sci. Lett. 1993, 12, 60–62. [Google Scholar] [CrossRef]
  7. Wang, J.; Li, Y.; Yu, T.; Li, Q.; Li, Z. Anisotropic behaviors of moisture absorption and hygroscopic swelling of unidirectional flax fiber reinforced composites. Compos. Struct. 2022, 297, 115941. [Google Scholar] [CrossRef]
  8. Krauklis, A.E.; Gagani, A.I.; Echtermeyer, A.T. Prediction of orthotropic hygroscopic swelling of fiber-reinforced composites from isotropic swelling of matrix polymer. J. Compos. Sci. 2019, 3, 10. [Google Scholar] [CrossRef]
  9. Arun, K.; Basavarajappa, S.; Sherigara, B. Damage characterisation of glass/textile fabric polymer hybrid composites in sea water environment. Mater. Des. 2010, 31, 930–939. [Google Scholar] [CrossRef]
  10. Wu, L.; Murphy, K.; Karbhari, V.M.; Zhang, J.S. Short-term effects of sea water on E-glass/vinylester composites. J. Appl. Polym. Sci. 2002, 84, 2760–2767. [Google Scholar] [CrossRef]
  11. Verdant Power. 2025. Available online: https://verdantpower.com/ (accessed on 26 September 2025).
  12. ORPC. 2025. Available online: https://orpc.co/ (accessed on 26 September 2025).
  13. Raye, R.; Nichols, C.; Bharath, A.; Candon, C.; Baca, E. Data Acquisition and Control for Marine Energy Devices: Cost Considerations; Technical Report; National Renewable Energy Laboratory (NREL): Golden, CO, USA, 2024.
  14. Ulvgård, L.; Kamf, T.; Risberg, A.; Leijon, M. Portable data acquisition system for offshore applications. IEEE J. Ocean. Eng. 2018, 44, 719–727. [Google Scholar] [CrossRef]
  15. Hayman, B.; Wedel-Heinen, J.; Brøndsted, P. Materials challenges in present and future wind energy. Mrs Bull. 2008, 33, 343–353. [Google Scholar] [CrossRef]
  16. Ciang, C.C.; Lee, J.R.; Bang, H.J. Structural health monitoring for a wind turbine system: A review of damage detection methods. Meas. Sci. Technol. 2008, 19, 122001. [Google Scholar] [CrossRef]
  17. Collins, L.N.; Roberts, S.A. Mesoscale simulation of woven composite design decisions. arXiv 2021, arXiv:2104.13554. [Google Scholar] [CrossRef]
  18. Foster, C.W.; Collins, L.N.; Panerai, F.; Roberts, S.A. Assessing Parameterized Geometric Models of Woven Composites using Image-Based Simulations. arXiv 2023, arXiv:2302.09480. [Google Scholar] [CrossRef]
  19. Trembacki, B.L.; Mistry, A.N.; Noble, D.R.; Ferraro, M.E.; Mukherjee, P.P.; Roberts, S.A. Mesoscale analysis of conductive binder domain morphology in lithium-ion battery electrodes. J. Electrochem. Soc. 2018, 165, E725–E736. [Google Scholar] [CrossRef]
  20. Sinchuk, Y.; Pannier, Y.; Gueguen, M.; Tandiang, D.; Gigliotti, M. Computed-tomography based modeling and simulation of moisture diffusion and induced swelling in textile composite materials. Int. J. Solids Struct. 2018, 154, 88–96. [Google Scholar] [CrossRef]
  21. Vanaerschot, A.; Panerai, F.; Cassell, A.; Lomov, S.V.; Vandepitte, D.; Mansour, N.N. Stochastic characterisation methodology for 3-D textiles based on micro-tomography. Compos. Struct. 2017, 173, 44–52. [Google Scholar] [CrossRef]
  22. ASTM D3039/D3039M-08; Standard Test Method for Tensile Properties of Polymer Matrix Composite Materials. ASTM International: West Conshohocken, PA, USA, 2014.
  23. ASTM D3518/D3518M-18; Standard Test Method for In-Plane Shear Response of Polymer Matrix Composite Materials by Tensile Test of a ±45° Laminate. ASTM International: West Conshohocken, PA, USA, 2018.
  24. ASTM D638-14; Standard Test Method for Tensile Properties of Plastics. ASTM International: West Conshohocken, PA, USA, 2018.
  25. ASTM-D5229; Standard Test Method for Moisture Absorption Properties and Equilibrium Conditioning of Polymer Matrix Composite Materials. ASTM International: West Conshohocken, PA, USA, 2020.
  26. Zhang, G.; Allaire, D.; Cagan, J. Taking the guess work out of the initial guess: A solution interval method for least-squares parameter estimation in nonlinear models. J. Comput. Inf. Sci. Eng. 2021, 21, 021011. [Google Scholar] [CrossRef]
  27. Mourad, A.H.I.; Abdel-Magid, B.M.; El-Maaddawy, T.; Grami, M.E. Effect of seawater and warm environment on glass/epoxy and glass/polyurethane composites. Appl. Compos. Mater. 2010, 17, 557–573. [Google Scholar] [CrossRef]
  28. Miller, D.; Mandell, J.; Samborsky, D.; Hernandez-Sanchez, B.; Griffith, D.T. Performance of composite materials subjected to salt water environments. In Proceedings of the 53rd AIAA/ASME/ASCE/AHS/ASC Structures, Structural Dynamics and Materials Conference 20th AIAA/ASME/AHS Adaptive Structures Conference 14th AIAA, Honolulu, HI, USA, 23–26 April 2012; p. 1575. [Google Scholar]
  29. Hexion. EPIKOTE™ Resin MGS™ RIMR 135 and EPIKURE™ Curing Agent MGS™ RIMH 134–RIMH 137. 2006. Available online: https://www.metyx.com/wp-content/uploads/PDF_Files/Hexion/TDS/TDS%20RIMH%20137.pdf (accessed on 26 September 2025).
  30. Comet. Dragonfly. 2023. Available online: https://dragonfly.comet.tech/ (accessed on 26 September 2025).
  31. Novikov, A.A.; Major, D.; Wimmer, M.; Lenis, D.; Bühler, K. Deep sequential segmentation of organs in volumetric medical scans. IEEE Trans. Med. Imaging 2018, 38, 1207–1215. [Google Scholar] [CrossRef]
  32. Zeiler, M.D. ADADELTA: An adaptive learning rate method. arXiv 2012, arXiv:1212.5701. [Google Scholar] [CrossRef]
  33. Krygier, M.C.; LaBonte, T.; Martinez, C.; Norris, C.; Sharma, K.; Collins, L.N.; Mukherjee, P.P.; Roberts, S.A. Quantifying the unknown impact of segmentation uncertainty on image-based simulations. Nat. Commun. 2021, 12, 5414. [Google Scholar] [CrossRef]
  34. Noble, D.R.; Newren, E.P.; Lechman, J.B. A conformal decomposition finite element method for modeling stationary fluid interface problems. Int. J. Numer. Methods Fluids 2010, 63, 725–742. [Google Scholar] [CrossRef]
  35. Roberts, S.A.; Mendoza, H.; Brunini, V.E.; Noble, D.R. A verified conformal decomposition finite element method for implicit, many-material geometries. J. Comput. Phys. 2018, 375, 352–367. [Google Scholar] [CrossRef]
  36. Chamis, C.C. Simplified composite micromechanics equations for hygral, thermal and mechanical properties. In Proceedings of the Annual Conference of the Society of the Plastics Industry (SPI) Reinforced Plastics/Composites Institute, Houston, TX, USA, 7–11 February 1983. number NASA-TM-83320. [Google Scholar]
  37. Yu, W. Multiscale Structural Mechanics: Top-Down Modelling of Composites Using the Structural Genome; Wiley: Hoboken, NJ, USA, 2019. [Google Scholar]
  38. SIERRA Thermal/Fluid Development Team. SIERRA Multimechanics Module: Aria User Manual, Version 5.10; Technical Report SAND2022-12436; Sandia National Laboratories: Albuquerque, NM, USA, 2022. [CrossRef]
  39. Adams, B.M.; Bohnhoff, W.J.; Dalbey, K.R.; Ebeida, M.S.; Eddy, J.P.; Eldred, M.S.; Hooper, R.W.; Hough, P.D.; Hu, K.T.; Jakeman, J.D.; et al. DAKOTA, A Multilevel Parallel Object-Oriented Framework for Design Optimization, Parameter Estimation, Uncertainty Quantification, and Sensitivity Analysis (V.6.16 User’s Manual); Sandia National Laboratories: Albuquerque, NM, USA, 2021. [CrossRef]
  40. Winokur, J. Empirical Sensitivity Analysis for Scalar and Field Quantities; Technical Report; Sandia National Lab. (SNL-NM): Albuquerque, NM, USA, 2020.
  41. Li, C.; Mahadevan, S. An efficient modularized sample-based method to estimate the first-order Sobol’ index. Reliab. Eng. Syst. Saf. 2016, 153, 110–121. [Google Scholar] [CrossRef]
  42. TORE. TUHH Open Research. 2024. Available online: https://tore.tuhh.de/ (accessed on 7 April 2025).
  43. University, M.S. 3D Static Elastic and Strength Properties of a Glass/Epoxy Unidirectional Laminate. 2024. Available online: https://www.montana.edu/composites/documents/3D%20Static%20Property%20Report-2.pdf (accessed on 7 April 2025).
  44. Teverovsky, A. Environmentally Induced Swelling and Shrinkage of Molding Compounds in PEMs; NASA/GSFC: Greenbelt, MD, USA, 2002.
  45. MatWeb. MatWeb Material Property Data. 2024. Available online: https://www.matweb.com (accessed on 7 April 2025).
  46. Ruggiero, A.; Merola, M.; Carlone, P.; Archodoulaki, V.M. Tribo-mechanical characterization of reinforced epoxy resin under dry and lubricated contact conditions. Compos. Part Eng. 2015, 79, 595–603. [Google Scholar] [CrossRef]
  47. van der Walt, S.; Schönberger, J.L.; Nunez-Iglesias, J.; Boulogne, F.; Warner, J.D.; Yager, N.; Gouillart, E.; Yu, T.; the scikit-image contributors. Scikit-image: Image processing in Python. PeerJ. 2014, 2, e453. [Google Scholar] [CrossRef] [PubMed]
  48. Wong, E.; Koh, S.; Lee, K.; Rajoo, R. Advanced moisture diffusion modeling and characterisation for electronic packaging. In Proceedings of the 52nd Electronic Components and Technology Conference 2002, San Diego, CA, USA, 28–31 May 2002; (Cat. No. 02CH37345). IEEE: New York, NY, USA, 2002; pp. 1297–1303. [Google Scholar]
  49. Cao, B.; Wang, J.; Tang, S.; Zhang, Z.; Li, Y. Experimental and numerical study on moisture diffusion behavior of 3D woven composite. Compos. Part Appl. Sci. Manuf. 2024, 185, 108280. [Google Scholar] [CrossRef]
  50. Cussler, E.L. Diffusion: Mass Transfer in Fluid Systems; Cambridge University Press: Cambridge, UK, 2009. [Google Scholar]
  51. Neumann, S.; Marom, G. Prediction of moisture diffusion parameters in composite materials under stress. J. Compos. Mater. 1987, 21, 68–80. [Google Scholar] [CrossRef]
  52. Miller, D.A.; Samborsky, D.D.; Stoffels, M.T.; Voth, M.M.; Nunemaker, J.D.; Newhouse, K.J.; Hernandez-Sanchez, B.A. Summary of Marine and Hydrokinetic (MHK) Composites Testing at Montana State University; Technical, Report; Sandia National Laboratories: Albuquerque, NM, USA; Montana State University: Bozeman, MT, USA, 2020. [CrossRef]
  53. Gibson, R.F. Principles of Composite Material Mechanics; CRC Press: Boca Raton, FL, USA, 2012. [Google Scholar]
  54. Kappenthuler, S.; Seeger, S. Assessing the long-term potential of fiber reinforced polymer composites for sustainable marine construction. J. Ocean. Eng. Mar. Energy 2021, 7, 129–144. [Google Scholar] [CrossRef]
  55. Li, B.; Baxevanakis, K.P.; Silberschmidt, V.V. Water Diffusion in Additively Manufactured Polymers: Effect of Voids. J. Compos. Sci. 2024, 8, 319. [Google Scholar] [CrossRef]
  56. Wang, M. Multiscale water diffusivity prediction of plain woven composites considering void defects. Sci. Eng. Compos. Mater. 2024, 31, 20220236. [Google Scholar] [CrossRef]
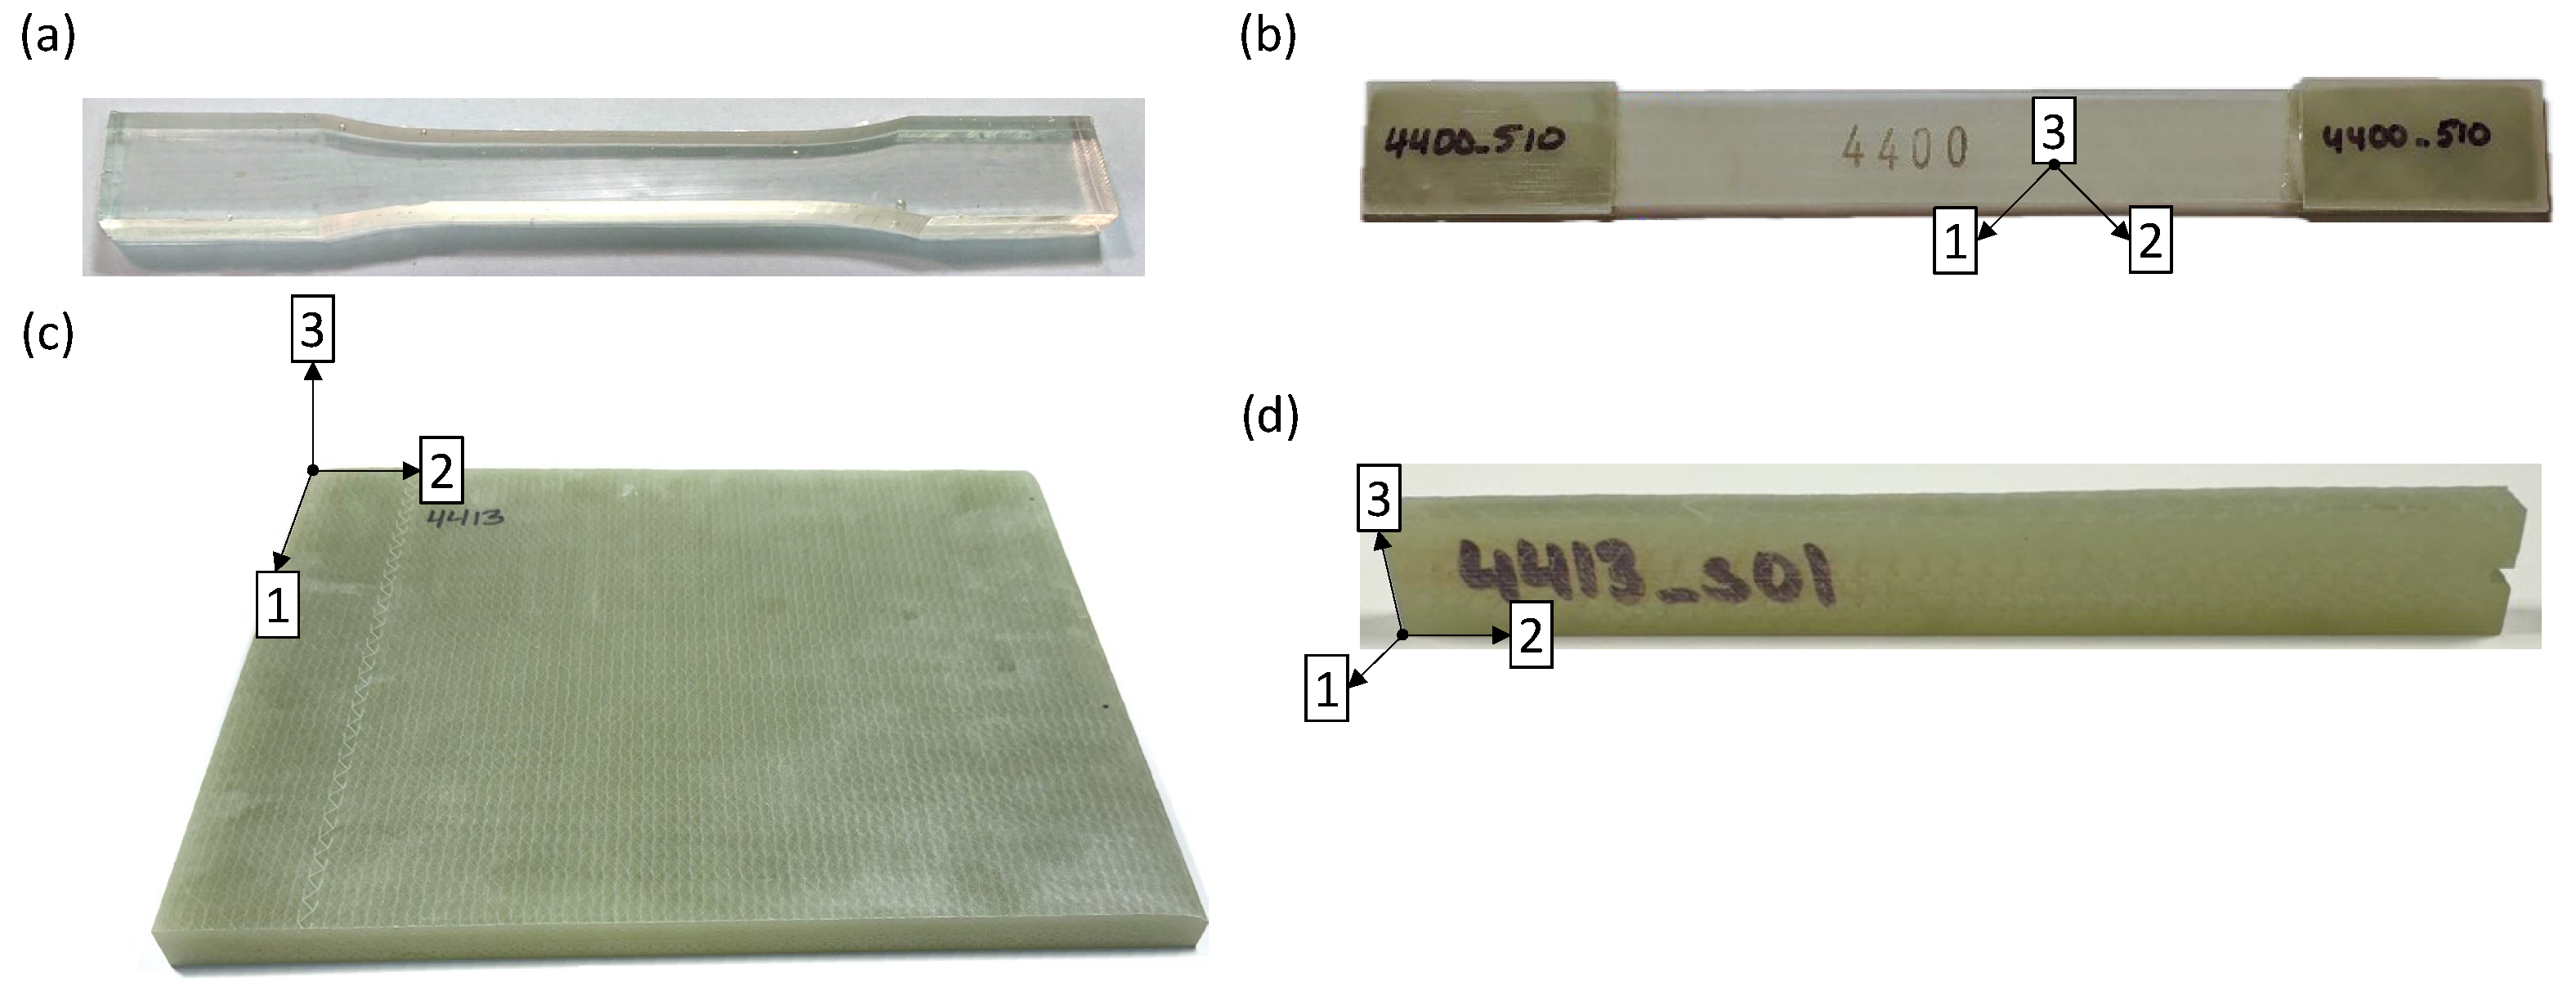
Figure 1. Materials manufactured in this study to characterize mechanical properties: (a) neat resin coupon, (b) in-plane shear coupon, (c) swelling panel, and (d) notched swelling coupon.
Jmse 13 02043 g001
Figure 2. Representative reconstructed X-ray CT image slices from two orientations (warp direction and through-the-thickness) and the corresponding image segmentation results.
Jmse 13 02043 g002
Figure 3. Convergence of the loss function within 100 epochs (left) and the corresponding visualization of the training progress for the deep learning model when classifying warp tows, weft tows, and the resin (right).
Jmse 13 02043 g003
Figure 4. Generation of a mesoscale model with idealized geometry.
Jmse 13 02043 g004
Figure 5. Finite element mesh generated showing the material regions of interest: voids, weft tows, resin, and combined with warp tows.
Jmse 13 02043 g005
Figure 6. Convergence of the mean value of the modeled shear modulus with an increasing sample size.
Jmse 13 02043 g006
Figure 7. Modeled and experimental distribution of (a) longitudinal modulus, (b) diffusivity, (c) transverse expansion coefficient, and (d) out-of-plane expansion coefficient.
Jmse 13 02043 g007
Figure 8. Optical image showing the resulting composite structure and cracks that have formed as a function of moisture uptake. Red regions indicate horizontal cracks that have formed.
Jmse 13 02043 g008
Figure 9. Sobol’s index sensitivity map between idealized model input parameters and output quantities of interest.
Jmse 13 02043 g009
Figure 10. Imaged-based simulation results for the von Mises stress (left) and normalized concentration (right) at time t 855 . The highlighted region shows the outline of voids (white) and resin (black).
Jmse 13 02043 g010
Figure 11. Image-based simulation results for (a) moisture uptake, (b) normalized concentration, (c) volume change, and (d) volume-averaged von Mises stress as a function of the square root of time ( t ). In each image, solid lines correspond to the image-based simulation using the nominal segmentation results, while the shaded regions correspond to the upper- and lower-bound simulation results using the 5th-percentile and 95th-percentile segmentation of the resin probability map. In (a) only, the dashed blue line corresponds to the experimental mean with the shaded region representing ± 2 standard deviations away from the mean.
Jmse 13 02043 g011
Table 1. Composite and resin properties determined from experiments.
Composite PropertyUnitMin.Max.Avg.Std. Dev.# Samples
Young’s modulus E 1 GPa36.5039.6538.561.0011
Young’s modulus E 2 GPa12.9915.0814.150.6011
Shear modulus GGPa4.044.484.360.165
Poisson’s ratio ν 12 0.230.310.280.044
Swelling coefficient β 2 0.0160.0270.0210.0048
Swelling coefficient β 3 0.170.360.270.0864
Diffusion coefficient D amm2/s2.39 × 10−72.68 × 10−72.51 × 10−70.13 × 10−74
Diffusion coefficient D bmm2/s2.45 × 10−72.75 × 10−72.59 × 10−70.13 × 10−74
Resin PropertyUnitMin.Max.Avg.Std. Dev.# Samples
Young’s modulus EGPa2.412.882.530.1610
Poisson’s ratio ν 0.360.400.380.032
Diffusion coefficient D amm2/s7.49 × 10−79.58 × 10−78.41 × 10−70.70 × 10−79
Diffusion coefficient D bmm2/s8.01 × 10−79.62 × 10−78.58 × 10−70.53 × 10−79
Density ρ g/cm31.131.141.150.0049
Maximum Moisture uptake M %3.223.283.250.029
a: linear slope method. b: least squares approach.
Table 2. Analytical relationships for effective homogenized properties of fiber tows from reference [36].
PropertyAnalytical Formula
Axial diffusivity D t 1 = ( 1 k f ) D m
Transverse diffusivity D t 2 = D t 3 = ( 1 k f ) D m
Longitudinal modulus E t 1 = k f E f 1 + ( 1 k f ) E m
Transverse modulus E t 2 = E t 3 = E m 1 k f ( 1 E m E f 2 )
Shear modulus G t 12 = G t 13 = G m 1 k f ( 1 G m G f 12 )
Shear modulus G t 23 = G m 1 k f ( 1 G m G f 23 )
Poisson’s ratio ν t 12 = ν 13 = k f ν f 12 + k m ν m
Poisson’s ratio ν t 23 = E t 2 2 G t 23 1
Longitudinal exp. coef. β t 1 = β m ( 1 k f ) E m E t 1
Transverse exp. coef. β t 2 = β t 3 = β m ( 1 k f ) 1 + k f ( 1 k f ) E m k f E t 2 + ( 1 k f ) E m
Table 4. Statistical results of output quantities of interest from Dakota simulations.
QOIUnitModel Avg.Model Std. Dev.Exp. Avg.Exp. Std. Dev.
Volume fraction V f 0.5450.04470.5130.018
Longitudinal diffusivity D 11 mm2/s4.92 × 10−73.68 × 10−72.55 × 10−71.07 × 10⁻⁸
Transverse diffusivity D 22 mm2/s2.78 × 10−71.84 × 10⁻⁷
Out of plane diffusivity D 33 mm2/s2.14 × 10−73.44 × 10⁻⁸
Longitudinal modulus E 11 GPa39.44.1438.560.954
Transverse modulus E 22 GPa13.42.3314.150.573
Out of plane modulus E 33 GPa10.61.85
Poisson’s ratio ν 12 0.2160.03700.2750.032
Poisson’s ratio ν 13 0.3040.0424
Poisson’s ratio ν 23 0.3630.0501
Shear modulus G 12 GPa3.650.6764.360.163
Shear modulus G 13 GPa3.530.664
Shear modulus G 23 GPa3.330.625
Longitudinal exp. coef. β 11 0.01110.00313
Transverse exp. coef. β 22 0.06240.01660.0210.004
Out of plane exp. coef. β 33 0.09610.02280.2700.075
Disclaimer/Publisher’s Note: The statements, opinions and data contained in all publications are solely those of the individual author(s) and contributor(s) and not of MDPI and/or the editor(s). MDPI and/or the editor(s) disclaim responsibility for any injury to people or property resulting from any ideas, methods, instructions or products referred to in the content.