1. Introduction
To address global environmental concerns, the International Maritime Organization (IMO) has implemented stringent regulations including the Energy Efficiency Design Index (EEDI) for new-built ships [
1] and the Carbon Intensity Indicator (CII) for existing fleets [
2] Moreover, IMO has set a target to reduce greenhouse gas emissions from international shipping by at least 50% by 2050 compared to 2008 levels, with an aim to phase out emissions entirely within this century [
3].
In this context, energy conservation and emission reduction have become the most important trends in the development of the shipping industry. Accordingly, there has been a growing shift in the field of marine engineering from traditional studies of ship performance in calm water to research on ship performance in waves, aiming to enhance navigation efficiency under real sea conditions.
Screw propellers (referred to henceforth, in keeping with common practice, as propellers) are the most common propulsion devices for ships. While traditional evaluation methods of propeller hydrodynamics (open-water and behind-ship tests) remain valuable, their inability to account for wave effects represents a critical limitation in real-world performance prediction. To enhance a ship’s performance in actual sea conditions, it is deemed important to study the hydrodynamic performance of propellers in waves. Tavakoli et al. [
4] and Saettone et al. [
5], through their study on mathematical models of ship propulsion systems in waves, confirm that the variation in propeller performance under wave conditions is a crucial and complex component of the entire propulsion system.
Recent studies on propeller performance in waves primarily adopt two approaches: open-water analyses with wave effects consideration and coupled hull-propeller analyses under wave conditions. Irannezhad et al. [
6] conducted experimental and numerical open water tests of KP458 propellers in calm water and in regular head waves, demonstrating the remarkable influences of waves on the propeller advance coefficient. Recently, Acanfora et al. [
7] conducted experimental studies on the open water characteristics of a ship propeller in waves and showed that both thrust and torque are reduced compared to the calm water case as wave amplitude increases. Cosgun et al. [
8] proposed a method to predict the motion performance of a submarine under various surge conditions by utilizing four-quadrant propeller performance and resistance test data. Their work also enhanced the prediction scope for the propeller’s open-water performance. Liang et al. [
9] analyzed the open-water propulsion performance of a propeller and the scale effect on hull resistance. They demonstrated that although the extrapolation method from model to full scale lacks high accuracy, its relative error remains acceptable for engineering requirements. Yurtseven et al. [
10] investigated the variation pattern of blade torque during the pitch change action of a controllable pitch propeller. Their results show that the torque required to rotate each blade increases with the pitch angle, peaks at a critical point, and then decreases. Grlj et al. [
11] conducted an in-depth investigation into the scale effects on open-water propeller performance. Through a systematic and scientific study of propeller open-water tests with and without the Gamma-Re-
θ transition model, they found that the influence of scale effects on open-water characteristics was significantly mitigated when the transition model was applied.
Analyzing the performance of a propeller in ship behind conditions is more complex and intriguing than in open water tests. Particularly, when the ship is sailing in waves, the propeller experiences six degrees of freedom wave-induced motions along with the ship hull. These significant wave-induced motions alter the wake of the ship hull, further complicating the flow field around the propeller. Through model testing, Ueno et al. [
12,
13] reveal that heave and pitch motions alter propeller inflow, leading to measurable changes in hydrodynamic performance.
Thanks to the rapid advancements in Computational Fluid Dynamics (CFD), numerous studies have also been conducted in this area. For instance, Cai et al. [
14] tested three different methods to analyze propeller–hull interactions in head waves. Using the KCS ship as a research model, Gamal et al. [
15] analyzed the variation in propeller propulsive power behind a ship in different wave conditions and demonstrated that an increase in wave steepness leads to large fluctuations in thrust, resulting in an additional reduction in propeller efficiency. Woeste et al. [
16] found that added power is not simply a linear function of added resistance or the squared incoming wave amplitude; the complex interactions between the propeller and hull in the waves result in significant power consumption. Sadat-Hosseini et al. [
17] simulated the self-propelled KCS ship in regular head waves with a dimensionless wavelength of
λ/L = 1.37 and confirmed a substantial increase in the mean inflow velocity to the propeller due to the fluctuating wake field. Ortolani et al. [
18] studied the loads on individual blades of the propeller of a twin-screw ship model navigating in regular waves, demonstrating that single blade loads are significantly affected by waves, even in relatively moderate sea states (
SS3 and
SS4).
Indeed, the above-mentioned CFD studies provide deep understanding of the complex physical phenomena of hull-propeller-wave interactions. However, these computations require large computational resources and long CPU times and, therefore, it is hard to perform systemic computations that reveal the variation law of the hydrodynamic performance of the propeller, such as the thrust and torque against the incident wave conditions. To deal with this problem, Wang et al. [
19,
20] proposed a simplified method by simulating a propeller in open water conditions near the free surface, with a forced sinusoidal heave motion applied to the propeller shaft. Their results proved that the propeller load and the wake field are closely related to the variation of heave motion period.
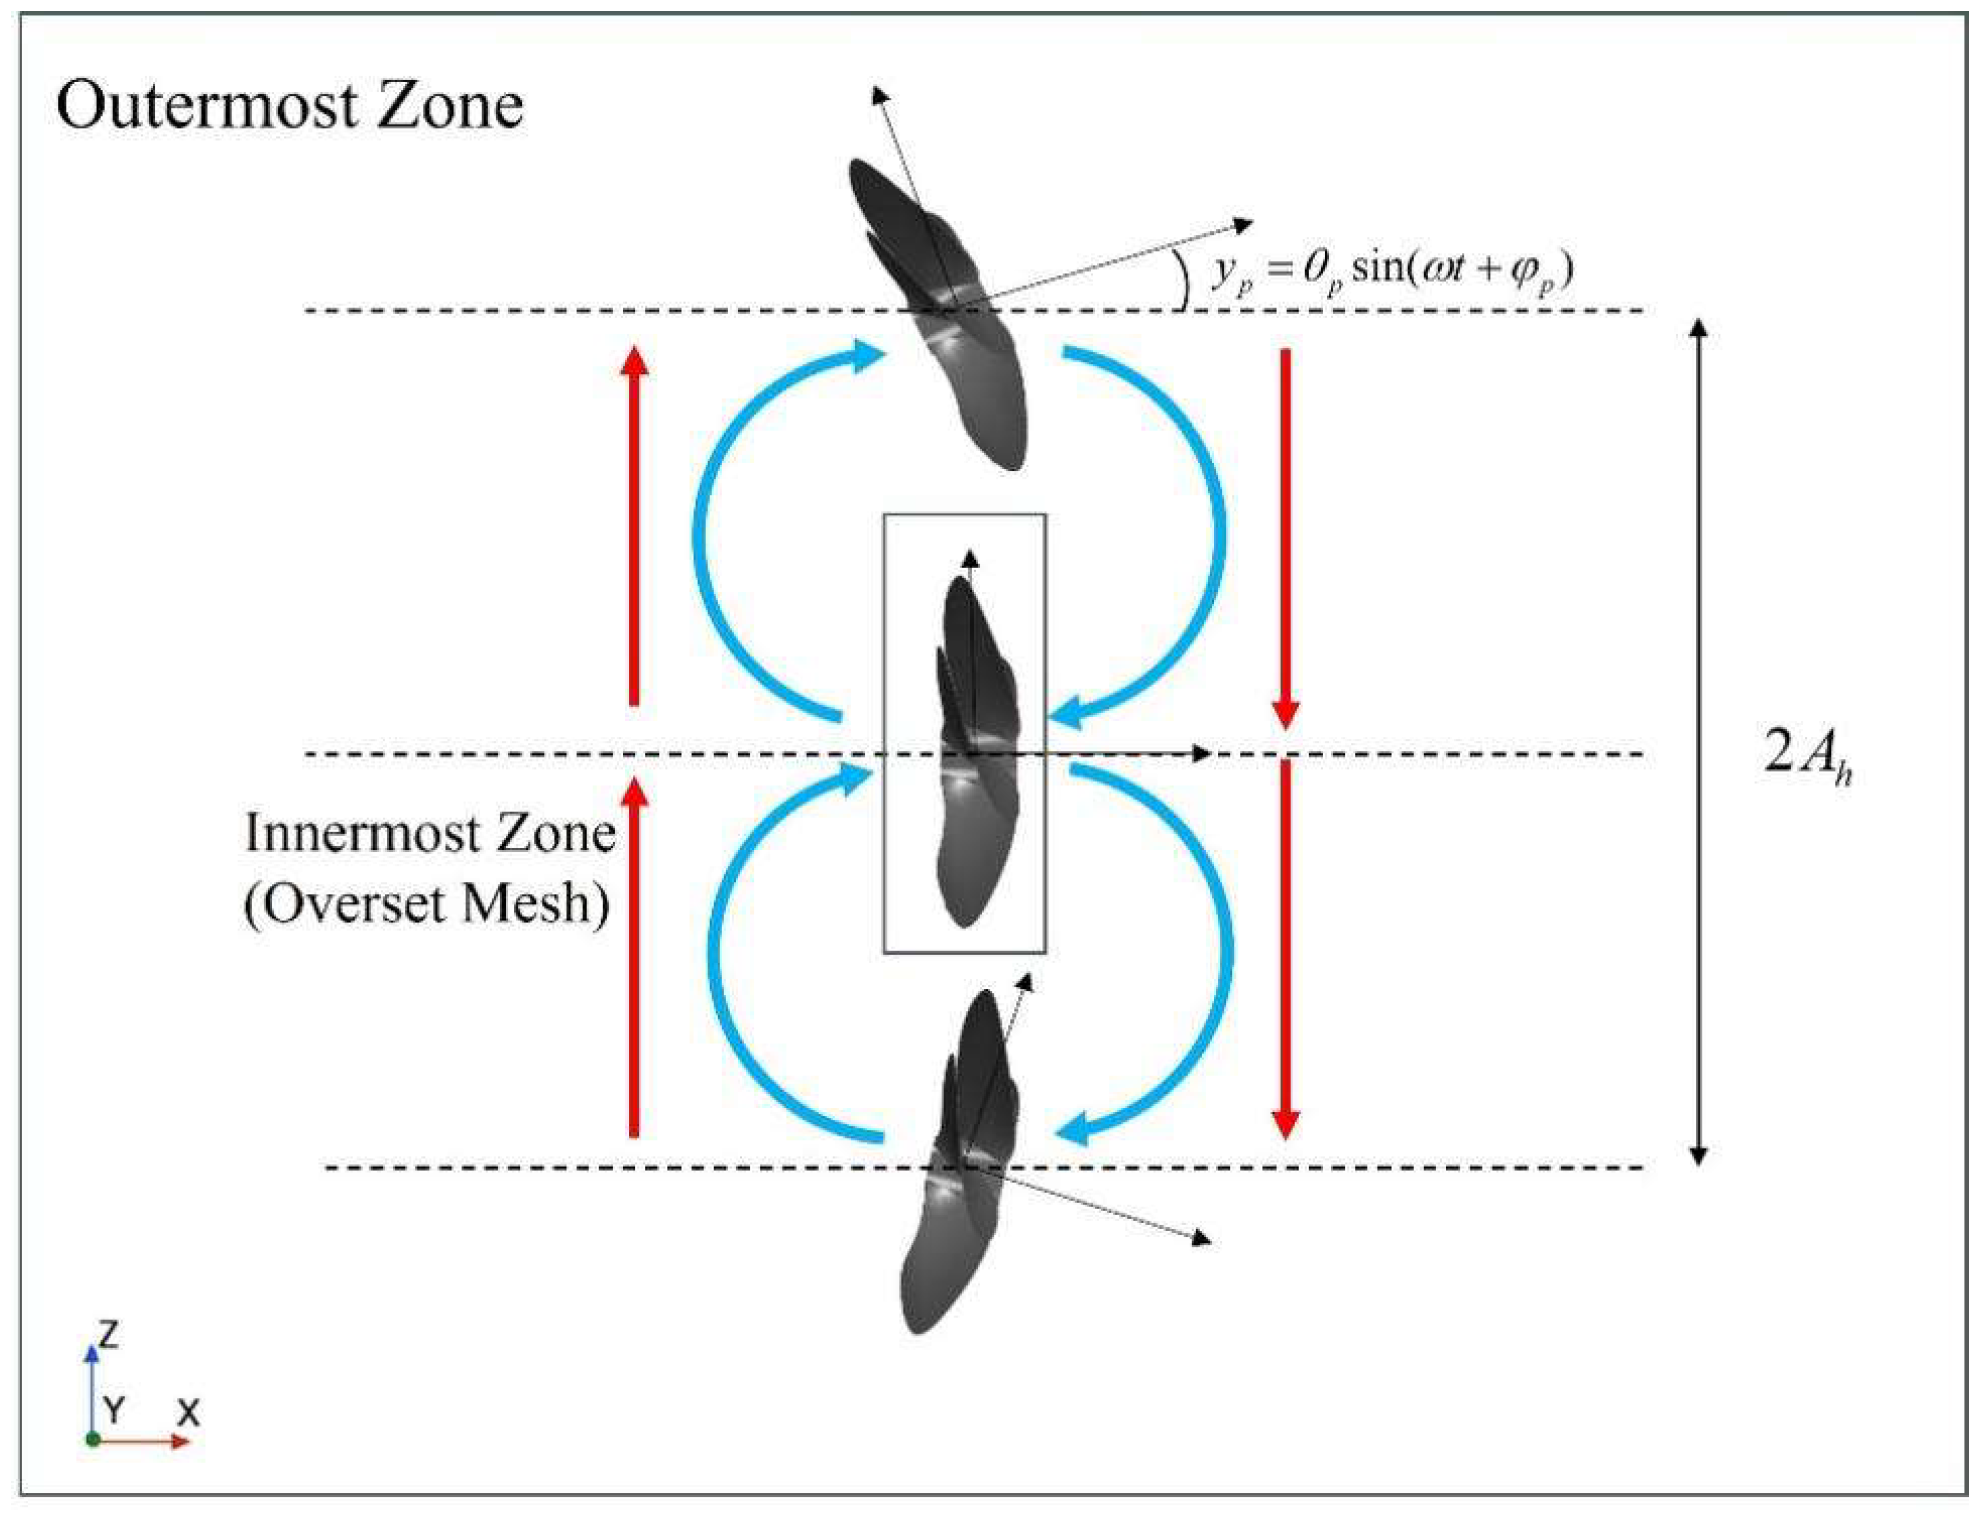
We computed the hydrodynamic performance of the KP505 propeller considering the heave and pitch motions of the KCS hull. A CFD-based numerical method was developed for the primary propeller analysis, and a potential flow-based method was used to calculate the response amplitude operators (RAOs) of the heave and pitch motions of the ship advancing in waves. Referring to Wang et al. [
19] we exerted sinusoidal heave and pitch motions, which are generated according to the computed amplitudes and phase lags of RAOs, to the propeller. Based on the developed model, three different incident wave lengths were tested and the propeller thrust, torque and efficiency under different wave conditions were collected and analyzed. The calculated results are expected to provide theoretical reference for the estimation of propeller propulsion performance in waves.
4. Results and Discussions
Numerical simulations were performed for a 1/31.6 scale model of the ship and propeller. A constant ship forward speed, corresponding to a Froude number Fr = Vs/(gL)0.5 = 0.26, was set as the target speed. The RAOs for heave and pitch motions at this speed were computed using AQWA. Based on the results, the heave and pitch motions under three representative wave conditions were selected to study their effects on the propeller’s hydrodynamic performance.
This section first presents the RAOs results calculated using AQWA. Then, the open-water characteristics of the KP505 propeller in calm water, predicted by CFD computations, is presented and compared against the experimental measurements. Subsequently, the proposed simplified method is verified through comparison with coupled hull-propeller-wave CFD simulation results. Finally, the hydrodynamic performances of the KP505 propeller, under different heave and pitch motion conditions, are presented and discussed.
4.1. Numerical Results of Heave and Pitch RAOs of the KCS Ship in Head Waves
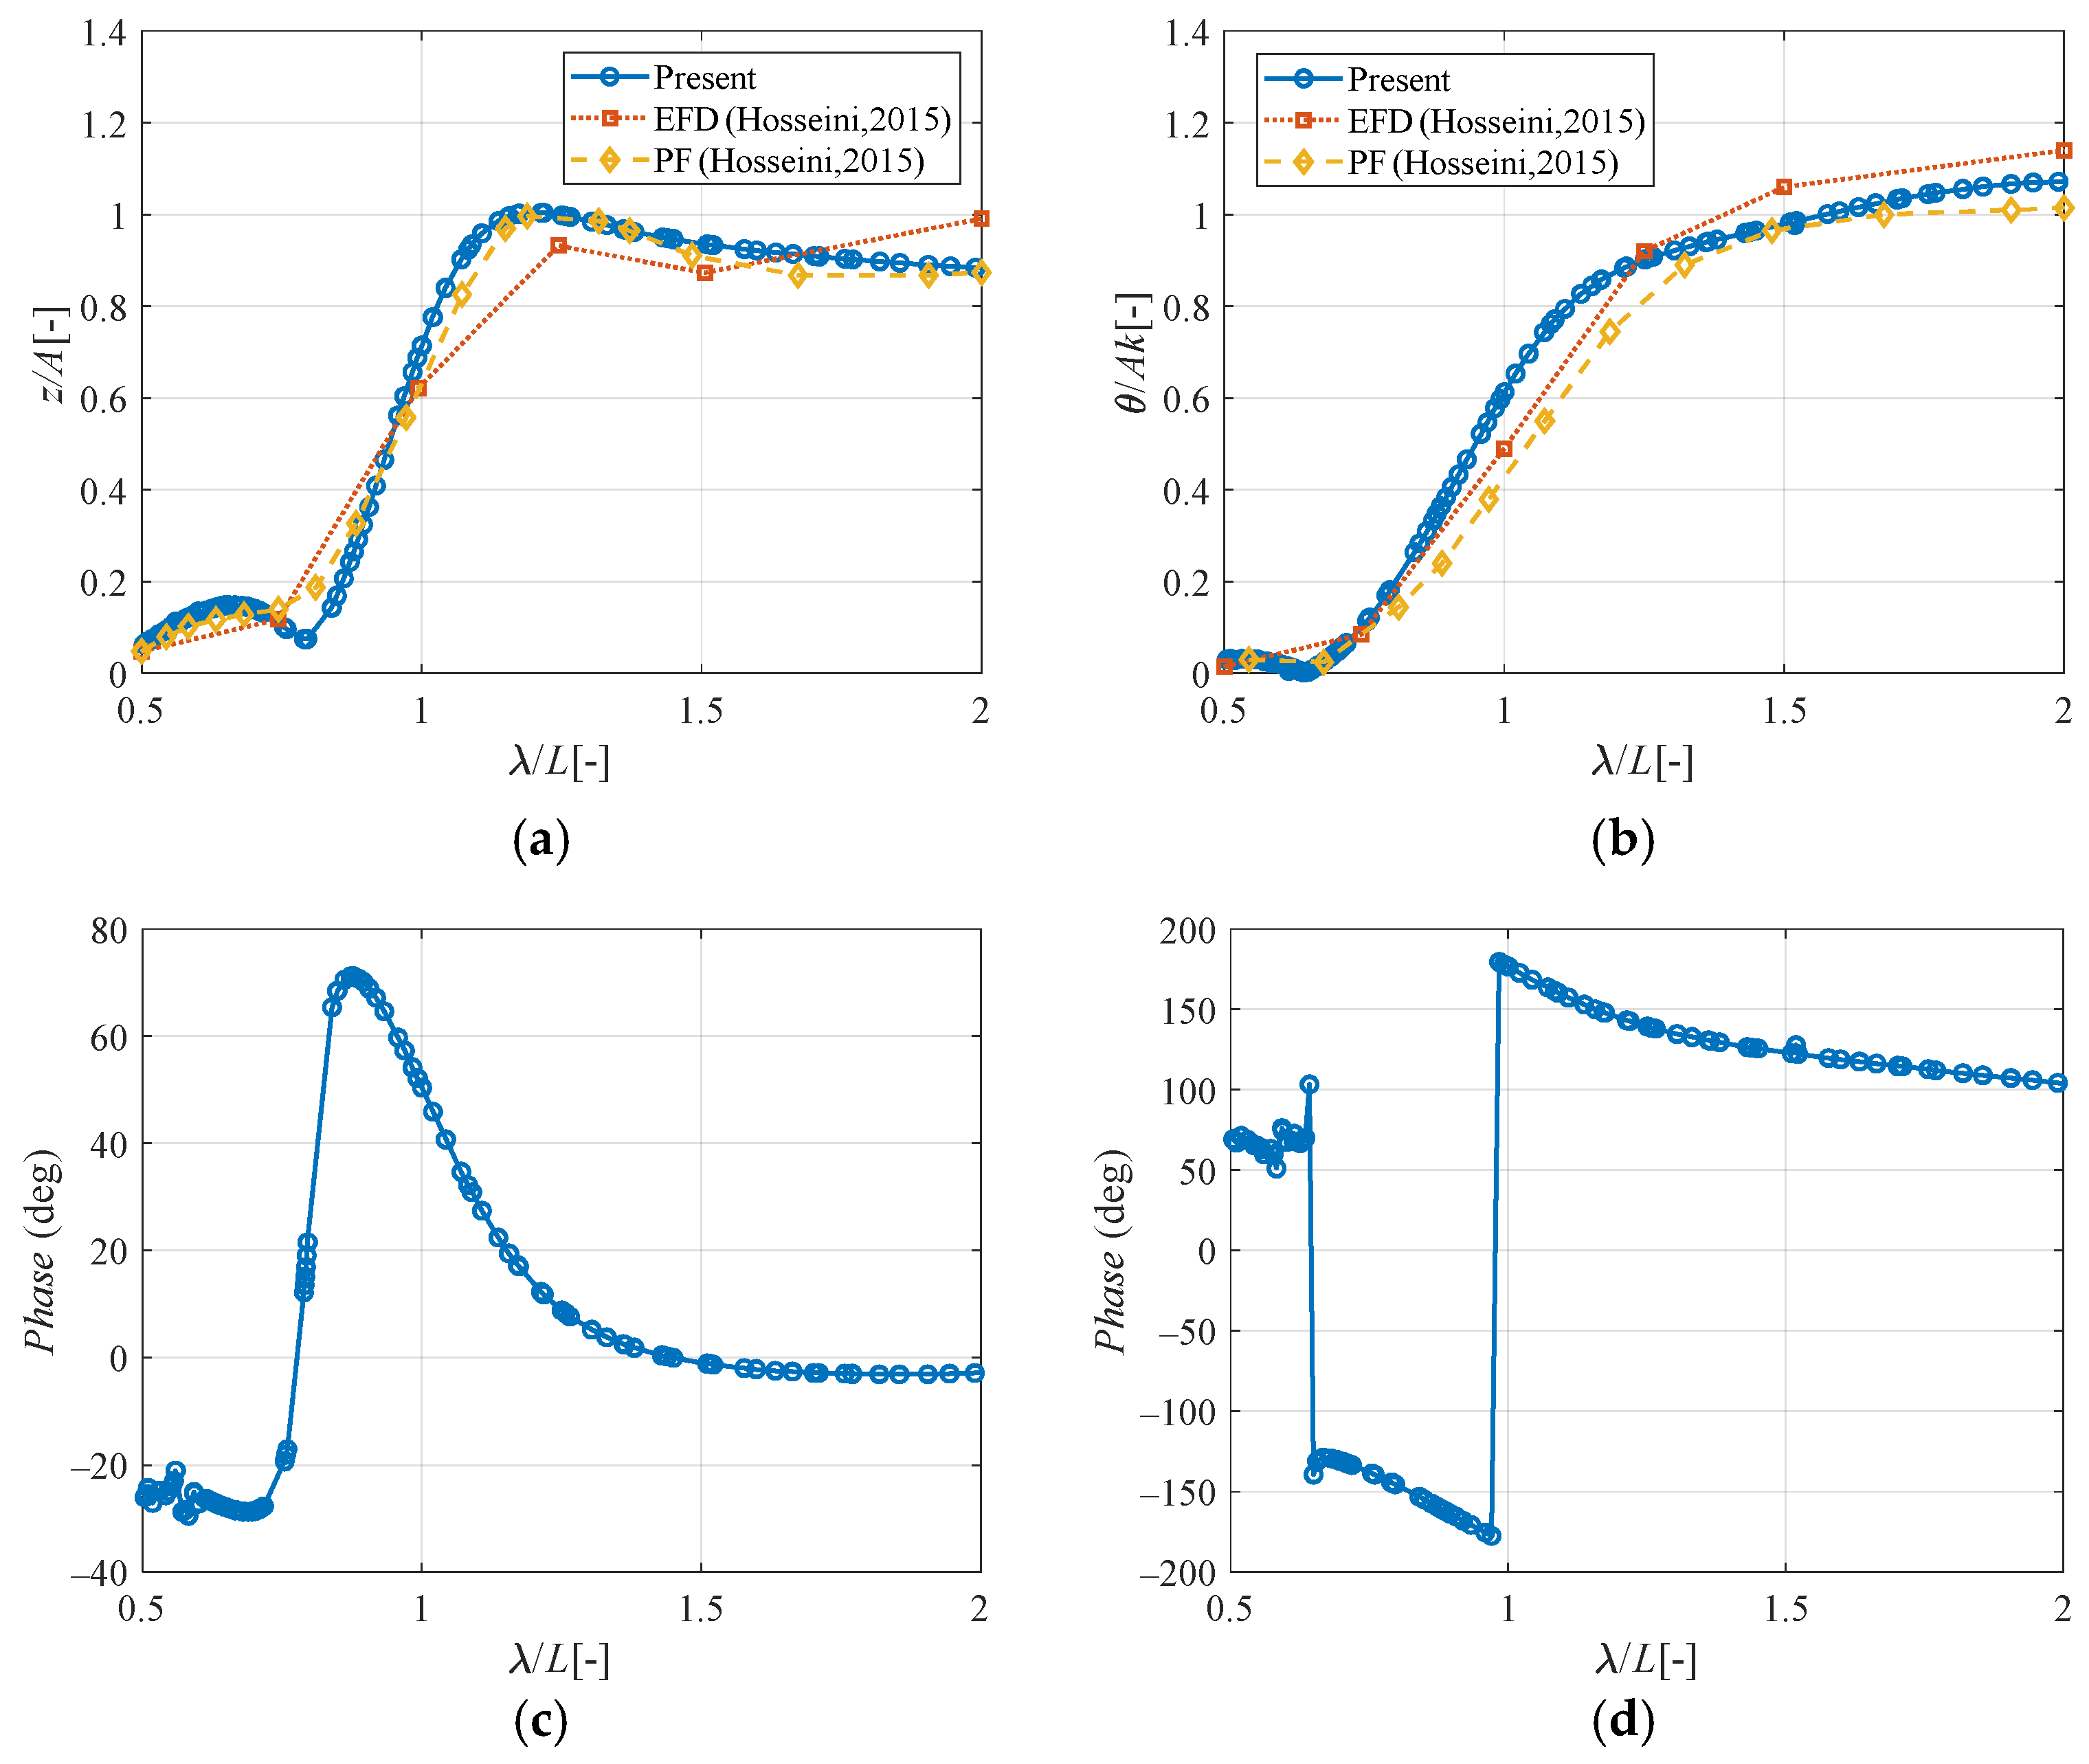
The seakeeping analysis of the KCS ship is performed using AQWA. The computed RAOs and phases of the heave and pitch motions are plotted in
Figure 7. In
Figure 7a,b, our numerical results (Present) are compared against the experimental measurements (EFD) and existing potential flow solutions (PF) of Sadat-Hosseini et al. [
17]. As seen, the computed motion RAOs exhibit favorable agreement with the published experimental data and the existing numerical solutions, demonstrating the effectiveness of the potential flow methodology implemented in our study.
4.2. CFD Predictions of the Open-Water Characteristics of the KP505 Propeller in Calm Water
The hydrodynamic characteristics of the KP505 propeller are computed using STAR-CCM+. The propeller rotation is modelled via overset grid method. During each CFD simulation run, the prism layer thickness and number of layers were adjusted based on the propeller’s advance speed to ensure computational accuracy.
Figure 8 plots the computed thrust coefficient (
KT), torque coefficient (
KQ), and propeller efficiency (
η), for KP505 propeller in calm water. The tested advance ratio was in the region of 0.1 <
J < 0.9. Our numerical results (Present) are denoted by dashed line with hollow symbols while the comparative measurements (EFD), borrowed from Lee et al. [
24], by solid lines with colored symbols.
It can be seen that our CFD results are in good agreement with the experimental results. The overall error is less than 5%. Near the design working condition (J = 0.5), the errors for the propeller thrust coefficient and torque coefficient are approximately 2%. The favorable agreements demonstrate the effectiveness of the established numerical approach for the propeller hydrodynamic analysis.
4.3. Hydrodynamic Performance of the Propeller with Heave and Pitch Motions
After validating the propeller performance, the focus shifts to added resistance under regular wave conditions. As seen in
Figure 7, the peak value of the heave RAO occurs around a dimensionless wavelength (
λ/L) is 1.15. Meanwhile, the pitch RAO increases significantly with wavelength when the dimensionless wavelength is below 1.15, while its growth rate decreases noticeably beyond this value. Hence, we selected three representative wavelengths, which centered around dimensionless wavelength is 1.15, as the typical computational cases. The default wave steepness (
H/λ) is set to be 1/60.
Table 3 and
Table 4 summarize the detailed specifications of the selected computational cases, in which the motion RAOs are sampled from
Figure 7 and the ‘ideal’ rotation speed for each case is calculated according to Equations (11)–(14). Note that a constant calm water resistance,
Rc = 84 N, was considered for all tested cases. This value is computed via a CFD computation of the KCS ship model advancing in calm water at
Fr = 0.26. The wave-added resistance coefficient
σaw at different wave lengths are borrowed from the experimental measurements of Mikkelsen et al. [
25] Moreover, a constant wake fraction,
ω = 0.2071, and a constant thrust deduction coefficient,
t = 0.1599, were adopted for all tested cases. These values were determined by Song et al. [
26] based on the experimental self-propulsion tests in calm water.
4.3.1. Convergence Test
Before conducting systemic computation of the propeller performance using the proposed method, we first carried out grid and temporal convergence test, following the methodology of Stern et al. [
27] and Grlj et al. [
28]. Selecting a typical case with dimensionless wavelength of 1.15, we computed the propeller thrust coefficient
KT and torque coefficient
KQ using three grid sets: coarse (
SG1, 5.23 million cells), medium (
SG2, 6.88 million cells), and fine (
SG3, 9.15 million cells). The grid refinement ratio
ΓG was approximately 1.31. Details about mesh density appear in
Table 5.
Similarly, temporal convergence was evaluated using three kinds of time steps, including 4.14 × 10
−4 s (
ST1, 2° per time step), 2.07 × 10
−4 s (
ST2, 1° per time step), and 1.03 × 10
−4 s (
ST3, 0.5° per time step). This gave a time step refinement ratio
ΓT = 2. Based on the spatial and temporal discretization schemes, the expected order of accuracy (
PGest) for grid convergence was 2. For time step convergence (
PTest), it was 1. The grid convergence study used the medium time step (
ST2). Conversely, the time step convergence study employed the medium grid (
SG2). Results for grid convergence and time step convergence are presented in
Table 6 and
Table 7, respectively.
Table 6 shows that both propeller thrust and torque coefficients converge monotonically with grid refinement. All convergence coefficients (
CG and
CT) are between 0 and 1, indicating favorable convergence characteristics of the calculation. The grid discretization uncertainty (
UG%
SG3) indicates minimal sensitivity to grid size changes. Furthermore, the low iterative uncertainty (
U1%
SG3) on the fine grid suggests iterative errors have minimal impact at this resolution. This collectively verifies grid convergence for the current simulations. Similarly,
Table 7 demonstrates monotonic convergence of thrust and torque coefficients with time step refinement. The small-time step discretization uncertainty (
UT%
ST3) confirms minimal sensitivity to time step size variations. The low iterative uncertainty (
U1%
ST3) also shows iterative errors have minimal impact.
Additionally, the relative percentage error (ε23%SG3) exhibits a small magnitude, indicating minimal differences between the results obtained with the SG2 and SG1 grids. Similarly, the relative percentage error ε23%ST3 is also small, signifying minimal differences between the results using the ST2 and ST1 time steps. To achieve higher accuracy and computational efficiency in subsequent numerical simulations, the SG2 grid and ST2 time step will be employed accordingly.
4.3.2. Analysis of the Hydrodynamic Performance of the Propeller Considering the Influence of Heave and Pitch Motions at Different Wavelengths
Applying the proposed computational method, the hydrodynamic performances of the propeller were investigated under three different wavelengths are 1.00, 1.15 and 1.30. For each case, we configure the CFD simulation parameters according to the specifications provided in
Table 3 and
Table 4. To better demonstrate the influence of heave and pitch motions on propeller performance, a supplementary simulation was conducted for each case, in which the same propeller rotational speed and advance ratio were maintained whereas the amplitudes of heave and pitch were set to zero.
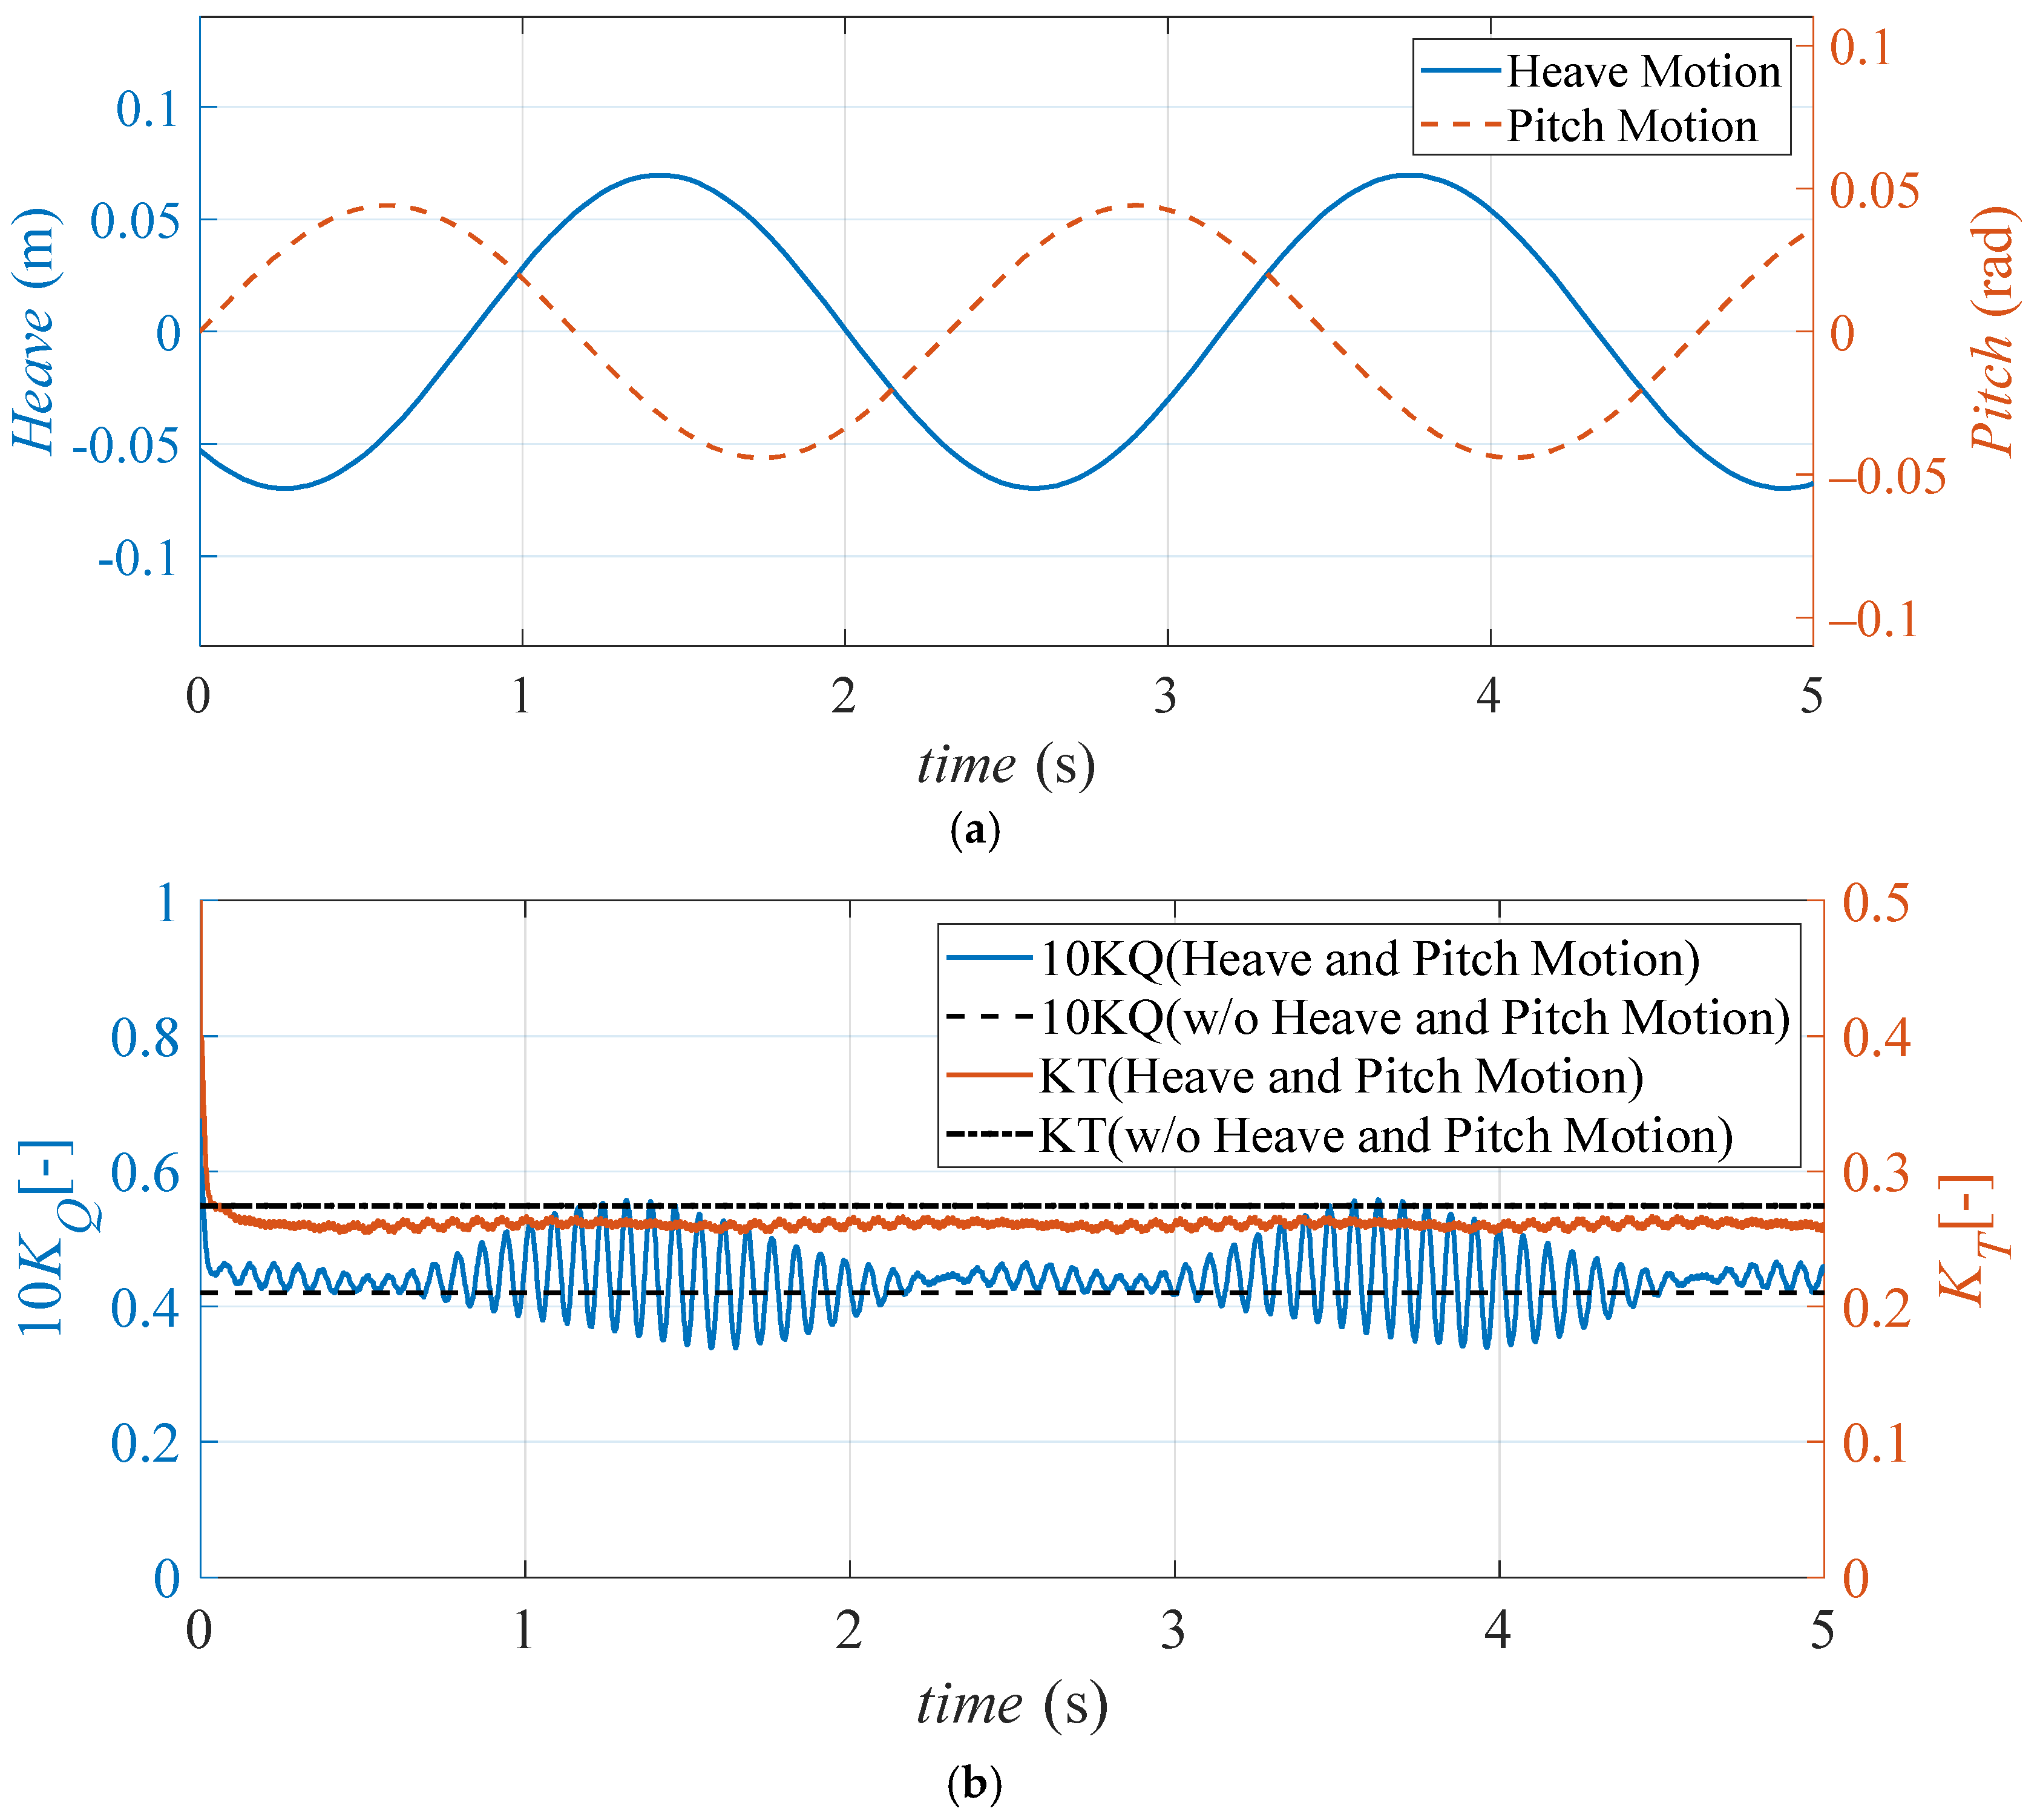
Figure 9a displays the kinematic trajectories of propeller heave displacement and pitch angular motion under prescribed operational conditions at dimensionless wavelength is 1.15.
Figure 9b presents the corresponding time histories of thrust and torque coefficients, comparing cases with and without heave and pitch motions of the propeller.
As shown in
Figure 9b, when propeller heave and pitch motions are taken into account, the time histories of thrust and torque coefficients exhibit two distinct periodic patterns. The shorter period corresponds to the blade frequency, while the longer period matches the frequency of heave and pitch motions (i.e., the wave encounter frequency). Compared to the results without heave and pitch motions, the inclusion of the motion leads to a decrease in the propeller’s average thrust coefficient and an increase in the average torque coefficient.
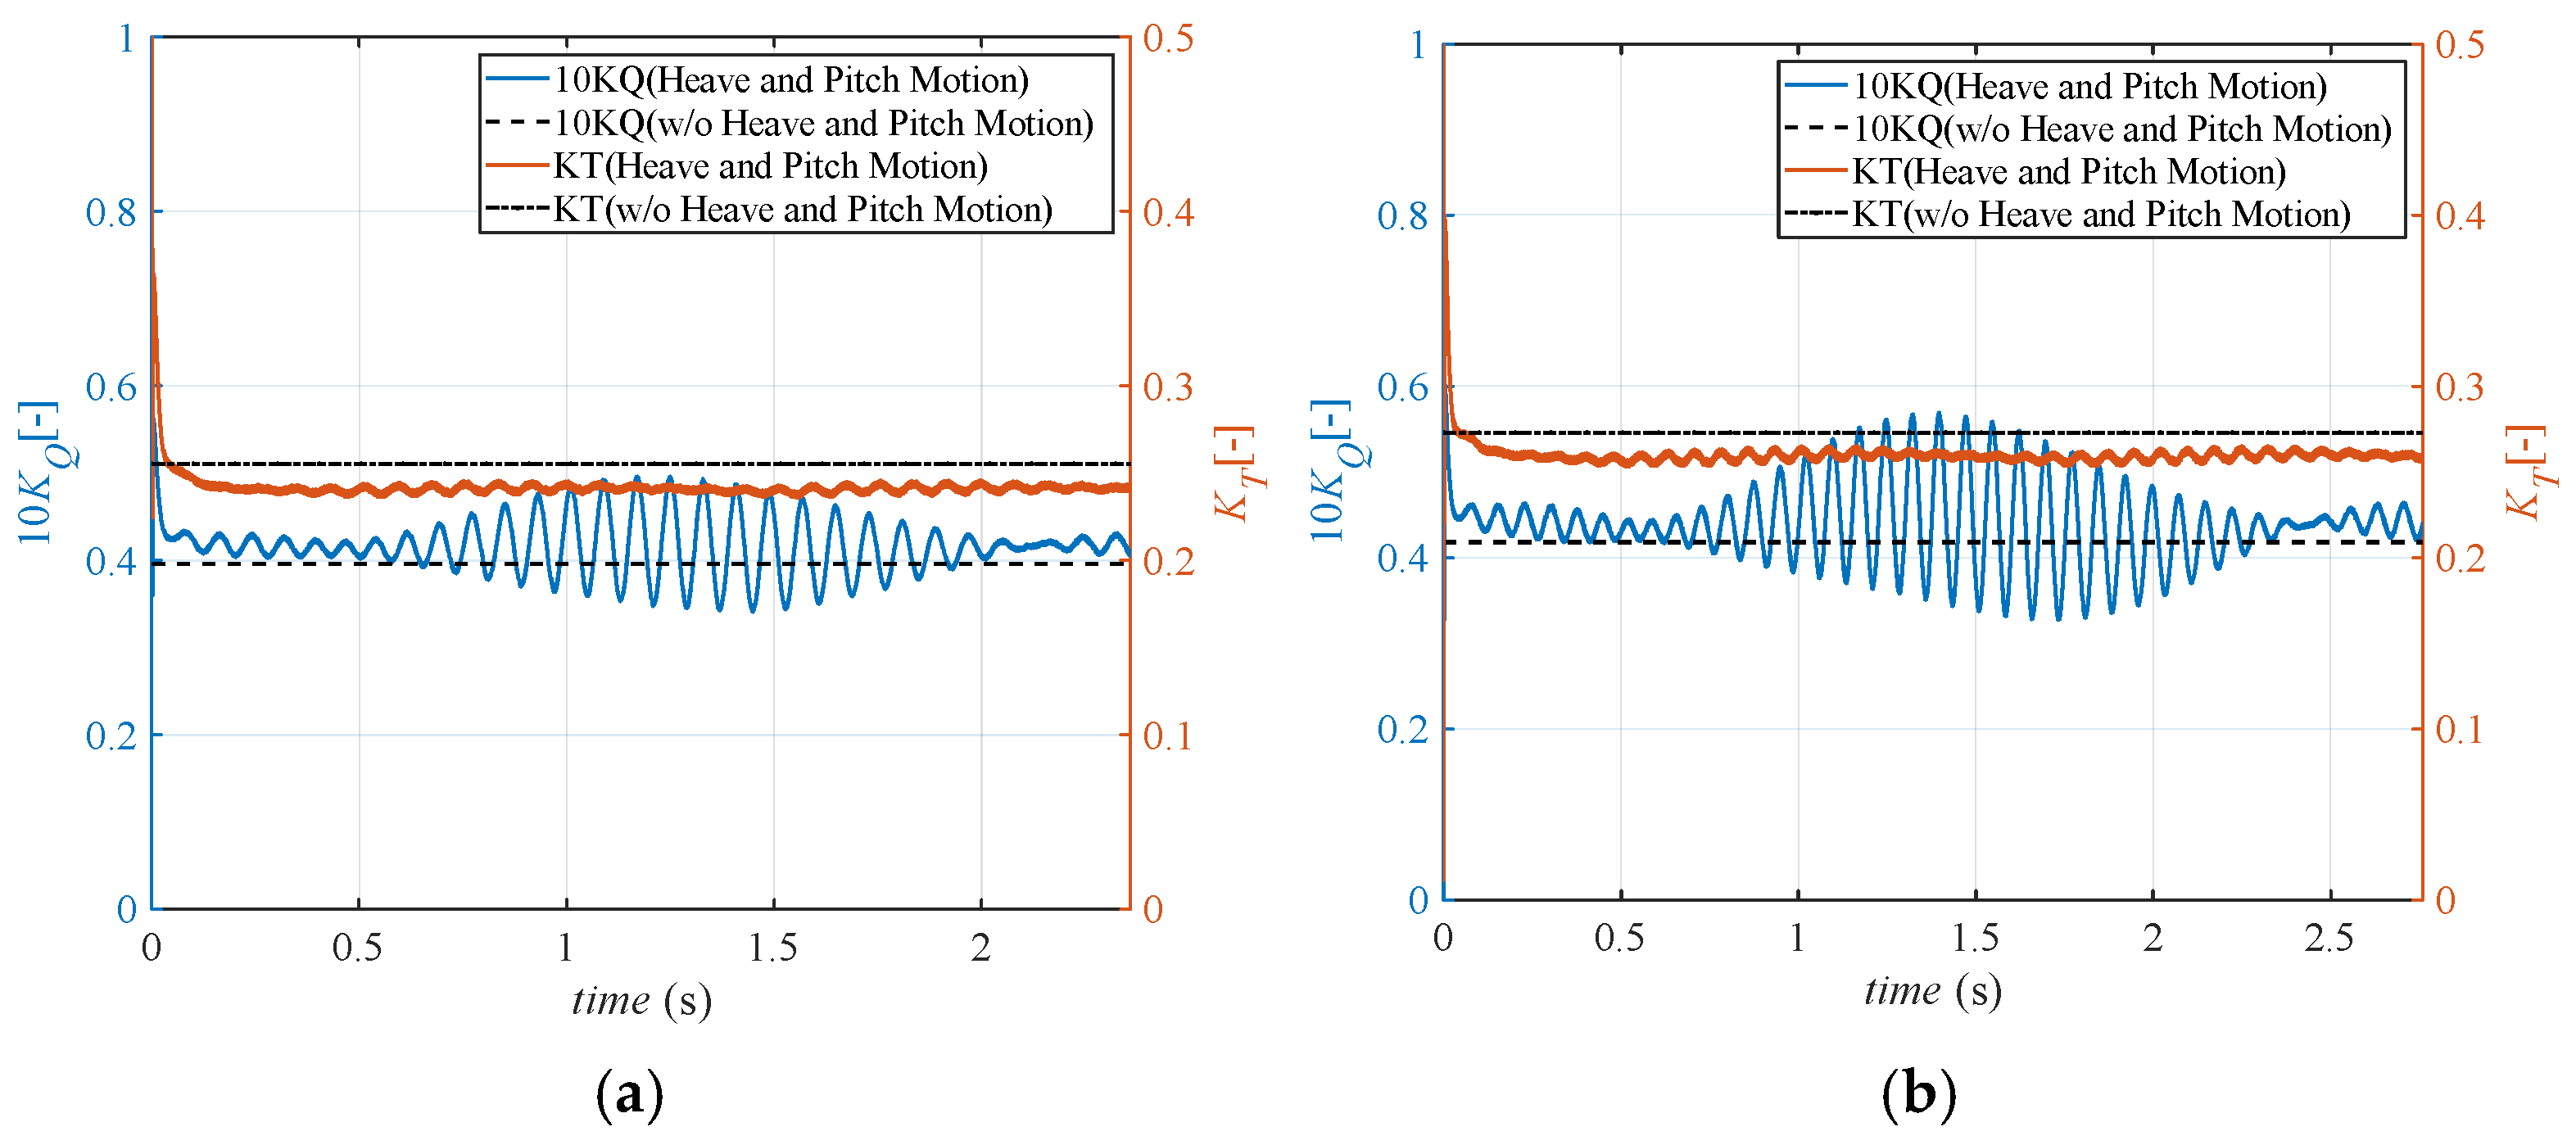
Figure 10 presents the variations in thrust coefficient and torque coefficient for wavelengths dimensionless wavelength is 1.00 and dimensionless wavelength is 1.30; the observed trends of thrust reduction and torque increase are consistent with the conclusions drawn for the dimensionless wavelength is 1.15 case, exhibiting a decrease in mean thrust and an increase in mean torque. Numerically, the thrust coefficients for the propeller with heave and pitch motions decreased by approximately 5% across all wavelengths compared to the case without motions, while the torque coefficients increased by approximately 5%. This significant reduction has notable implications for ship propulsion performance. For instance, using only traditional open-water propeller curves to predict the self-propulsion point results in actual thrust being lower than expected values, preventing achievement of the target ship speed.
4.3.3. Validation of the Simplified Computational Method
To further validate the effectiveness of the proposed simplified algorithm, this study conducted additional CFD simulations of self-propelled ship-propeller systems in waves (which is referred to as the ‘high-fidelity method’ hereafter). The results from these high-fidelity simulations were then systematically compared with those obtained from the simplified approach.
Figure 11 presents the schematic diagram and boundary condition configuration for the high-fidelity computations.
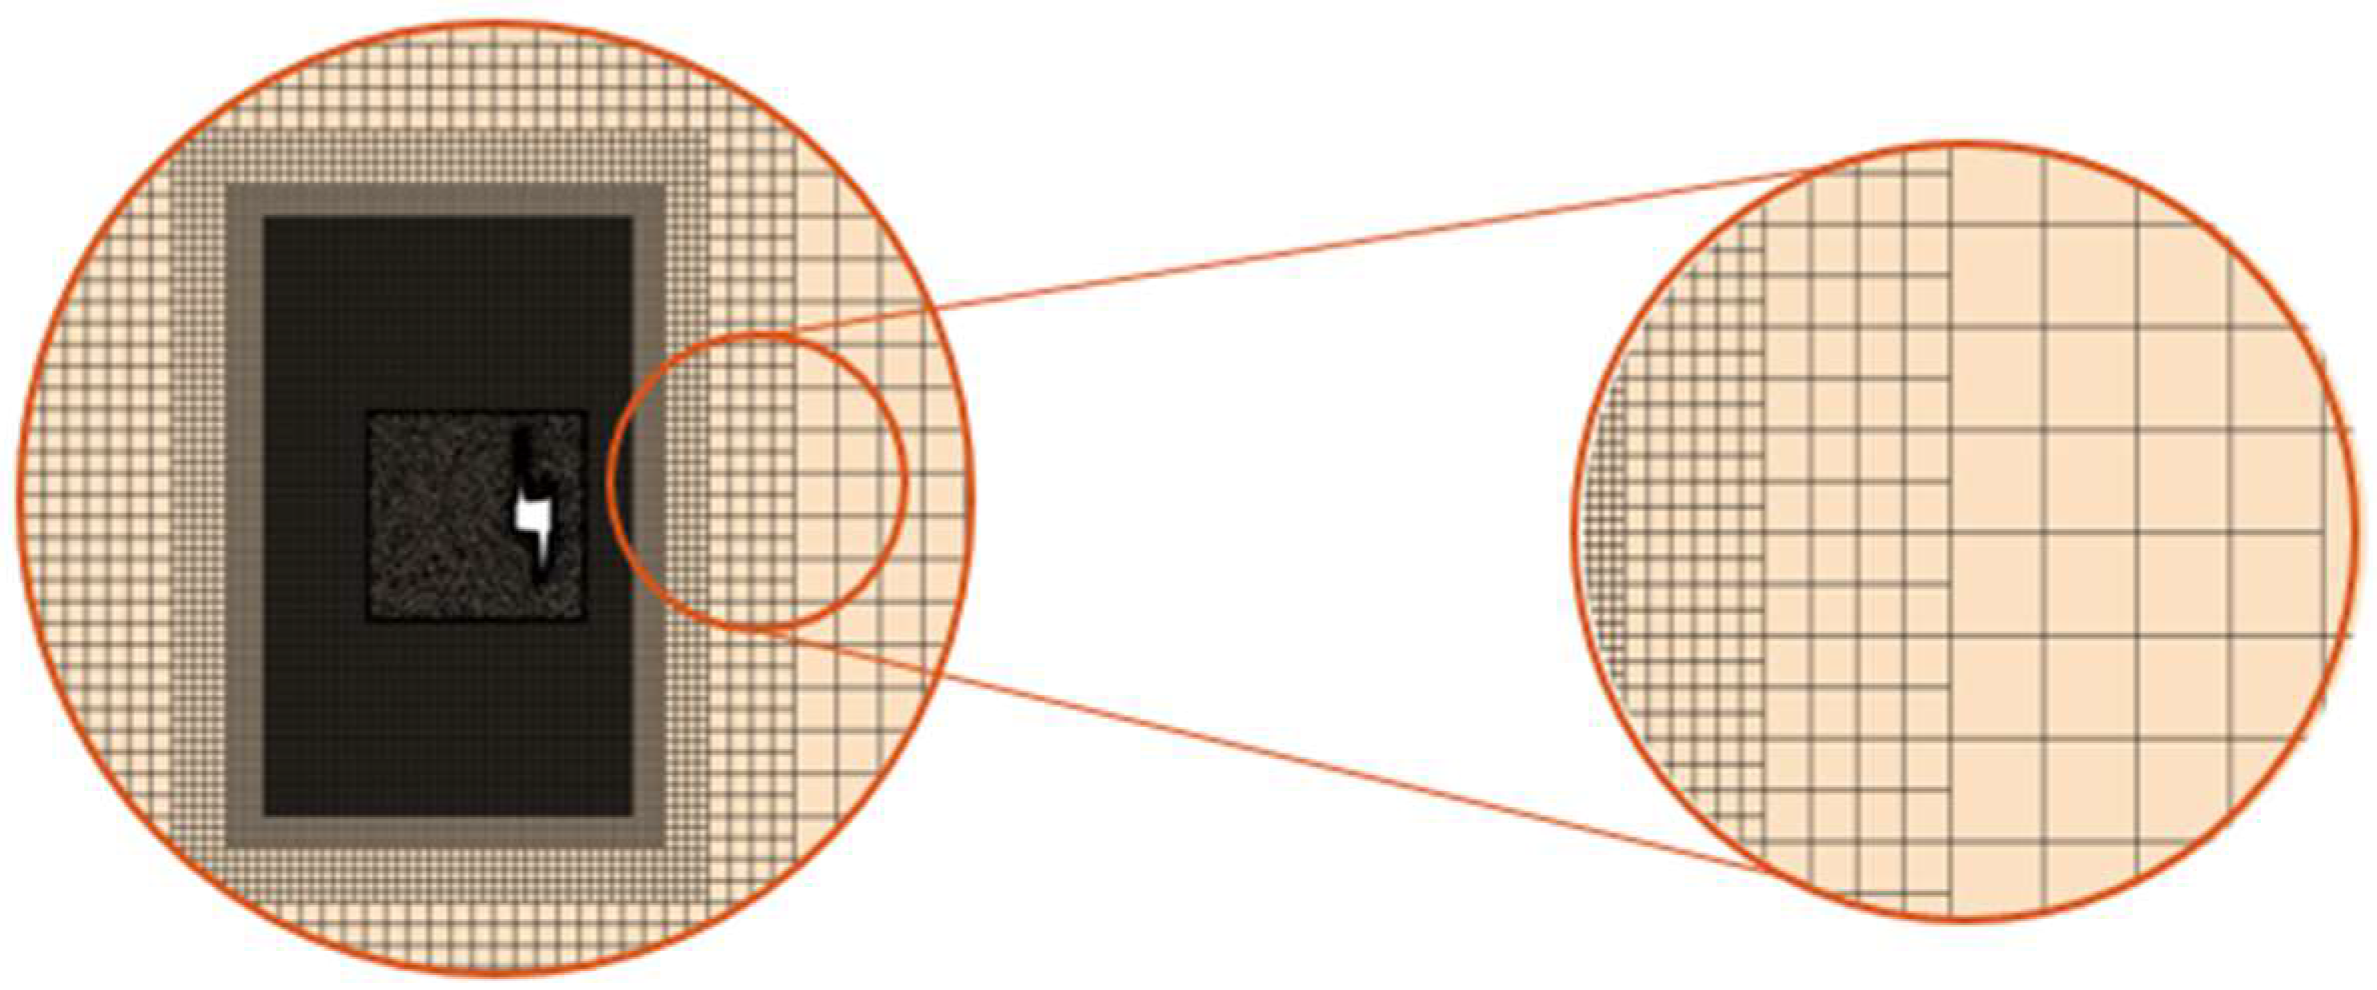
For the computational setup of the high-fidelity method, the DFBI approach was employed to simulate ship motions in waves. A PI controller was used to regulate the ship’s speed to 2.196 m/s under self-propulsion conditions. The entire computational domain was defined as the background region, with an overset grid established around the hull. In cell size and position between the overset and background regions. Mesh morphing was activated to ensure a smooth and natural transition Furthermore, for the propeller, an overset grid was adopted to better capture the intricate flow characteristics. A schematic of the background and overset mesh is shown in
Figure 12.
Furthermore, to capture wave characteristics and mitigate the influence of reflected waves, a wave-forcing method was employed. Wave-forcing zones, each with a length of one ship length, were applied on all sides of the computational domain. The mesh was discretized to ensure at least 80 cells per wavelength and 10 cells per wave height, with the aspect ratio of any individual cell not exceeding 8:8:1. A fifth-order VOF wave model was selected for wave generation. The time step was set to 2.07 × 10⁻⁴ s with a maximum of 10 internal iterations per step. The simulation was configured for a maximum physical time of 25 s.
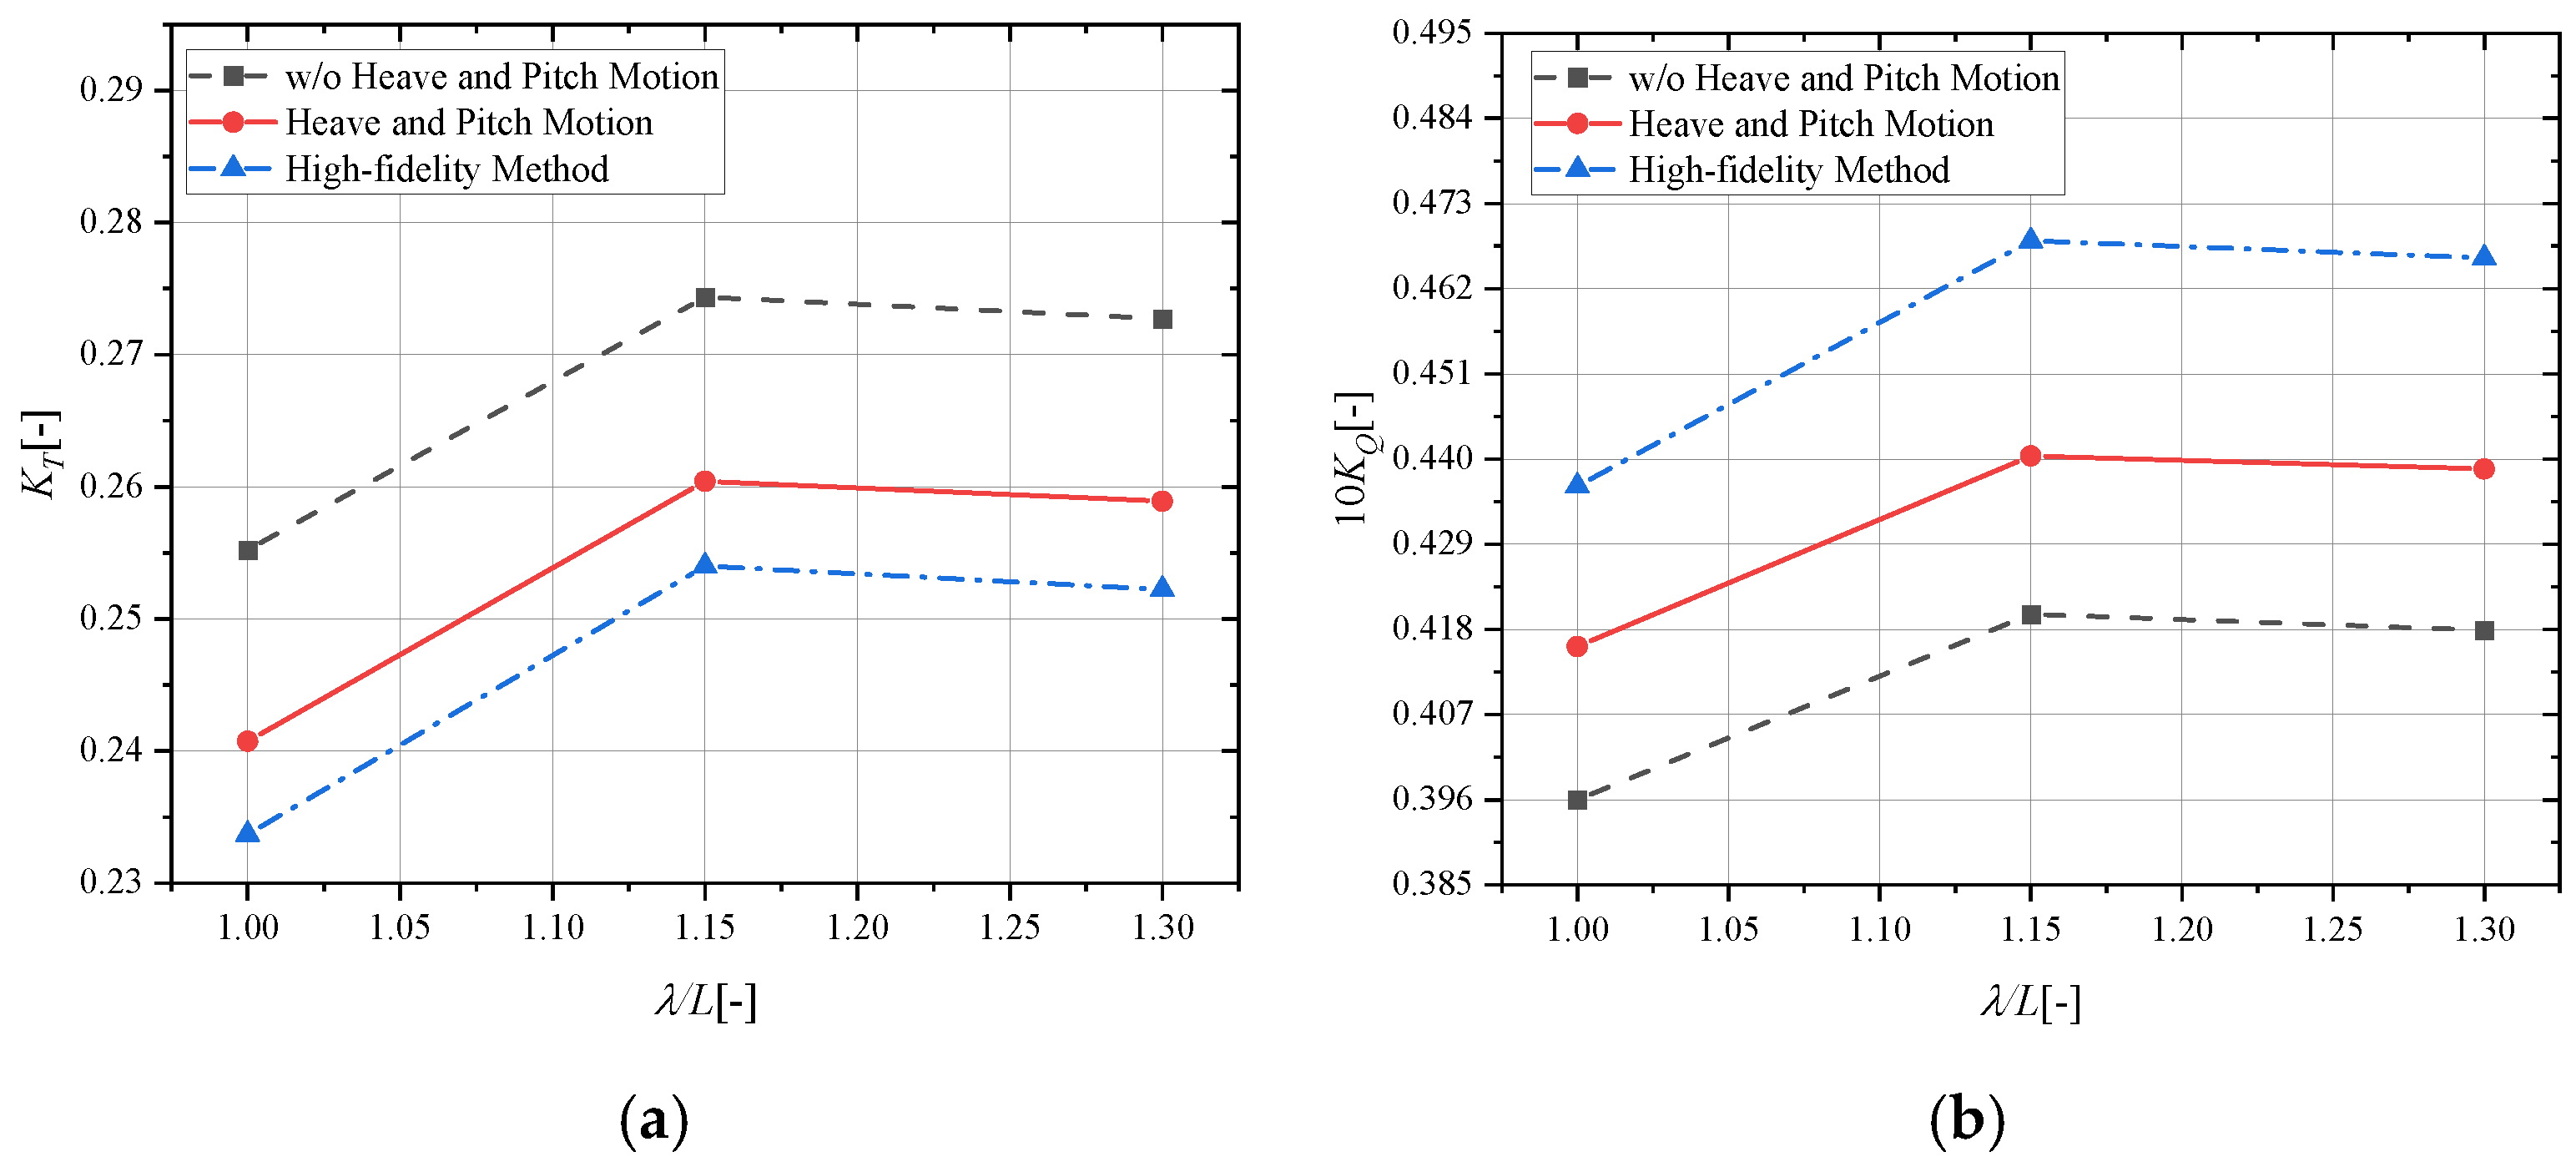
Figure 13 presents the computed thrust and torque coefficients of the propeller. The red line with circle symbol represents results from the simplified algorithm accounting for heave and pitch motions, while the black dash line with square symbol shows results from the same algorithm without considering these motions. The blue dash-dot line with triangle symbol corresponds to the high-fidelity CFD results.
The results presented in
Figure 13 confirm that heave and pitch motions significantly influence propeller performance, leading to thrust reduction and torque increment. As shown, the hydrodynamic parameters for the propeller without heave and pitch motions deviate substantially from the high-fidelity results. In comparison, the proposed simplified algorithm effectively narrows this discrepancy—particularly for the thrust coefficient—demonstrating its validity.
Although the simplified method accounting for heave and pitch motions shows improved results, some discrepancies with the high-fidelity data remain. These differences stem primarily from the method’s assumption of uniform inflow (calculated using a wake fraction) rather than incorporating the actual non-uniform ship wake. Accurate modeling of non-uniform inflow, especially the complex wake field, remains computationally challenging. Furthermore, pressure fluctuations induced by ship motions in waves may significantly influence propeller cavitation dynamics. The underlying physics involved in these phenomena presents complex theoretical challenges that remain unresolved in the current research landscape.
It is noteworthy that, under identical computational resources, the simplified algorithm is four times more efficient than the high-fidelity approach. This substantial improvement enables systematic investigation of propeller performance across various operating conditions. Given the significantly reduced computational burden, the accuracy attained by the proposed method—especially in predicting thrust coefficient—represents a practical and rational balance between computational expense and result reliability. Consequently, the proposed method shows strong potential as an efficient tool for the systematic analysis of propeller performance in complex operational scenarios.
4.3.4. Analysis on the Hydrodynamic Performance of the Propeller Considering Different Wave Steepness
Based on the simplified method, we further investigate wave height effects on propeller performance. To this end, three typical dimensionless wavelengths (the three dimensionless wavelengths are 1.00, 1.15, and 1.30) were selected and for each wavelength three wave steepness factors, 1/30, 1/60, and 1/90, were systematically examined.
Table 8 summarizes the wave steepness, advance coefficient and ‘Ideal’ propeller rotation for each computational case. The heave and pitch motions under each computational case, which were determined according to
Table 3, were incorporated into the proposed method to evaluate the propeller’s hydrodynamic performance across varying wave steepness conditions.
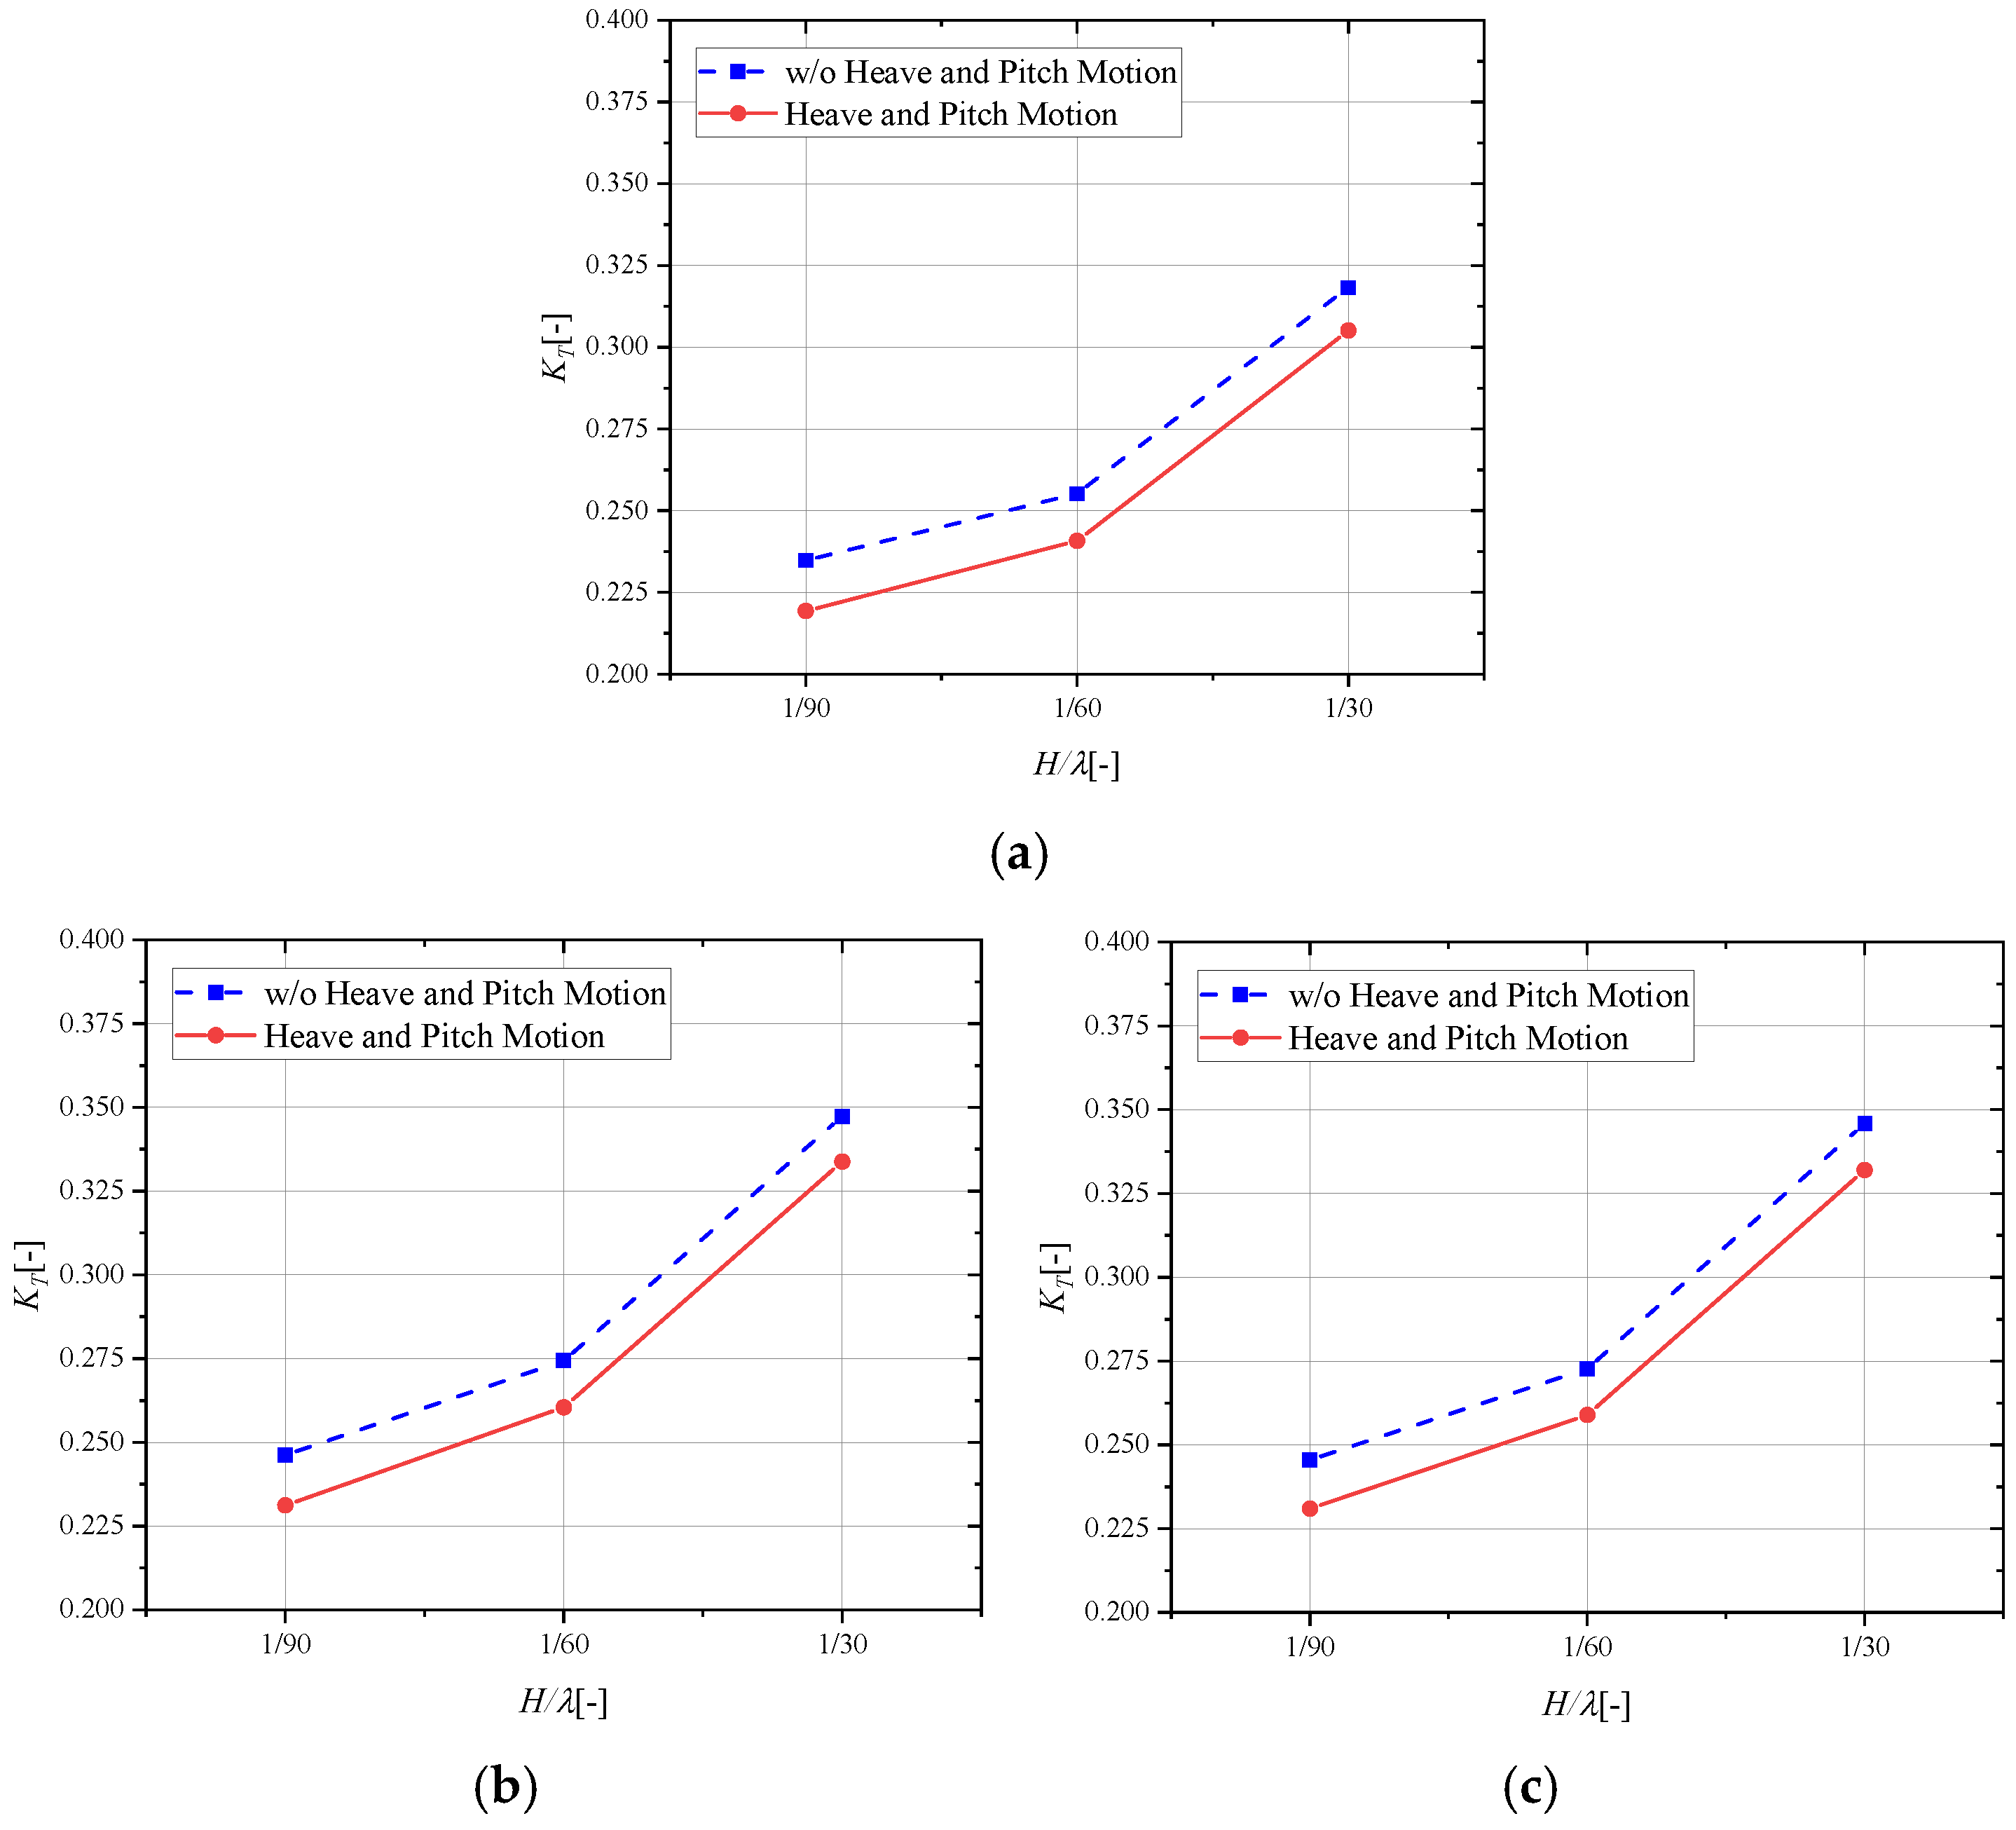
Figure 14 compares thrust coefficients across different wave steepness values at constant wavelengths, while
Figure 15 presents the corresponding torque coefficients. In both figures, results for the propeller under heave and pitch motions are indicated by red solid lines, whereas blue dotted lines represent the propeller without these motions.
As shown in
Figure 14 and
Figure 15, both thrust and torque coefficients increase notably with greater wave steepness. This trend is attributed to the heightened wave-added resistance under steeper waves, which imposes an increased load on the propeller at a fixed sailing speed. Furthermore, the figures reaffirm the observed reduction in thrust and increase in torque resulting from heave and pitch motions.
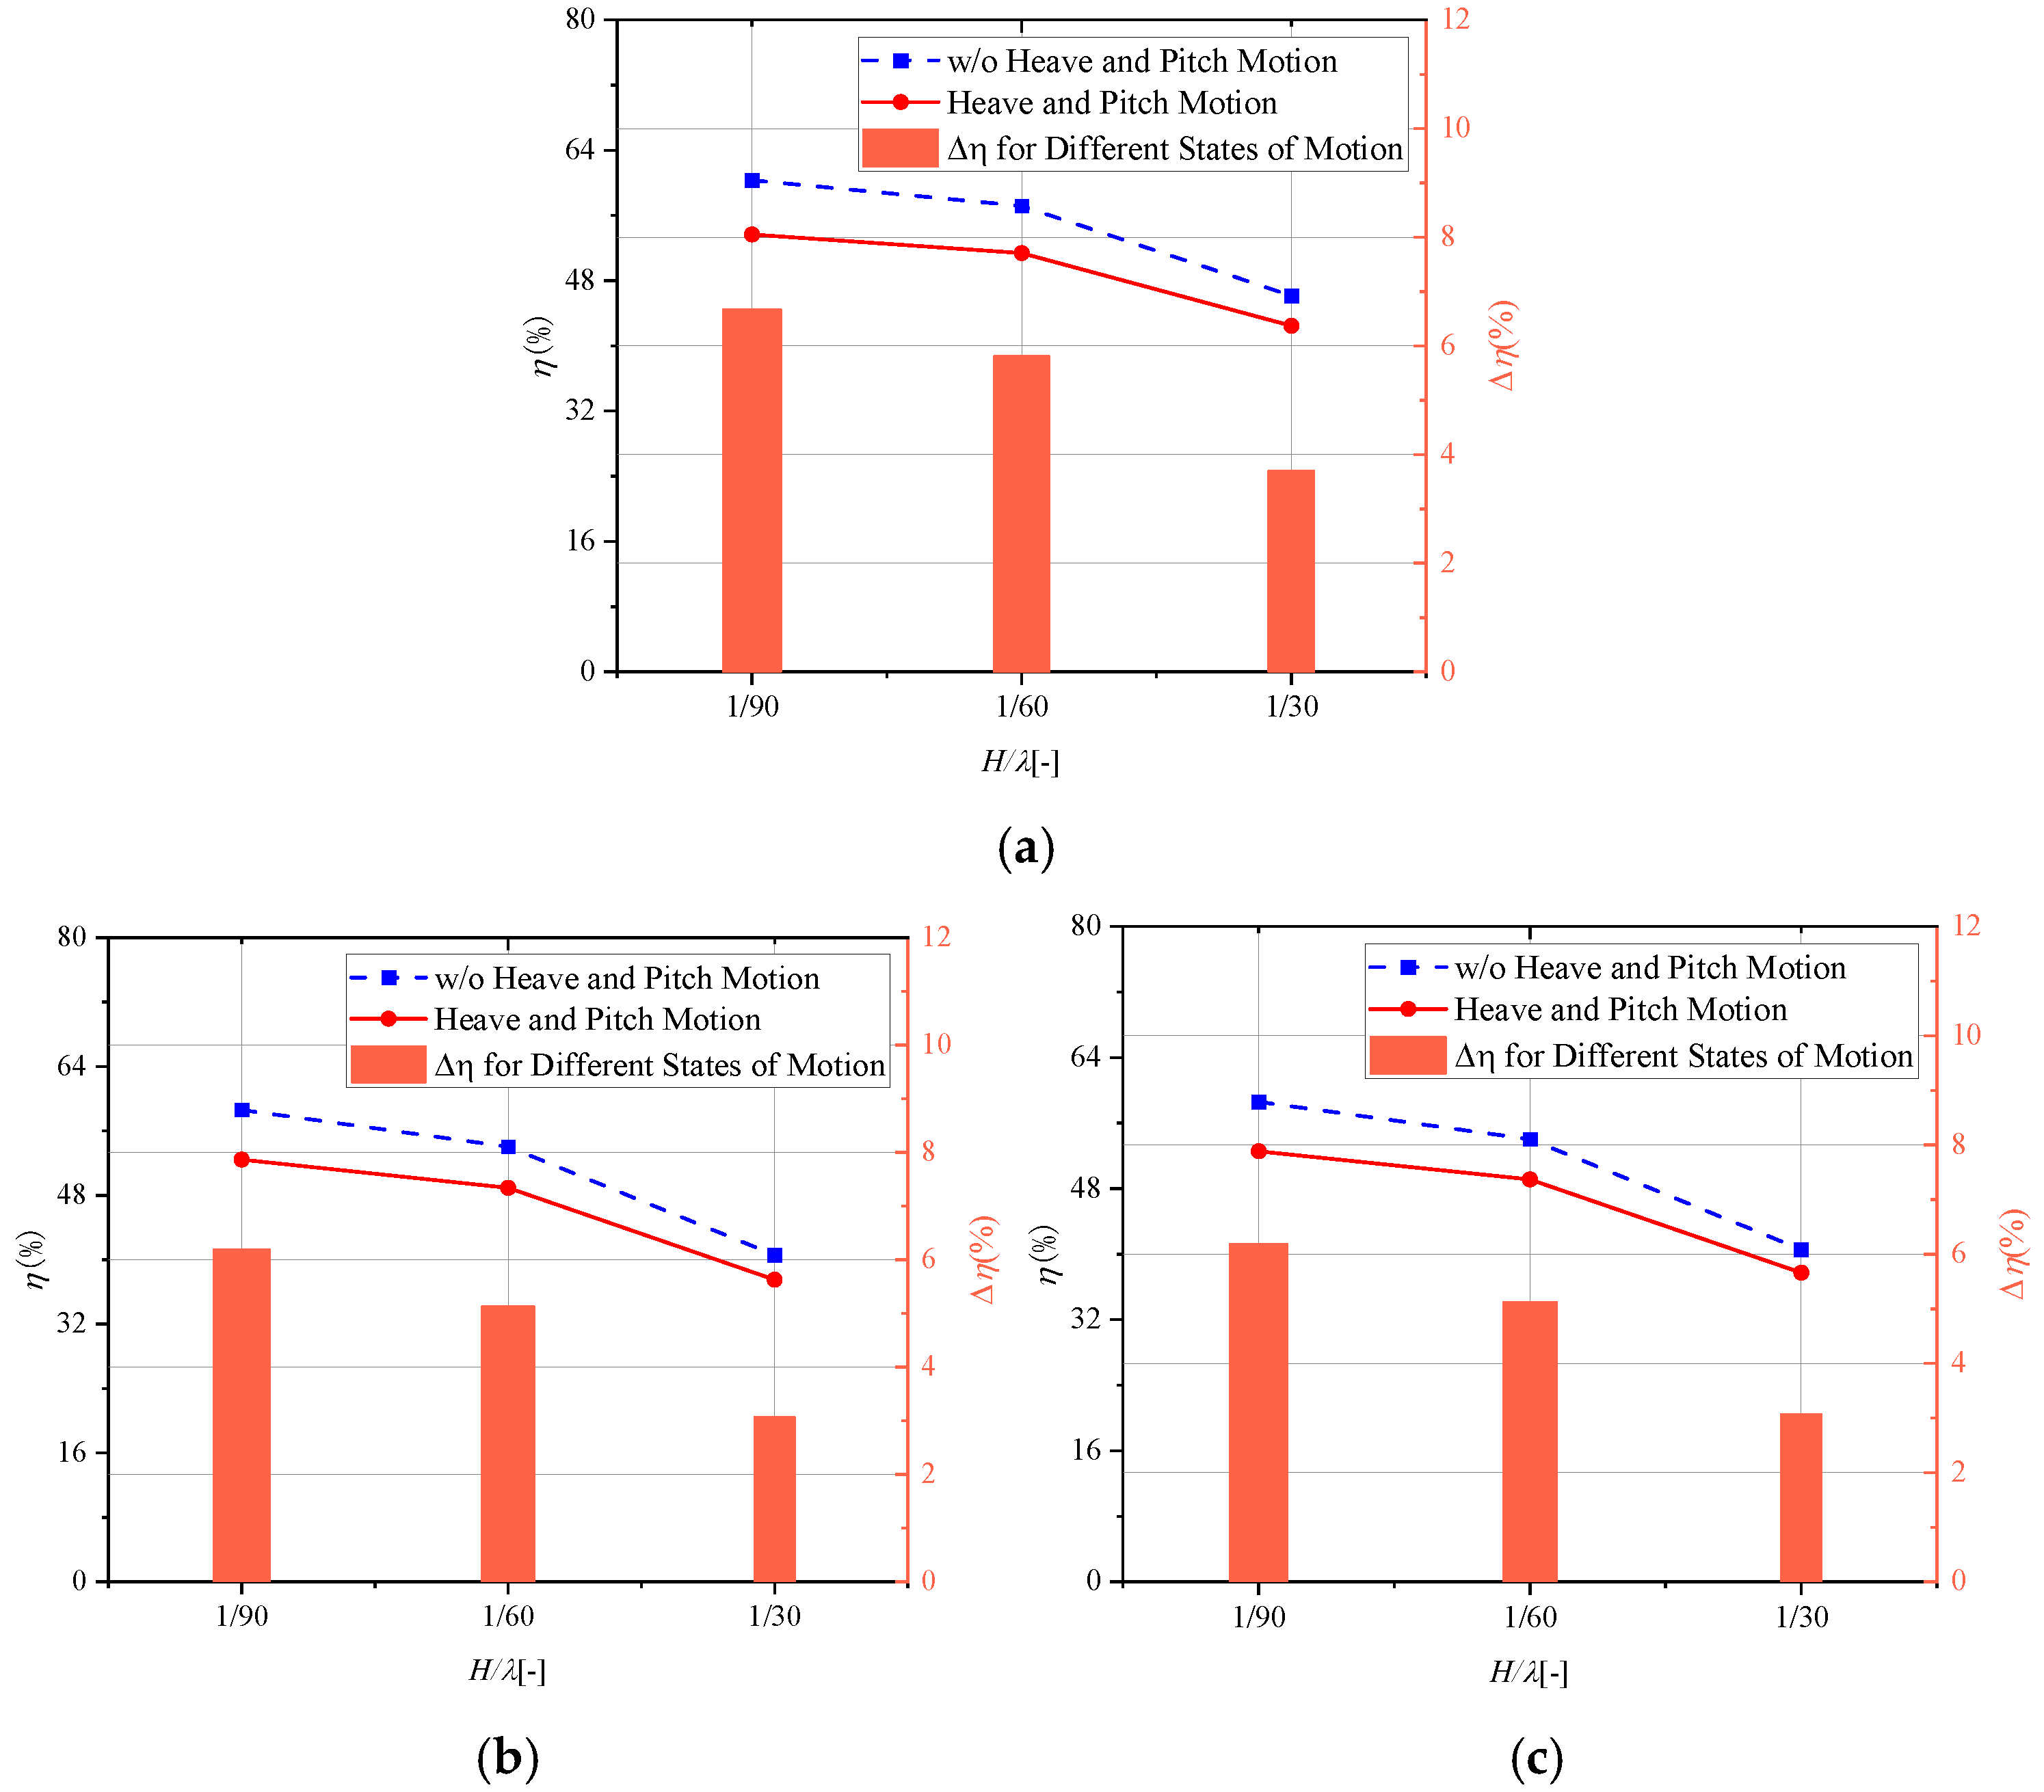
Figure 16 illustrates the reduction in propeller efficiency caused by heave and pitch motions. This is examined for different wave steepness at a fixed wavelength. In the figure, the red solid line represents propeller efficiency incorporating heave and pitch effects, while the blue dotted line corresponds to the baseline efficiency without these motion-induced disturbances. The orange bar chart quantifies the absolute efficiency reduction between the two scenarios.
As seen in
Figure 16, under the three tested wave steepness conditions, the propeller efficiency shows noticeable decreases when heave and pitch motions are considered compared to when they are not. Under low wave steepness of 1/90, the propeller efficiency experiences an absolute decrease of over six percentage points when accounting for heave and pitch effects, which is equivalent to a relative reduction exceeding 10%; whereas under high wave steepness of 1/30, the absolute efficiency drop exceeds three percentage points, corresponding to a relative reduction of approximately 7%.
It is interesting to find that the influence of heave and pitch motions on propeller efficiency is less pronounced under high wave steepness compared to low wave steepness conditions. This phenomenon can be attributed to the following mechanisms: while larger wave steepness corresponds to greater heave and pitch motion amplitudes, it simultaneously induces more significant wave-added resistance, consequently altering the propeller’s operating conditions under self-propulsion. At lower wave steepness, the propeller operates at a relatively lower rotational rate and, therefore, the circumferential inflow velocity of the propeller is relatively low. When the radial inflow velocity of the propeller is affected by heave and pitch motions, the resulting changes in the hydrodynamic pitch angle of propeller blades become more pronounced, leading to greater variations in overall hydrodynamic performance. Conversely, at higher wave steepness, the propeller rotates faster, and the circumferential inflow velocity increases. In this scenario, the influence of heave and pitch motions on the advance velocity has relatively less impact on the propeller’s overall performance, despite the larger heave and pitch motion amplitudes.
4.3.5. Impact of Independent Heave and Pitch Motions on Propeller Hydrodynamics
In all the numerical results presented above, both heave motion and pitch motion were simultaneously applied to the propeller during calculations. To better understand their individual contributions to propeller hydrodynamics, this section separately examines the effects of isolated heave motion and pitch motion. Following the same operating conditions listed in
Table 3 and
Table 4, we applied these individual motions to our proposed simplified method.
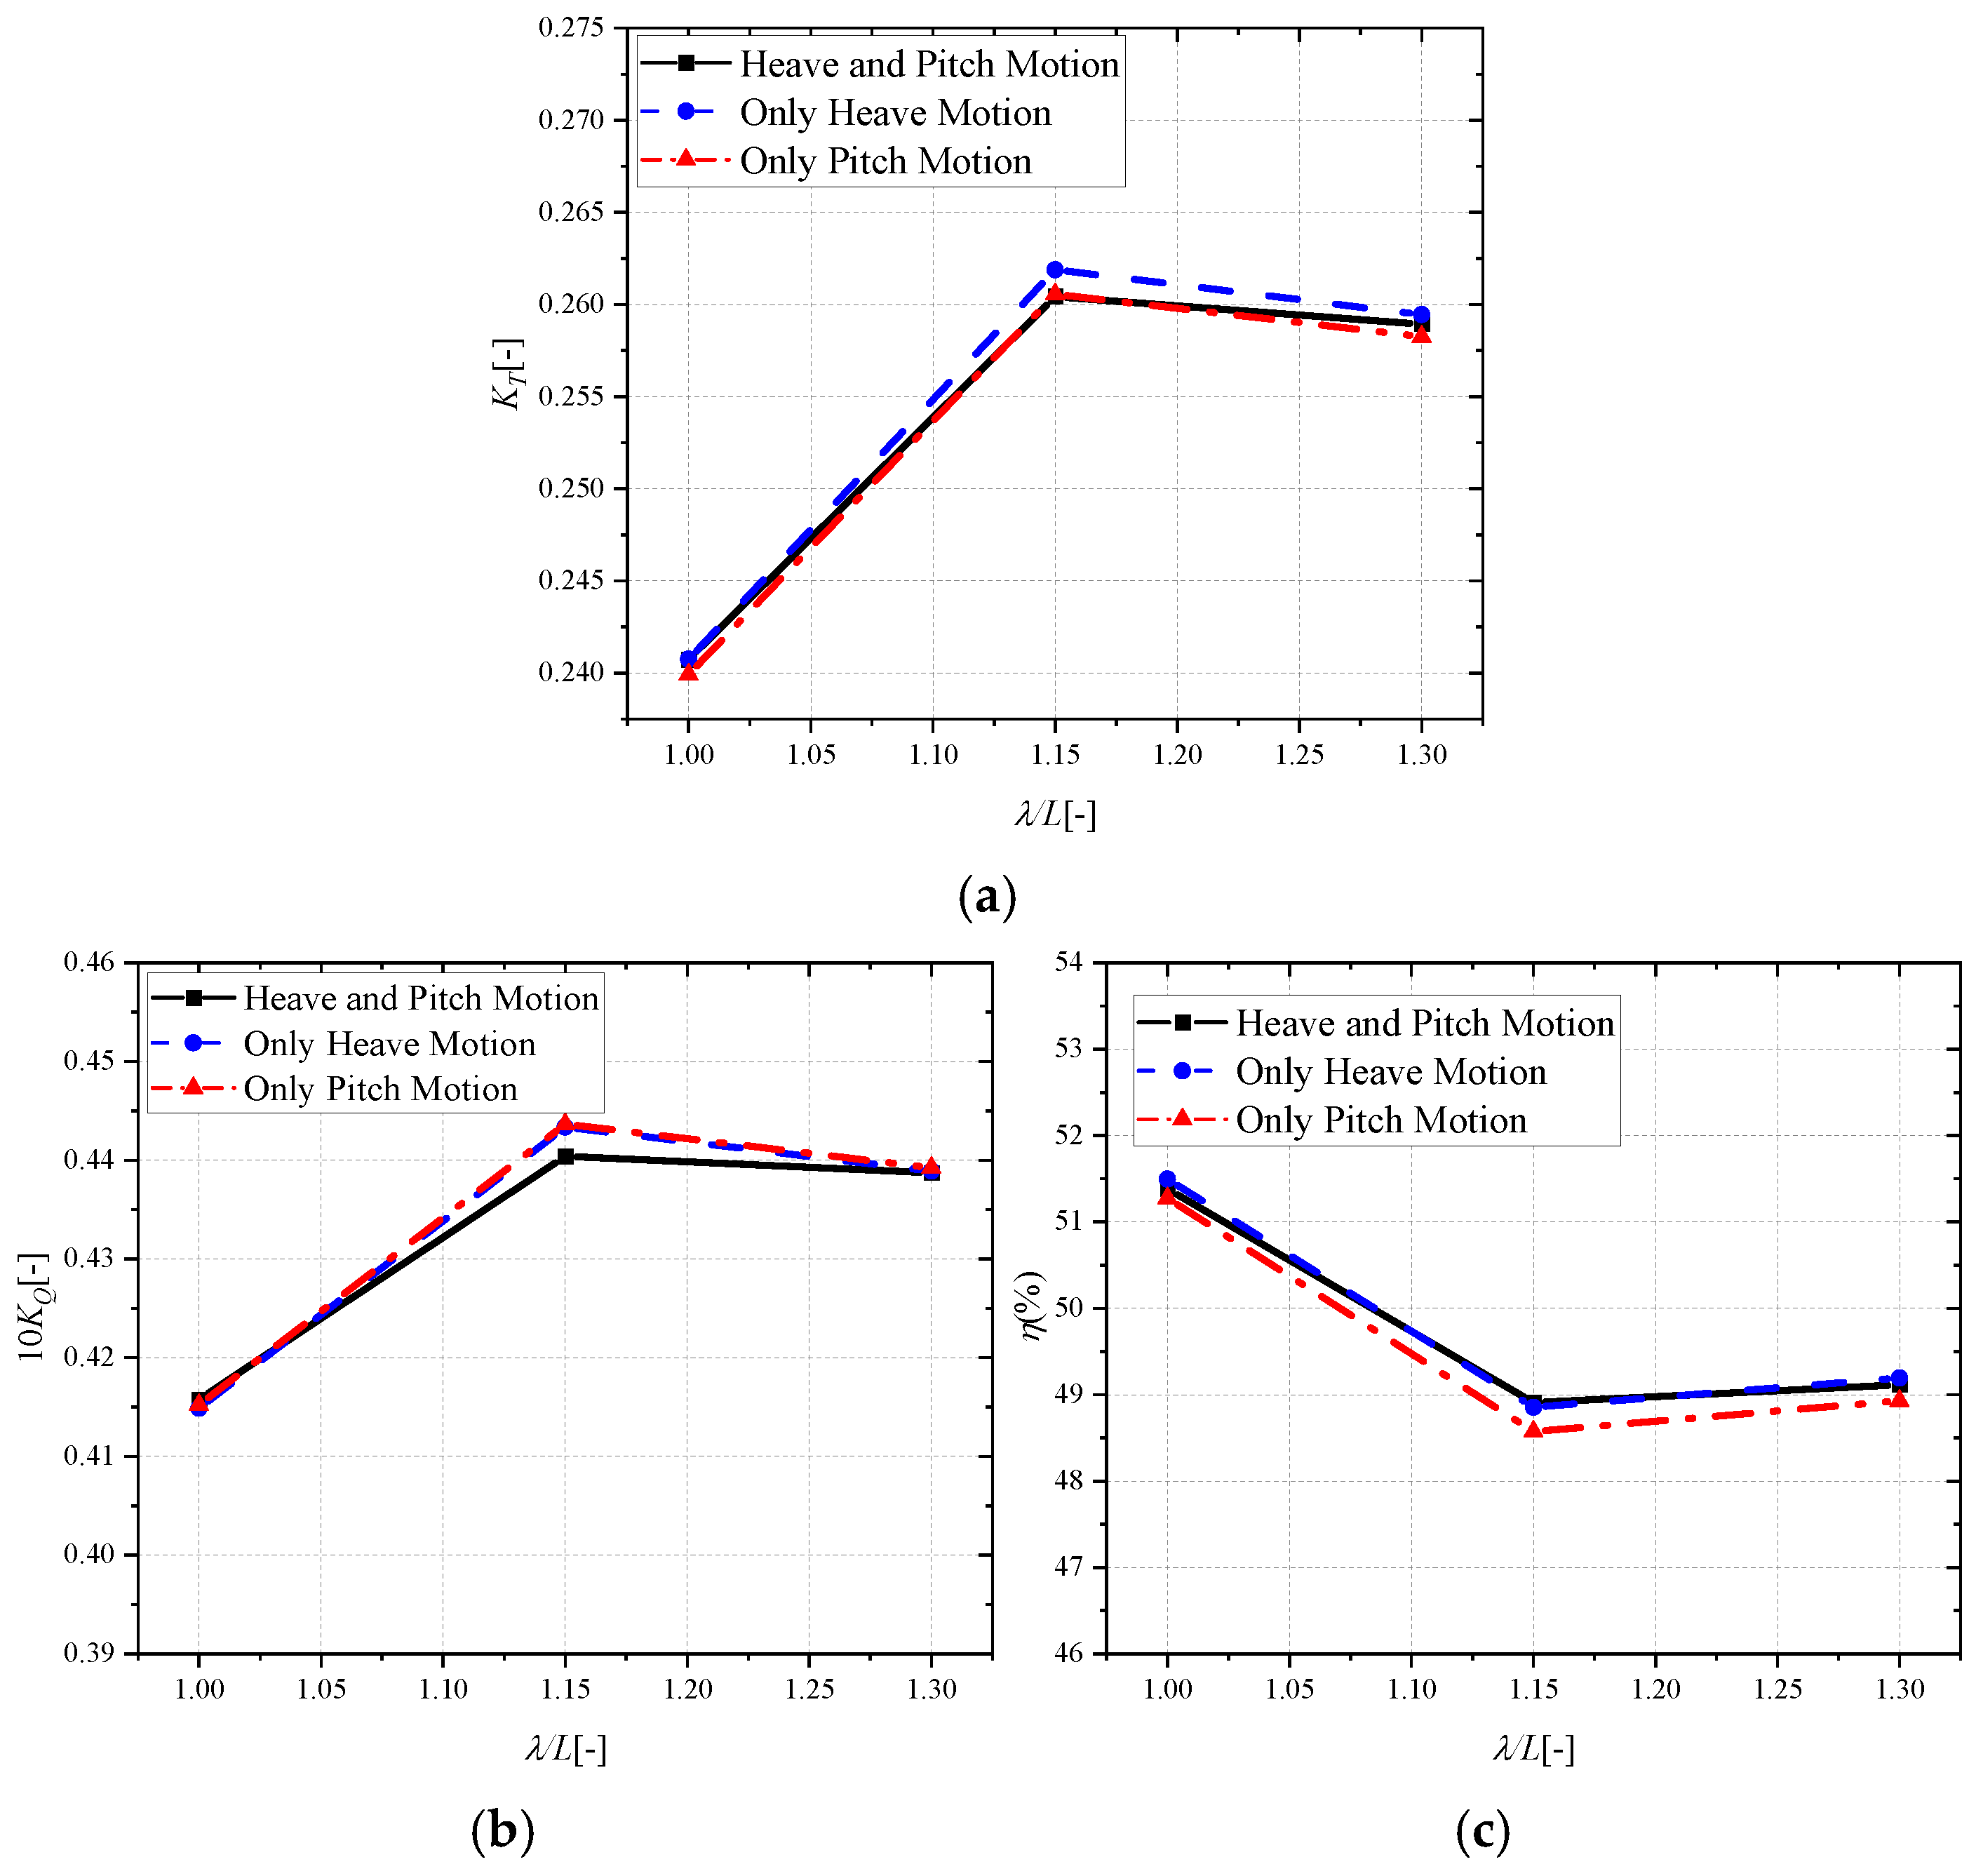
Figure 17 presents variations in propeller hydrodynamic performance across varying wavelength conditions, under three kinematic configurations: coupled heave and pitch motions (black dotted line with square symbol), isolated heave motion (blue dotted line with circle symbol), and isolated pitch motion (red dash-dotted line with triangle symbol).
Figure 17a shows that isolated heave motion generates higher thrust than coupled heave-pitch motion, while isolated pitch motion results in lower thrust.
Figure 17b further indicates that both isolated heave and pitch motions produce greater torque than the coupled motion. Interestingly,
Figure 17c reveals that the coupled heave-pitch motion does not result in the lowest efficiency among the three cases—instead, the isolated pitch motion leads to the most substantial efficiency reduction. These findings suggest that hydrodynamic coupling between heave and pitch motions introduces a nonlinear, counteracting effect on efficiency loss, rather than a simple additive combination of individual motion penalties. As can be seen from the figure, compared to heave motion, the ship’s pitch motion has a more significant impact on propeller performance, not only reducing the thrust but also causing a noticeable decrease in propeller efficiency.
5. Conclusions
This study develops a simplified computational method for assessing propeller performance under wave-induced heave and pitch motions. The methodology integrates potential flow theory-derived motion RAOs with CFD-based hydrodynamic analysis, where prescribed heave and pitch motions are systematically imposed on the propeller.
Numerical tests were conducted based on the KCS container ship and its matched KP505 propeller. The numerical results demonstrated that the wave-induced heave and pitch motions lead to a consistent performance degradation, manifested by thrust reduction and torque increase, ultimately leading to an absolute efficiency decrease of 3 to 6 percentage points across all tested wave conditions (equivalent to approximately 10% relative reduction).
Verification against high-fidelity CFD results confirms that the proposed method delivers fairly good accuracy and high computational efficiency. It therefore shows strong potential as an effective tool for the systematic analysis of propeller performance in complex operational scenarios.

