Article

Comparison of Numerical Simulations of Propeller Open-Water Performance with Cavitation for High-Speed Planing Hulls

1
IIHR-Hydroscience & Engineering, University of Iowa, Iowa City, IA 52242, USA
2
Mercury Marine, Fond Du Lac, WI 54935, USA
*
Authors to whom correspondence should be addressed.
J. Mar. Sci. Eng. 2025, 13(9), 1804; https://doi.org/10.3390/jmse13091804
Submission received: 31 August 2025 / Revised: 15 September 2025 / Accepted: 16 September 2025 / Published: 18 September 2025
(This article belongs to the Special Issue Novelties in Marine Propulsion)

Abstract

Numerical simulations of an open-water propeller are performed using CFDShip-Iowa. The propeller, originally designed by Mercury Marine for a 21 feet high-speed planing hull, is scaled to match a 42 feet hull configuration. Three advance ratios ( J = 0.8, 1.1, and 1.4) and two cavitation numbers (σ = 0.274 and 1.095) are considered in the computations, and the results are compared with those obtained from the commercial CFD solver STAR-CCM+. For the fully wetted conditions without cavitation, the overall trends of the computed thrust ( K t ), torque ( K q ), and propeller efficiency ( η ) with respect to the advance ratios are similar. The computed K t , K q , and η with cavitations generally agree with the STAR-CCM+ results except for η at σ = 0.274, where the latter shows a much higher value for J = 1.4. For σ = 1.095, the cavitation patterns and overall pressure distributions are similar for both codes. For σ = 0.274, the cavitation is more violent for CFDShip-Iowa than STAR-CCM+. CFDShip-Iowa shows better preservation of the cavities and blade-to-blade interactions, which are not captured in the simulations using STAR-CCM+, since a single blade with periodic boundary conditions are used.

1. Introduction

High-speed small craft with surface-pierced propellers experience severe cavitation and ventilation effects, particularly during planing conditions at high speeds. Ventilation occurs when air is drawn into the propeller region due to partial submergence, leading to a decrease in thrust and overall propeller efficiency. Cavitation induces noise, vibration, and potential damage to propeller blades, negatively affecting vessel performance and longevity. Accurately capturing the interaction of these multiphase phenomena with the rotating propeller is essential for reliable performance prediction and design optimization.
Propeller open-water (POW) tests with cavitation effects play a critical role in estimating the performance of high-speed planing hulls. However, both experimental testing and numerical prediction of propeller hydrodynamics with cavitation phenomena is challenging due to the interactions between the complex turbulent multiphase flows and the rotating body. Experimental POW tests involving cavitation are more limited by scale effects, facility constraints, controllability of test conditions, and difficulties in visualization and measurement. An experimental study for a surface-piercing propeller was conducted by Olofsson [1] using the propeller model 841-B, followed by the numerical studies by Young and Kinnas [2] and Nouroozi and Zeraatgar [3] using a boundary element method (BEM) and a (Unsteady Reynolds-Averaged Navier–Stokes) URANS method, respectively. The BEM results generally compared well with the experimental measurements, but force fluctuations were not captured. The URANS results computed using the FLUENT (v14.5) software showed errors up to 15%. In the recent study by Yari and Moghadam [4], the POW characteristics of the 841-B propeller were studied using BEM-based predictions. The computed results showed small errors at high advance ratios but large errors at low advance ratios, where the errors for the thrust and torque coefficients were up to 30% and 60%, respectively, at an advance ratio of 0.4. Therefore, high-fidelity Computational Fluid Dynamics (CFD) simulations that incorporate viscosity effects should be considered for accurately predicting a wide range of propeller operating conditions. Numerous CFD POW studies have been conducted recently to investigate cavitation effects [5,6,7,8,9], salinity effects [10], wave conditions [11], geometry optimization [12], scaling effects [13], and propeller–hull interaction [14], though most studies are not specifically for propellers on high-speed planing hulls. Overall, these studies demonstrate that CFD approaches are capable and effective for evaluating marine propeller performance under various conditions.
The objective of the present study is to perform numerical simulations of the propeller open-water performance with a focus on cavitation effects for a high-speed planing hull, which serves as a prerequisite for subsequent self-propulsion and acceleration simulations [15] using the actual propeller and gear case geometries. A Froude number of 1.84 is used for the simulations, which is relatively high compared to those usually employed in POW tests. The PLSN6143 propeller, originally designed by Mercury Marine for a 21 feet (6.4 m) high-speed planing hull, is scaled up by a factor of two to match a 42 feet (12.8 m) model of General Prismatic Planing Hull (GPPH) and is used for the simulations. The high-fidelity simulation tools CFDShip-Iowa V4.5 and V5.5 are employed for the computations, with the results compared to those obtained from the commercial CFD solver STAR-CCM+. Detailed computational methods and the setup are presented in Section 2, followed by the computational results and discussions in Section 3.

2. Computational Methods and Setup

CFDShip-Iowa V4.5 and V5.5 are used for the simulations. V4.5 is a single-phase solver with the level set method for free surface modeling, and V5.5 is a fully coupled multi-phase solver [16,17] using a volume-of-fluid (VOF) method for the air–water interface treatment. The grids and CFD setups are the same for both codes. V4.5 is used for the fully wetted cases without cavitation, and V5.5 is used for both fully wetted and cavitation cases. The commercial CFD code, STAR-CCM+ v17.02, is also used for the simulations for comparison purposes. Note that the use of two distinct solvers is for the independent verification of the results since experimental data is not available. The choice of turbulence and cavitation models and overall modeling strategies is based on model availability, code stability, and practical experience.

2.1. Mathematical Model and Numerical Method

In CFDShip-Iowa V4.5, a single-phase level set method is used for free surface modeling. The pressure in the air region is constant, and a zero normal gradient for both the k and ω are used at the free surface. Periodic reinitializations of the level set function are performed to keep the property of being a distance function during the simulation. CFDShip-Iowa V5.5 is a fully coupled multi-phase flow solver developed based on V4.5. In V5.5, the highly accurate geometric VOF method is used to replace the level set method for interface tracking. The vapor transport mixture cavitation models, e.g., the Zwart–Gerber–Belamri model [18], have been implemented into V5.5 [17], where a numerical scheme has been developed for the cavitation models in the framework of a pressure projection method for incompressible Navier–Stokes equations. An algorithm for three-phase water/vapor/air interaction is also developed for flows with both ventilation and cavitation. In the present study, cavitation is represented using the vapor volume fraction.
Menter’s blended k     ω / k     ϵ turbulent model [19] is used for turbulence modeling in both V4.5 and V5.5. The 6DoF motion of ships is predicted by solving the rigid body equations of motion and is realized using the overset grid technique. Suggar [20] is used to obtain the overset domain connectivity information for overlapping grids. An implicit second-order Euler backward difference scheme is used for the time derivatives. The convection terms are discretized using the 2nd-order upwind scheme, and the 2nd-order central difference scheme is used for the diffusion terms. The same discretization schemes are used for the turbulence and level set equations. Incompressibility is enforced by a strong pressure/velocity coupling using a projection (fractional time step) method, and the resulting pressure equation is solved using the Portable Extensible Toolkit for Scientific Computing (PETSc) v3.19.4. The code is parallelized using the MPI-based domain decomposition approach, where each decomposed block is mapped to one processor. Details of the mathematical models and numerical methods can be found in the above papers and references therein.
STAR-CCM+ (v17.02) employs unstructured polyhedral grids and the finite volume method for spatial discretization, along with an implicit scheme for time integration. The second-order convective HRIC scheme volume-of-fluid (VoF) method is used to capture and track the water–vapor interface. The realizable k ε two-layer model is used for the turbulence modeling, and the Schnerr–Sauer cavitation model [21] is used to model the phase change.

2.2. Computational Setup

Figure 1 shows the geometry of the PLSN6143 propeller, which has a diameter of 0.710 m and four blades at a skew angle of 11.77 degrees. The tip rake and skew-induced rake are 0.174 m and 0.035 m, respectively. The pitch distance is 1.065 m, and the hub diameter is 0.228 m, which gives a hub-to-diameter ratio greater than 0.32. The length of the hub shown in Figure 1 is 0.37 m. The detailed specifications of the propeller geometry are given in Table 1. Note that both the STAR-CCM+ and CFDShip-Iowa simulations assume an infinite hub, with the latter extending to the inlet boundary. Only the blades are considered for the calculation of the thrust and torque coefficients.
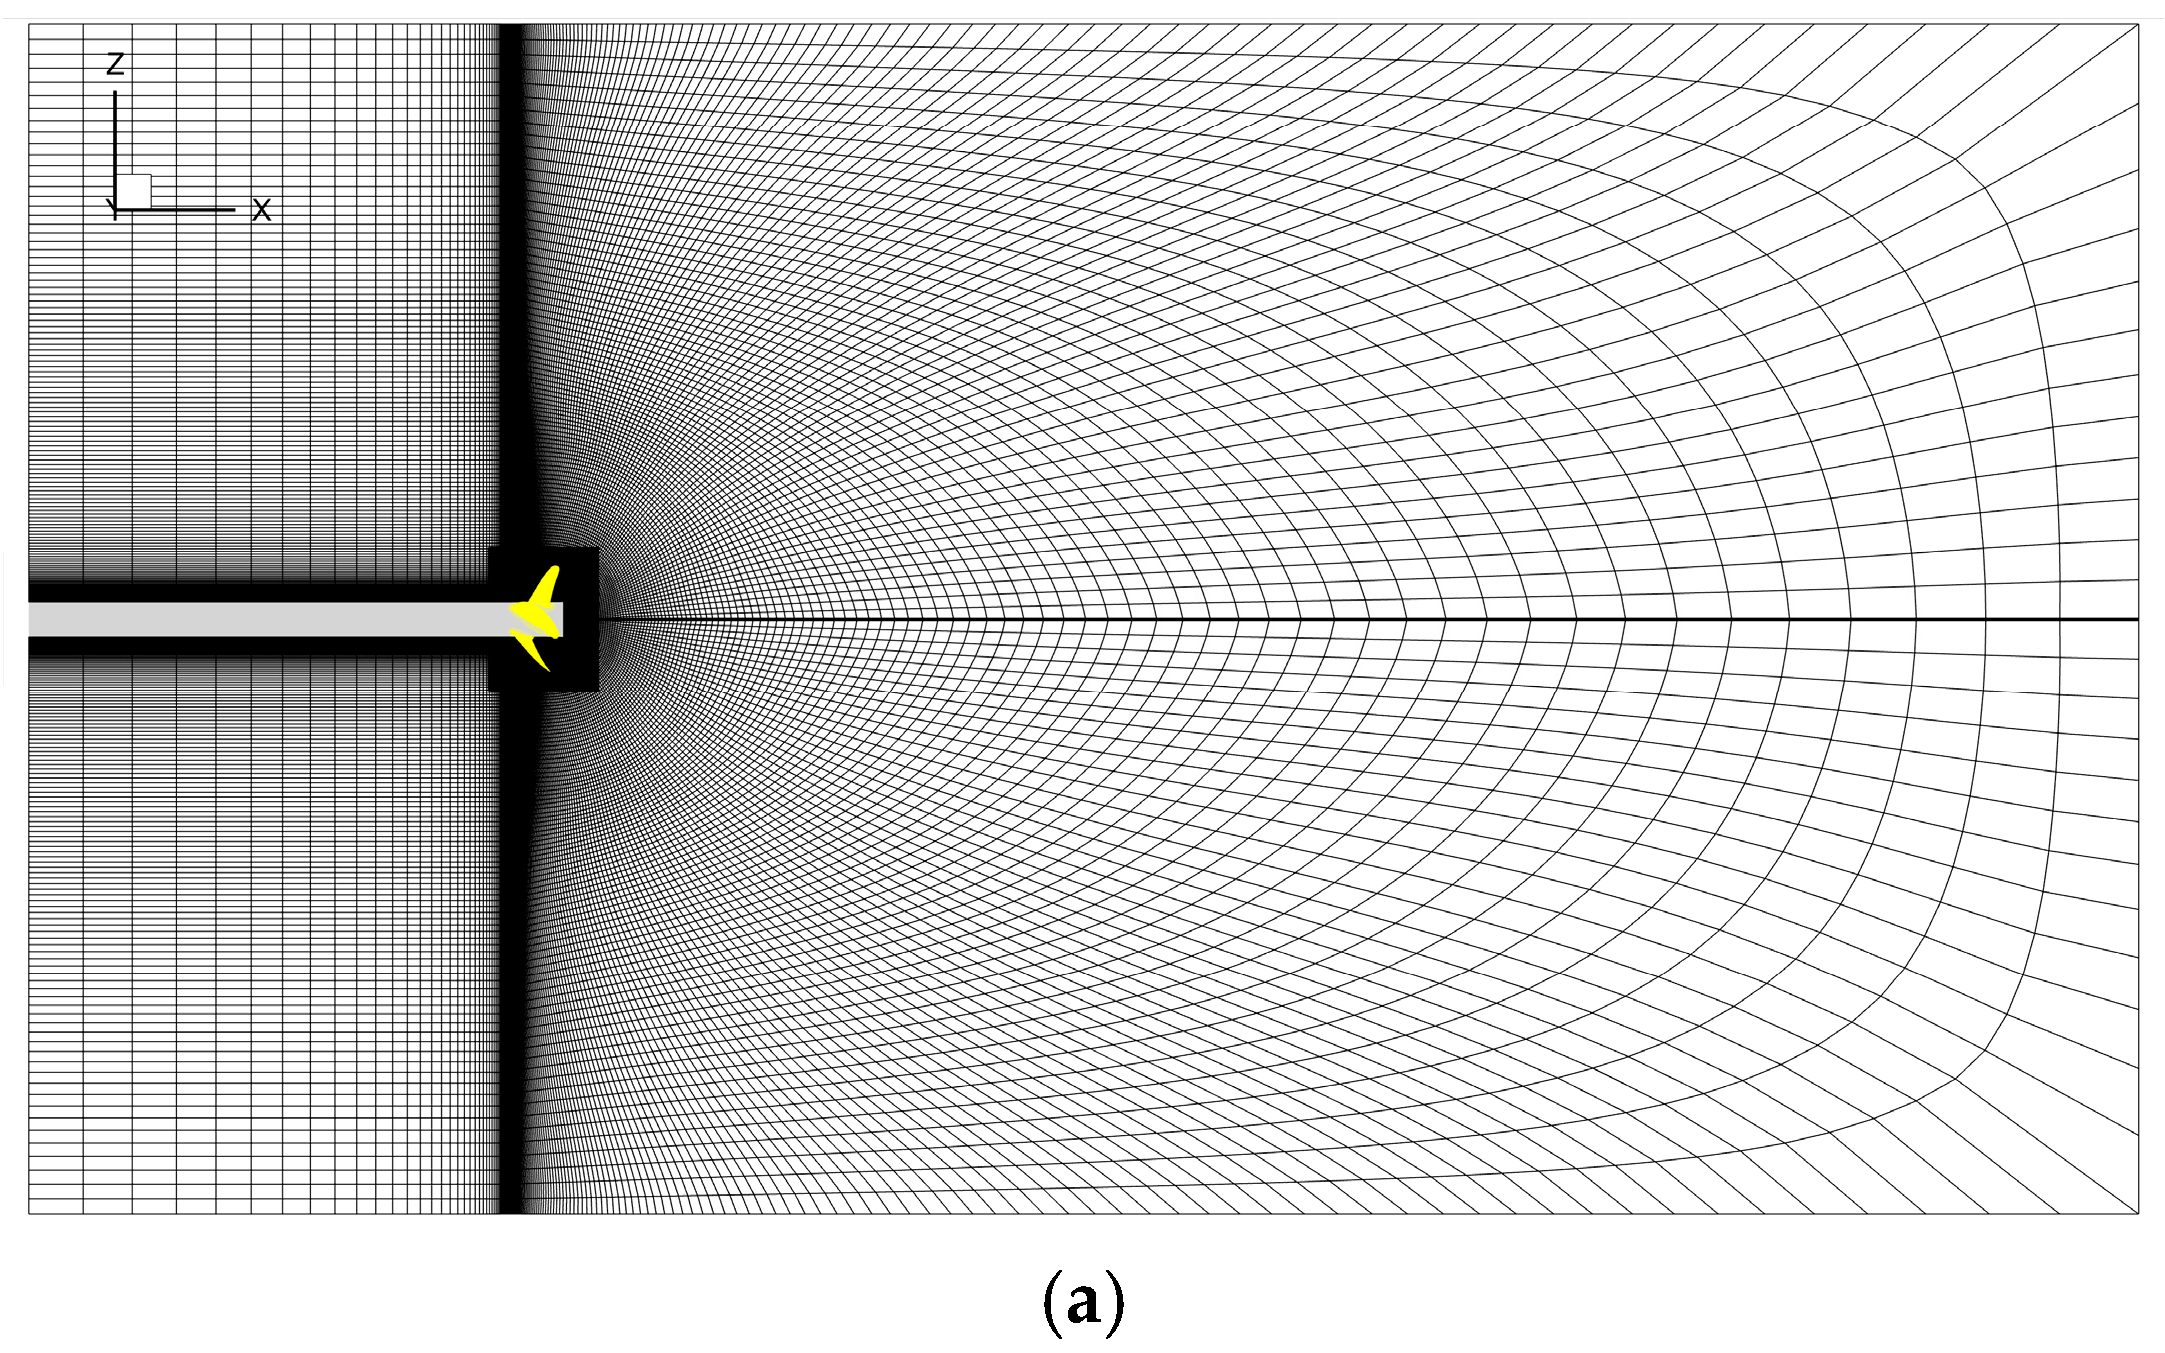
Figure 2 shows the computational domain in terms of propeller diameter ( D ) and boundary conditions for the CFDShip-Iowa simulations, where the hub of the propeller is extended to the inlet and a cylindrical background grid is used. Zero-gradient boundary conditions for both velocity and pressure are applied on the outer boundary of the cylindrical background grid. Constant velocity and zero gradient of the pressure are used at the inlet, and constant pressure and zero gradient of the velocity are imposed at the outlet. No-slip wall boundary conditions are applied to surfaces of the propeller blades and hub. The entire grid system rotates to represent the propeller rotating motion while maintaining the static overset mesh connectivity among grid blocks.
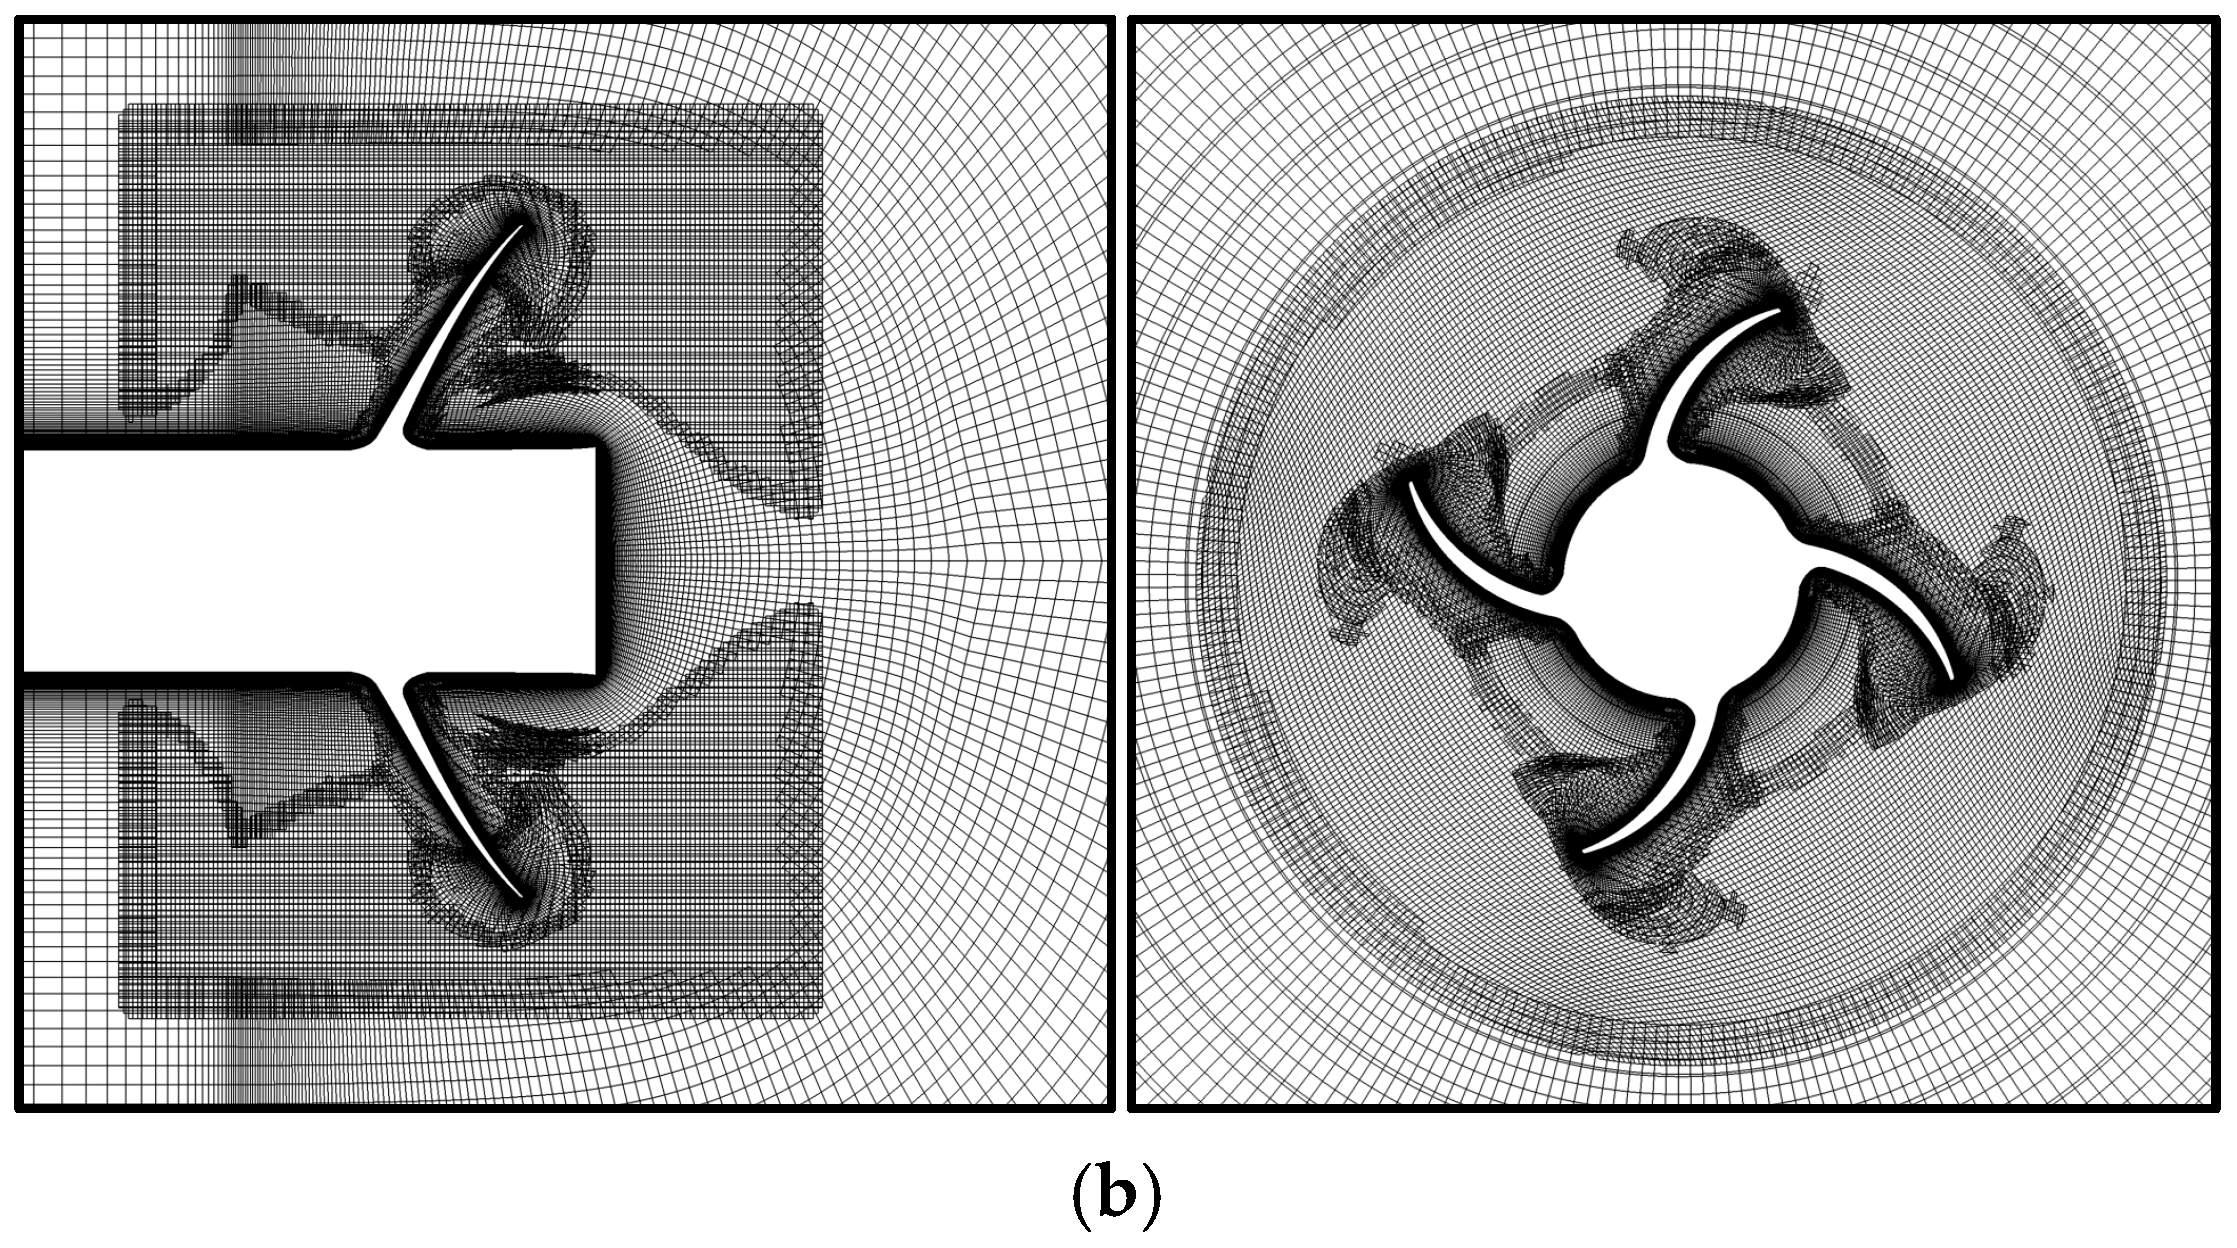
Figure 3 shows the multi-block and structured overset grids used in the CFDShip-Iowa simulations. The grid consists of 10 overlapping blocks, including 1 background, 1 refinement, 4 blade, and 4 blade tip blocks. The numbers of grid points are 7.43 M, 3.38 M, 3.43 M, and 1.30 M, respectively, with a total of 15.5 M grid points. The grid spacing near the wall surface is designed to satisfy y + 1.0 .
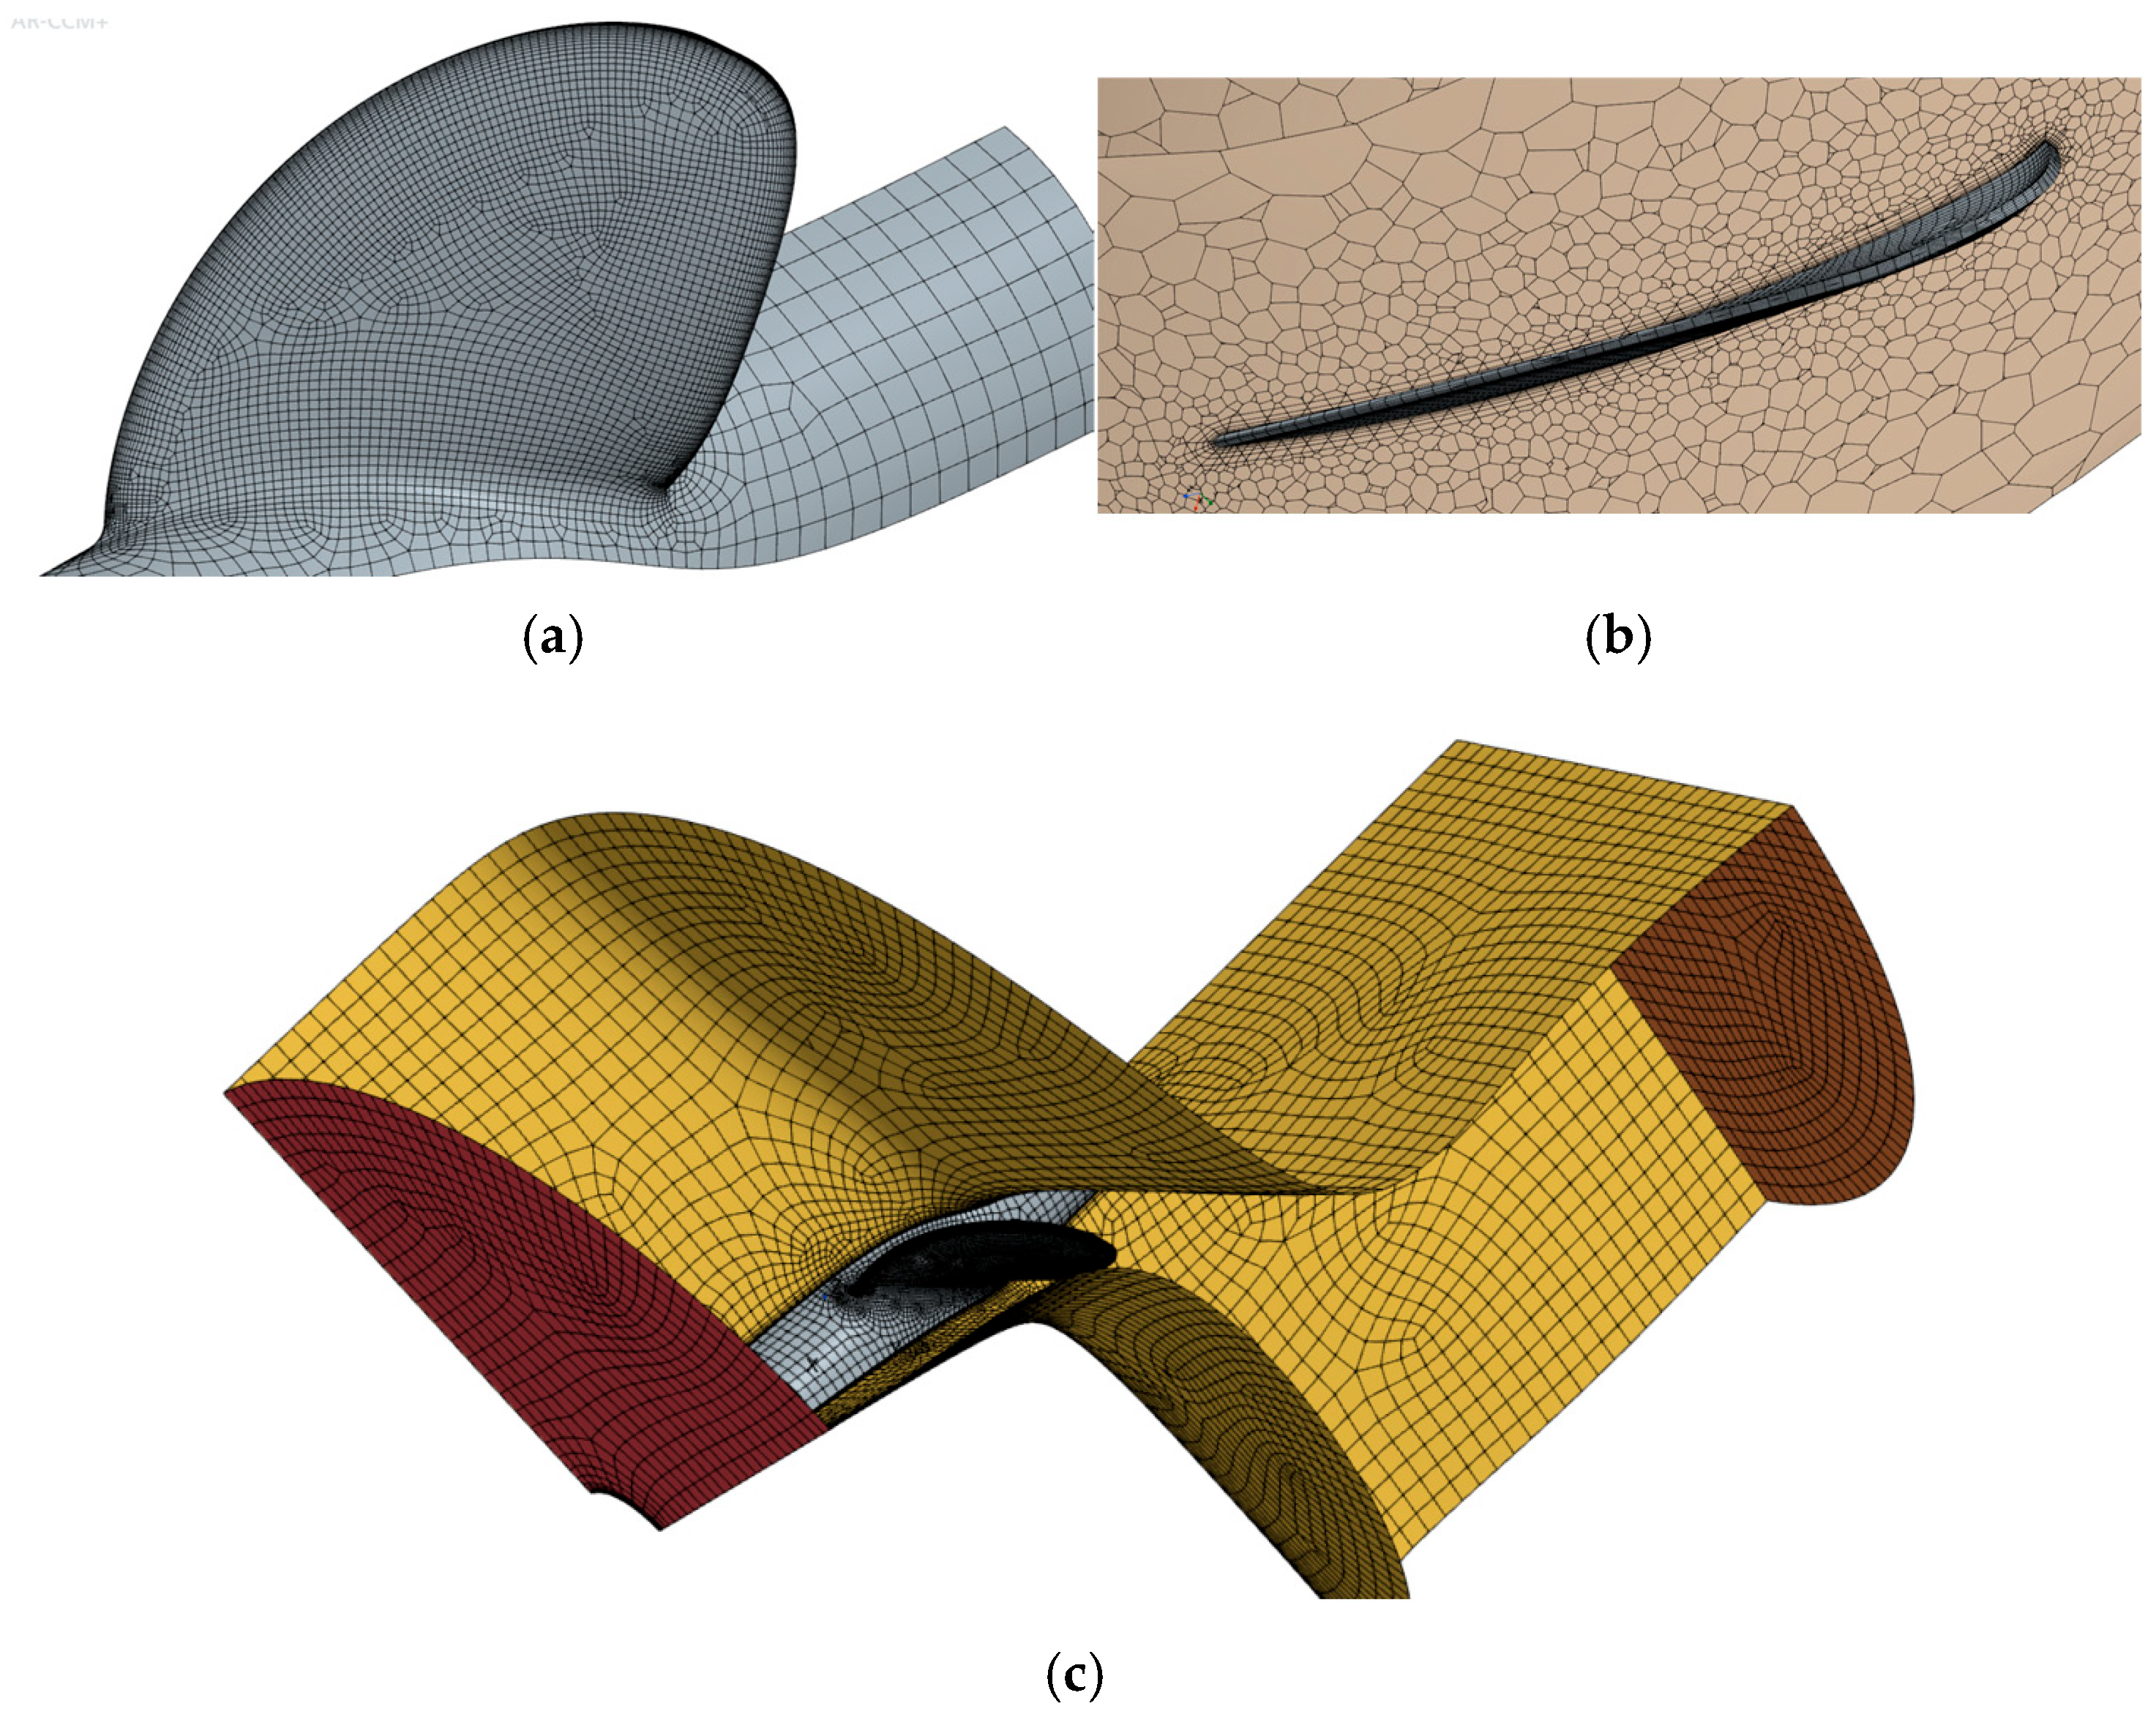
For the STAR-CCM+ simulations, a single blade geometry is used. Figure 4 shows the geometry and computational domain, where a moving reference frame (MRF) and periodic boundary condition are used. Constant-velocity and zero-pressure-gradient boundary conditions are used at the inlet, and a constant-pressure boundary condition is applied at the outlet. The reference pressure P r e f is calculated based on the cavitation number:
σ = P r e f P v 1 2 ρ w U 0 2
An unstructured polyhedral mesh is used for the STAR-CCM+ simulations, as shown in Figure 5. The base size is set to 0.01 m, with target and minimum surface sizes set to 25% and 1% of the base size, respectively. At the no-slip wall, 5 prism layers are applied with a total thickness of 20% base size and a stretching factor of 1.5 to resolve the boundary layer appropriately. The total number of cells, faces, and vertices for the unstructured polyhedral mesh is 717 K, 3.78 M, and 2.81 M, respectively.
For the current propeller open-water simulations, three advance ratios, J = 0.8, 1.1, and 1.4, are used with a constant inlet velocity of 20.68 m/s, which corresponds to a Froude number of F r = 1.84 for the GPPH. The corresponding RPS values are 36.42, 26.49, and 20.81 for the given advance ratios. For the fluid properties, the densities ρ w = 1000 kg/m3 and ρ v = 0.02558 kg/m3 are used for the liquid and vapor phases, respectively. The kinematic viscosities are ν w = 1.0 × 10⁻⁶ m2/s for the liquid phase and ν v = 8.85 × 10⁻⁹ m2/s for the vapor phase. The vapor pressure for cavitation is P v = 2334.1 Pa. Two different cavitation numbers, σ = 0.274 and 1.095, are considered, which require the reference pressure P r e f to be set to 60.94 kPa and 236.6 kPa, respectively.

3. Results

3.1. Thrust and Torque Coefficients and Propeller Efficiency

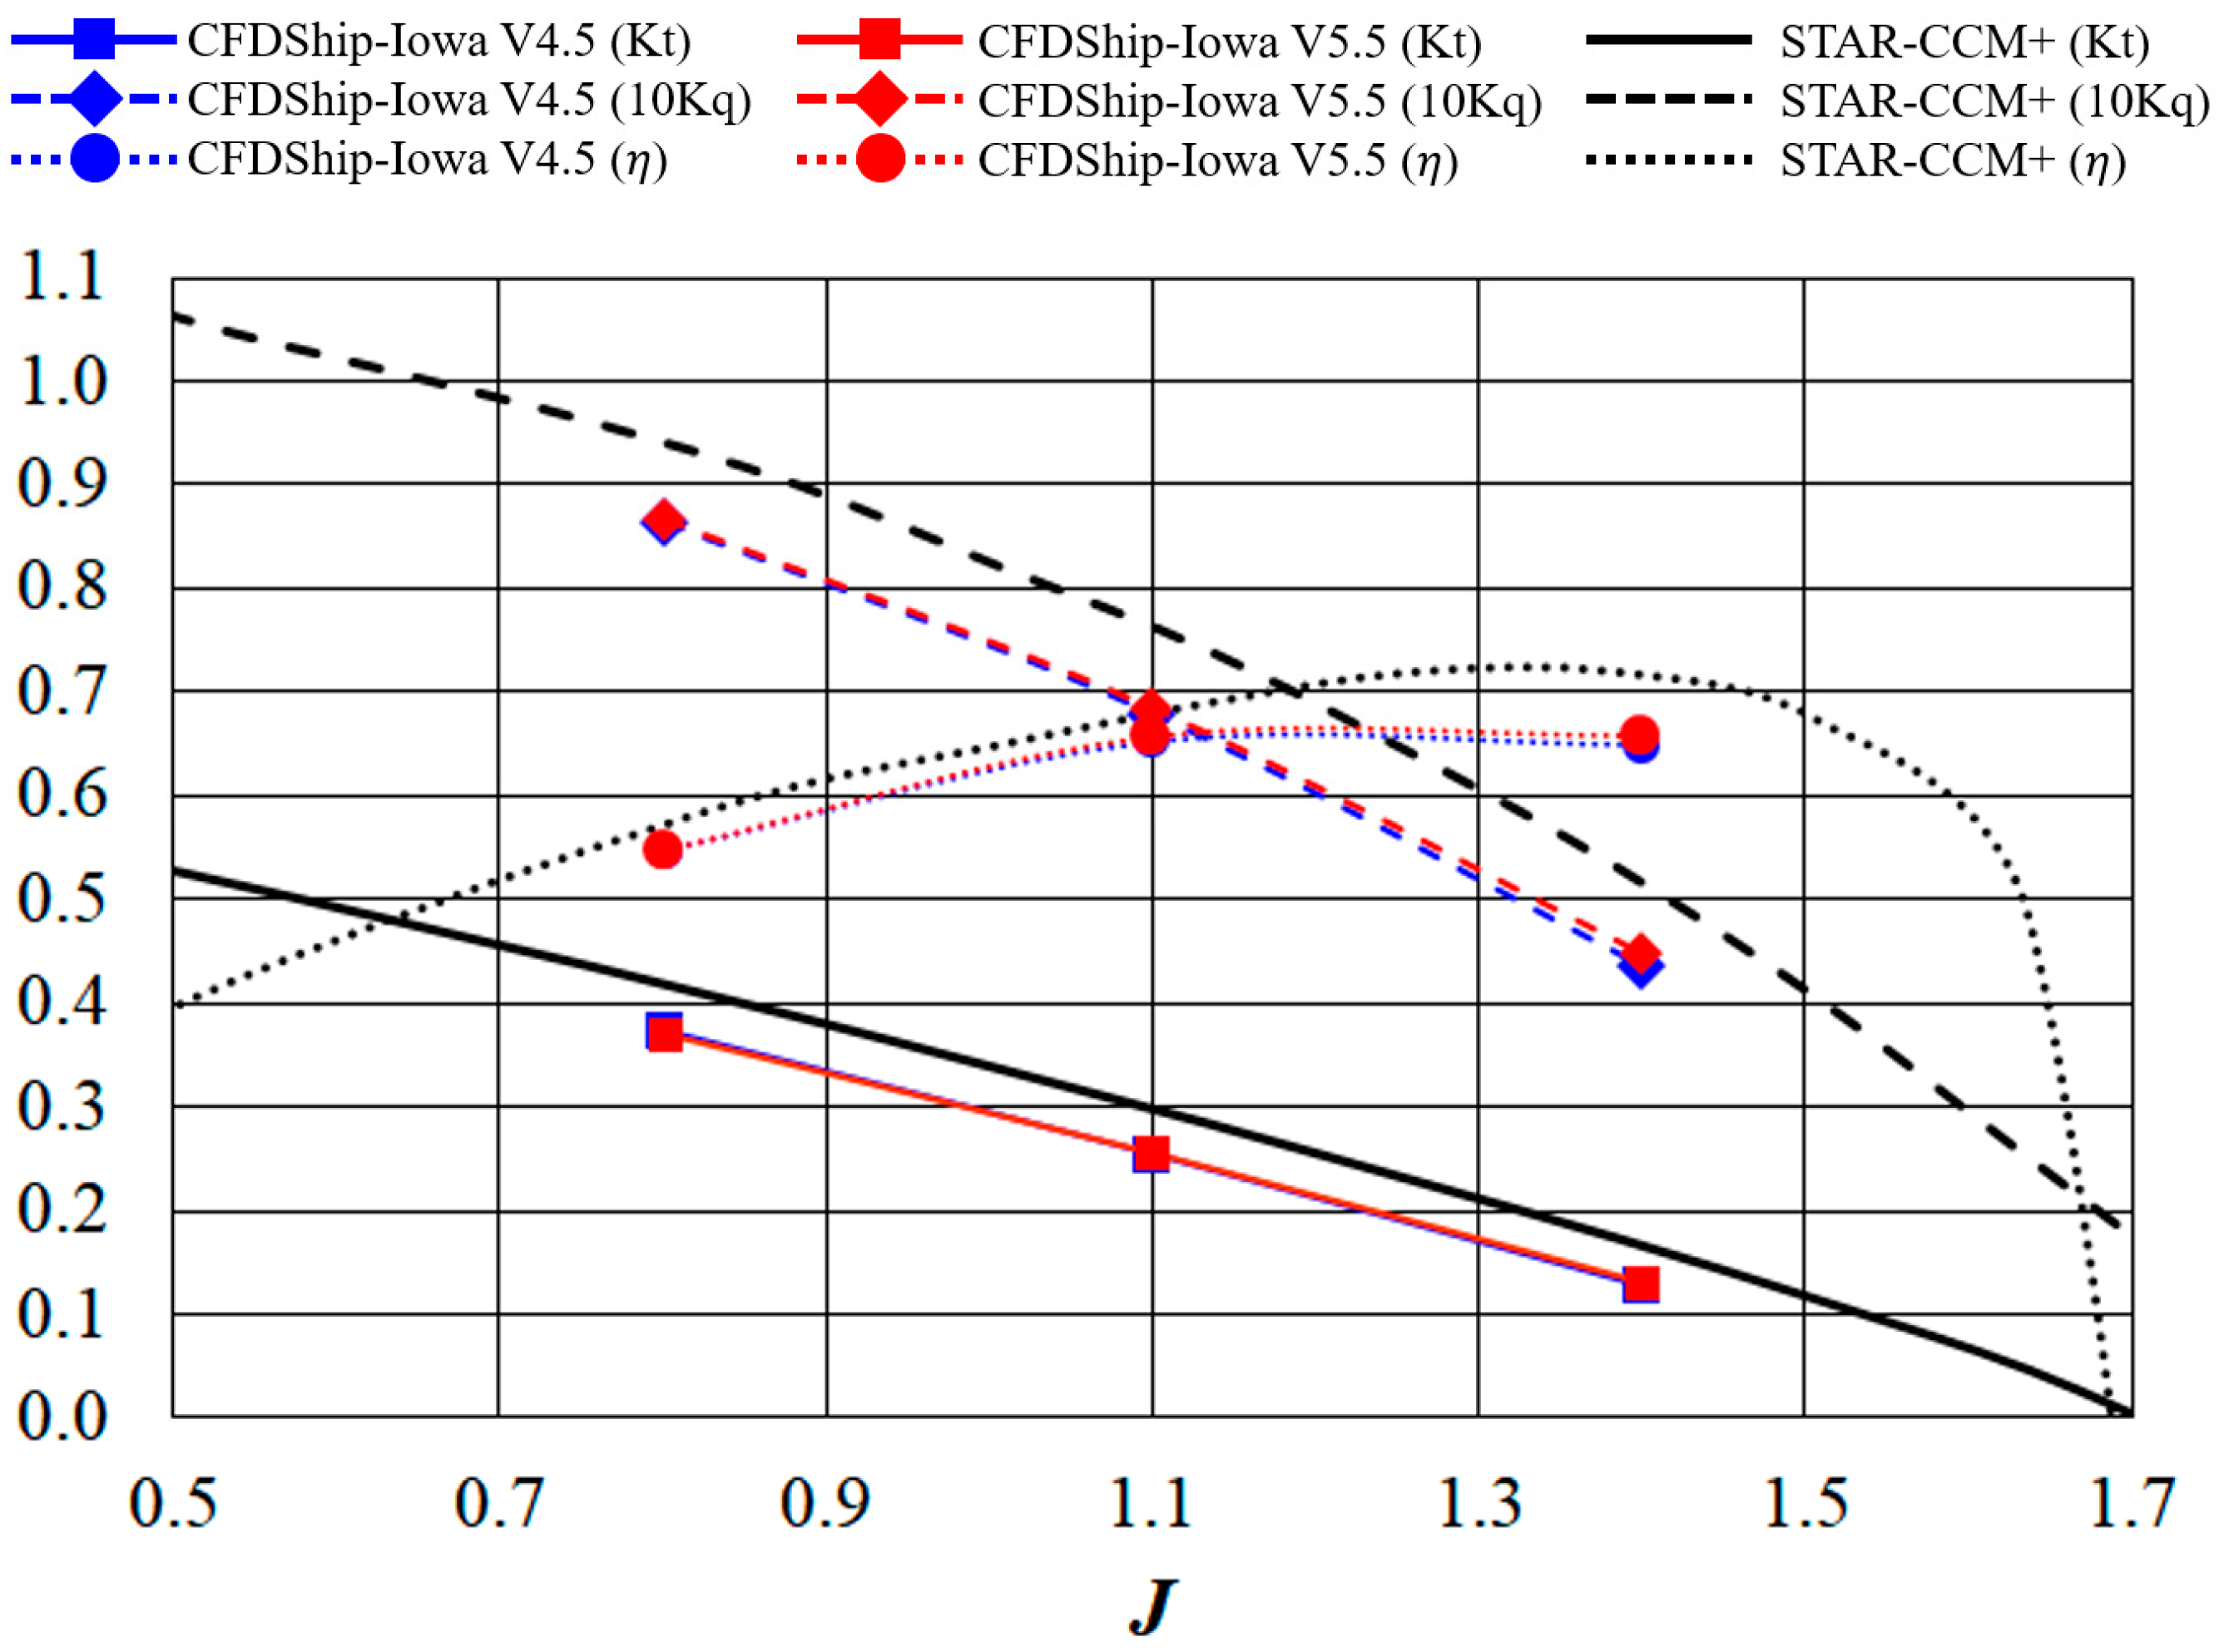
The computed results of the thrust, torque, and propeller efficiency using both CFDShip-Iowa and STAR-CCM+ are presented in Figure 6, Figure 7 and Figure 8 and included in Table 2, Table 3 and Table 4.
Figure 6 presents the thrust and torque coefficients along with the propeller efficiency for the non-cavitating conditions. For the CFDShip-Iowa simulations, both the single-phase flow solver V4.5 and multi-phase flow solver V5.5 are used. As shown in the figure, the simulation results of both V4.5 and V5.5 are almost identical. For the STAR-CCM+ simulations, 14 advance ratios ranging from J = 0.126 to J = 1.763 are used. Generally, the results computed using STAR-CCM+ and CFDShip-Iowa show similar trends and are in good agreement. For the J values from 0.8 to 1.4, the thrust and torque coefficients decrease, and the propeller efficiency increases with the advance ratios. The thrust and torque values obtained using STAR-CCM+ are slightly higher than those obtained using CFDShip-Iowa. The propeller efficiency of STAR-CCM+ is also higher compared to CFDShip-Iowa, especially at the large advance ratio J = 1.4. As mentioned in the previous section, only the blades are considered for the calculation of the thrust and torque coefficients for CFDShip-Iowa.
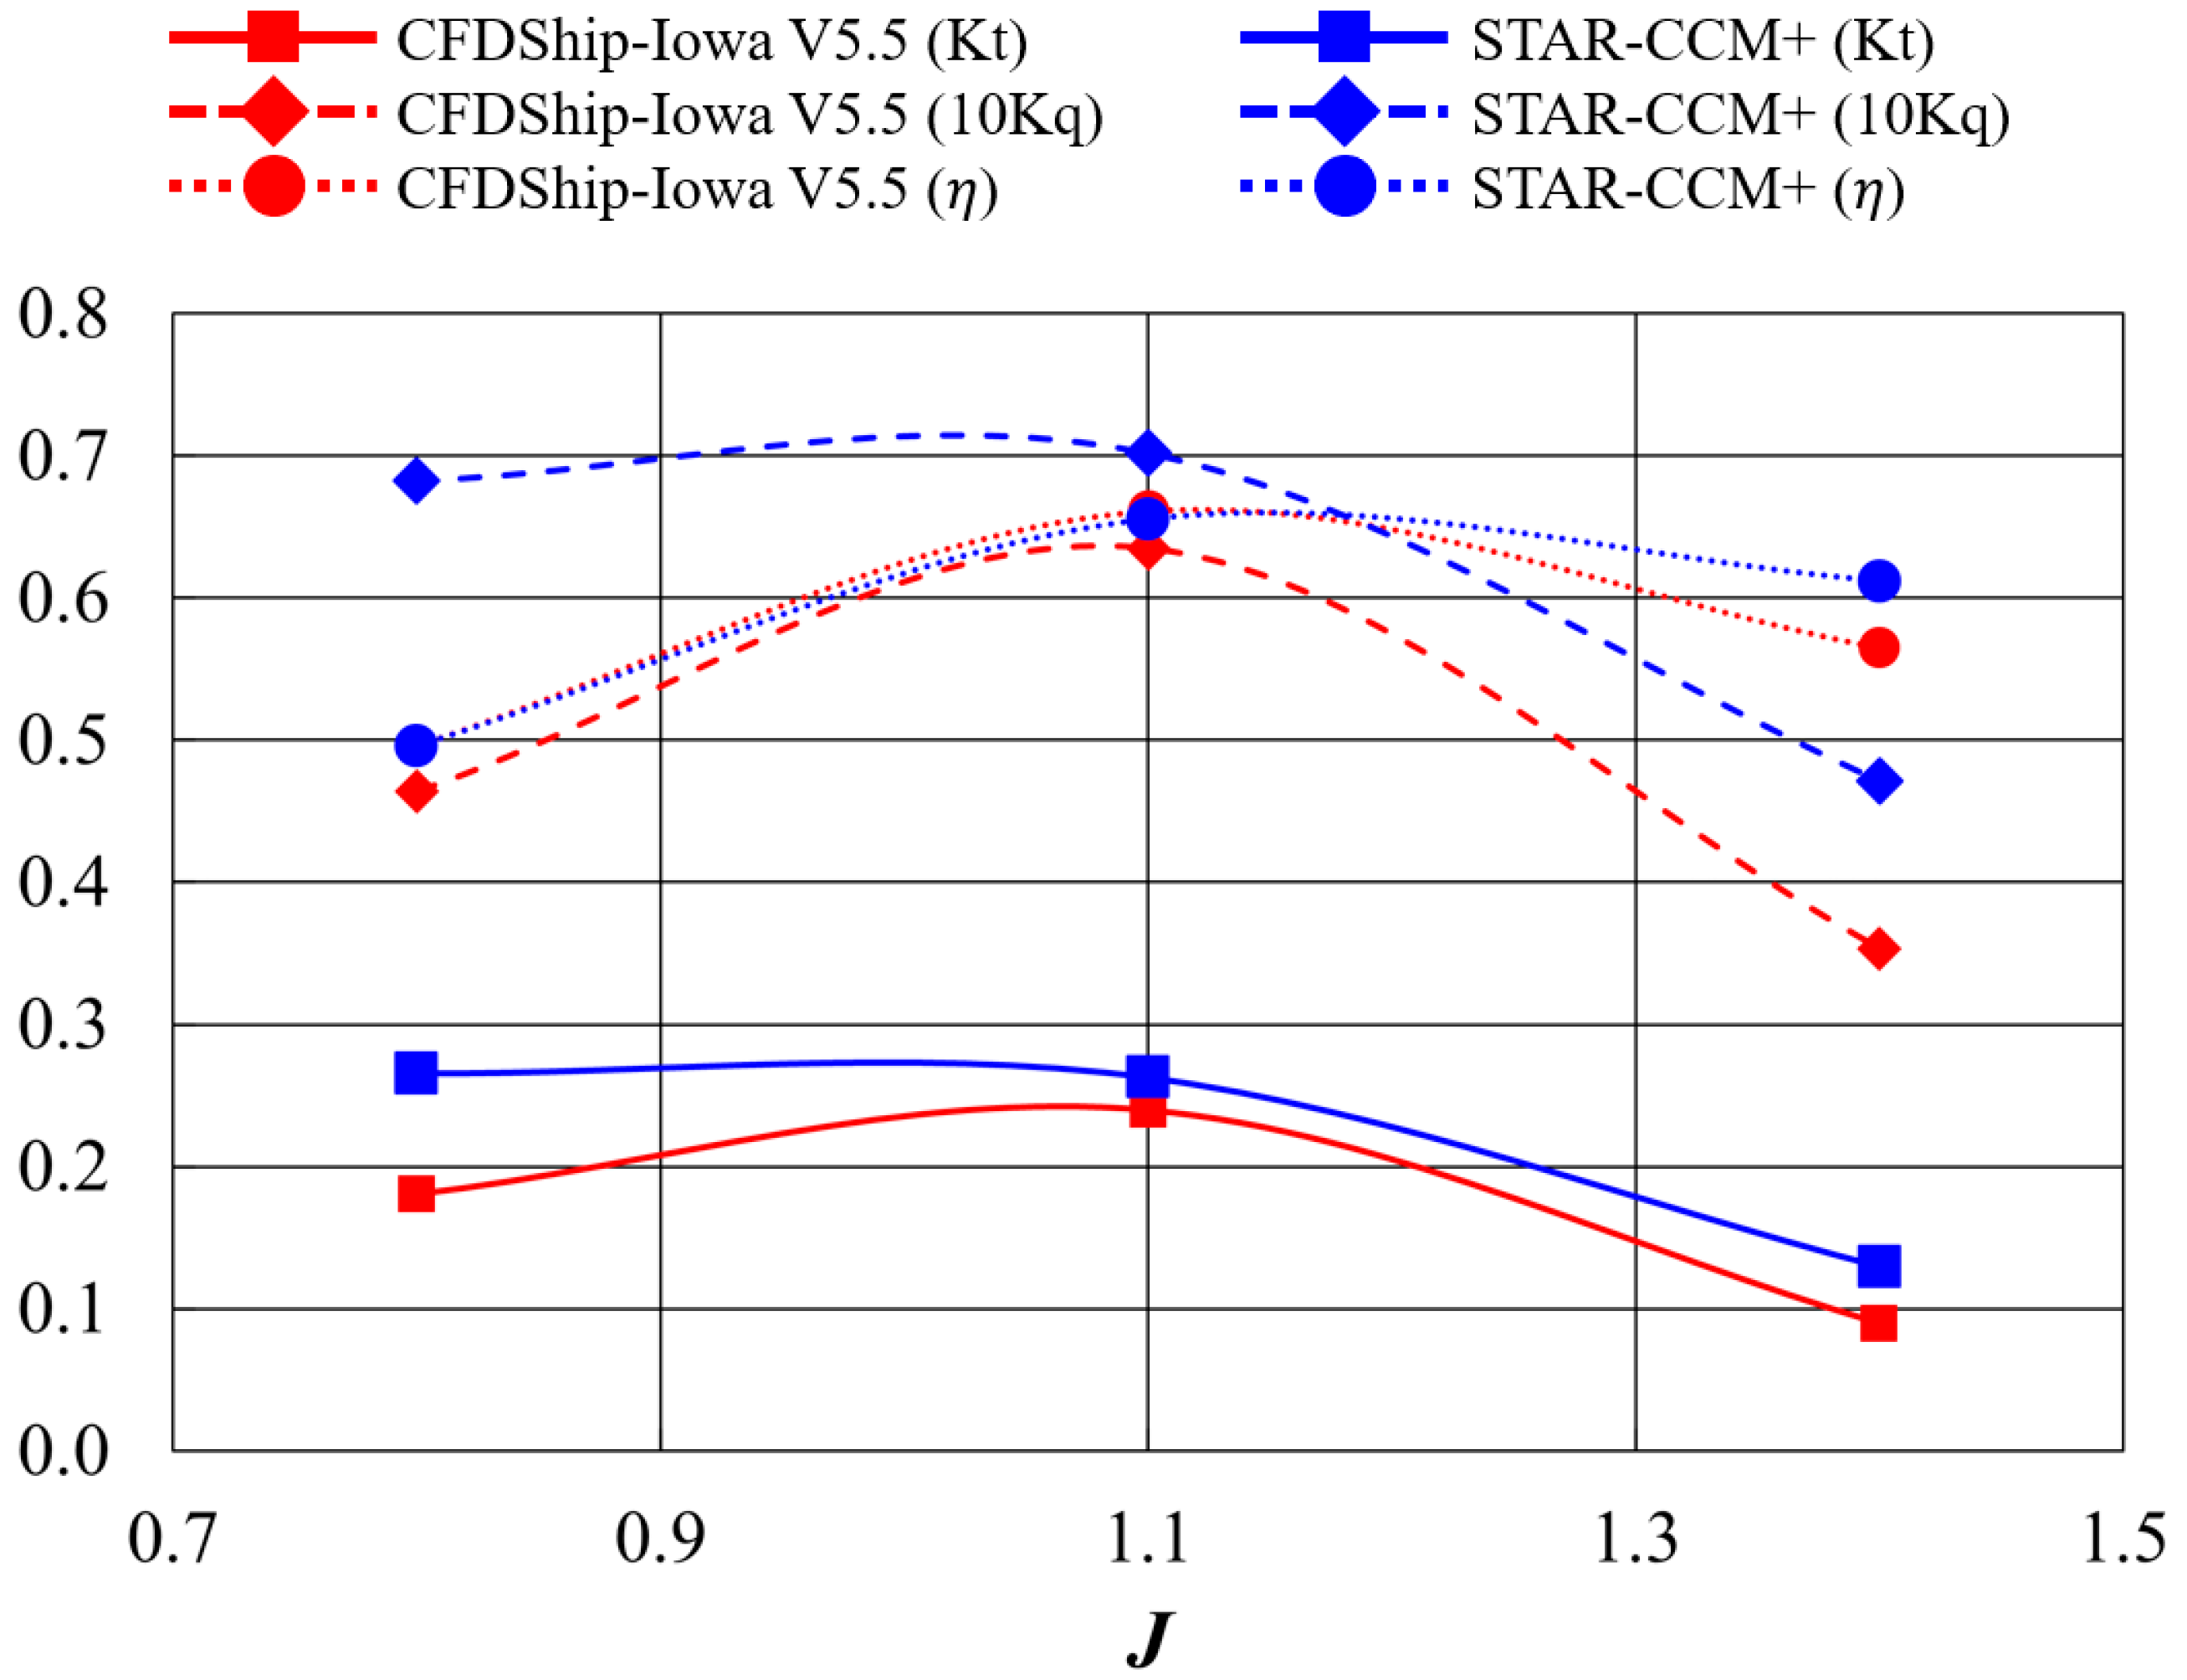
Figure 7 shows the simulation results for the high cavitation number σ = 1.095 obtained from both CFDShip-Iowa V5.5 and STAR-CCM+. As shown in the figure, the results of both codes show similar trends, although noticeable differences can also be observed. Both the thrust and torque coefficients computed using CFDShip-Iowa V5.5 are lower compared to STAR-CCM+, which is consistent with the non-cavitating cases. The propeller open-water efficiencies computed using both solvers are close.
In general, the thrust and torque coefficients and the propeller efficiency increase and then decrease with the advance ratio. This trend differs from the fully wetted case without cavitation effects, where the thrust and torque coefficients decrease, and the propeller efficiency increases with advance ratios in the range of J = 0.8 to 1.4. At the low advance ratio J = 0.8, the blade section experiences a high angle of attack, resulting in a significant pressure drop on the suction side of the blade. This leads to the development of a large cavitation region, which consequently reduces both the thrust and torque. As the advance ratio increases, both the angle of attack and the pressure drop decrease, which results in a reduction in cavitation size and intensity. Consequently, the influence of cavitation on thrust and torque diminishes, and both the thrust and torque decrease from J = 1.1 to 1.4, similar to the non-cavitating cases. Compared to the non-cavitating conditions, both thrust and torque coefficients significantly decrease, especially at J = 0.8. As shown in Table 2, Table 3 and Table 4, the averaged reductions in thrust, torque, and propeller efficiency are 30.2%, 25.0%, and 7.6%, respectively, for the CFDShip-Iowa simulations. For STAR-CCM+, the corresponding averaged reductions are 23.4%, 14.5%, and 10.4%, respectively. Note that the reduction and change in the three variables at J = 1.1 are much smaller compared to the other two J values. This is because the J = 1.1 is close to the design value.
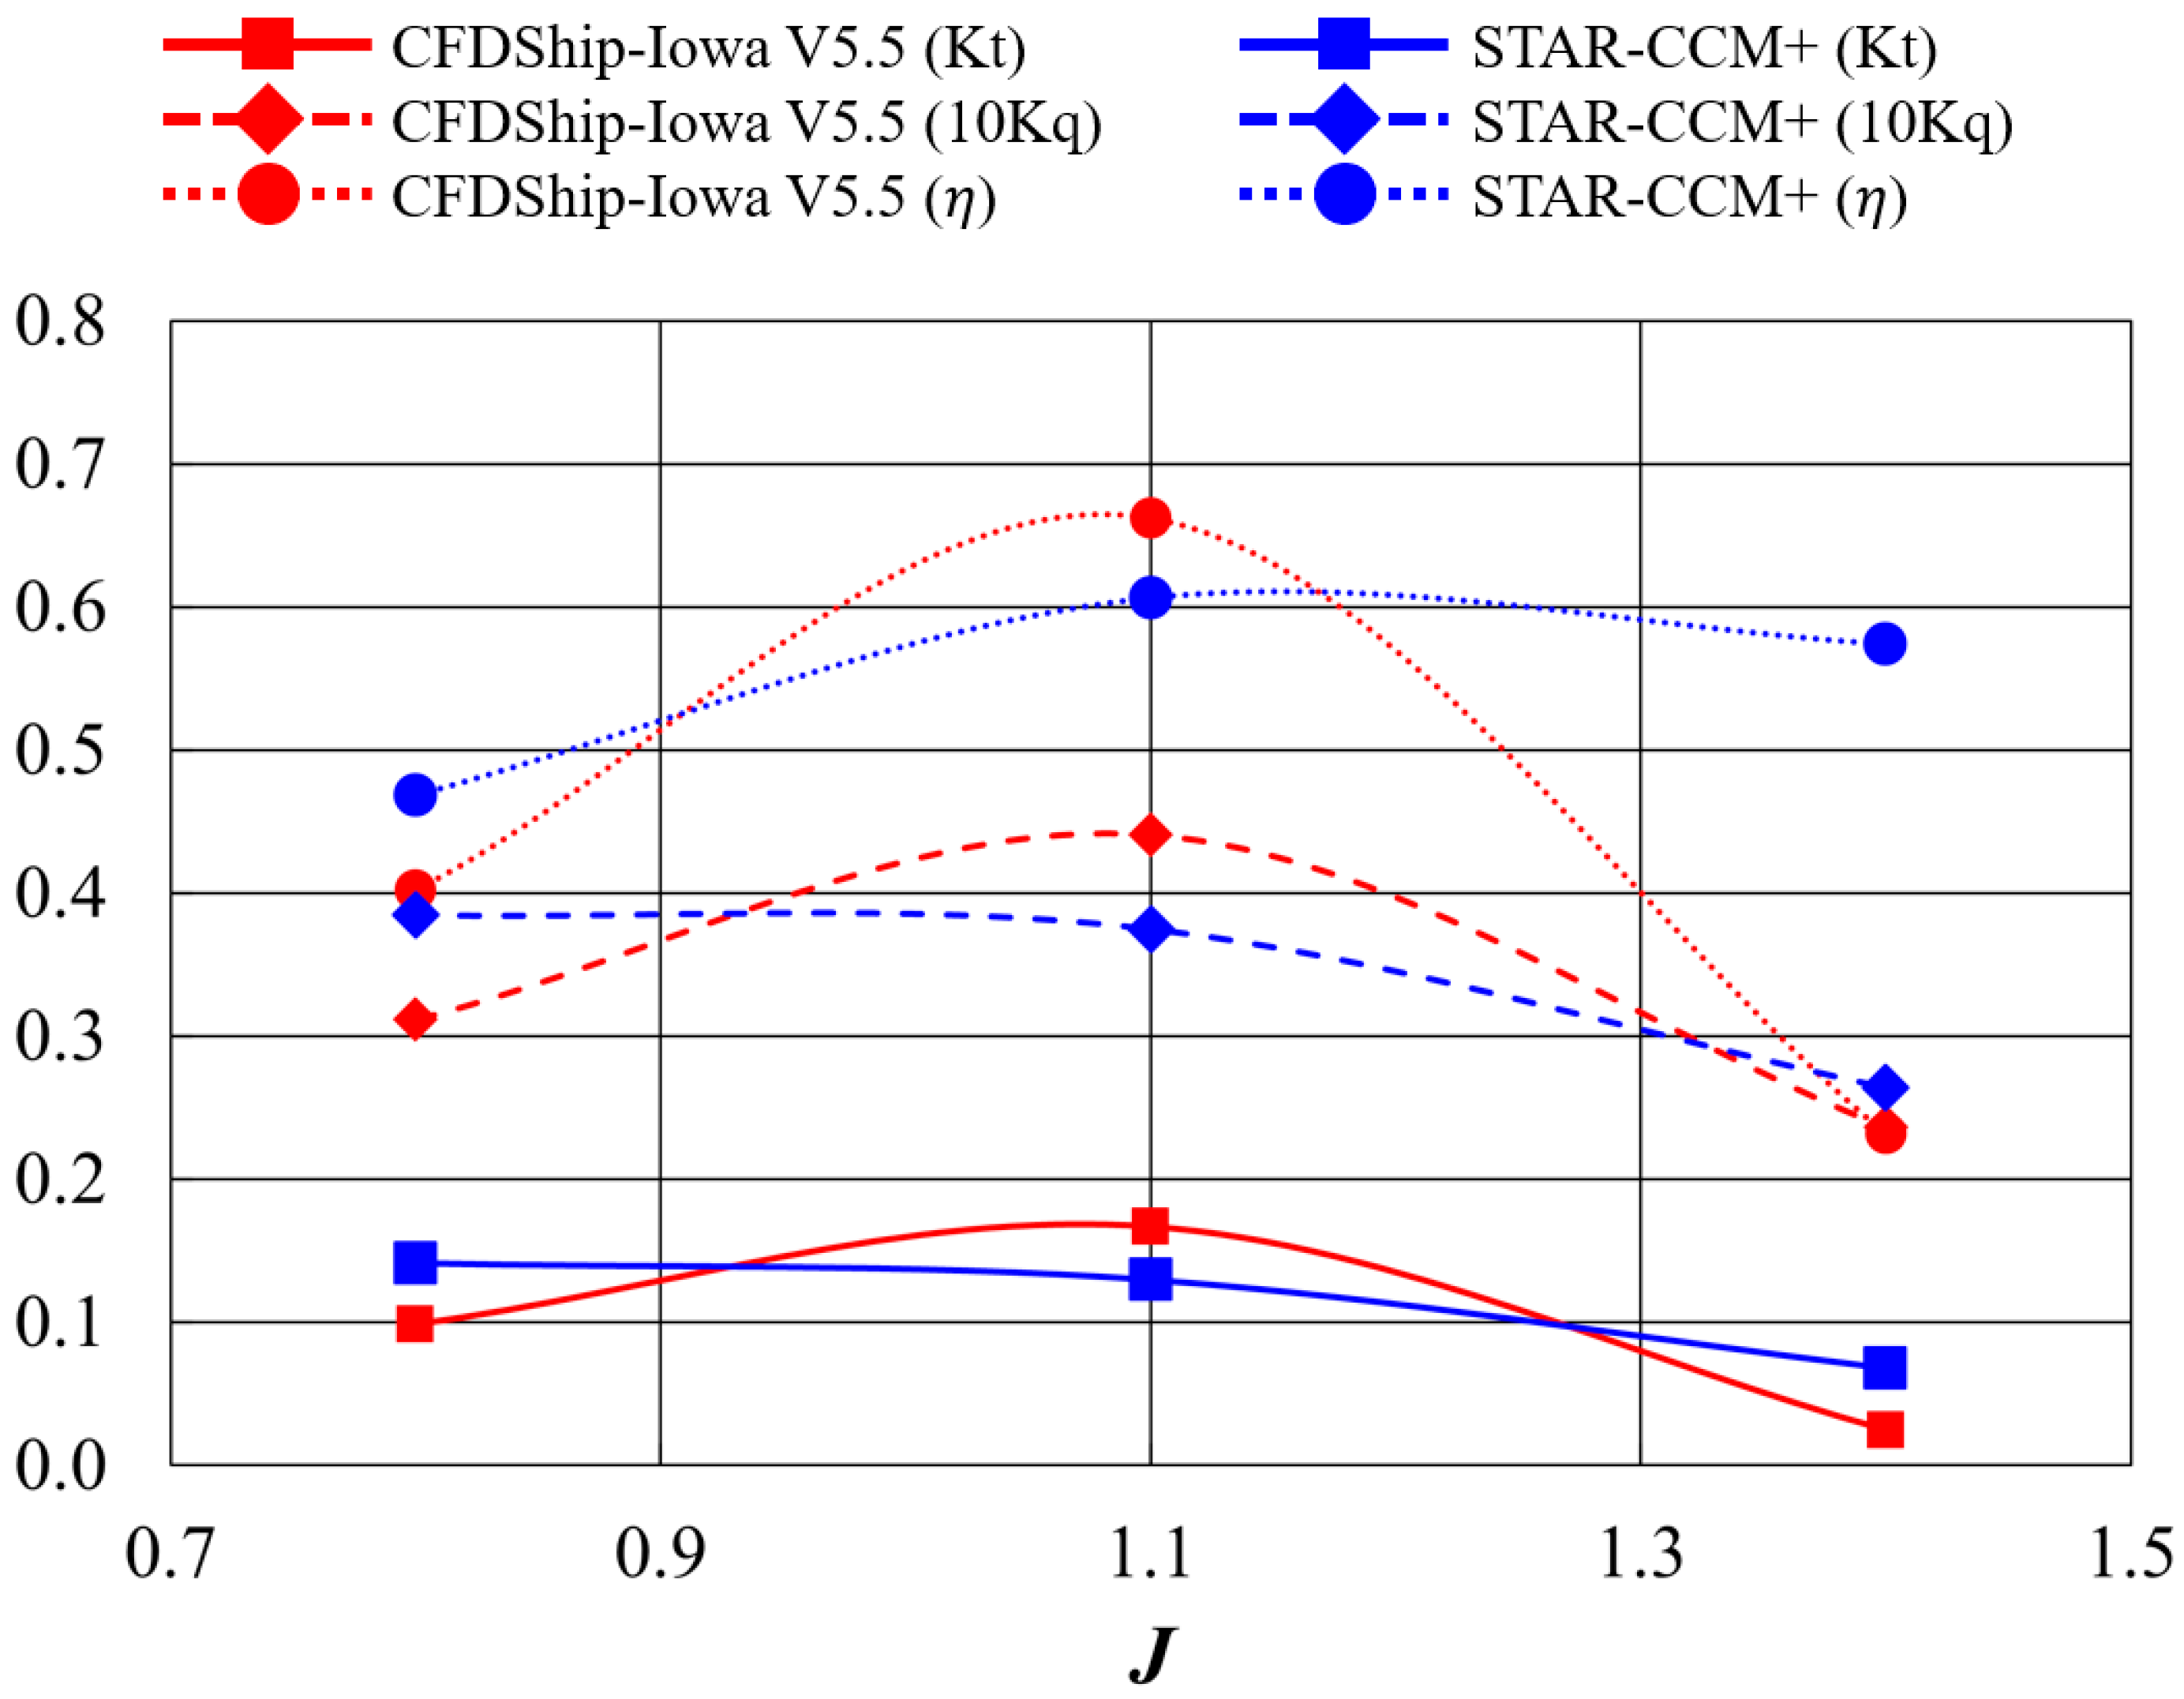
Figure 8 presents the results at the low cavitation number of 0.274. The simulation results from CFDShip-Iowa V5.5 generally agree with those from STAR-CCM+, except for the propeller efficiency ( η ), where CFDShip-Iowa V5.5 shows a much lower value at J = 1.4. The predicted trends of the thrust, torque, and propeller efficiency using CFDShip-Iowa V5.5 differ from those obtained by STAR-CCM+. For CFDShip-Iowa V5.5, all the variables increase first and then decrease with the advance ratios, which is similar to the results of the large cavitation number of σ = 1.095. As for STAR-CCM+, the thrust and torque coefficients decrease, and the propeller efficiency generally increases with advance ratios, which is similar to the non-cavitating cases. These differences are probably due to the blade-to-blade interactions, which are not captured in STAR-CCM+.
For the CFDShip-Iowa simulations (see Table 2, Table 3 and Table 4), the thrust, torque, and propeller efficiency are reduced on average by 63.4%, 49.0%, and 30.1%, respectively. For STAR-CCM+, the averaged reductions are 60.5%,52.8%, and 16.1% for the thrust, torque, and efficiency, respectively. The averaged reductions of both codes are close, except for the propeller efficiency, as also shown in Figure 8. Note that the changes in the three variables at J = 1.1, which is close to the design value, are smaller compared to those at J = 0.8 and J = 1.4.

3.2. Cavitation Profiles and Pressure Distributions

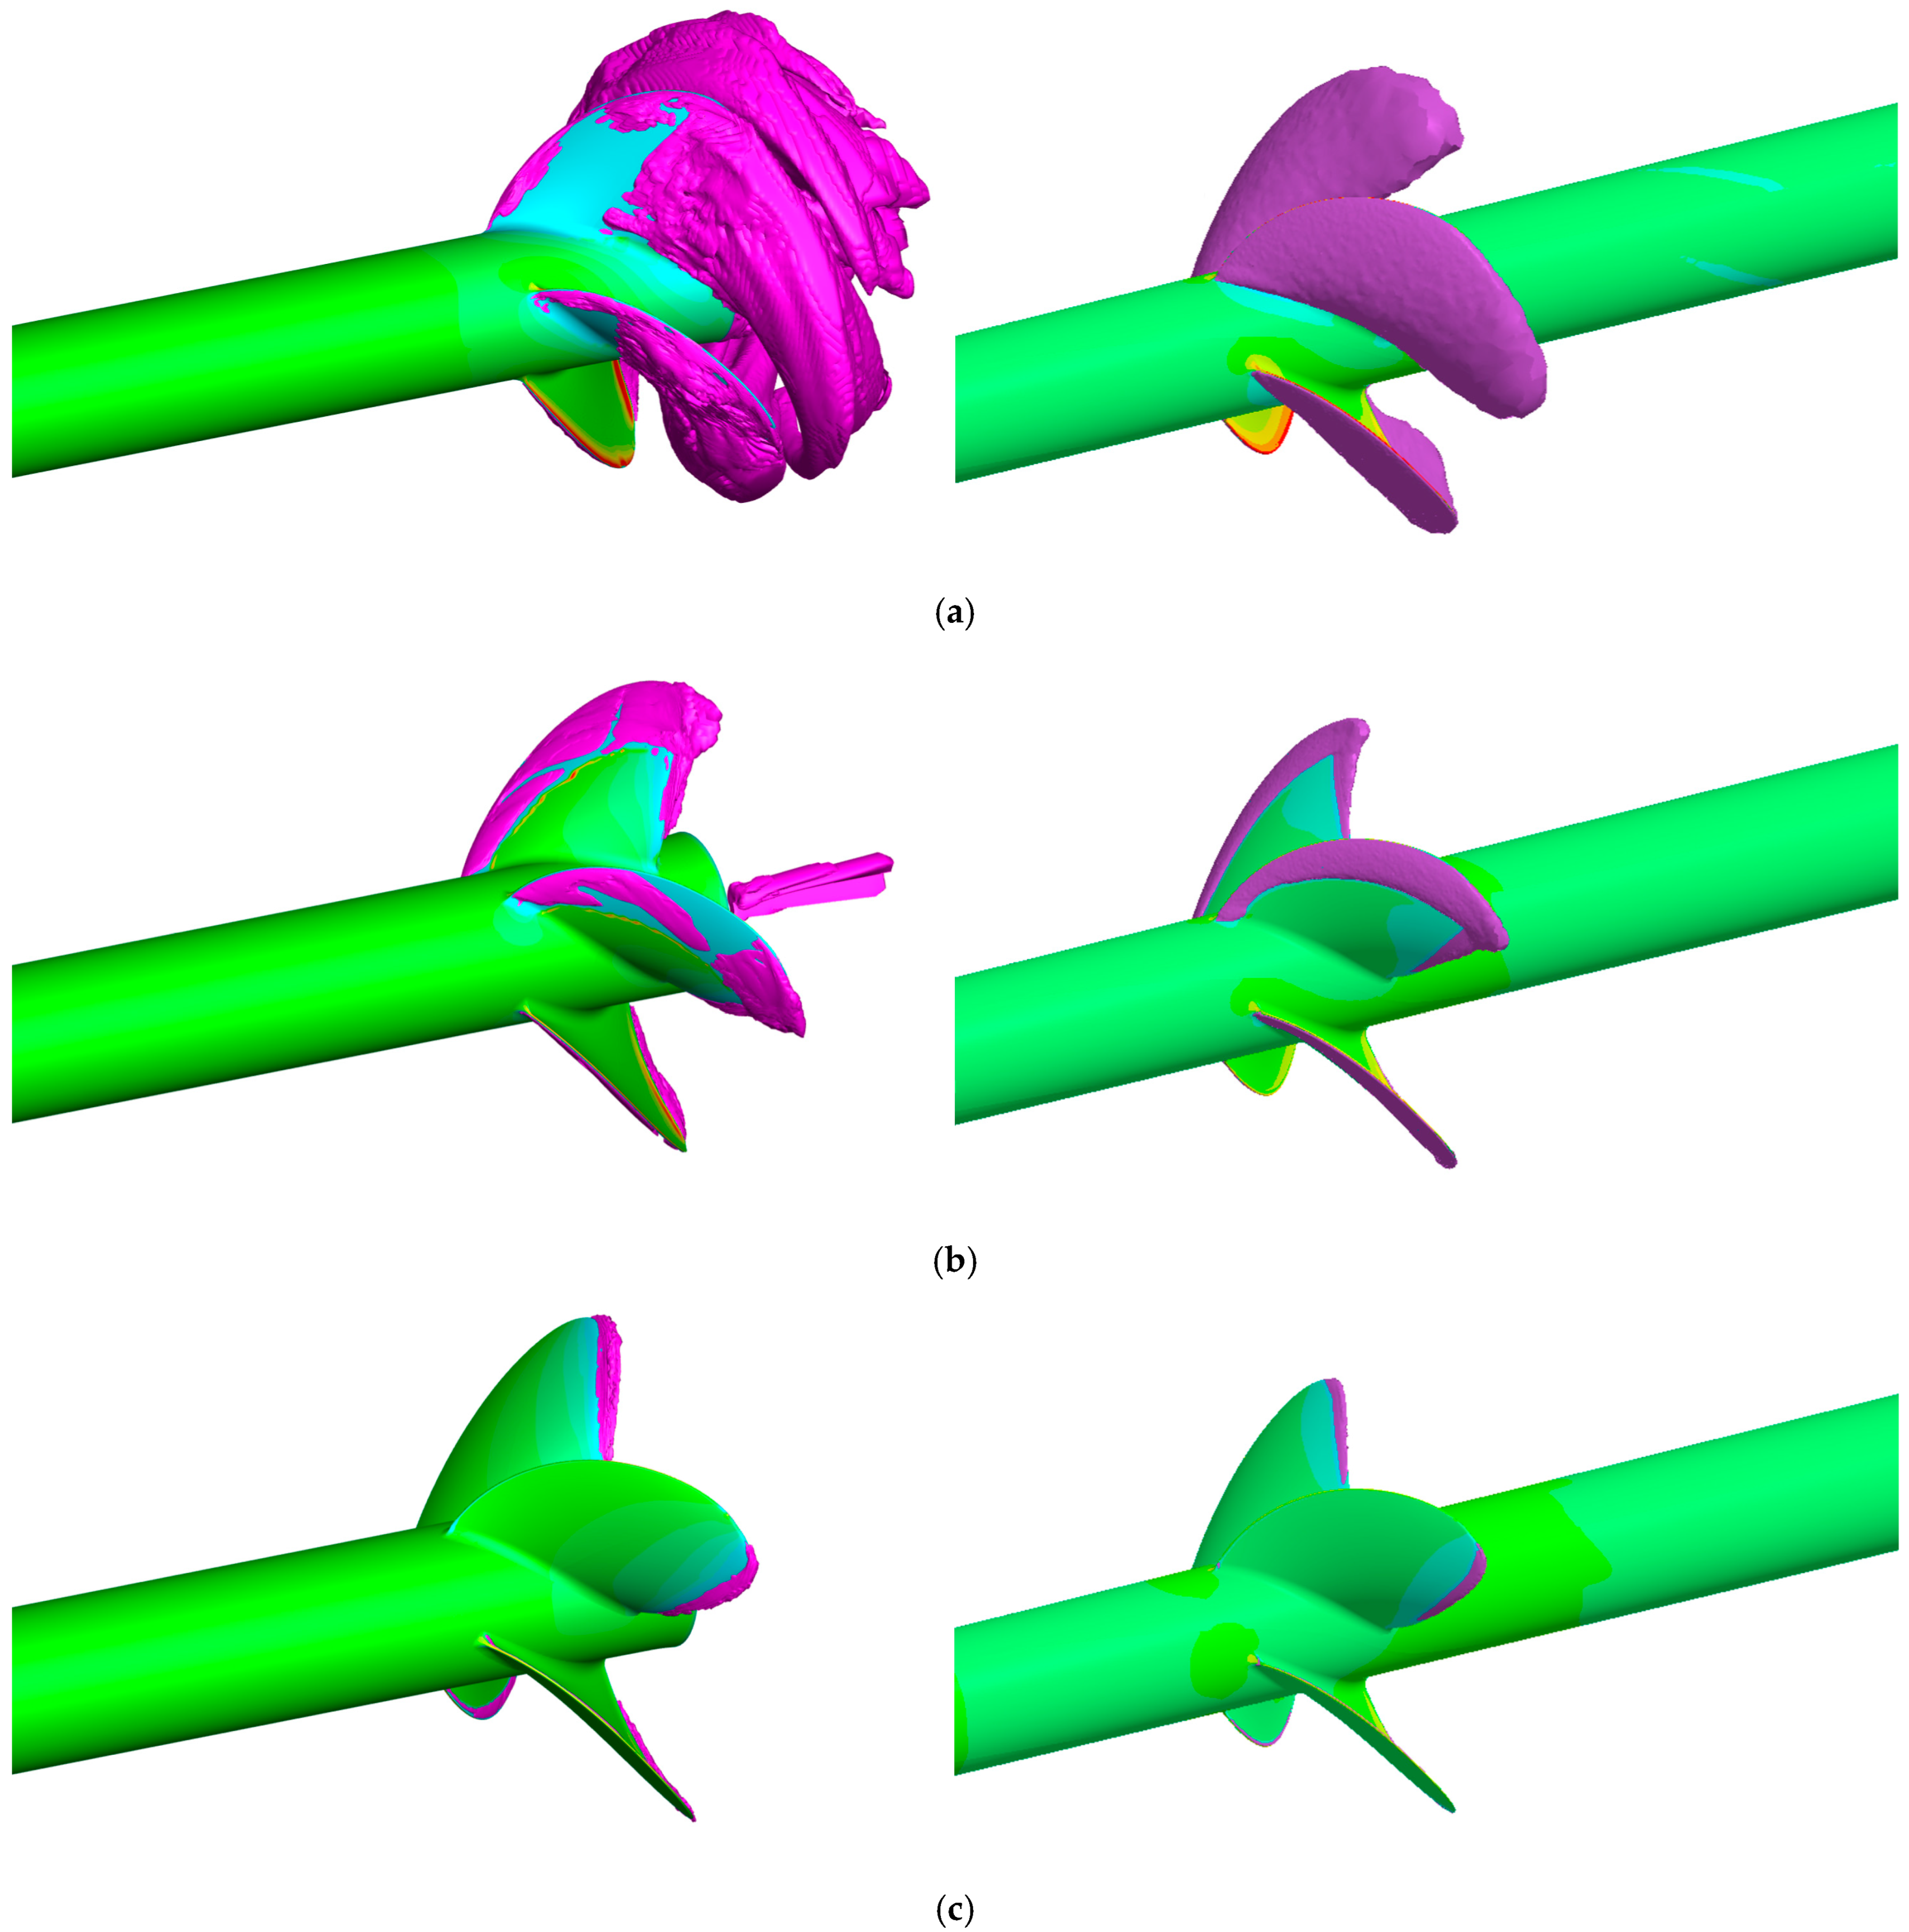
Figure 9 shows the cavitation vapor profiles for σ = 1.095 computed using both CFDShip-Iowa V5.5 and STAR-CCM+. As shown in the figures, the overall cavitation patterns are similar for both codes, where the cavitation size decreases with the advance ratios. CFDShip-Iowa V5.5 shows relatively more violent patterns compared to those of STAR-CCM+. At J = 0.8 and 1.1, cavitation shedding towards the pressure side can be observed in the CFDShip-Iowa V5.5 simulations, and the cavitation is mainly on the suction side of the blades in the STAR-CCM+ simulations.
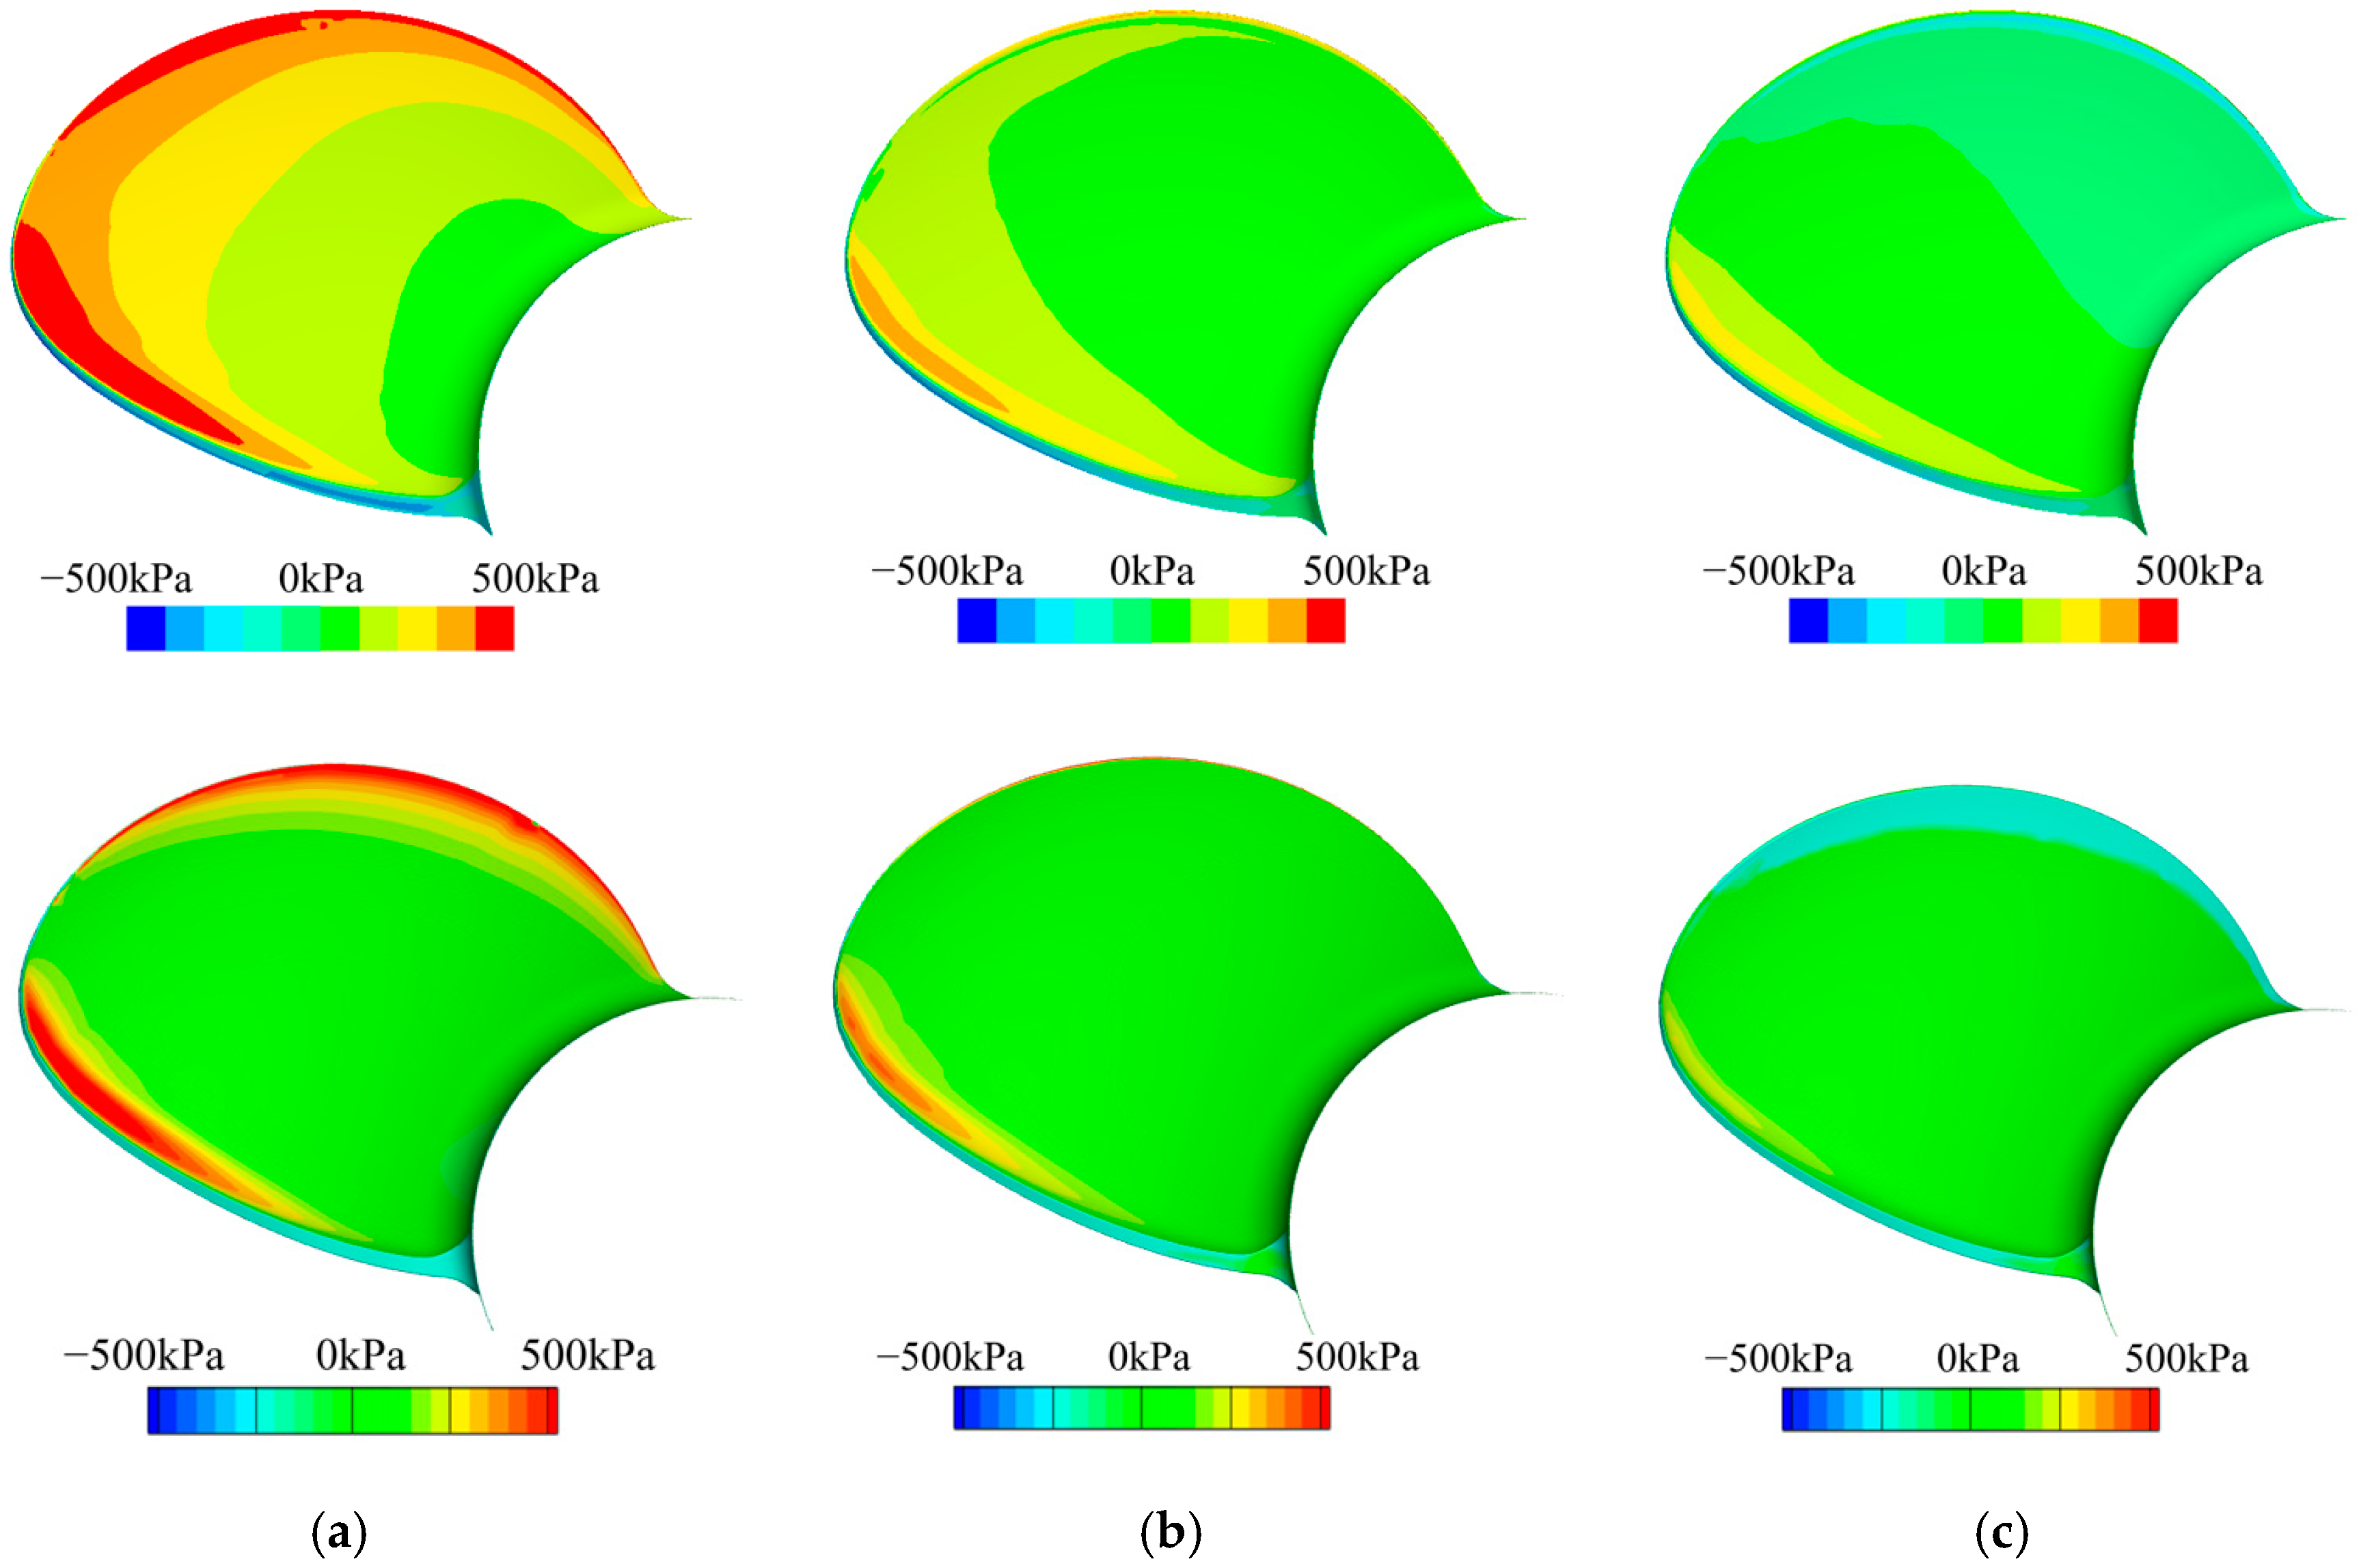
Pressure distributions on the surface of the propeller blade for σ = 1.095 are shown in Figure 10 and Figure 11 for the suction and pressure sides, respectively. Generally, the results of both CFDShip-Iowa V5.5 and STAR-CCM+ show similar trends with advance ratios. The pressure on the suction side of the blade increases with J values, which is consistent with the cavitation size shown in Figure 9. For the pressure side, the pressure decreases with the advance ratios. Moreover, on the pressure side, STAR-CCM+ shows larger regions of high pressure than CFDShip-Iowa V5.5, especially at J = 0.8 and 1.1. This is due to the blade-to-blade cavitation interactions, where the cavity generated on the neighboring blade is extended onto the pressure side of the blade. As mentioned in the previous section, a single propeller blade with periodic boundary conditions is used for the STAR-CCM+ simulations, where the blade-to-blade interactions are not considered.
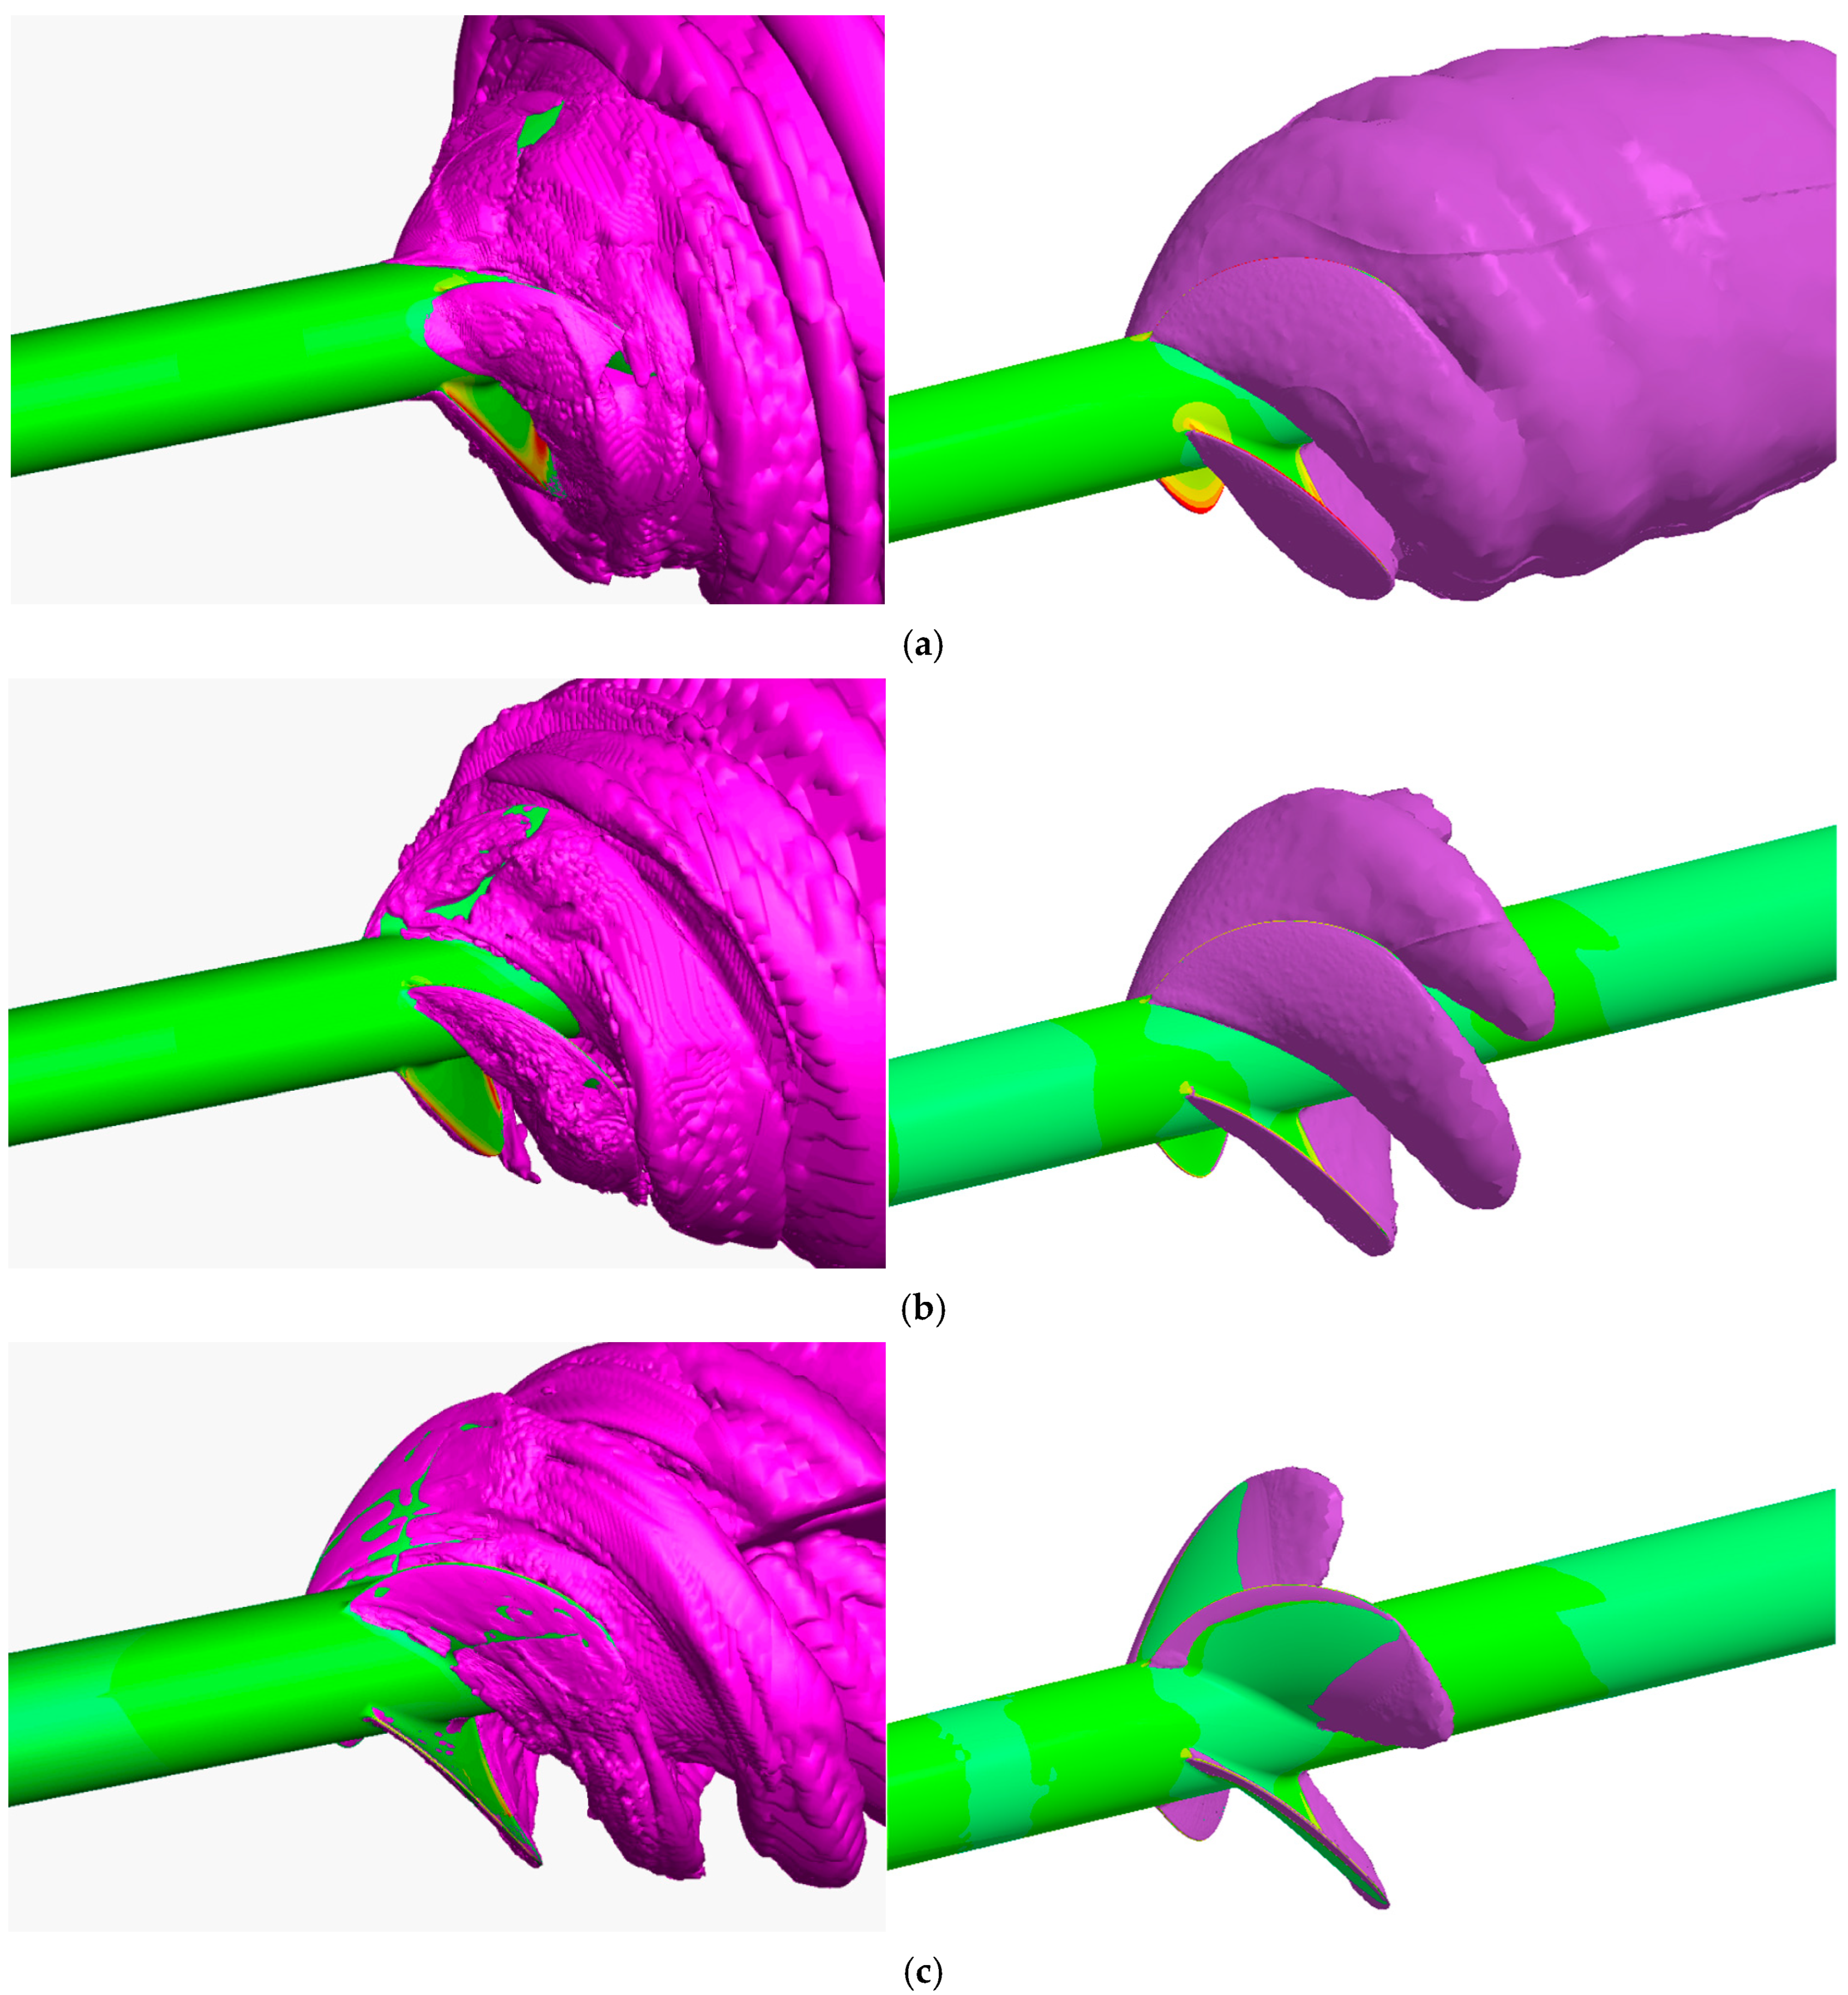
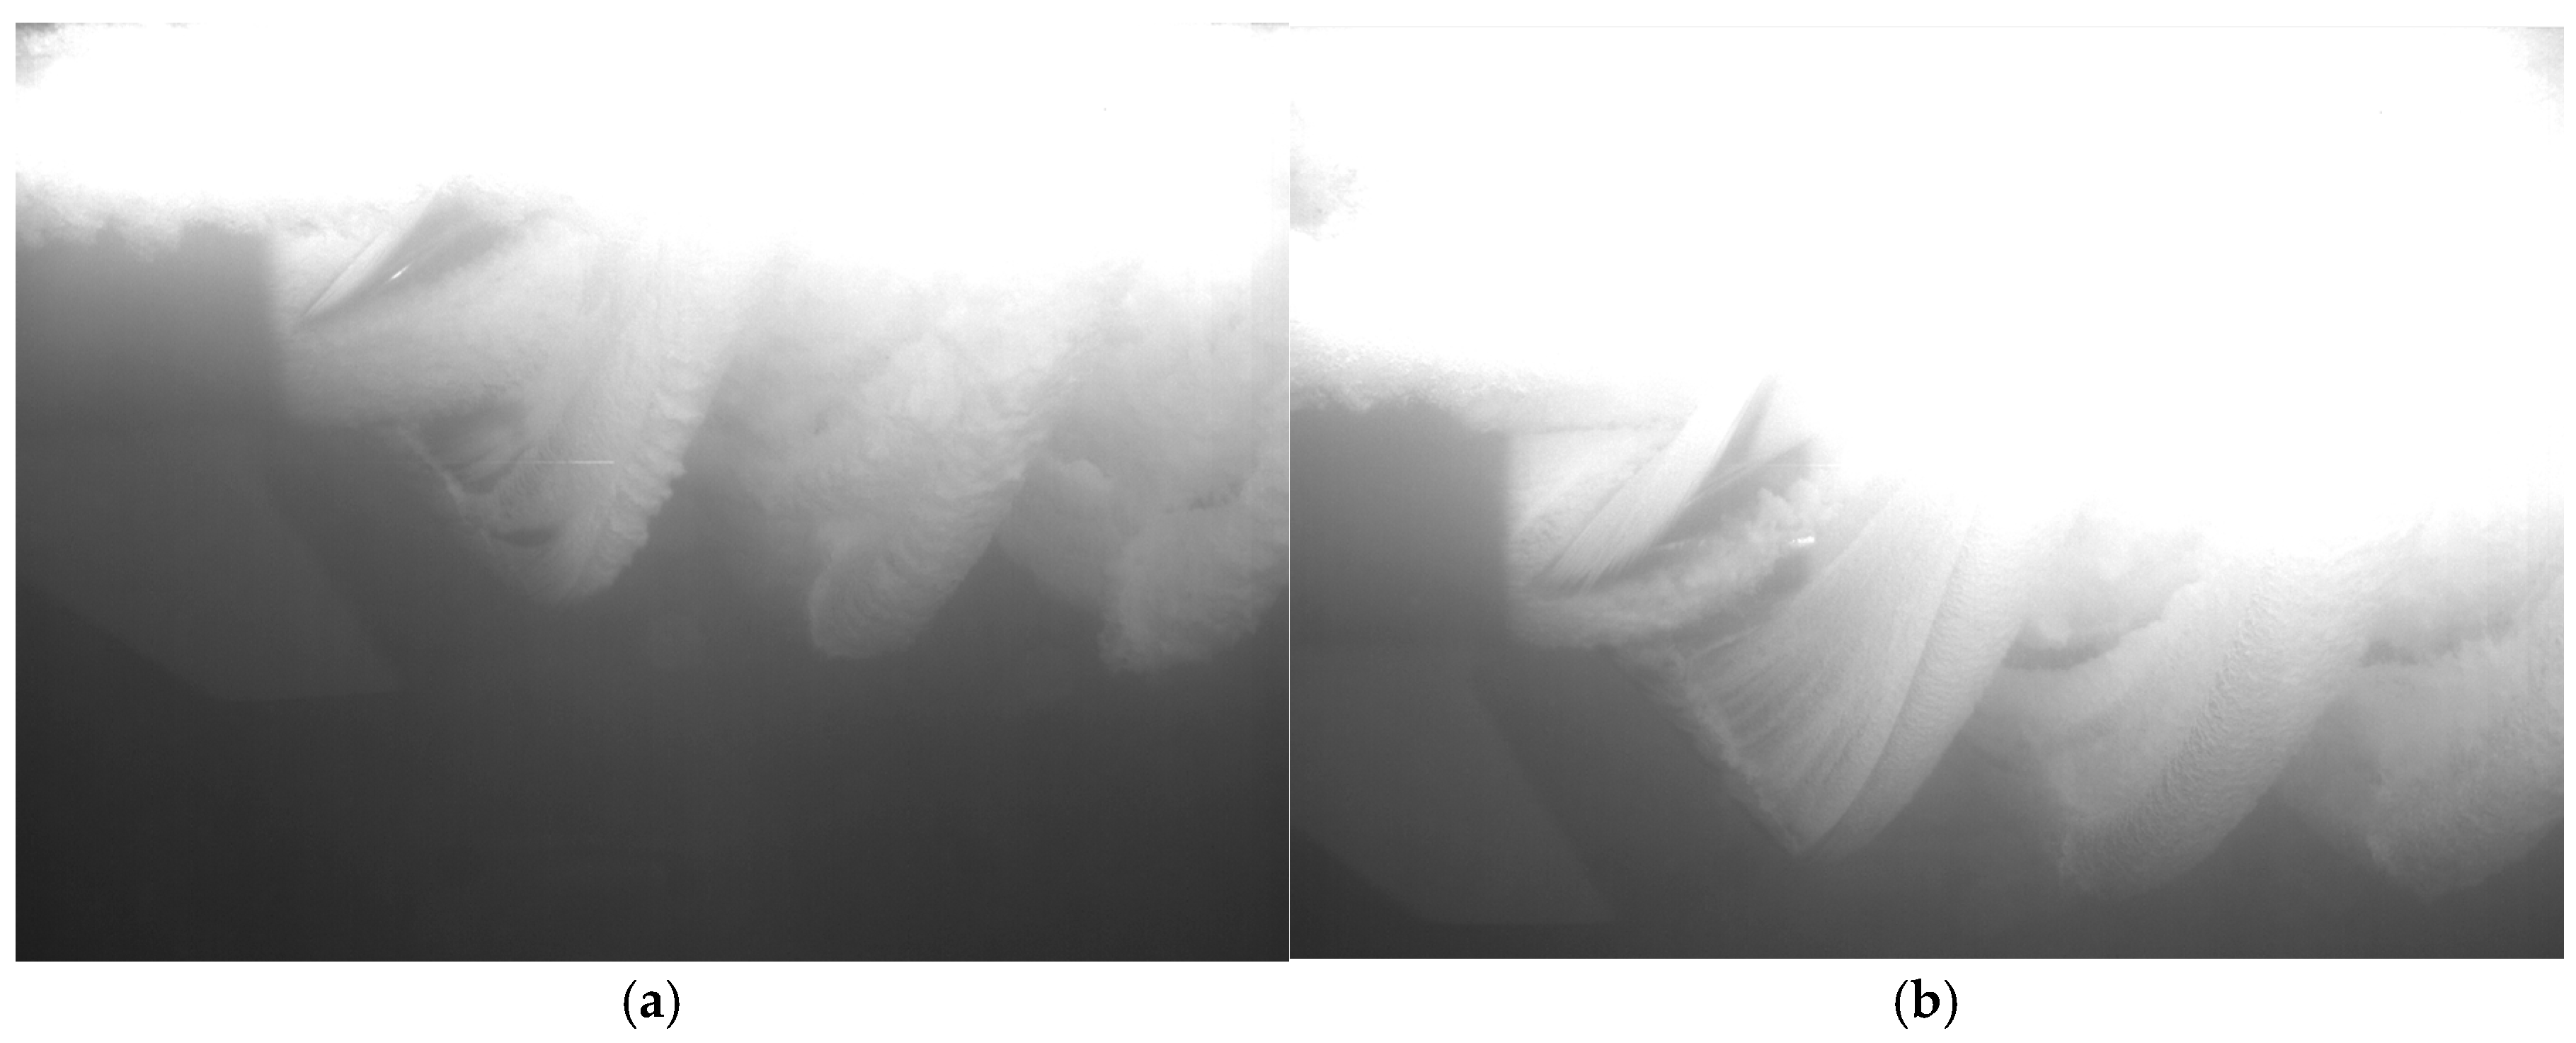
Figure 12 shows the cavitation vapor profiles for σ = 0.274. The cavitation is more violent with a much larger size than that computed at the large cavitation number σ = 1.095. The cavitation size also decreases with advance ratios, which is clearly shown in the simulation results of STAR-CCM+. For CFDShip-Iowa V5.5, the cavitation wraps around the entire propeller and is swept downstream for all the J values, which is observed only at J = 0.8 in the STAR-CCM+ simulations. Figure 13 shows the underwater high-speed video images of a propeller mounted on a production outboard motor, with a design similar to the one used in this study. The tests were conducted at speeds of 60 mph (26.8 m/s) and 70 mph (31.3 m/s), corresponding to cavitation numbers of σ = 0.275 and σ = 0.202, respectively. The propeller is partially submerged, and exhaust gas emanating from the back of the gearcase housing through the gap between housing and propeller is also present. At high speeds, this exhaust forms a sheath along the hub. As a result, the blades experience a mixture of cavitation, air, and exhaust, rather than pure cavitation, as in the simulations. Nevertheless, the images appear to support the presence of relatively large cavitation volumes, similar to those predicted by the CFDShip-Iowa simulations and significantly greater than those from the STAR-CCM+ simulations.
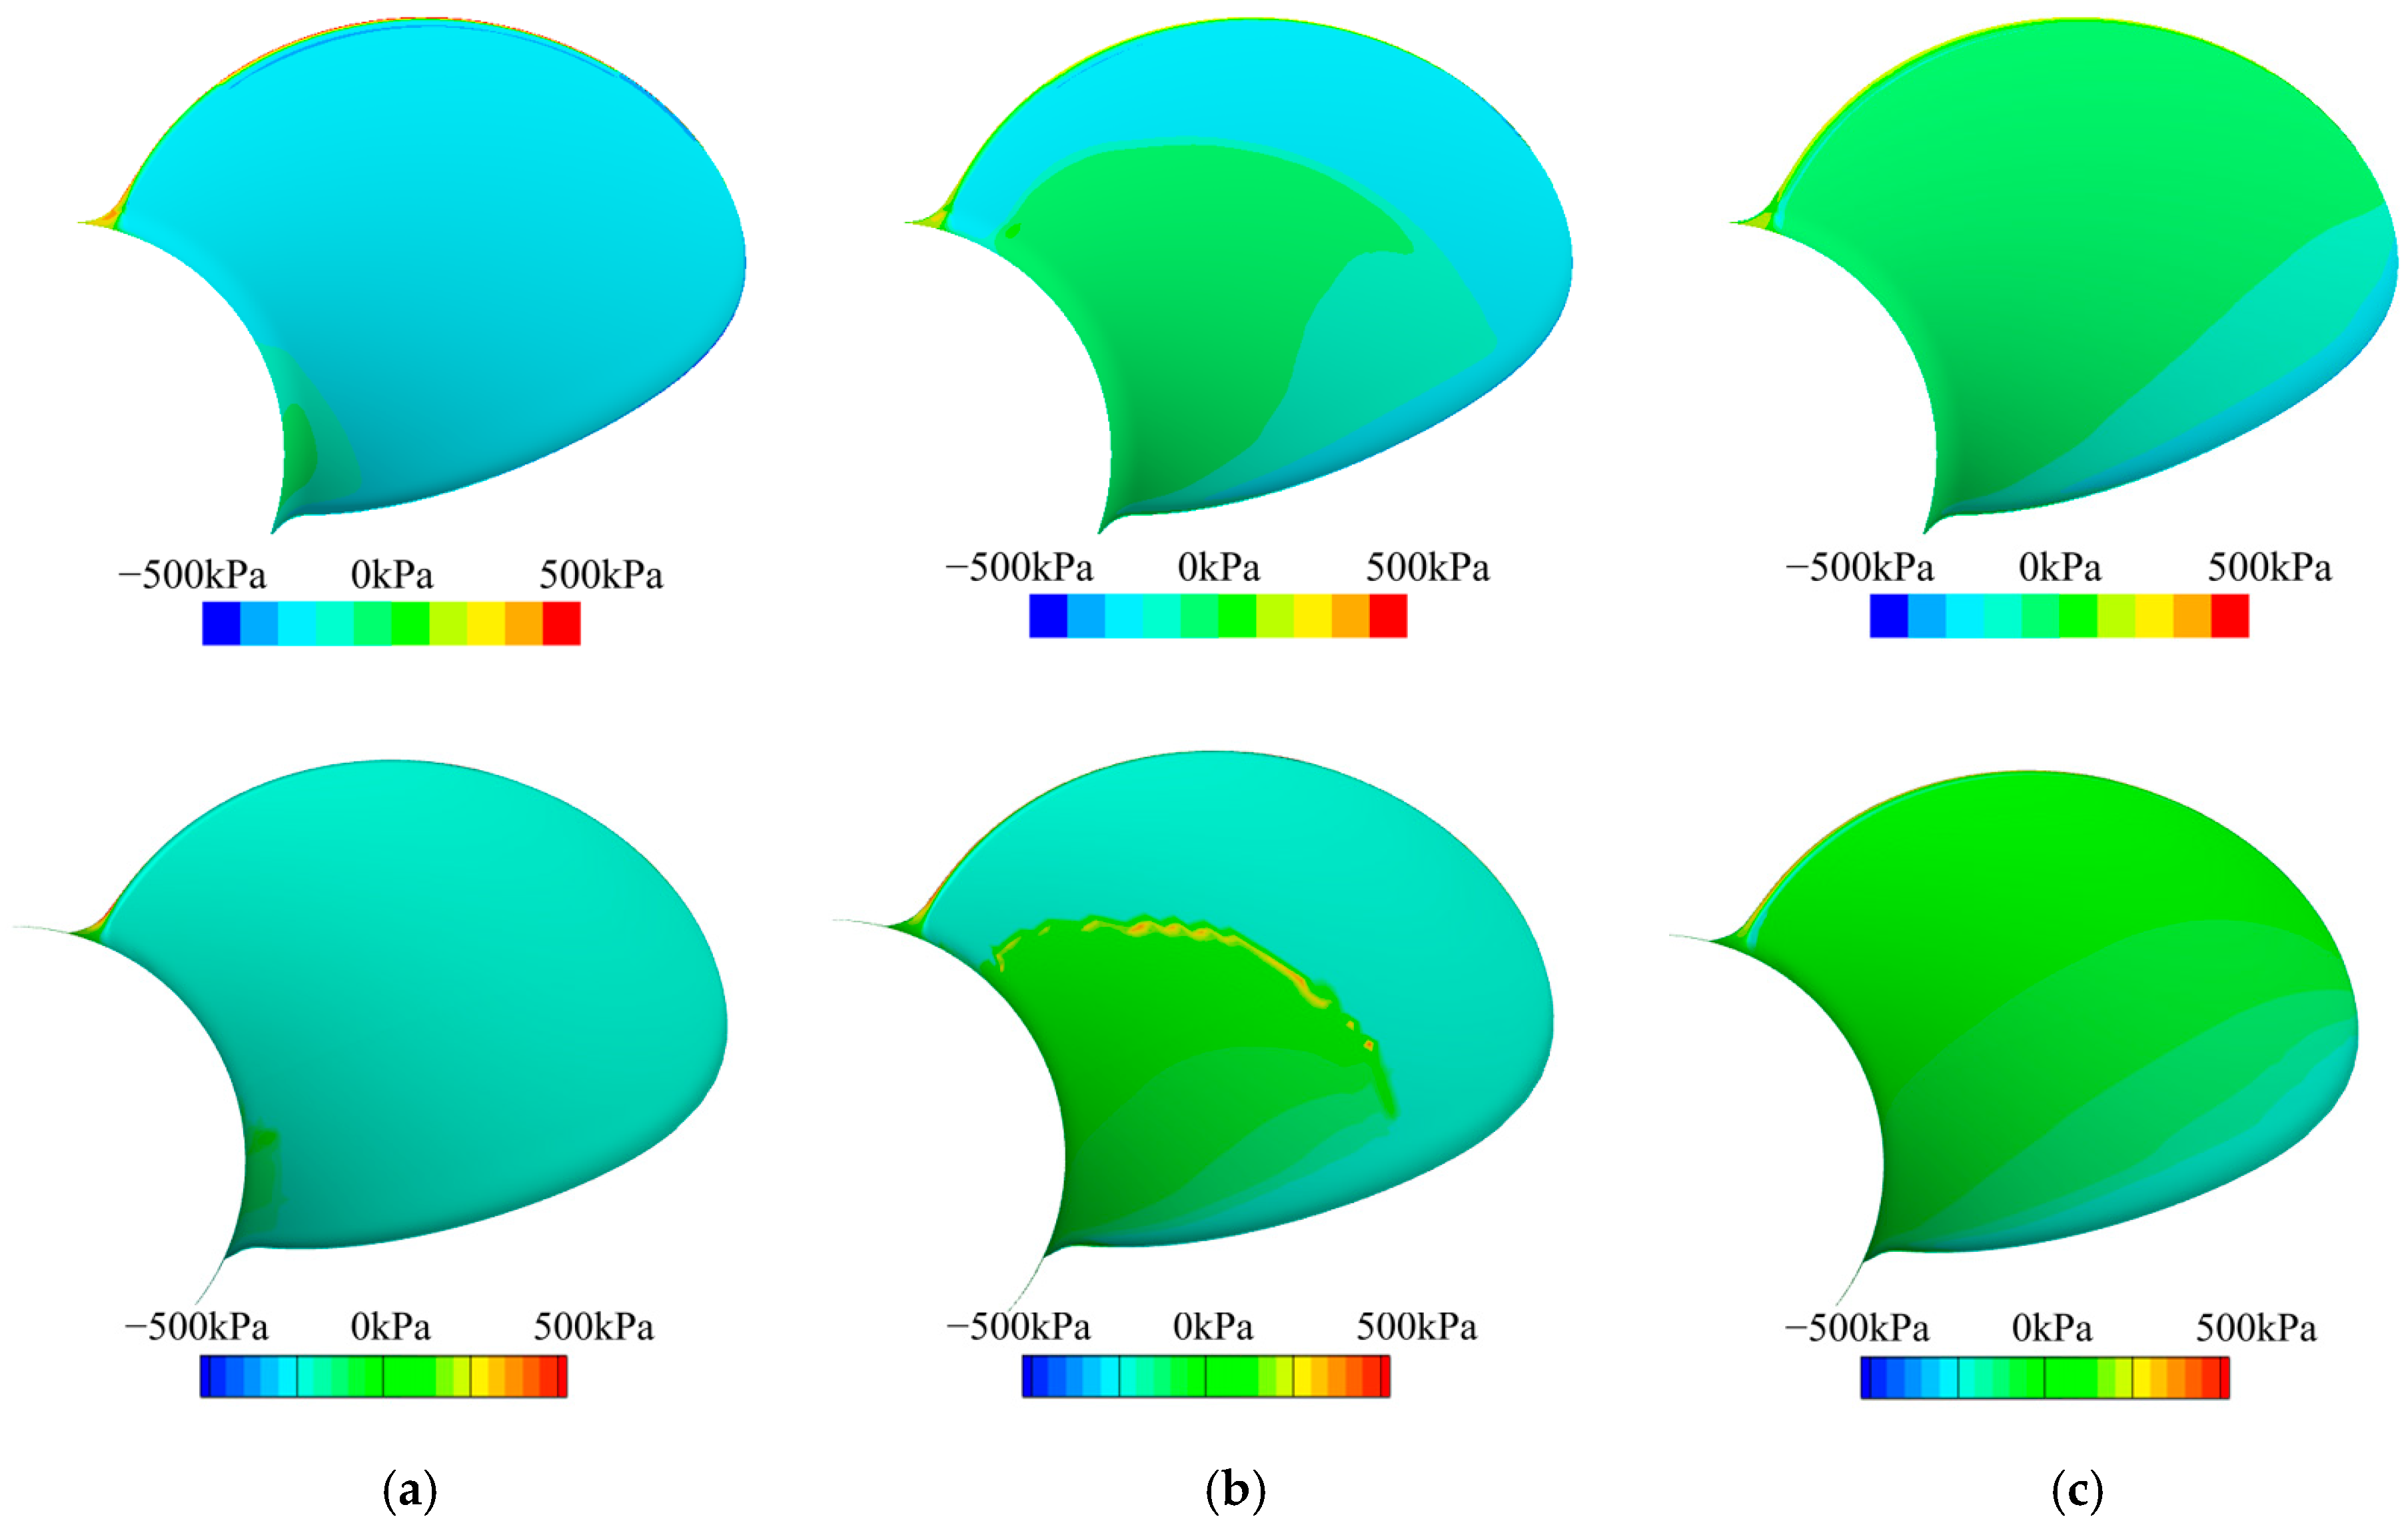
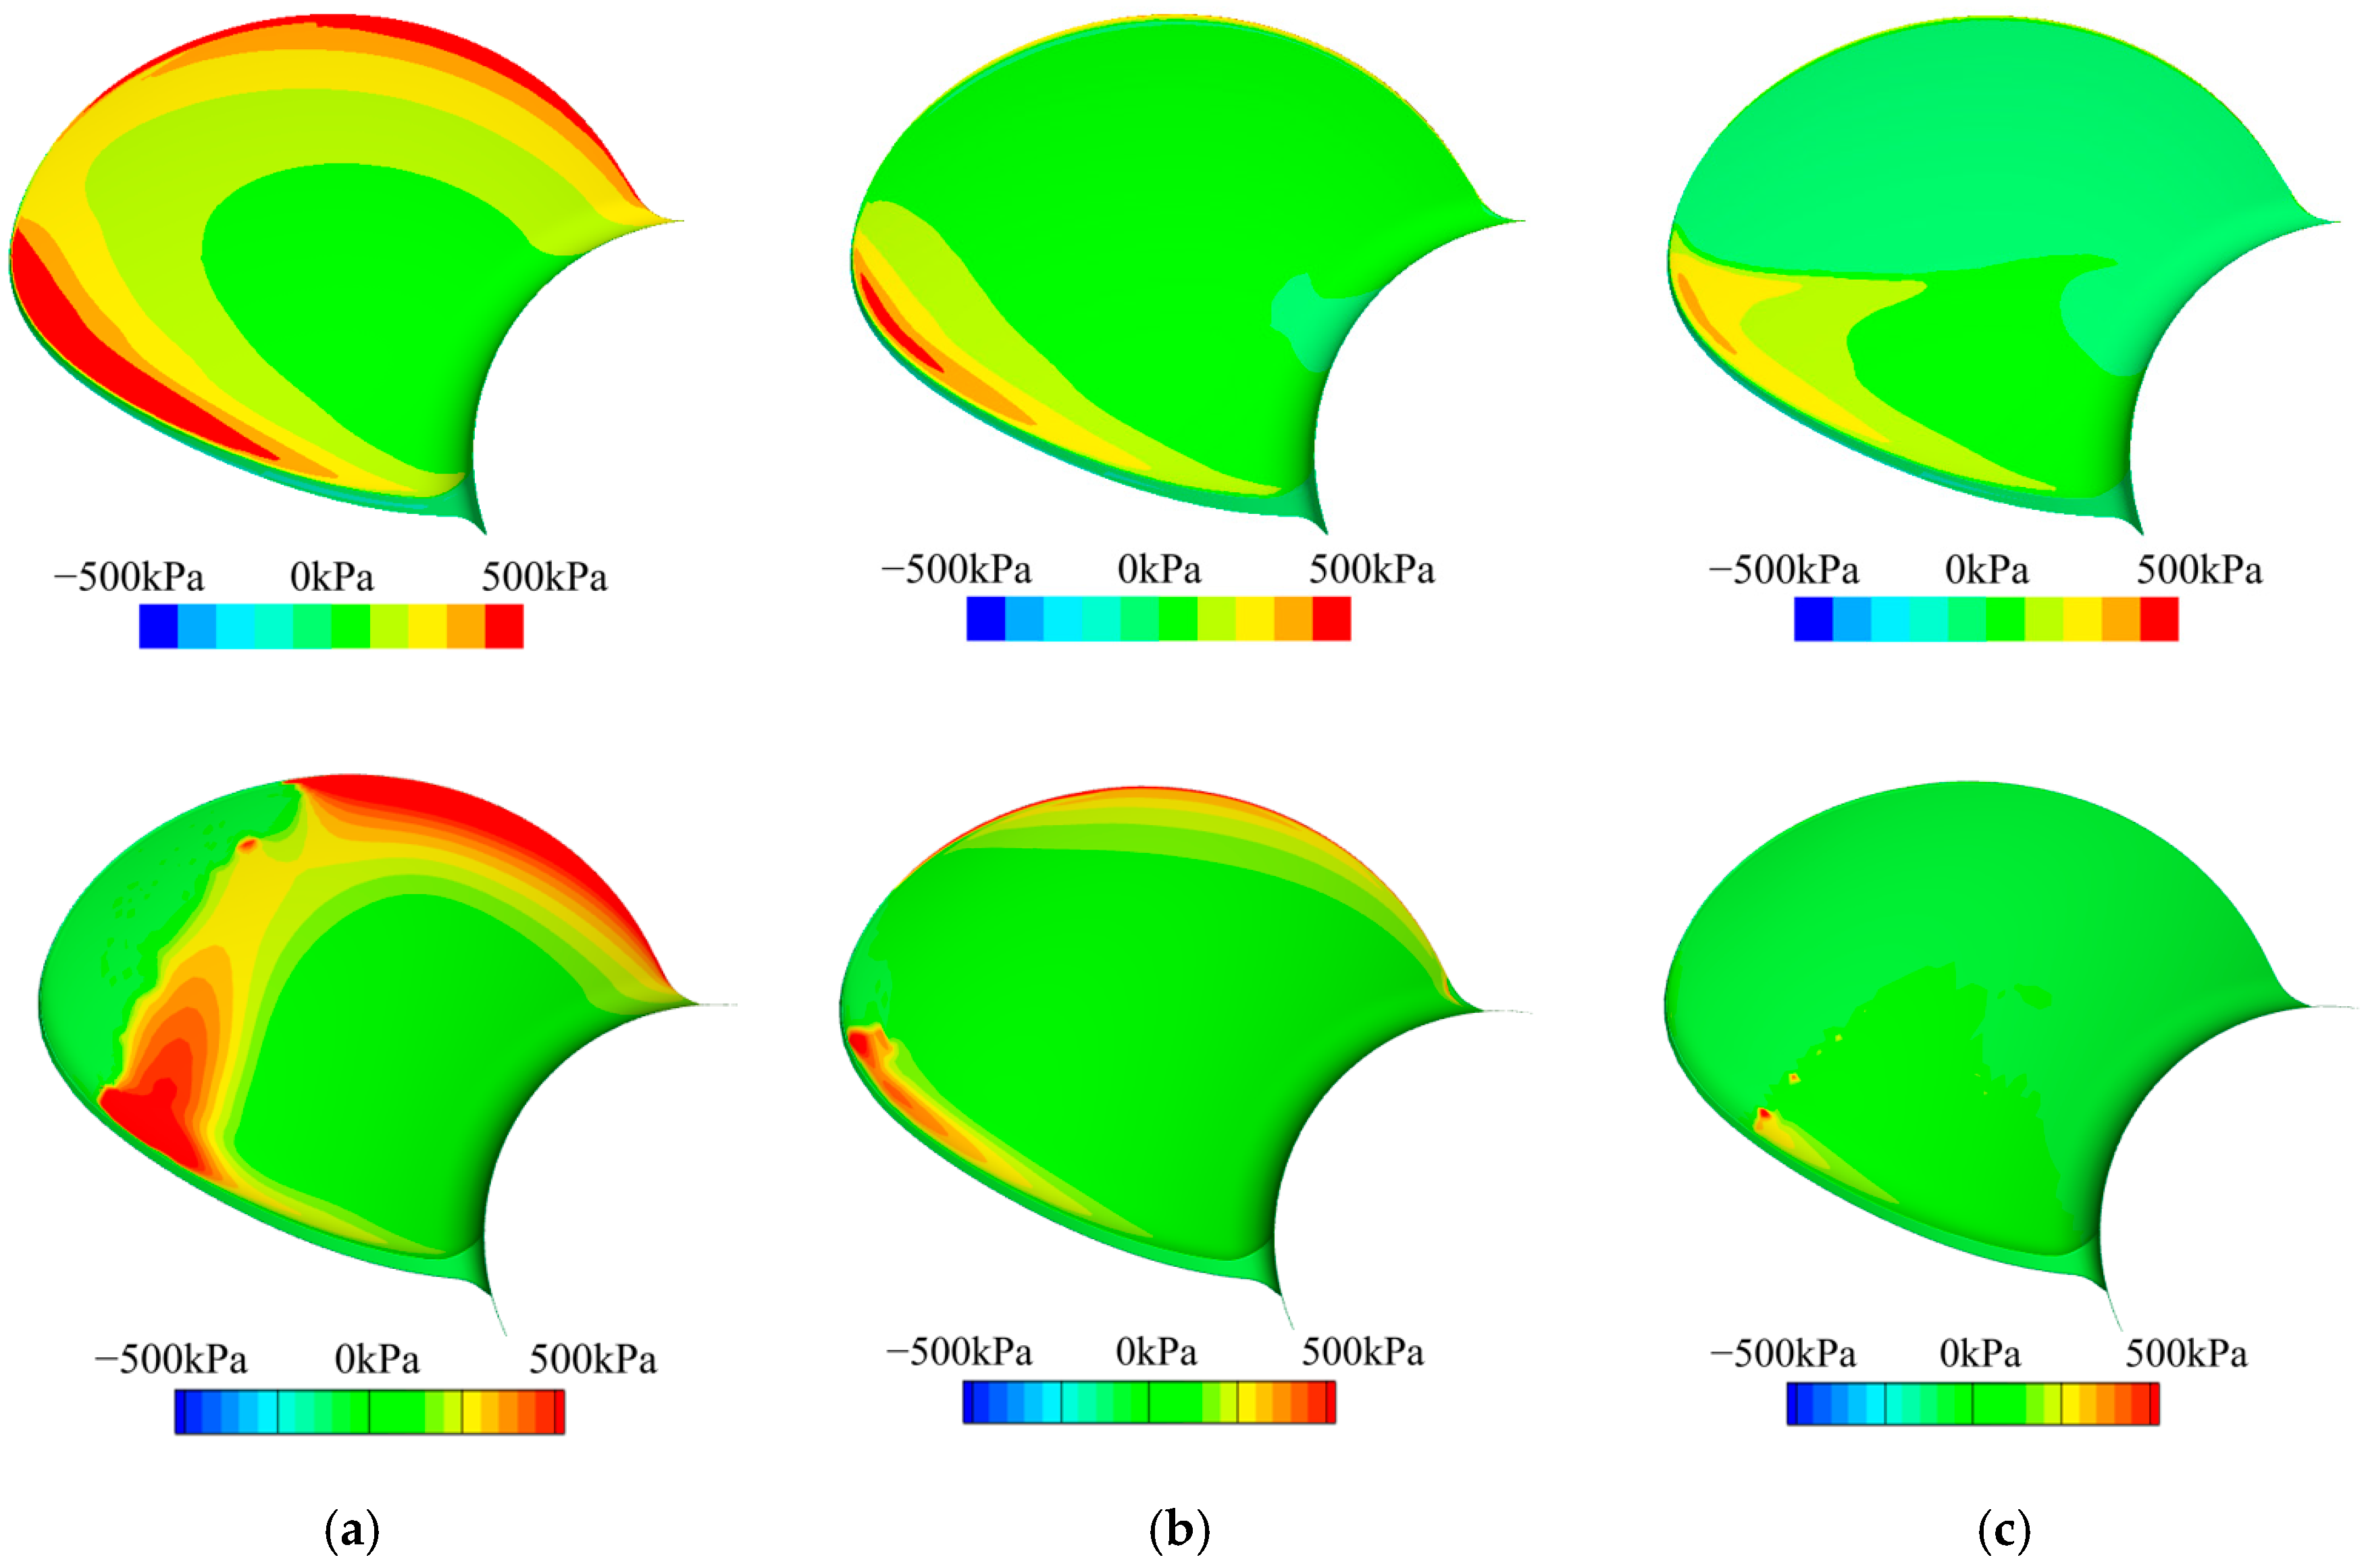
The pressure distribution on the suction and pressure sides of the blade for σ = 0.274 is shown in Figure 14 and Figure 15, respectively. Except for STAR-CCM+ at J = 1.4, where a small region of high pressure is observed on the suction side, the pressure is almost constant for all the cases, which indicates that entire blade is cavitated. This is consistent with the cavitation profiles shown in Figure 12. For the pressure side, the pressure decreases with advance ratios. STAR-CCM+ shows larger high-pressure regions than CFDShip-Iowa V5.5. A clear low-pressure distribution at the tip of the blade can be observed at J = 0.8 in the simulation results of CFDShip-Iowa V5.5. Again, this is due to the blade-to-blade cavitation interactions that are not captured in the STAR-CCM+ simulations.

4. Conclusions

Numerical simulations of an open-water propeller with cavitation effects are performed using CFDShip-Iowa V5.5 for a high-speed planing hull at a high Froude number of 1.84. The computed results are compared with those obtained from the simulations using STAR-CCM+. The overall trends of the computed thrust, torque, propeller efficiency, cavitation profile, and pressure distribution from both codes are consistent, except for the low cavitation number σ = 0.274, where the propeller efficiency is much lower than that obtained with STAR-CCM+.
For the fully wetted conditions without cavitation effects, the thrust and torque coefficients decrease, while the propeller efficiency increases with the advance ratio. Compared to the non-cavitating conditions, both thrust and torque coefficients significantly decrease with cavitation effects. For the large cavitation number σ = 1.095, the thrust, torque, and propeller efficiency increase and then decrease with the advance ratio. For the small cavitation number σ = 0.274, all the variables increase first and then decrease with the advance ratios for CFDShip-Iowa, and the thrust and torque coefficients decrease, and the propeller efficiency generally increases with advance ratios for STAR-CCM+. The cavitation is more violent in CFDShip-Iowa than STAR-CCM+ at σ = 0.274 due to the blade-to-blade interactions, which are not captured in the STAR-CCM+ simulations since a single blade is used.
Additional factors, including geometry and grids, mathematical models, and numerical methods, can also influence the simulation results and account for the observed differences between simulations of the two codes. Further investigations will be considered in future work. Self-propulsion and acceleration simulations of the GPPH using the actual propeller and gear case geometries will be conducted.

Author Contributions

Conceptualization, F.S. and J.S.; methodology, S.P., Z.W. and A.G.; software, Z.W.; validation, S.P., Z.W. and A.G.; formal analysis, S.P., Z.W. and J.S.; investigation, S.P. and A.G.; resources, F.S.; data curation, S.P.; writing—original draft preparation, S.P. and Z.W.; writing—review and editing, Z.W.; visualization, S.P., A.G. and J.S.; supervision, F.S.; project administration, F.S.; funding acquisition, F.S. All authors have read and agreed to the published version of the manuscript.

Funding

This research was funded by the US Office of Naval Research, grant numbers N00014-20-1-2259 and N00014-22-1-2413.

Data Availability Statement

All the data are available in the paper.

Acknowledgments

This work is supported by the US Office of Naval Research grants N00014-20-1-2259 and N00014-22-1-2413 under the administration of Robert Brizzolara. The simulations presented in this work were performed at the Department of Defense (DoD) Supercomputing Resource Centers (DSRCs) through the High-Performance Computing Modernization Program (HPCMP).

Conflicts of Interest

Authors Andrew Gunderson and John Scherer are employed by the company Mercury Marine. The remaining authors declare that the research was conducted in the absence of any commercial or financial relationships that could be construed as a potential conflict of interest.

References

  1. Olofsson, N. Force and Flow Characteristics of a Partially Submerged Propeller. Ph.D. Thesis, Chalmers University of Technology, Göteborg, Sweden, 1996. [Google Scholar]
  2. Young, Y.L.; Kinnas, S.A. Fluid and Structural Modeling of Cavitating Propeller Flows. In Proceedings of the 5th International Symposium on Cavitation, Osaka, Japan, 1–4 November 2003. [Google Scholar]
  3. Nouroozi, H.; Zeraatgar, H. A reliable simulation for hydrodynamic performance prediction of surface-piercing propellers using URANS method. Appl. Ocean Res. 2019, 92, 101939. [Google Scholar] [CrossRef]
  4. Yari, E.; Moghadam, A.B. BEM applied to the cup effect on the partially submerged propeller performance prediction and ventilation pattern. J. Mar. Eng. Technol. 2020, 21, 159–177. [Google Scholar] [CrossRef]
  5. Yilmaz, N.; Atlar, M.; Khorasanchi, M. An improved Mesh Adaption and Refinement approach to Cavitation Simulation (MARCS) of propellers. Ocean Eng. 2019, 171, 139–150. [Google Scholar] [CrossRef]
  6. Zhang, X.; Xu, Q.; Zhang, M.; Xie, Z. Numerical Prediction of Cavitation Fatigue Life and Hydrodynamic Performance of Marine Propellers. J. Mar. Sci. Eng. 2023, 12, 74. [Google Scholar] [CrossRef]
  7. Vázquez-Santos, A.; Camacho-Zamora, M.; Hernández-Hernández, J.; Herrera-May, A.L.; Santos-Cortes, L.D.C.; Tejeda-del-Cueto, M.E. Numerical Analysis and Validation of an Optimized B-Series Marine Propeller Based on NSGA-II Constrained by Cavitation. J. Mar. Sci. Eng. 2024, 12, 105. [Google Scholar] [CrossRef]
  8. Zhang, B.; Zheng, C.S.; Shao, X.M.; Deng, J. Multiscale modeling of propeller cavitation flows in open water. J. Hydrodyn. 2025, 37, 1–13. [Google Scholar] [CrossRef]
  9. Ristea, M.; Popa, A.; Volintiru, O.-N. CFD Design Performance Analysis for a High-Speed Propeller. Appl. Sci. 2025, 15, 8754. [Google Scholar] [CrossRef]
  10. Ghoniem, A.M.; Elazm, A.S.A.; Benaya, M.I.; Mohamed, S.A. Effect of salinity on marine propeller performance. J. Phys. Conf. Ser. 2023, 2616, 012016. [Google Scholar] [CrossRef]
  11. Irannezhad, M.; Kjellberg, M.; Bensow, R.E.; Eslamdoost, A. Experimental and numerical investigations of propeller open water characteristics in calm water and regular head waves. Ocean Eng. 2024, 302, 117703. [Google Scholar] [CrossRef]
  12. Oloan, A.F.N.; Ariana, I.M.; Baidowi, A. Open Water and Performance Analysis of Marine Propeller with PBCF Based CFD Method. In Proceedings of the 6th International Conference on Marine Technology, Surabaya, Indonesia, 27 November 2021. [Google Scholar]
  13. Grlj, C.G.; Degiuli, N.; Farkas, A.; Martić, I. Numerical Study of Scale Effects on Open Water Propeller Performance. J. Mar. Sci. Eng. 2022, 10, 1132. [Google Scholar] [CrossRef]
  14. Ali, M.A.; Peng, H.; Qiu, W. Propeller-hull interaction simulation for self-propulsion with sinkage and trim. Phys. Fluids 2024, 36, 025159. [Google Scholar] [CrossRef]
  15. Stern, F.; Wang, Z.; Park, S.; Milano, C.; Gunderson, A.; Scherer, J.; Yasukawa, H.; Diez, M. Multi-Fidelity Full Throttle Acceleration from Rest for High-Speed Planing-Hulls with Engine Curves. In Proceedings of the 36th Symposium on Naval Hydrodynamics, Busan, Republic of Korea, 14–19 June 2026. [Google Scholar]
  16. Wang, Z.; Stern, F. Volume-of-fluid based two-phase flow methods on structured multiblock and overset grids. Int. J. Numer. Methods Fluids 2022, 94, 557–582. [Google Scholar] [CrossRef]
  17. Wang, Z.; Park, S.; Stern, F. Cavitation Implementation Algorithms Based on Pressure Projection Method for Incompressible Flows with Three-Phase Interactions. Int. J. Numer. Methods Fluids 2025, 97, 1057–1072. [Google Scholar] [CrossRef]
  18. Zwart, P.J.; Gerber, A.G.; Belamri, T. A Two-Phase Flow Model for Predicting Cavitation Dynamics. In Proceedings of the International Conference on Multiphase Flow, Yokohama, Japan, 30 May–3 June 2004. [Google Scholar]
  19. Menter, F.R. Two-equation eddy-viscosity turbulence models for engineering applications. AIAA J. 1994, 32, 1598–1605. [Google Scholar] [CrossRef]
  20. Noack, R. SUGGAR: A general capability for moving body overset grid assembly. In Proceedings of the 17th AIAA Computational Fluid Dynamics Conference, Toronto, ON, Canada, 6–9 June 2005; p. 5117. [Google Scholar]
  21. Schnerr, G.H.; Sauer, J. Physical and Numerical Modeling of Unsteady Cavitation Dynamics. In Proceedings of the 4th International Conference on Multiphase Flow, New Orleans, LA, USA, 27 May–1 June 2001. [Google Scholar]
Figure 1. Geometry of the PLSN6143 propeller. (a) Side view, (b) front view, (c) back view.
Jmse 13 01804 g001
Figure 2. Computational domain and boundary conditions for the CFDShip-Iowa simulations. (a) View from side; (b) view from the outlet.
Jmse 13 01804 g002
Figure 3. Grid distribution for the CFDShip-Iowa. (a) Background grid distribution; (b) propeller blade grid with the overset grid distribution.
Jmse 13 01804 g003aJmse 13 01804 g003b
Figure 4. Single blade geometry: (a) suction face; (b) pressure face; and (c) computational domain for the STAR-CCM+ simulations.
Jmse 13 01804 g004
Figure 5. Grid distribution for the STAR-CCM+ simulations. (a) Single blade grid distribution; (b) polyhedral volume grid with prism layers; (c) background grid distribution.
Jmse 13 01804 g005
Figure 6. Thrust and torque coefficients and propeller open-water efficiency without cavitation.
Jmse 13 01804 g006
Figure 7. Thrust and torque coefficients and propeller open-water efficiency for the cavitation number of σ = 1.095.
Jmse 13 01804 g007
Figure 8. Thrust and torque coefficients and propeller open-water efficiency for the cavitation number of σ = 0.274.
Jmse 13 01804 g008
Figure 9. Vapor-phase iso-surface (vapor volume fraction of 0.1) for σ = 1.095. (a) J = 0.8; (b) J = 1.1; (c) J = 1.4. Left: CFDShip-Iowa V5.5; right: STAR-CCM+, rotated and duplicated from the single-blade results.
Jmse 13 01804 g009
Figure 10. Pressure distributions on the suction side of the propeller blade for σ = 1.095. (a) J = 0.8; (b) J = 1.1; (c) J = 1.4. Top: STAR-CCM+; bottom: CFDShip-Iowa V5.5.
Jmse 13 01804 g010
Figure 11. Pressure distributions on the pressure side of the propeller blade for σ = 1.095. (a) J = 0.8; (b) J = 1.1; (c) J = 1.4. Top: STAR-CCM+; bottom: CFDShip-Iowa V5.5.
Jmse 13 01804 g011
Figure 12. Vapor-phase iso-surface (vapor volume fraction of 0.1) for σ = 0.274. (a) J = 0.8; (b) J = 1.1; and (a,c) J = 1.4. Left: CFDShip-Iowa V5.5; right: STAR-CCM+, rotated and duplicated from the single-blade results.
Jmse 13 01804 g012
Figure 13. Experimental images from high-speed digital video. (a) σ  = 0.275; (b) σ  = 0.202.
Jmse 13 01804 g013
Figure 14. Pressure distributions on the suction side of the propeller blade for σ = 0.274. (a) J = 0.8; (b) J = 1.1; (c) J = 1.4. Top: STAR-CCM+; bottom: CFDShip-Iowa V5.5.
Jmse 13 01804 g014
Figure 15. Pressure distributions on the pressure side of the propeller blade for σ = 0.274. (a) J = 0.8; (b) J = 1.1; (c) J = 1.4. Top: STAR-CCM+; bottom: CFDShip-Iowa V5.5.
Jmse 13 01804 g015
Table 1. Detailed specifications of PLSN6143 propeller.
Number of BladesPropeller DiameterHub DiameterPitch Distance
40.71 m0.2282 m1.065 m
SkewTip rakeSkew-induced rakeDisc area
11.77 deg0.1739 m0.0348 m0.3959 m2
Table 2. Thrust coefficients for CFDShip-Iowa V5.5 and STAR-CCM+.
KtCFDShip-Iowa V5.5STAR-CCM+
σNo-Cav1.095 Diff (%)0.274Diff (%)No-Cav1.095Diff (%)0.274Diff (%)
J = 0.80.3720.181−51.40.098−73.50.4180.266−36.50.142−66.2
J = 1.10.2570.240−6.70.167−35.10.2980.263−11.70.130−56.4
J = 1.40.1330.090−32.40.025−81.40.1660.129−21.90.068−58.9
Average −30.2 −63.4 −23.4 −60.5
Table 3. Torque coefficient for CFDShip-Iowa V5.5 and STAR-CCM+.
10KqCFDShip-Iowa V5.5STAR-CCM+
σNo-Cav1.095 Diff (%)0.274Diff (%)No-Cav1.095Diff (%)0.274Diff (%)
J = 0.80.8670.464−46.50.312−64.10.9390.683−27.30.385−59.0
J = 1.10.6850.635−7.30.441−35.60.7610.702−7.80.375−50.8
J = 1.40.4490.353−21.30.236−47.40.5150.471−8.40.264−48.6
Average −25.0 −49.0 −14.5 −52.8
Table 4. Propeller open-water efficiency for CFDShip-Iowa V5.5 and STAR-CCM+.
η CFDShip-Iowa V5.5STAR-CCM+
σNo-Cav1.095 Diff (%)0.274Diff (%)No-Cav1.095Diff (%)0.274Diff (%)
J = 0.80.5460.496−9.20.402−26.40.5710.496−13.20.469−18.0
J = 1.10.6570.6610.70.6620.80.6800.655−3.50.606−10.8
J = 1.40.6580.565−14.10.232−64.80.7140.612−14.30.574−19.6
Average −7.6 −30.1 −10.4 −16.1
Disclaimer/Publisher’s Note: The statements, opinions and data contained in all publications are solely those of the individual author(s) and contributor(s) and not of MDPI and/or the editor(s). MDPI and/or the editor(s) disclaim responsibility for any injury to people or property resulting from any ideas, methods, instructions or products referred to in the content.