Abstract
Underwater Wireless Acoustic Power Transfer (UWAPT) systems face severe efficiency limitations from acoustic cavitation during high-power operation. This paper presents a comprehensive optimization method to mitigate this limitation. A cavitation threshold model, derived from the linearized Rayleigh–Plesset equation, is integrated with an acoustic absorption model to determine optimal operating frequencies for maximizing received acoustic power while avoiding cavitation. The optimization method effectively addresses the trade-off between cavitation thresholds and frequency-dependent absorption. Simulation experiments demonstrate the benefit of the proposed method, achieving a significant enhancement in power transfer efficiency compared to UWAPT systems without frequency optimization. For example, received power at 10 m transmission distance and 50 m operating depth is increased by 17.8%. Further analysis shows that the optimal frequency is influenced by environmental factors such as depth, salinity, and transmission distance. Simulation experiments in diverse underwater environments verify that the proposed method provides a robust solution for enhancing the efficiency and reliability of UWAPT systems.
1. Introduction
Underwater Wireless Power Transfer (UWPT) is rapidly developing as a crucial technology for supplying power to submerged devices, Autonomous Underwater Vehicles (AUVs), and underwater sensor networks [1,2,3,4,5]. It enhances the operation flexibility while eliminating the constraints of traditional cable-based systems. Among various UWPT techniques, Underwater Wireless Acoustic Power Transfer (UWAPT) has emerged as a promising method due to its capability to deliver power over extended distances in challenging subsea environments [6,7,8].
However, as the demand for high-power underwater devices (e.g., AUVs with extended mission durations) grows, the end-to-end efficiency of UWAPT systems remains constrained by three interrelated technical challenges, particularly in high-power operation.
The first challenge is electro-acoustic/acoustic-electro conversion loss in transducers [9,10]. Piezoelectric transducers, the core components of UWAPT systems that convert electrical energy to acoustic energy (transmitter) and vice versa (receiver), inherently suffer from energy dissipation due to material hysteresis, imperfect strain distribution, structural energy leakage and impedance mismatch. These mechanisms collectively make conversion loss a fundamental limitation, especially in high-power operation. The second challenge is ultrasonic propagation loss. Acoustic waves in seawater undergo attenuation from multiple mechanisms, including geometric spreading, scattering, and ambient noise [11,12]; however, the most critical loss is acoustic absorption, which arises from molecular relaxation and viscous effects.
The third and most severe challenge for high-power UWAPT is acoustic cavitation. Acoustic cavitation involves the nucleation, growth, and violent inertial collapse of microbubbles driven by intense acoustic fields [13]. Ultrasonic cavitation enables multidisciplinary applications by generating transient microjets and extreme localized conditions, including enhanced drug delivery through blood–brain barrier disruption [14], industrial precision cleaning of contaminated surfaces [15], and accelerated organic synthesis via radical generation. The presence of microbubbles in seawater and the resultant acoustic cavitation phenomenon imposes severe limitations on achievable power levels. As illustrated in Figure 1, in high-power UWAPT systems for underwater environments, intense acoustic fields can activate dissolved gas micro-nuclei. If the intensity is high enough, acoustic cavitation occurs. Obviously, the resulting cavitation bubble clouds degrade power transmission efficiency due to the following aspects: acoustic attenuation is enlarged due to combined scattering and viscous absorption effects, and broadband noise generated by inertial bubble collapse reduces usable delivered power. Critically, cavitation imposes an upper bound on the acoustic intensity that can be safely transmitted, making it a bottleneck for high-power UWAPT systems that cannot be resolved by addressing conversion or propagation losses alone.

Figure 1.
An example of a UWAPT system with illustration of cavitation process.
To address the above challenges, current research on enhancing UWAPT efficiency primarily focuses on three approaches. Firstly, to mitigate electro-acoustic/acoustic-electro conversion losses in transducers, researchers are exploring advanced materials and transducer designs. This includes the use of novel piezoelectric composite materials, such as BaTiO3/P(VDF-TrFE) sandwich structures, and innovative transducer structures like trapezoidal cantilevers, designed to optimize strain distribution [16]. Furthermore, intelligent impedance matching techniques, utilizing dynamically tuned adaptive networks driven by RBF neural algorithms, are being employed to mitigate cross-coupling losses in multi-load scenarios. Secondly, to address ultrasonic propagation losses during transmission, studies focus on beamforming and directional control using phased array technology to concentrate acoustic energy and overcome geometric spreading losses, alongside phase modulation techniques designed to compensate for scattering losses induced by temperature-gradient-dependent sound velocity variations [11,17].
Frequency optimization has emerged as a third key direction, as frequency directly influences both propagation losses (via acoustic absorption) and cavitation risks (via cavitation threshold). However, existing frequency-based strategies fail to integrate cavitation dynamics with marine environmental parameters, limiting their applicability to high-power UWAPT. A 2025 study by Liu Z. et al. on underwater acoustic energy transmission established a multi-variable coupled model to optimize operating frequency, with its core focus being balancing frequency-dependent acoustic absorption and geometric diffusion losses to improve energy transmission efficiency [18]. However, this work critically overlooks acoustic cavitation—a major efficiency limiter in high-power UWAPT systems—where bubble collapse can drastically degrade transmission efficiency. For UWAPT systems specifically, the hybrid hill climbing–golden section search (HC-GSS) algorithm [19] is a representative frequency optimization strategy, which enables maximum energy efficiency tracking (MEET) without primary–secondary communication and achieves up to 93.35% efficiency under axial misalignment; yet it also fails to account for cavitation risks, restricting its reliability in high-power scenarios. From the hardware perspective, Zuo et al. addressed a key bottleneck that hinders effective frequency optimization: transducer multi-peak resonance, which often leads to false frequency tracking in ultrasonic systems [20]. They proposed a hybrid tracking strategy that uses the minimum current method to locate parallel resonance during the transducer’s idle period and uses phase difference control to maintain stable tracking under dynamic loads, effectively ensuring consistent transducer operation across varying working conditions. This work, however, focuses solely on transducer-level frequency calibration, lacking integration of marine environmental factors or cavitation dynamics, limiting its applicability to UWAPT systems in natural seawater. For broader underwater acoustic systems, Felemban developed a mathematical model for UWSN acoustic channels, focusing on quantifying how environmental parameters (e.g., temperature, wind speed) influence optimal frequency selection [21]; its core contribution lies in verifying that dynamic frequency adjustment can significantly improve communication SNR (especially under complex environmental conditions), yet the model targets data transmission rather than power transfer, with no consideration of cavitation risks or energy transmission efficiency—core metrics for UWAPT.
However, across all these frequency optimization efforts, a critical limitation persists: there are few discussions on the complex interactions between propagation losses, particularly cavitation dynamics and system performance during high-power UWAPT operation in natural seawater environments. As established in prior research [22,23], the cavitation threshold pressure exhibits distinct frequency dependence, shaped by acoustic parameters, liquid properties, and environmental conditions. Critically, this gives rise to an intrinsic trade-off: increasing the operating frequency elevates the cavitation threshold (thereby raising the maximum acoustic pressure that can be transmitted to avoid cavitation) but simultaneously exacerbates acoustic absorption losses in seawater—two competing effects that pull optimal frequency selection in opposing directions. This fundamental conflict not only substantially complicates the determination of optimal operating frequency for UWAPT systems but also highlights a broader gap: existing research lacks a quantitative framework that integrates cavitation dynamics, frequency-dependent absorption, and environmental variables to maximize power transfer efficiency.
To fill this gap, this study proposes a comprehensive frequency optimization method for high-power UWAPT systems, with the core goal of maximizing received acoustic power while avoiding cavitation. Our methodology derives the cavitation threshold–frequency relationship using the linearized Rayleigh–Plesset equation, subsequently integrating it with the Francois–Garrison acoustic absorption model. We then establish a quantitative trade-off framework between cavitation threshold and acoustic absorption through derivation of the received acoustic pressure expression. This model enables construction of an optimization framework to maximize the received pressure, where the global optimum frequency is identified via the optimization algorithm. Finally, comprehensive simulation experiments investigate the influence of transmission distance and diverse practical environmental parameters on UWAPT system performance and optimal frequency selection. And the optimal frequencies of the UWAPT system in three representative underwater environments are simulated and calculated.
Our proposed optimization framework delivers a substantial improvement in power transfer efficiency compared to existing UWAPT systems, showcasing its practical advantage in enhancing power delivery. Through systematic analysis of frequency-dependent acoustic pressure characteristics and environmental parameter sensitivity, this study provides crucial theoretical insights and practical guidelines for optimizing UWAPT system performance in real marine environments.
2. Method
The overall architecture of the frequency optimization method is illustrated in Figure 2, and this design is targeted at addressing the core research gap identified in the Introduction—namely, the lack of a framework integrating cavitation dynamics, frequency-dependent absorption, and environmental variables for UWAPT systems—with each key step guided by clear logical connections to research objectives and model applicability.
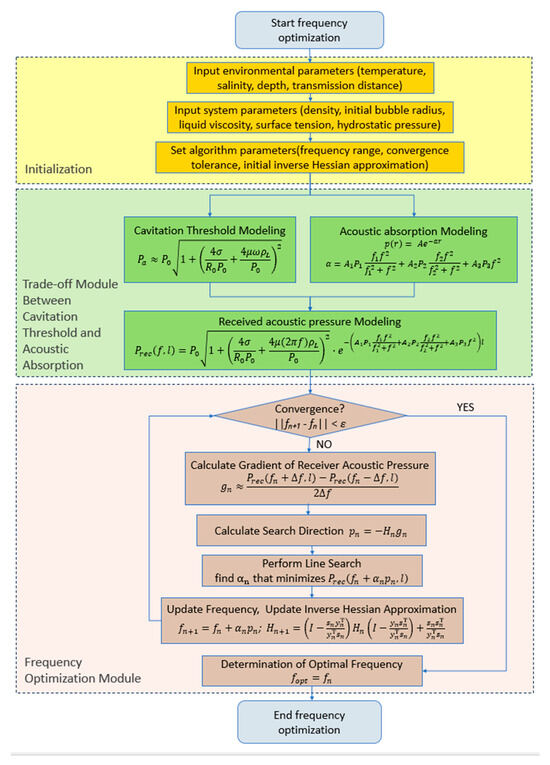
Figure 2.
Flowchart of the frequency optimization method.
The method begins with the input of essential environmental and system parameters, followed by the setting of algorithm parameters such as the frequency range and convergence criteria. Subsequently, it integrates two core models: a cavitation threshold model derived from the linearized Rayleigh–Plesset equation, and the Francois–Garrison acoustic absorption model. The linearized Rayleigh–Plesset equation is selected to quantify the frequency–cavitation threshold relationship—unlike the full nonlinear form (which involves complex numerical solutions obscuring direct frequency effects), its linearization under “small-amplitude bubble oscillations around the equilibrium radius” decouples complex interactions, enabling an explicit frequency-dependent cavitation threshold expression that lays the foundation for incorporating cavitation constraints. The Francois–Garrison model, by contrast, addresses limitations of simplified absorption models: it decomposes absorption into physically meaningful components (boric acid, magnesium sulfate, pure water) to accurately characterize frequency-dependent attenuation, explicitly integrates environmental parameters (salinity, depth) into absorption coefficient calculations, and ensures consistency with mainstream underwater acoustics literature.
These two models are then combined to develop a trade-off model for received acoustic pressure, which accounts for both cavitation risk and acoustic absorption losses. This model resolves the intrinsic contradiction between cavitation avoidance and absorption minimization: it restricts transmit pressure to the frequency-dependent cavitation threshold while incorporating frequency-dependent absorption losses, converting the qualitative cavitation–absorption trade-off into a quantifiable optimization objective.
Finally, to address the complexity of the resulting nonlinear equations (arising from the product of the cavitation-related square-root term and absorption-related exponential term), the BFGS iterative numerical optimization algorithm is implemented—unlike first-order methods (e.g., gradient descent) prone to local optima, BFGS approximates the function’s curvature via inverse Hessian updates, supporting convergence to the global optimal frequency and adapting to potential real-time adjustment in dynamic underwater environments. The algorithm involves calculating the gradient of the received acoustic pressure, determining the search direction, performing a line search to optimize the step size, and updating the frequency using an inverse Hessian approximation; the iterative process continues until the specified convergence criteria are met, at which point the optimal operating frequency is determined.
In essence, the methodology follows a coherent sequential logic, with each step directly addressing the core research gap identified in the Introduction—the lack of a framework integrating cavitation dynamics, frequency-dependent absorption, and environmental variables for UWAPT systems. It first quantifies the frequency–cavitation threshold relationship via the linearized Rayleigh–Plesset equation and the frequency–environment–absorption relationship via the Francois–Garrison model, laying a quantitative foundation for subsequent analysis. On this basis, it constructs a unified received acoustic pressure trade-off model to resolve the intrinsic contradiction between cavitation avoidance and absorption minimization. Finally, it adopts the BFGS algorithm to efficiently find the global optimal frequency for the nonlinear trade-off model, overcoming analytical intractability and adapting to dynamic underwater environments. All these steps collectively serve the core goal of maximizing the received power of UWAPT systems while effectively avoiding acoustic cavitation.
2.1. Trade-Off Model Between Cavitation Threshold and Acoustic Absorption
2.1.1. Theoretical Modeling of the Relationship Between Cavitation Threshold and Ultrasonic Frequency
To study the influence of acoustic cavitation on the UWAPT system, this paper uses the linearized Rayleigh–Plesset equation to derive the quantitative relationship between the cavitation threshold and ultrasonic frequency.
The Rayleigh–Plesset equation describes the dynamic behavior of a bubble in a liquid, given in Formula (1) [24]:
where is the bubble radius, is the liquid density, is the gas pressure inside the bubble, is the hydrostatic pressure, is the applied acoustic pressure, is the surface tension coefficient, and is the liquid viscosity coefficient.
To clarify the basis for linearization, we focus on determining cavitation critical conditions (rather than depicting full nonlinear bubble dynamics) and thus assume small-amplitude oscillations of the bubble radius around its equilibrium radius. Next, we linearize Formula (1). We assume that the bubble radius oscillates slightly around the equilibrium radius given in Formula (2),
We neglect nonlinear terms and , and linearize as follows:
where is the gas polytropic index. Under normal circumstances, k takes the value of the adiabatic index.
Next, we bring the above formulas into the R-P equation and perform linearization as follows:
This can be rearranged into the standard damped harmonic oscillator equation as follows:
where is the damping coefficient and is the bubble natural frequency.
The steady-state solution of the linearized R-P equation is , where the amplitude is given in Formula (6),
The critical condition for cavitation is when the bubble oscillation amplitude reaches or exceeds , that is:
Assuming the applied frequency is much lower than the resonance frequency , we can obtain Formula (8),
Substituting the expressions for and as follows:
By further simplification, we can obtain Formula (10),
For the cavitation threshold, we typically take (isothermal process) and ignore higher-order small terms, resulting in:
Formula (11) ultimately establishes a theoretical relationship model between the cavitation threshold and ultrasonic frequency. This model provides a fundamental theoretical foundation for mitigating cavitation risks through frequency regulation, and subsequently, it will be integrated with the acoustic absorption model to construct a trade-off optimization framework.
2.1.2. Acoustic Absorption Modeling
Seawater constitutes a characteristically dissipative medium for acoustic wave propagation, where energy attenuation arises principally from viscous interactions and molecular relaxation processes of dissolved chemical constituents. The contemporary Francois–Garrison attenuation model provides a comprehensive theoretical framework for quantifying frequency-dependent absorption losses in oceanic environments, establishing itself as the prevailing paradigm in underwater acoustics research [25]. The absorption coefficient is decomposed into three terms corresponding to the roles of boric acid, magnesium sulfate, and pure water as follows:
The role of boric acid can be summarized as Formula (13),
The role of magnesium sulfate can be summarized as Formula (14),
The role of pure water can be summarized as Formula (15),
In the above formulas, is the absorption coefficient in dB/km; z is the depth in meter; S is the salinity in psu; T is the temperature in °C; and f is the frequency in kHz. During underwater sound propagation, acoustic energy experiences inevitable attenuation due to the viscous properties of the medium and molecular relaxation processes. This energy dissipation follows a characteristic pattern where sound pressure amplitude decreases exponentially with transmission distance. The attenuation behavior can be mathematically modeled through an exponential decay function incorporating the absorption coefficient . For a sound wave propagating through a distance in seawater, the resulting pressure amplitude accounting for medium losses is given by Formula (16):
This fundamental relationship quantitatively describes how acoustic energy diminishes with propagation distance in marine environments. The exponential model provides critical insights for evaluating and enhancing underwater acoustic transmission performance, forming the basis for various practical applications in underwater acoustics.
2.1.3. Received Acoustic Pressure Modeling
To establish a quantitative trade-off between the cavitation threshold and sound absorption models, we derived an expression for the acoustic pressure at the receiver after propagating a distance , and the theoretical maximum receiver acoustic pressure with corresponding optimal frequency, under the constraint of cavitation avoidance.
Given the relationship between the cavitation threshold and the ultrasonic frequency as described in Formula (11), the acoustic absorption loss in seawater is described by the Francois–Garrison model as described in Formula (16).
To avoid cavitation, the acoustic pressure emitted by the transmitting transducer must be limited to the cavitation threshold . Therefore,
Considering the absorption loss during propagation, the acoustic pressure at the receiver after propagating a distance can be expressed as:
Substituting the expressions for and , we obtain Formula (19) for received sound pressure,
This integrated receiver pressure model (Formula (19)) quantifies the fundamental trade-off between cavitation avoidance and acoustic transmission efficiency. It demonstrates that the achievable pressure at distance is governed by the viscosity-dependent cavitation threshold scaling with frequency, and frequency-selective absorption mechanisms in seawater. The model establishes an analytical basis for determining the frequency-dependent maximum received acoustic energy under safety constraints, thereby forming the core objective function for the subsequent optimization framework in Section 2.2.
2.2. Frequency Optimization for Maximum Received Power
To clarify the distinction between design variables and predefined parameters in the frequency optimization process, and their respective constraints, the following key definitions are first supplemented. The sole design variable of this study is the UWAPT system’s operating frequency , as it directly regulates the cavitation–absorption trade-off. Predefined parameters include seawater physical properties (e.g., , ), environmental conditions (e.g., depth, salinity), and BFGS algorithm settings (e.g., convergence tolerance), all fixed by scenarios or hardware. The design variable is constrained by cavitation avoidance, acoustic absorption limits, and commercial transducer operational ranges, ensuring engineering feasibility.
The final objective is to determine the optimal frequency that maximizes the receiver acoustic pressure . Mathematically, this involves finding the frequency where the derivative of with respect to equals zero.
However, due to the complexity of the equation for , it is challenging to obtain an analytical solution for . Therefore, the numerical optimization approach should be adopted. This choice is motivated by the need to balance high-precision frequency matching (to avoid local optima in the coupled “cavitation threshold–acoustic absorption–frequency” relationship) and computational efficiency (considering the limited computing power of underwater sensor nodes). As a quasi-Newton method, BFGS iteratively updates the Hessian matrix to efficiently approach the global optimum with far fewer iterations than first-order methods, while also exhibiting better engineering adaptability and lower per-iteration computational load compared to other second-order methods (e.g., Newton method). The Broyden–Fletcher–Goldfarb–Shanno (BFGS) algorithm is chosen to identify the optimal frequency for maximizing received acoustic power while mitigating cavitation effects.
The implementation process starts with initializing a frequency range of interest, an initial frequency, a convergence tolerance, and an approximation of the inverse Hessian matrix (often the identity matrix). The BFGS algorithm iteratively refines these parameters by calculating the receiver acoustic pressure and its gradient with respect to frequency, using either numerical approximation or analytical expression if computationally feasible. A line search is then performed to determine the optimal step size, and the frequency and inverse Hessian approximation are updated accordingly until a convergence criterion is met. Finally, the optimal frequency is determined to maximize achievable receiver acoustic pressure .
The key steps are summarized as follows.
Repeat the following steps until a convergence criterion is met, such as a small change in frequency or gradient magnitude:
First, calculate the receiver acoustic pressure at the current frequency: .
Next, calculate the gradient of the receiver acoustic pressure with respect to frequency: . This derivative can be approximated numerically using finite differences:
where is a small frequency step. Alternatively, the analytical expression for the derivative (as given in a previous version of this response) can be used if available and computationally feasible.
Then, calculate the search direction: .
Following this, perform a line search along the direction to find the optimal step size that minimizes . A simple approach is to use a backtracking line search, reducing until a sufficient decrease in the objective function is achieved.
Then, update the frequency, , and calculate and .
Finally, update the inverse Hessian approximation using the BFGS update formula as follows:
We can then determine the optimal frequency. Once a convergence criterion is met, the optimal frequency is given by the final value of as follows.
Finally, we calculate maximum achievable acoustic pressure. Once is determined, the maximum achievable receiver acoustic pressure is calculated by substituting back into the equation for :
This frequency optimization methodology resolves the core trade-off between cavitation avoidance and acoustic transmission efficiency. The BFGS-based numerical approach overcomes analytical intractability while ensuring physical consistency through gradient-aware frequency updates, curvature-informed step adaptation, and rigorous convergence to (Formula (23)). The resultant (Formula (24)) defines the theoretical maximum for safe acoustic power delivery considering acoustic cavitation, establishing a critical design benchmark for UWAPT systems operating in dissipative marine environments.
It is important to clarify that the proposed frequency optimization model does not aim for a fixed target frequency. Instead, its core objective is to determine an environmentally adaptive optimal frequency that maximizes received acoustic power while avoiding cavitation, as dynamically depends on environmental (depth, salinity) and operational (transmission distance) parameters. A “satisfactory” is defined by three criteria: proximity to the theoretical maximum received power, measurable performance improvement over non-optimized frequencies, and compatibility with the operational range of commercial piezoelectric transducers. All simulated values in this study meet these criteria, ensuring theoretical optimality and engineering feasibility.
3. Results and Discussion
3.1. Validation of the Frequency—Cavitation Threshold Relationship
In this study, a theoretical model relating acoustic frequency and cavitation threshold is derived from the linearized Rayleigh–Plesset equation. Direct experimental validation of the cavitation threshold is challenging due to the complexity of measurement techniques and limitations of available laboratory equipment. Therefore, to assess the validity of the derived model, its prediction is compared against existing data reported by J. Sponer [23]. Sponer’s data, conducted under specific conditions (water density of 1000 kg/m3, surface tension of 0.073 N/m, speed of sound in water of 1450 m/s, polytropic exponent of 1.4, and hydrostatic pressure of 0.1 MPa), provide a valuable benchmark for comparison. As shown in Figure 3, the theoretical predictions from our model exhibit a consistent trend with Sponer’s data, thereby supporting the validity and applicability of the derived theoretical cavitation threshold model.
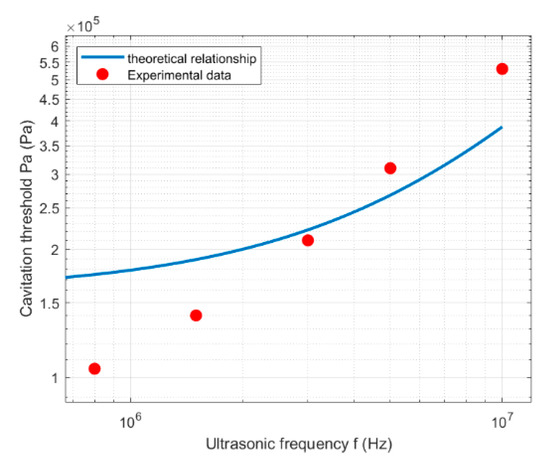
Figure 3.
Comparison of the theoretical model of frequency–cavitation threshold relationship and the existing data.
The theoretical curve, generated using Formula (11), demonstrates a strong conformance and agreement with the observed trend, indicating that the cavitation threshold generally increases with increasing frequency. While the model accurately captures the overall trend, some discrepancies were observed. These deviations can be attributed to the nonlinear effects not accounted for by the linearized R-P equation.
3.2. Impact of Frequency on Received Sound Pressure
This section investigates the influence of operational frequency on the received acoustic pressure in a UWAPT system, taking into account the constraints imposed by cavitation avoidance. We directly observe and analyze the system’s optimal operating frequency that maximizes the received sound pressure.
3.2.1. Experimental Setup
The theoretical model described in Section 2 was adopted for simulations, with parameters set to reflect typical seawater properties and practical UWAPT operational constraints, as summarized in the following: liquid density kg/m3, surface tension N/m, and liquid kinematic viscosity m2/s—these values are based on the average properties of global surface seawater, matching the shallow-water deployment scenarios of most UWAPT systems. The initial bubble radius m corresponds to the “dominant radius” of cavitation nuclei in shallow seawater, ensuring the cavitation threshold model accurately captures real cavitation risks. Hydrostatic pressure Pa, water temperature T = 20 °C, salinity S = 35%, and propagation distance m align with the average conditions of upper ocean environments (where UWAPT systems are most commonly deployed) and typical operational distances. The simulation swept across a frequency range from 10 kHz to 2 MHz (2000 evenly spaced points), calculating the received acoustic pressure at the receiver for each operating frequency to generate the relationship curve between frequency and received pressure.
3.2.2. Experimental Result
To intuitively demonstrate the variation law of the received acoustic pressure with the operating frequency for the UWAPT system under cavitation constraints, this study has organized the simulation results of received acoustic pressure corresponding to different frequencies in Figure 4.
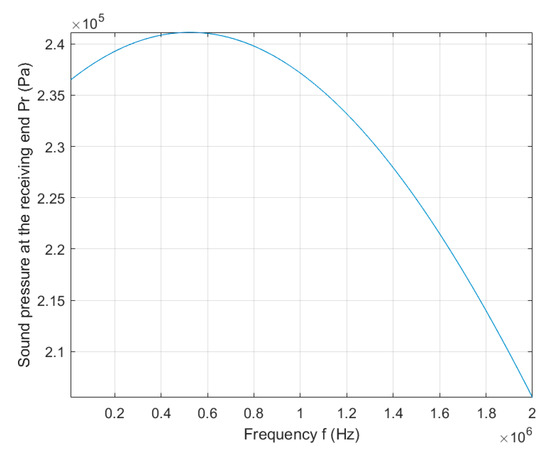
Figure 4.
The relationship between received sound pressure and frequency.
The simulation results, presented in Figure 4, illustrate the relationship between the operational frequency and the received acoustic pressure under the imposed cavitation avoidance constraint. The plot clearly shows a non-monotonic behavior: the received acoustic pressure initially increases with frequency, reaches a maximum, and then decreases.
At lower frequencies (approximately 10 kHz to 52 kHz), the received acoustic pressure increases due to the increasing cavitation threshold. Higher cavitation thresholds allow for higher transmitting pressure levels, compensating for acoustic absorption losses over the 1.3 m propagation distance. However, as the frequency increases beyond 52 kHz, the received acoustic pressure starts to decrease. This is attributed to the combined effects of the increasing acoustic absorption loss governed by Francois–Garrison Model and the limited increase in the cavitation threshold. At higher frequency, although the transmit pressure allowed by cavitation threshold increases, the effect is not as significant as at lower frequencies. The absorption loss rises rapidly. The maximum received acoustic pressure is found to be approximately 241,000 Pa at a frequency of 52.4 kHz.
This result demonstrates the existence of an optimal operating frequency for Underwater Wireless Ultrasonic Power Transfer systems to prevent acoustic cavitation. This frequency optimally balances the cavitation threshold and acoustic absorption loss, thereby maximizing the received acoustic pressure at the transducer.
Parametric analysis reveals that the optimal frequency varies with propagation distance and water properties, governed by the interplay between the medium-specific cavitation threshold and absorption characteristics. To implement frequency-optimized UWAPT systems, the proposed theoretical framework should be employed to determine context-dependent operating frequencies. A systematic parametric study of optimal frequencies under diverse conditions is subsequently presented.
These findings underscore the practical significance of frequency optimization in UWAPT design. Strategic frequency selection is critical to maximize harvested acoustic power while preventing cavitation-induced efficiency losses. The theoretical and simulation results provide essential insights into navigating the cavitation–absorption trade-off in underwater ultrasonic power transfer.
3.3. Dependence of the Optimal Frequency on Transmission Distance
This section investigates the dependence of the optimal operating frequency on the transmission distance, considering the constraint of cavitation prevention in the UWAPT system. Initially, the relationship between received sound pressure and frequency is analyzed for various transmission distances. Subsequently, the relationship between optimal frequency and transmission distance is examined, demonstrating a decreasing trend in optimal frequency with increasing distance, with a stabilizing effect at longer ranges. Furthermore, the impact of frequency selection within the practical operating range (below 1 MHz) is explored. The results reveal a heightened sensitivity of system performance to frequency choice at longer transmission distances, highlighting the critical importance of optimized frequency selection for efficient and reliable UWAPT operation, particularly for extended-range applications.
The analysis is based on numerical simulations utilizing the physical model and parameters described in Section 3.2, with the key parameters being liquid density, bubble radius, viscosity, surface tension, and hydrostatic pressure. The simulations explored a frequency range from 100 Hz to 10 MHz. The transmission distances ranged from 1.1 to 9.9 m.
The experiment analyzes the relationship between the received sound pressure and frequency under different transmission distances, and the obtained results are shown in Figure 5.

Figure 5.
The relationship between the received sound pressure and frequency at different transmission distances.
The graph shows that the received acoustic pressure decreases with increasing transmission distance, indicating greater signal attenuation over longer propagation paths. Furthermore, the frequency at which the peak pressure occurs, representing the optimal frequency, shows variations across the different transmission distances. Then we study the relationship between the optimal frequency and the transmission distance, and the experimental results are shown in Figure 6.
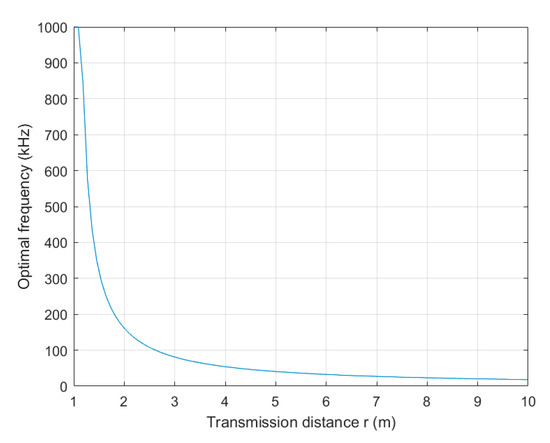
Figure 6.
The relationship between the optimal frequency and the transmission distance.
The results shown in Figure 6 indicate that the optimal frequency exhibits notable decreases with transmission distance within the shorter range, demonstrating a certain degree of fluctuation or slope. With the increase in transmission distance, the rate of decline of the optimal frequency gradually slows down, and the optimal frequency proceeds to stabilize.
Meanwhile, for longer transmission distances, the simulation suggests that optimal frequencies fall within a range that more closely aligns with the operational frequencies commonly employed in practical UWAPT systems. But the optimal frequency for shorter transmission distances falls within a higher, and less commonly used, ultrasonic frequency range. Therefore, we further simulate and analyze the received sound pressure variation within the common frequency range of practical UWAPT systems. Considering that the common frequency range of practical UWAPT systems is mostly below 1 MHz, to analyze the variation relationship between the received acoustic pressure, frequency, and transmission distance within this range, we have plotted the simulation results into Figure 7.
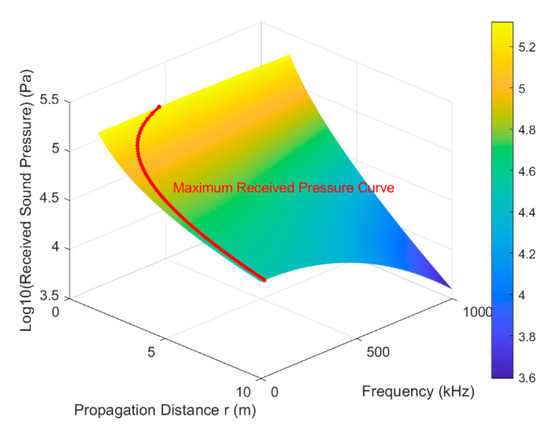
Figure 7.
Received sound pressure within practical frequency range.
The simulation results in Figure 7 demonstrate that within the practical frequency range, the received sound pressure exhibits a more pronounced frequency dependence as the transmission distance increases, implying that the system performance is more sensitive to the choice of operating frequency over longer transmission distances.
To quantify this effect, a relative pressure difference is calculated for each transmission distance. This metric represents the normalized difference between the maximum achievable sound pressure and the sound pressure at 1 MHz. The simulation results are shown in Figure 8.
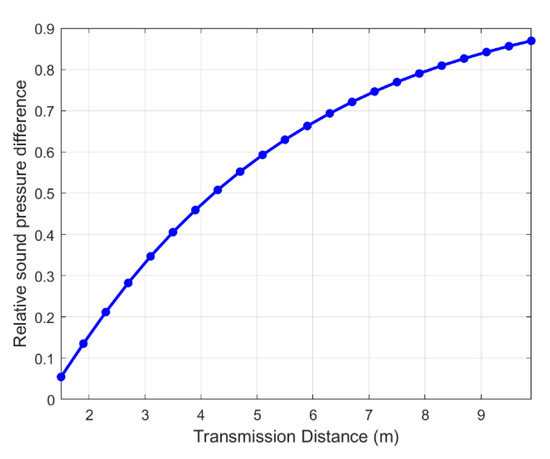
Figure 8.
The variation in the relative sound pressure difference with distance.
As shown in Figure 8, the relative pressure difference increases with transmission distance, indicating that the system performance becomes more sensitive to the choice of operating frequency at longer ranges. In other words, for a longer transmission range, a small deviation in frequency will result in a significant change in received acoustic pressure. This finding underscores the importance of careful frequency selection and optimization in UWAPT systems, especially when operating over extended distances. The system performance is more sensitive to frequency selection in longer transmission distance cases.
3.4. Dependence of the Optimal Frequency on Operational Depth and Salinity
This section details a numerical investigation into the influence of operational depth of the UWAPT system and salinity on the received acoustic pressure in a UWAPT system, considering the limitations imposed by cavitation avoidance. We numerically quantify received sound pressure versus frequency across operational depths and salinities, establishing a parameter dependence model of optimal frequency on depth and salinity for cavitation prevention.
A consistent set of parameters are used to represent typical seawater conditions: liquid density kg/m3, initial bubble radius m, liquid kinematic viscosity m2/s, surface tension N/m, atmospheric pressure Pa, water temperature °C, salinity , and propagation distance m. A frequency range from 10 kHz to 1 MHz, discretized into 200 points, was employed for both experiments.
The first experiment investigates the impact of specific water depths on the received acoustic pressure as a function of frequency. Three distinct depths are selected for comparison: 1 m, 10 m, and 20 m. The obtained result is as shown in Figure 9.
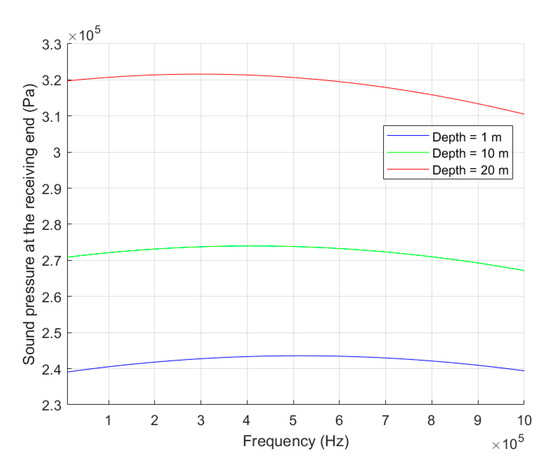
Figure 9.
The relationship between the received sound pressure and frequency at different depths.
The results are visualized in Figure 9, which depicts the received acoustic pressure as a function of frequency for the three distinct depths. Depth has an impact on both the cavitation threshold and the absorption loss. In the figure, the most prominent observation is that increasing the water depth leads to a noticeable increase in the received acoustic pressure across the considered frequency range. This enhancement is primarily attributable to the elevated hydrostatic pressure at greater depths, which consequently raises the cavitation threshold. This permits the use of higher transmitting pressures without inducing cavitation, resulting in a stronger received signal. Notably, the overall shape of the curves remains qualitatively similar across the different depths, suggesting that the fundamental relationship governing the interplay between frequency, cavitation threshold, and absorption loss is preserved, even as the magnitude of the received pressure scales with depth.
The second experiment focuses on quantifying the relationship between the optimal operating frequency and water depth. A range of depths from 1 m to 100 m was explored, with values sampled at 50 equally spaced points. The obtained result is as shown in Figure 10.
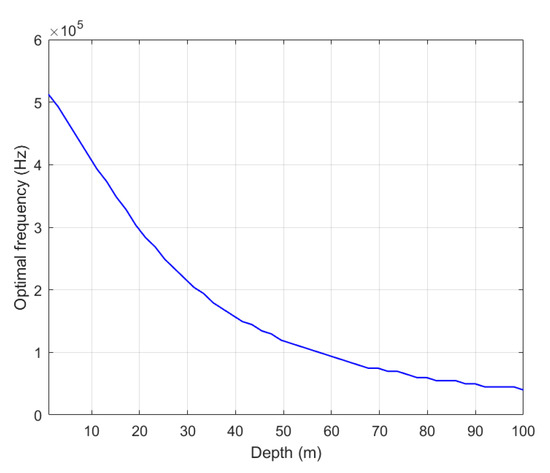
Figure 10.
The relationship between the optimal frequency and depth.
The results of experiment two are illustrated in Figure 10, which displays the relationship between the optimal frequency and water depth. In contrast to expectations based solely on cavitation threshold, the plot demonstrates that the optimal frequency generally decreases with increasing water depth. This trend is primarily driven by the increased acoustic absorption at higher frequencies. While the hydrostatic pressure does increase with depth, thereby raising the cavitation threshold and theoretically allowing for the use of higher frequencies, the concurrent increase in acoustic absorption at these higher frequencies outweighs the benefit. This trend’s theoretical cause lies in the coupled action of the linearized Rayleigh–Plesset cavitation threshold model and the Francois–Garrison acoustic absorption model. Francois–Garrison model’s characteristic of acoustic absorption increasing exponentially with frequency (dominated by the term) far overrides the weak absorption reduction from depth-induced changes in P2 and P3. At greater depths, the increased absorption necessitates a shift towards lower frequencies to minimize signal attenuation and maximize the received acoustic pressure. The optimal frequency, therefore, represents a trade-off between the allowable transmit power and the signal attenuation due to absorption, with the latter becoming the dominant factor at higher depths. The fact that frequency has to be lower to overcome the acoustic losses means that the pressure in the water will also drop.
This finding has critical implications for UWAPT system design. The optimal operating frequency should be dynamically adjusted to consider both the cavitation threshold and the frequency-dependent acoustic absorption characteristics, ensuring that the system operates at the most efficient point for a given deployment depth.
Salinity changes can affect the density and surface tension of seawater, thereby influencing both absorption attenuation and cavitation threshold. We explore the influence of salinity on the received acoustic pressure within a UWAPT system, considering the limitations imposed by cavitation avoidance. The study explores the received acoustic pressure as a function of frequency at discrete salinity levels and the relationship between the optimal operating frequency and salinity. The obtained result is as shown in Figure 11.
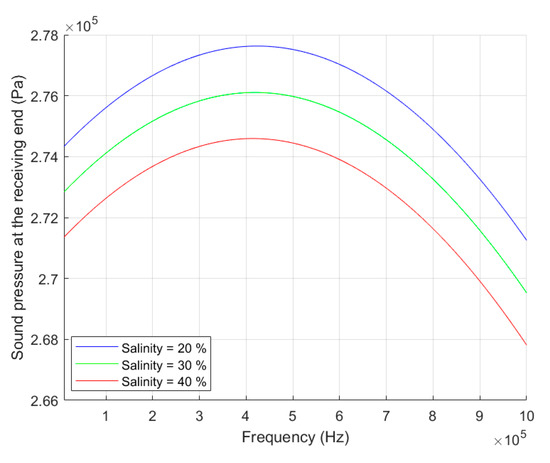
Figure 11.
The relationship between the received pressure and frequency at different salinities.
Figure 11 shows the variation in the influence of frequency on the received sound pressure under three specific salinities. It can be observed that increasing salinity will lead to a slight increase in the received sound pressure throughout the entire frequency range considered. To further quantify the influence trend of salinity changes on the optimal frequency, this study has organized the calculated optimal frequency results under different salinity conditions into Figure 12.
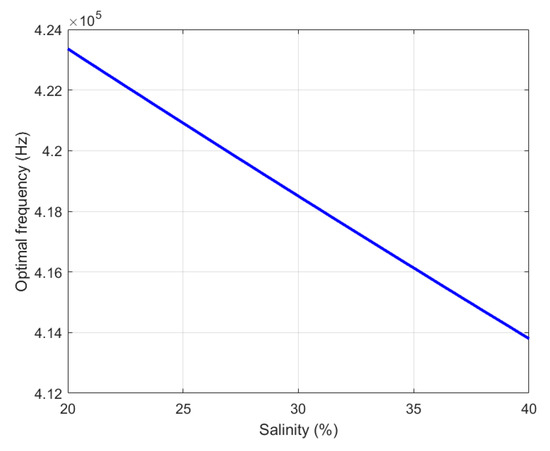
Figure 12.
The relationship between the optimal frequency and salinity.
The observed reduction in optimal operating frequency with increasing salinity arises from salinity-dependent modifications of fundamental seawater properties. Elevated salinity enhances seawater density and surface tension, which collectively elevates the cavitation threshold according to established acoustic principles—this is consistent with the linearized Rayleigh–Plesset model’s prediction of cavitation threshold being sensitive to these seawater properties. This threshold augmentation exhibits greater prominence at lower frequencies, effectively expanding the operational envelope for high-intensity transmission. Concurrently, while salinity-mediated sound speed variations marginally influence acoustic absorption, the inherent frequency-dependent attenuation profile continues to favor lower frequencies. This frequency-downshifting strategy fundamentally supports cavitation prevention while maximizing received acoustic pressure in saline-rich underwater environments.
3.5. Dependence of the Optimal Frequency on Dominant Cavitation Nucleus Radius
To explore the impact of cavitation nucleus size distribution on the frequency optimization of UWAPT systems, this section supplements a simulation experiment on the “correlation between dominant cavitation nucleus radius and optimal frequency under different marine environments”. This experiment illustrates the inherent relationship among “environmental parameters–dominant cavitation nucleus radius–optimal frequency” and further verifies the rationality of the proposed optimization method.
Cavitation nuclei (microbubble nuclei) in seawater do not distribute randomly; instead, they exhibit a “dominant radius” characteristic under the same environmental conditions—that is, the radius of most bubbles concentrates around a fixed value. Significant differences in dominant radius exist across different marine environments [26]: temperate coastal seas are in a medium-temperature and medium-salinity environment (temperature: 15 °C, salinity: 35%) with a medium dominant radius; deep seas (e.g., 100 m depth in the Pacific Ocean) are in a low-temperature, low-salinity, and high-hydrostatic-pressure environment (temperature: 4 °C, salinity: 34%) with a smaller dominant radius; polar seas are in an extremely low-temperature environment (temperature: 0 °C, salinity: 33%) with the smallest dominant radius. As a core parameter for calculating the cavitation threshold in the linearized Rayleigh–Plesset equation (Formula (11)), differences in directly alter the cavitation threshold, thereby affecting the trade-off between “cavitation avoidance and acoustic absorption suppression” and ultimately changing the optimal operating frequency of the UWAPT system.
Simulation experiments are designed for the three aforementioned typical marine environments, with the corresponding dominant cavitation nucleus radius as follows (Note: The following radius values are assumed based on the core rule that “dominant radii vary in different environments” and are not measured data): 1.0 μm for temperate coastal seas, 0.8 μm for deep seas, and 0.6 μm for polar seas. Our model is used to calculate the received acoustic pressure and optimal frequency for each environment, with the results shown in Figure 13.
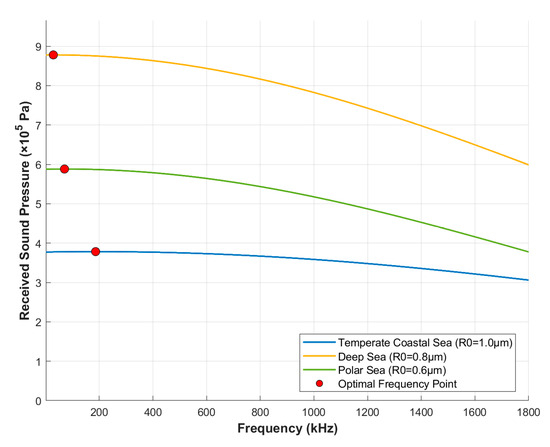
Figure 13.
Variations in received acoustic pressure with frequency under different marine environments (with corresponding dominant bubble radius).
The results show that in the temperate coastal sea environment , the optimal frequency is 186.3 kHz and the maximum received acoustic pressure is 3.78 × 10⁵ Pa; in the deep sea environment , the optimal frequency is 28.7 kHz and the maximum received acoustic pressure is 8.78 × 10⁵ Pa; in the polar sea environment , the optimal frequency is 70.3 kHz and the maximum received acoustic pressure is 5.88 × 10⁵ Pa. These results confirm that the dominant cavitation nucleus radius, as a key factor in cavitation threshold calculation, directly determines the optimal frequency. For example, the smaller dominant radius in the deep sea environment reduces the cavitation threshold, requiring a lower optimal frequency to balance cavitation risks and acoustic absorption losses.
This experiment not only verifies the environmental dependence of cavitation nucleus distribution in seawater but also provides support for the frequency optimization framework: the proposed “frequency optimization method incorporating environmental parameters” inherently implies the correlation logic of “environmental parameters–dominant cavitation nucleus radius”—temperature, salinity, and depth parameters in different environments affect the dominant cavitation nucleus radius of the corresponding environment, thereby guiding the calculation of the optimal frequency. Ignoring such distribution differences would increase the calculation error of the optimal frequency, while the framework in our study effectively avoids this issue by dynamically correlating environmental parameters with the dominant radius.
3.6. Performance Enhancement with the Optimal Frequency Selection
This section demonstrates the performance gains achieved by utilizing the proposed frequency optimization method in a typical underwater environment. We simulate a UWAPT system operating with and without the optimized frequency to quantify the improvement in received power across various operational depths. The results showcase the significant potential for enhancing system efficiency through intelligent frequency selection proposed in Section 2.
The simulations are conducted using the parameters outlined in previous sections, including a water temperature of 20 °C, salinity of 35%, and a transmission distance of 10 m. The operational depths vary from 5 m to 50 m. The frequency range is set from 1 kHz to 2 MHz. A non-optimized frequency of 200 kHz is chosen for comparison. The percentage increase in received power is calculated by comparing the received power at the optimized frequency with the received power at the non-optimized frequency. Sound power is proportional to the square of the sound pressure. To quantify the power improvement effect of the frequency optimization method proposed in this study under different operating depths, we have presented the comparison results of received power between the optimal frequency and non-optimized frequency in Figure 14.
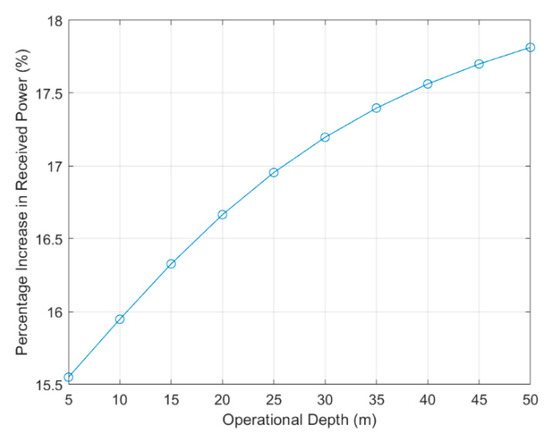
Figure 14.
Percentage increase in power with the frequency optimization method across different operational depths.
The simulation results, as presented in Figure 14, illustrate the percentage increase in received power achieved by employing the optimal frequency compared to the fixed, non-optimal frequency across different operating depths. The results show that increasing the operating depth increases the percentage of received power. Specifically, at an operating depth of 50 m and a transmission distance of 10 m, the optimal frequency obtained through the frequency optimization method results in a 17.8% increase in received power compared to using the non-optimized frequency.
These findings highlight the substantial practical advantages of the proposed frequency optimization method for UWAPT systems. By dynamically adjusting the operating frequency based on the underwater environmental conditions, our approach enables a considerable increase in received power. Consequently, the overall efficiency of wireless power transfer is significantly improved.
3.7. Comparison of Different Frequency Selection Strategies
To highlight the advantages and innovativeness of the proposed method, two typical frequency selection strategies are supplemented for comparison: the “fixed frequency without optimization” (a common choice in engineering practice) and the “traditional gradient descent method” (a classic first-order optimization approach). Together with the BFGS method outlined in this paper, they form a comparative system, and the superiority of the BFGS method is verified through rigorous simulations.
All three comparative strategies are based on the same physical models (the linearized Rayleigh–Plesset cavitation threshold model and the Francois–Garrison acoustic absorption model) and identical environmental parameters (depth range: 5–30 m, transmission distance: 15 m) to ensure comparison fairness. Specifically, the strategy without optimization fixes the frequency at 200 kHz, representing an engineering initial choice with no adaptive capability and no iterative calculation required. The traditional gradient descent method dynamically updates the frequency based on the first-order gradient of the “power–frequency” relationship with adaptive step-size adjustment, representing a classic optimization scheme with low computational complexity but limited precision. In contrast, the BFGS method predicts the optimal direction using the second-order Hessian matrix of the quasi-Newton method and combines line searches to ensure convergence, representing the “balance between high precision and high efficiency” optimization scheme adopted in this study.
In the field of acoustics, received power is proportional to the square of the acoustic pressure amplitude. Thus, in the following simulations, the square of the received acoustic pressure is used to represent the received power for simplified calculation and result presentation. The received power (represented by the square of acoustic pressure) of the three frequency selection strategies at different depths from simulations is shown in Figure 15.
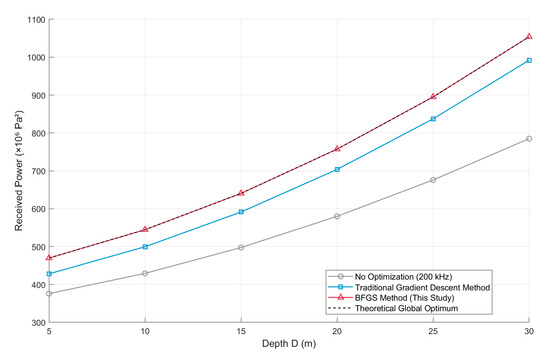
Figure 15.
Comparison of received power for three frequency selection strategies at different depths.
As observed from Figure 15, within the typical deployment depth range of Underwater Wireless Sensor Network (UWSN) nodes, the received power performance of the BFGS method is significantly superior to the other two strategies and almost coincides with the “theoretical global optimum” (black dashed line), intuitively demonstrating its capability to approach the globally optimal frequency. The strategy without optimization consistently exhibits the lowest received power because fixing the frequency at 200 kHz completely ignores the coupling relationship among “cavitation threshold–frequency–acoustic absorption”, leading to an inherent deficiency in energy transmission efficiency. Taking a depth of 25 m as an example, its received power is only approximately 680 × 106 Pa2, suffering a loss of over 32% compared to the BFGS method (approximately 900 × 106 Pa2). Although the traditional gradient descent method achieves a notable improvement over the non-optimized strategy, there remains a gap with the BFGS method: at a depth of 25 m, its received power is about 830 × 106 Pa2, and the BFGS method yields an improvement of approximately 8.4% relative to it. In contrast, the received power of the BFGS method in this paper always closely follows the “theoretical global optimum”, reaching approximately 1.05 × 10⁹ Pa2 at a depth of 30 m, which fully approaches the globally optimal power.
Meanwhile, a quantitative table covering three core dimensions—“power precision, convergence efficiency, and frequency-tracking precision”—is derived via simulations, as presented in Table 1.

Table 1.
Quantitative comparison of three frequency selection strategies in core performance dimensions.
The advantages of the BFGS method can be further quantified from Table 1. Taking a depth of 30 m as an example, the BFGS method converges to the theoretically optimal frequency of 53.00 kHz with only nine iterations, and the received power reaches 1.05 × 10⁹ Pa2 without any power loss. In contrast, the non-optimized strategy (fixing frequency at 200 kHz) achieves a power of only 7.85 × 10⁸ Pa2 (with a 25.50% loss). After more than one thousand iterations, the traditional gradient descent method still stagnates at the locally optimal frequency of 114.98 kHz, with a power of 9.92 × 10⁸ Pa2 (with a 5.85% loss). These simulation results fully verify the comprehensive superiority of the BFGS method in “precision–efficiency”.
From the cost dimension, the BFGS method achieves a favorable balance between cost and performance. Its computational cost mainly comes from gradient calculation (Equation (21)) and inverse Hessian matrix update (Equation (22)) per iteration, but the total overhead is controllable due to there being only nine iterations—this is compatible with the 32-bit microcontrollers commonly used in UWAPT hardware. In terms of deployment cost, it only requires initializing the frequency search range and convergence tolerance, without complex parameter tuning. By contrast, the non-optimized strategy, though lowest in cost, incurs a 17.8% power loss (Section 3.6) as a severe performance cost; the traditional gradient descent method has much higher computational cost (over 1000 iterations) and fails to meet real-time adjustment needs. Overall, the marginal cost increase in the BFGS method is negligible compared to its performance gains in eliminating power loss and ensuring efficiency, making it highly suitable for practical UWAPT deployment.
3.8. Convergence Stability Validation of the Frequency Optimization Algorithm
To validate the convergence stability of the proposed BFGS-based frequency optimization algorithm—a critical prerequisite for ensuring the reliability of UWAPT systems, as optimization models may converge to different values due to random initial conditions or operator variations—supplementary simulation experiments were conducted. These experiments aimed to verify whether the algorithm consistently converges to stable results under random initial frequencies and to quantify the variability of key output metrics (received power, optimal frequency, and convergence speed) across multiple runs.
The experimental design strictly controlled core physical and environmental parameters to align with the main study, ensuring consistency in validation conditions. Seawater physical properties were set as follows: liquid density , initial bubble radius , salinity , and temperature ; the transmission distance was fixed at to eliminate the interference of distance-dependent attenuation on convergence analysis. To mimic the uncertainty of initial frequency settings in practical deployment, initial frequencies were randomly sampled from a wide range of 50–150 kHz. For each target depth (5 m, 10 m, 15 m, 20 m, 25 m, 30 m), 30 independent simulation runs were performed to capture statistical variability. Convergence criteria were designed to balance precision and engineering feasibility: two complementary thresholds were adopted—a relative change in received power of (i.e., 0.1%, ensuring the objective function meets UWAPT operational precision) and a frequency update of 50 Hz (avoiding over-iteration when the optimal frequency stabilizes). A maximum of 5000 iterations was also set to ensure the algorithm sufficiently explores the frequency space, preventing premature convergence to local extrema caused by initial fluctuations.
In this experiment, received power was characterized using the square of the received acoustic pressure. Statistical results of received power, optimal frequency, and iteration counts across 30 repeated runs at different depths are presented in Table 2, Table 3, and Table 4, respectively.

Table 2.
Statistical results of received power.

Table 3.
Statistical results of optimal frequency.

Table 4.
Statistical results of iteration counts.
As shown in Table 2, the received power—the core objective function of the optimization—exhibits negligible variability across 30 repetitions for all depths. At 5 m depth, the minimum and maximum received power are identical (4.70 × 10⁸ Pa2) with a coefficient of variation (CV) of only 0.0302%; even at 25 m depth (the largest CV among all depths), the value remains as low as 0.0497%. This indicates that regardless of random initial frequency settings, the algorithm consistently converges to a stable optimal power level, and the variability is far below the threshold that would impact practical UWAPT performance.
For the optimal frequency (Table 3), high convergence consistency is also observed. The standard deviation of the optimal frequency across 30 runs is less than 900 Hz for all depths: 635.1 Hz at 5 m and 885.9 Hz at 25 m. When compared to the theoretical global optimal frequency, the relative error is mostly below 0.3% (e.g., 0.0886% at 5 m and 0.0272% at 20 m). Even at 15 m and 25 m depths—where the relative theoretical errors are slightly larger (3.6160% and 3.3477%, respectively)—such deviations fall within the acceptable range for UWAPT systems, as they do not significantly affect power transfer efficiency or the actual operational performance of the system.
Convergence speed, another key indicator of algorithm stability, is summarized in Table 4. For all depths, convergence is achieved within 5–11 iterations, with an average of 9–10 iterations. No runs failed to converge (all completed within the maximum 5000 iterations), further confirming the algorithm’s reliability in practical deployment scenarios.
While the BFGS-based optimization method does not converge to exactly identical numerical values (attributed to minor randomness in initial frequencies and line-search step sizes), the deviations are statistically negligible and well within the tolerance required for practical UWAPT systems. The high stability of received power, optimal frequency, and convergence speed across 30 repeated experiments confirms that the proposed algorithm is robust to random initial conditions and operator variations, providing a reliable basis for its application in real-world UWAPT systems. It is noted that real UWAPT systems exhibit nonlinearity (e.g., bubble oscillation); however, the mathematical models in our study are not abstract constructs—their simplifications, parameter selections, and applicability boundaries are all grounded in the practical operating conditions of real UWAPT systems. Despite the presence of such nonlinearity in real systems, the models are specifically designed to capture the core frequency–cavitation–absorption relationships that govern optimal frequency selection.
3.9. Applications for Frequency Optimization Method in Typical Underwater Environments
In this study, two extreme real underwater environments and a typical oceanic environment are experimentally analyzed to investigate the equilibrium relationship between cavitation threshold and acoustic absorption. Meanwhile, the study presents the optimal frequencies and maximum received sound pressure under cavitation prevention in three real environments.
To comprehensively evaluate the performance of the proposed frequency optimization method, simulations are conducted across three representative underwater environments. These included the Red Sea, Lake Baikal, and a canonical mean ocean environment. The Red Sea is selected as a high-absorption environment, characterized by elevated salinity levels (41%) and temperatures approaching 30 °C [27]. The Red Sea’s unique geographical and hydrological features—its subtropical location promoting high evaporation, limited freshwater input due to minimal precipitation, and a semi-enclosed topography (connected only via the Bab-el-Mandeb Strait and the Suez Canal), collectively contribute to exceptionally high acoustic absorption. In contrast, Lake Baikal is chosen to represent low-absorption environments, distinguished by its ultra-low salinity (1%), near-freezing bottom temperatures (≈4 °C), and substantial hydrostatic pressure [28]. Finally, a typical oceanic environment, defined by typical oceanic parameters (salinity: 35%, temperature: 20 °C) is included for comparative analysis.
To assess UWAPT system performance under cavitation constraints, simulations are conducted across these diverse environments, quantifying the relationship between received sound pressure and frequency. We have plotted the simulation results of the relationship between received acoustic pressure and frequency in the Red Sea, Lake Baikal, and a typical ocean environment in Figure 16.
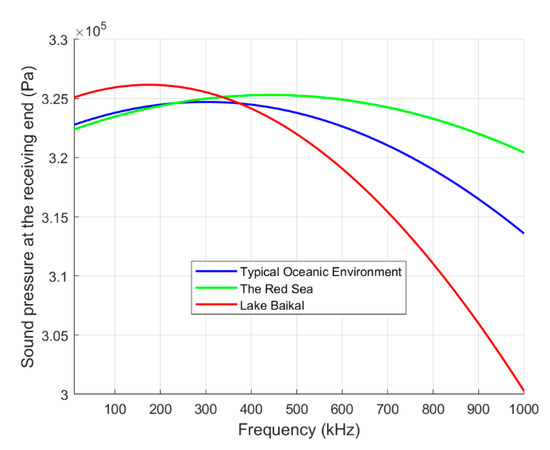
Figure 16.
Received sound pressure in different underwater environments.
The observed optimal frequency hierarchy (Lake Baikal < typical ocean < Red Sea) arises from competing acoustic attenuation and cavitation threshold mechanisms governed by environmental parameters. Lower salinity and colder temperatures in Lake Baikal reduce both sound absorption and cavitation thresholds, forcing the system toward lower frequencies to avoid cavitation-induced losses despite inherently favorable low-attenuation conditions. Conversely, the Red Sea’s elevated salinity and temperature significantly increase cavitation thresholds through enhanced surface tension and reduced gas solubility, permitting safe operation at higher frequencies where absorption penalties are offset by greater transmit pressure tolerance. The canonical ocean environment exhibits intermediate characteristics, balancing moderate absorption and cavitation constraints at mid-range frequencies.
Finally, based on our proposed frequency optimization method, the optimal operating frequencies for the UWAPT system in each of the three representative underwater environments are presented in Table 5.

Table 5.
The optimal frequency in different underwater environments.
4. Conclusions and Future Works
In conclusion, this study presents a novel and robust frequency optimization framework for UWAPT systems, addressing the critical challenge of acoustic cavitation while simultaneously maximizing power transfer efficiency. By integrating the linearized Rayleigh–Plesset equation for cavitation modeling with the Francois–Garrison acoustic absorption model, our approach quantifies the fundamental trade-off between cavitation thresholds and frequency-dependent attenuation. This represents the integrated solution to this key challenge in UWAPT design.
Numerical simulations, validated across diverse underwater environments and varying conditions, reveal that optimal operating frequencies are not static, but rather dynamically dependent on environmental parameters. Specifically, increased water depth necessitates a shift towards lower frequencies due to increased acoustic absorption, while elevated salinity leads to a similar reduction in optimal frequency. Furthermore, at longer transmission ranges, system performance becomes more sensitive to frequency selection, emphasizing the need for careful optimization. The practical benefit of our frequency optimization method to achieve a 17.8% increase in received power at a transmission distance of 10 m and an operating depth of 50 m, relative to a non-optimized frequency, clearly demonstrates its effectiveness in improving UWAPT system performance. This framework has been applied to analyze real-world scenarios, determining the optimal frequencies and maximizing received sound pressure in environments like the Red Sea, Lake Baikal, and a typical ocean environment.
While simulations provide valuable insights into the interplay between frequency, cavitation, and absorption, translating this theoretical framework into practical applications and verifying its performance remain key priorities for future research. Future efforts will focus on two interconnected directions: enhancing adaptability to complex Underwater Wireless Sensor Networks (UWSNs) and conducting phased experimental validation.
For UWSN practical adaptability, four core measures will be implemented: first, develop an environment-aware multi-node frequency management system—adopting a streamlined BFGS algorithm for unified/differentiated frequency allocation (suppressing co-frequency interference) and integrating a dynamic load response sub-module for real-time frequency fine-tuning; second, construct a multi-hop link segmented optimization mechanism—decomposing long paths into short hops, selecting adaptive frequencies per hop, and establishing “per-hop threshold control + multi-hop loss accumulation” logic; third, build a cross-layer collaboration framework—adapting MAC-layer transmission duty cycles and routing-layer weights based on BFGS-optimized frequencies to form holistic energy management logic; and fourth, design a BFGS-based adaptive frequency controller (embedded in gateways/energy hubs) for real-time environmental data collection, optimal frequency updates, and emergency fault tolerance.
Phased experimental validation will bridge simulation and engineering practice: the first phase will use an underwater tank to build a single-link UWAPT system, verifying the BFGS method’s power improvement in practical conditions; and the second phase will develop UWSN node prototypes with integrated BFGS modules, deploy a small-scale network, and test multi-node frequency coordination—confirming hardware compatibility and scenario adaptability.
Additionally, future work will explore integrating adaptive control algorithms for real-time frequency adjustment (aligning with dynamic environments) and investigating the influence of transducer design/array configurations on optimal frequency selection—further enhancing the framework’s robustness and engineering value for UWAPT systems.
Author Contributions
Conceptualization, Y.L. and T.Z.; methodology, Y.L.; software, Y.L.; validation, Y.L. and T.Z.; formal analysis, Z.L.; investigation, Y.L., Y.G. and Z.L.; resources, N.M.; data curation, Y.L.; writing—original draft preparation, Y.L.; writing—review and editing, Y.G. and N.M.; visualization, T.Z.; supervision, Y.G. and Z.L.; project administration, Y.G.; funding acquisition, N.M. All authors have read and agreed to the published version of the manuscript.
Funding
This research was supported by National Natural Science Foundation of China (No. 62271344).
Data Availability Statement
The original contributions presented in this study are included in the article. Further inquiries can be directed to the corresponding author.
Acknowledgments
The authors gratefully acknowledge the National Natural Science Foundation of China.
Conflicts of Interest
The authors declare no conflicts of interest.
References
- Yang, L.; Li, X.; Zhang, Y.; Feng, B.; Yang, T.; Wen, H.; Tian, J.; Zhu, D.; Huang, J.; Zhang, A.; et al. A review of underwater inductive wireless power transfer system. IET Power Electron. 2024, 17, 894–905. [Google Scholar] [CrossRef]
- Lin, M.; Zhang, F.; Yang, C.; Li, D.; Lin, R. Design of bidirectional power converters coupled with coils for wireless charging of AUV docking systems. J. Mar. Sci. Technol. 2022, 27, 873–886. [Google Scholar] [CrossRef]
- Mohsan, S.A.H.; Khan, M.A.; Mazinani, A.; Alsharif, M.H.; Cho, H.-S. Enabling underwater wireless power transfer towards sixth generation (6g) wireless networks: Opportunities, recent advances, and technical challenges. J. Mar. Sci. Eng. 2022, 10, 1282. [Google Scholar] [CrossRef]
- Liu, Y.; Li, B.; Pan, L.; Yao, S.; Dong, Z.; Zhang, J.; Zhu, C.; Cui, S. Review on Development and Research of Underwater Capacitive Power Transfer. Energies 2024, 17, 6496. [Google Scholar] [CrossRef]
- Liu, Z.; Li, F.; Tao, C.; Li, S.; Wang, L. Design of wireless power transfer system for autonomous underwater vehicles considering seawater eddy current loss. Microsyst. Technol. 2021, 27, 3783–3792. [Google Scholar] [CrossRef]
- Guida, R.; Demirors, E.; Dave, N.; Melodia, T. Underwater ultrasonic wireless power transfer: A battery-less platform for the internet of underwater things. IEEE Trans. Mob. Comput. 2020, 21, 1861–1873. [Google Scholar] [CrossRef]
- Liu, Z.; Zhang, T.; Yuan, Y.; Li, Y.; Geng, Y. Evaluation Method for Underwater Ultrasonic Energy Radiation Performance Based on the Spatial Distribution Characteristics of Acoustic Power. Sensors 2024, 24, 3942. [Google Scholar] [CrossRef]
- Zhu, Y.; Moheimani, S.O.R.; Yuce, M.R. Ultrasonic energy transmission and conversion using a 2-D MEMS resonator. IEEE Electron Device Lett. 2010, 31, 374–376. [Google Scholar] [CrossRef]
- Zhao, Y.; Du, Y.; Wang, Z.; Wang, J.; Geng, Y. Design of ultrasonic transducer structure for underwater wireless power transfer system. In Proceedings of the 2021 IEEE Wireless Power Transfer Conference (WPTC), San Diego, CA, USA, 1–4 June 2021; IEEE: Piscataway, NJ, USA, 2021; pp. 1–4. [Google Scholar]
- Liu, L.; Abdulla, W.H. Optimizing Ultrasonic Wireless Power Transfer Systems: Theoretical and Experimental Analysis of Piezoelectric Transducer Resonance. IEEE Sens. J. 2025, 25, 10694–10706. [Google Scholar] [CrossRef]
- Liu, Z.; Zhang, T.; Geng, Y.; An, T. Underwater wireless high-efficiency energy transmission method based on the ultrasonic transducer array. In Proceedings of the 2021 IEEE 21st International Conference on Communication Technology (ICCT), Tianjin, China, 13–16 October 2021; IEEE: Piscataway, NJ, USA, 2021. [Google Scholar]
- Richards, S.D. The effect of temperature, pressure, and salinity on sound attenuation in turbid seawater. J. Acoust. Soc. Am. 1998, 103, 205–211. [Google Scholar] [CrossRef]
- Tiong, T.J.; Chu, J.K.; Tan, K.W. Advancements in Acoustic Cavitation Modelling: Progress, Challenges, and Future Directions in Sonochemical Reactor Design. Ultrason. Sonochem. 2025, 112, 107163. [Google Scholar] [CrossRef]
- Maciulevičius, M.; Ragaišė, D.; Rulinskaitė, R.; Raišutis, R.; Svilainis, L.; Chaziachmetovas, A.; Saleniece, K.; Šatkauskas, S. Ca2+ Delivery into Cell Suspension and Spheroid Models via Ultrasound-induced Inertial Cavitation. J. Drug Deliv. Sci. Technol. 2025, 111, 107132. [Google Scholar] [CrossRef]
- Yusof, N.S.M.; Babgi, B.; Alghamdi, Y.; Aksu, M.; Madhavan, J.; Ashokkumar, M. Physical and chemical effects of acoustic cavitation in selected ultrasonic cleaning applications. Ultrason. Sonochem. 2016, 29, 568–576. [Google Scholar] [CrossRef]
- Fang, L.H.; Rahim, R.A.; Fahmi, M.I.; Kupusamy, V. Modelling and Characterization Piezoelectric Transducer for Sound Wave Energy Harvesting. J. Adv. Res. Fluid Mech. Therm. Sci. 2023, 103, 81–98. [Google Scholar] [CrossRef]
- Xu, H.; He, Z.; Shi, Q.; Gao, J.; Zhou, T. Transmitting beam control method of underwater acoustic transducer array based on global optimization. IEEE Sens. J. 2023, 23, 17491–17498. [Google Scholar] [CrossRef]
- Liu, Z.; Zhang, T.; Li, Y.; Yuan, Y.; Mahmud, N.; Geng, Y. Dynamic Frequency Optimization for Underwater Acoustic Energy Transmission: Balancing Absorption and Geometric Diffusion in Marine Environments. J. Mar. Sci. Eng. 2025, 13, 1089. [Google Scholar] [CrossRef]
- Ma, Y.; Liang, B.; Wang, J.; Cheng, B.; Yan, Z.; Dong, M.; Mao, Z. A Novel Hill Climbing-Golden Section Search Maximum Energy Efficiency Tracking Method for Wireless Power Transfer Systems in Unmanned Underwater Vehicles. J. Mar. Sci. Eng. 2024, 12, 1336. [Google Scholar] [CrossRef]
- Zuo, C.; Yang, M.; Li, S. Frequency tracking of piezoelectric transducer based on the current and phase difference. J. Appl. Acoust. 2016, 35, 189–194. [Google Scholar]
- Felemban, E. Acoustic frequency optimization for underwater wireless sensor network. Int. J. Adv. Comput. Sci. Appl. 2020, 11, 642–648. [Google Scholar] [CrossRef]
- Nguyen, T.T.; Asakura, Y.; Koda, S.; Yasuda, K. Dependence of cavitation, chemical effect, and mechanical effect thresholds on ultrasonic frequency. Ultrason. Sonochem. 2017, 39, 301–306. [Google Scholar] [CrossRef]
- Sponer, J. Dependence of the cavitation threshold on the ultrasonic frequency. Czechoslov. J. Phys. 1990, 40, 1123–1132. [Google Scholar] [CrossRef]
- Franc, J.P. The Rayleigh-Plesset equation: A simple and powerful tool to understand various aspects of cavitation. In Fluid Dynamics of Cavitation and Cavitating Turbopumps; Springer: Vienna, Austria, 2007; pp. 1–41. [Google Scholar]
- Francois, R.E.; Garrison, G.R. Sound absorption based on ocean measurements. Part II: Boric acid contribution and equation for total absorption. J. Acoust. Soc. Am. 1982, 72, 1879–1890. [Google Scholar] [CrossRef]
- Yount, D.E.; Gillary, E.W.; Hoffman, D.C. A microscopic investigation of bubble formation nuclei. J. Acoust. Soc. Am. 1984, 76, 1511–1521. [Google Scholar] [CrossRef]
- Le Menn, M.; Albo, P.A.G.; Lago, S.; Romeo, R.; Sparasci, F. The absolute salinity of seawater and its measurands. Metrologia 2018, 56, 015005. [Google Scholar] [CrossRef]
- Hamilton, E.L. Sound attenuation as a function of depth in the sea floor. J. Acoust. Soc. Am. 1976, 59, 528–535. [Google Scholar] [CrossRef]
Disclaimer/Publisher’s Note: The statements, opinions and data contained in all publications are solely those of the individual author(s) and contributor(s) and not of MDPI and/or the editor(s). MDPI and/or the editor(s) disclaim responsibility for any injury to people or property resulting from any ideas, methods, instructions or products referred to in the content. |
© 2025 by the authors. Licensee MDPI, Basel, Switzerland. This article is an open access article distributed under the terms and conditions of the Creative Commons Attribution (CC BY) license (https://creativecommons.org/licenses/by/4.0/).