Article

CFD-Based Estimation of Ship Waves in Shallow Waters

Department of Naval Architecture and Ocean Engineering, Kunsan National University, Gunsan 54151, Republic of Korea
*
Author to whom correspondence should be addressed.
J. Mar. Sci. Eng. 2025, 13(10), 1965; https://doi.org/10.3390/jmse13101965
Submission received: 12 September 2025 / Revised: 1 October 2025 / Accepted: 13 October 2025 / Published: 14 October 2025
(This article belongs to the Section Ocean Engineering)

Abstract

This study examines the evolution characteristics of ship waves generated by large vessels in shallow waters. A CFD-based numerical wave tank, incorporating Torsvik’s ship wave theory, was developed using the VOF multiphase approach and the RNG k-ε turbulence model to capture free-surface evolution and turbulence effects. Results indicate that wave heights vary significantly near the critical depth-based Froude number ( F h ). Comparative analyses between CFD results for a Wigley hull and proposed empirical correction formulas show strong agreement in predicting maximum wave heights in transcritical and supercritical regimes, accurately capturing the nonlinear surge of wave amplitude in the transcritical range. Simulations of 2000-ton and 6000-ton class vessels further reveal that wave heights increase with F h , peak in the transcritical regime, and subsequently decay. Lateral wave attenuation was also observed with increasing transverse distance, highlighting the role of vessel dimensions and bulbous bow structures in modulating wave propagation. These findings provide theoretical and practical references for risk assessment and navigational safety in shallow waterways.

1. Introduction

Since the ship wave problem was first proposed in the 19th century, it has gradually attracted widespread attention from scholars and engineers. With the continuous improvement of inland waterway systems and the increasing application of large-tonnage and high-speed vessels in major countries, the issue of ship waves in nearshore ports and narrow waterways has become increasingly significant. In recent years, the trend toward larger vessels has substantially increased cargo capacity per ship, but the development of port infrastructure has lagged behind, resulting in shoreline water depths often failing to meet the draft requirements of large vessels, making terminals more vulnerable to disturbances caused by ship waves [1]. Additionally, the rapid development of high-speed and novel ships has further intensified the impact on ports and coastal structures, highlighting ship waves in shallow waterways as a major research focus.
With the development of inland waterway transport and the trend toward larger, faster vessels, ship waves present three major issues. First, they increase ship resistance—wave-making can account for over 50% of total resistance in high-speed vessels—making wave reduction essential for performance and efficiency. Second, strong waves threaten ports, channels, and moored ships; in busy or tourist waters, high-speed vessels passing nearby can endanger fishing or construction ships, causing severe rolling or capsizing. Third, they erode and destabilize channel banks, especially in narrow waterways and canals, where long-term scour leads to slope failure, farmland loss, siltation, and higher maintenance costs.
Ship waves are a common phenomenon in Figure 1, but systematic research on ship waves has a history of only about a century. Traditional analyses have mainly relied on theoretical formulations, yielding certain theoretical achievements. Model tests and field observations have also played an important role in ship wave research by providing extensive experimental data, compensating for the limitations of theoretical approaches, and leading to the development of various empirical formulas describing ship wave characteristics, particularly wave height and period. However, these formulas are often limited to specific river conditions.
Kelvin [3] first established deep-water ship wave theory in 1887 using a moving pressure point model, revealing transverse and divergent wave mechanisms. Havelock [4] improved this with a finite pressure distribution in 1908, while Hönl [5] later introduced distributed sources for analytical solutions. In the 1960s, Wehausen and Laitone [6] advanced potential flow analyses, with Ursell [7] removing singularities via Airy function expansions and Kombiadze [8] extending the theory to viscous fluids. A major breakthrough came with Dawson [9], whose Rankine source method overcame integral singularities and became central to numerical ship wave computation.
The early studies on numerical simulation of ship waves focused on solitary waves and wave height prediction. Ertkin [10] revealed the role of the Froude number in the formation of solitary waves, Kazi [11] applied Delft2D-Rivers for channel flows, and Wu et al. [12] quantified resistance and interaction forces between ships.
Research on hydrodynamic interactions between ships is essential for ensuring navigational safety and optimizing maneuverability, with its development evolving from early potential flow models to modern high-fidelity simulations integrated with experimental approaches. Havelock [4] established a deep-water interaction model, later extended to shallow waters by Davis & Geer and Kijima et al. [13,14], highlighting nonlinear and geometric effects on lateral forces. Experimental studies advanced with Vantorre, Lataire, Swiegers, and Miller [15,16,17,18], providing empirical formulas, motion coupling insights, and validation of prediction methods.
With the advancement of Computational Fluid Dynamics (CFD) and multiphysics coupling methods, recent studies have provided new insights into ship wave simulation and applications. Mursid et al. [19] systematically reviewed coupled hydrodynamic–structural approaches, emphasizing that two-way fluid–structure interaction has become an important tool for assessing wave loads and structural responses in shallow and confined waters. Zhang et al. [20] employed CFD to investigate the influence of drift angle on hull–propeller–rudder interactions, highlighting nonlinear flow features and their effects on wave propagation under maneuvering conditions. In the field of ship design and optimization, Htein et al. [21] summarized the applications of artificial intelligence (AI) methods in hydrodynamics, noting their potential in resistance prediction and hull optimization, particularly when combined with physics-based models. Furthermore, Bagazinski et al. [22] introduced the ShipGen diffusion model, enabling data-driven hull generation and optimization, which reflects the growing trend toward intelligent and data-driven approaches in ship wave research.
Although significant progress has been made in numerical and experimental studies on ship waves, several limitations remain. Most existing works still focus on idealized hull forms or scaled models, providing limited insight into the generation and propagation of ship waves by large vessels in shallow and confined waters. In addition, conventional empirical formulas show reduced accuracy in transcritical and supercritical regimes, where wave height evolution and energy decay are often poorly captured.
To address these gaps, the present study offers several innovations. First, a high-fidelity CFD model based on turbulence-governed equations is developed to more accurately capture ship wave characteristics of large vessels in shallow water. Second, modified empirical formulas are proposed for transcritical and supercritical flow regimes, improving the prediction of wave peaks and attenuation. Finally, comparative analyses of 2000-ton and 6000-ton vessels are conducted to clarify the role of vessel tonnage and hull geometry in shaping wave propagation and attenuation patterns.
This paper follows a progressive structure: Section 2 outlines the theoretical background of ship waves; Section 3 describes the numerical model and validation methods; Section 4 analyzes the wave characteristics of 2000- and 6000-ton vessels using the modified empirical formulas; and Section 5 summarizes the key findings and discusses their practical implications.

2. Ship Wave Theory

2.1. Fundamental Theory of Ship Waves

During navigation, hull–water interaction produces complex hydrodynamic effects, with wave-making as a major nonlinear phenomenon governed by ship speed, hull form, and water depth. This process influences resistance, maneuverability, and environmental impact.
Kelvin’s theory divides the ship wave system into bow and stern wave groups within a sector-shaped region. Bow waves arise from surface elevation due to flow compression, while stern waves reflect compensatory depressions. Both include divergent and transverse components shaped by hull geometry. Divergent waves spread laterally and dominate ship–ship interference, while transverse waves align with the sailing direction, creating a cusp region of maximum amplitude at about 19°28′. The wave pattern depends strongly on the Froude number ( F r ): for F r < 0.3, divergent waves prevail, whereas for F r > 0.5, transverse wave energy grows significantly, highlighting the influence of ship speed.
The Froude number ( F r ) is a fundamental dimensionless parameter that describes the ratio of inertial to gravitational forces in free-surface flows. Defined as:
F r = V g L
where V is the characteristic velocity of the object, g is gravitational acceleration, and L is the characteristic length of the object or flow field.
In shallow waters, ship wave behavior is strongly affected by depth. As water depth decreases, wave speed and wavelength reduce, while wave height increases nonlinearly—affecting maneuverability and safety. To better characterize these shallow-water effects, the depth-based Froude number ( F h ) is used, defined as:
F h = V V k
V k = g h
In the formulation, V represents the ship’s navigation speed, V k denotes the critical wave speed of the waterway, g is the gravitational acceleration, and h indicates the water depth of the navigation channel.

2.2. Ship Wave Patterns

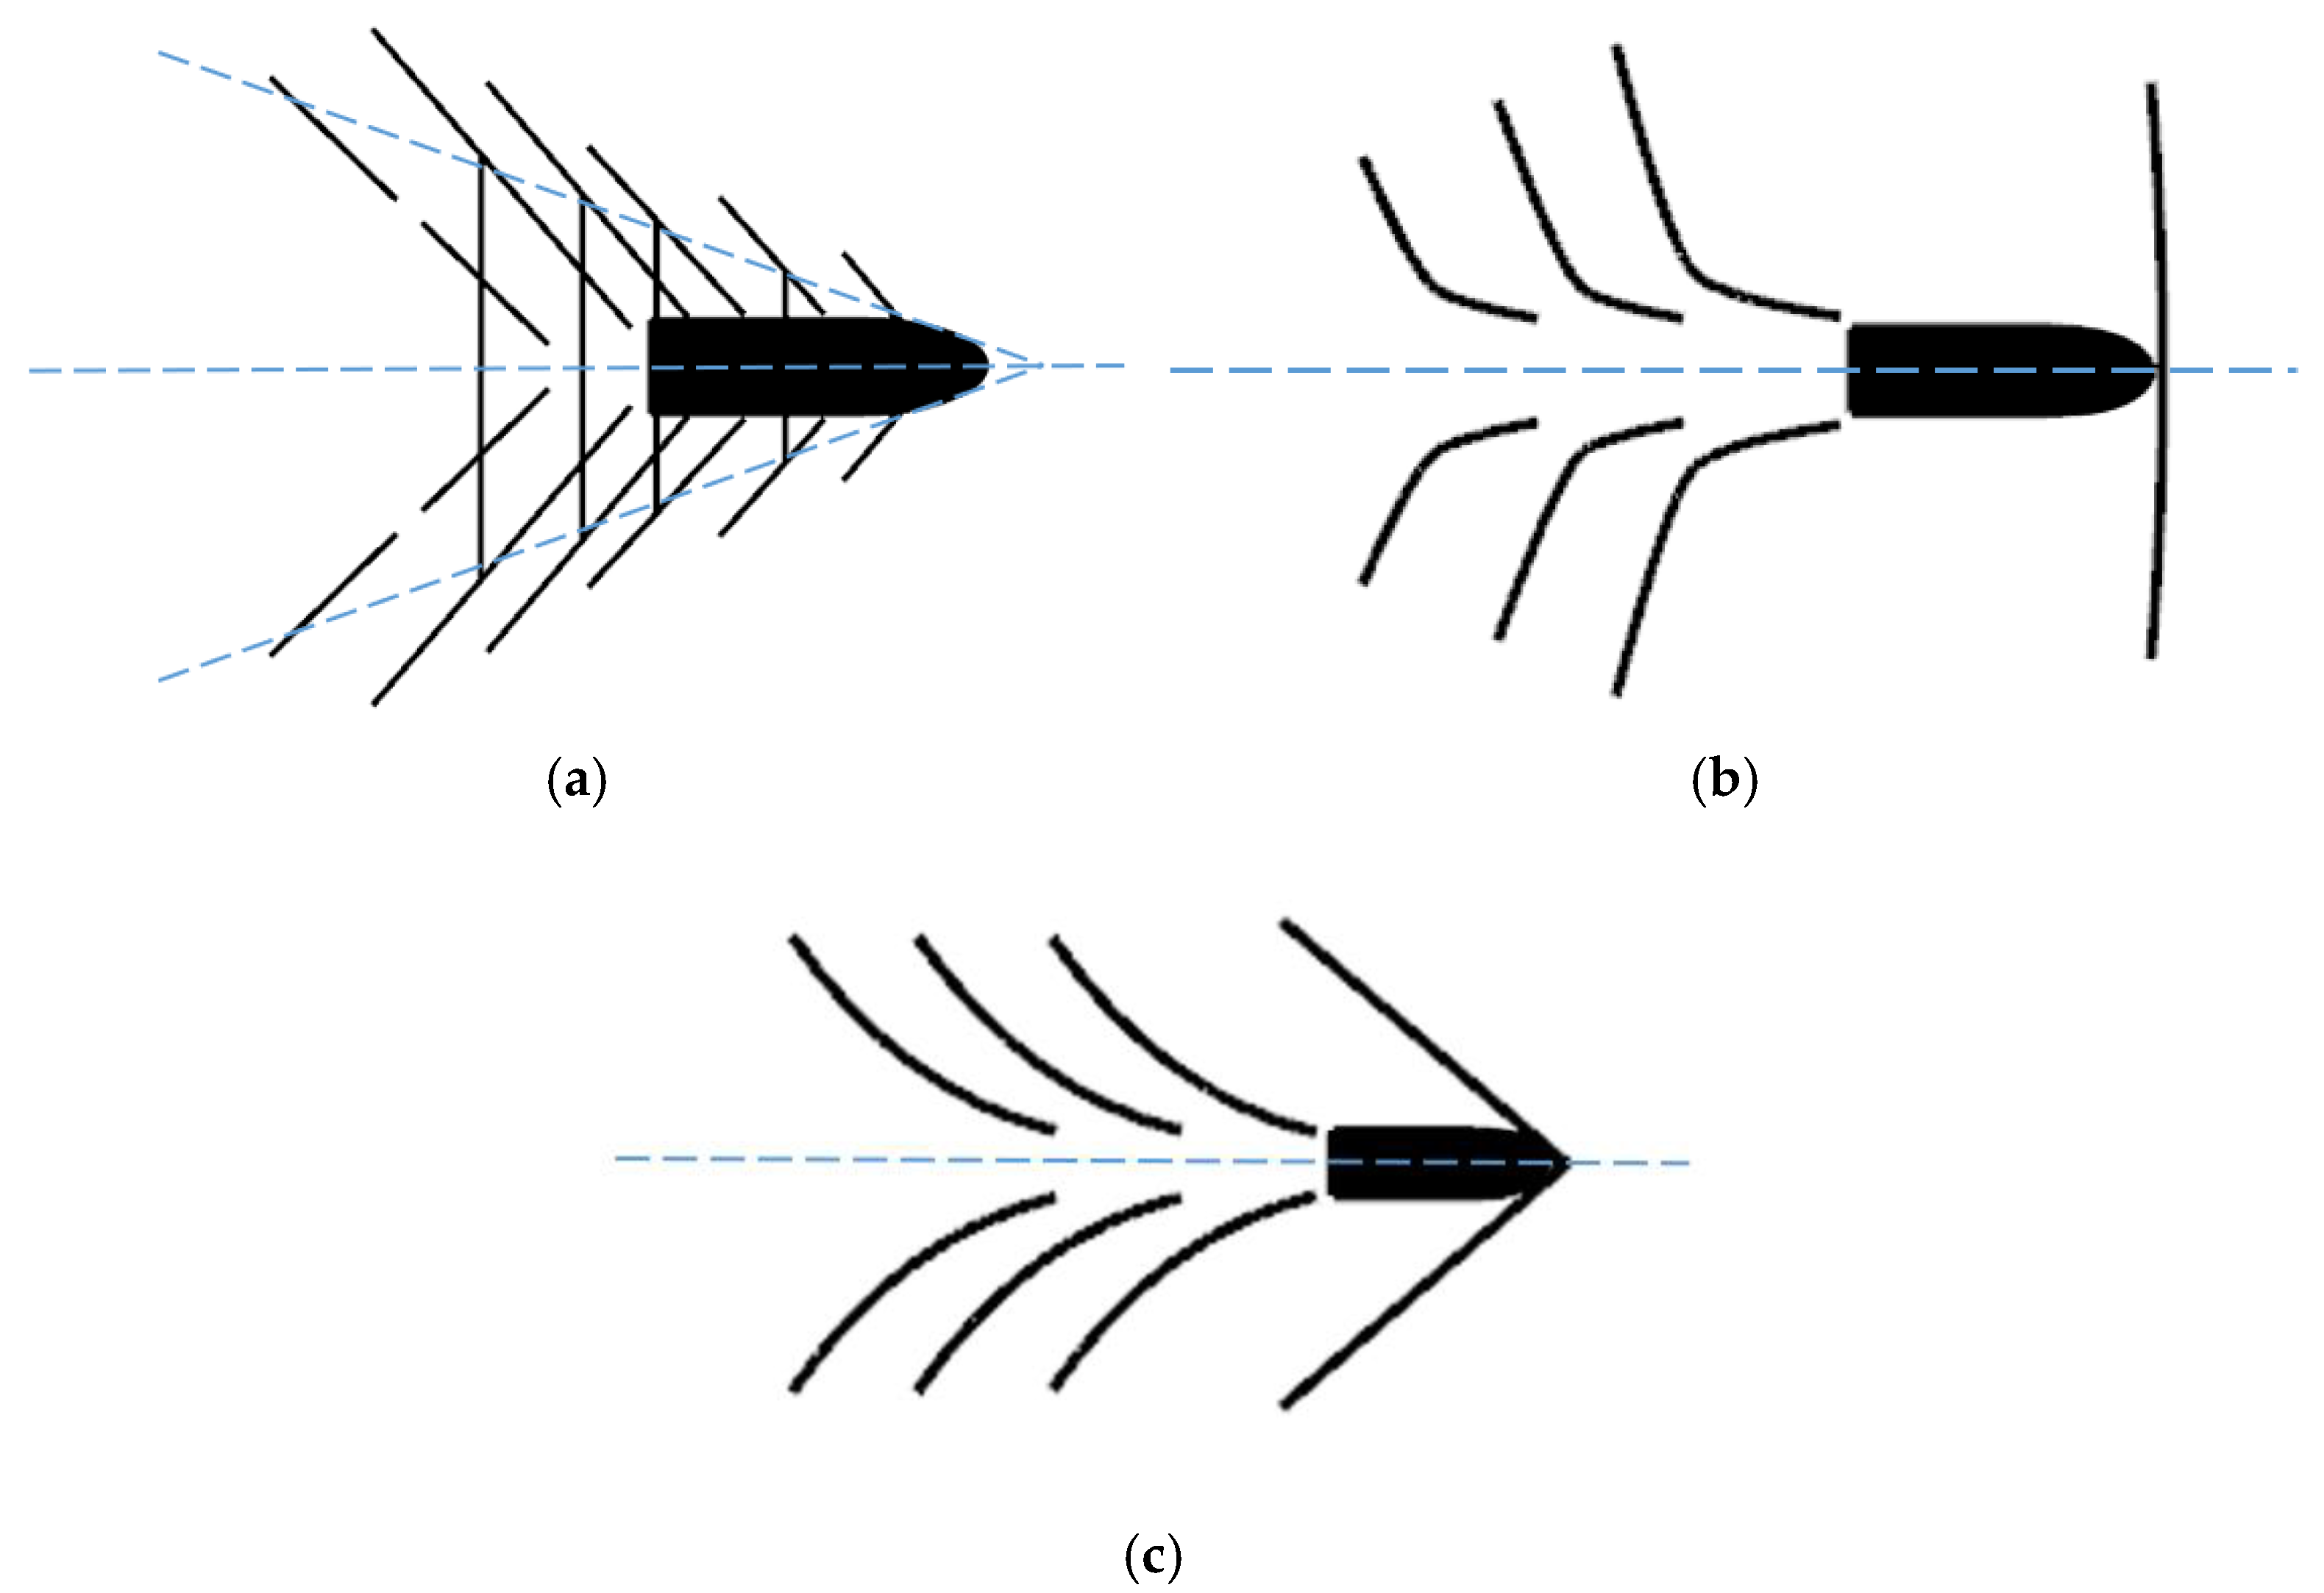
Based on the depth-based Froude number, ship speeds can be classified into three distinct regimes, as illustrated in Figure 2. When F h < 0.84, the ship operates in the subcritical speed regime; when 0.84 ≤ F h ≤ 1.15, it falls within the transcritical speed regime (note that these threshold values are dependent on ship type and channel conditions); and when F h > 1.15, the ship enters the supercritical speed regime. Each speed regime exhibits unique characteristics in terms of ship wave patterns.
When the depth-based Froude number ( F h ) is below 0.84, ships operate in the subcritical regime, where wave patterns resemble those in deep water. According to Kelvin’s theory, the system consists of transverse and divergent waves, intersecting at a constant 19°28′ cusp angle of maximum wave height.
In the transcritical regime (0.84 ≤ F h ≤ 1.15), wave patterns transform significantly. As F h rises, divergent wave angles widen, producing strong bow and stern transverse waves. Around F h ≈ 1, divergent waves merge into a nearly perpendicular transverse system. Practical effects of draft-to-depth ratio (h/d) and hull geometry extend this regime to about 0.8–1.2, where wave morphology, energy, and propagation change markedly.
For F h > 1.15, the supercritical regime emerges. Transverse waves vanish, while divergent wave angles narrow with speed. Bow waves shift rearward toward the stern, producing streamlined, narrowing patterns with distinct directional changes.

3. Numerical Modeling and Validation

3.1. Fundamental Equations for Shallow Water

3.1.1. Governing Equations

In the numerical simulation of viscous flow around ships, the fluid is assumed to be incompressible and isothermal, and density variations due to temperature are neglected. Under these assumptions, the flow field is governed by the continuity equation and the Reynolds-Averaged Navier–Stokes (RANS) equations, which together describe mass and momentum conservation in viscous flows.
The continuity equation ensures mass conservation and, for incompressible fluids, is expressed as:
u = 0
where u = ( u x ,   u y ,   u z ) denotes the velocity vector.
The RANS momentum equations describe the balance of forces:
ρ u t + u u = P + μ 2 u + ρ g ρ u u ¯
where ρ is the fluid density, p is the pressure, μ is the dynamic viscosity, g is the gravitational acceleration, and the last term represents the Reynolds stresses introduced by turbulence. These stresses are modeled using the RNG k−ε closure, which is particularly suitable for separated flows and complex free-surface conditions.

3.1.2. Turbulence Equations

To account for turbulence effects in ship-generated wave simulations, this study adopts the RNG k−ε two-equation model. The RNG formulation improves upon the standard k−ε model by incorporating additional terms derived from renormalization group theory, which enhance its performance in flows with strong streamline curvature, separation, and free-surface interactions. These features make it particularly suitable for shallow-water ship-wave problems where vortical structures and wave-breaking phenomena may arise.
The governing transport equations for the turbulent kinetic energy (k) and dissipation rate (ε) are given as:
ρ k t + ρ k u i x i = x j a k μ e f f k x j + G k + ρ ε
ρ ε t     + ρ ε u i x i     = x j a ε μ e f f ε x j + C 1 ε * ε k G k C 2 ε ρ ε 2 k
where G k denotes the production of turbulent kinetic energy due to mean velocity gradients, μ e f f is the effective viscosity, and a k , a ε , C 1 ε , and C 2 ε are model constants. This closure provides a practical balance between computational efficiency and accuracy, ensuring reliable predictions of wave-induced turbulence without excessive computational cost.

3.2. VOF Model and Discretization Method Selection

Accurately capturing the free surface is essential for analyzing ship waves in shallow waters. In this study, the Volume of Fluid (VOF) method is employed to resolve the interface between air and water. The transport equation for the volume fraction a is expressed as:
a t + a u = 0
where a = 1 corresponds to the liquid phase and a = 0 corresponds to the air phase. This method effectively tracks the evolution of the free surface, enabling the model to capture nonlinear features such as wave breaking, crest deformation, and attenuation.
In free surface flow simulations using the Volume of Fluid (VOF) method, grid quality is critical to accuracy. For engineering problems, mesh design must be optimized for both efficiency and precision. In ship wave simulations, at least 20 grid layers per wave height are generally required for accurate surface capture.
CFD analysis begins by discretizing the domain into grid cells with central nodes and boundary faces. The governing equations are then discretized, converting nonlinear PDEs into linear systems, whose solutions yield flow variables such as pressure and velocity [23,24].
For unsteady ship flows, time-step selection is equally important. The Courant–Friedrichs–Lewy (CFL) number governs temporal accuracy, representing the relative distance a fluid parcel travels through a cell in one-time step, and is expressed mathematically as:
C F L = U Δ t Δ x
where U represents characteristic flow velocity (m/s), Δ t denotes computational time step (s), and Δ x signifies minimum grid size (m).
To ensure accurate capture of flow characteristics, the global CFL number must be maintained below 1 during computation. With reference to ITTC recommended values while considering computational efficiency, this study adopts 0.01 s as the computational time step.

3.3. Validation of Numerical Methods

3.3.1. Computational Model and Domain

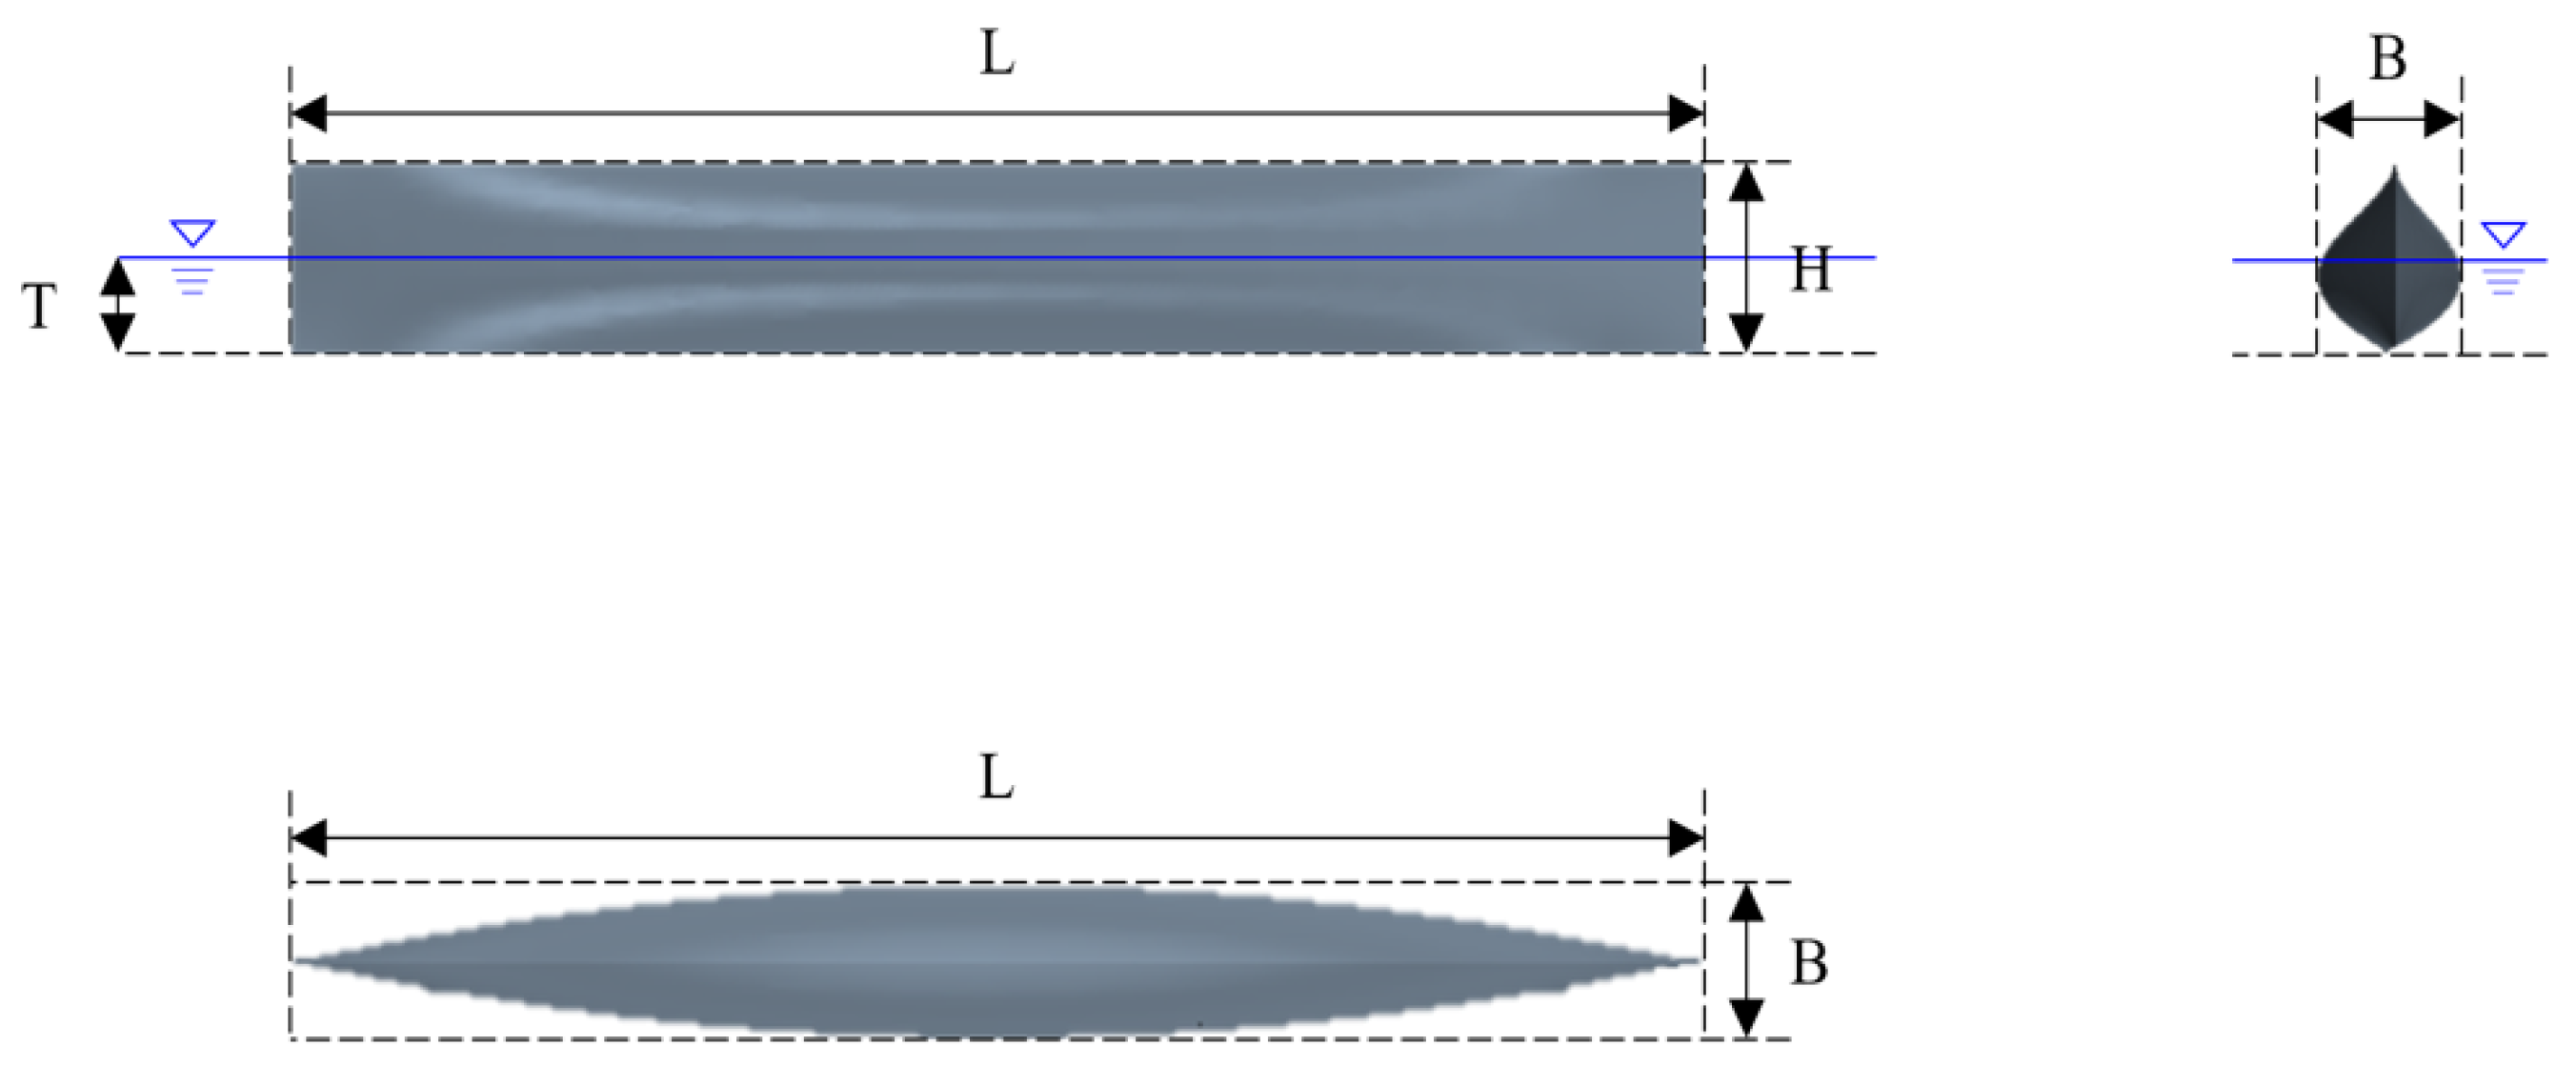
The Wigley hull, with its simple parabolic geometry and available analytical resistance solutions, is widely used as a benchmark for validating numerical methods and CFD simulations [25,26,27,28]. The geometric configuration of the Wigley hull used in this study is illustrated in Figure 3.
To validate the theoretical models of wave angle and wave height for ships in shallow water, this study established a 30 m Wigley hull model. The main parameters of this model are shown in Table 1.
The World Association for Waterborne Transport Infrastructure classifies water depth into four categories based on h/d ratio [29]. deep water (h/d > 3.0); limited depth (1.5 < h/d ≤ 3.0); shallow water (1.2 < h/d ≤ 1.5); and extremely shallow water (h/d ≤ 1.2). Since large vessels predominantly operate in limited and moderately shallow waters, this study adopts a near-shallow condition (h/d = 1.6) for numerical simulations to better reflect practical scenarios, with subsequent calculations maintaining this ratio for consistent comparison.
In Figure 4, the numerical simulation employs STAR-CCM+ to analyze the 30 m Wigley hull in shallow water (h = 1.6 d, d = 1.875 m).
To enhance the numerical accuracy of boundary layer flow simulations, this study employs a prismatic layer mesh refinement technique for detailed treatment of near-wall regions. Considering the pronounced wave-making effects generated by the stern flow field during high-speed vessel navigation, the computational domain must satisfy the following requirements. the domain should possess sufficient spatial extent to fully capture the development process of ship waves, while the boundaries need to be positioned sufficiently far from the vessel to ensure negligible influence of boundary conditions on the surrounding flow field characteristics [30].
Yan et al. [30] conducted a convergence test to determine an appropriate grid resolution by analyzing three different grid configurations, in which the grid size was progressively increased. Based on the calculation results of their previous study, and considering the balance between computational accuracy and efficiency, the optimal grid configuration was adopted in this work.
The grid system for the present numerical simulations was established using the automated grid generation techniques provided by STAR-CCM+, including surface remesher, prism layers, and trimmer grids. During the meshing procedure, local refinements were applied in the free-surface region and around the hull. The height of the first grid layer on the hull surface was set to 0.025 m, ensuring a total of 20 to 50 layers across the hull boundary layer. To better capture the wave profile at the free surface, the first grid layer above and below the undisturbed free surface was set to 0.125 m, with grid size gradually increasing with distance from the surface.
The computational domain dimensions were set as −15 < x/ L P P < 3 in the longitudinal direction, −10 < y/ L P P < 0 in the transverse direction, and 0.1 < z/ L P P < 0.4 in the vertical direction. Considering the hull’s symmetry, only half of the vessel was modeled to optimize computational efficiency. The final computational mesh contained approximately 4.4 million cells, with detailed domain dimensions illustrated in Figure 5.
Boundary conditions were established using STAR-CCM+’s predefined settings. velocity inlet conditions at both the upstream and top boundaries, symmetry conditions on the side planes, pressure outlet at the downstream boundary, and a no-slip wall condition at the bottom to represent shallow water conditions.
For the 30 m Wigley hull, the maximum wave height was measured at 1.5 m from the centerline (half-beam position). This location corresponds to a region of pronounced hull curvature where velocity gradients peak, producing extreme wave amplitudes. The bilge area, where the bow and side intersect, initiates boundary layer separation and vortex generation, concentrating free-surface energy. Following ITTC recommendations, wave height measurements at the half-beam position avoid near-wall viscous effects while capturing representative ship wave patterns [31]. This setup is consistently applied in simulations of the 2000-ton and 6000-ton vessels.

3.3.2. Theoretical Validation of Wave Angle and Height in Shallow Water

This section presents a comparative analysis between CFD simulation results and shallow-water ship waves theoretical models to validate the speed-dependent characteristics of wave angles and heights for the Wigley hull in confined waterways. The investigation aims to establish the applicability of numerical methods across different velocity regimes, thereby providing theoretical foundations for subsequent multi-scale ship hydrodynamic analyses.
To optimize computational efficiency while maintaining adequate resolution, the ship speed was systematically varied in 2 knots increments. Based on the depth-based Froude number formulation derived in previous sections, simulations were conducted across a speed range of 5 to 17 knots, with the corresponding variations in depth Froude number presented in Table 2.
The speed regime transitions are characterized as follows. when speed remains below 9 knots ( F h < 0.84), the flow is in subcritical regime; between 9~11 knots (0.84 ≤ F h ≤ 1.15), it enters transcritical regime; and exceeds supercritical regime when speed surpasses 11 knots.
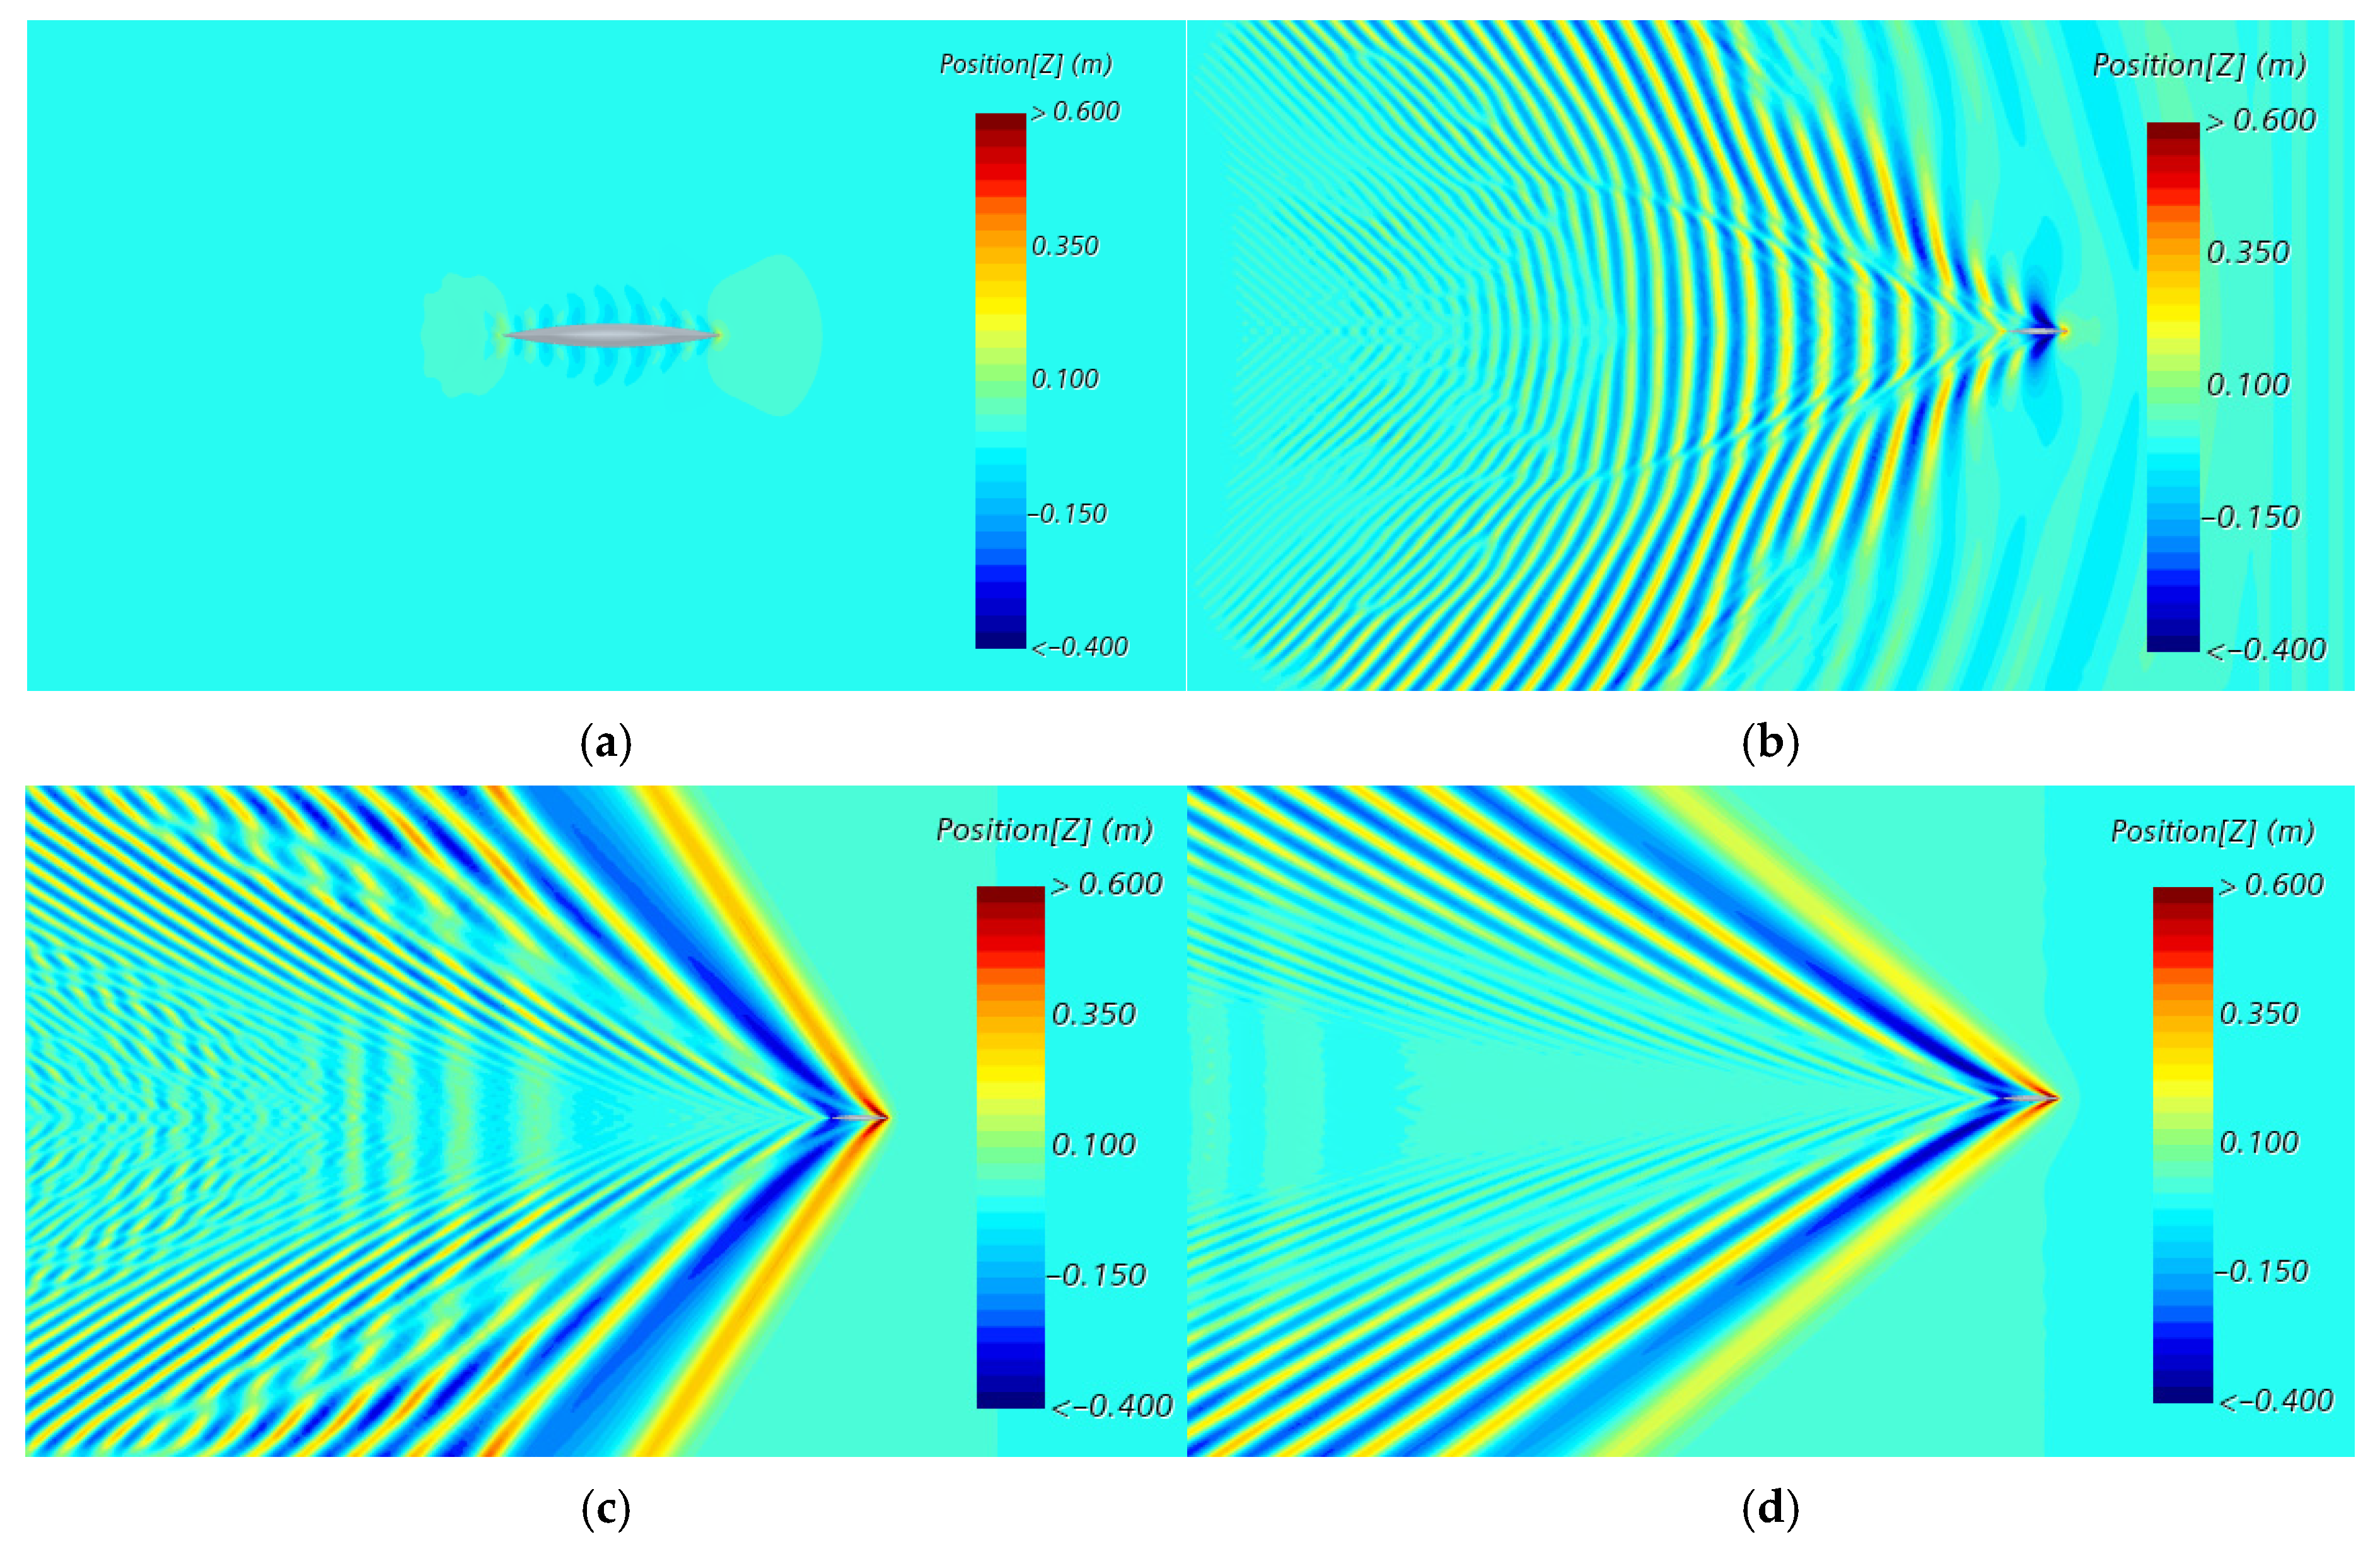
In Figure 6, the series illustrates the evolution of ship waves patterns generated by the Wigley hull in shallow waters with constant depth-to-draft ratio, as the ship speed progressively increases from 5 to 17 knots.
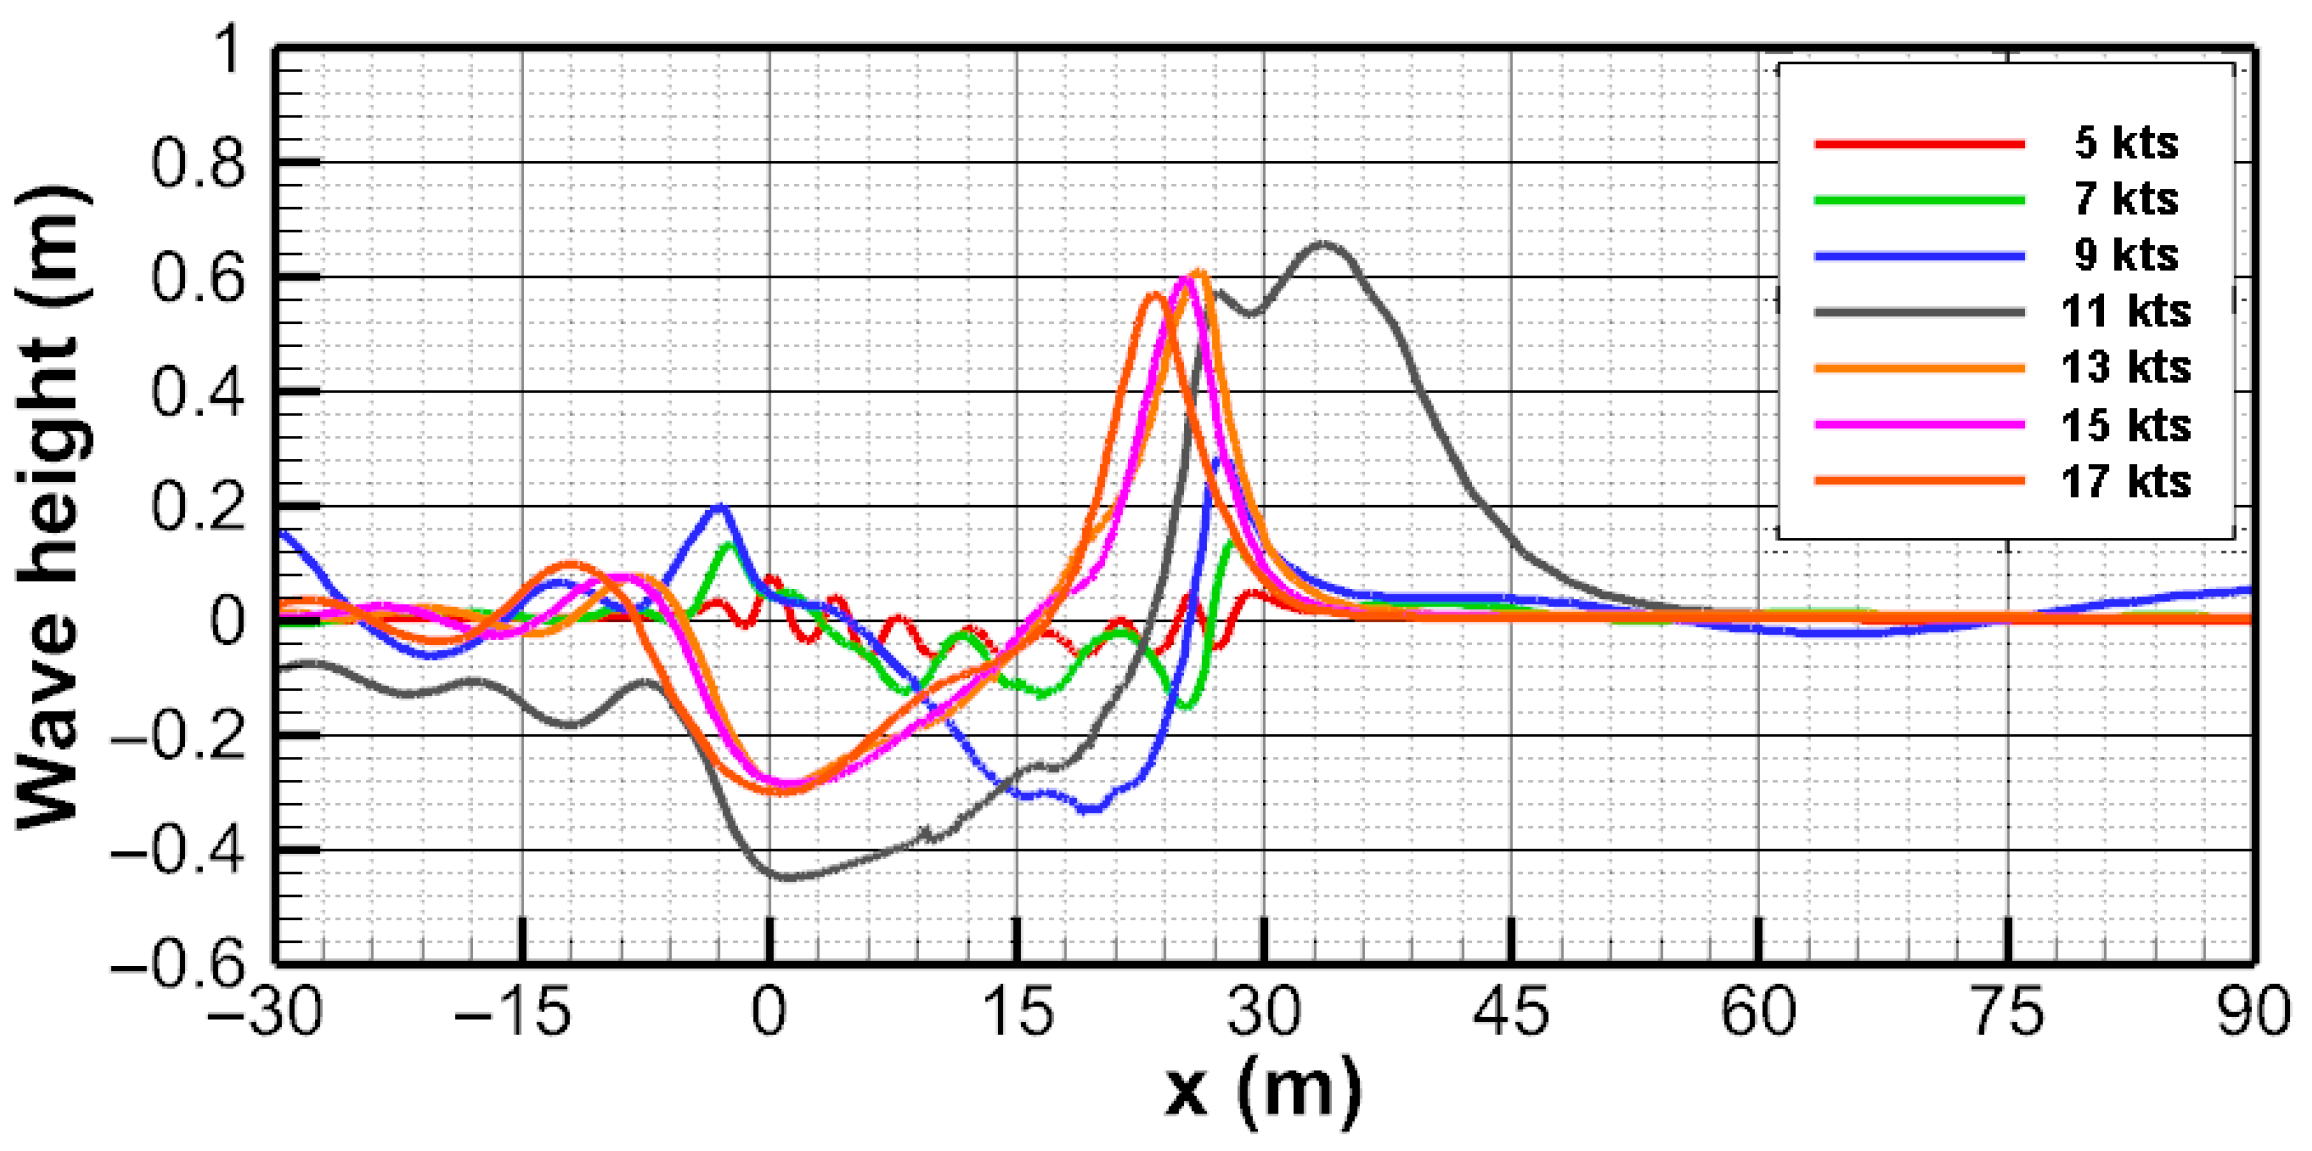
The variation in wave height at 1.5 m from the hull with increasing speed is presented in Figure 7. Taking the stern as the origin of the x-axis, as the vessel speed increases from 5 knots to 11 knots, the maximum wave height also increases accordingly. When the speed reaches 11 knots, the vessel enters the transcritical speed range, during which the wave height reaches its peak, and the location of the maximum wave height is at the bow. As the vessel continues to accelerate into the supercritical speed range, the wave height decreases with increasing speed, and the position of the maximum wave height shifts aft from the bow.
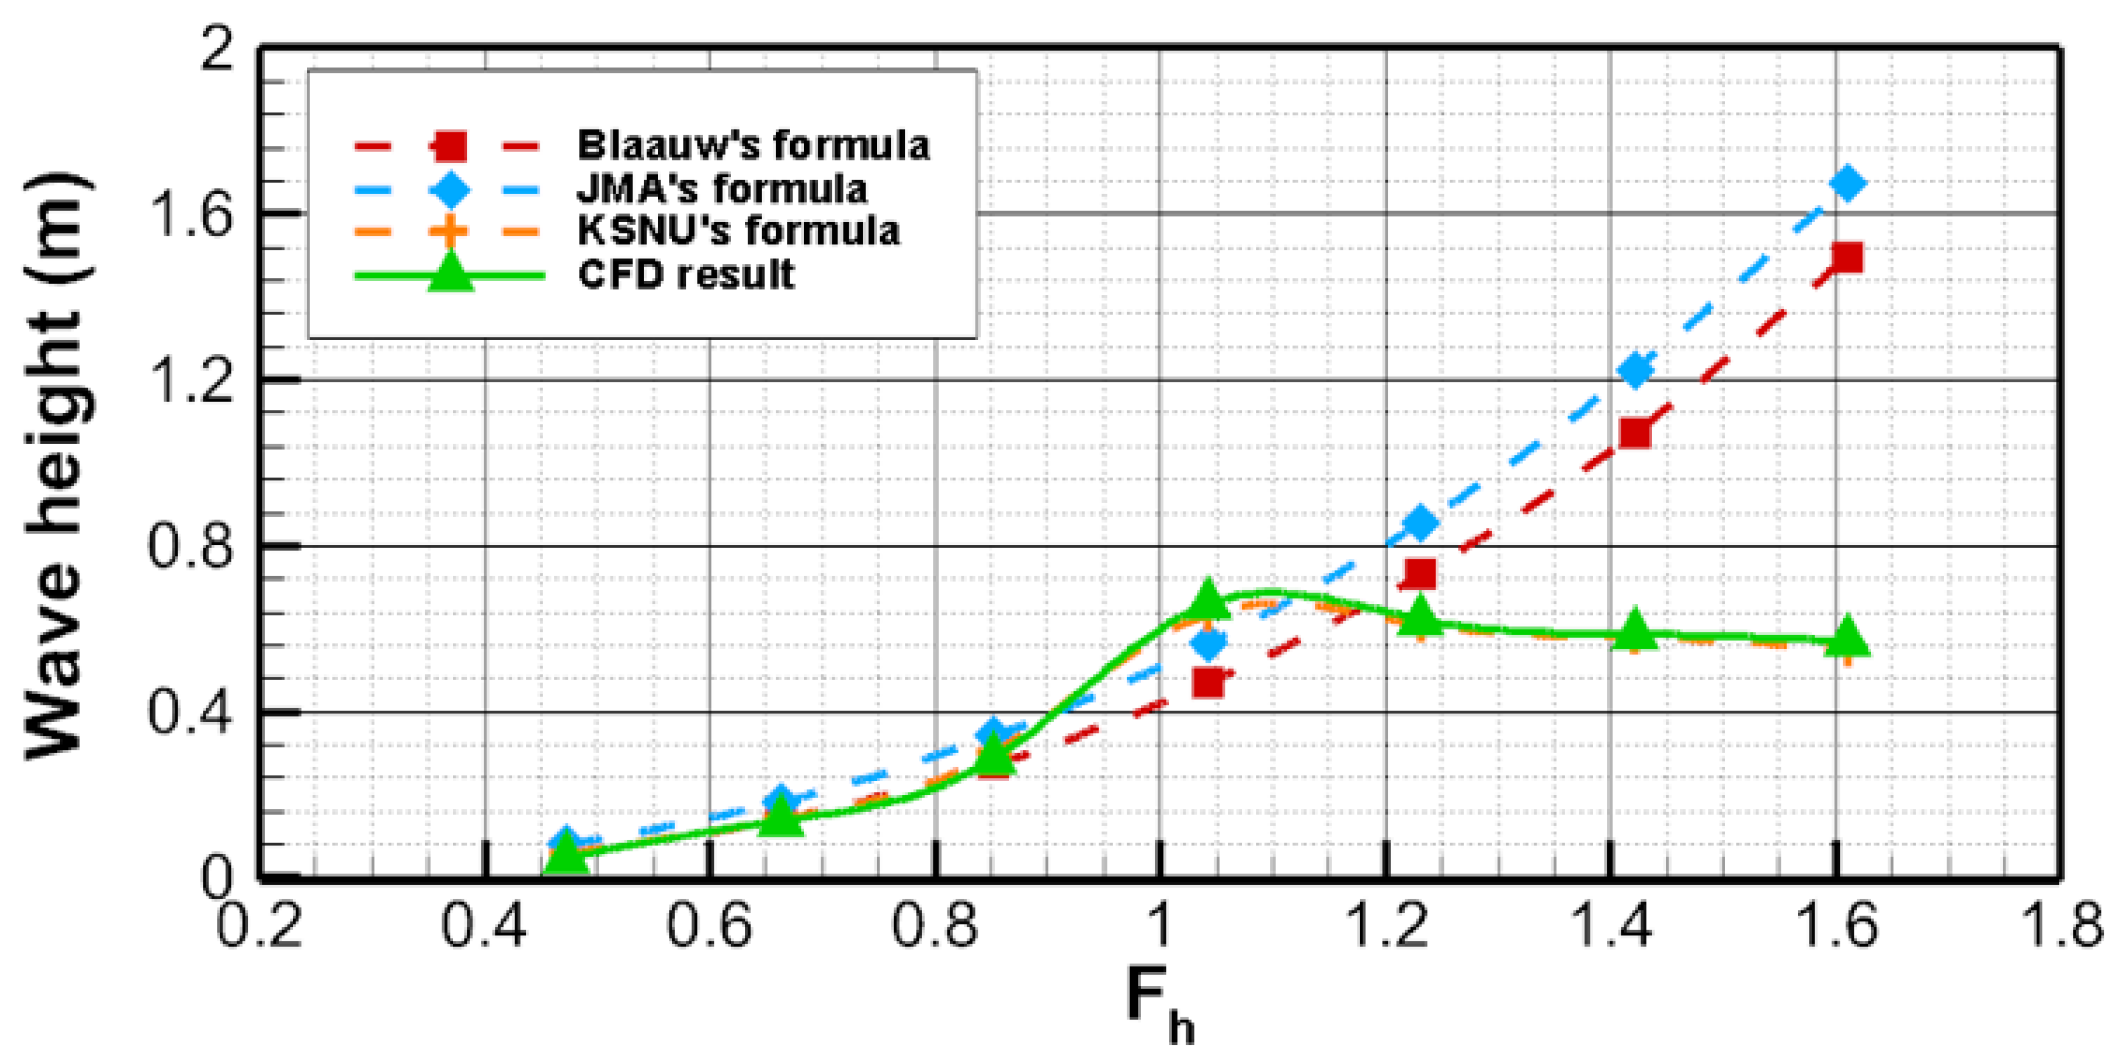
As shown in Figure 7, in the subcritical regime (5~9 knots), the wave height grows linearly from 0.049 m to 0.287 m; the transcritical regime (9~11 knots) produces peak wave heights up to 0.659 m; while in the supercritical regime (13~17 knots), the wave height shows moderate reduction to 0.57 m.
In 1984, researchers from the Netherlands and the United States compiled and analyzed existing ship model test data and field observations [32]. During this process, Blaauw proposed a formula for estimating the maximum wave height, expressed as:
H m a x / d = a 1 s / d 0.33 V / g h 2.67
The coefficient a 1 in the Blaauw formula varies according to the ship type. a 1 = 1.0 for patrol vessels and fully loaded inland motor ships, a 1 = 0.5 for unloaded ships, and a 1 = 0.35 for unloaded motor ships and tugboats. In the formula, s is the distance from the ship centerline to the ship side, H m a x represents the ship wave height at the ship side, g is the gravitational acceleration, d is the ship draft, V is the ship speed, and h is the water depth.
To roughly estimate the maximum wave height of ship waves, the Ship Wave Study Committee of the Japan Marine Disaster Prevention Association proposed the following method [33]:
H m a x = H 0 100 s 1 3 V k V K 3
where H m a x is the maximum ship wave height at the measurement point, H 0 is the specific ship wave height, s is the lateral distance from the measurement point to the ship’s centerline, V k is the actual ship speed, and V K is the fully loaded speed.
Through analysis of simulation data, comparisons were made between the calculated maximum ship wave heights and the results obtained from the Blaauw formula and the JMA formula, as shown in Figure 8.
According to empirical formulas, the wave height of ship waves shows a gradual increase with rising ship speed. Numerical results indicate good agreement with theory in the subcritical regime, with wave energy concentrated near-field. In the transcritical range, wave energy intensifies, wave height rises rapidly, and peaks above theoretical predictions. In the supercritical regime, wave energy disperses into the far-field, reducing near-field height and extending wavelength. These trends are consistent with Kang et al. [34] and Shin & Jeong [35].
Accordingly, existing empirical formulas are insufficiently accurate for application in the transcritical and supercritical speed ranges. Therefore, it is necessary to propose new correction formulas that are suitable for these velocity regimes. Among the previously discussed empirical models, the Blaauw formula demonstrates a clearer representation of the physical characteristics in confined waterways and is thus chosen as the basis for modification.
To improve predictions, the draft-to-depth ratio ( d / h ) is added to capture shallow-water effects, an exponential decay term exp ( X · F h ) is introduced to describe wave energy transfer from near- to far-field, and the power coefficient of F h is modified to reflect the nonlinear increase in transcritical speeds and stabilization in supercritical regimes.
The modified empirical formula for the transcritical speed range (applicable for 0.84 < F h < 1.15) is as follows:
H m a x / d = 0.5 s / d 0.33 d / h 0.25 F h 4.22 exp 0.538 F h
The corresponding formula for the supercritical speed range (applicable for F h   > 1.15) is as follows:
H m a x / d = 0.83 s / d 0.33 d / h 0.25 F h 0.134 exp 0.369 F h
In Figure 9, the modified formulas exhibit strong agreement with the computed maximum ship wave heights for the Wigley hull. This correction model will be adopted for further comparative analyses.
In summary, beyond conventional CFD practice, this study incorporates several refinements: corrected empirical formulas for transcritical and supercritical regimes validated against CFD, a refined grid strategy with over 20 layers across the free surface, and strict temporal control to ensure stability near critical speed. These methodological improvements enhance both the accuracy and robustness of the present simulations.

4. Numerical Simulation of Ship Waves in Shallow Waters

4.1. Ship Waves for 2000-Ton Class Vessel

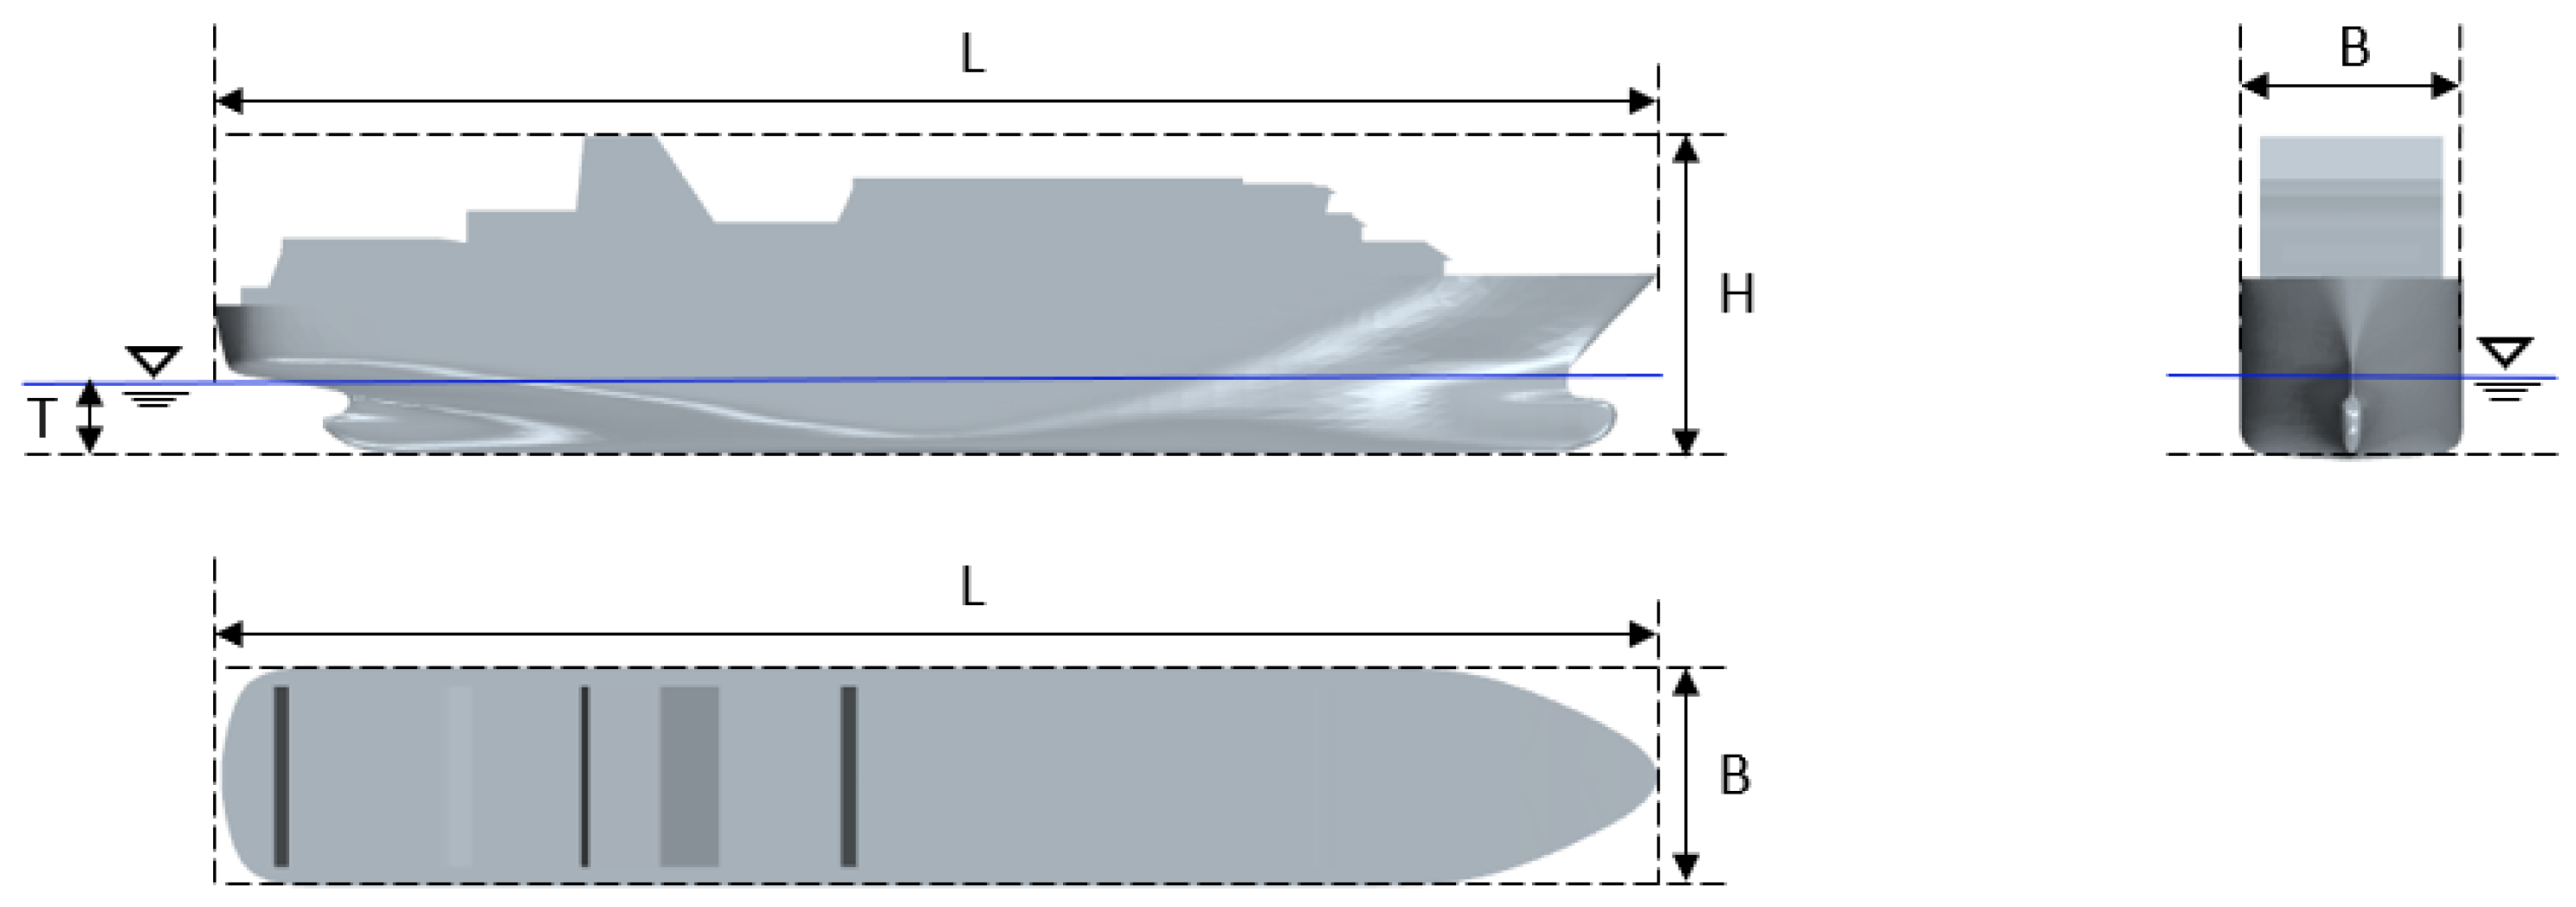
The 2000-ton cargo ship calculated in this paper has a length of 70 m, beam of 12 m, depth of 5.2 m, and design draft of 4 m, the vessel has a full-load displacement of 2488.5 tons. The geometric shapes and main parameters of the 2000-ton class ships analyzed in this study, are illustrated in Figure 10 and detailed in Table 3, respectively.
As shown in Figure 11, the computational domain was designed following the verified Wigley hull case to allow full development of ship waves. The upstream, downstream, and lateral clearances were set to 3 L P P , 10 L P P , and 6 L P P , respectively. The grid comprised about 11 million elements, with the bottom wall at 6.4 m, ensuring a depth-to-draft ratio of 1.6. The half-beam measurement point, 6 m from the centerline, corresponds to the maximum wave height monitoring station defined earlier.
The calculated depth-based Froude numbers corresponding to increasing ship speeds are presented in Table 4. Since the flow remains in the subcritical regime at speeds below 11 knots, simulations were initiated from 11 knots (near the transcritical regime) to optimize computational efficiency by excluding hydrodynamically insignificant cases.
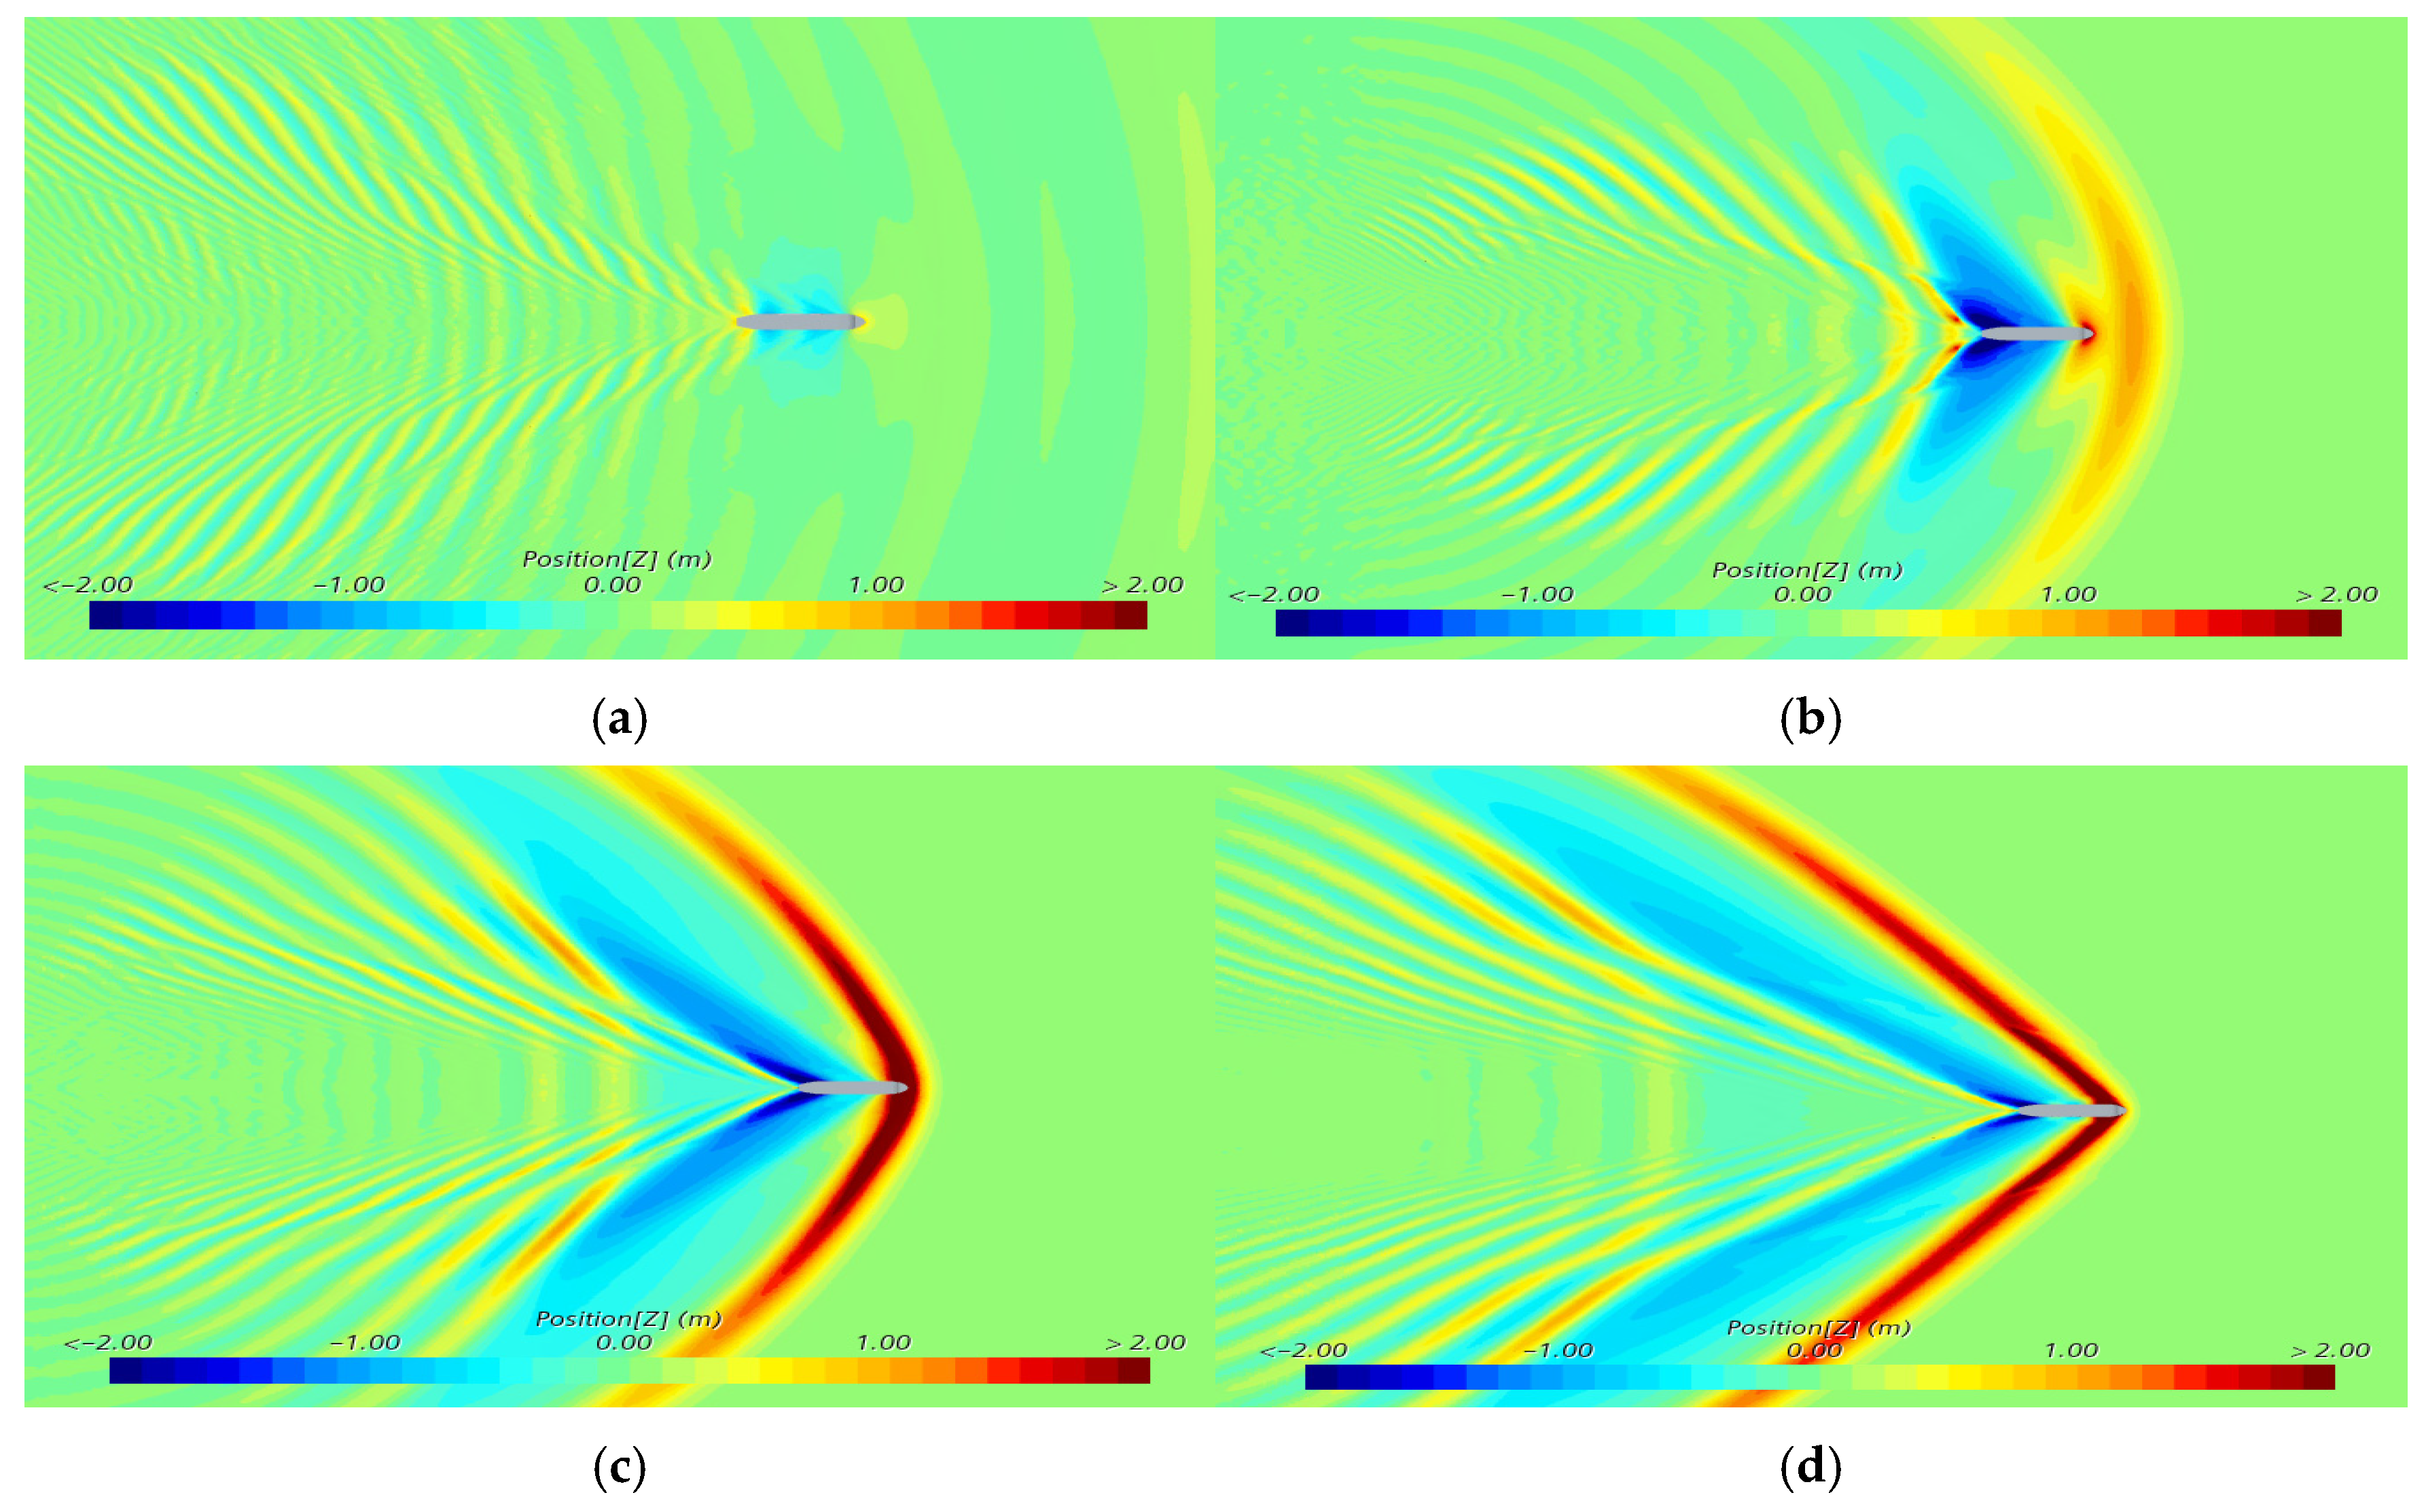
The speed regimes are defined as follows: subcritical flow occurs below 15 knots ( F h < 0.84), transcritical between 15 and 17 knots (0.84 ≤ F h ≤ 1.15), and supercritical beyond 19 knots. Figure 12 illustrates the evolution of ship waves from the 2000-ton vessel in shallow water at a constant depth-to-draft ratio, with speeds increasing from 11 to 23 knots.
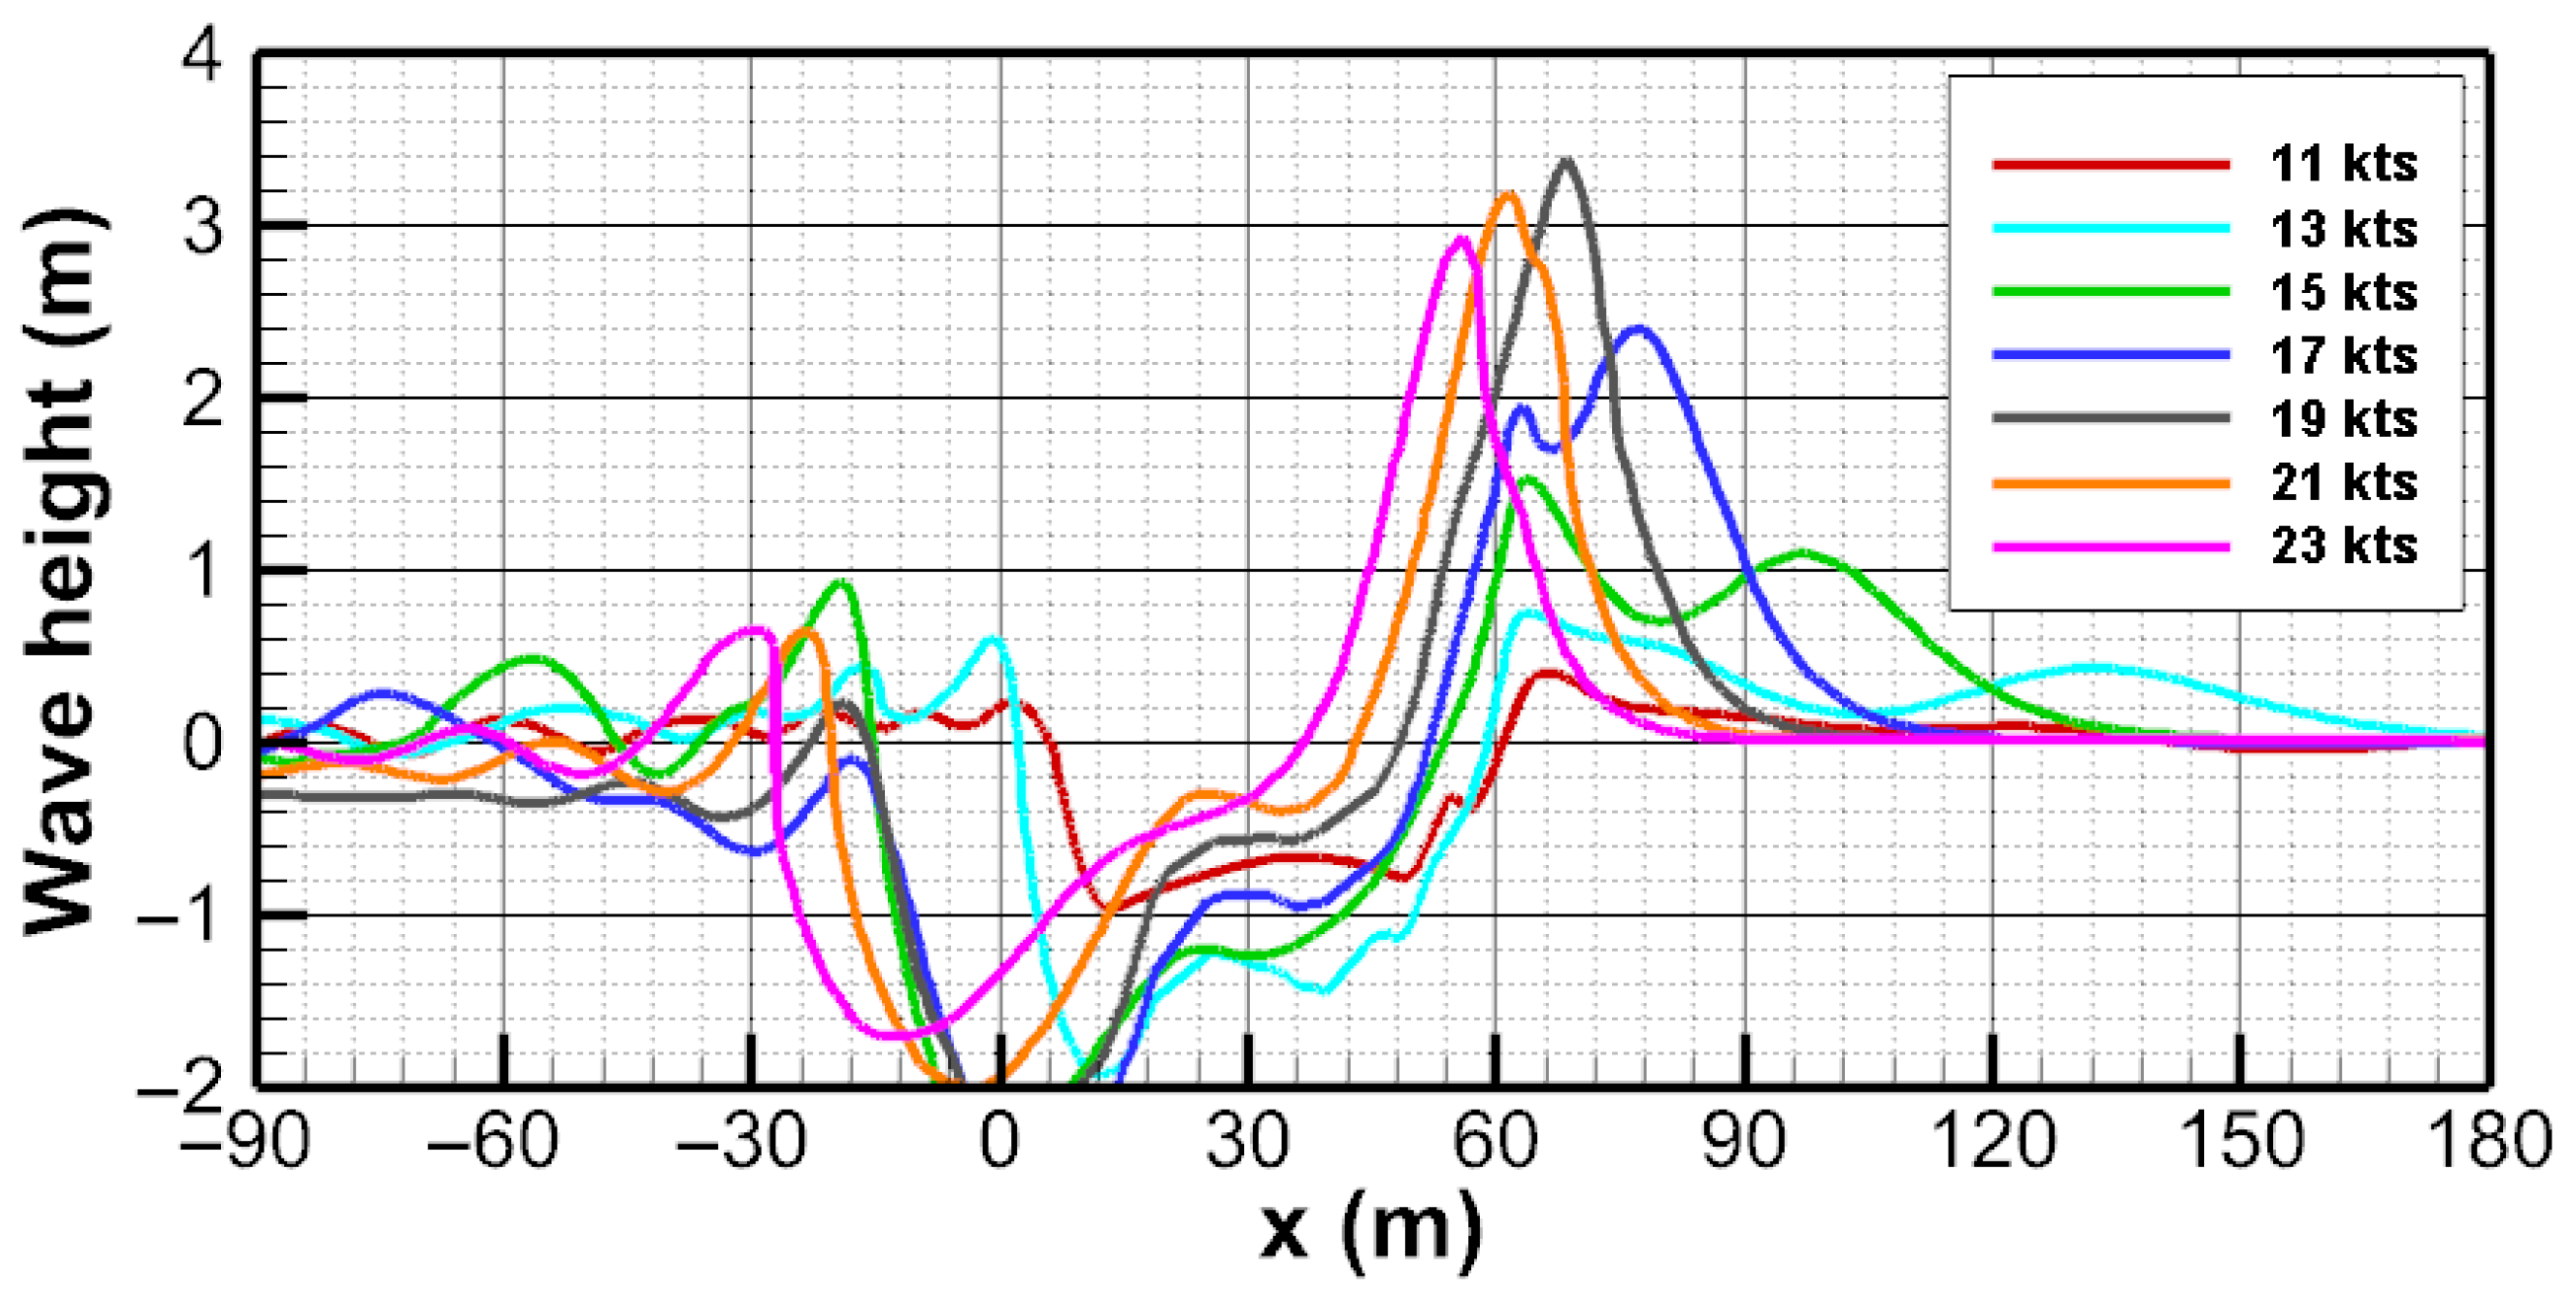
Figure 13 illustrates the wave height variation measured 6 m from the hull as a function of ship speed (11~23 knots, F h = 0.708~1.481) for the 2000-ton vessel. The results demonstrate a characteristic pattern of initial increase followed by subsequent decrease in wave height with increasing speed.
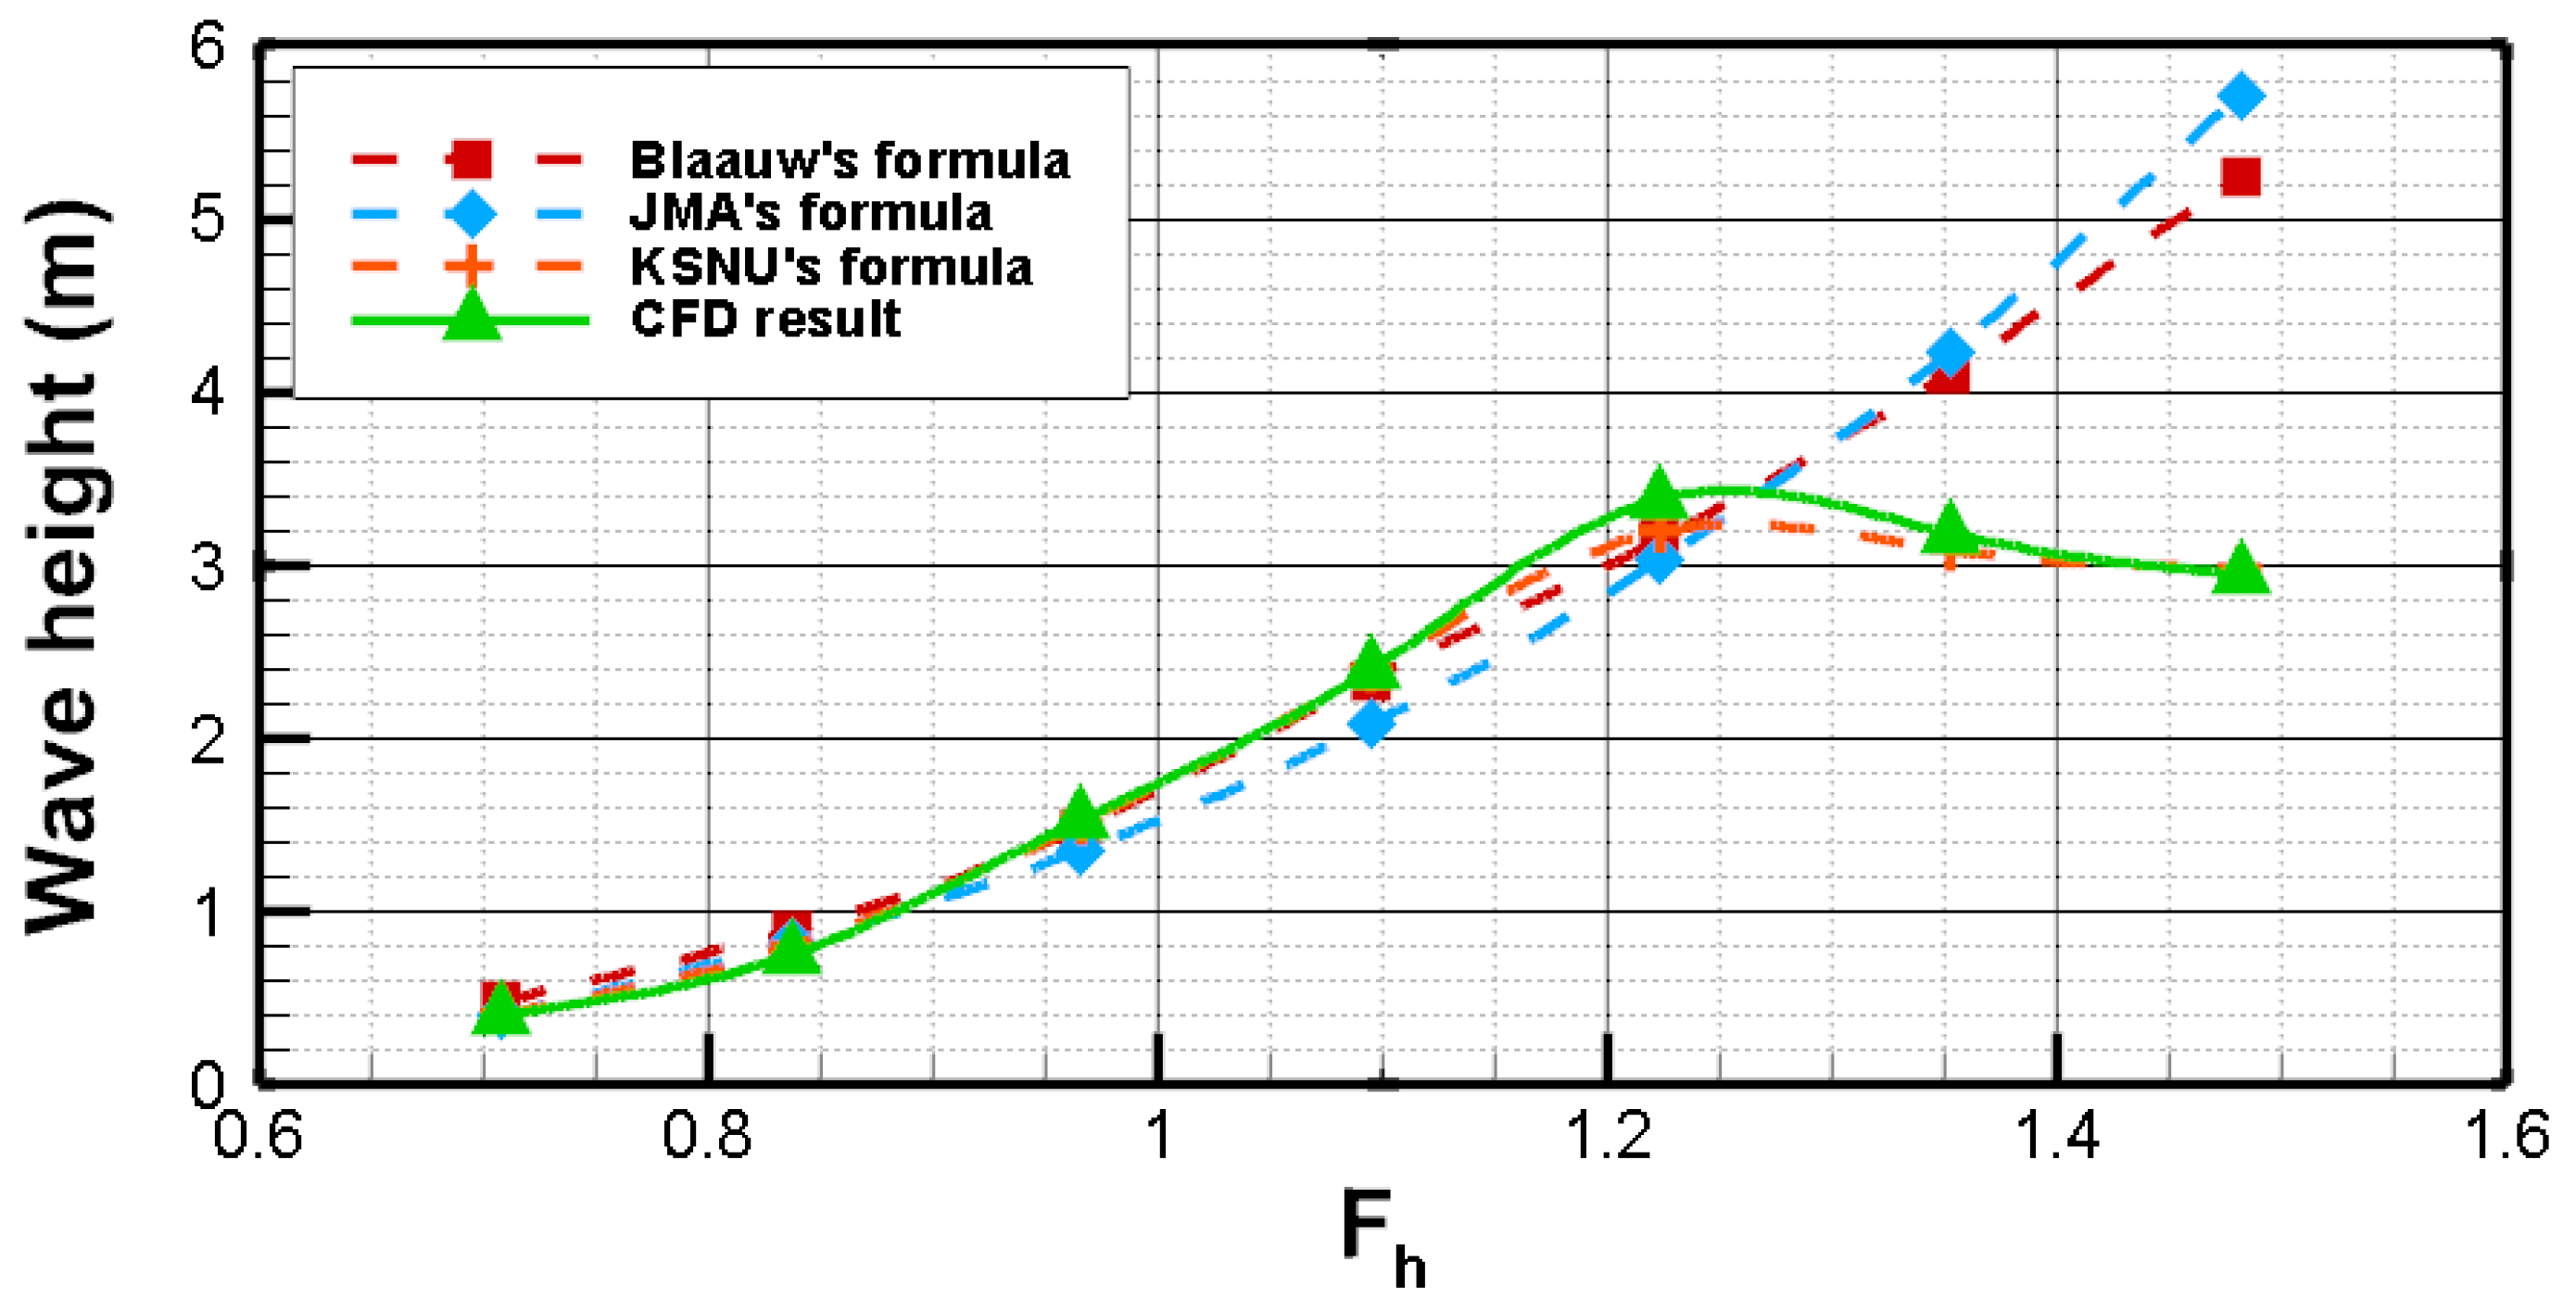
As observed in Figure 14, the ship waves exhibit a pronounced increase in wave height as the vessel speed rises from 15 to 19 knots. This phenomenon can be attributed to the transitional phase of the depth-based Froude number ( F h = 0.966 at 15 knots), where the flow regime shifts from subcritical to supercritical conditions. During this transition, the wave superposition effect becomes progressively more significant with increasing speed, leading to substantial wave amplification.
The subcritical-to-transcritical regime (11~19 knots, F h = 0.708~1.168) exhibited a dramatic wave height increase from 0.407 m to the peak value of 3.384 m at 19 knots. The maximum wave height occurred at 19 knots ( F h = 1.223), with this delayed peak attributed to the bulbous bow’s wave-breaking suppression effect through pre-breaking wave modulation, which postponed energy release compared to the Wigley hull’s peak at 11 knots ( F h = 1.042). In the supercritical regime (19~23 knots, F h > 1.223), wave heights gradually decreased from 3.384 m to 2.945 m with increasing speed. Relative to the Wigley hull, the 2000-ton vessel demonstrated both higher peak wave heights and delayed occurrence, highlighting the bulbous bow’s modulation effect on shallow-water wave generation.
The bulbous bow effectively delays the speed range for maximum wave height, confirming its role in modulating shallow-water wave generation through optimized design. Larger hull dimensions further prolong wave angle attenuation in the supercritical regime. Comparison with the Wigley hull highlights that variations in principal dimensions and bow geometry are critical factors in predicting ship waves in shallow waters.

4.2. Ship Waves for 6000-Ton Class Vessel

The “HANBADA” is a comprehensive training vessel affiliated with Korea Maritime and Ocean University (KMOU), integrating educational, research, and cargo transport functions [36]. Its design and operation strictly comply with Korean Register (KR) regulations. The “HANBADA” has an overall length of 117 m, length between perpendiculars of 104 m, molded breadth of 17.8 m, molded depth of 9.2 m, design draft of 5.915 m, and full-load displacement of 6434.6 tons. Are illustrated in Figure 15 and detailed in Table 5, respectively.
To accurately capture the far-field evolution characteristics of ship waves while minimizing boundary reflection interference, the computational domain was expanded compared to the 2000-ton class vessel in Figure 16. The domain configuration includes. 2 L p p between the bow and upstream boundary, 10 L p p between the stern and downstream boundary, and 8 L p p for the transverse width. Given the increased tonnage (from 2000 to 6000 tons) and corresponding wave height amplification, the refined mesh region for free surface resolution was proportionally enlarged to maintain computational standards. The optimized domain contains approximately 13 million grid cells, with both longitudinal and transverse dimensions expanded by 25% relative to the 2000-ton case to prevent artificial boundary reflections from affecting far-field wave systems. With a vessel draft of 5.915 m, the water depth was set at 9.464 m to maintain the depth-to-draft ratio (h/d) of 1.6. The measurement point at the ship’s half-beam position was located 8.9 m from the centerline.
The calculated depth-based Froude numbers corresponding to increasing ship speeds (15 to 27 knots) are presented in Table 6.
The vessel operates in the subcritical regime at 15 knots, transitions to the supercritical regime between 17~21 knots (0.84 ≤ F h ≤ 1.15), and enters the supercritical regime when speed exceeds 21 knots. For larger vessels with deeper drafts, the required navigation depth increases proportionally, consequently raising the critical speed thresholds—this 6000-ton vessel reaches transcritical conditions at 17 knots.
In Figure 17 series presents the wave pattern development of the 6000-ton class vessel in shallow waters under constant depth-to-draft ratio as speed increases from 15 to 27 knots.
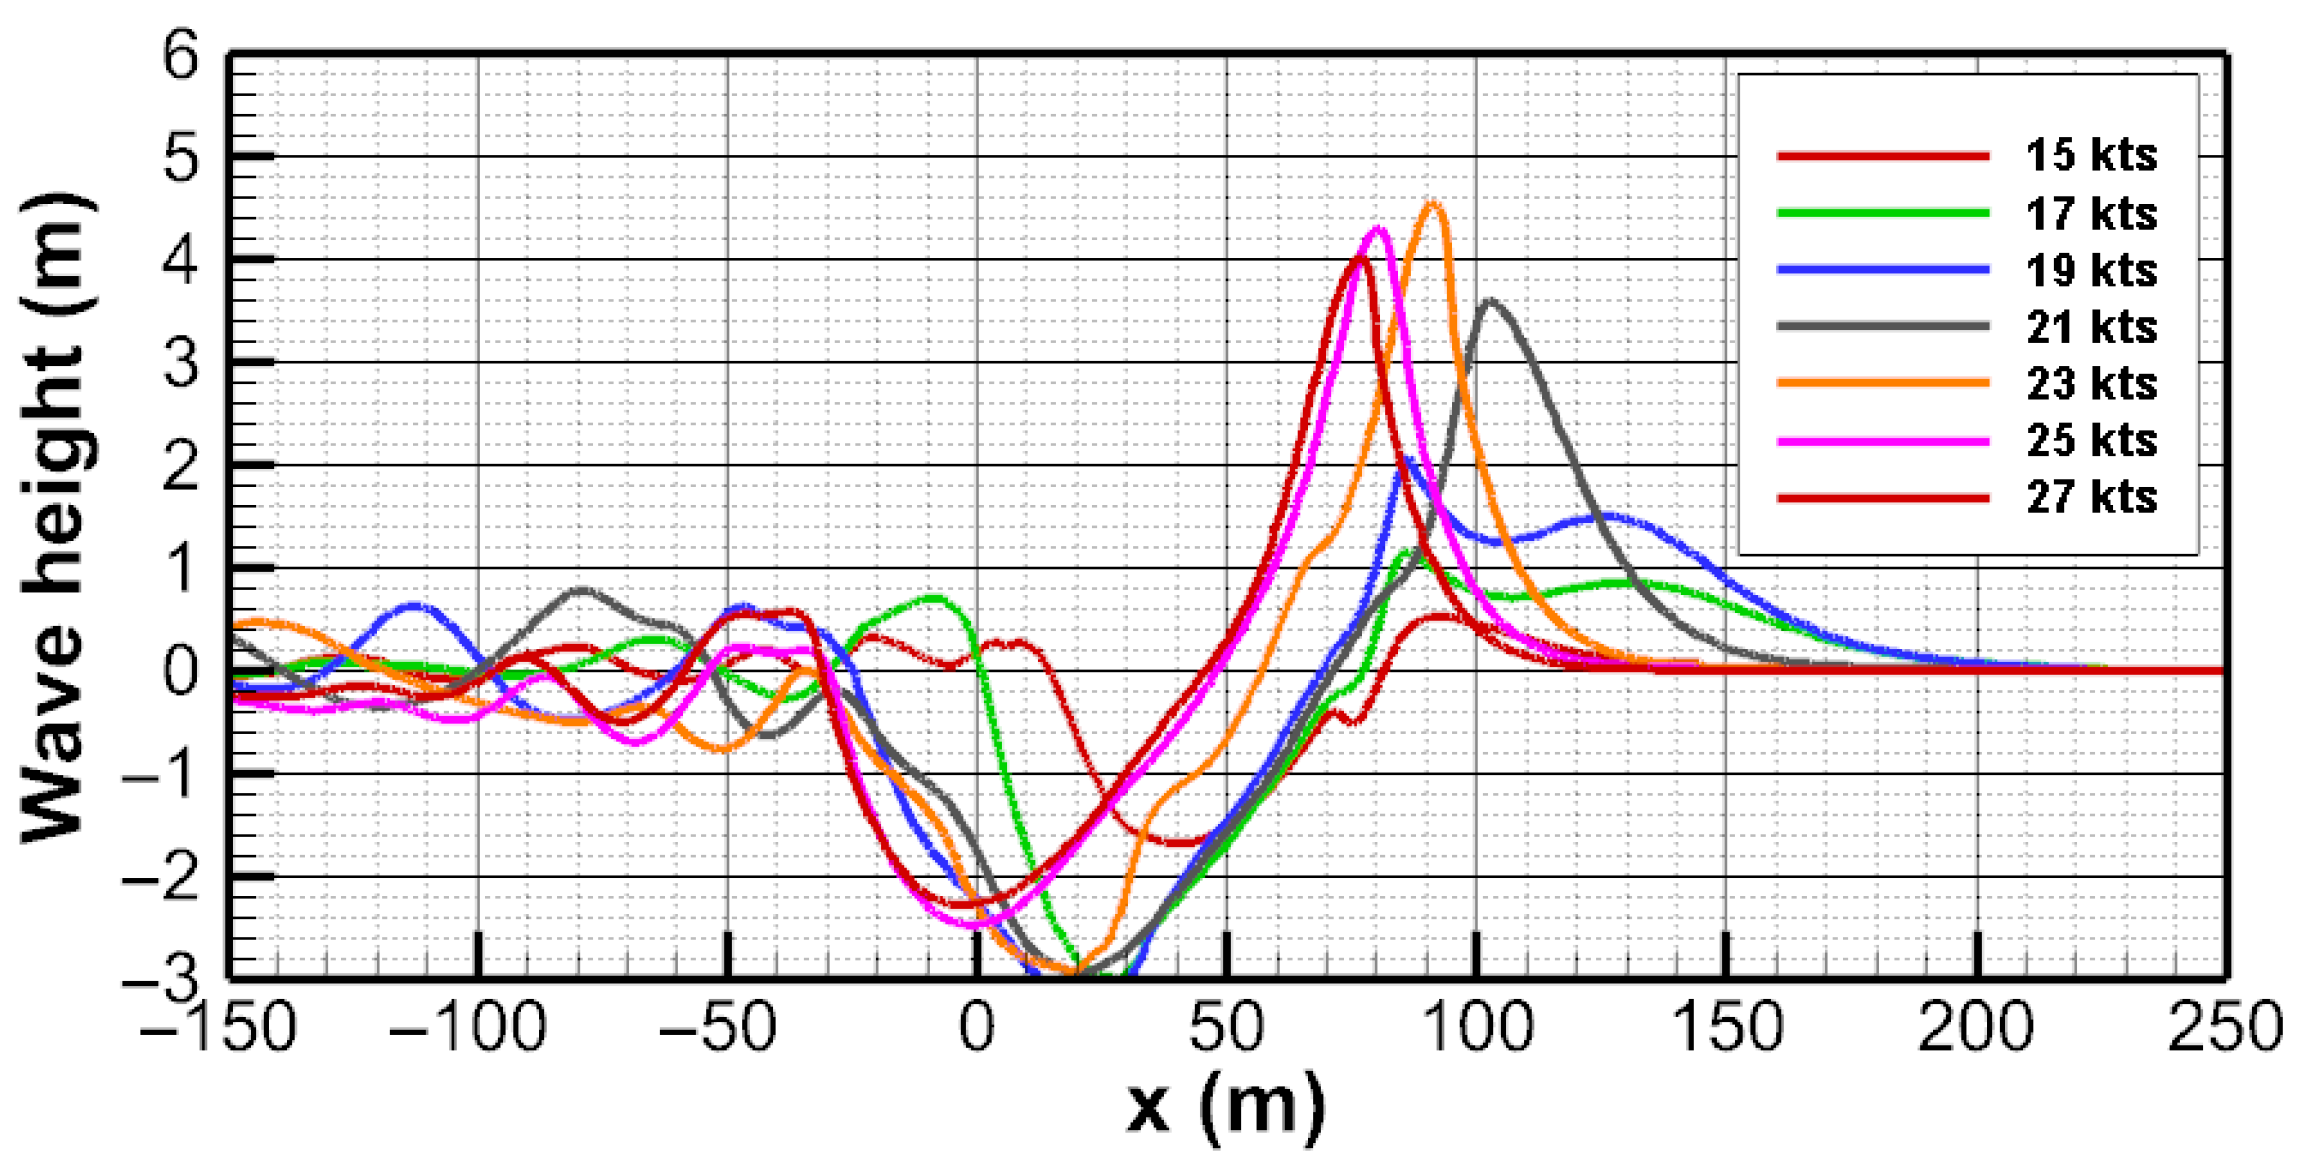
The wave height variation at 8.9 m from the hull with increasing speed is shown in Figure 18. For the 6000-ton vessel, the wave height versus speed (15~27 knots, F h = 0.8~1.44) follows a similar initial increase followed by a decrease trend as observed for the 2000-ton vessel.
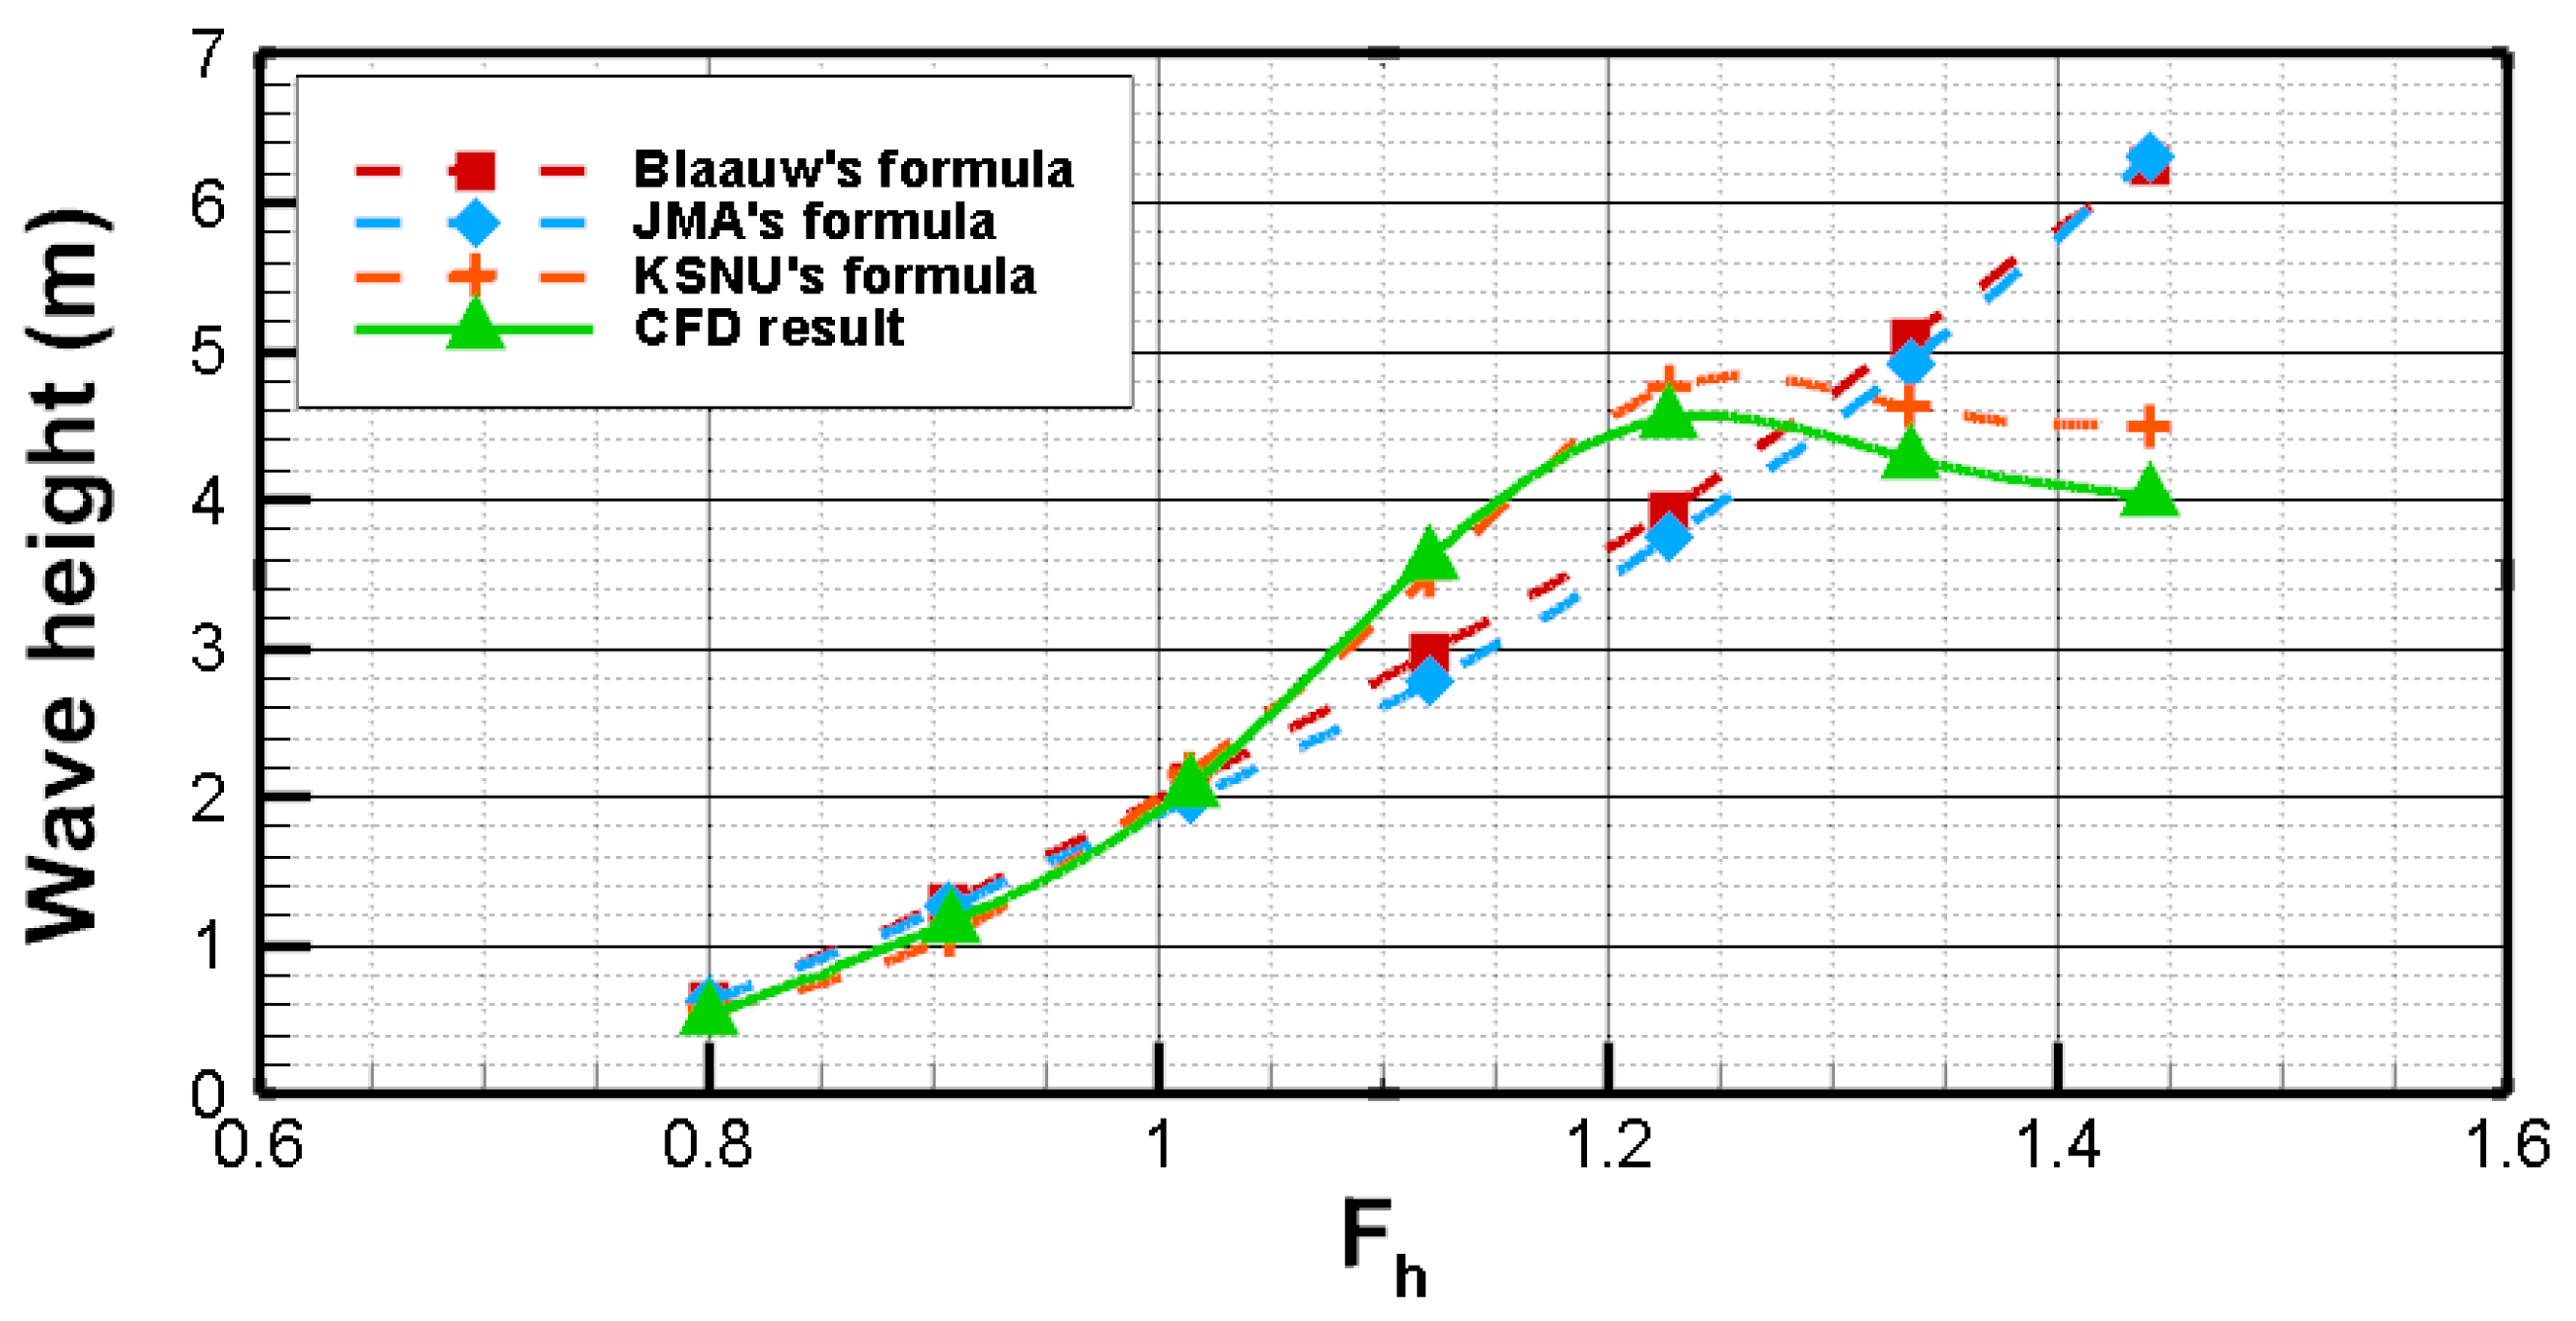
In the transcritical regime (17~23 knots, F h = 0.907~1.227), the wave height rises significantly from 1.154 m to a peak of 4.548 m at 23 knots. In Figure 19, similarly to the 2000-ton vessel, the maximum wave height occurs at a higher F h due to the bulbous bow’s pre-breaking wave effect, which delays energy dissipation through flow pre-compression and extends the wave energy accumulation phase. In the supercritical regime (23~27 knots, F h > 1.227), the wave height gradually decreases from 4.548 m to 4.027 m, primarily due to enhanced destructive interference between the hull-reflected waves and free-surface waves at higher speeds, combined with reduced wave energy focusing caused by the bulbous bow’s flow-separation effect.
Compared to the Wigley hull, the 6000-ton vessel exhibits both higher peak wave heights and more pronounced delay in their occurrence, demonstrating the combined effects of large-scale vessel dimensions and optimized bulbous bow performance.

4.3. Wave Height Attenuation Analysis

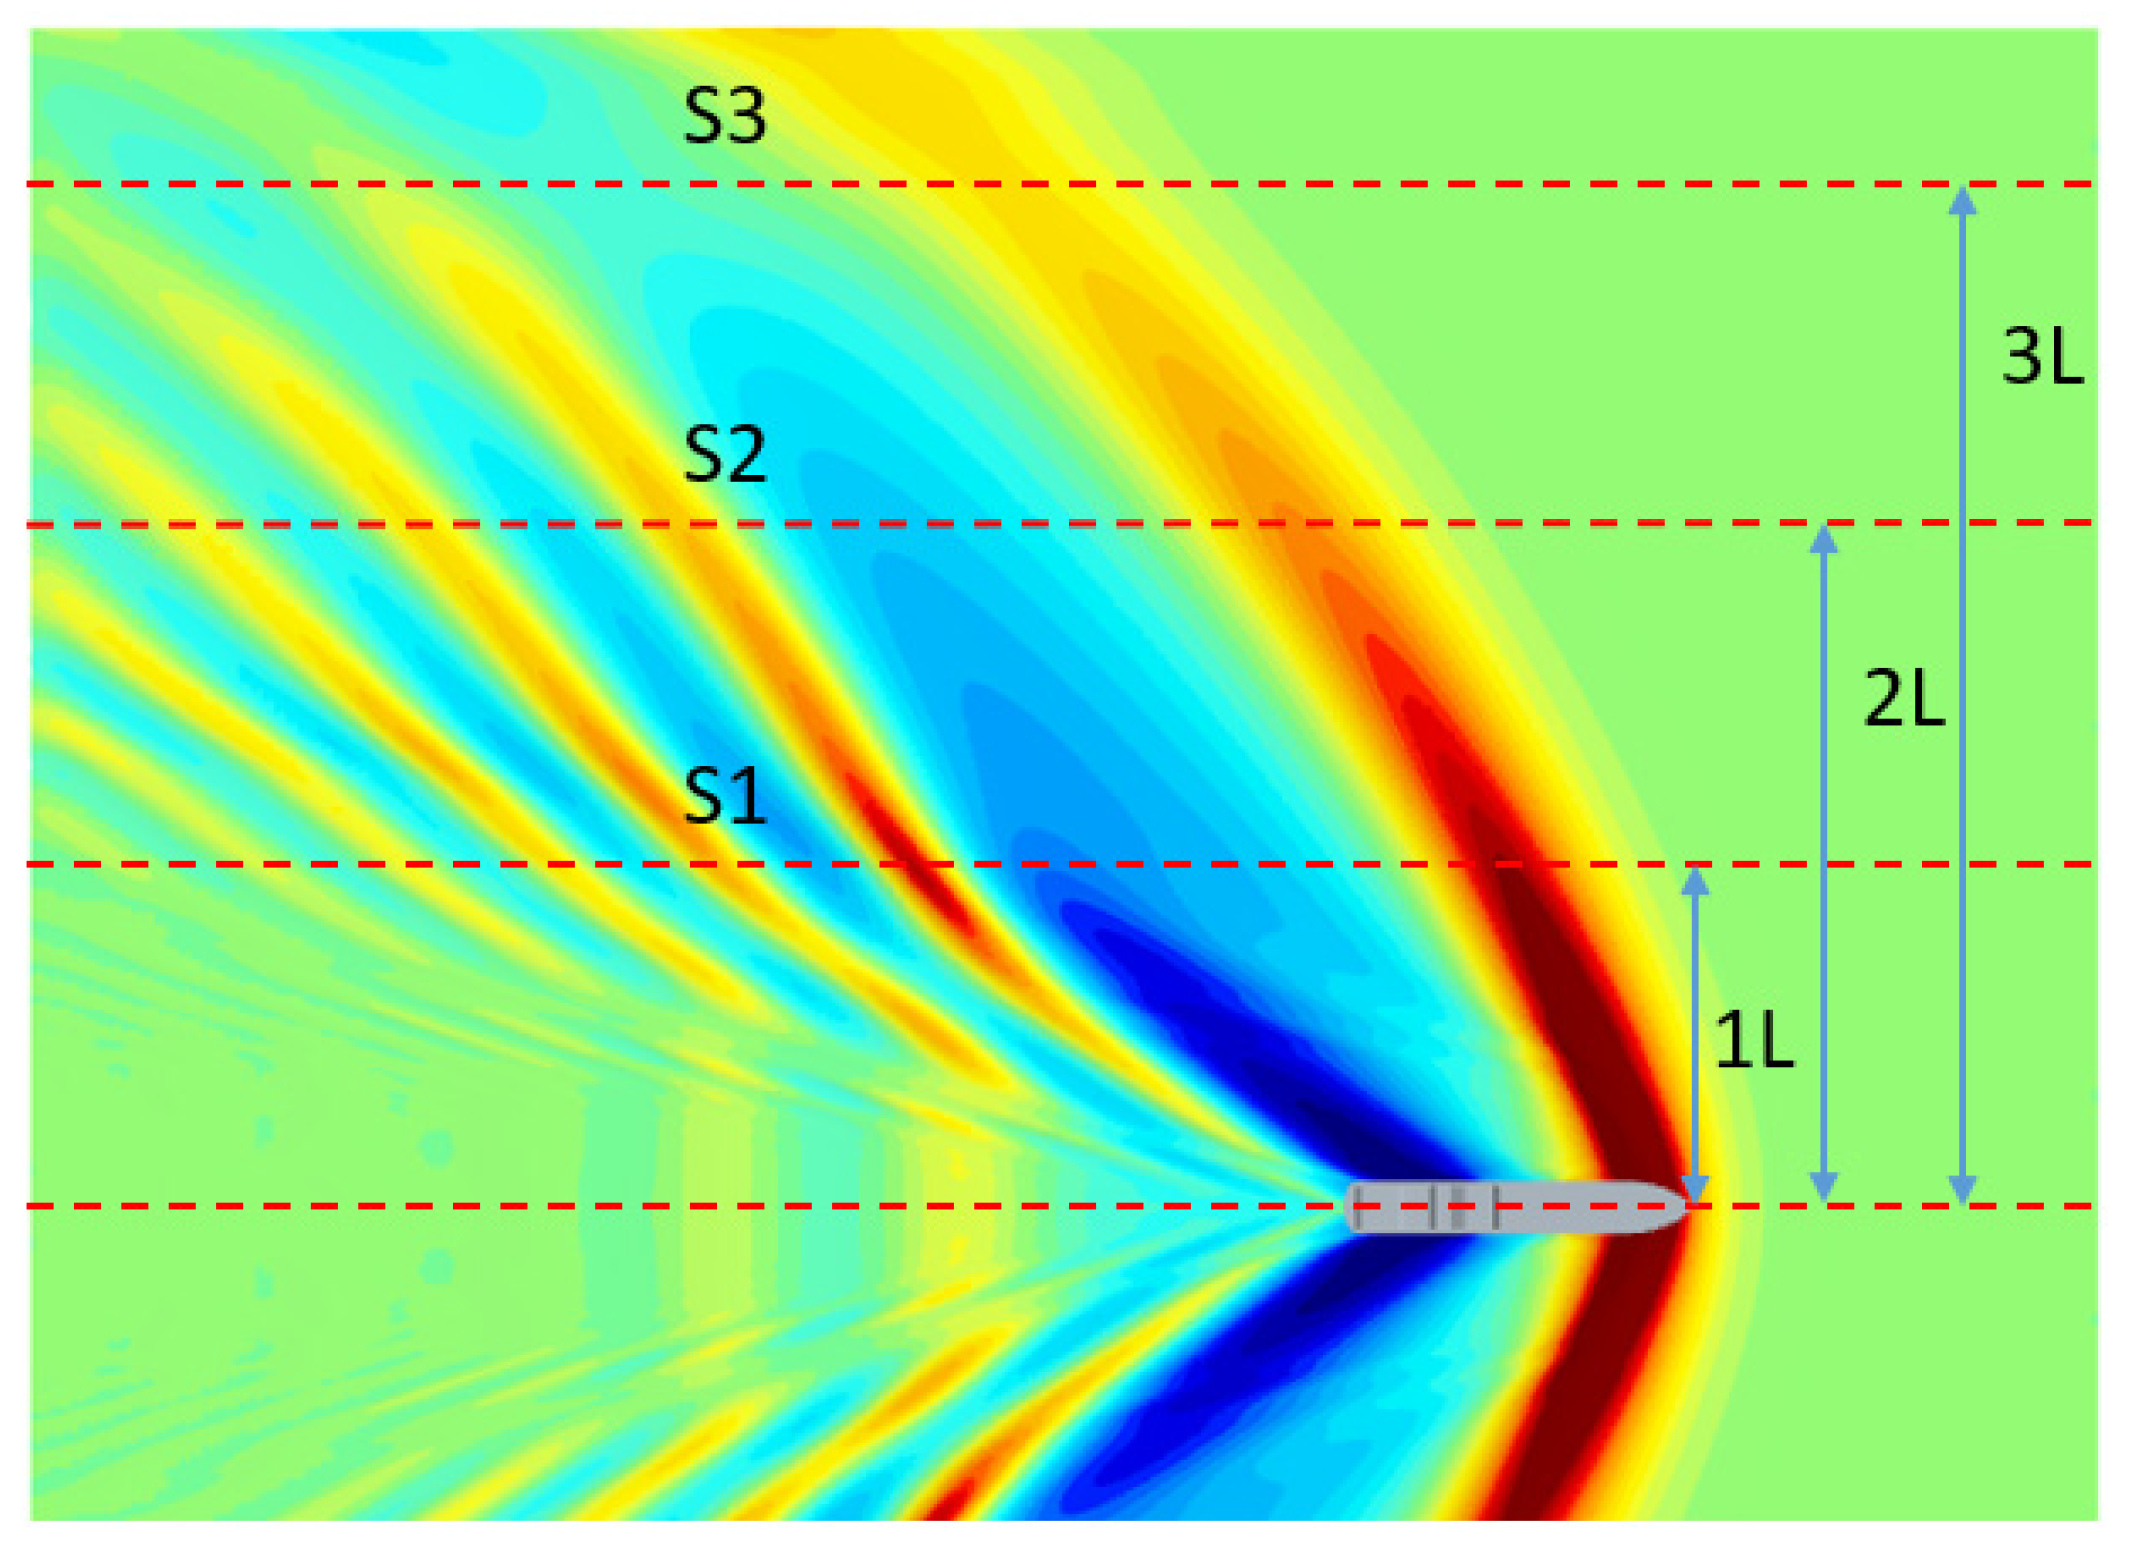
This section examines the lateral attenuation characteristics of ship-induced waves generated by the 2000-ton class vessel (L = 70 m) and the 6000-ton class vessel (L = 104 m) in shallow waters based on CFD simulation results. The study focuses on wave height decay patterns at transverse distances of 1L, 2L, and 3L from the hull under constant depth-to-draft ratio ( h / d ). The transverse distance is defined as S, where S1, S2, and S3 represent 1, 2, and 3 times the ship length from one side of the vessel, respectively. Figure 20 illustrates the coordinate system and wave height measurement lines for reference.
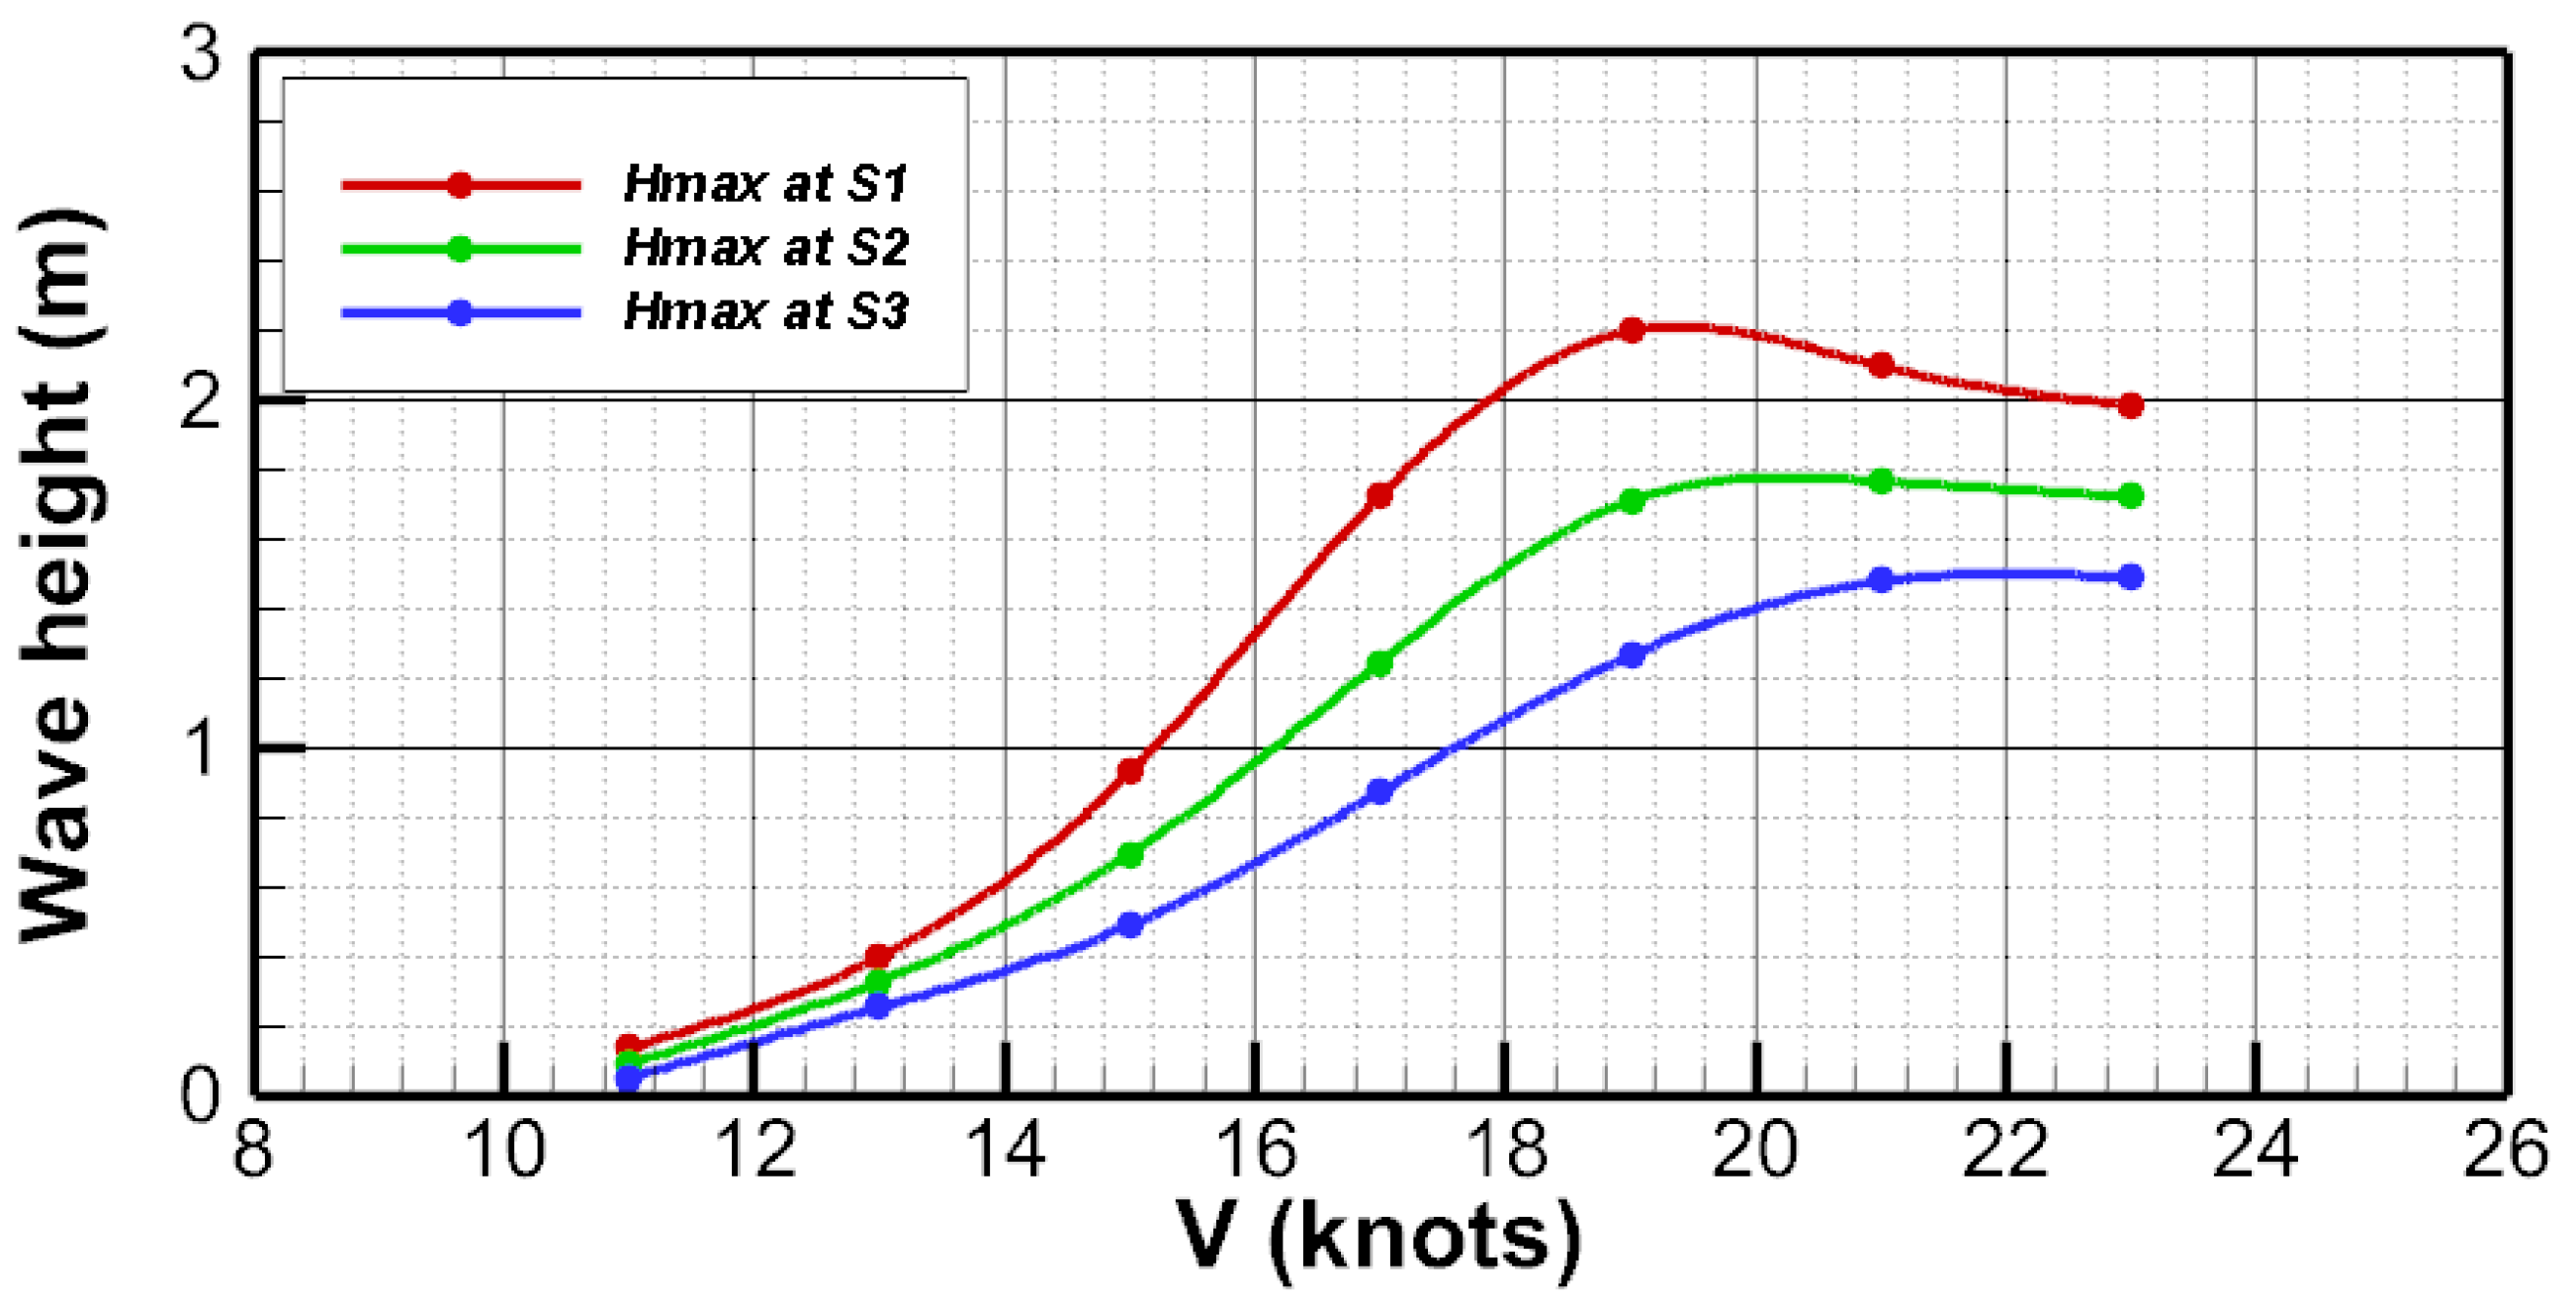
Figure 21 illustrates the variation in wave height with increasing ship speed at 1L, 2L, and 3L positions for the 2000-ton vessel. At 1L, the maximum wave crest of approximately 2.2 m occurs at 19 knots. The peak wave height shifts to 21 knots at 2L position with a maximum of about 1.75 m, and further delays to 23 knots at 3L position with a maximum height of approximately 1.5 m. This demonstrates that wave height attenuation becomes progressively slower with increasing ship speed, evidenced by the continued wave height growth in the supercritical regime at the 3L position.
As shown in Figure 22, it presents the variation in wave height with speed for a 6000-ton vessel at positions 1L, 2L and 3L. At the 1L position, the maximum wave crest appears at a ship speed of 25 knots, reaching approximately 2.6 m. At the 2L position, the maximum wave crest occurs at 27 knots, with a height of approximately 1.9 m. At the 3L position, the maximum wave crest is also observed at 27 knots, with a height of about 1.2 m. It can be observed that vessels with larger tonnage generate higher wave heights, and the wave attenuation is more pronounced. At lateral distances of 2L and 3L, the wave height continues to increase within the supercritical speed range.
The comparative analysis demonstrated that the CFD results and modified empirical formulas consistently predict maximum wave heights under both transcritical and supercritical conditions. Furthermore, the influence of ship tonnage, bulbous bow geometry and lateral separation on wave attenuation was clarified. These results provide a reliable basis for risk assessment and regulation of ship-induced waves in shallow waterways.

5. Conclusions

Through numerical simulations and theoretical analysis, this study systematically investigates the evolution characteristics of ship waves generated by vessels of different tonnages in shallow waters. The main conclusions are as follows:
(1)
Near the critical depth-based Froude number ( F h ≈ 1.0), ship waves reach their maximum height, exhibiting a pronounced nonlinear surge in the transcritical regime.
(2)
The CFD results for a Wigley hull show strong agreement with the proposed correction formulas, verifying their reliability for predicting wave heights in transcritical and supercritical regimes.
(3)
Comparative analysis of 2000-ton and 6000-ton vessels under identical depth-to-draft ratios revealed that larger vessels generate higher peak wave heights, but the presence of a bulbous bow significantly influences attenuation characteristics.
(4)
Lateral attenuation of ship waves was confirmed, with rapid decay near the hull and slower attenuation farther away, underscoring the importance of vessel separation in navigation safety.
The findings of this study provide a quantitative foundation for improving ship-wave risk assessments and formulating regulatory guidelines in shallow and restricted waterways. By clarifying the nonlinear evolution of wave heights across different speed regimes, as well as the attenuation effects of tonnage and hull geometry, the results contribute directly to the safe design of navigation channels, optimization of operational speeds, and planning of coastal infrastructure. These insights can support policymakers and engineers in mitigating erosion, reducing navigational risks, and ensuring safer coexistence between commercial shipping and coastal operations.

Author Contributions

Conceptualization, M.M. and I.L.; methodology, J.O. and D.S.; data curation, M.M. and I.L.; writing—original draft preparation, M.M.; writing—review and editing, J.O. and D.S. All authors have read and agreed to the published version of the manuscript.

Funding

This research was supported by Korea Institute of Marine Science & Technology Promotion (KIMST) funded by the Ministry of Oceans and Fisheries (RS-2021-KS211511).

Data Availability Statement

The original contributions presented in this study are included in the article. Further inquiries can be directed to the corresponding author.

Conflicts of Interest

The authors declare no conflicts of interest.

References

  1. Ravens, T.M.; Thomas, R.C. Ship wave-induced sedimentation of a tidal creek in Galveston Bay. J. Waterw. Port Coast. Ocean Eng. 2008, 134, 21–29. [Google Scholar] [CrossRef]
  2. Sun, X.; Cai, M.; Wang, J.; Liu, C. Numerical simulation of the Kelvin wake patterns. Appl. Sci. 2022, 12, 6265. [Google Scholar] [CrossRef]
  3. Thomson, W. On ship waves. Inst. Mech. Eng. 1887, 38, 409–434. [Google Scholar] [CrossRef]
  4. Havelock, T.H. The propagation of groups of waves in dispersive media, with application to waves on water produced by a travelling disturbance. Proc. R. Soc. Lond. A Math. Phys. Sci. 1908, 81, 398–430. [Google Scholar]
  5. Hogner, E. Contributions to the theory of ship waves. Ark. Mat. Astron. Fys. 1925, 17, 1–68. [Google Scholar]
  6. Wehausen, J.V.; Laitone, E.V. Surface Waves. In Encyclopedia of Physics; Springer: Berlin, Germany, 1960; Volume IX, pp. 446–778. [Google Scholar]
  7. Ursell, F. On Kelvin’s ship-wave pattern. J. Fluid Mech. 1960, 8, 418–431. [Google Scholar] [CrossRef]
  8. Cumberbatch, E. Effects of viscosity on ship waves. J. Fluid Mech. 1965, 23, 471–479. [Google Scholar] [CrossRef]
  9. Dawson, C.W. A practical computer method for solving ship-wave problems. In Proceedings of the 2nd International Conference on Numerical Ship Hydrodynamics, Washington, DC, USA, 19–21 September 1977; pp. 30–38. [Google Scholar]
  10. Ertekin, R.C.; Webster, W.C.; Wehausen, J.V. Waves caused by a moving disturbance in a shallow channel of finite width. J. Fluid Mech. 1986, 169, 275–292. [Google Scholar] [CrossRef]
  11. Kazi, S.A. Hydrodynamic modelling of vessel-induced water motion using Delft2D-Rivers. In Proceedings of the IHE, Paris, France, 5–9 October 1998. [Google Scholar]
  12. Wang, J.; Lee, T.S.; Shu, C. Numerical study of wave interaction generated by two ships moving parallely in shallow water. Comput. Methods Appl. Mech. Eng. 2001, 190, 2099–2110. [Google Scholar] [CrossRef]
  13. Davis, A.M.J.; Geer, J.F. The application of uniform-slender-body theory to the motion of two ships in shallow water. J. Fluid Mech. 1982, 114, 419–441. [Google Scholar] [CrossRef]
  14. Kijima, K. Manoeuvrability of ship in confined water. In Proceedings of the International Conference on Ship Manoeuvrability—Prediction and Achievement, London, UK, 29 April–1 May 1987. [Google Scholar]
  15. Vantorre, M.; Verzhbitskaya, E.; Laforce, E. Model test based formulations of ship-ship interaction forces. Ship Technol. Res. 2002, 49, 124–141. [Google Scholar]
  16. Lataire, E.; Vantorre, M.; Delefortrie, G. Captive model testing for ship to ship operations. In Proceedings of the International Conference Marine Simulation and Ship Maneuverability (MARSIM’09), Panama City, Panama, 17–20 August 2009; Panama Canal Authority: Panama City, Panama, 2009. [Google Scholar]
  17. Swiegers, P.B. Calculation of the Forces on a Moored Ship Due to a Passing Container Ship. Master’s Thesis, Stellenbosch University, Stellenbosch, South Africa, 2011. [Google Scholar]
  18. Miller, A. Interaction forces between two ships during underway replenishment. J. Navig. 2016, 69, 1197–1214. [Google Scholar] [CrossRef]
  19. Mursid, O.; Oterkus, E.; Oterkus, S. Coupled ship simulation in hydrodynamics and structural dynamics induced by wave loads: A systematic literature review. J. Mar. Sci. Eng. 2025, 13, 447. [Google Scholar] [CrossRef]
  20. Zhang, Y.; Li, H.; Wang, C.; Kim, H.; Park, Y. A numerical study of drift angle effect on hydrodynamic performance of a fully appended container ship in head waves. Ocean Eng. 2024, 313, 119343. [Google Scholar] [CrossRef]
  21. Htein, N.M.; Rahman, M.M.; Oka, M.; Okada, T. AI-based optimization techniques for hydrodynamic and structural design in ships: A review. J. Mar. Sci. Eng. 2025, 13, 1719. [Google Scholar] [CrossRef]
  22. Bagazinski, N.J.; Ahmed, F. ShipGen: A diffusion model for parametric ship hull generation with multiple objectives and constraints. J. Mar. Sci. Eng. 2023, 11, 2215. [Google Scholar] [CrossRef]
  23. Wu, C.; Zhou, D.; Gao, L.; Miao, Q.M. CFD computation of ship motions and added resistance for a high speed trimaran in regular head waves. Int. J. Nav. Archit. Ocean Eng. 2011, 3, 105–110. [Google Scholar] [CrossRef]
  24. Ngoc, P.M.; Kim, B.; Yang, C. A velocity prediction program for an autonomous sailing drone. J. Adv. Mar. Eng. Technol. 2021, 45, 288–299. [Google Scholar] [CrossRef]
  25. Yaakob, O.; Ahmed, Y.M.; Rashid, M.F.A.; Elbatran, A.H. Determining ship resistance using computational fluid dynamics (CFD). J. Transp. Syst. Eng. 2015, 2, 20–25. [Google Scholar]
  26. Perez, G.; Tan, M.; Wilson, P.A. Validation and verification of hull resistance components using a commercial CFD code. In Proceedings of the 11th Numerical Towing Tank Symposium, Brest, France, 7–9 September 2008. [Google Scholar]
  27. Lv, X.; Wu, X.; Sun, J.; Tu, H. Trim optimization of ship by a potential-based panel method. Adv. Mech. Eng. 2013, 5, 378140. [Google Scholar] [CrossRef]
  28. Nam, B.W.; Park, J.Y. Numerical simulation for a passing ship and a moored barge alongside quay. Int. J. Nav. Archit. Ocean Eng. 2018, 10, 566–582. [Google Scholar] [CrossRef]
  29. Duarte, H.O.; Droguett, E.L.; Martins, M.R.; Lutzhoft, M.; Pereira, P.S.; Lloyd, J. Review of practical aspects of shallow water and bank effects. Int. J. Marit. Eng. 2016, 158, 177–186. [Google Scholar] [CrossRef]
  30. Yan, K.; Oh, J.; Seo, D.W. Numerical Study on the Performance of Resistance various Trim Tab’s Position and Size for High-Speed Small Boat. J. Korea Acad.-Ind. Coop. Soc. 2023, 24, 206–218. [Google Scholar]
  31. ITTC Resistance Committee. Cooperative Experiments on Wigley Parabolic Models in Japan. In 17th ITTC Resistance Committee Report, 2nd ed.; Resistance Committee of the International Towing Tank Conference (ITTC): Varna, Bulgaria, 1983. [Google Scholar]
  32. Blaauw, H.G.; van der Knaap, F.C.M.; de Groot, M.T.; Pilarczyk, K.W. Design of Bank Protection of Inland Navigation Fairways; Delft Hydraulics Laboratory: Delft, The Netherlands, 1984. [Google Scholar]
  33. Lee, J.M. Study on the Characteristics of Ship Wave Generation Due to Ship Traffic in Busan North Port. Master’s Thesis, Pukyong National University, Busan, Republic of Korea, 2022. [Google Scholar]
  34. Kang, Y.S.; Kim, P.J.; Hyun, S.K.; Sung, H.K. Numerical simulation of ship-induced wave using FLOW-3D®. J. Korean Soc. Coast. Ocean Eng. 2008, 20, 255–267. [Google Scholar]
  35. Shin, S.H.; Jeong, D.D. Numerical prediction of ship induced wave and its propagation using nonlinear dispersive wave model. J. Navig. Port Res. 2003, 27, 527–537. [Google Scholar]
  36. Lee, D.S.; Kwon, K.D.; Jo, H.S. A study on the greenhouse gas emission from ships with training ship HANBADA. J. Korean Soc. Mar. Eng. 2014, 38, 240–245. [Google Scholar] [CrossRef]
Figure 1. Ship wave in shallow water [2].
Jmse 13 01965 g001
Figure 2. Ship wave pattern: (a) Subcritical Speed Regime; (b) Transcritical Speed Regime; (c) Supercritical Speed Regime.
Jmse 13 01965 g002
Figure 3. Wigley hull geometry.
Jmse 13 01965 g003
Figure 4. Wigley hull calculated the water depth.
Jmse 13 01965 g004
Figure 5. Wigley hull grid system.
Jmse 13 01965 g005
Figure 6. Wave surface diagram of Wigley hull: (a) 5 knots; (b) 9 knots; (c) 13 knots; (d) 17 knots.
Jmse 13 01965 g006
Figure 7. Wave height change at the side of the Wigley hull.
Jmse 13 01965 g007
Figure 8. Comparison of the ship wave height between theoretical method and presented CFD results.
Jmse 13 01965 g008
Figure 9. Comparison of the ship wave height between Modified Formula and presented CFD results.
Jmse 13 01965 g009
Figure 10. The 2000-ton class vessel geometry.
Jmse 13 01965 g010
Figure 11. Computational domain of ship waves of the 2000-ton class vessel.
Jmse 13 01965 g011
Figure 12. Wave surface diagram of the 2000-ton class vessel: (a) 11 knots; (b) 15 knots; (c) 19 knots; (d) 23 knots.
Jmse 13 01965 g012
Figure 13. Wave height variation at the side of the 2000-ton class vessel.
Jmse 13 01965 g013
Figure 14. The maximum wave height varies with F h (2000-ton).
Jmse 13 01965 g014
Figure 15. The 6000-ton class vessel geometry.
Jmse 13 01965 g015
Figure 16. Computational domain of ship waves of the 6000-ton class vessel.
Jmse 13 01965 g016
Figure 17. Wave surface diagram of the 6000-ton class vessel: (a) 15 knots; (b) 19 knots; (c) 23 knots; (d) 27 knots.
Jmse 13 01965 g017
Figure 18. Wave height variation at the side of the 6000-ton class vessel.
Jmse 13 01965 g018
Figure 19. The maximum wave height varies with F h (6000-ton).
Jmse 13 01965 g019
Figure 20. Schematic Diagram of Wave Height Detection Line.
Jmse 13 01965 g020
Figure 21. Wave height variation with increasing velocity at 1L, 2L, and 3L (2000-ton).
Jmse 13 01965 g021
Figure 22. Wave height variation with increasing velocity at 1L, 2L, and 3L (6000-ton).
Jmse 13 01965 g022
Table 1. Wigley hull’s principal dimension.
Parameters (Symbol)Value (Unit)
Length (L) 30   m
Breadth (B) 3   m
Height (H) 3.75   m
Draft (T) 1.875   m
Wetted surface area (Sw) 133.9   m 2
Displacement   volume   ( ) 75   m 3
Mass   ( m ) 76 , 875   k g
Table 2. F h varies with velocity.
V  (kts) V k  (m/s) F h
55.4250.474
70.663
90.853
111.042
131.232
151.421
171.611
Table 3. The 2000-ton class vessel’s principal dimension.
Parameters (Symbol)Value (Unit)
Length (L) 76.25   m
Length Between Perpendicular (LBP) 70   m
Breadth (B) 12   m
Draft (T) 4   m
Displacement   volume   ( ) 2477.34   m 3
Mass   ( m ) 2 , 539 , 273.5   k g
Table 4. The 2000-ton class vessel F h varies with velocity.
V  (kts) V k  (m/s) F h
117.9830.708
130.837
150.966
171.095
191.223
211.352
231.481
Table 5. The 6000-ton class vessel’s principal dimension.
Parameters (Symbol)Value (Unit)
Length (L) 117.2   m
Length Between Perpendicular (LBP) 104   m
Breadth (B) 17.8   m
Draft (T) 5.915   m
Displacement   volume   ( ) 6248.5   m 3
Mass   ( m ) 6 , 404 , 712.5   k g
Table 6. The 6000-ton class vessel F h varies with velocity.
V  (kts) V k  (m/s) F h
159.6350.800
170.907
191.014
211.120
231.227
251.334
271.440
Disclaimer/Publisher’s Note: The statements, opinions and data contained in all publications are solely those of the individual author(s) and contributor(s) and not of MDPI and/or the editor(s). MDPI and/or the editor(s) disclaim responsibility for any injury to people or property resulting from any ideas, methods, instructions or products referred to in the content.