Abstract
This study investigates the hydrodynamic loads of “Ningde No. 1” offshore aquaculture under current-only conditions using a fluid–structure interaction (FSI) approach with the computational fluid dynamics (CFD) solver OpenFOAM. A porous-media-based model is applied to simulate net-induced drag, while the rigid framework is resolved using a large eddy simulation (LES) turbulence model. A comprehensive set of 350 CFD simulations is performed, with varying flow velocities, flow directions, draft depths, and existence of nets. The results reveal that the load on this fishing facility in the streamwise direction (Fx) increases monotonically with flow velocity, direction, and draft. The lateral (Fy) and vertical (Fz) loads exhibit non-linear trends, peaking at a specific flow direction (approximately 60°) and draft levels (around 11.5 m). The fishing nets substantially increase the streamwise load by up to 80%, while their influence on the lateral forces is dependent on submergence depth. To efficiently predict hydrodynamic loads without performing additional and lengthy CFD simulations, a physics-informed neural network (PINN) is trained using the simulated data. The PINN model is found able to accurately reproduce the hydrodynamic force across a wide range of current conditions, offering a practical and interpretable surrogate approach for structural design optimization and mooring system development in offshore aquaculture industry.
1. Introduction
Aquaculture has become a vital component of global food security, with China maintaining its position as the world’s leading producer of aquatic products for decades [1,2]. However, the country’s marine aquaculture sector continues to face critical challenges, particularly from the ecological sustainability, spatial limitations of nearshore waters, and quality control of its outputs. The increasing demand for higher productivity, environmental sustainability, and resilience against climate-related events has catalyzed the transition of marine aquaculture toward deeper and more dynamic offshore regions. The push toward deep-sea aquaculture calls for a structure shift, moving from traditional nearshore cage systems to robust, safe, and technologically advanced offshore farming platforms that can withstand extreme marine environments [3,4].
To address these challenges, the development of large-scale offshore aquaculture platforms has garnered significant attention. Such platforms typically combine rigid support structures with flexible netting systems and are subjected to complex fluid–structure interactions (FSI). Unlike conventional fixed marine installations or small-scale nearshore cages, these hybrid systems must maintain structural integrity and operational functionality under harsh conditions, requiring sophisticated design methodologies that integrate mechanical robustness with hydrodynamic efficiency. Over the past decade, considerable research has been conducted on the hydrodynamics of aquaculture nets and structures. Bi et al. [5,6] investigated flow-induced net deformation and velocity reduction using both numerical and experimental approaches, and they found that the flow velocity reduction tended to increase with an increasing inclination angle between the plane net and the flow direction. Swift et al. [7] observed that biological fouling can more than double the drag force on net structures. Moe-Føre et al. [8,9,10] proposed hydrodynamic models for fish nets and validated the results against experimental data for nets with different solidities. In their hydrodynamic model, solidity was measured with image analysis, which was more consistent and objective than manual measurements. Balash et al. [11] estimated the hydrodynamic loads on net in steady and oscillating flows, and they found that the conventional non-dimensional parameters Keulegan–Carpenter and Reynolds numbers are not applicable to nets in oscillating flow. Kristiansen and Faltinsen [12] introduced a generalization numerical model of Løland’s formulas (1991) to assess the current loads on aquaculture nets. Their new model considered the function of the Reynolds number, which is important in particular when validating against model tests.
More recent work has focused on integrating hydrodynamic models with realistic aquaculture structures. Li et al. [13,14] studied the orientation and current–wave interaction of single-point moored offshore fish farms. To reduce computational complexity, the net structure in their study was simplified and modeled as a rigid element. Jin et al. [15] applied linear potential theory hydrodynamic models to optimize the motion and mooring response of Ocean Farm 1. In this study, the calculation of the net force was realized by using a Dynamic Linked Library (DLL) in SIMO. However, the flow reductions after nets were still based on an empirical velocity reduction factor. Martin et al. [16] and Wang et al. [17] used the REEF3D platform to simulate deep-sea fish cages under irregular waves and current forcing. Their fluid structure interaction method could better predict the flow reduction behind nets. Zhao et al. [18] conducted wave tank experiments on “Ocean Farm 1” and demonstrated the influence of wave parameters and draft on structural response. Cheng et al. [19] combined the open-source programs (OpenFOAM + Code_Aster) for aquaculture structures to study their FSI problems. This method can be further developed for more complex structure under offshore environmental conditions. Mi et al. [20] developed a novel multi-component coupled numerical model for aquaculture systems in OpenFOAM, integrating two open source tools, MoorDyn and EndoBeams. This proposed numerical model was a robust tool for predicting the complex dynamics of aquaculture systems in different environments.
In parallel, the applications of physics-informed neural network (PINN) have been increasingly explored in marine and fluid dynamics. For example, Yin et al. [21] applied a PINN model to predict the flow-induced vibration of a cylinder in an offshore engineering setting, demonstrating how structure response under hydrodynamic loading can be rapidly and accurately estimated. Xu et al. [22] proposed a PINN model to identify and predict the dynamic behavior of unmanned surface vehicles (USVs), demonstrating that the PINN model can effectively combine data-driven learning with physical models to achieve superior generalization and accuracy in modeling surge, sway, and yaw motions using limited experimental data. Peng et al. [23] presents a novel approach using PINN to model nonlinear free surface wave propagation, demonstrating that the method can accurately simulate both solitary and regular wave scenarios and solve inverse problems in two-dimensional water wave dynamics. Lu et al. [24] introduced fully nonlinear free surface PINNs (FNFS-PINNs) for modeling complex wave propagation in nonlinear potential flows, showing that the approach effectively handles time-dependent domains and variable scales, and it was validated through multiple wave scenarios, laying the groundwork for broader applications in free surface flow problems. Collectively, these studies underscore the growing potential of PINNs to complement high-fidelity CFD, particularly in cases where computational cost is limited.
In China, the development of large-scale offshore aquaculture infrastructure has begun in recent years but has advanced rapidly due to increasing government investment in marine ranching and maritime industry innovation. Since 2017, several institutions have collaborated on the development of offshore aquaculture platforms such as “Shenlan No. 1” and “Ningde No. 1.” Despite these advances, most existing work either focuses on small-scale systems or simplifies the platform into a single-component system. There is still a lack of systematic methodologies capable of analyzing large-scale aquaculture platforms operating under full-scale offshore conditions. Moreover, few studies provide a comprehensive database of high-fidelity simulations that account for variations in environmental parameters such as current velocity, incident flow angle, submergence depth, and net presence.
To fill this gap, this study focuses on the “Ningde No. 1” platform, which is China’s first full-scale, semi-submersible deep-sea aquaculture platform with eight compartments and adjustable drafts. The platform is 120 m long, 56 m wide, and 12.5 m high (32 m in total with center column), with a total aquaculture volume of 65,000 m3 and a designed capacity of up to 780 tons of fish. The main parameters of this floater are given in Table 1 and are illustrated in Figure 1. The “Ningde No. 1” platform employs netting made of ultra-high molecular weight polyethylene (UHMWPE), with a mesh size of 60 mm and a twine diameter of 4 mm, resulting in a solidity of approximately 0.13. The nets are connected to the main frame through pre-tensioned ropes, which prevent large deformations under waves and current. The net covers the whole framework and divides the total aquaculture volume into eight independent fish-rearing chambers.

Table 1.
The main parameters of Ningde No.1.
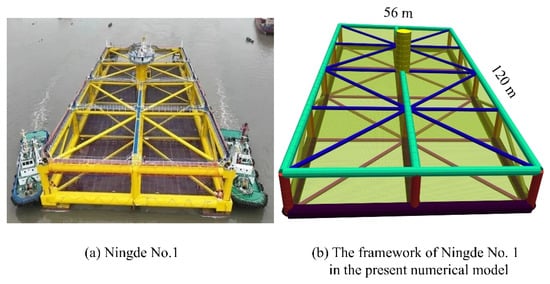
Figure 1.
The main framework structure and the numerical model for Ningde No.1.
In this study, a numerical fluid–structure interaction (FSI) framework is developed within the OpenFOAM environment to investigate the hydrodynamic response of the semi-submersible offshore aquaculture platform Ningde No. 1. The flexible net structures are represented using a porous media formulation, and turbulence is resolved through a large-eddy simulation (LES) approach. This full-scale CFD framework enables a systematic evaluation of hydrodynamic loads under varying current velocities, flow directions, and draft depths.
To address the high computational cost associated with extensive CFD analyses during design optimization, a physics-informed neural network (PINN) model is further developed and trained using the CFD dataset. The PINN integrates three governing-equation constraints into its loss function, ensuring physical consistency while providing the rapid and accurate prediction of hydrodynamic forces across a wide range of operating conditions.
The combined use of full-scale LES and a physics-informed neural network represents a novel hybrid physics–data-driven approach for offshore aquaculture hydrodynamics. This framework advances current modeling methods by enhancing predictive capability, improving computational efficiency, and increasing interpretability through physics-guided learning. The proposed methodology therefore offers a new framework for the design, safety assessment, and mooring optimization of large offshore aquaculture platforms.
2. Mathematical Modelling
2.1. Governing Equations and Assumptions
The simulations are based on the incompressible Navier Stokes equations solved using the finite volume method (FVM). The fluid domain is discretized into a grid of cells, and the governing equations for mass and momentum conservation are presented below.
where u is the flow velocity, p is the pressure, ρ is the fluid density, ν and νT are the kinematic and turbulent viscosities, respectively, g is the gravitational acceleration, and Spz is the source term representing net-induced drag.
The source term, Spz, is used to account for the resistance force from nets. This term is zero for most of the computational domain and only has non-zero value in the exact cells belonging to nets. The value of Spz is determined based on the conservation of momentum; that is, the hydrodynamic loads acting on the nets are the same in magnitude but opposite in direction to the resistance forces acting on the fluid. The detail derivation for this term is available in the literature [19,25], and this term is shown as follows:
where CD and CL represent the drag and lift coefficients, Vi is the cell volume, T is the thickness of the source zone, and iD and iL are unit vectors corresponding to drag and lift force directions, respectively. U∞ is the undisturbed flow velocity and Uc is the local cell-centered flow velocity in the source zone.
Force coefficients (i.e., CD and CL) for nets are usually determined through experiments using the undisturbed flow velocity U∞. This velocity is usually unknown for the net within the wake range of a neighboring net, even in CFD simulations. However, the local flow velocity Uc is always available in CFD simulations. Thus, an empirical correction, as shown in Equation (4) is applied to determine U∞ from Uc [26].
In this study, we adopt CD and CL from the work by Løland [27]. In Equations (5) and (6), α is the local angle between the normal vector of a net panel and the flow direction. In Equation (7), the solidity Sn is calculated for the square shape mesh net in Figure 2a, where dw is the twine diameter and L is the half-mesh size, as illustrated in Figure 2. For a typical net in marine aquaculture structures, Sn is in the range from 0.1 to 0.4.
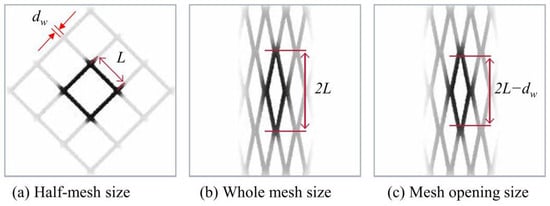
Figure 2.
Definitions of mesh size, reproduced from [28].
2.2. Turbulence Modeling
Large eddy simulation (LES) is adopted to resolve the unsteady turbulent flow around the platform and net structures. LES directly captures the energy-containing large-scale eddies while modeling the influence of the unresolved small-scale motions through a sub-grid scale (SGS) model. In this study, the one-equation eddy-viscosity Smagorinsky model is employed, which solves a transport equation for the sub-grid turbulent kinetic energy. The model constant and the turbulent Prandtl number are used following best practice for external marine flows [29]. The filter length scale Δ is determined from the cubic root of the cell volume Δ = Vc1/3. Given the nearly uniform cell aspect ratio in the mesh (confirmed through mesh quality metrics), such estimation of Δ is sufficiently accurate. The mesh is locally refined around the netting structure and platform frames to ensure the appropriate resolution of flow separation, recirculation, and wake dynamics. LES is particularly crucial in resolving the anisotropic vortex shedding and flow-induced vibration modes, which are critical to predicting hydrodynamic loads and assessing the design of mooring systems and structural fatigue.
2.3. Numerical Solution
The numerical simulations are conducted using OpenFOAM-v2012, an open-source CFD framework widely adopted for offshore and marine engineering simulations. The transient, incompressible Navier–Stokes equations are solved using the PimpleFoam solver, which combines the features of the PISO (Pressure Implicit with Splitting of Operators) and SIMPLE algorithms to allow for the efficient convergence of pressure–velocity coupling.
The PIMPLE algorithm is an iterative pressure–velocity coupling method, where a predictor–corrector strategy is applied at each time step. The temporal discretization used a second-order implicit backward Euler scheme, ensuring numerical stability under Courant number less than 1. Figure 3 illustrates the computational mesh around the platform, including refined net and structure zones. The boundary conditions used for various patches (inlet, outlet, walls, and symmetry planes) are summarized in Table 2.
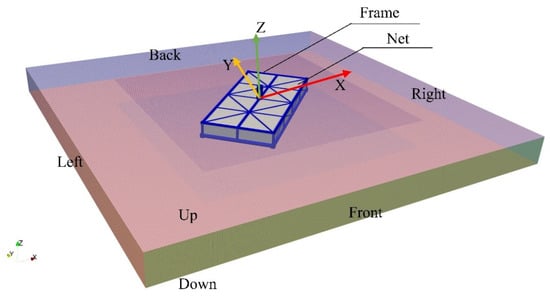
Figure 3.
Computational domain.
Table 2.
Boundary conditions.
2.4. Model Validation
To ensure the credibility and accuracy of the numerical simulation framework, a validation study is conducted against the published experimental data available in the literature. Specifically, the particle image velocimetry (PIV) experiments reported by Bi et al. [5,6] are used. These experiments investigated flow behavior around net panels at varying angles of attack under uniform current conditions and provide reliable references for evaluating porous-media-based flow models.
Figure 4 illustrates the experimental setup used in the works by Bi et al. [5,6], where a uniform incoming flow with a velocity of 0.17 m/s interacts with a single net panel positioned at different angles ranging from 0° to 60°. To quantitatively validate the empirical velocity correction model proposed in Equation (5), the local flow velocity within the net is extracted from the experimental visualizations. The original PIV velocity contour images are first converted to grayscale, and then noise filtering is applied. Subsequently, the pixel intensities near the center of the net panel are averaged to approximate the local velocity value at the center of the net structure, as shown in Figure 5.
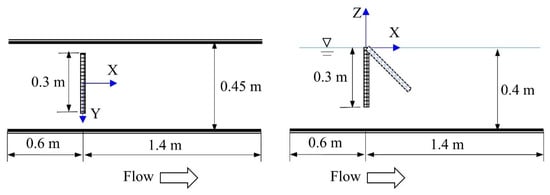
Figure 4.
The numerical simulation setup for the validation study [5,6].
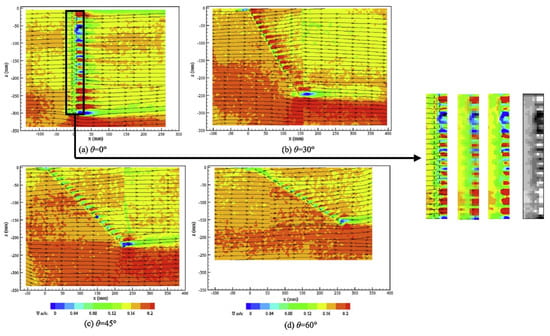
Figure 5.
The flow velocity of Uc in Equation (4) is extracted based on the PIV experiment by Bi et al. [5,6].
To evaluate the accuracy of the porous media model implemented in this study, we compare predictions from the two velocity correction methods proposed by Cheng et al. [19] and by Martin et al. [16]. Table 3 presents a side-by-side comparison of the measured local flow velocity from PIV images, the predicted values using the formula from two velocity correction methods, and their relative deviations from the undisturbed inflow velocity of 0.17 m/s. Obviously, the model by Cheng et al. [19] consistently outperforms the method proposed by Martin et al. [16]. Cheng’s correction produces lower velocity deviation across all angles, confirming its effectiveness in current-only porous drag modeling. These findings confirm that the porous media representation combined with Equation (5) correction is a reliable and robust approach for simulating net-induced flow resistance in large-scale aquaculture structures under current-only conditions.
Table 3.
Comparison of the predicted flow velocity U∞.
3. Results and Discussion
3.1. Convergence Study
To ensure the reliability of numerical simulations, a mesh independence study is conducted using a standard test case with a uniform inflow velocity of 1 m/s, a flow direction of 45° relative to the platform’s longitudinal axis, and a draft depth of 11.5 m. In this case, the net structures are excluded for the time being to simplify the geometry and to focus solely on mesh sensitivity. The loading duration is set to 600 s.
Five sets of background Cartesian grids are generated using BlockMesh [30], each with a progressively finer resolution. The key parameters of these meshes, including the number of cells, number of nodes, and base mesh size, are summarized in Table 4. It is important to note that, due to local refinement near the platform, the smallest actual cell size in the computational domain is approximately one-fourth of the base mesh size. Figure 6 shows the mesh size of Mesh3 together with the aquaculture net and its corresponding source zones in CFD simulations.
Table 4.
Parameters for mesh.
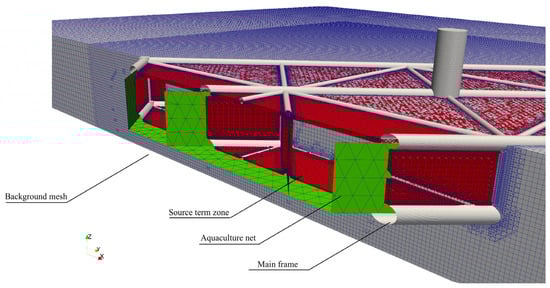
Figure 6.
The model for the net in CFD simulations; the background mesh is based on Mesh3.
Figure 7 shows the flow fields obtained from different mesh resolutions. As expected, the quality and clarity of the turbulent wake behind the “Ningde No. 1” platform improve with increasing mesh resolution. In the coarsest grids (Mesh1 and Mesh2), the wake structures are poorly resolved or entirely missing, which may compromise the accuracy of hydrodynamic force prediction. Starting from Mesh3, large-scale eddies and vortex structures in the wake begin to emerge clearly, suggesting an improved ability to capture the turbulent flow features critical for accurate force estimation.
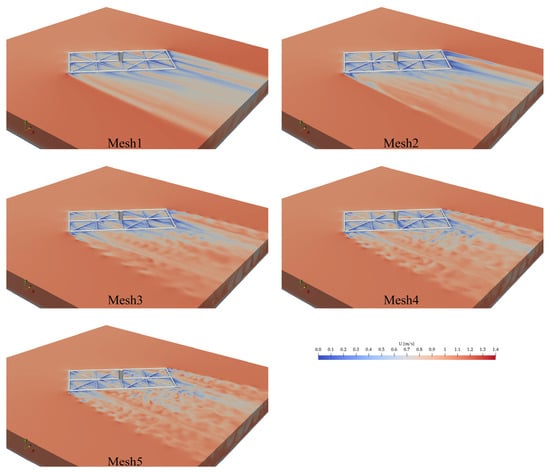
Figure 7.
Flow field results using different meshes.
Figure 8 presents the time history of the total hydrodynamic force acting on the platform under different mesh resolutions. The results show that the force approaches a quasi-steady state when its acting duration exceeds 300 s. However, small fluctuations persist even after convergence, which are attributed to inherent turbulent unsteadiness rather than numerical instability.
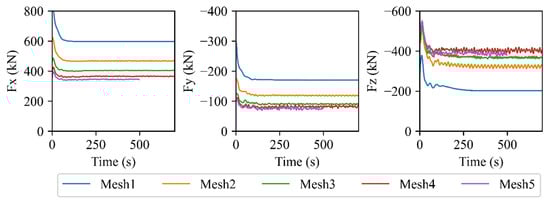
Figure 8.
Current load results using different meshes.
A statistical comparison of the steady-state hydrodynamic forces for each mesh is provided in Table 5. The results indicate that Mesh3 offers a good balance between accuracy and computational cost, while the forces predicted using Mesh3 differ by about 20% from those obtained with the finest grid (Mesh5). This error is considered acceptable in the context of structural design, where safety margins are essential. On the other hand, Fz is only slightly underestimated by less than 5%. As a result, Mesh3 is selected as the baseline mesh configuration for all subsequent CFD simulations in this study.
Table 5.
Converged current load using different meshes.
3.2. Environmental Conditions
To comprehensively evaluate the hydrodynamic response of the “Ningde No. 1” offshore aquaculture platform under varying marine conditions, a parametric study is conducted using a total of 350 simulation cases. These cases are generated by systematically varying four key environmental and structural parameters that result in a full factorial design with 5 × 7 × 5 × 2 = 350 condition combinations.
These combinations are listed in Table 6. The ranges of current velocities and directions are selected in accordance with the typical hydrodynamic conditions observed at the platform’s deployment site, ensuring that the tested scenarios reflect realistic operational environments. Throughout all cases, the global computational domain remains fixed to preserve mesh consistency and ensure numerical comparability between simulations.
Table 6.
Parameters for simulations.
3.3. Hydrodynamic Load from CFD Simulations
3.3.1. Hydrodynamic Load on the Frame Under Different Flow Velocities
Figure 9 presents the hydrodynamic load acting on the “Ningde No. 1” platform frame under different current velocities without fishing nets. The following two flow directions are considered: 0° (streamwise) and 90° (crosswise), with a fixed draft of 11.5 m. The force fluctuations are indicated by error bars, while average values are used for trend analysis.
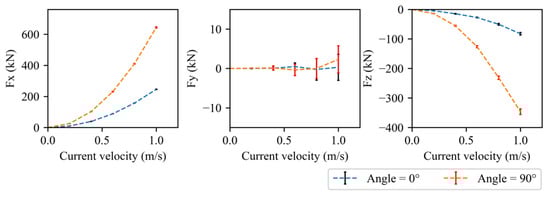
Figure 9.
Current loads on the main framework varying with current speeds; in the case θ = 0° and 90°, d = 11.5 m.
Obviously, the force Fx, aligned with the incoming flow, is the dominant component in design. Results show a nonlinear increase in Fx as the current velocity increases. Notably, in the 90° inflow case, the projected area of the structure normal to the flow is significantly larger than that in the 0° case, leading to substantially higher hydrodynamic forces. The fluctuations in Fx are fairly minor, indicating a stable response in the streamwise direction.
The force Fy is perpendicular to the incoming flow. Due to the geometric symmetry of the structure, the mean force in the Fy direction is expected to be zero, which is confirmed by the simulation results. However, Fy exhibits considerable unsteady fluctuations, which grow with increasing current velocity. This is attributed to turbulent wake dynamics and flow separation around the frame, especially at higher flow speeds. Given that the Reynolds number is approximately 2 × 10⁶ when current velocity is 1 m/s, the flow is fully turbulent. In this regime, vortex shedding and wake instabilities become more pronounced, leading to stronger and more irregular force oscillations.
In vertical direction, the net hydrodynamic force Fz acts downward and increases with current velocity. This indicates a trend toward downward motion of the floater under stronger current conditions, which is critical for evaluating platform stability and mooring tension.
Figure 10 provides visualizations of the surrounding flow field under 0° current incidence and a draft of 11.5 m. As the current velocity increases, the extent of the disturbed flow region, particularly around the sides of the frame, becomes more pronounced. Such an enlarged wake zone is responsible for the increased fluctuating loads observed in Fy and contributes to the overall drag force on the frame.
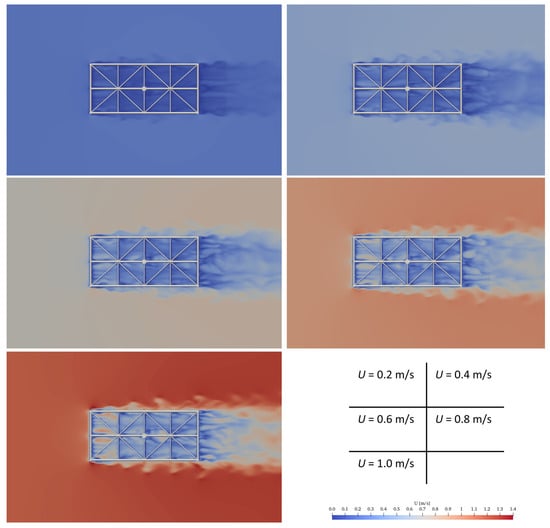
Figure 10.
Flow field around the main framework under five different current velocities when θ = 0°, d = 11.5 m.
3.3.2. Hydrodynamic Load on the Frame Under Different Drafts
Figure 11 presents the three simulated hydrodynamic force components acting on the “Ningde No. 1” platform under varying draft conditions. The analysis considers two flow directions under a constant current velocity of 0.8 m/s.
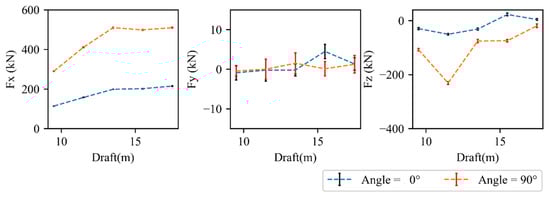
Figure 11.
Current loads on the main framework in the case θ = 0° and 90°, U = 0.4m/s.
Fx initially increases with draft depth. This trend continues until the entire structural frame is fully submerged. Beyond full submergence, further increases in draft result in negligible changes in Fx, suggesting that the majority of the flow-induced drag is governed by the wetted projected area rather than deeper submerged portions. As expected, Fx is significantly higher in 90° flow direction than in 0°, due to the increased projected area normal to the incoming flow. The increase of Fx with drafts suggests that mooring line pretension and anchor holding capacity must account for the larger horizontal loads when the platform operates at deeper drafts.
Fy remains close to zero in mean value because of the platform’s geometric symmetry. However, notable unsteady fluctuations are observed, and the amplitude of these fluctuations grows with increasing draft. Once the structure is fully submerged, these fluctuations stabilize, indicating a transition to a quasi-steady flow regime where the platform’s interaction with the free surface becomes minimal.
Fz is consistently downward and increases with draft. The maximum downward force occurs at a draft of 11.5 m under a 90° flow direction, indicating a strong vertical momentum transfer from the flow to the structure, likely due to the enhanced flow separation and wake development at intermediate-to-deep submergence levels, as shown in Figure 12.
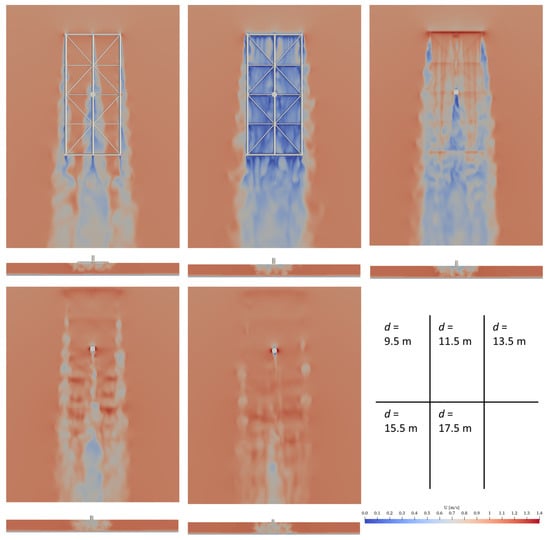
Figure 12.
Flow field from top and back under different drafts in the case of θ = 0°, U = 0.8 m/s.
Figure 12 illustrates the surrounding flow field near water surface at a flow direction of 0° and a velocity of 0.8 m/s for various draft conditions. As the draft increases, the size and intensity of the wake region behind and around the structure reduces, and the surface disturbance becomes more pronounced. When the draft reaches 11.5 m, a prominent wake pattern emerges at the free surface behind the frame, coinciding with the peak of Fz. This suggests that wake-induced downward suction and pressure imbalances contribute significantly to Fz under such conditions.
3.3.3. Hydrodynamic Load on the Frame Under Different Flow Directions
Figure 13 presents the hydrodynamic forces under various flow directions. The simulations are conducted at a fixed flow velocity of 0.8 m/s and three different draft levels, 9.5 m, 11.5 m, and 13.5 m. The simulations focus on how Fx, Fy, and Fz vary with increasing incident angles.
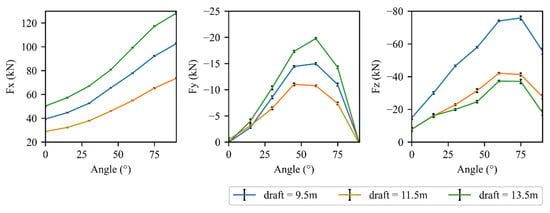
Figure 13.
Current loads on the main framework under different flow directions in the case of U = 0.8 m/s.
Fx represents the force in the streamwise direction. It shows a monotonic increase with the flow direction. Interestingly, the rate of increase in Fx appears largely independent of draft depth, indicating that the dominant contribution to Fx stems from the effective projected area exposed to the flow, which increases geometrically with the flow direction.
In contrast, the Fy component, representing the lateral force perpendicular to the longitudinal axis, exhibits a non-monotonic trend. Fy increases initially with flow direction, reaches a maximum between approximately 60° and 70°, and then begins to decrease. This behavior closely resembles the shape of a half-sine function, which is consistent with theoretical expectations of the transverse force on symmetric bluff bodies.
The Fz component, which corresponds to vertical hydrodynamic force, is consistently downward across all conditions. Similar to Fy, Fz also exhibits a nonlinear trend that increases with flow direction up to a maximum near 70–75° and then decreases. This indicates a strong dependence of vertical loading on the formation of flow separation and wake structures, which intensifies with increased flow obliqueness up to a certain threshold.
Figure 14 provides flow field visualizations for six flow directions, in the case of U = 0.8 m/s, d = 11.5 m. As the angle increases, the wake region behind and around the platform becomes increasingly pronounced, particularly on the leeward side. These wake structures correlate well with the increased Fy and Fz at mid-range angles, implying that vortex shedding and asymmetrical flow separation play a major role in shaping the platform’s unsteady hydrodynamic response.
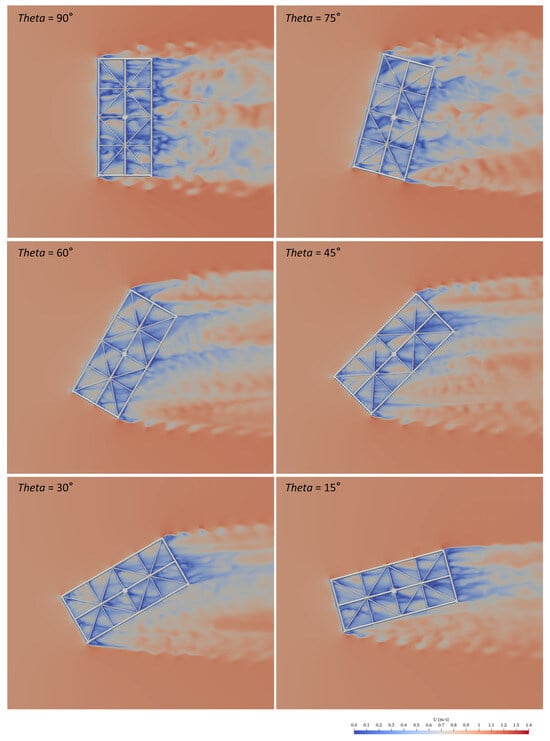
Figure 14.
Flow field under different flow directions in the case of U = 0.8 m/s, d = 11.5 m.
From a design perspective, the dependence of hydrodynamic loads on flow direction shows the importance of orienting the platform and its mooring layout to minimize exposure to oblique currents. The sharp rise in Fx and Fy between 65° and 75° suggests that these directions are critical for design load assessment and dynamic analysis. Mooring lines on the leeward side will experience higher cyclic tension due to amplified lateral and vertical loads, which should be reflected in line sizing and fatigue design.
3.3.4. Hydrodynamic Load with and Without Net
Figure 15 illustrates the total hydrodynamic forces acting on the platform with and without nets at a fixed flow velocity of 0.8 m/s. They are presented as functions of both flow direction and draft depth. As expected, the presence of the net contributes additional drag, especially in the streamwise direction in line with Fx. However, the overall trends in force variation with respect to flow direction and draft depth remain qualitatively similar regardless of the net presence of nets.
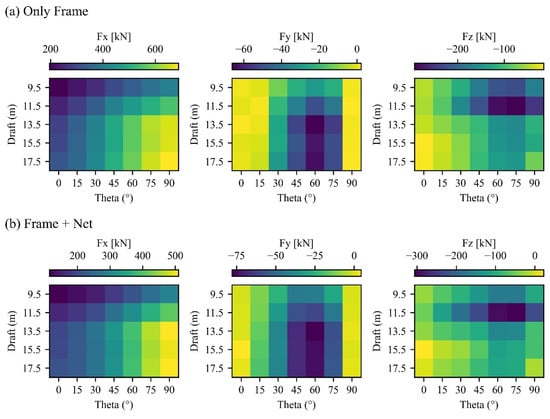
Figure 15.
The total current loads on the floater with/without nets in the case of U = 0.8 m/s.
To more clearly demonstrate the effect of the nets, Figure 16 compares the absolute force magnitudes with and without nets under the same environmental conditions. In the Fx direction, the presence of nets leads to a significant increase in drag force across all flow directions and draft levels. Interestingly, in the Fy direction, the opposite trend is observed, i.e. the nets appear to reduce the magnitude of the transverse force. This may be due to the viscous damping effect introduced by the net, which disrupts lateral flow structures and reduces unbalanced vortex shedding.
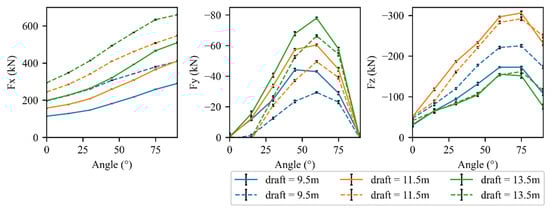
Figure 16.
The effect of nets on the current loads; the dashed lines represent simulation results on the structure with nets, and the solid lines correspond to the absence of nets.
The effect of the net on Fz is more complex and dependent on draft depth. As shown in Figure 16, when the draft is shallower than 11.5 m, the presence of nets increases Fz. However, for drafts exceeding 11.5 m, nets actually lead to a slight reduction of Fz. This nontrivial interaction likely results from the altered wake structures and pressure recovery patterns induced by the porous resistance of nets, and this is explained in the next figure.
To further elucidate these effects, Figure 17 illustrates the flow field surrounding the platform under a representative condition of current speed of 0.8 m/s, flow direction of 45°, and draft depth of 11.5 m, both with and without nets. The top view clearly shows that the presence of the nets expands the wake region behind the structure and reduces the velocity within this wake. From the rear view, it is evident that nets significantly lower the velocity in the wake zone and enhance the vortex structures, making them more pronounced and coherent. These enhanced vortex patterns result from flow separation caused by increased drag and blockage due to the porous net layer.
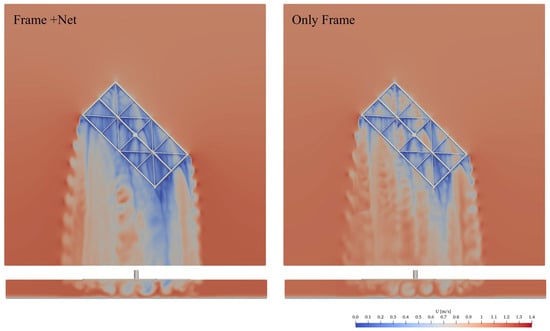
Figure 17.
The effects of nets on the flow fields in the case of θ = 45°, U = 0.8 m/s, and d = 9.5m.
These results highlight the necessity of accounting for net-induced flow reduction in the hydrodynamic design and mooring analysis of large offshore aquaculture platforms. Nevertheless, the wave-induced forces on nets are different than current loads. According to Lei et al. [31], nets have negligible influence on downstream wave propagation. As a result, the wave-induced forces acting downstream of a net panel can be assumed to be equivalent to those upstream.
3.4. Prediction of Hydrodynamic Loads
The parametric results and discussions presented in Section 3.3 reveal that the hydrodynamic loads acting on the “Ningde No. 1” offshore aquaculture platform are sensitive to the incident current angle (θ), current velocity (U), draft depth (d), and the presence of fishing nets. In practical design scenarios, particularly for structural sizing and mooring system configuration, a quick yet reliable prediction of hydrodynamic loads is expected to support design iteration and operational assessment.
To efficiently predict hydrodynamic loads on the large-scale offshore aquaculture platform “Ningde No. 1”, we have developed a physics-informed neural network (PINN) model trained on a limited set of high-fidelity CFD simulations. The model is designed to learn the mapping from the input parameters to hydrodynamic loads, while simultaneously embedding prior physical knowledge of the flow–structure interaction.
The input to the network consists of three non-dimensional features. They are θ, U, and d. The network outputs the predicted hydrodynamic loads of Fx, Fy, and Fz on the whole floater (Frame + net). The architecture of the PINN consists of a fully connected feedforward neural network with three input neurons, three hidden layers with 128–256–128 neurons respectively, and three output neurons, as shown in Figure 18. Each hidden layer uses the hyperbolic tangent (Tanh) activation function and incorporates dropout regularization (dropout rate = 0.1) to mitigate overfitting, given the limited size of the CFD dataset.
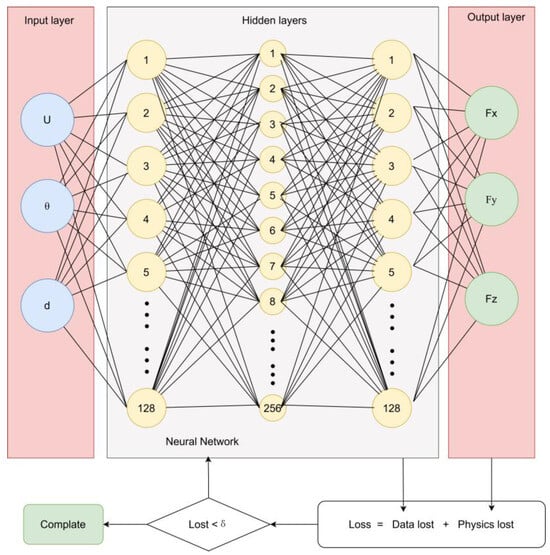
Figure 18.
The architecture of the PINN for predicting hydrodynamic loads.
In addition to minimizing the mean squared error between the predicted and CFD-calculated forces (data loss), we introduce physics-based regularization terms derived from known hydrodynamic principles. Specifically, the total loss function includes derivatives of the predicted force components with respect to the following input features:
- ∂F/∂U is constrained to follow a power law relationship (approximating the quadratic scaling of drag with velocity).
- ∂F/∂θ is regularized toward sinusoidal patterns, reflecting angular dependencies in projected area and force symmetry.
- ∂F/∂d is constrained toward a polynomial trend, representing geometric and buoyancy-related effects from draft variation.
By embedding these physical relationships into the training process, the PINN model achieves good generalization and physical interpretability compared to purely data-driven models. After training, the model can rapidly estimate the force responses of the structure under arbitrary flow conditions within the training domain, providing a highly efficient surrogate model for design iteration and parameter optimization. Although the exact computational cost depends on specific hardware and implementation details, typical estimates for the present study are as follows: the PINN training process takes on the order of tens of minutes, comparable to a standard machine-learning model. In contrast, a full CFD simulation may take several days or even weeks. These comparisons emphasize the significant computational efficiency of the PINN surrogate, which enables fast predictions and extensive parametric analyses without compromising accuracy relative to high-fidelity CFD simulations.
To evaluate the performance of the trained PINN model in predicting the hydrodynamic forces under various flow conditions, we compute several standard regression metrics, i.e. mean squared error (MSE), root mean squared error (RMSE), mean absolute error (MAE), coefficient of determination (R2), and mean absolute percentage error (MAPE) for all three load directions. The definitions of these regression metrics are given by Equations (8)–(12), where n is the total number of data, is the value by CFD simulations, and is the predicted value by the PINN model. The results are given in Table 7.
Table 7.
Performance metrics for PINN hydrodynamic force prediction.
As shown in Figure 19, the model achieves excellent prediction accuracy for the dominant load component Fx, especially with R2 = 0.9934, indicating a nearly perfect fit to the CFD results. For the transverse load component Fy, which has a smaller magnitude and more complex directional dependence, the model still performs well with R2 = 0.9840, though the relative error (MAPE = 831.98%) is high due to the small absolute magnitude of this force in the MAPE calculation. Similarly, the vertical load Fz yields robust performance with R2 = 0.9617, although its MAPE is moderately large (54.61%).
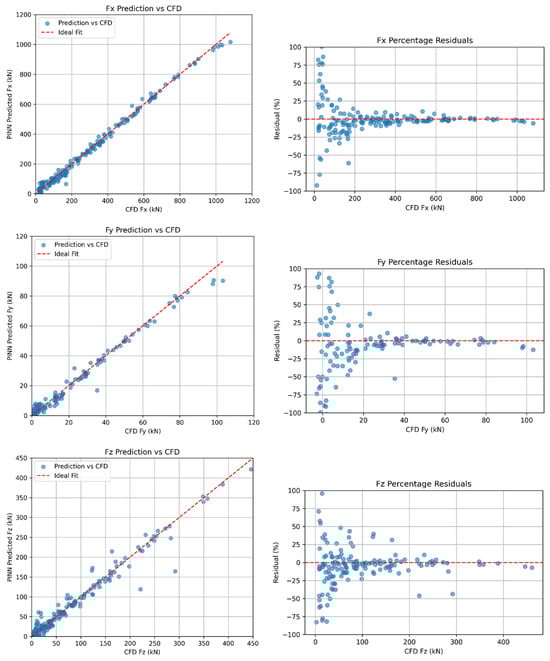
Figure 19.
Prediction outcome of Fx, Fy and Fz using the FINN model.
Overall, these results demonstrate that the PINN model not only fits the CFD-computed hydrodynamic loads with high fidelity but also generalizes robust nonlinear trends involving flow velocity, angle, and submergence depth.
4. Conclusions
In this study, a high-fidelity CFD framework in OpenFOAM is developed to investigate the hydrodynamic performance of the semi-submersible offshore aquaculture platform “Ningde No. 1” under sea currents. This framework develops a porous media representation for the net structures and applies LES to turbulence modeling, along with a delicately validated mesh strategy and boundary condition setup. A total of 350 simulation cases are conducted by systematically varying current velocities, flow directions, draft depths, and the presence or absence of nets. The key findings from this comprehensive analysis are summarized as follows:
- The transverse load component Fy increases with current velocity and draft, but it shows a non-monotonic trend with flow direction, and a peak at around 65°.
- The vertical load component Fz also increases with current velocity. It peaks near 70° and exhibits a non-monotonic relationship with draft, with a maximum near d = 11.5 m.
- The presence of nets significantly increases the force in the Fx direction (up to 80%), while its effect on Fy and Fz is more complex and draft dependent.
To enhance the applicability of the CFD results, a physics-informed neural network (PINN) was trained using the simulation dataset to provide a rapid and physically consistent estimation of hydrodynamic forces under varying environmental and structural conditions. The combined use of full-scale LES with a PINN represents a novel hybrid physics–data-driven approach, offering high predictive accuracy (R2 > 0.96 for all force components), tremendous computational speedup compared to full CFD, and improved interpretability by embedding physical constraints within the learning process. This surrogate model can substantially accelerate early-stage design iterations and parametric assessments, enabling a more efficient evaluation of structural responses for offshore aquaculture platforms.
The present study focuses on current-only conditions to understand the fundamental hydrodynamic mechanisms. Future work will extend this investigation to include the coexistence of currents and ocean waves, which is essential for representing realistic offshore environments. Furthermore, CFD results will be benchmarked against experimental measurements and field observations to achieve in-depth validation.
Author Contributions
Conceptualization, M.C., X.Z. and H.C.; Methodology, M.C. and H.C.; Software, M.C. and H.C.; Validation, M.C. and H.C.; Formal analysis, M.C., X.Z., H.C. and X.L.; Investigation, M.C., X.Z. and X.L.; Resources, X.Z.; Data curation, M.C.; Writing—original draft, M.C.; Writing—review& editing, M.C., X.Z., H.C. and X.L.; Visualization, M.C., H.C. and X.L.; Supervision, X.Z.; Project administration, X.Z.; Funding acquisition, X.Z. All authors have read and agreed to the published version of the manuscript.
Funding
This research received no external funding.
Data Availability Statement
Data is contained within the article.
Conflicts of Interest
The author Mingjia Chen was employed by the CCCC Marine Construction & Development Co., Ltd. company. The author Hui Cheng was employed by the AKVA Group ASA company. All authors declare that the research was conducted in the absence of any commercial or financial relationships that could be construed as a potential conflict of interest.
References
- FAO. The State of World Fisheries and Aquaculture 2022: Towards Blue Transformation; The State of World Fisheries and Aquaculture (SOFIA); FAO: Rome, Italy, 2022; ISBN 978-92-5-136364-5. [Google Scholar]
- Liu, L.; Anderson, J.L.; Che, B.; Chu, J.; Garlock, T.M.; Xu, J. An Analysis of China’s Aquaculture Sector for the Three Pillars of Sustainability. Aquac. Econ. Manag. 2025, 29, 231–252. [Google Scholar] [CrossRef]
- DNV. Marine Aquaculture Forecast to 2050; DNV: Høvik, Norway, 2021. [Google Scholar]
- DNV. Aquaculture Going Offshore—Seizing the Opportunity, Managing the Risk; DNV: Høvik, Norway, 2018. [Google Scholar]
- Bi, C.-W.; Zhao, Y.-P.; Dong, G.-H.; Xu, T.-J.; Gui, F.-K. Numerical Simulation of the Interaction between Flow and Flexible Nets. J. Fluids Struct. 2014, 45, 180–201. [Google Scholar] [CrossRef]
- Bi, C.-W.; Zhao, Y.-P.; Dong, G.-H.; Xu, T.-J.; Gui, F.-K. Experimental Investigation of the Reduction in Flow Velocity Downstream from a Fishing Net. Aquac. Eng. 2013, 57, 71–81. [Google Scholar] [CrossRef]
- Swift, M.R.; Fredriksson, D.W.; Unrein, A.; Fullerton, B.; Patursson, O.; Baldwin, K. Drag Force Acting on Biofouled Net Panels. Aquac. Eng. 2006, 35, 292–299. [Google Scholar] [CrossRef]
- Moe-Føre, H.; Endresen, P.C.; Bjelland, H.V. Load Coefficients and Dimensions of Raschel Knitted Netting Materials in Fish Farms. J. Offshore Mech. Arct. Eng. 2022, 144, 041301. [Google Scholar] [CrossRef]
- Moe-Føre, H.; Endresen, P.C.; Norvik, C.; Lader, P. Hydrodynamic Loads on Net Panels with Different Solidities. J. Offshore Mech. Arct. Eng. 2021, 143, 051901. [Google Scholar] [CrossRef]
- Moe-Føre, H.; Christian Endresen, P.; Gunnar Aarsæther, K.; Jensen, J.; Føre, M.; Kristiansen, D.; Fredheim, A.; Lader, P.; Reite, K.-J. Structural Analysis of Aquaculture Nets: Comparison and Validation of Different Numerical Modeling Approaches. J. Offshore Mech. Arct. Eng. 2015, 137, 041201. [Google Scholar] [CrossRef]
- Balash, C.; Colbourne, B.; Bose, N.; Raman-Nair, W. Aquaculture Net Drag Force and Added Mass. Aquac. Eng. 2009, 41, 14–21. [Google Scholar] [CrossRef]
- Kristiansen, T.; Faltinsen, O.M. Modelling of Current Loads on Aquaculture Net Cages. J. Fluids Struct. 2012, 34, 218–235. [Google Scholar] [CrossRef]
- Li, G.; Li, X.; Xie, Y.; Zhao, C.; Xu, P. Experimental Study on Hydrodynamic Performance of the Semi-Submersible Vessel-Shaped Fish Cage. Aquac. Eng. 2024, 107, 102482. [Google Scholar] [CrossRef]
- Li, L.; Jiang, Z.; Wang, J.; Ong, M.C. Predicting the Heading Misalignment of a Vessel-Shaped Offshore Fish Farm Under Waves and Currents; American Society of Mechanical Engineers Digital Collection: New York, NY, USA, 2018. [Google Scholar]
- Jin, J.; Su, B.; Dou, R.; Luan, C.; Li, L.; Nygaard, I.; Fonseca, N.; Gao, Z. Numerical Modelling of Hydrodynamic Responses of Ocean Farm 1 in Waves and Current and Validation against Model Test Measurements. Mar. Struct. 2021, 78, 103017. [Google Scholar] [CrossRef]
- Martin, T.; Tsarau, A.; Bihs, H. A Numerical Framework for Modelling the Dynamics of Open Ocean Aquaculture Structures in Viscous Fluids. Appl. Ocean Res. 2021, 106, 102410. [Google Scholar] [CrossRef]
- Wang, G.; Martin, T.; Huang, L.; Bihs, H. A Numerical Study of the Hydrodynamics of an Offshore Fish Farm Using REEF3D. J. Offshore Mech. Arct. Eng. 2021, 144, 021301. [Google Scholar] [CrossRef]
- Zhao, Y.-P.; Guan, C.-T.; Bi, C.-W.; Liu, H.-F.; Cui, Y. Experimental Investigations on Hydrodynamic Responses of a Semi-Submersible Offshore Fish Farm in Waves. J. Mar. Sci. Eng. 2019, 7, 238. [Google Scholar] [CrossRef]
- Cheng, H.; Ong, M.C.; Li, L.; Chen, H. Development of a Coupling Algorithm for Fluid-Structure Interaction Analysis of Flexible Nettings in Fluid. Ocean Eng. 2022, 243, 110208. [Google Scholar] [CrossRef]
- Mi, S.; Avital, E.J.; Williams, J.J.R.; Chatjigeorgiou, I.K. Development of a Novel Multi-Component Coupled Numerical Model for Aquaculture Systems in OpenFOAM. Appl. Ocean Res. 2024, 151, 104146. [Google Scholar] [CrossRef]
- Yin, G.; Janocha, M.J.; Ong, M.C. Physics-Informed Neural Networks for Prediction of a Flow-Induced Vibration Cylinder. J. Offshore Mech. Arct. Eng. 2024, 146, 061203. [Google Scholar] [CrossRef]
- Xu, P.-F.; Han, C.-B.; Cheng, H.-X.; Cheng, C.; Ge, T. A Physics-Informed Neural Network for the Prediction of Unmanned Surface Vehicle Dynamics. J. Mar. Sci. Eng. 2022, 10, 148. [Google Scholar] [CrossRef]
- Peng, J.-Z.; Hua, Y.; Aubry, N.; Chen, Z.-H.; Mei, M.; Wu, W.-T. Data and Physics-Driven Modeling for Fluid Flow with a Physics-Informed Graph Convolutional Neural Network. Ocean Eng. 2024, 301, 117551. [Google Scholar] [CrossRef]
- Lu, H.; Wang, Q.; Tang, W.; Liu, H. Physics-Informed Neural Networks for Fully Non-Linear Free Surface Wave Propagation. Phys. Fluids 2024, 36, 062106. [Google Scholar] [CrossRef]
- Aydemir, O.; Cheng, H.; Ong, M.C. A Comparative Study of Two Fish Farm Layouts under Pure Current Conditions. Appl. Ocean Res. 2024, 148, 104025. [Google Scholar] [CrossRef]
- Cheng, H.; Li, L.; Ong, M.C. Comparative Study of Five Commonly Used Gravity Type Fish Cages under Pure Current Conditions. Ocean Eng. 2022, 250, 110977. [Google Scholar] [CrossRef]
- Løland, G. Current Forces on and Flow through Fish Farms. Ph.D. Thesis, Norwegian Institute of Technology, Trondheim, Norway, 1991. [Google Scholar]
- AKVA Group. Marine Infrastructure. Available online: https://www.akvagroup.com/sea-based/marine-infrastructure/ (accessed on 1 October 2025).
- Moeng, C.-H.; Sullivan, P.P. NUMERICAL MODELS|Large-Eddy Simulation. In Encyclopedia of Atmospheric Sciences; Elsevier: Amsterdam, The Netherlands, 2015; pp. 232–240. ISBN 978-0-12-382225-3. [Google Scholar]
- OpenFOAM Foundation. OpenFOAM User Guide; OpenFOAM Foundation: London, UK, 2024. [Google Scholar]
- Lei, Y.; Li, W.; Zheng, X.Y.; Cai, X.; Gao, S.; Zheng, H.; Zhang, S.; Liu, X. Hydrodynamic Characteristics of the Aluminum Alloy Net Panel in Regular Waves: An Experimental Study. Aquac. Eng. 2025, 110, 102531. [Google Scholar] [CrossRef]
Disclaimer/Publisher’s Note: The statements, opinions and data contained in all publications are solely those of the individual author(s) and contributor(s) and not of MDPI and/or the editor(s). MDPI and/or the editor(s) disclaim responsibility for any injury to people or property resulting from any ideas, methods, instructions or products referred to in the content. |
© 2025 by the authors. Licensee MDPI, Basel, Switzerland. This article is an open access article distributed under the terms and conditions of the Creative Commons Attribution (CC BY) license (https://creativecommons.org/licenses/by/4.0/).