Abstract
Historically, the Mediterranean Sea has been an area of cultural exchange and maritime commerce. One out of many submerged archaeological sites is the Roman shipwreck that was discovered in 2006 off the coast of Santo Stefano al Mare, in the Ligurian Sea, Italy. The wreck was dated to the 1st century B.C. and consists of a well-preserved cargo ship of Roman amphorae that were likely used for transporting wine. In this study, we present the results of the first underwater survey of the wreck using an Autonomous Underwater Vehicle (AUV) industrialized by Graal Tech. The AUV was equipped with a NORBIT WBMS multibeam sonar, a 450 kHz side-scan sonar, and inertial navigation systems. The AUV conducted multiple high-resolution surveys on the wreck site and the collected data were processed using geospatial analysis methods to highlight local anomalies directly related to the presence of the Roman shipwreck. The main feature was an accumulation of amphorae, covering an area of approximately 10 × 7 m with a maximum height of 1 m above the seabed. The results of this interdisciplinary work demonstrated the effectiveness of integrating AUV technologies with spatial analysis techniques for underwater archaeological applications. Furthermore, the success of this mission highlighted the potential for broader applications of AUVs in the study of the seafloor, such as monitoring seabed movements related to offshore underground energy storage or the identification of objects lying on the seabed, such as cables or pipelines.
1. Introduction
During historic times, the Mediterranean Sea was an important area of commerce and cultural exchange among the surrounding countries, connecting the civilizations of Europe, Africa and Asia (e.g., [1]). According to [2], during the Roman era, the Mediterranean is believed to have been more interconnected than at any other time until modern transportation developed in the 19th century.
Shipwrecks are some of the most valuable sources to gain an insight into the maritime economy in the Mediterranean area. Until 1984, there were almost 800 shipwrecks reported in the Mediterranean area and the Black Sea [3], while to date, almost 1784 ancient shipwrecks have been identified [4], many dating from the Hellenistic and Roman periods, a time when maritime commerce was very active due to relatively stable political conditions. Many wrecks that lie in shallow waters are easily accessible to potential looters, while others, especially those sunk in deeper locations, are more difficult to reach and remain relatively intact.
These shipwrecks provide valuable and rare evidence of the goods and materials that were traded across the sea in ancient times. The goods in most cases were transported in amphorae, ceramics and other types of cargo, which, when discovered, offer valuable information regarding the economic patterns, production centers, and consumption habits of the communities of that time [3]. The reasons for the maritime disasters that caused the ships to sink were diverse. Sometimes, heavy storms or navigational errors could lead to the ship sinking, while other times, the causes can be linked to piracy or even to deliberate beaching.
In the Italian region, one of the discoveries that has enriched our knowledge of maritime trade in Roman times is the wreck of a Roman merchant vessel located off the coast of Santo Stefano al Mare in the Ligurian Sea (Figure 1). The wreck was discovered in 2006, and it is a well-preserved example of a mid-sized cargo ship that was transporting amphorae. The wreck offers valuable information regarding shipbuilding techniques and logistical practices in the 1st century B.C. The site where the wreck was found is relatively undisturbed and thus has allowed researchers to document the spatial organization and preservation state of the cargo with high precision. In addition, a museum dedicated to the wreck, the Roman Shipwreck Museum (MURR), was established in the area of the former railway station of Santo Stefano al Mare, with the aim of bringing the public closer to history and underwater archaeology and offering a unique opportunity to virtually explore the wreck to those who cannot dive into the depths of the Ligurian Sea.
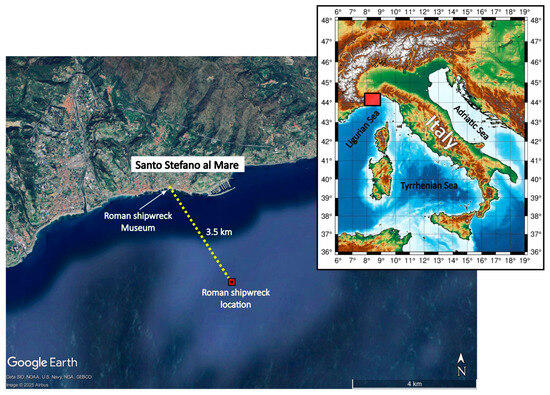
Figure 1.
Location of the Roman shipwreck in the Ligurian Sea, close to the city of Santo Stefano al Mare (IM), Italy; the red square on the top right map identifies the position of the wreck site in the Ligurian Sea, North-West Italy.
In recent years, Autonomous Underwater Vehicles (AUVs) have become an important tool used in a wide range of marine exploration applications. This has been achieved by introducing state-of-the-art technologies that minimize human contribution and allow accurate mapping of large areas that are difficult to access directly.
AUVs are extensively used for seabed mapping due to their high-resolution scan capability. Bathymetric studies have been conducted by [5], who employed an AUV to map undiscovered fields of high-temperature hydrothermal vents. Ref. [6] used an AUV to survey bathymetry and water mass properties at Glover’s Reef atoll in Belize as part of a multidisciplinary study of population connectivity of Nassau grouper. Ref. [7] exploited high-resolution multibeam scans for sea floor mapping, while [8] used AUVs for iceberg positioning and orientation. AUVs have also been used for environmental monitoring and the mapping and detailed characterization of geological structures. Ref. [9] focused their research on monitoring coral reefs and fisheries. Ref. [10] used images at selected reference stations on the Australian continental shelf for the identification of changes in benthic assemblage composition and cover derived from registered maps collected at regular intervals. Ref. [11] used an AUV to record aquatic life. Ref. [12] focused on the study of hydrothermal fields on the submarine ridges. Ref. [13] adopted AUV technology for studying large-scale, deep-sea geological structures such as mid-ocean ridges, seamounts and back-arc basins. In recent years, surveys and inspections of subsea infrastructures and sites have also benefited from AUVs because they can work efficiently and safely in a cost-effective way. Ref. [14] utilized an AUV for real-time simultaneous localization and mapping (SLAM) to inspect a 3D subsea infrastructure within a water tank, whereas [15] focused their work on pipeline inspection for tracking and monitoring spilled oil and gas in an offshore environment. AUVs have also been used for military applications such as intervention activities, logistics, search and rescue operations [16,17,18]. Recently, ref. [19] presented advancements in Unmanned Underwater Vehicle (UUV) technology, leading to increased capabilities and reduced costs, and making underwater archaeological sites more accessible, thereby reducing the need for human diving.
AUVs are particularly valuable for conducting archaeological studies by mapping underwater sites with high precision and minimizing human intervention, which could damage the archaeological findings [20,21]. Ref. [4] studied 11 known shipwrecks in the Ionian Sea (Greece), ranging from ancient times to the 20th century, using marine remote sensing tools such as side-scan sonars, sub-bottom profilers, and multibeam echo-sounders.
The considerable interest of the scientific community in a broad spectrum of underwater operations to investigate offshore historical artifacts as well as industrial marine structures is well documented in recent research. Ref. [22] performed geophysical surveys off the ancient port of Myos Hormos in the Red Sea; they detected a Roman shipwreck using a side-scan sonar and AUV-based high-resolution mapping, highlighting the value of advanced acoustic methods for underwater archaeology. Ref. [23] offers a review of recent advances in underwater robotics and analyzes their potential to improve inspection and monitoring of critical undersea infrastructures. Ref. [24] highlights the potential of using artificial intelligence for the detection and classification of underwater findings and how interdisciplinary approaches can assist in the preservation and valorization of cultural heritage.
For the study of the offshore area of Santo Stefano al Mare, recent technological advancements were employed for an accurate mapping of the wreck site and its amphorae. At the end of 2023, an AUV was deployed by Graal Tech to explore the area and collect detailed bathymetric data about the ancient cargo ship lying on the seabed. The AUV provided a high-resolution 3D map of the wreck site, which helped identify key geomorphological and anthropogenic features. In this work, we collected and analyzed the available data derived from the AUV acquisitions. Data were elaborated using geostatistical techniques, including a variogram model and spatial interpolation analysis. The main detected features were a substantial amphorae concentration and a separate anomaly, identified as a mine cart.
Our results show that the acquisition process and methodology were adequate for accurately locating the amphorae accumulation and measuring its dimensions and, more generally, that current AUVs, equipped with proper instrumentation, have a good performance for underwater archaeological exploration. The successful outcome of this mission confirmed the AUV’s potential for the identification and localization of objects lying on the seabed, such as communication cables or pipelines, as reported in [15], but their use could be effectively extended to monitoring seabed movements related to anthropogenic activities, as suggested in [25,26].
2. The Roman Shipwreck
The waters of the Ligurian Sea are rich in ancient shipwrecks, with the discovery of the Albenga A in 1950 being the first and possibly most famous find [27]. Crucially, most discoveries are the result of fishing or diving activity and not of systematic research, as is the case of the Santo Stefano Romano shipwreck that was found off the coast of Santo Stefano al Mare, a small coastal village in the province of Imperia, Italy [28,29,30].
In 2006, at a depth of about 58 m, the sea returned the remains of a Roman merchant ship, that once sailed the Mediterranean transporting amphora-borne foodstuffs. This wreck, dating back to the 1st century BC, is one of several examples of this period along the coast of Liguria.
The vessel, likely of medium size, around 15–20 m long and 5–8 m wide, was probably a corbita (Figure 2), a sailing ship with a rounded bow and stern that had a large load capacity. This ship typically had one mast, even if the presence of a second mast cannot be excluded. The existence of a deck is doubtful because in other cases it was found that such ships had only narrow footbridges for access, leaving the entire hull free for cargo, covered only by tents in case of rain or rough sea. It is also believed that since the cargo was full of a single type of amphora, this proves that the ship was performing a cabotage route rather than coastal trade with intermediate stops ([31] and references therein). The presence of amphorae (Figure 3), of Roman Republican type 1B according to the Dressel classification [31], suggests that the ship was transporting wine (or, less likely, oil), valuable goods that were traded along the commercial routes connecting the Italian peninsula to Gallia and Hiberia further to the west.
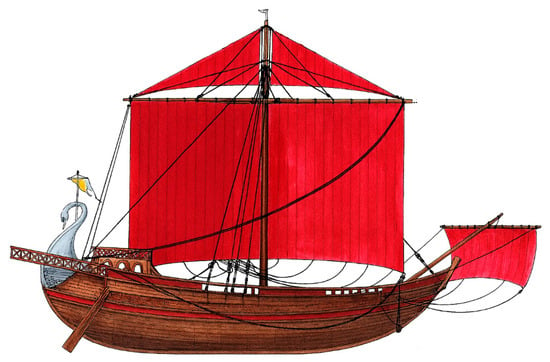
Figure 2.
Artistic depiction of a Roman corbita vessel (mod. from [32]).
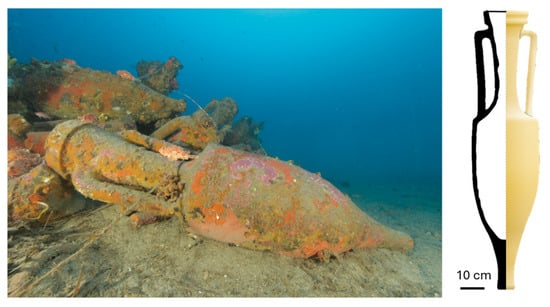
Figure 3.
Underwater photo of an amphora from the Santo Stefano al Mare shipwreck (left); representation of a Dressel 1B amphora [33] (right). (Underwater photo courtesy of: Superintendence for Archaeology, Fine Arts and Landscape for Liguria Soprintendenza Archeologia Belle Arti e Paesaggio per la Liguria/Nautilus Technical Diving Center).
While the ship’s wooden planks are worn by time and salt, the cargo of amphorae is still well-preserved. It is believed that the cargo capacity was about 3000 amphorae. The amphora accumulation is covered with sponges and has an elliptical shape, rising about 70 cm above the seabed (Figure 4). Video analysis shows mostly intact amphorae, scattered on the seabed, possibly due to trawl nets, with only around 5% of the amphorae having been damaged. The absence of other materials, such as ceramic pieces, stones, etc., around the amphorae suggests the good state of preservation of the wreck [31]. Dives conducted by the team from the Superintendence (Soprintendenza) and the Nautilus Technical Diving Center have documented the state of the wreck and carried out detailed surveys, allowing researchers to reconstruct the history and hypothesize the causes of the sinking of the ship, which likely sunk due to a sudden storm, a common event for sailors of the time who, despite their expertise, lacked modern technology to predict the whims of the sea.
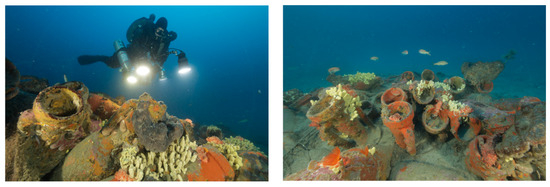
Figure 4.
Underwater photos of the amphorae accumulation of the Santo Stefano al Mare shipwreck. (Underwater photos courtesy of Superintendence for Archaeology, Fine Arts and Landscape for Liguria—Soprintendenza Archeologia Belle Arti e Paesaggio per la Liguria/Nautilus Technical Diving Center).
This extraordinary discovery became the focus of a French documentary series dedicated to Roman trade in the Mediterranean named “Histoires englouties” (PLANÈTE+/myCANAL), episode “Les naufrages de l’Empire romain”. In this episode, director-diver Kevin Sempé explores several sites across Italy and France, including the Roman shipwreck off Santo Stefano al Mare (Liguria) as well as wrecks in the Camargue. The series was broadcast during December 2022 and produced by Imagissime (Mediawan). High-definition underwater footage offered the public fascinating images of what lies on the seabed, revealing the beauty and historical value of the wreck.
3. Underwater Exploration with the AUV
3.1. AUV Equipment
The exploration of submerged archaeological sites presents complex challenges and requires advanced methods to achieve high-quality data acquisition. Several challenges, such as the depth of investigation, limited visibility, unpredictable sea currents, and the need for precise data acquisition without direct visual confirmation, need to be addressed; thus, the use of advanced technology is mandatory. AUVs equipped with high-precision sensors have become essential for the real-time collection of detailed, georeferenced subsea data (e.g., [4,19] and references therein).
In the present study, an AUV assembled by Graal Tech was deployed for the inspection of the Roman shipwreck off the coast of Santo Stefano al Mare, at a depth of approximately 58 m. The employed platform was based on the X300 model, equipped with instruments for high-resolution bathymetric mapping and imaging and georeferenced localization of the AUV.
The NORBIT WBMS multibeam sonar was the core of the system. This device emits fan-shaped acoustic waves toward the seabed and measures the time it takes for the echoes to return after striking submerged objects. The result is a detailed 3D bathymetric map that offers a precise reconstruction of the underwater terrain that is crucial for identifying anthropogenic structures such as wrecks or objects lying on the sea floor. Alongside the multibeam sonar, a 450 kHz side-scan sonar was also employed. Unlike the multibeam, which focuses on vertical depth, this instrument performs lateral scans, providing high-resolution images of the seabed on both sides of the vehicle. It is especially useful for detecting the shapes and contours of submerged objects, allowing researchers to clearly distinguish man-made elements from natural formations. To accurately determine where data is being collected, the AUV is equipped with an inertial navigation platform integrated with a Doppler Velocity Log (DVL). The former uses gyroscopes and accelerometers to detect the vehicle’s movement and orientation, while the DVL measures velocity relative to the seabed. Together, these systems allow for precise georeferencing of each point, even in the absence of GPS signals, which cannot be received underwater.
The entire system is managed by a synchronization software that enables autonomous navigation and real-time data acquisition. Additionally, a radio communication link with the ground station allows remote monitoring of the mission, with the possibility of receiving updates on the vehicle position and issuing corrective commands, if necessary.
3.2. AUV Specifications and Instrumentation
The X-300 is a multimode AUV that can operate under different configurations, as a classic AUV, glider or profiler, while in some cases also as a ROV-like system with real-time operator control. It is 2.2 m long with a diameter of its cylindrical body of 15.5 cm, a weight of approximately 29 kg, and it is capable of operating down to a depth of 300 m below sea level.
The general structural layout includes a nose section, hosting navigation sensors and optional sonar or cameras. The payload bay (middle part) hosts scientific equipment or side-scan sonar. The core suite of sensors includes:
- Inertial Measurement Unit (IMU) with gyroscopes and accelerometers used for navigation;
- Depth-meter and pressure sensor;
- Doppler Velocity Log (DVL) for underwater dead-reckoning;
- GPS (only at surface);
- Acoustic modem and WiFi for underwater and surface communications.
Optional payloads may include different frontal or side-scan sonars and environmental sensors (e.g., fluorometer, magnetometer)
The AUV buoyancy system is controlled by a variable buoyancy chamber. Its thruster system includes two pairs of vectored thrusters plus a rear propulsor for the main forward thrust that offers a maximum speed of 5 knots. The tail is equipped with antennas or tether connection devices. The AUV is powered by 24 V Li-ion batteries.
The resolution of side-scan sonars depends on the frequency and the depth of investigation. Sonars operating in low frequencies (100–300 kHz) offer longer range and deeper penetration, but lower resolution. Higher-frequency sonars (600–1200 kHz) offer higher resolution but are limited to shallow waters. The 450 kHz sonar employed for the surveys is an intermediate solution. It is effective at the depths of the Roman shipwreck site since it is specifically designed for continental shelf waters or coastal surveys. Its optimal operation depth range is 50–150 m, with a lateral coverage of 100–400 m while offering a resolution between 20 and 50 cm.
The X-300 model uses an inertial navigation system and a Doppler Velocity Log (DVL) to maintain accurate positioning when operating underwater in the absence of GPS access. Its Inertial Measurement Unit (IMU) continuously monitors acceleration and angular rates, and the on-board computer analyzes the data to estimate position or orientation changes with time. This system keeps track of the navigation path once the last GPS measurement is taken, just before the submersion of the AUV. Additional systems, such as the Doppler Velocity Log (DVL), are used to measure the AUV’s velocity relative to the seabed using acoustic pulses, providing precise 3D velocity data, which significantly enhances positional accuracy when used in conjunction with IMU data.
3.3. AUV and Equipment Testing Phases
The mission followed a multiphase approach that is described below and is illustrated in the pictures shown in Figure 5.
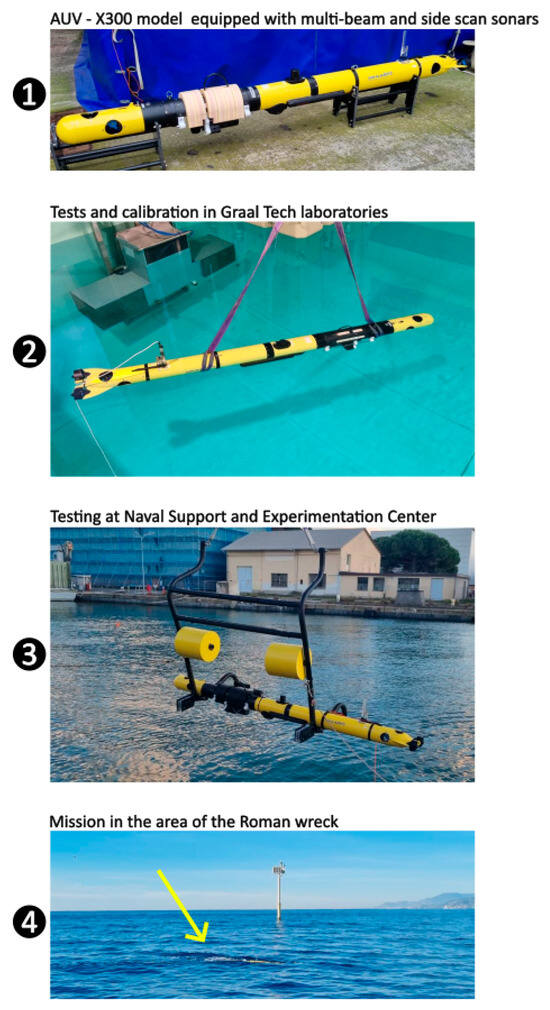
Figure 5.
Visual narration of the journey of the AUV from assembly to open-sea deployment, starting with the installation of the sonar systems (1), followed by preliminary testing in a controlled pool environment (2), then seawater trials at the Naval Support and Experimentation Center in La Spezia (3), and finally the actual inspection of the archaeological site (4).
The development of this underwater archaeological mission adhered to rigorous protocols. Initially, a system calibration and validation were conducted at Graal Tech’s laboratories, where the autonomous vehicle was configured with the multibeam sonar system and integrated data management software. Extensive testing of each of the individual components and the overall system stability was performed in controlled pool environments to simulate operational conditions. These preliminary tests ensured functional integrity before deployment.
The second phase Involved conducting sea trials at the Naval Support and Experimentation Center (CSSN) in La Spezia. The objectives included refining navigation algorithms to achieve precise georeferencing and validating data fusion methods between the navigation system and multibeam sonar. Trial data acquisition facilitated the iterative adjustments to optimize sensors synchronization and positional accuracy under open-sea conditions.
Following laboratory and sea trial validation, the operational phase was initiated. Pre-deployment procedures included system checks, instrumentation functionality verification, and logistical preparations such as loading the AUV and supporting equipment onto the deployment vessel. The mission was executed through three autonomous surveys at specific depths:
- Survey 1: Depth of 40 m.
- Survey 2: Same trajectory as Survey 1, but at 45 m.
- Survey 3: Navigation at 48 m with a vertical distance of 7 m from the seabed.
Each survey was designed to generate high-resolution, layered datasets of the archaeological site.
4. Statistical Analysis of Data Recorded by the AUV
The data collected during the AUV surveys were downloaded and processed to examine the methodology applied during the acquisition process and to analyze the findings related to the remains of the Roman shipwreck on the sea floor. Initial analysis of the collected data was used to demonstrate its operational effectiveness. The on-board sensors produced detailed 3D reconstructions of the wreck site, revealing the structural features and the positioning of artifacts such as amphorae, while the integrated navigation algorithms maintained precise georeferencing. The combined application of multibeam and side-scan sonar methodologies facilitated the interpretation of the submerged archaeological site.
The area surveyed by the AUV Is approximately 65 m × 50 m wide, covering a larger area with respect to the one where the Roman shipwreck is located (Figure 6), with depths below sea level varying from 54 m to 62 m. The acquisition route of the AUV was in the NW-SE direction with a sampling rate frequency of approximately 1 data point/15 cm along the route. The average spacing between adjacent trajectories was approximately 10 cm, covering the area of investigation with a high point density. Each stripe of data points reflects the trajectory followed by the AUV to cover the study area. An intentional overlap between stripes was designed to ensure complete spatial coverage and the absence of gaps.
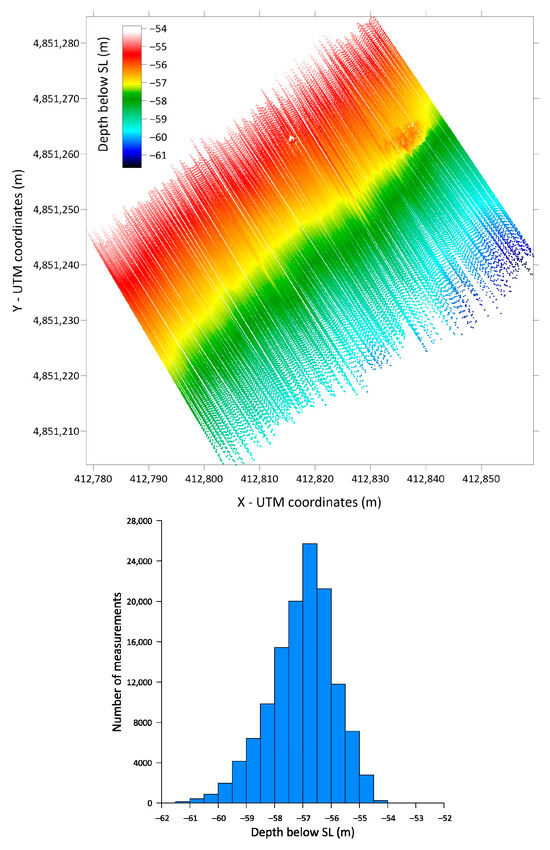
Figure 6.
Measurement points of the depth of the seabed below sea level (SL) acquired by the AUV in the area of the Roman shipwreck (top) and corresponding histogram distribution of the depth values (bottom). The route of the AUV followed parallel NW–SE trajectories coinciding with the direction of the data point stripes displayed in the top map.
The data were initially imported into a specialized software for statistical analysis to visualize them and perform an analysis focused on revealing the details of sea floor geometry and the objects lying on the seabed.
Before any interpretation, it was necessary to recognize possible trends that are related to the geometry of the sea floor. In this pre-processing phase, a geostatistical analysis (e.g., [34,35,36,37]) was performed in order to identify the spatial characteristics of the dataset (including spatial variation or degree of discontinuity). For this reason, it was necessary to calculate the variogram, a useful tool to identify various spatial features of a dataset, such as spatial continuity, cyclicity, or trend. For observations collected in nature (data points within a specific area), the variogram (or semi-variogram) is defined as the half variance of two observations that are separated in space by a specific distance (lag distance). In this case, the experimental variogram was calculated as follows:
where h is the lag distance between the two data points Z(x + h) and Z(x) and N(h) is the number of pairs of data points for this specific lag distance (e.g., [34]).
A conceptual example of an experimental variogram analysis is presented in Figure 7.
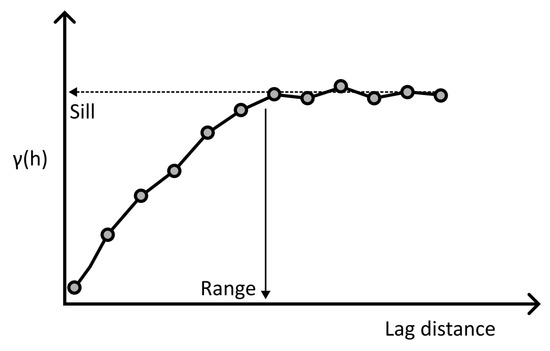
Figure 7.
Typical example of an experimental variogram showing the maximum data variability (sill) and the maximum correlation distance (range); the horizontal axis represents the lag distance (distance between pairs of data points).
During the variogram analysis, the values of the variogram are plotted for several lag distances. If the dataset shows correlation in a specific direction, it is expected that the variogram values will flatten out, at a certain distance, when the maximum data variability (sill) is reached. This lag distance is called range and indicates the maximum distance, in a given direction, for which the values remain correlated. To evaluate the full spatial correlation, the variogram can also be calculated for different directions, investigating the presence of anisotropy effects. If the dataset exhibits higher spatial continuity in a certain direction, a longer correlation range is expected in that direction. In several cases, the dataset may be characterized by the presence of a trend; in such cases, the variogram analysis will show a continuous increase with larger lag distances never reaching the “sill” point.
During the pre-processing phase, we performed the variogram analysis on the data gathered by the AUV. The variogram map created by calculating the experimental variogram for different directions is shown in Figure 8. As expected, the trend in the data due to the deepening of the seafloor was clearly identified (direction parallel to the AUV route), while the variogram shows a constant behavior in the direction perpendicular to the AUV route, which is typical for a variable that does not present any spatial continuity.
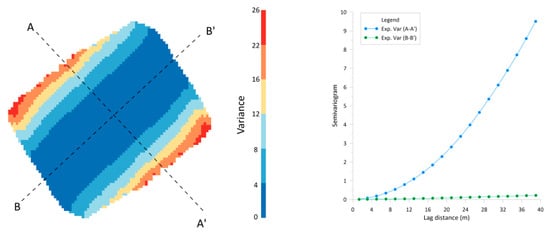
Figure 8.
Variogram map and experimental variograms relative to the directions parallel (A-A’) and perpendicular (B-B’) to the AUV route.
Then, we performed an interpolation over the available data points and created a surface that represents the detected regional trend (Figure 9) by using a polynomial regression approach applied to the original bathymetric data. As clearly visible from the regional trend, the investigated area shows a constant deepening of the sea floor when moving from NW towards SE, which we expected to identify during the variogram analysis.
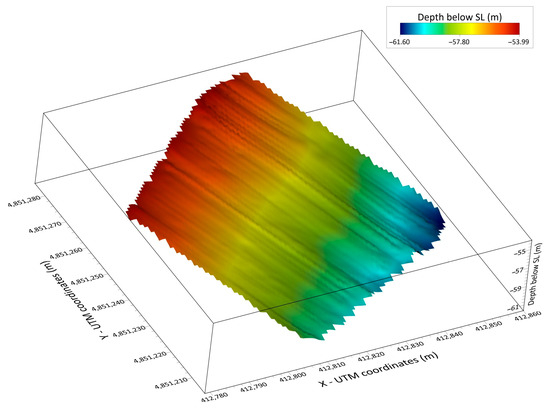
Figure 9.
Regional surface trend obtained from the original seabed depth map.
This trend was subsequently subtracted from the data points to create a detrended dataset of the bathymetric data suitable for further analysis. The detrended data, interpolated using the Kriging interpolation technique, along with the corresponding histogram distribution of the residual depth values, are presented in Figure 10. In this case, the Kriging interpolation was adequate for producing accurate maps because the point density was extremely high (a few centimeters distance between points and a total number of more than 128,000 measured points), and different methods would not have generated substantially different results.
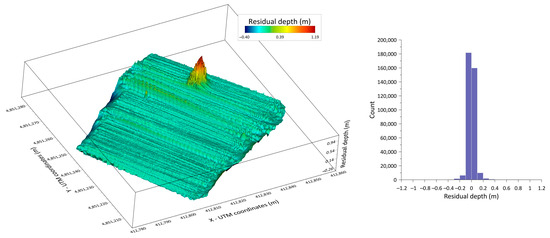
Figure 10.
Residual surface of the seabed elevation points after removing the regional surface trend and corresponding histogram distribution of the residual depth values.
The area covered by the AUV surveys shows two anomalies, which are highlighted in Figure 11. The first anomaly of large dimensions corresponds to the Roman shipwreck site. It covers an area of approximately 10 m × 7 m and highlights the accumulation of amphorae related to the cargo of the Roman ship that sank in that region. The maximum height of the amphorae accumulation reaches almost 1 m. The second anomaly has dimensions of approximately 1.5 m × 1.5 m and corresponds to a mine cart.
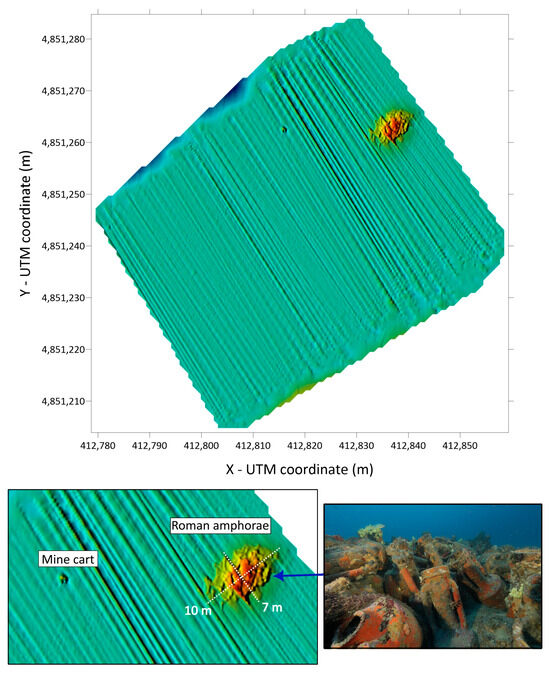
Figure 11.
Identification and measurements of significant anomalies recognized on the seabed: Roman amphorae accumulation and mine cart. (Underwater photo courtesy of: Superintendence for Archaeology, Fine Arts and Landscape for Liguria Soprintendenza Archeologia Belle Arti e Paesaggio per la Liguria/Nautilus Technical Diving Center).
5. Discussion and Conclusions
In this work, we presented an integrated methodology for the acquisition and analysis of underwater elevation data related to a Roman shipwreck site offshore of the town of Santo Stefano al Mare in the Liguria region of northern Italy, using an Autonomous Underwater Vehicle (AUV). This was the first time that an AUV was deployed in that area to document the shipwreck. The result of this work is an example of interdisciplinary collaboration between archaeology and engineering, combining advanced monitoring techniques, geostatistical analysis, and knowledge of maritime archeology. The outcome of this joint effort from researchers with such different backgrounds contributes to revealing the complexities of ancient maritime networks and enriches our understanding of the economic and social framework that characterized the Mediterranean basin during the Roman era. Furthermore, the collaboration with the Roman Shipwreck Museum (MURR) proved the importance of bringing scientific discoveries and public interest to raise awareness of cultural heritage preservation.
The combined use of multibeam and side-scan sonars proved to be a highly effective solution for surveying submerged archaeological sites, ensuring minimum disturbance of the site under investigation. The collected data interpretation has demonstrated that the use of high-quality equipment and the application of geostatistical techniques can provide precise and reliable results in identifying relatively small objects lying on the seabed, with dimensions ranging from the centimeter to meter scale. The methodology that is presented in this work proves how advanced technological integration and systematic operational planning can bring underwater exploration to a rigorous scientific discipline, showing its potential for applications beyond archaeology surveys. Bathymetric variations and the presence of submerged artifacts, cables or pipelines can be detected and mapped, reducing the need for diving interventions. The ability to detect and map seabed anomalies can also be applied to offshore infrastructure inspection, environmental monitoring, and geostorage risk assessment.
Author Contributions
Conceptualization, C.B., F.V., C.F.P., C.M., G.G. and R.M.; methodology, C.B.; formal analysis, C.B.; investigation, R.M.; resources, A.R.; writing—original draft preparation, C.B. and C.P.; writing—review and editing, C.B., C.P., F.V., G.G., S.C. and A.R.; supervision, F.V. All authors have read and agreed to the published version of the manuscript.
Funding
This research received no external funding.
Data Availability Statement
The original contributions presented in this study are included in the article. The original data collected by the AUV and used in this study are available at the following link: https://zenodo.org/records/17281322, accessed on 2 October 2025. Further inquiries can be directed to the corresponding author.
Acknowledgments
The authors acknowledge the Ministry of the Environment and Energy Safety (MASE) for their support in developing the methodology for seabed investigation with Autonomous Underwater Vehicles. Furthermore, the authors wish to thank the Ministry of Culture (MiC)—Superintendency of Archaeology, Fine Arts and Landscape of Liguria, and the Port Authority for granting permission to explore the Roman shipwreck with the AUV.
Conflicts of Interest
The authors declare no conflicts of interest.
Abbreviations
The following abbreviations are used in this manuscript:
| AUV | Autonomous Underwater Vehicle |
| UUV | Unmanned Underwater Vehicle |
| MURR | Roman Shipwreck Museum |
| SLAM | Simultaneous Localization and Mapping |
References
- Abulafia, D. The Great Sea: A Human History of the Mediterranean; Oxford University Press: Oxford, UK, 2011; p. 783. ISBN 0195323343. [Google Scholar]
- Whitewright, J. Sailing and sailing rigs in the ancient Mediterranean: Implications of continuity, variation, and change in propulsion technology. Int. J. Naut. Archaeol. 2018, 47, 28–44. [Google Scholar] [CrossRef]
- Parker, A.J. Shipwrecks and ancient trade in the Mediterranean. Archaeol. Rev. Camb. 1984, 3, 99–113. [Google Scholar] [CrossRef]
- Geraga, M.; Christodoulou, D.; Eleftherakis, D.; Papatheodorou, G.; Fakiris, E.; Dimas, X.; Georgiou, N.; Kordella, S.; Prevenios, M.; Iatrou, M.; et al. Atlas of Shipwrecks in Inner Ionian Sea (Greece): A Remote Sensing Approach. Heritage 2020, 3, 1210–1236. [Google Scholar] [CrossRef]
- German, C.R.; Yoerger, D.R.; Jakuba, M.; Shank, T.M.; Langmuir, C.H.; Nakamura, K.I. Hydrothermal exploration with the autonomous benthic explorer. Deep Sea Res. 2008, 55, 203–219. [Google Scholar] [CrossRef]
- Shcherbina, A.Y.; Gawarkiewicz, G.G.; Linder, C.A.; Thorrold, S.R. Mapping bathymetric and hydrographic features of Glover’s Reef, Belize, with a REMUS autonomous underwater vehicle. Limnol. Oceanogr. 2008, 53, 2264–2272. [Google Scholar] [CrossRef]
- Thompson, D.; Caress, D.; Paull, C.; Clague, D.; Thomas, H.; Conlin, D. MBARI mapping AUV operations: In the Gulf of California. In Proceedings of the 2012 Oceans Conference, Hampton Roads, VA, USA, 14–19 October 2012; pp. 1–5. [Google Scholar] [CrossRef]
- Norgren, P.; Skjetne, R. A multibeam-based SLAM algorithm for iceberg mapping using AUVs. IEEE Access 2018, 6, 26318–26337. [Google Scholar] [CrossRef]
- Vasilescu, I.; Kotay, K.; Rus, D.; Dunbabin, M.; Corke, P. Data collection, storage, and retrieval with an underwater sensor network. In Proceedings of the 3rd International Conference on Embedded Networked Sensor Systems, San Diego, CA, USA, 2–4 November 2005; pp. 154–165. [Google Scholar] [CrossRef]
- Williams, S.B.; Pizarro, O.R.; Jakuba, M.V.; Johnson, C.R.; Barrett, N.S.; Babcock, R.C.; Kendrick, G.A.; Steinberg, P.D.; Heyward, A.J.; Doherty, P.J.; et al. Monitoring of benthic reference sites: Using an autonomous underwater vehicle. IEEE Robot. Autom. Mag. 2012, 19, 73–84. [Google Scholar] [CrossRef]
- Katzschmann, R.K.; DelPreto, J.; MacCurdy, R.; Rus, D. Exploration of underwater life with an acoustically controlled soft robotic fish. Sci. Robot. 2018, 3, eaar3449. [Google Scholar] [CrossRef]
- Wu, T.; Tao, C.; Zhang, J.; Wang, A.; Zhang, G.; Zhou, J.; Deng, X. A hydrothermal investigation system for the Qianlong-II autonomous underwater vehicle. Acta Oceanol. Sin. 2019, 38, 159–165. [Google Scholar] [CrossRef]
- Zhu, Z.; Tao, C.; Wu, T.; Schneider von Deimling, J.; Zhang, J.; Zhang, G. Seafloor Classification by Fusing AUV Acoustic and Magnetic Data: Toward Complex Deep-Sea Environments. IEEE Trans. Geosci. Remote Sens. 2025, 63, 4203215. [Google Scholar] [CrossRef]
- Palomer, A.; Ridao, P.; Ribas, D. Inspection of an underwater structure using point-cloud SLAM with an AUV and a laser scanner. J. Field Robot. 2019, 36, 1333–1344. [Google Scholar] [CrossRef]
- Kimura, R.; Choyekh, M.; Kato, N.; Senga, H.; Suzuki, H.; Ukita, M.; Kamezuka, K. Guidance and control of an autonomous underwater robot for tracking and monitoring spilled plumes of oil and gas from seabed. In Proceedings of the 23rd International Offshore and Polar Engineering Conference, Anchorage, AK, USA, 30 June—5 July 2013. [Google Scholar]
- Hamilton, M.J.; Kemna, S.; Hughes, D. Antisubmarine warfare applications for autonomous underwater vehicles: The GLINT09 sea trial results. J. Field Robot. 2010, 27, 890–902. [Google Scholar] [CrossRef]
- Sanz, P.J.; Ridao, P.; Oliver, G.; Casalino, G.; Insaurralde, C.; Silvestre, C.; Melchiorri, C.; Turetta, A. TRIDENT: Recent improvements about autonomous underwater intervention missions. IFAC Proceeding 2012, 45, 355–360. [Google Scholar] [CrossRef]
- Casalino, G.; Caccia, M.; Caselli, S.; Melchiorri, C.; Antonelli, G.; Caiti, A.; Indiveri, G.; Cannata, G.; Simetti, E.; Torelli, S.; et al. Underwater intervention robotics: An outline of the Italian national project MARIS. Mar. Technol. Soc. J. 2016, 50, 98–107. [Google Scholar] [CrossRef]
- Diamanti, E.; Ødegård, Ø.; Mentogiannis, V.; Koutsouflakis, G. Underwater Drones as a Low-Cost, yet Powerful Tool for Underwater Archaeological Mapping: Case Studies from the Mediterranean. J. Comput. Appl. Archaeol. 2025, 8, 10–24. [Google Scholar] [CrossRef]
- Bingham, B.; Foley, B.; Singh, H.; Camilli, R.; Delaporta, K.; Eustice, R.; Mallios, A.; Mindell, D.; Roman, C.; Sakellariou, D. Robotic tools for deep water archaeology: Surveying an ancient shipwreck with an autonomous underwater vehicle. J. Field Robot. 2010, 27, 702–717. [Google Scholar] [CrossRef]
- Allotta, B.; Costanzi, R.; Ridolfi, A.; Salvetti, O.; Reggiannini, M.; Kruusmaa, M.; Salumae, T.; Lane, D.M.; Frost, G.; Tsiogkas, N.; et al. The ARROWS project: Robotic technologies for underwater archaeology. IOP Conf. Ser. Mater. Sci. Eng. 2018, 364, 012088. [Google Scholar] [CrossRef]
- Hamouda, A.; El-Gharabawy, S.; Fekry, A.; Nassar, M. Exploration and identification of ancient Roman shipwreck located at Quseir, Red Sea. Egypt. J. Aquat. Res. 2024, 50, 17–22. [Google Scholar] [CrossRef]
- Ioannou, G.; Forti, N.; Millefiori, L.M.; Carniel, S.; Renga, A.; Tomasicchio, G.; Binda, S.; Braca, P. Underwater inspection and monitoring: Technologies for autonomous operations. IEEE Aerosp. Electron. Syst. Mag. 2024, 39, 4–16. [Google Scholar] [CrossRef]
- Ababneh, A. Review Future Technologies in Underwater Cultural Heritage. J. Gen. Union Arab. Archaeol. 2024, 9, 1–19. [Google Scholar] [CrossRef]
- Benetatos, C.; Catania, F.; Giglio, G.; Pirri, C.F.; Raeli, A.; Scaltrito, L.; Serazio, C.; Verga, F. Workflow for the Validation of Geomechanical Simulations through Seabed Monitoring for Offshore Underground Activities. J. Mar. Sci. Eng. 2023, 11, 1387. [Google Scholar] [CrossRef]
- Carpignano, A.; Gerboni, R.; Mezza, A.; Pirri, C.; Sacco, A.; Sassone, D.; Suriano, A.; Uggenti, A.C.; Verga, F.; Viberti, D. Italian Offshore Platform and Depleted Reservoir Conversion in the Energy Transition Perspective. J. Mar. Sci. Eng. 2023, 11, 1544. [Google Scholar] [CrossRef]
- La Nave Romana di Albenga: Studi, Progetti e Ricerche per il Nuovo Museo; Gandolfi, D., Trigona, S.L., Eds.; Rivista di Studi Liguri: Bordighera-Albenga, Italy, 2022; ISBN 978-88-86796-87-3. [Google Scholar]
- Trigona, S.L. Archeologia subacquea in Liguria: Un progetto integrato per la tutela e la valorizzazione. In Proceedings e Report; Bonora, L., Carboni, D., De Vincenzi, M., Eds.; Firenze University Press: Florence, Italy, 2020; Volume 126, pp. 137–146. ISBN 978-88-5518-146-4. [Google Scholar]
- Trigona, S.L. Archeologia Subacquea in Liguria. L’attività Dello STAS Nel 2014–2015. In Archeologia Liguria Nuova Serie; De Ferrari Editore: Genova, Italy, 2018; Volume 6, pp. 2014–2015. ISBN 9788864059631. [Google Scholar]
- Trigona, S.L. Archeologia Subacquea in Liguria: L’attività Dello STAS Nel Triennio 2016–2018. In Archeologia Liguria; De Ferrari Editore: Genova, Italy, 2021; Volume 7, pp. 11–29. ISBN 9788855034388. ISSN 2499-927X. [Google Scholar]
- Martino, G.P. Relitto di Santo Stefano al Mare (IM). Archaeol. Marittima Mediterr.-Int. J. Underw. Archaeol. 2007, 7, 45–52, ISSN 1724-6091. [Google Scholar] [CrossRef]
- Westphalen, N. Roman Warfare, Ships and Medicine. J. Mil. Veterans Health 2020, 28, 11–22. [Google Scholar]
- Gaba, E. Wikimedia Commons User: Sting. Antic Roman Wine Amphora of the Dressel 1B Type, Wikimedia Commons. 2007. Available online: https://commons.wikimedia.org/wiki/File:Amphora_Dressel_1B.svg (accessed on 2 October 2025).
- Ma, Y.Z. Quantitative Geosciences: Data Analytics, Geostatistics, Reservoir Characterization and Modeling, Quantitative Geosciences: Data Analytics, Geostatistics, Reservoir Characterization and Modeling; Springer International Publishing: Berlin/Heidelberg, Germany, 2014. [Google Scholar] [CrossRef]
- Matheron, G. Principles of Geostatistics. Econ. Geol. 1963, 58, 1246–1266. [Google Scholar] [CrossRef]
- Stein, M.L. Minimum Norm Quadratic Estimation of Spatial Variograms. J. Am. Stat. Assoc. 1987, 82, 765–772. [Google Scholar] [CrossRef]
- Zakeri, F.; Mariethoz, G. A review of geostatistical simulation models applied to satellite remote sensing: Methods and applications. Remote Sens. Environ. 2021, 259, 112381. [Google Scholar] [CrossRef]
Disclaimer/Publisher’s Note: The statements, opinions and data contained in all publications are solely those of the individual author(s) and contributor(s) and not of MDPI and/or the editor(s). MDPI and/or the editor(s) disclaim responsibility for any injury to people or property resulting from any ideas, methods, instructions or products referred to in the content. |
© 2025 by the authors. Licensee MDPI, Basel, Switzerland. This article is an open access article distributed under the terms and conditions of the Creative Commons Attribution (CC BY) license (https://creativecommons.org/licenses/by/4.0/).