Article

Iron Curtain Formation in Coastal Aquifers: Insights from Darcy-Scale Experiments and Reactive Transport Modelling

1
Sustainable Minerals Institute, University of Queensland, Brisbane, QLD 4072, Australia
2
School of the Environment, University of Queensland, Brisbane, QLD 4072, Australia
3
Environment, Commonwealth Scientific and Industrial Research Organisation (CSIRO), Brisbane, QLD 4102, Australia
4
School of Civil Engineering, University of Queensland, Brisbane, QLD 4072, Australia
*
Authors to whom correspondence should be addressed.
J. Mar. Sci. Eng. 2025, 13(10), 1909; https://doi.org/10.3390/jmse13101909
Submission received: 25 August 2025 / Revised: 30 September 2025 / Accepted: 3 October 2025 / Published: 4 October 2025
(This article belongs to the Special Issue Monitoring Coastal Systems and Improving Climate Change Resilience)

Abstract

Although many studies have examined reaction zones in groundwater–seawater mixing areas, little attention has been given to how subsurface processes drive changes in iron (Fe) precipitation over time and space. This gap has limited our understanding of the “iron curtain” phenomenon in coastal aquifers. To address this, this study developed a reactive transport model to investigate how porosity evolves during the oxidative precipitation of Fe(II) in porous media. The model incorporates the dynamic effects of tortuosity, diffusivity, and surface area as minerals accumulate. Validation experiments, conducted with syringe tests that simulated Fe precipitation during freshwater–saltwater mixing, showed that precipitates formed mainly near the inlets, reflecting the development of a geochemical barrier at the groundwater–seawater interface. Scanning electron microscopy confirmed that Fe precipitates coated the surfaces of spherical particles. Numerical simulations further revealed that high Fe(II) concentrations drove pore clogging near the inlet, creating a dense precipitation zone akin to the iron curtain in coastal aquifers. At 10 mmol/L Fe(II), local clogging was observed, while at 100 mmol/L Fe(II), outflow rates (i.e., discharge) were substantially reduced. Together, the experiments and simulations highlight how hydrogeochemical processes influence hydraulic properties during the oxidative precipitation of Fe(II) in mixing zones.

1. Introduction

At the interface where fresh groundwater meets seawater in intertidal zones, geochemical conditions shift from reducing (low-oxygen) to oxidizing (oxygen-rich) environments. This transition plays an important role in controlling the mobility and reactivity of elements along the flow path. In these mixing zones, ferrous ions (i.e., Fe(II) or Fe2+), which are stable under reducing conditions common in groundwater [1], are rapidly oxidized to ferric ions (i.e., Fe(III) or Fe3+) when dissolved oxygen (DO) becomes available [2]. This reaction forms solid ferric hydroxides (i.e., Fe(OH)3) beneath sandy beaches [3]. These iron-oxide-coated sands create a natural barrier—often termed an iron curtain—that retards the transport of dissolved chemicals, such as nutrients and metals, towards the ocean, thereby shaping coastal biogeochemical cycles [4,5,6,7,8]. While iron curtains have been documented in areas like Waquoit Bay, MA, USA [9], their formation and subsurface behaviour remain inadequately understood with regard to the complex interactions between physical transport and chemical reactions.
Despite numerous studies on coastal hydrogeological processes, research on redox-sensitive ions and metals, particularly iron (Fe) and iron curtain features, remains limited. While existing research has explored Fe speciation, phosphate (PO43−) removal, and sulfate (SO42−) reduction in intertidal zones [8,10,11,12,13,14,15,16], the subsurface processes and spatiotemporal dynamics of the iron curtain are incomplete. Key research gaps include:
(1)
Multifaceted formation processes: The iron curtain develops through a combination of abiotic and biotic drivers, including groundwater flow, kinetic reactions, microbial activity, and long-term mineral transformations [17,18,19,20]. Previous studies often examined these factors in isolation, limiting holistic understanding of how physical transport and geochemical reactions interact [14].
(2)
Pore-scale dynamics: At the pore scale, chemical reactions can alter flow pathways by reducing pore throat size, clogging pore spaces, and increasing particle surface area [21]. These microscale changes are difficult to scale up, creating challenges when integrating across representative elementary volumes (REVs) and continuum models [22].
(3)
Permeability reduction: Precipitate growth and increasing surface area generate tortuous flow paths that reduce permeability [23,24]. Because surface area (the total exposed area of mineral grains available for reactions) governs reactivity, its dynamic evolution strongly influences the rates and distribution of precipitation processes [25]. For example, a larger surface area increases contact between particles, fluids, and solutes, thereby accelerating reaction rates.
(4)
Impact of solid-phase minerals: Changes in porous media properties depend on the distribution of precipitates [26]. Under complete pore clogging, effective porosity and thus specific yield can approach zero, eliminating the interconnected pore space needed for fluid flow [27]. Some isolated pores may still remain, contributing to total porosity but not to flow. Modelling these scenarios is challenging, as most reactive transport models (RTMs) impose a porosity threshold below which fluid flow is assumed to cease [28].
(5)
Influence of redox and organic processes: In natural mixing zones, the supply of organic matter (OM) and sulfate from seawater drive microbial sulfate reduction and sulfide production [29,30,31]. These processes compete with Fe(II) oxidation, redirecting Fe toward sulfide minerals (e.g., FeS2).
(6)
Hydrological variability: Fluctuating water tables promote alternating oxic–anoxic conditions, which intensify redox cycling and lead to spatial heterogeneity in Fe distribution [32,33]. Current models rarely couple these hydrological dynamics with geochemical reactions, limiting predictive accuracy.
These challenges highlight the need for an integrated approach that combines pore-scale processes with continuum-scale models to refine porous media parameters during the oxidative precipitation of Fe(II). Incorporating surface area into numerical models is essential to improve the agreement between simulations and experimental observations. This integration will advance our understanding of the impact of an iron curtain on subsurface flow in coastal groundwater systems.
To address the research gaps in understanding the iron curtain phenomenon, this study combined laboratory experiments with numerical modelling. The objective was to develop a process-based model of how Fe precipitates change over space and time in response to subsurface groundwater–seawater mixing. Syringe tests involved an injection of Fe(II)-rich freshwater into DO-rich saltwater flow, mimicking subsurface mixing conditions and allowing Fe precipitate formation in specified areas. A coupled hydrogeochemical model was developed to simulate the oxidative precipitation of Fe(II) within the experimental setting. The experimental results were compared with numerical simulations, focusing on key parameters such as the Péclet number (Pe) and Damköhler number (Da). These analyses generated valuable datasets that clarified the impact of geochemical reactions on Fe precipitate distribution, pore space alterations, and changes in water chemistry. The coupled model offered a practical approach to predicting porosity variations and their hydrogeological implications, such as permeability changes, during pore-scale Fe precipitation in granular porous media. By uncovering the kinetic mechanisms behind iron curtain formation, this study provides a detailed understanding of how hydrogeochemical processes influence hydraulic properties. These findings are instrumental for refining predictive models and improving management strategies for coastal groundwater systems with geochemical transitions.

2. Laboratory Experiment

2.1. Apparatus and Settings

The syringe tests were carried out in the GeoSystems Research Laboratory of The University of Queensland (UQ) in Brisbane, Australia. As shown in Figure 1a, the experimental setup utilized a standard plastic syringe as a small column, with 120 mm in length, 30 mm in inner diameter, and a total volume capacity of 100 mL, resulting in a slenderness ratio of 4.0. The redesigned syringe had an inlet at the bottom and an outlet at the top to enable preferential flow. Before sealing the top, the column was filled with saturated glass beads (BlastOne). These glass beads, primarily composed of silicon dioxide (SiO2), were selected for their chemical similarity to quartz sands and their well-defined, smooth surfaces, which provide a controlled and uniform surface area for experimental analysis. With a larger particle size (0.6–0.8 mm) compared to fine and medium sands (0.1–0.5 mm), the beads enhanced visualization of Fe precipitation over the experiment, providing better contrast for interpreting microscopic images of Fe precipitates within the pore space. This setup ensured both effective observation and precise analysis of the experimental outcomes.
Although columns are normally operated in an upright position, they can also be run with an upward flow to simulate saturated groundwater conditions [34]. For this reason, we applied an upward flow to maintain saturation of the glass beads in the syringe during the 15-day experiment. In Figure 1a, Fe(II)-rich freshwater (60 mL) and DO-rich saltwater (60 mL) were simultaneously and continuously supplied using a two-channel syringe pump (Chonry ZS100, max flow rate: 82.61 mL/min). Their mixing produced oxidative precipitation of Fe(II) within the experimental setup, representing the development of a geochemical barrier at the groundwater–seawater interface. The outflow from the syringe was gathered in a measuring jug placed on a digital scale, which automatically recorded weight changes over time. This setup allowed for precise monitoring of flow rates and fluid volumes, enabling detailed analysis of geochemical processes and the formation of Fe precipitates under controlled conditions. Table 1 summarizes the experimental scenario and associated parameters, including the concentration of Fe(II) in freshwater, initial porosity (ϕ), and permeability (k) of the glass beads used as the porous media.

2.2. Solutions and Glass Beads

2.2.1. Freshwater and Saltwater

Solid ferrous chloride tetrahydrate (FeCl2•4H2O, Sigma Aldrich, St. Louis, MO, USA) was used as the Fe(II) source. To prepare the Fe(II) solution, it was dissolved in deionized water that had been pre-treated to remove air. The deionized water underwent vacuum treatment to create negative pressure, ensuring the elimination of air bubbles. After preparation, the Fe(II) solution was transferred into a 60 mL plastic syringe for injection. Saltwater was produced using deionized water and sodium chloride (NaCl). To achieve sufficient DO levels, the saltwater was aerated with an air pump for 24 h before storage in the syringe. The physicochemical properties of the saltwater, including pH, salinity, DO, and oxidation/reduction potential (ORP), were measured using a portable multiparameter probe (Hanna HI98194). The final saltwater had a density of 1025 kg/m3, a salinity of 35 ppt (or g/kg) and a pH of 8.00.

2.2.2. Glass Beads

The porous media in the syringe consisted of glass beads (BlastOne), manufactured glass abrasives with a particle size range of 0.60–0.85 mm. The porosity of the bead-filled syringe was calculated using Equation (1), which accounts for the three-phase system, while multiple measurements of permeability were conducted to ensure accuracy using a constant head permeameter. These parameters are summarized in Table 1.
= V v V t = V w V t
where ϕ is porosity, Vt is total volume, and Vv is void volume, which equals the water volume Vw at saturation conditions.
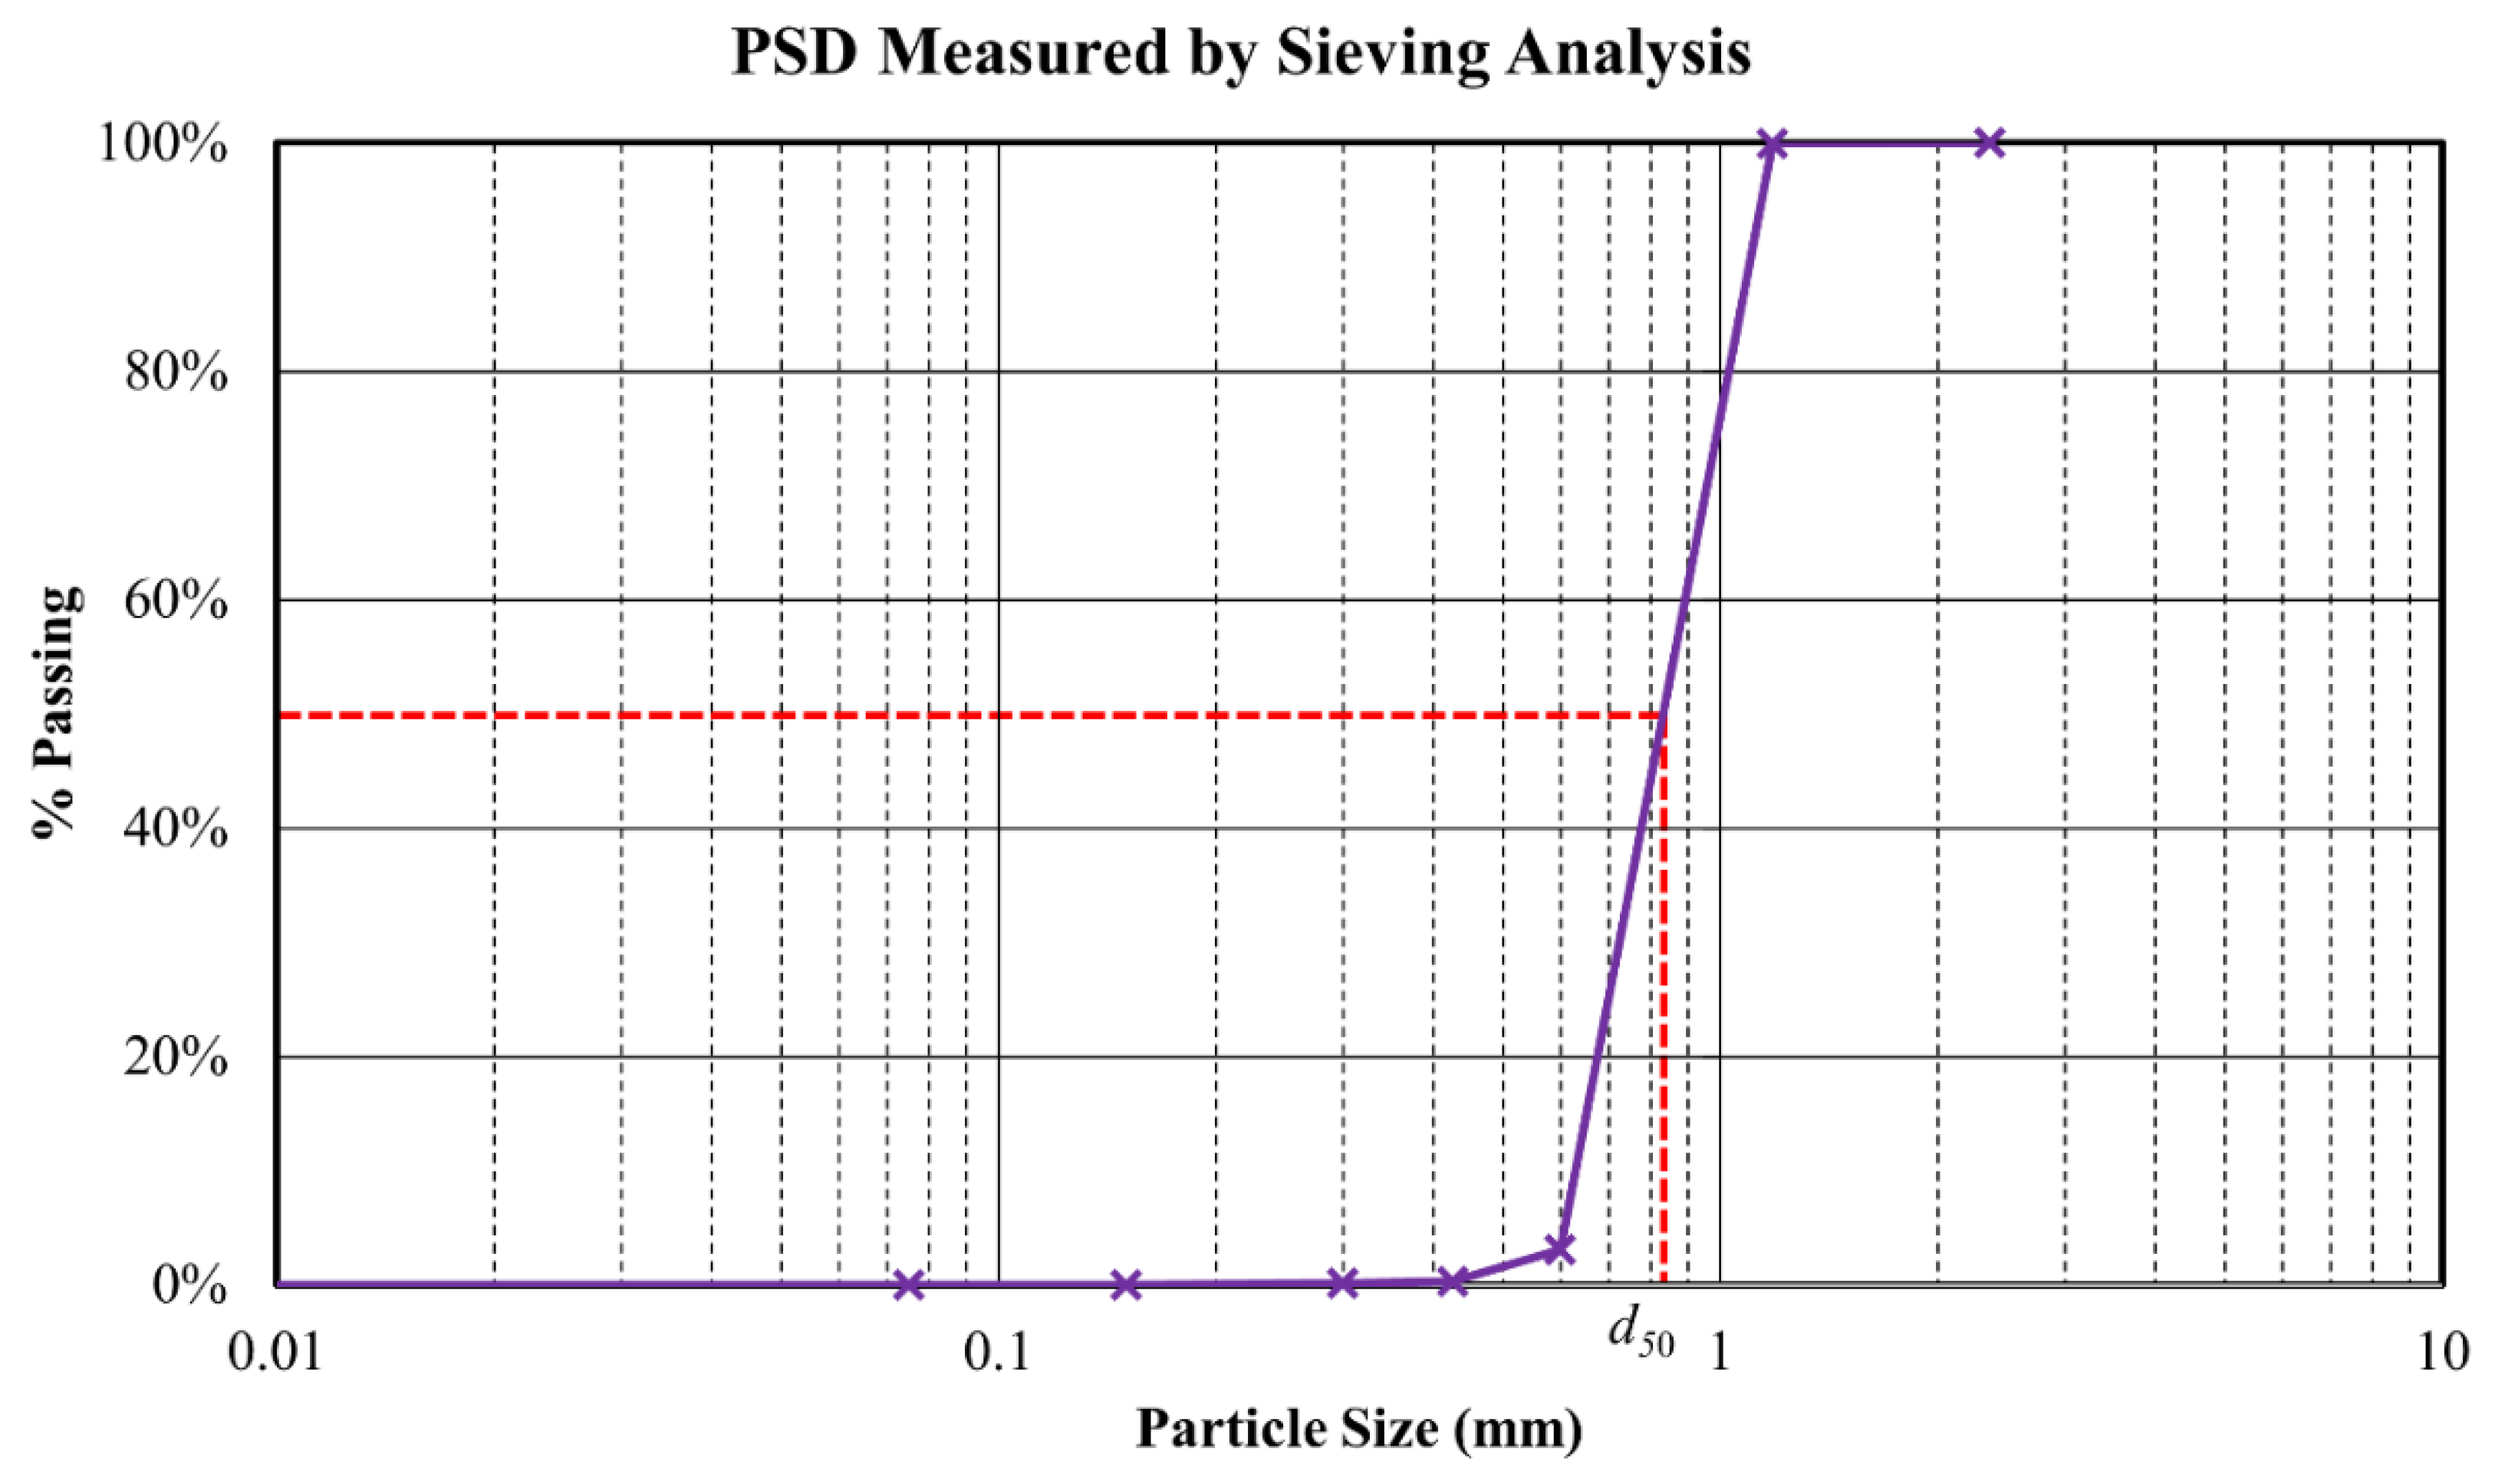
The particle size distribution (PSD) of the glass beads was determined through sieving analysis, as shown in Figure 2. The results revealed a coefficient of uniformity (Cu) of 1.36, and a coefficient of curvature (Cc) of 0.96. Based on the Unified Soil Classification System (USCS), these values classified the porous media as poorly graded. Hence, the median particle diameter (d50) was selected as the representative diameter for subsequent analysis.

2.3. Experimental Procedures

The syringe was prepared by placing it in a vacuum desiccator and applying negative pressure until all air bubbles were removed. After disconnecting from the desiccator, the syringe experienced a 24 h saturation period, during which capillary action allowed saltwater to fully saturate the pore matrix. Once saturated, the syringe was mounted on a stand clamp, and an initial value of permeability was estimated using a Marriot bottle which provides a constant head of 200 mm. After establishing the permeability baseline, a daily influx of 120 mL/d was pumped into the syringe to simulate flow conditions. The flow rate corresponded to a Reynolds number (Re) of 0.07, confirming laminar flow throughout the experiment. The temperature at the laboratory was kept at 21.5 ± 1 °C to minimize the impact of temperature fluctuations on the viscosity and density of the fluids.
The experiment ran for 15 days, with regular permeability tests to monitor reductions caused by Fe precipitates. Outflow samples were collected periodically to determine the steady-state Fe(II) concentration, providing insights into the progression of geochemical reactions. Daily photographs were taken using a high-definition (HD) camera (Logitech C920 Webcam, 2-megapixel sensor, f/2.0-aperture, Carl Zeiss lens, Carl Zeiss AG, Jena, Germany) to record the development of the Fe precipitation zone over time. Upon completing the experiment, undisturbed samples were extracted using sample O-rings for further analysis. These samples were examined with a Hitachi TM3030 scanning electron microscope (SEM) (Hitachi, Tokyo, Japan) to study changes in pore structure. Visual comparisons of the pore matrix before and after chemical reactions highlighted the impact of Fe precipitates on pore space, revealing how precipitation altered the physical properties of the porous media.

3. Numerical Modelling

3.1. Governing Equations and Theoretical Models

The laboratory-scale model was developed using porousMedia4Foam, an open-source software package designed to resolve multiscale hydrogeochemical interactions [35,37]. The study adopted governing equations suitable for the REV scale, including a novel permeability–tortuosity–porosity model considering Fe precipitation in porous media [38].
C t + q C = D e f f C + R
q = k μ P
D e f f = n D 0 1 + α L v D 0
k = k 0 τ 0 τ 2 0 2 1 0 1 3
τ = F = 3 / 4
where C is concentration of the chemical species (mol/L), q is Darcy velocity, representing the volumetric flow rate per unit area (m/s), Deff is effective diffusion coefficient, combining molecular diffusion and hydrodynamic dispersion process (m2/s) [36,39], where ϕn represents the effects of tortuosity according to Archie’s law [35,37,40], R is reaction terms, representing the rate of chemical reactions (mol/L/s), k is permeability of porous media, accounting for changes due to Fe precipitation (m2) [23], µ is fluid viscosity (Pa·s), ∇P is pressure gradient driving fluid flow (Pa), D0 is molecular diffusion coefficient (m2/s), αL is longitudinal dispersion coefficient, describing solute spreading along the flow direction (m), v is fluid velocity (m/s), τ is tortuosity of porous media, F is formation factor account for changes caused by Fe precipitation [23], and ϕ0, k0, and τ0 are the initial porosity, permeability, and tortuosity of the porous media, respectively.
Although the system was under steady-state flow conditions and advection is the dominant transport mechanism, diffusion was included in the model to account for local-scale concentration gradients near the inlet and within partially clogged regions. In steady-state systems, microscale heterogeneities and stagnant zones can create diffusion-controlled transport, particularly when precipitation reduces pore connectivity. Including diffusion ensures that the model captures these effects and avoids overestimating advective dominance in regions where flow paths are restricted. This approach is consistent with previous studies that emphasize the role of diffusion in reactive transport under heterogeneous conditions, even when bulk flow appears advective [37,41].

3.2. Chemical Reactions and Rate Laws

The Fe(II)-rich freshwater was mixed with DO-rich saltwater in the syringe, leading to Fe(II) oxidative and Fe(III) precipitation. Two primary processes were modelled:
Oxidation : F e 2 + + H + + 0.25 O 2 a q F e 3 + + 0.5 H 2 O
Precipitation : F e 3 + + 3 H 2 O F e ( O H ) 3 + 3 H +
Governed by the reaction rate (kox), the oxidation process drives the overall reactions [36,42]:
d F e 2 + d t = k o x F e 2 + O 2 a q [ O H ] 2
where kox = 2.46 × 10¹⁴ L3/mol3/s, converted from the universal rate constant.
The precipitation process follows a kinetic surface-controlled reaction with the rate (kpr) [22,28]. The reactive surface area (S, in m−1) is modelled using a power-law relationship [35,43]:
d F e 3 + d t = k p r S 1 I A P K
S = S 0 s m
where kpr = 5.0 × 10⁻⁶ mol/m2/s, IAP is ion activity product, K is equilibrium constant, S0 is initial reactive surface area, ϕs is mineral volume fraction, and m = 1.0 for Fe(OH)3.
While Fe(OH)3 represents Fe oxides in the simulation, it could also correspond to ferrihydrite (Fh), a metastable mineral common in aquifers and marine systems. Over time, Fh may transform into more stable phases like goethite through aging [44,45]. However, this aging process, along with microbial-driven reductions [19], was excluded due to the short experimental timescale (15 days), and the inhibitory effects of pre-treated glass beads and high chloride ion (Cl) concentrations on microbial activity.

3.3. Boundary and Initial Conditions

As shown in Figure 1b, a two-dimensional (2D) domain under water-saturated conditions was created. The dimensions were 120 mm high and 30 mm wide, matching the full-scale syringe in Figure 1a. To balance computational accuracy and efficiency, the domain was divided into cells of 10 mm in height, resulting in 36 control volumes to simulate the porous media.
Initially, the domain was fully saturated with saltwater at 35 ppt (or g/kg) under isothermal conditions. A specified influx containing Fe(II) at a concentration of 0.001 mol/L was applied to the bottom block of the domain to replicate the injection flow from continuous pumping during the experiment. The top block served as the outlet, connected to the ambient environment with an atmospheric pressure and a temperature of 20 °C. No-flow conditions were applied to the left and right boundaries. This setup closely mimicked the experimental conditions, enabling accurate simulation of the coupled hydrogeochemical processes in the syringe. The parameters summarized in Table 1 were carefully selected to maintain consistency with experimental conditions while enabling numerical simulations to accurately capture the key hydrogeochemical interactions observed during the experiments.
To ensure temporal accuracy and numerical stability in simulations, this study used the Courant criterion to determine grid discretization. The Courant number (Co = Δtx • |v|) was maintained below 1.0 across the domain, where Δt is the time step, and Δx is the cell size. The maximum Co occurred near regions with the greatest velocity in the inlet. For a fixed cell size of Δx = 10 mm, Δt was adjusted to ensure Co < 1.0. In this study, Δt was set to 10 s, resulting in a maximum Co of 0.066. This approach ensures both numerical stability and accurate chemical representation.

3.4. Key Factors and Parametric Analysis

To analyze the transport regimes and hydrogeochemical effects on porous media resulting from the mixing of freshwater and saltwater, we used two dimensionless variables: the Péclet number (Pe) and Damköhler number (Da). Together, they provide a unified and scalable framework for simplifying complex reactive transport systems. In addition, this study incorporated the effect of tortuosity on diffusion coefficient (see Equation (4)) and therefore applied the effective diffusion coefficient (Deff) rather than the conventional D0. As a result, both Pe and Da incorporate Deff in the subsequent parametric studies.
Pe quantifies the relative significance of advective and diffusive transport processes [46]. It is defined as:
P e = a d v e c t i o n d i f f u s i o n = v l c D e f f
where lc is characteristic length, taken as the median particle size (d50) of porous media.
Pe describes transport phenomena under varying fluid velocities: (1) Diffusion-dominant regime (Pe → 0): Advection is negligible, and transport is governed primarily by diffusion. (2) Advection-dominant regime (Pe ≫ 1): Advection dominates, with diffusion playing a minor role. (3) Balanced regime (Pe = 1): Diffusion and advection have equal influence on transport processes. In this study, the Pe value was estimated at 6.0 (see Table 2).
Da characterizes the relationship between reaction kinetics and transport processes in a system. Mathematically. It is often expressed as:
D a = r e a c t i o n   r a t e a d v e c t i v e   t r a n s p o r t   r a t e = k o x F e 2 + O 2 a q [ O H ] l c v
Da determines whether the system is reaction-limited, transport-limited, or operates in a mixed regime: (1) Da ≪ 1: Transport is faster than the reaction, and solutes are carried far downstream before reaction. (2) Da ≫ 1: Reactions are faster than transport, and the reaction occurs near the source before solutes travel far. (3) Da = 1: Reaction and transport processes occur on comparable timescales, and a distributed reaction zone forms. In this study, the Da value was estimated as 0.26 (see Table 2).
Based on the identified variables, nine simulation cases were conducted to investigate Fe precipitation fronts and their patterns. Table 2 outlines the variations in model parameters for each case. Each case is labelled using a specified format, such as Fe1_Pe6_Da26, where Fe1 indicates an Fe(II) concentration of 1 mmol/L, Pe6 refers to a Pe of 6, and Da26 denotes a Da of 0.26, respectively. This naming convention ensures clarity and facilitates easy identification and comparison of different parameter combinations during parametric analysis. The simulations explored a wide range of conditions, enabling a detailed examination of how variations in transport regimes and chemical concentrations influence precipitation zones and their effects on porous media properties.

4. Experimental and Numerical Results

4.1. Temporal Change in Outflow Chemistry

Figure 3 shows the observed concentrations of dissolved Fe(II) in outflow samples collected on days 5, 10, and 15. The Fe(II) concentration in the injected freshwater was maintained at 1 mmol/L, with a constant inflow rate of 120 mL/day throughout the experiment. When mixed with saltwater as per the scenario in Table 1, the initial Fe(II) concentration (CFe(II),0) was 0.5 mmol/L. Chemical analysis of the outflow samples revealed a notable reduction in Fe(II) concentration over time. By day 5, CFe(II),5 dropped sharply to 0.003 mmol, representing 0.5% of CFe(II),0. This concentration further decreased to 0.1% of CFe(II),0 by day 10, and remained at this level until the experiment ended. These results indicate that the system achieved steady-state flow conditions during the experimental period, meaning that inflow and outflow rates remained constant (see Figure 3). However, chemical equilibrium was not reached, as Fe precipitation continued throughout the experiment. The persistence of measurable Fe(II) concentrations in solution highlights that the system was still undergoing active geochemical reactions, reflecting the dynamic nature of oxidative precipitation under the imposed conditions.
Figure 4 presents an Eh-pH (Pourbaix) diagram for iron, illustrating the stability fields of aqueous iron species (e.g., Fe2+, Fe3+) and solid phases (e.g., Fe(OH)3) under varying redox and pH conditions at 20 °C. The diagram compares tapwater (green rectangle), saltwater (red circle), Fe(II)-rich freshwater (brown circle), and outflow samples (purple crosses) relative to the theoretical stability limits of water (red dashed lines). Key observations include:
(1)
Redox Potential (Eh): Measured in volts, Eh reflects the oxidation-reduction state of the solutions. Saltwater and Fe(II)-rich freshwater initially shared similar Eh values (~0.5 V), indicating comparable redox conditions.
(2)
pH Dynamics: Fe(II)-rich freshwater exhibited a significantly lower pH than saltwater, corresponding to a 40-fold increase in H+ activity. This acidity arises from the stability of Fe2+ and hydrolysis products (e.g., FeOH+), which release H+ ions.
(3)
Mixing Effects: When Fe(II)-rich freshwater mixed with oxygenated saltwater, Fe2+ oxidation occurred near the inlet. This process consumed H+ ions (e.g., via reactions in Equation (7)), raising the pH to 5.5–6.5 in the outflow.
The results demonstrate how coupled redox and pH changes during the oxidative precipitation of Fe(II) shape geochemical conditions in mixing zones. The diagram underscores the dominance of Fe(OH)3 under oxidizing, near-neutral conditions, while Fe2+ persists in acidic, reducing environments. Laboratory tapwater was used as a reference, representing conditions without chemical reactions. In contrast, the experimental samples, particularly the outflow waters, show clear evidence of hydrochemical processes, including Fe(II) oxidation and subsequent precipitation.

4.2. Spatial Variations in Pore Structure

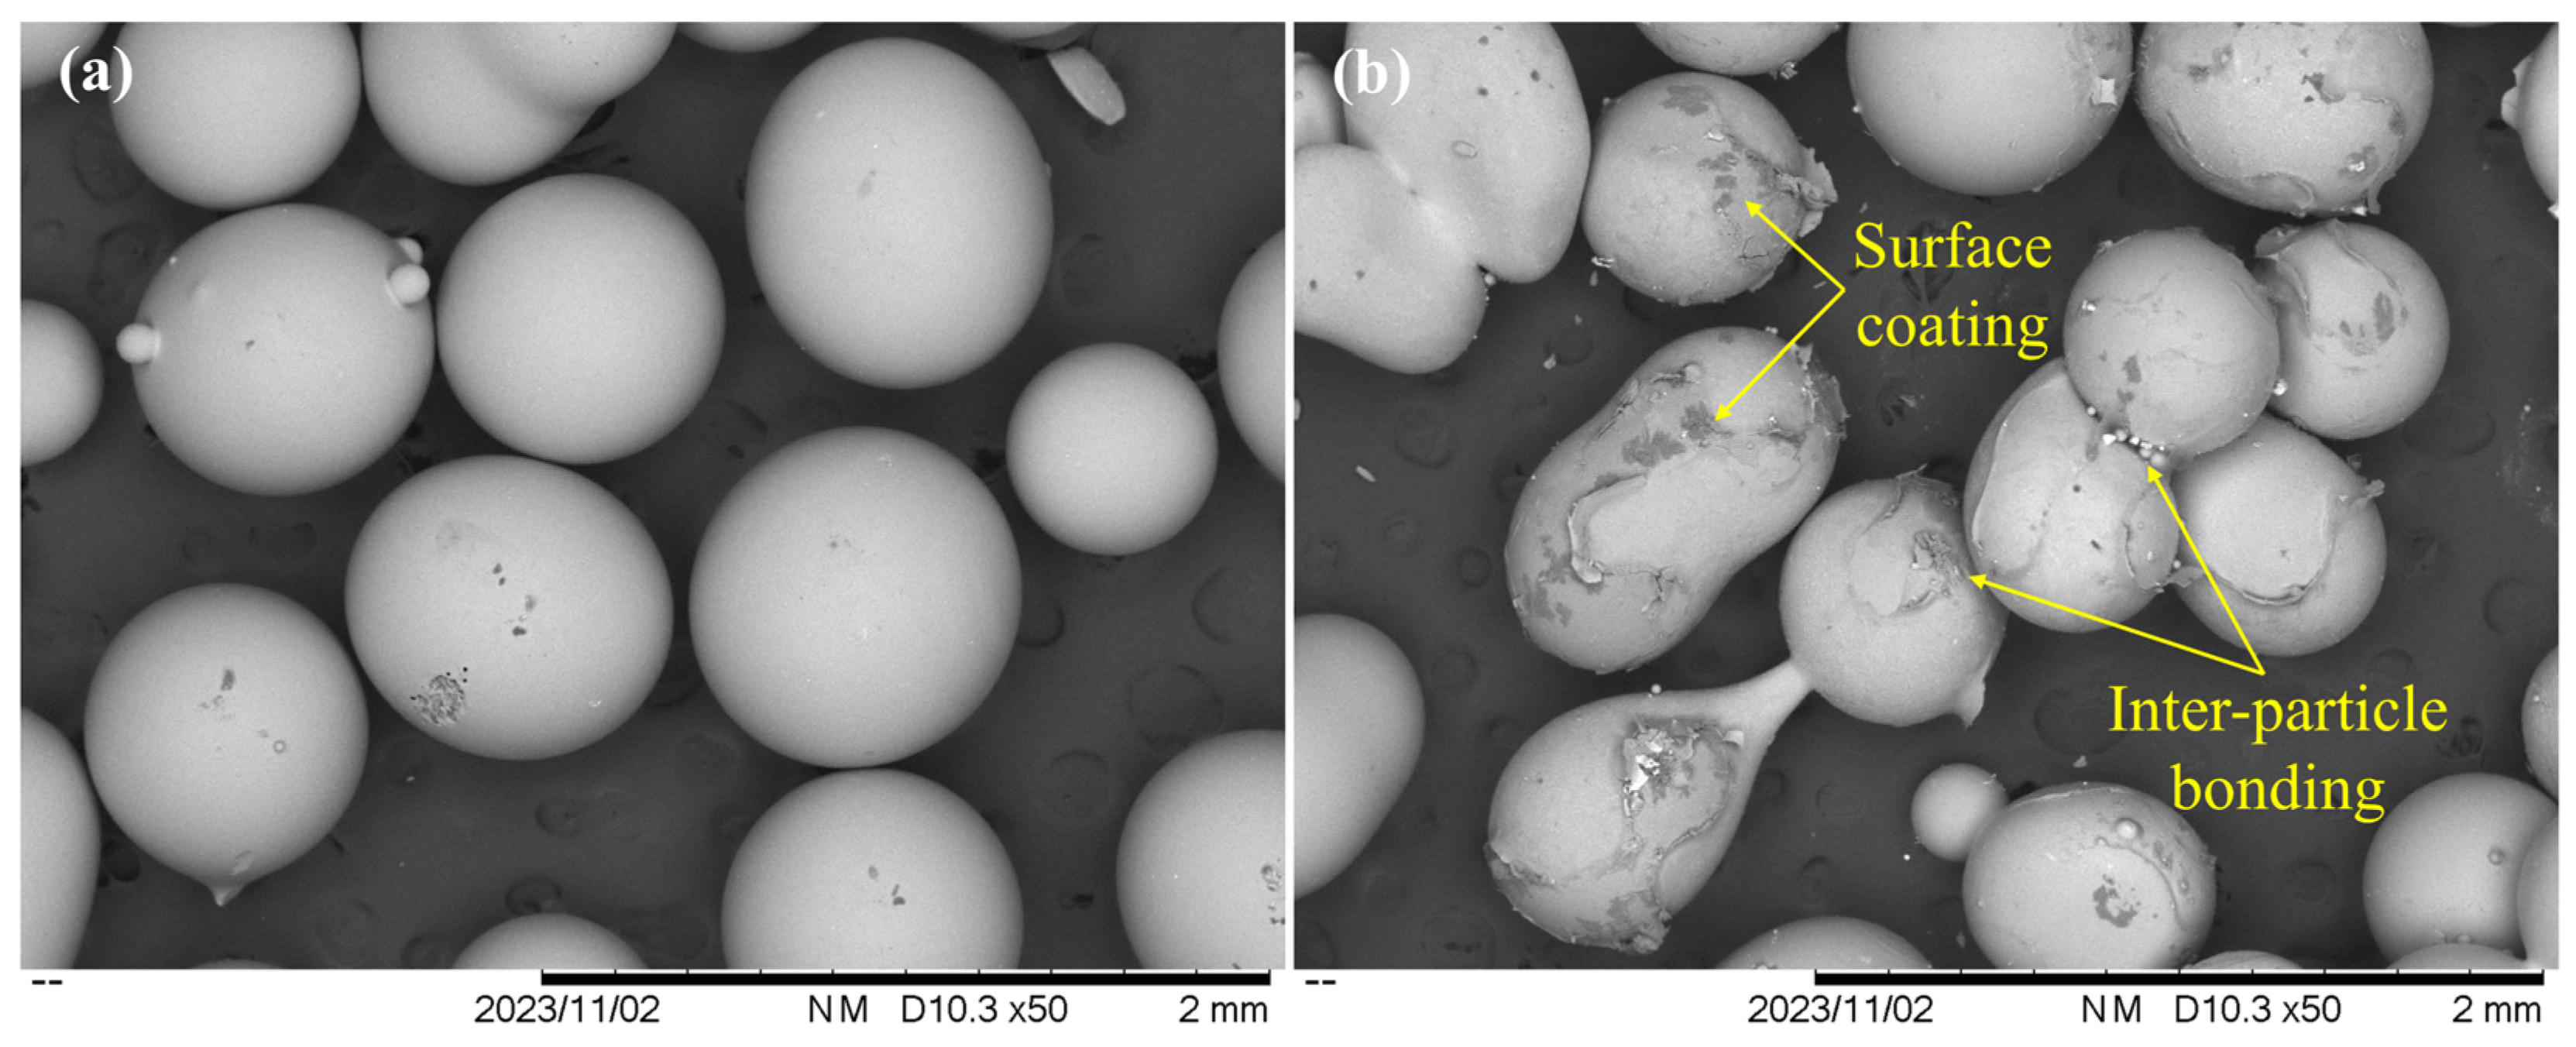
Non-invasive imaging techniques provide high-resolution visualizations of pore structure, enhancing our understanding of the complex characteristics of porous media. As shown in Figure 5, these SEM images, captured at 50× magnification, revealed key structural and surface characteristics of the porous media before (Figure 5a) and after (Figure 5b) Fe precipitation. The clean sample displayed smooth particle surfaces with minimal irregularities, while the post-reaction sample exhibited visible Fe precipitates in the pore matrix. Two distinct patterns of Fe precipitates are evident, including (1) particle surface coating: Fe precipitates primarily coated particle surfaces, forming inter-particle bonding structures. This increased the surface area of existing particles; (2) interstitial space disruption: Fe precipitates within interstitial spaces narrowed flow channels, and reduced pore throat sizes. In extreme cases, this led to pore-clogging, where flow paths were completely obstructed. These modifications together altered the hydraulic properties of porous media [23].
The phenomenon of particle surface coating observed in post-reaction beads can be attributed to the high level of chloride ions (i.e., Cl) in aqueous environments. In chloride-rich systems, such as saltwater or seawater, hydrous Fe oxides tend to precipitate uniformly on particle surfaces. This behaviour reflects the solid-phase mineral’s inclination to spread evenly, creating a continuous coating [47,48,49]. Similar observations were presented in a recent study by Zhao et al. [36], which reported comparable Fe precipitation patterns on fine quartz sand. The SEM findings in this study corroborated these earlier observations, providing experimental validation for the uniform distribution of Fe precipitates. Furthermore, these results support the implementation of Equation (11), which describes the precipitation of Fe(III) as Fe(OH)3. Incorporating evolving surface areas into numerical models enables a more accurate representation of reactivity changes during the oxidative precipitation of Fe(II) in porous media.

4.3. Model Calibration and Validation

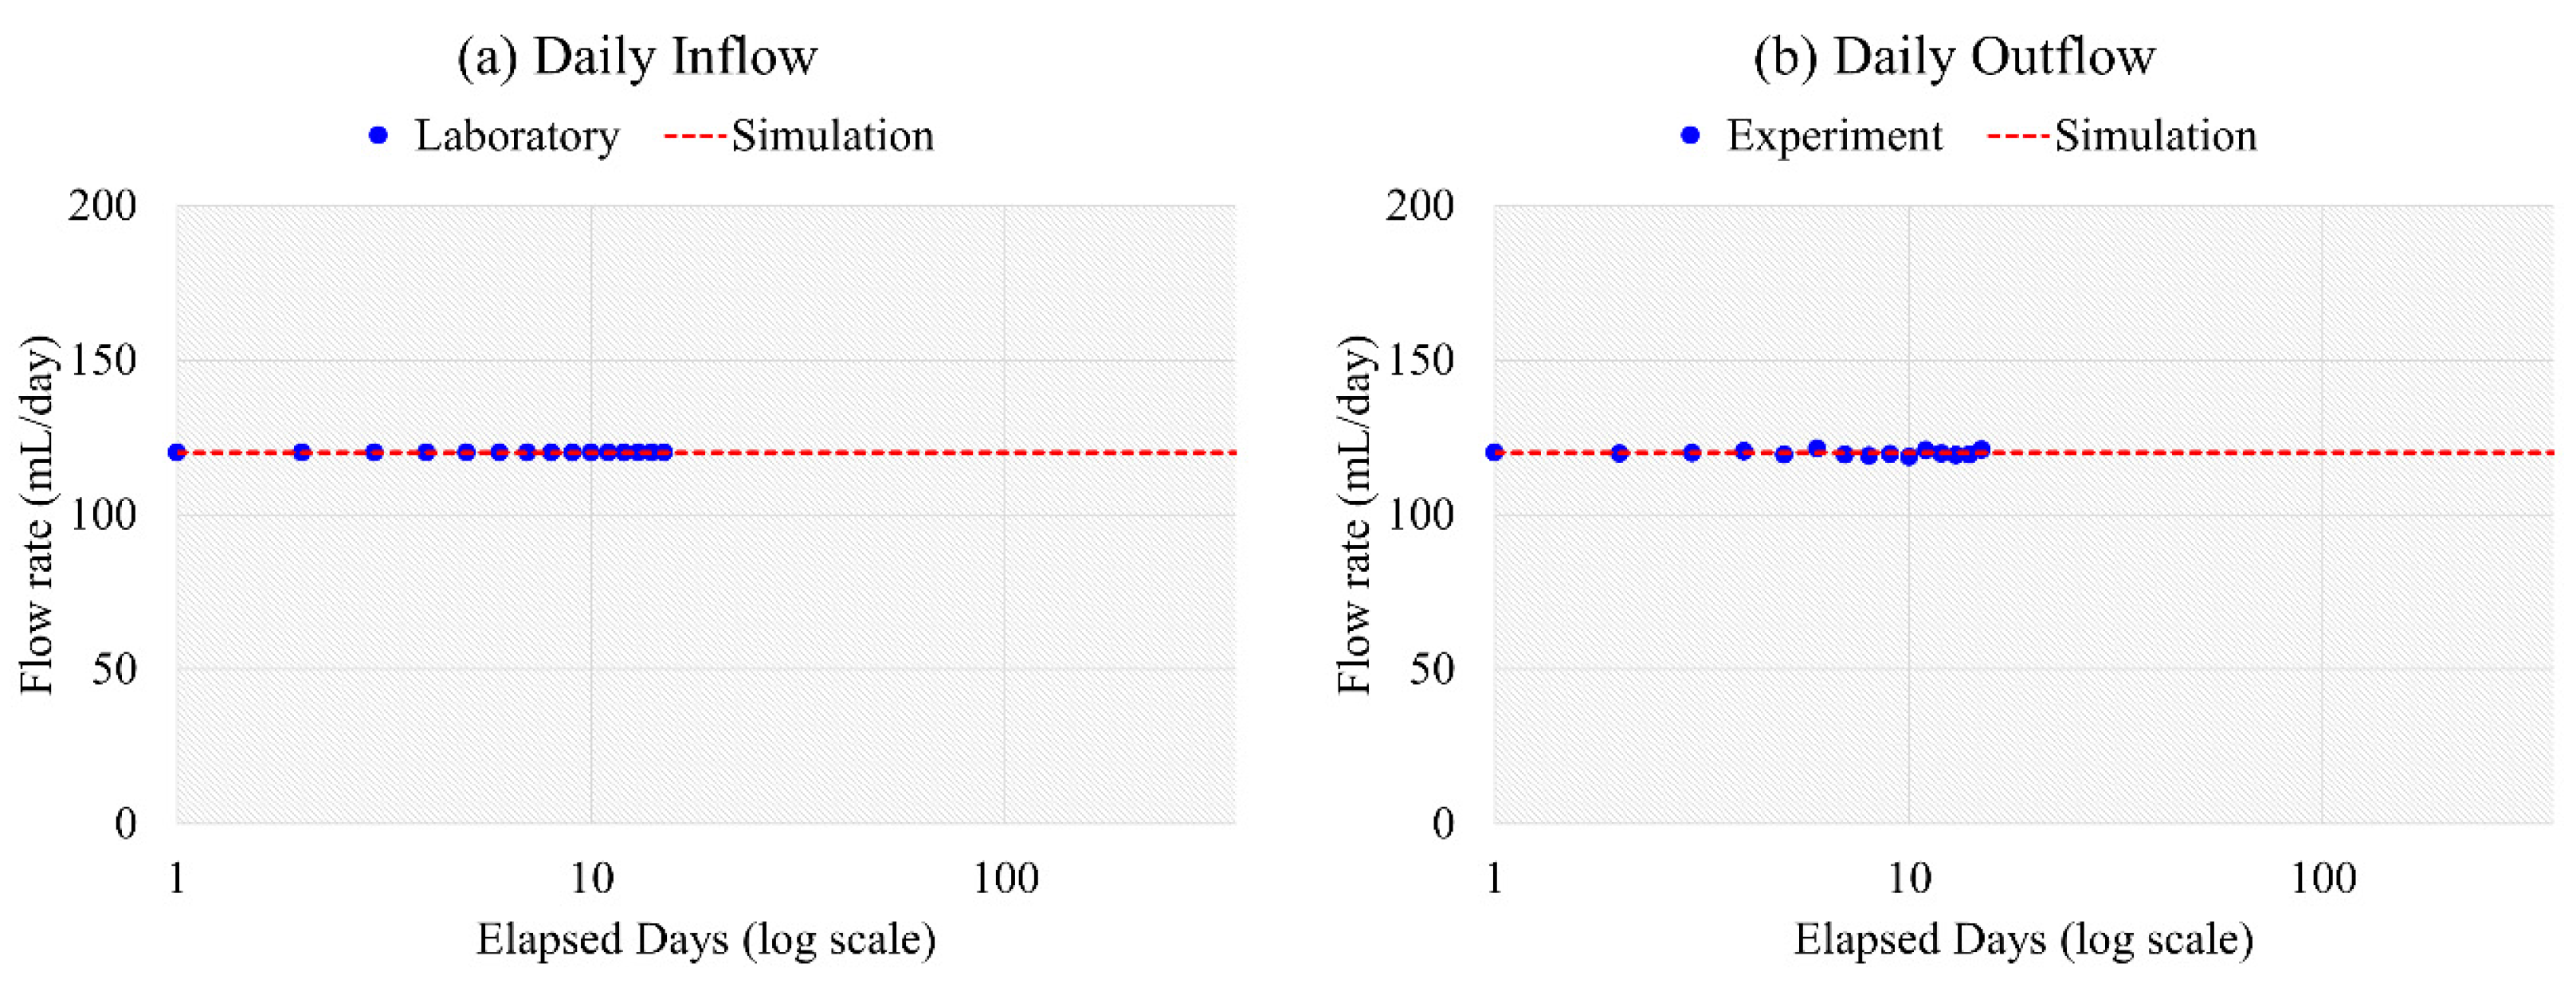
In Figure 6, the numerical model was calibrated using experimental data to ensure accurate representation of realistic hydrogeochemical behavior while maintaining consistency with imposed experimental conditions. Specifically, the simulated inflow rate (Figure 6a) and outflow rate (Figure 6b) were compared to experimental measurements after the system reached steady-state flow conditions. The strong agreement between simulations and observations demonstrates that the model reliably captures the hydraulic behavior of the system. This validation provides confidence in applying the model to investigate hydrogeochemical interactions, including Fe(II) oxidation, Fe precipitation, and their effects on porous media properties.
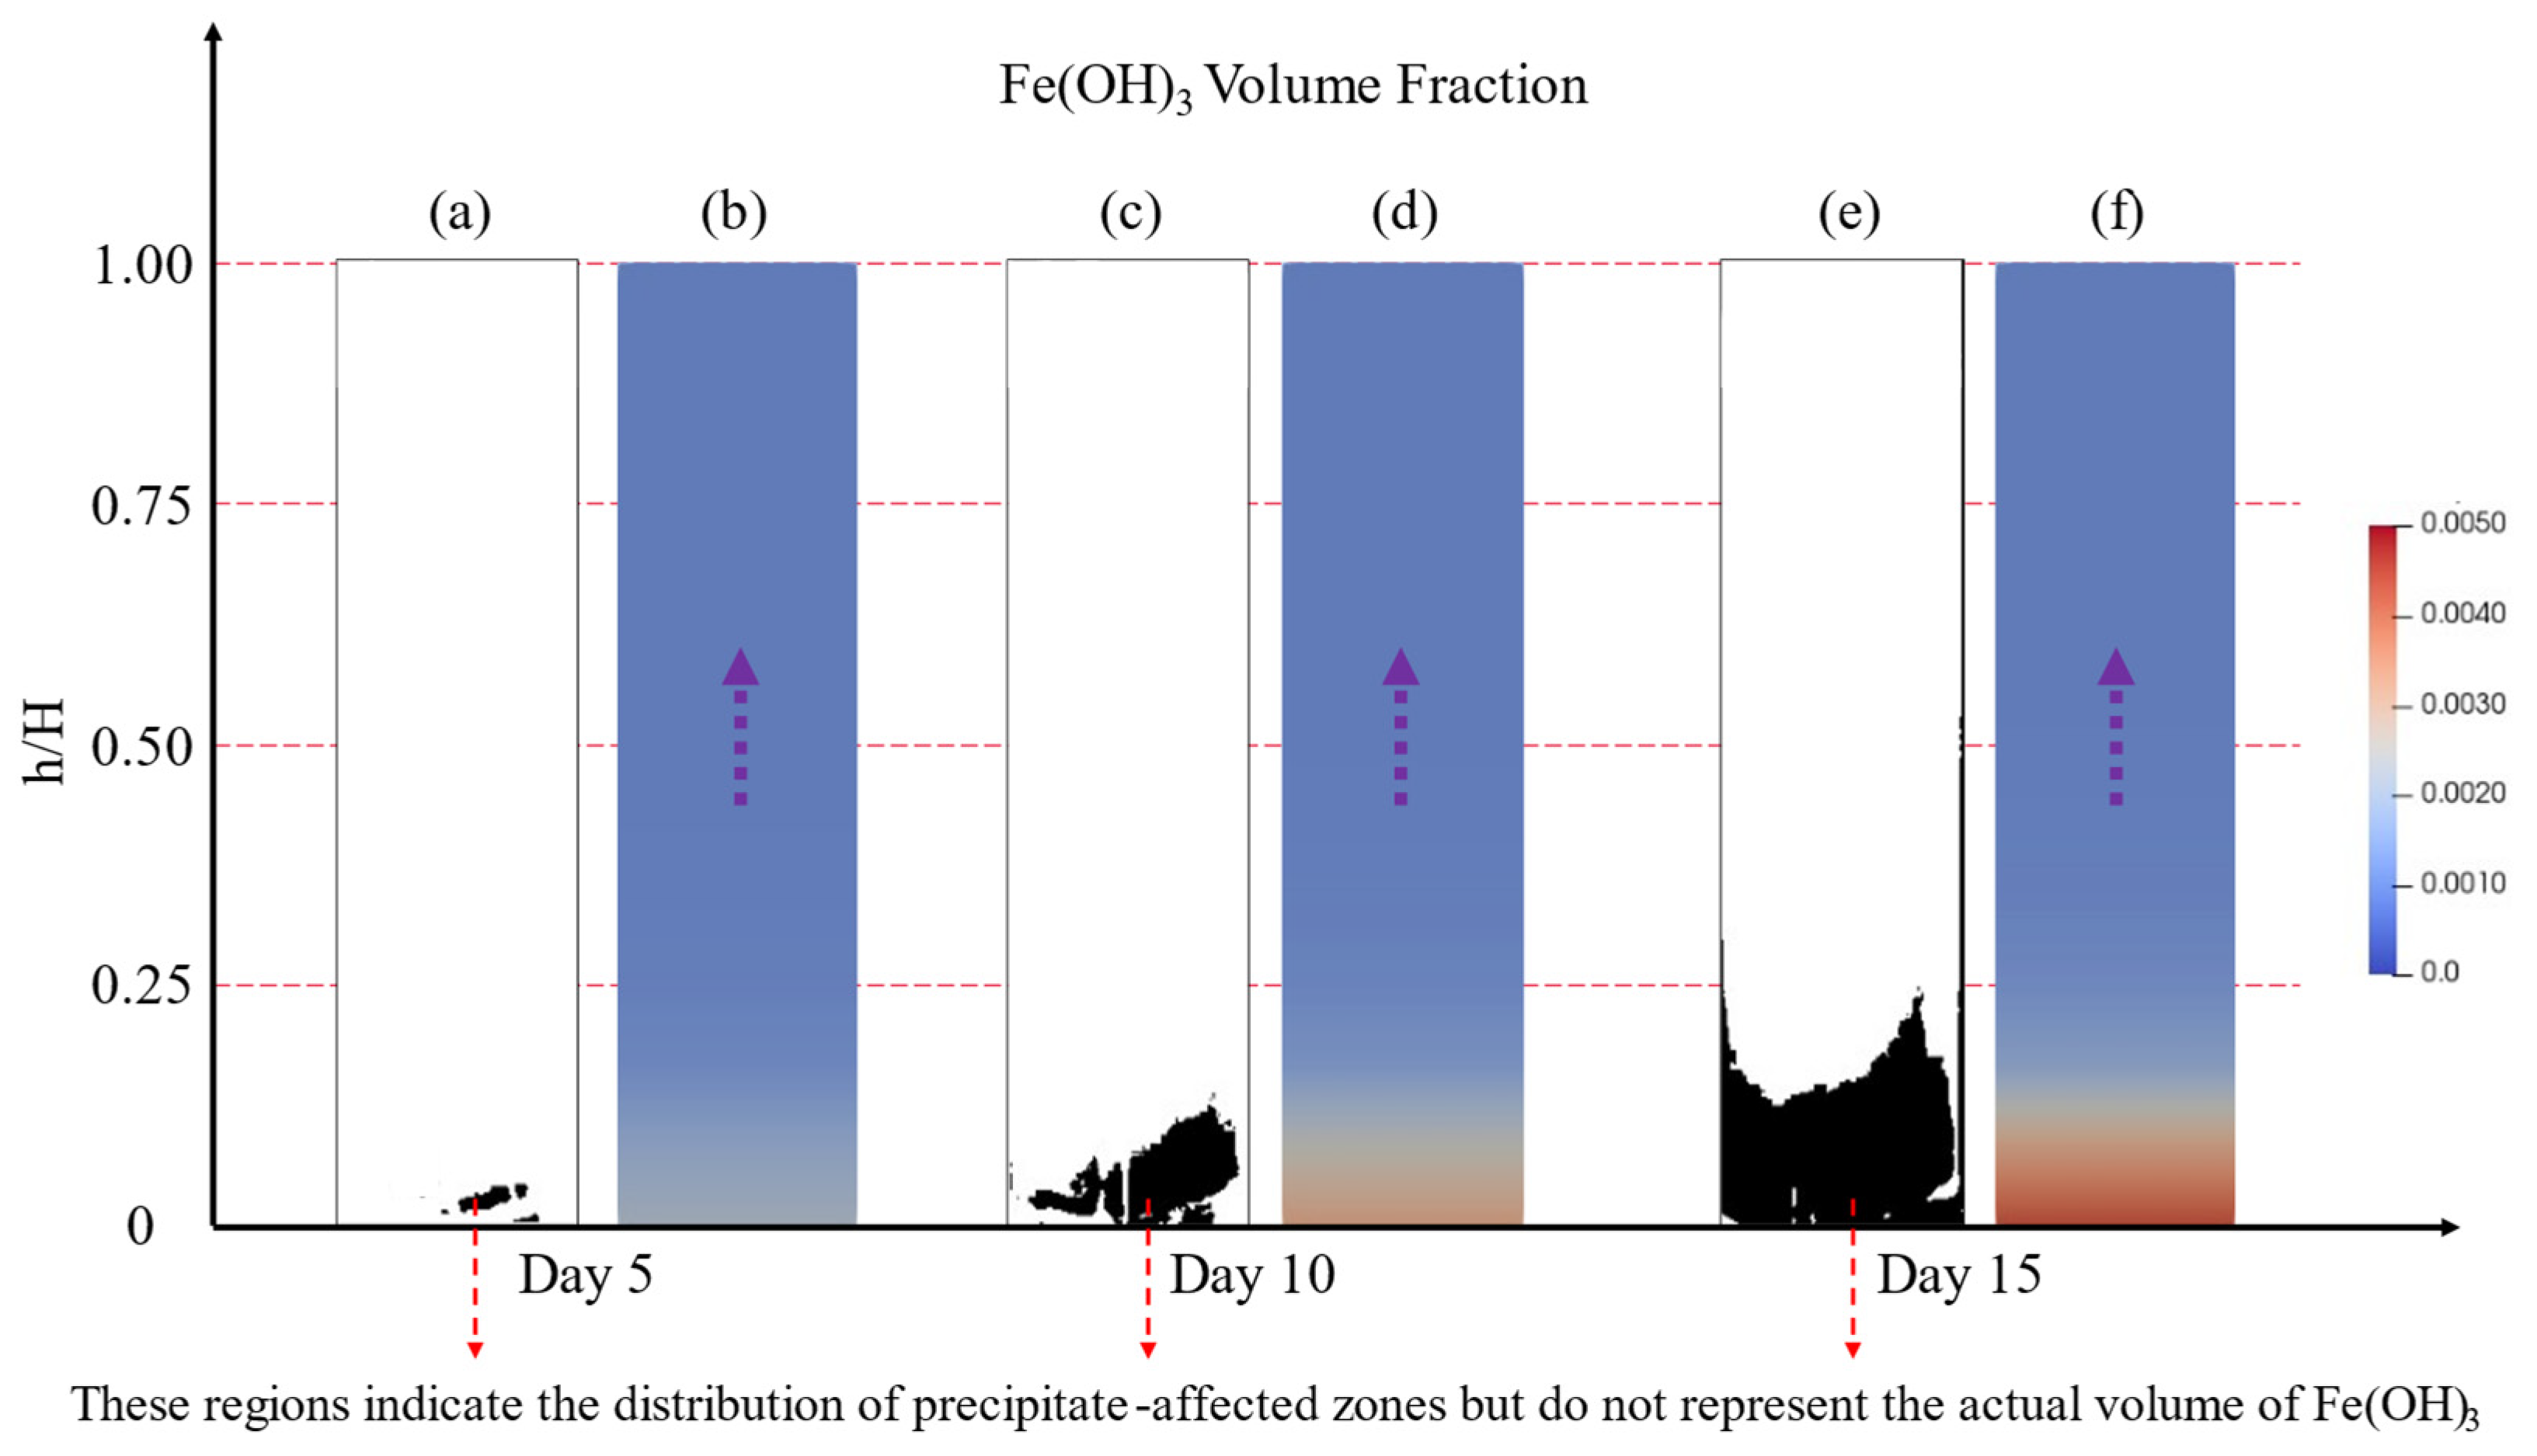
Additionally, the spatiotemporal evolution of the precipitation zone during the experimental period, and the volume fraction of precipitated Fe at the end of the experiment were analyzed to improve the model’s predictive capability for estimating the mass of Fe precipitates within porous media. For this purpose, the imaging analysis procedure described by Yan et al. [50] was employed. Original photographs of the porous media were processed and converted into binary images by applying a threshold level of 0.5, where pixel intensity levels were compared with the original image. Pixels above the threshold were assigned to one category, and those below it to another. This binary conversion significantly enhanced the visibility of the main precipitation zone within the porous media. Areas with intensive Fe precipitates were highlighted in black, representing regions with Fe accumulation, while the remaining area was shown in white. This method provided a clear delineation of the precipitation zone and validated the model’s performance in predicting the distribution and extent of Fe precipitates in porous media.
The experimental and numerical results in Figure 7 show strong agreement in the spatiotemporal evolution of the precipitation zone over 15 days. Both results indicate a daily vertical expansion of the precipitation zone, reaching nearly one-fourth of the syringe’s height (h/H = 0.25) by day 15. This progression highlights the dynamic development of Fe precipitates driven by oxidative precipitation within the porous media. The experimental findings also quantified the mass of Fe precipitates in the syringe at 0.6 g, corresponding to a volume fraction of 0.14%. These values were calculated using the mineral density provided in Table 1. Similarly, the numerical simulations predicted an average volume fraction of 0.14% for Fe(OH)3 over 15 days, consistent with the experimental data. This agreement underscores the accuracy of the numerical model in replicating the extent of the spatial distribution of Fe precipitation, reinforcing its reliability as a predictive tool for hydrogeochemical interactions in porous media.
By incorporating surface area and evolving variables such as tortuosity and effective diffusion, the numerical model demonstrated its capability to precisely reproduce the spatial precipitation zone and accurately predict the temporal volume fraction of Fe precipitates. These findings highlight the model’s potential as a robust tool for predicting hydrogeochemical interactions in porous media. This represents a significant advancement in modelling evolving porous media, as previous studies have emphasized the need to refine such parameters for improved accuracy in simulating mineral precipitation processes.

4.4. Pe Influence on Precipitation Front

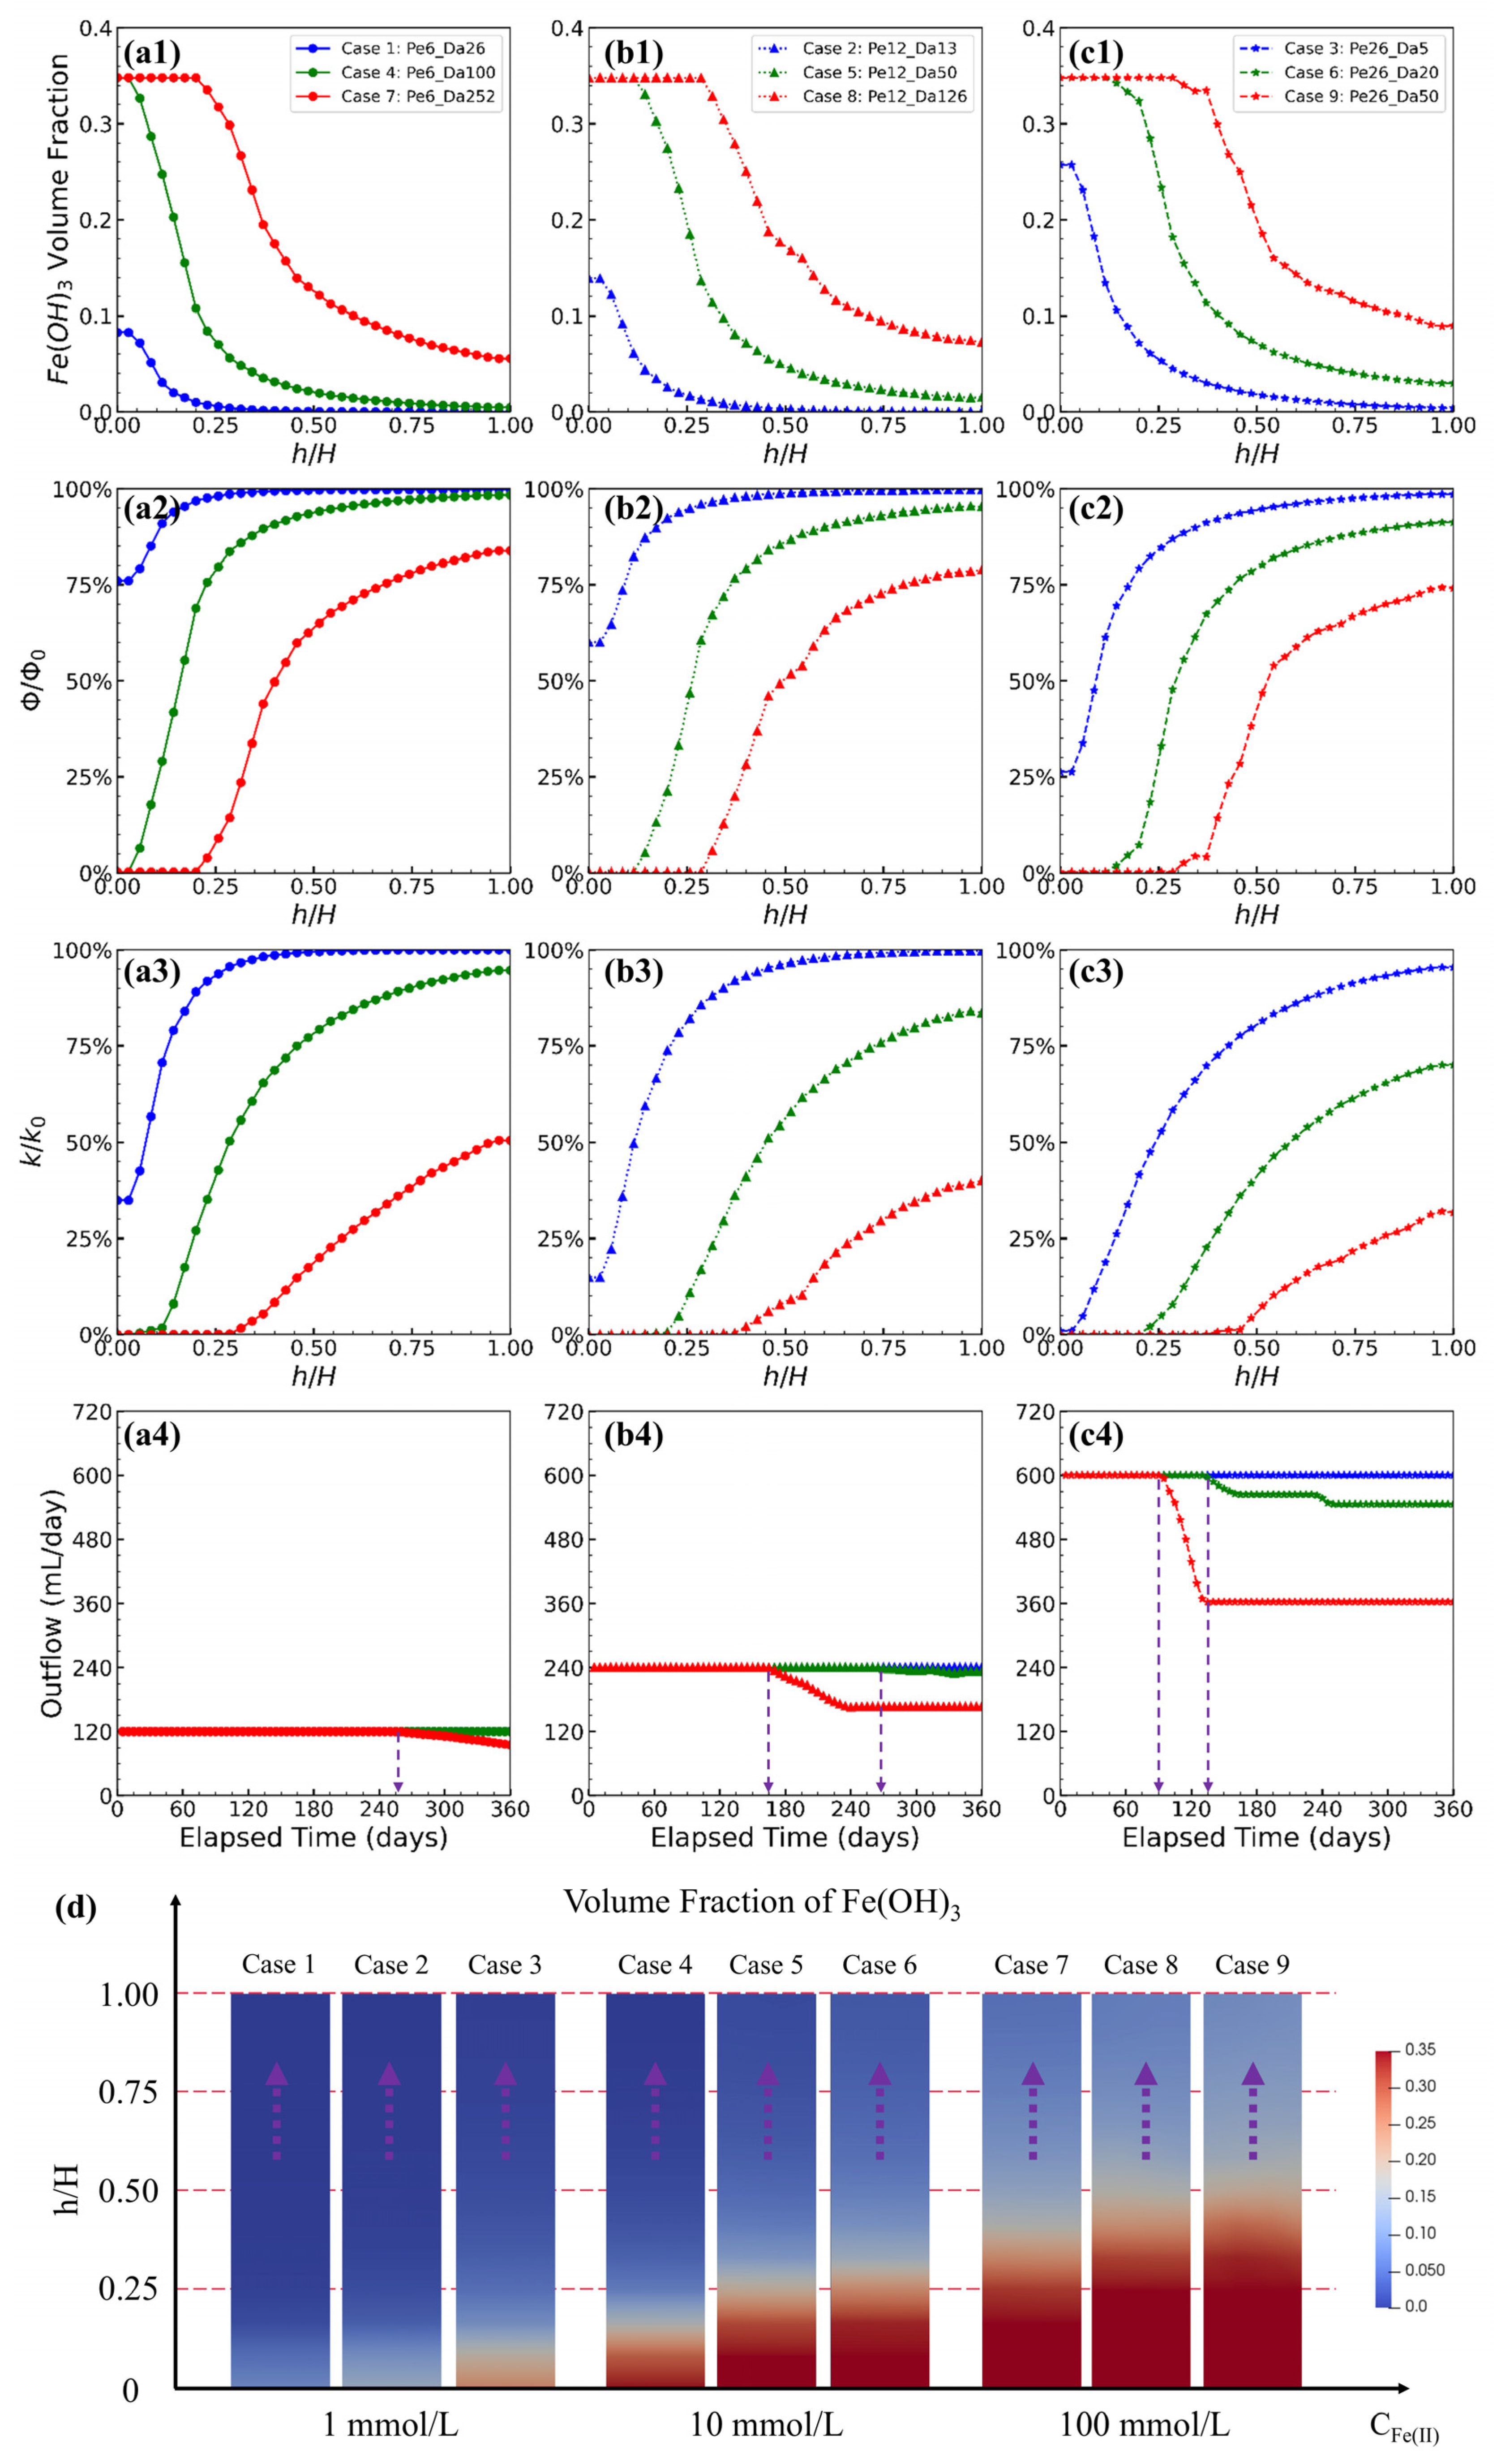
Figure 8 illustrates the spatiotemporal evolution of Fe(OH)3 volume fraction, porosity reduction (ϕ/ϕ0), permeability loss (k/k0), outflow rate changes, and corresponding contour plots under different Pe, which are divided into three distinct groups. The findings emphasize the impact of transport regimes, ranging from diffusion-dominated to advection-dominated, on the precipitation front and subsequent clogging behavior in porous media.
The spatiotemporal evolution in Fe(OH)3 volume fraction (Figure 8(a1–c1)) reveals that Fe precipitation reaches its maximum value of 0.35 in localized regions (Figure 8(b1,c1)), indicating complete pore clogging at a critical Fe(II) concentration of 10 mmol/L. Notably, precipitation occurs earlier in high-Pe cases due to faster reactant transport, leading to accelerated pore-clogging near the injection zone (see Case 6 in Figure 8(b1), and Case 9 in Figure 8(c1)). Higher Fe(II) concentration results in a more gradual Fe(OH)3 accumulation over a broader spatial extent (Figure 8(c1)), while lower Fe(II) concentration leads to a more localized, high-volume Fe(OH)3 region close to the inlet (Figure 8(b1)), contributing to sharp porosity reduction (ϕ/ϕ0 curves in Figure 8(a2–c2)). This trend is reflected in the permeability loss (k/k0 plots in Figure 8(a3–c3)). At lower Fe(II) concentrations, permeability drops sharply near the inlet due to rapid precipitation. At higher Fe(II) concentrations, permeability loss is more evenly distributed, reducing the risk of localized clogging at the inlet. These findings confirm that high Fe(II) concentrations increase the risk of pore-clogging near the injection zone, particularly in high-Pe conditions where advection rapidly delivers reactants to reaction zones. Additionally, the outflow rate plots (Figure 8(a4–c4)) show that higher Fe(II) concentrations accelerate outflow reduction, with purple dashed lines marking the first observed drop. In high-Pe cases with high Fe(II) concentrations (e.g., Case 9 in Figure 8(c4)), the outflow rate drops sharply and early, consistent with rapid pore-clogging near the inlet. At low Fe(II) concentrations (e.g., Case 6 in Figure 8(b4)) or lower Pe (e.g., Case 7 in Figure 8(c4)), outflow declines more gradually, as Fe accumulates more diffusely rather than in concentrated regions. These observations suggest that Fe(II) concentration has a greater impact on outflow rate than Pe alone, highlighting the importance of controlling Fe(II) levels to prevent excessive pore-clogging and maintain system efficiency.
The contour plots (Figure 8d) capture the development of Fe precipitation fronts, with dark red areas indicating regions of high Fe accumulation and potential pore clogging. Each Pe group contains multiple Fe(II) concentrations, enabling direct comparison of precipitation behavior both within Pe groups and across different Pe regimes. Accordingly, the analysis addresses two key aspects: (1) the evolution of the precipitation front within each Pe group as Fe(II) concentration increases, and (2) differences in front behavior across Pe groups to assess transport-driven effects. Within each Pe group, a consistent trend is shown: As Fe(II) concentration increases, the precipitation front moves further from the inlet and becomes more spatially extended. At low Fe (II) concentrations (e.g., Case 1–3 in Figure 8d), Fe precipitation occurs rapidly, producing compact Fe(OH)3 zones near the injection point. In contrast, at high Fe(II) concentrations (e.g., Case 7–9 in Figure 8d), Fe(II) oxidation occurs more slowly, allowing Fe(II) to travel further before reacting, resulting in broader precipitation zones. When comparing different Pe groups at the same Fe(II) concentration (e.g., Case 4–6 in Figure 8d), the precipitation pattern also follows a clear trend. Under high-Pe conditions (Case 6), where advection dominates, Fe(II) is transported more rapidly and oxidizes gradually over a longer distance, forming a diffuse precipitation front. Under low-Pe conditions (Case 4), where advection is less dominant, Fe(II) is oxidized near the inlet due to slower transport, producing more localized Fe(OH)3 accumulation. Thus, Fe(II) concentration controls the spatial extent of precipitation within each Pe group, while Pe determines whether Fe(II) transport is more localized or extended. Together, these parameters shape the size and location of the precipitation front, influencing system-scale clogging behavior.
In conclusion, the study demonstrates that Fe(II) concentration is the primary factor controlling the position of the Fe precipitation front, while Pe governs the extent of Fe transport and the spatial distribution of precipitation. Within each Pe group, increasing Fe(II) concentrations shift the precipitation front further downstream and intensify pore clogging near the inlet. Across Pe groups, high-Pe conditions result in broader, more dispersed precipitation patterns, whereas low-Pe conditions favor localized precipitation near the injection point. These findings underscore the influence of Fe(II) concentration in managing precipitation behavior, as it directly affects the onset and severity of pore clogging. Accordingly, regulating Fe(II) levels is essential for optimizing fluid injection strategies, and minimizing clogging risks in environmental engineering applications.

4.5. Da Effect on Precipitation Patterns

Figure 9 shows the spatiotemporal evolution of Fe(OH)3 volume fraction, porosity reduction (ϕ/ϕ0), permeability loss (k/k0), outflow rate variations, and associated contour plots under varying Fe(II) concentrations. The results demonstrate how the balance between reaction kinetics and transport dynamics governs Fe precipitation patterns and pore-clogging behavior in porous media.
The volume fraction of Fe(OH)3 over time and space (Figure 9(a1–c1)) displays a consistent trend across all simulation cases: as Da increases, both the volume fraction and its spatial extent grow through the syringe. In high-Da cases, Fe precipitation reaches its maximum volume fraction of 0.35, marking regions of complete pore clogging (highlighted by red and green lines in Figure 9(a1–c1)). The ϕ/ϕ0 plots (Figure 9(a2–c2)) reveal that higher Da (red lines) leads to faster porosity reduction within each group, but this porosity reduction becomes more spatially confined. Instead of a broad porosity reduction zone, lower Da (green lines) results in localized, concentrated clogging, reinforcing the observation that increasing reaction dominance constrains precipitation patterns. A similar trend is also evident in the k/k0 plots (Figure 9(a3–c3)), where permeability decreases more sharply as Da increases. However, lower Da (green lines) exhibits localized permeability loss, indicating that pore-clogging occurs more abruptly and within a smaller area. The outflow rates (Figure 9(a4–c4)) provide further evidence of localized clogging effects at high Da. The purple dashed lines mark the first noticeable drop in the outflow rate. For lower Da (green lines in Figure 9(c4)), this drop occurs gradually as precipitation is more localized within 1/8 of the syringe height (see green line in Figure 9(c2)). In contrast, at higher Da (see red line in Figure 9(c4)), the outflow reduction is sharper and occurs sooner, aligning with the observation that rapid precipitation causes clogging up to 1/4 of the syringe height (see red line in Figure 9(c2)), significantly impacting flow earlier in the process.
The contour plots (Figure 9d) illustrate Fe precipitation patterns, with dark red regions indicating high solid volume fractions where pore clogging occurs. Simulations are grouped by identical Fe(II) concentrations to investigate the effect of Da. Only two (Cases 7 and 8) yielded Da values above 1.0, indicating reaction-dominated conditions in which reaction occurs faster than transport. In all other cases, Da < 1 reflects transport-dominated conditions, where advection carries Fe(II) further into the domain before reaction occurs. At lower Fe(II) concentrations (Cases 1–3), the system is more sensitive to Da: higher Da (Case 1) leads to rapid, localized oxidation near the inlet, whereas higher Pe (Case 3) extends and intensifies the precipitation zone downstream. At higher Fe(II) concentrations (Cases 7–9), despite a shift toward reaction-dominated behavior in Cases 7 and 8, the influence of Pe outweighs that of Da. Increasing Pe from 6 (Case 7) to 26 (Case 9) pushes the precipitation front further downstream, broadening its spatial footprint. These trends reflect the interplay among Fe(II) availability, reaction kinetics, and transport regimes. While Da governs precipitation localization, Pe has a stronger influence by defining how far excess Fe(II) is advected before oxidation, thereby determining the spatial extent of precipitation fronts.
In summary, the effect of Da on Fe precipitation patterns is not uniform across all simulation cases, but a consistent trend is observed within groups sharing the same Fe(II) concentration. As Fe(II) levels increase, system sensitivity to Da diminishes, and transport effects (Pe) become stronger control by carrying excess Fe(II) further downstream before oxidation. Thus, while Da dictates the degree of precipitation localization, system-scale precipitation patterns are strongly influenced by Fe(II) concentration and local flow regimes. These findings emphasize the need to integrate both reaction and transport mechanisms in reactive transport models to accurately capture precipitation behavior across diverse environmental settings, particularly in mining-related groundwater with elevated Fe(II) concentrations.

5. Discussion and Implications

5.1. Dynamic Characteristics of Fe Oxides

This study uses the chemical formula Fe(OH)3 to represent Fe oxides in coastal aquifers and incorporates static physical properties, such as density and molar volume, as outlined in Table 1. However, in natural environments, Fe oxides undergo significant transformations, evolving from amorphous ferrihydrite, which has a gel-like structure, to more stable crystalline forms like goethite [44]. These transformations affect pore volume, surface area, and flow paths in porous media over time [23,38], leading to variations in density and molar volume influenced by water content [51]. While the inherent complexities of natural Fe oxides restrict direct applicability, this study provides a theoretical approach by considering static physical properties, time-dependent tortuosity and surface-controlled reactivity during oxidative precipitation of Fe(II) in porous media.
Although these simplifications may introduce some uncertainties, the model has been calibrated and verified through laboratory experiments, offering a foundational framework for predicting the distribution of Fe precipitation and its influence on the hydraulic properties of porous media. While the study does not include the transformation process, future collaboration with experienced chemists and experimental studies under various conditions will improve the model’s ability to accurately simulate mineral precipitation within porous media.

5.2. Microbial and Auto-Catalytic Feedback

This study focused on the abiotic oxidative precipitation of Fe(II) and its impact on porosity and flow, but it did not address the potential reversibility of this process or the role of microbial activity. However, microorganisms significantly influence Fe cycling, particularly in aerobic environments [52,53], where Fe-oxidizing bacteria can accelerate Fe(II) oxidation and promote Fe(III) precipitation [54,55]. Interactions between organic matter and inorganic compounds can further enhance precipitation rates [56,57], while extracellular polymeric substances (EPS) produced by microbes can alter the dynamics of Fe precipitation [58]. Early-stage precipitates may also act as catalytic surfaces, facilitating additional Fe(II) oxidation and preferential growth on existing mineral surfaces [59]. Furthermore, Fe(III) precipitates can be reduced back to Fe(II) under strongly reducing conditions [54,55], particularly in the presence of organic matter and dissimilatory iron-reducing bacteria such as Geobacter and Shewanella [60,61]. Such redox cycling is common in coastal aquifers, where fluctuating water tables and organic-rich sediments create alternating oxic and anoxic conditions [52,62]. In natural mixing zones on the marine side, OM inputs from tidal waters provide electron donors that stimulate sulfate reduction [29,30,63]. The abundant sulfate from seawater acts as an electron acceptor, producing sulfide that reacts with dissolved Fe(II) to form Fe-sulfide minerals (e.g., FeS2) [64,65]. This process alter the balance between Fe precipitation in sediments and Fe removal from porewaters [18,31,66]. Coupled with water table fluctuations [32,33], these reactions promote alternating oxic–anoxic conditions that intensify redox cycling, create spatial heterogeneity in Fe distribution, and exacerbate pore clogging in specific regions [39,67,68]. As a result, iron curtains in coastal aquifers are shaped not only by abiotic precipitation (as captured in our experiments), but also by OM-driven microbial processes and dynamic hydrological forcing. While our study resolves knowledge gaps on abiotic precipitation mechanisms, future studies should explicitly incorporate OM supply, sulfate reduction, and water table variability to evaluate the long-term stability of iron curtains in natural field settings.
This study excluded microbial activity as a result of pre-washed glass beads, and the saltwater inhibited microbial growth. However, incorporating microbial processes, autocatalytic mechanisms, and redox reversibility into the reactive transport model is essential for better predicting the persistence and evolution of iron precipitates under dynamic environmental conditions. Future studies will take into account microbial facilitation in order to increase the model’s applications in environments with prevalent microbial activities. Additionally, integrating exponential models proposed in earlier research [22,69] to describe how early mineral phases influence the reactivity of later phases could provide valuable insights into future studies.

5.3. Upscaling and Practical Applications

Fe(II) in natural groundwater primarily originates from the reductive dissolution of iron-bearing minerals under anoxic conditions [52,70]. Its concentrations typically range from about 0.01 to 4.0 mmol/L in highly reducing systems, depending on pH, alkalinity, and the presence of organic matter [71,72]. In contrast, the Fe(II) concentrations (1 to 100 mmol/L) used in this study are higher than those commonly observed in natural groundwater. These elevated concentrations were necessary to achieve observable precipitation within the experimental timescale and to investigate pore-clogging under extreme conditions. By simulating high-stress geochemical environments similar to those found in industrial discharge zones, this study offers critical insights into the oxidative precipitation of Fe(II) under conditions that extend beyond typical natural systems.
Through parametric analysis, the study underscores the necessity of controlling Pe in subsurface flow applications, including groundwater remediation and geochemical engineering. High Pe facilitates rapid transport but exacerbates confined clogging, which can lead to permeability loss and flow channelling. In contrast, low Pe allows for more localized precipitation but may reduce the efficiency of reactant transport. These findings provide important insights for optimizing injection strategies to balance efficient contaminant removal with controlled precipitation to prevent premature system failure. Also, the study reveals key distinctions in how Da affects Fe precipitation patterns. Within each Da group, increasing Da results in a more localized and reduced precipitation front due to faster reaction rates, which limits transport distances. Across different Da groups, variations in precipitation patterns highlight additional influences beyond Da, such as local hydrodynamics, mixing conditions, and flow heterogeneities. From an engineering perspective, these findings are vital for designing injection strategies in reactive transport systems. High Da leads to rapid but confined clogging, which may require optimized flow rates or reagent dispersion techniques to avoid localized system failure. In contrast, low Da enables more localized precipitation, which may be preferable in applications where controlled distribution is desired.
Although this study is based on controlled experiments and simplified modelling, the syringe test conducted under controlled settings provides significant data on spatial heterogeneity, hence validating the reliability of predictive models for porous media. The numerical model further offers critical insights into how hydrogeochemical processes influence pore structure over time. These findings are instrumental in developing customized tactics for certain operational objectives, thereby guaranteeing both efficiency and durability in subsurface engineering applications.

5.4. Limitations and Future Directions

The study defines specific settings to investigate the fundamental hydrogeochemical processes governing Fe(II) oxidative and Fe(III) precipitation in porous media. However, it has several limitations due to time and financial constraints. One primary limitation is the controlled setting and spatial scale of the syringe experiment, which may inadequately represent the complexity of field-scale systems. Fixed inflow rate and specified flow path in the experiment may also not adequately represent large-scale variations in preferential flow and transport mechanisms in heterogeneous field conditions. Additionally, the 15-day experimental duration may not capture the long-term evolution of mineral transformations in groundwater systems. Despite these limitations, the study represents a significant advance in understanding the key mechanisms of iron curtain functionalities in coastal environments.
In natural field environments, localized patterns of Fe precipitation driven by variable Fe(II) inputs can result in anisotropic changes in porosity and permeability [73,74]. To better mimic real-world systems, future research will integrate heterogeneous substrates, organic compounds, and natural sediments with multiple particle sizes. These studies will also employ large column experiments with variable injection schemes to facilitate long-term monitoring. Additionally, field-scale implementation will involve large-scale RTM to enhance forecasting capabilities and support the development of sustainable strategies for managing hydrogeological systems.

6. Conclusions

While numerous studies have focused on groundwater–seawater mixing in intertidal areas, limited attention has been given to the spatiotemporal evolution of Fe precipitates associated with subsurface processes. This gap has restricted our understanding of the iron curtain in coastal sediments, as well as long-term variations in coastal groundwater systems. To resolve this, this study reconstructed the subsurface mixing process at a laboratory scale using syringe tests, in which freshwater containing Fe(II) was injected into a flow of saltwater with abundant DO. These experiments generated useful data for determining the impact of geochemical reactions on pore structure, precipitation patterns, and hydraulic properties. Furthermore, a process-based numerical model integrating hydrogeochemical reactions was developed to better illustrate the evolution of Fe precipitates over time and space. The model was calibrated based on experimental conditions and validated against observed results. Based on these experimental and numerical findings, the key research outcomes can be summarized as follows:
The syringe experiments identified a critical zone of intensive Fe precipitation near the inlet, where Fe(II)-rich freshwater first mixed with DO-rich saltwater. Imaging techniques such as SEM revealed that Fe precipitates primarily coated the surfaces of spherical particles, with some forming inter-particle bonding structures. This process increased the surface area of existing particles within an REV and altered flow pathways by narrowing pore spaces and reducing pore throat sizes. These structural changes significantly influenced the observed porosity and permeability of the system. Numerical simulation using a full-scale syringe model further demonstrated that complete pore-clogging was initiated near the inlet when Fe(II) concentration was increased to 10 mmol/L. The results identified a threshold Fe concentration relevant to this model’s timescale, serving as a threshold beyond which pore-clogging accelerated. This threshold was evident in the maximal volume fraction of Fe precipitates predicted by the model, ultimately regulating flow patterns by localized pore-clogging.
These findings from parametric studies can apply to field-scale scenarios, enabling the extension of process-based understanding to groundwater modelling for engineering and environmental applications. As a result, this study provides reasonable interpretations of iron curtain formation in coastal groundwater systems. First, the presence of Fe(II) and its subsequent oxidative precipitation generate an acidic environment, lowering porewater pH. Therefore, characterizing pH profiles can serve as a practical approach for identifying and delineating iron curtains in intertidal areas. Second, Fe precipitates form interconnections between granular particles, often bonding them into new structures. This explains the observation of Fe oxide-coated sands in sediments, commonly known as the iron curtain in previous studies. Third, the initiation of an iron curtain is likely to occur in subsurface zones with high flow rates and oxidizing conditions with high Fe(II) concentrations. In such environments, the direct transport of dissolved Fe(II) to the ocean is restricted, while elevated Fe(II) concentrations enhance oxidation and precipitation at localized scales, leading to zones with intensive Fe precipitates. As a result, the accumulation of Fe oxides in specific areas alters the hydraulic properties of coastal systems and acts as a natural geochemical barrier, regulating solute transport at groundwater–seawater interfaces.
In summary, this study integrates experimental observations with numerical modelling to examine how oxidative precipitation of Fe(II) influences porosity and flow in porous media. The results demonstrate that Fe precipitation can significantly reduce permeability and outflow rates, leading to localized pore clogging under high Fe(II) concentrations. Although microbial processes and long-term aging were not covered, the methodology developed here provides a robust framework for assessing porosity changes and their hydraulic implications in precipitation-dominated systems. These findings improve understanding of geochemical barriers in coastal aquifers and their role in controlling solute transport under dynamic mixing conditions.

Author Contributions

W.C.: Conceptualization, Methodology, Investigation, Formal analysis, Data curation, Visualization, Writing—original draft, Writing—review and editing. H.H.: Conceptualization, Methodology, Resources, Writing—review and editing, Supervision, Project administration. A.S.: Writing—review and editing, Supervision, Project administration. All authors have read and agreed to the published version of the manuscript.

Funding

This research was funded by the Australian Research Council through its Discovery Project (grant number: DP190103782).

Institutional Review Board Statement

Not applicable.

Informed Consent Statement

Not applicable.

Data Availability Statement

The original contributions presented in the study are included in the article. Further inquiries can be directed to the corresponding author.

Acknowledgments

The numerical scheme was refined through discussions with Guanxi Yan at The University of Queensland (UQ). The authors extend their gratitude to the School of Civil Engineering, and the School of the Environment at UQ for their support. Additionally, we deeply appreciate the insightful comments from the reviewers and the editor, which significantly enhanced the clarity and rigor of this study.

Conflicts of Interest

The authors declare no conflicts of interest.

References

  1. Larrahondo, J.M.; Burns, S.E. Laboratory-Prepared Iron Oxide Coatings on Sands: Surface Characterization and Strength Parameters. J. Geotech. Geoenviron. Eng. 2014, 140, 04013052. [Google Scholar] [CrossRef]
  2. Viscarra Rossel, R.A.; Bui, E.N.; de Caritat, P.; McKenzie, N.J. Mapping Iron Oxides and the Color of Australian Soil Using Visible–near-Infrared Reflectance Spectra. J. Geophys. Res. 2010, 115, F04031. [Google Scholar] [CrossRef]
  3. Charette, M.A.; Allen, M.C. Precision Ground Water Sampling in Coastal Aquifers Using a Direct-Push, Shielded-Screen Well-Point System. Groundw. Monit. Remediat. 2006, 26, 87–93. [Google Scholar] [CrossRef]
  4. Spiteri, C.; Regnier, P.; Slomp, C.P.; Charette, M.A. pH-Dependent Iron Oxide Precipitation in a Subterranean Estuary. J. Geochem. Explor. 2006, 88, 399–403. [Google Scholar] [CrossRef]
  5. Lalonde, K.; Mucci, A.; Ouellet, A.; Gélinas, Y. Preservation of Organic Matter in Sediments Promoted by Iron. Nature 2012, 483, 198–200. [Google Scholar] [CrossRef] [PubMed]
  6. Linkhorst, A.; Dittmar, T.; Waska, H. Molecular Fractionation of Dissolved Organic Matter in a Shallow Subterranean Estuary: The Role of the Iron Curtain. Environ. Sci. Technol. 2017, 51, 1312–1320. [Google Scholar] [CrossRef]
  7. Zhang, D.; Guo, H.; Xiu, W.; Ni, P.; Zheng, H.; Wei, C. In-Situ Mobilization and Transformation of Iron Oxides-Adsorbed Arsenate in Natural Groundwater. J. Hazard. Mater. 2017, 321, 228–237. [Google Scholar] [CrossRef]
  8. Reckhardt, A.; Beck, M.; Seidel, M.; Riedel, T.; Wehrmann, A.; Bartholomä, A.; Schnetger, B.; Dittmar, T.; Brumsack, H.-J. Carbon, Nutrient and Trace Metal Cycling in Sandy Sediments: A Comparison of High-Energy Beaches and Backbarrier Tidal Flats. Estuar. Coast. Shelf Sci. 2015, 159, 1–14. [Google Scholar] [CrossRef]
  9. Charette, M.A.; Sholkovitz, E.R. Oxidative Precipitation of Groundwater-Derived Ferrous Iron in the Subterranean Estuary of a Coastal Bay. Geophys. Res. Lett. 2002, 29, 85-1–85-4. [Google Scholar] [CrossRef]
  10. Anwar, N.; Robinson, C.; Barry, D.A. Influence of Tides and Waves on the Fate of Nutrients in a Nearshore Aquifer: Numerical Simulations. Adv. Water Resour. 2014, 73, 203–213. [Google Scholar] [CrossRef]
  11. O’Connor, A.E.; Luek, J.L.; McIntosh, H.; Beck, A.J. Geochemistry of Redox-Sensitive Trace Elements in a Shallow Subterranean Estuary. Mar. Chem. 2015, 172, 70–81. [Google Scholar] [CrossRef]
  12. Paffrath, R.; Pahnke, K.; Behrens, M.K.; Reckhardt, A.; Ehlert, C.; Schnetger, B.; Brumsack, H.-J. Rare Earth Element Behavior in a Sandy Subterranean Estuary of the Southern North Sea. Front. Mar. Sci. 2020, 7, 424. [Google Scholar] [CrossRef]
  13. Porubsky, W.P.; Weston, N.B.; Moore, W.S.; Ruppel, C.; Joye, S.B. Dynamics of Submarine Groundwater Discharge and Associated Fluxes of Dissolved Nutrients, Carbon, and Trace Gases to the Coastal Zone (Okatee River Estuary, South Carolina). Geochim. Cosmochim. Acta 2014, 131, 81–97. [Google Scholar] [CrossRef]
  14. Robinson, C.E.; Xin, P.; Santos, I.R.; Charette, M.A.; Li, L.; Barry, D.A. Groundwater Dynamics in Subterranean Estuaries of Coastal Unconfined Aquifers: Controls on Submarine Groundwater Discharge and Chemical Inputs to the Ocean. Adv. Water Resour. 2018, 115, 315–331. [Google Scholar] [CrossRef]
  15. Roy, M.; Martin, J.B.; Cherrier, J.; Cable, J.E.; Smith, C.G. Influence of Sea Level Rise on Iron Diagenesis in an East Florida Subterranean Estuary. Geochim. Cosmochim. Acta 2010, 74, 5560–5573. [Google Scholar] [CrossRef]
  16. Trezzi, G.; Garcia-Orellana, J.; Rodellas, V.; Santos-Echeandia, J.; Tovar-Sánchez, A.; Garcia-Solsona, E.; Masqué, P. Submarine Groundwater Discharge: A Significant Source of Dissolved Trace Metals to the North Western Mediterranean Sea. Mar. Chem. 2016, 186, 90–100. [Google Scholar] [CrossRef]
  17. Houben, G.J.; Wachenhausen, J.; Guevara Morel, C.R. Effects of Ageing on the Hydraulics of Water Wells and the Influence of Non-Darcy Flow. Hydrogeol. J. 2018, 26, 1285–1294. [Google Scholar] [CrossRef]
  18. McAllister, S.M.; Barnett, J.M.; Heiss, J.W.; Findlay, A.J.; MacDonald, D.J.; Dow, C.L.; Luther, G.W.; Michael, H.A.; Chan, C.S. Dynamic Hydrologic and Biogeochemical Processes Drive Microbially Enhanced Iron and Sulfur Cycling within the Intertidal Mixing Zone of a Beach Aquifer: Fe and S Cycling in a Beach Aquifer. Limnol. Oceanogr. 2015, 60, 329–345. [Google Scholar] [CrossRef]
  19. Sevinç Şengör, S.; Spycher, N.F.; Ginn, T.R.; Sani, R.K.; Peyton, B. Biogeochemical Reactive–Diffusive Transport of Heavy Metals in Lake Coeur d’Alene Sediments. Appl. Geochem. 2007, 22, 2569–2594. [Google Scholar] [CrossRef]
  20. Shen, C.; Zhang, C.; Xin, P.; Kong, J.; Li, L. Salt Dynamics in Coastal Marshes: Formation of Hypersaline Zones. Water Resour. Res. 2018, 54, 3259–3276. [Google Scholar] [CrossRef]
  21. Stack, A.G. Precipitation in Pores: A Geochemical Frontier. Rev. Mineral. Geochem. 2015, 80, 165–190. [Google Scholar] [CrossRef]
  22. Seigneur, N.; Mayer, K.U.; Steefel, C.I. Reactive Transport in Evolving Porous Media. Rev. Mineral. Geochem. 2019, 85, 197–238. [Google Scholar] [CrossRef]
  23. Cao, W.; Hu, N.; Yan, G.; Hofmann, H.; Scheuermann, A. Permeability–Porosity Model Considering Oxidative Precipitation of Fe(II) in Granular Porous Media. J. Hydrol. 2024, 636, 131346. [Google Scholar] [CrossRef]
  24. Saripalli, K.P.; Serne, R.J.; Meyer, P.D.; McGrail, B.P. Prediction of Diffusion Coefficients in Porous Media Using Tortuosity Factors Based on Interfacial Areas. Groundwater 2002, 40, 346–352. [Google Scholar] [CrossRef]
  25. Soulaine, C.; Tchelepi, H.A. Micro-Continuum Approach for Pore-Scale Simulation of Subsurface Processes. Transp. Porous Media 2016, 113, 431–456. [Google Scholar] [CrossRef]
  26. Tenthorey, E.; Fitzgerald, J. Feedbacks between Deformation, Hydrothermal Reaction and Permeability Evolution in the Crust: Experimental Insights. Earth Planet. Sci. Lett. 2006, 247, 117–129. [Google Scholar] [CrossRef]
  27. Hommel, J.; Coltman, E.; Class, H. Porosity–Permeability Relations for Evolving Pore Space: A Review with a Focus on (Bio-)Geochemically Altered Porous Media. Transp. Porous Media 2018, 124, 589–629. [Google Scholar] [CrossRef]
  28. Xie, M.; Mayer, K.U.; Claret, F.; Alt-Epping, P.; Jacques, D.; Steefel, C.; Chiaberge, C.; Simunek, J. Implementation and Evaluation of Permeability-Porosity and Tortuosity-Porosity Relationships Linked to Mineral Dissolution-Precipitation. Comput. Geosci. 2015, 19, 655–671. [Google Scholar] [CrossRef]
  29. Amoako, K.; Saban, R.C.; Böttcher, M.E.; Waska, H. Sources and Processing of Dissolved Organic Matter in a Microtidal Subterranean Estuary. Estuaries Coasts 2025, 48, 171. [Google Scholar] [CrossRef]
  30. Peng, K.; Yan, L.; Xie, X.; Deng, Y.; Gan, Y.; Li, Q.; Zhang, Y.; Tang, X. Quantifying the Fate of Biogenic Elements in Mangrove Aquifers: Insights from Reactive Transport Modeling under Saltwater-Freshwater Mixing. Water Res. 2025, 278, 123381. [Google Scholar] [CrossRef] [PubMed]
  31. Caschetto, M.; Colombani, N.; Mastrocicco, M.; Petitta, M.; Aravena, R. Nitrogen and Sulphur Cycling in the Saline Coastal Aquifer of Ferrara, Italy. A Multi-Isotope Approach. Appl. Geochem. 2017, 76, 88–98. [Google Scholar] [CrossRef]
  32. Peng, K.; Yan, L.; Xie, X.; Deng, Y.; Gan, Y.; Zhang, Y. Hydrogeochemical Dynamics under Saltwater-Freshwater Mixing in a Mangrove Wetland over Tidal Cycles. Sci. Total Environ. 2024, 954, 176827. [Google Scholar] [CrossRef] [PubMed]
  33. Heiss, J.W.; Post, V.E.A.; Laattoe, T.; Russoniello, C.J.; Michael, H.A. Physical Controls on Biogeochemical Processes in Intertidal Zones of Beach Aquifers. Water Resour. Res. 2017, 53, 9225–9244. [Google Scholar] [CrossRef]
  34. Banzhaf, S.; Hebig, K.H. Use of Column Experiments to Investigate the Fate of Organic Micropollutants—A Review. Hydrol. Earth Syst. Sci. 2016, 20, 3719–3737. [Google Scholar] [CrossRef]
  35. Pavuluri, S.; Tournassat, C.; Claret, F.; Soulaine, C. Reactive Transport Modeling with a Coupled OpenFOAM®-PHREEQC Platform. Transp. Porous Media 2022, 145, 475–504. [Google Scholar] [CrossRef]
  36. Zhao, Z.; Zhang, C.; Cao, W.; Hofmann, H.; Wang, T.; Li, L. Oxidative Precipitation of Fe(II) in Porous Media: Laboratory Experiment and Numerical Simulation. ACS EST Water 2023, 3, 963–973. [Google Scholar] [CrossRef]
  37. Soulaine, C.; Pavuluri, S.; Claret, F.; Tournassat, C. porousMedia4Foam: Multi-Scale Open-Source Platform for Hydro-Geochemical Simulations with OpenFOAM®. Environ. Model. Softw. 2021, 145, 105199. [Google Scholar] [CrossRef]
  38. Cao, W.; Yan, G.; Hofmann, H.; Scheuermann, A. A Novel Permeability–Tortuosity–Porosity Model for Evolving Pore Space and Mineral-Induced Clogging in Porous Medium. Geotechnics 2025, 5, 2. [Google Scholar] [CrossRef]
  39. Cao, W.; Yan, G.; Hofmann, H.; Scheuermann, A. A State-of-the-Art Perspective on Fe Precipitation in Porous Media: Hydrogeochemical Processes and Evolving Parameters. J. Mar. Sci. Eng. 2024, 12, 690. [Google Scholar] [CrossRef]
  40. Archie, G.E. The Electrical Resistivity Log as an Aid in Determining Some Reservoir Characteristics. Trans. AIME 1942, 146, 54–62. [Google Scholar] [CrossRef]
  41. Alhama, I.; García-Ros, G.; Icardi, M. Non-Stationary Contaminant Plumes in the Advective-Diffusive Regime. Mathematics 2021, 9, 725. [Google Scholar] [CrossRef]
  42. Van Der Grift, B.; Rozemeijer, J.C.; Griffioen, J.; Van Der Velde, Y. Iron Oxidation Kinetics and Phosphate Immobilization along the Flow-Path from Groundwater into Surface Water. Hydrol. Earth Syst. Sci. 2014, 18, 4687–4702. [Google Scholar] [CrossRef]
  43. Poonoosamy, J.; Soulaine, C.; Burmeister, A.; Deissmann, G.; Bosbach, D.; Roman, S. Microfluidic Flow-through Reactor and 3D Raman Imaging for in Situ Assessment of Mineral Reactivity in Porous and Fractured Porous Media. Lab. Chip 2020, 20, 2562–2571. [Google Scholar] [CrossRef]
  44. Cudennec, Y.; Lecerf, A. The Transformation of Ferrihydrite into Goethite or Hematite, Revisited. J. Solid State Chem. 2006, 179, 716–722. [Google Scholar] [CrossRef]
  45. Houben, G.J. Iron Oxide Incrustations in Wells. Part 1: Genesis, Mineralogy and Geochemistry. Appl. Geochem. 2003, 18, 927–939. [Google Scholar] [CrossRef]
  46. Algive, L.; Bekri, S.; Vizika, O. Pore-Network Modeling Dedicated to the Determination of the Petrophysical-Property Changes in the Presence of Reactive Fluid. SPE J. 2010, 15, 618–633. [Google Scholar] [CrossRef]
  47. Auffan, M.; Rose, J.; Bottero, J.-Y.; Lowry, G.V.; Jolivet, J.-P.; Wiesner, M.R. Towards a Definition of Inorganic Nanoparticles from an Environmental, Health and Safety Perspective. Nat. Nanotechnol. 2009, 4, 634–641. [Google Scholar] [CrossRef] [PubMed]
  48. Hu, Y.; Lee, B.; Bell, C.; Jun, Y.-S. Environmentally Abundant Anions Influence the Nucleation, Growth, Ostwald Ripening, and Aggregation of Hydrous Fe(III) Oxides. Langmuir 2012, 28, 7737–7746. [Google Scholar] [CrossRef] [PubMed]
  49. Xu, Y.; Axe, L. Synthesis and Characterization of Iron Oxide-Coated Silica and Its Effect on Metal Adsorption. J. Colloid Interface Sci. 2005, 282, 11–19. [Google Scholar] [CrossRef]
  50. Yan, G.; Cheng, Z.; Ma, Y.; Scheuermann, A.; Li, L. Applying Imaging Technique to Investigate Effects of Solute Concentrations and Gas Injection Rates on Gas Bubble Generation. Geofluids 2022, 2022, 1–26. [Google Scholar] [CrossRef]
  51. Hiemstra, T.; Mendez, J.C.; Li, J. Evolution of the Reactive Surface Area of Ferrihydrite: Time, pH, and Temperature Dependency of Growth by Ostwald Ripening. Environ. Sci. Nano 2019, 6, 820–833. [Google Scholar] [CrossRef]
  52. Cao, W.; Hofmann, H.; Yan, G.; Scheuermann, A. Porewater Exchange and Iron Transformation in a Coastal Groundwater System: A Field Investigation, Driving Mechanisms Analysis, and Conceptual Model. Front. Mar. Sci.—Sec Coast. Ocean Process. 2024, 11, 1385517. [Google Scholar] [CrossRef]
  53. Wu, Z.; Wang, S.; Ji, N. Distribution Character of Localized Iron Microniche in Lake Sediment Microzone Revealed by Chemical Image. Environ. Sci. Pollut. Res. 2019, 26, 35704–35716. [Google Scholar] [CrossRef]
  54. Baker, I.R.; Matzen, S.L.; Schuler, C.J.; Toner, B.M.; Girguis, P.R. Aerobic Iron-Oxidizing Bacteria Secrete Metabolites That Markedly Impede Abiotic Iron Oxidation. PNAS Nexus 2023, 2, pgad421. [Google Scholar] [CrossRef] [PubMed]
  55. Kügler, S.; Cooper, R.E.; Wegner, C.-E.; Mohr, J.F.; Wichard, T.; Küsel, K. Iron-Organic Matter Complexes Accelerate Microbial Iron Cycling in an Iron-Rich Fen. Sci. Total Environ. 2019, 646, 972–988. [Google Scholar] [CrossRef]
  56. Zhou, S.; Chen, S.; Yuan, Y.; Lu, Q. Influence of Humic Acid Complexation with Metal Ions on Extracellular Electron Transfer Activity. Sci. Rep. 2015, 5, 17067. [Google Scholar] [CrossRef]
  57. Sukekava, C.F.; Downes, J.; Filella, M.; Vilanova, B.; Laglera, L.M. Ligand Exchange Provides New Insight into the Role of Humic Substances in the Marine Iron Cycle. Geochim. Cosmochim. Acta 2024, 366, 17–30. [Google Scholar] [CrossRef]
  58. Costa, O.Y.A.; Raaijmakers, J.M.; Kuramae, E.E. Microbial Extracellular Polymeric Substances: Ecological Function and Impact on Soil Aggregation. Front. Microbiol. 2018, 9, 1636. [Google Scholar] [CrossRef]
  59. Harrison, A.L.; Dipple, G.M.; Power, I.M.; Mayer, K.U. The Impact of Evolving Mineral–Water–Gas Interfacial Areas on Mineral–Fluid Reaction Rates in Unsaturated Porous Media. Chem. Geol. 2016, 421, 65–80. [Google Scholar] [CrossRef]
  60. Jiang, Z.; Shi, M.; Shi, L. Degradation of Organic Contaminants and Steel Corrosion by the Dissimilatory Metal-Reducing Microorganisms Shewanella and Geobacter spp. Int. Biodeterior. Biodegrad. 2020, 147, 104842. [Google Scholar] [CrossRef]
  61. Zhong, H.; Lyu, H.; Wang, Z.; Tian, J.; Wu, Z. Application of Dissimilatory Iron-Reducing Bacteria for the Remediation of Soil and Water Polluted with Chlorinated Organic Compounds: Progress, Mechanisms, and Directions. Chemosphere 2024, 352, 141505. [Google Scholar] [CrossRef]
  62. Benaiges-Fernandez, R.; Palau, J.; Offeddu, F.G.; Cama, J.; Urmeneta, J.; Soler, J.M.; Dold, B. Dissimilatory Bioreduction of Iron(III) Oxides by Shewanella Loihica under Marine Sediment Conditions. Mar. Environ. Res. 2019, 151, 104782. [Google Scholar] [CrossRef]
  63. Brodersen, K.E.; Trevathan-Tackett, S.M.; Nielsen, D.A.; Connolly, R.M.; Lovelock, C.E.; Atwood, T.B.; Macreadie, P.I. Oxygen Consumption and Sulfate Reduction in Vegetated Coastal Habitats: Effects of Physical Disturbance. Front. Mar. Sci. 2019, 6, 14. [Google Scholar] [CrossRef]
  64. Antler, G.; Mills, J.V.; Hutchings, A.M.; Redeker, K.R.; Turchyn, A.V. The Sedimentary Carbon-Sulfur-Iron Interplay—A Lesson From East Anglian Salt Marsh Sediments. Front. Earth Sci. 2019, 7, 140. [Google Scholar] [CrossRef]
  65. Beam, J.P.; George, S.; Record, N.R.; Countway, P.D.; Johnston, D.T.; Girguis, P.R.; Emerson, D. Mud, Microbes, and Macrofauna: Seasonal Dynamics of the Iron Biogeochemical Cycle in an Intertidal Mudflat. Front. Mar. Sci. 2020, 7, 562617. [Google Scholar] [CrossRef]
  66. Snyder, M.; Taillefert, M.; Ruppel, C. Redox Zonation at the Saline-Influenced Boundaries of a Permeable Surficial Aquifer: Effects of Physical Forcing on the Biogeochemical Cycling of Iron and Manganese. J. Hydrol. 2004, 296, 164–178. [Google Scholar] [CrossRef]
  67. Alotaibi, M.D.; Patterson, B.M.; McKinley, A.J.; Reeder, A.Y.; Furness, A.J.; Donn, M.J. Fate of Benzotriazole and 5-Methylbenzotriazole in Recycled Water Recharged into an Anaerobic Aquifer: Column Studies. Water Res. 2015, 70, 184–195. [Google Scholar] [CrossRef] [PubMed]
  68. Luef, B.; Fakra, S.C.; Csencsits, R.; Wrighton, K.C.; Williams, K.H.; Wilkins, M.J.; Downing, K.H.; Long, P.E.; Comolli, L.R.; Banfield, J.F. Iron-Reducing Bacteria Accumulate Ferric Oxyhydroxide Nanoparticle Aggregates That May Support Planktonic Growth. ISME J. 2013, 7, 338–350. [Google Scholar] [CrossRef]
  69. Jeen, S.-W.; Mayer, K.U.; Gillham, R.W.; Blowes, D.W. Reactive Transport Modeling of Trichloroethene Treatment with Declining Reactivity of Iron. Environ. Sci. Technol. 2007, 41, 1432–1438. [Google Scholar] [CrossRef]
  70. Osorio-Leon, I.; Bouchez, C.; Chatton, E.; Lavenant, N.; Longuevergne, L.; Le Borgne, T. Hydrological and Geological Controls for the Depth Distribution of Dissolved Oxygen and Iron in Silicate Catchments. Water Resour. Res. 2023, 59, e2023WR034986. [Google Scholar] [CrossRef]
  71. Fitzsimmons, J.N.; Conway, T.M. Novel Insights into Marine Iron Biogeochemistry from Iron Isotopes. Annu. Rev. Mar. Sci. 2023, 15, 383–406. [Google Scholar] [CrossRef] [PubMed]
  72. Zhang, J.; Zhu, X.; Zhang, R.; Ren, J.; Wu, Y.; Liu, S.; Huang, D. Dissolved Fe in the East China Sea Under the Influences of Land Sources and the Boundary Current With Implications for Global Marginal Seas. Glob. Biogeochem. Cycles 2022, 36, e2021GB006946. [Google Scholar] [CrossRef]
  73. Steefel, C.I.; Appelo, C.A.J.; Arora, B.; Jacques, D.; Kalbacher, T.; Kolditz, O.; Lagneau, V.; Lichtner, P.C.; Mayer, K.U.; Meeussen, J.C.L.; et al. Reactive Transport Codes for Subsurface Environmental Simulation. Comput. Geosci. 2015, 19, 445–478. [Google Scholar] [CrossRef]
  74. Ladd, A.J.C.; Szymczak, P. Reactive Flows in Porous Media: Challenges in Theoretical and Numerical Methods. Annu. Rev. Chem. Biomol. Eng. 2021, 12, 543–571. [Google Scholar] [CrossRef] [PubMed]
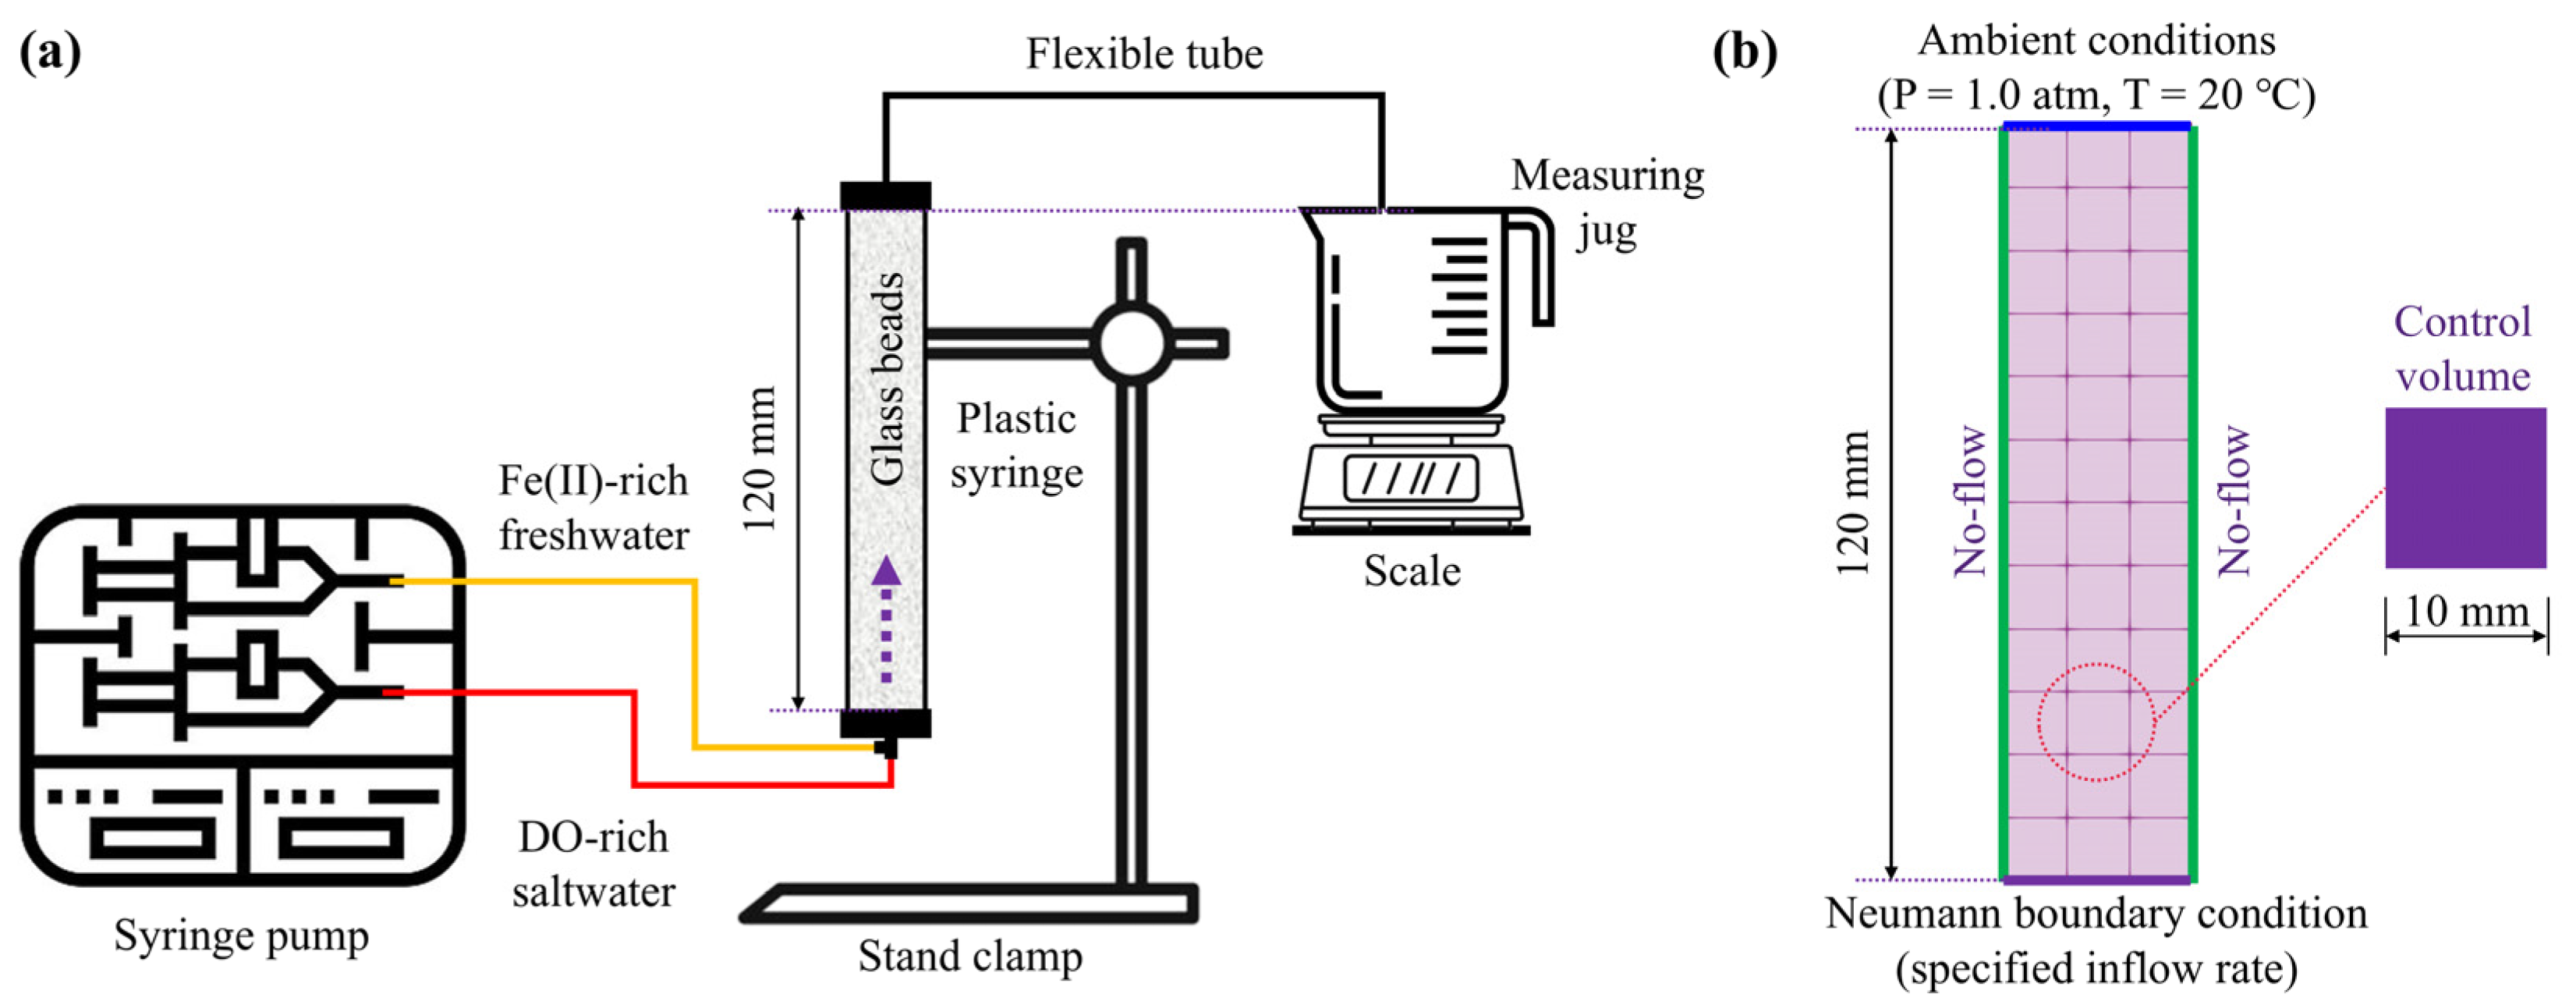
Figure 1. (a) Schematic of the syringe setup. (b) Numerical model setup, including domain dimensions, control volume size, and boundary conditions. Purple arrows indicate the flow direction through the porous media.
Jmse 13 01909 g001
Figure 2. Particle size distribution (PSD) of glass beads measured by sieving analysis. The red dotted line represents d50, the particle size at which 50% of soil particles are smaller.
Jmse 13 01909 g002
Figure 3. Observed concentrations of dissolved Fe(II) (solid circles) and the corresponding trend line (red curve) in outflow samples collected on day 5, 10, and 15.
Jmse 13 01909 g003
Figure 4. Characterization of tapwater (green rectangle), saltwater (red circle), Fe(II)-rich freshwater (brown circle), and outflow samples (purple crosses).
Jmse 13 01909 g004
Figure 5. SEM images: (a) Clean sample prior to reaction, showing unaltered particle surfaces; (b) post-reaction sample with Fe precipitates coating the particles. Dark areas represent the top of the SEM pin stub, while unmodified particle surfaces appear white. Grey regions indicate visible Fe precipitates. Some coating-peeling is observed, which is attributed to the natural drying process of the sample in an oven at 60 °C.
Jmse 13 01909 g005
Figure 6. (a) Simulated and experimental inflow rate over time, and (b) Experimental and simulated outflow rate over time. Blue dots are experimental data, while red dashed lines show simulation results.
Jmse 13 01909 g006
Figure 7. Spatiotemporal variation in Fe precipitation zone. (1) Experiment results (a,c,e): Black regions show areas with intensive Fe precipitates. These regions show the extent and distribution of precipitate-affected zones, but do not represent the actual volume of Fe precipitates. (2) Modelling outcomes (b,d,f): Contour colors depict the level of Fe(OH)3 volume fractions within the porous media, offering a quantitative assessment of precipitation. The ratio h/H denotes the height of a specified point (h, measured from the base) relative to the overall height (H) of the syringe. Purple arrows indicate the flow direction through the porous media.
Jmse 13 01909 g007
Figure 8. Spatiotemporal evolution of Fe(OH)3 volume fraction (a1c1), porosity reduction (ϕ/ϕ0) (a2c2), permeability decrease (k/k0) (a3c3), outflow rate changes (a4c4), and corresponding contour plots under varying Pe (d). The yellow dashed line traces the precipitation front within each Pe group, while the purple dashed line marks the first reduction in outflow rate for different cases. Note that the highest volume fraction is limited to 0.35, suggesting complete pore-clogging. Purple arrows indicate the flow direction through the porous media.
Jmse 13 01909 g008
Figure 9. Spatiotemporal evolution of Fe(OH)3 volume fraction (a1c1), porosity reduction (ϕ/ϕ0) (a2c2), permeability decrease (k/k0) (a3c3), outflow rate changes (a4c4), and corresponding contour plots under varying Fe(II) concentrations (d). The purple dashed line marks the first reduction in outflow rate for different cases. Note that the highest volume fraction is limited to 0.35, suggesting complete pore-clogging. Purple arrows indicate the flow direction through the porous media.
Jmse 13 01909 g009
Table 1. Values from laboratory experiments and model parameters used in the simulation.
CategoryParameterValueUnits
Porous media properties
(Glass beads)
Dry density (ρd)1600 [a]kg/m3
Initial porosity (ϕ0)0.35 [a]-
Initial permeability (k0)7.0 × 10⁻¹¹ [a]m2
Median particle size (d50)0.83 [a]mm
Freshwater properties (Containing Fe(II))Fe(II) concentration (CFe(II))0.001mol/L
Density (ρfw)1000kg/m3
pH4.0 [a]-
Saltwater properties (Containing DO)DO concentration (CDO)2.25 × 10⁻⁴ [b]mol/L
Density (ρsw)1025kg/m3
pH 8.0 [a]-
Injection scheme and transport propertiesVolumetric influx (Q)0.12L/day
Pore velocity (v = Q/0)4.78 × 10−6m/s
Vfw/Vsw [c]1.0-
Duration (t)15day
Diffusion coefficient (D0)1.0 × 10⁻⁹ [d]m2/s
Dispersion coefficient (αL)1.0 × 10⁻⁵ [d]m
Reaction rates and mineral parametersFe(II) oxidation rate constant (kox)2.46 × 10¹⁴ [d]L3/mol3/s
Fe precipitation rate constant (kpr)5.0 × 10⁻⁶ [d]mol/m2/s
Mineral density (ρs)4370 [d]kg/m3
Molar volume (Vm)0.024 [d]L/mol
Initial reactive surface area (S0)1.0 [d]m−1
Note: [a] Laboratory measurement. [b] 7.2 mg/L equivalent at 20 °C. [c] Vfw/Vsw is the volume ratio of DO-rich saltwater (Vsw) to Fe(II)-rich freshwater (Vfw) applied daily in the experiment. [d] Values reported for similar porous media systems in the literature [28,35,36]. These parameters were not measured directly in this study because the primary objective was to investigate Fe(II) precipitation and its impact on porosity and flow, rather than to characterize solute transport in detail. However, we acknowledge that under conditions of complete pore-clogging by Fe precipitates, advective transport dominates and the influence of dispersion becomes negligible.
Table 2. Model parameters for different simulation cases, with the experimental scenario listed as Item 1.
ItemCase IDInjection Scheme
(mL/day)
Hydrochemistry
(mmol/L)
Variables
VswVfwCFe(II)CDOpH *PeDa (×10−2)
1 Fe1_Pe6_Da26606010.2254.1626
2Fe1_Pe12_Da1312012010.2254.11213
3Fe1_Pe26_Da530030010.2254.1265
4Fe10_Pe6_Da1006060100.2253.76100
5Fe10_Pe12_Da50120120100.2253.71250
6Fe10_Pe26_Da20300300100.2253.72620
7Fe100_Pe6_Da25260601000.2253.16252
8Fe100_Pe12_Da1261201201000.2253.112126
9Fe100_Pe26_Da503003001000.2253.12650
Note: * pH levels are predicted results of combining freshwater and seawater before any chemical reactions.
Disclaimer/Publisher’s Note: The statements, opinions and data contained in all publications are solely those of the individual author(s) and contributor(s) and not of MDPI and/or the editor(s). MDPI and/or the editor(s) disclaim responsibility for any injury to people or property resulting from any ideas, methods, instructions or products referred to in the content.