Abstract
As a core component of large marine engines, the compressor delivers robust and efficient power for propulsion. This study focuses on assessing and quantifying the uncertainty in the aerodynamic performance of a transonic rotor under various operating conditions, with the aim of investigating the impact of blade manufacturing variability on performance. Monte Carlo simulation (MCS) and sensitivity analysis were initially employed to identify parameters that significantly influence airfoil performance. Subsequently, a non-intrusive polynomial chaos (NIPC) uncertainty quantification model was developed to compare the effects of tip clearance deviation and surface geometry deviation on rotor performance. The study then analyzes how the geometric deviation at the different spanwise sections affects aerodynamic performance. The results reveal that geometric deviations have a more profound influence on aerodynamic performance than blade tip clearance. The impact of geometric deviations on average pressure ratio and efficiency of the transonic compressor rotor intensifies as the air mass flow rate approaches the near-stall point, while it decreases near the choking point. Interestingly, fluctuations in pressure ratio exhibit the opposite trend. Regarding spatial distribution, deviations in the upper half of the blade span (near the tip) exert a more dramatic influence on mass flow rate and pressure ratio fluctuation. A conceivable reason is that the inlet airflow velocity increases along the radial direction of the blade, and manufacturing variations in the same magnitude produce more notable relative geometric deviations in the upper half of the blade span. Centered on the machining tolerance guidelines for transonic compressor rotors, this work recommends stricter profile tolerance requirements for the upper half of the blade span.
1. Introduction
As the demand for operational efficiency and durability in marine propulsion systems increases, designers of marine gas turbines are focusing on creating compressors that can achieve higher pressure ratios, improved isentropic efficiency, and wider surge margins. In contemporary high-performance gas turbines, the initial stages of multistage axial compressors often employ transonic stages. Through the integration of three-dimensional (3D) bowed and swept blade design with flow path contraction, and by precisely matching the radial distribution of aerodynamic parameters between blade rows, it is possible to significantly enhance the aerodynamic and mechanical performance of transonic compressors [1,2]. Nevertheless, the manufacturing process often fails to perfectly replicate the intended blade geometry due to limitations in machining techniques, equipment capabilities, and material properties. These minor geometric deviations can negatively impact the aerodynamic performance of the compressor, thereby diminishing the efficiency and reliability of marine gas turbines.
Previous research has thoroughly examined how aerodynamic performance is affected by manufacturing variability in compressors through deterministic methods. While these studies have substantially deepened our understanding of the degradation mechanisms associated with manufacturing variability and its effects on compressor blade performance, they are limited by their inherent simplifications. Uncertainty Quantification (UQ) methods offer a way to quantitatively evaluate the effects of stochastic inputs on system outputs, thus aiding in the statistical characterization of specific performance parameters. Goodhand [3] utilized Monte Carlo Simulation (MCS) to assess the sensitivity of the two-dimensional (2D) incidence range of compressors to manufacturing variability. Zhang et al. [4] introduced an efficient UQ approach using the adjoint method, which facilitates high-dimensional uncertainty analysis of 3D transonic fan aerodynamic performance, achieving computational efficiencies hundreds of times greater than those of traditional full-scale Computational Fluid Dynamics (CFD) simulations. Additionally, Ghisu et al. [5,6] have explored surrogate modeling techniques that employ polynomial chaos expansion. From detailed MCSs to efficient surrogate-based methods, UQ has been effectively applied in various areas, including the robust design of compressor rotor blades [7,8,9,10], robust design of turbine rotor blades [11,12,13], the analysis of geometric variability’s impact on aeroelastic excitation forces [14], and the evaluation of aerodynamic performance [15,16,17,18,19,20,21,22,23].
In this study, we focused on investigating research pertaining to the impact of manufacturing variability on the aerodynamic performance of compressors. Gambitta et al. [15] developed a stochastic model based on optical scans of a stator, employing a data reduction methodology to efficiently represent geometric uncertainty. Sun et al. [16] developed an intelligent surrogate model-based UQ framework specifically for deviations in the leading-edge (LE) radius. They concluded that such deviations lead to a probability of performance degradation exceeding 90%, with the tip region exhibiting the highest sensitivity at peak efficiency condition. Lange and colleagues [17,18] reported that geometric variations, specifically the thickness of airfoils, exert a more pronounced influence on the aerodynamic performance of compressor. Furthermore, an increased thickness in the LE region results in greater losses, as it induces flow acceleration in the low-momentum area near the stagnation point. Ji et al. [19] implemented a data-driven polynomial chaos approach combined with kernel density estimation to systematically quantify the effects of multiple geometric deviations. Their findings indicated that various geometric deviations at the 50% span section, as well as deviations in the LE radius and stagger angle at the 95% span section, significantly influence flow field losses. Additionally, Zheng et al. [20] examined the effects of variations in the stagger angle on aerodynamic performance and revealed that deviations with a circumferential sinusoidal distribution significantly mitigate adverse impacts on compressor performance. Moreover, in the context of 3D blades, the uncertainty in blade tip clearance originating from blade height deviation also affects aerodynamic performance. Rendu et al. [21] conducted a CFD-based UQ analysis, revealing that variations in the stagger angle and tip clearance between adjacent blades can precipitate performance degradation. Through the use of a surrogate model, they demonstrated that reducing the variability in stagger angle, while concurrently increasing the variability in tip clearance among adjacent blades, effectively heightens isentropic efficiency and substantially diminishes performance fluctuations. Liang [22] explored the effects of varying tip gap sizes at different stages of blade implementation on the inter-stage flow field in compressors. His findings indicated that an increase in tip clearance size results in the downstream shift in the initial position of the rotor’s tip leakage vortex, with an accompanying enlargement in scale and intensity of the vortex. Additionally, the trajectory of the tip leakage vortex was observed to deflect towards the inlet along the circumferential path. Zhang [23] determined that an increased tip clearance in the rotor leads to inadequate flow deviation at the blade tip. This, in turn, diminishes the aerodynamic forces near the rotor and exacerbates both leakage and pressure losses emanating from the clearance.
Previous research has illuminated the effects of various geometric deviations on the aerodynamic performance of compressors through the use of 2D or 3D blades. Nonetheless, the influence of geometric variations at different spans remains underexplored. In this study, the transonic rotor R37, designed by NASA, was utilized as a test case. A combination of MCS and Non-Intrusive Polynomial Chaos (NIPC) methods is employed to analyze the effects of distributed typical deviation features along the radial position. The study is organized into three sections: Section 1 discusses the development of distorted 2D airfoils, specifically modeled after the 50% span of NASA Rotor 37. Within this section, the MCS, in conjunction with the Multi-blade Interacting Streamtube Euler Solver (MISES) [24], is utilized to identify deviation features that significantly affect blade aerodynamic performance, thereby enabling a reduction in the dimensions of UQ. The identified deviations with significant impacts are subsequently incorporated into the 10%, 50%, and 90% spans of Rotor 37 to create a 3D distorted blade model. Section 2 delineates the numerical methods employed for CFD simulations and the UQ methodology. Section 3 examines and contrasts the effects of variations in tip clearance and deviations in blade surface geometry on the aerodynamic performance.
2. Dimensionality Reduction and Screening of Key Geometric Deviation Characteristics for 3D Error Modeling
2.1. Research Object
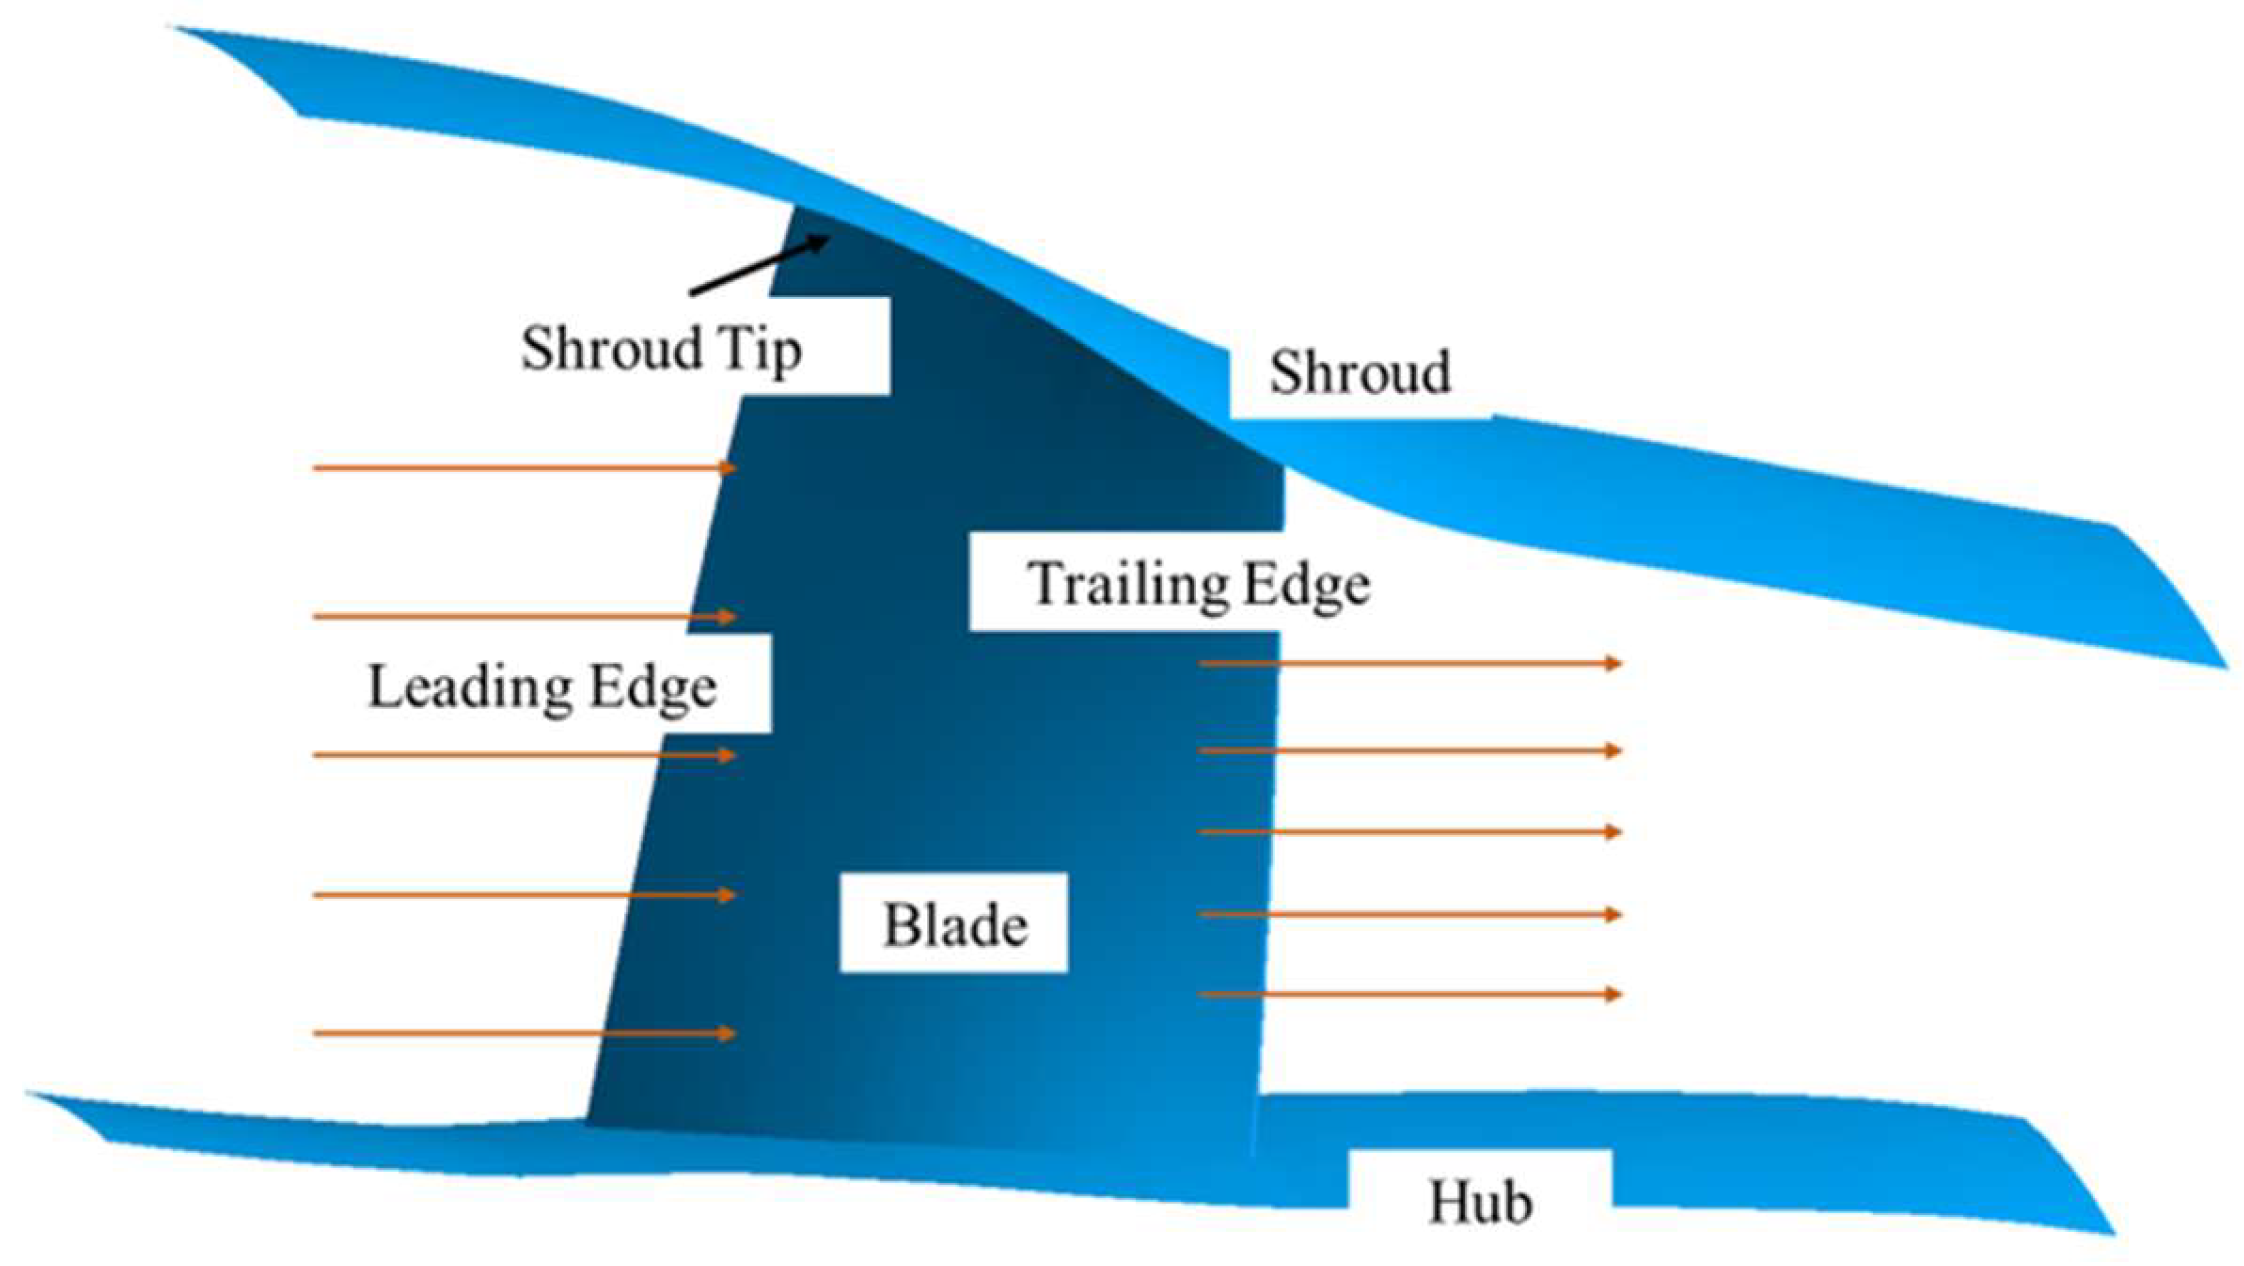
As a transonic axial-flow compressor rotor, NASA Rotor 37 is widely used for aerodynamic performance validation and flow field mechanism research in turbomachinery. Although this model is primarily applied within the fields of aeronautics and aerospace, its flow characteristics are analogous to those observed in the initial stages of contemporary high-performance marine compressors. Additionally, it provides openly accessible and comprehensive model and test data [25]. Consequently, the insights garnered from the R37 test case may serve as a valuable reference for evaluating the impact of manufacturing variability on the aerodynamic performance of marine gas turbines. Table 1 provides the core aerodynamic design parameters and key geometric structural parameters. A view of the compressor rotor is shown in Figure 1.

Table 1.
Geometric and aerodynamic parameters of Rotor 37.
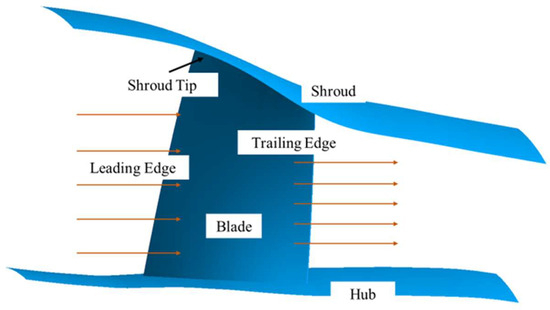
Figure 1.
View of the compressor rotor.
2.2. Modeling of Distorted 2D Blades
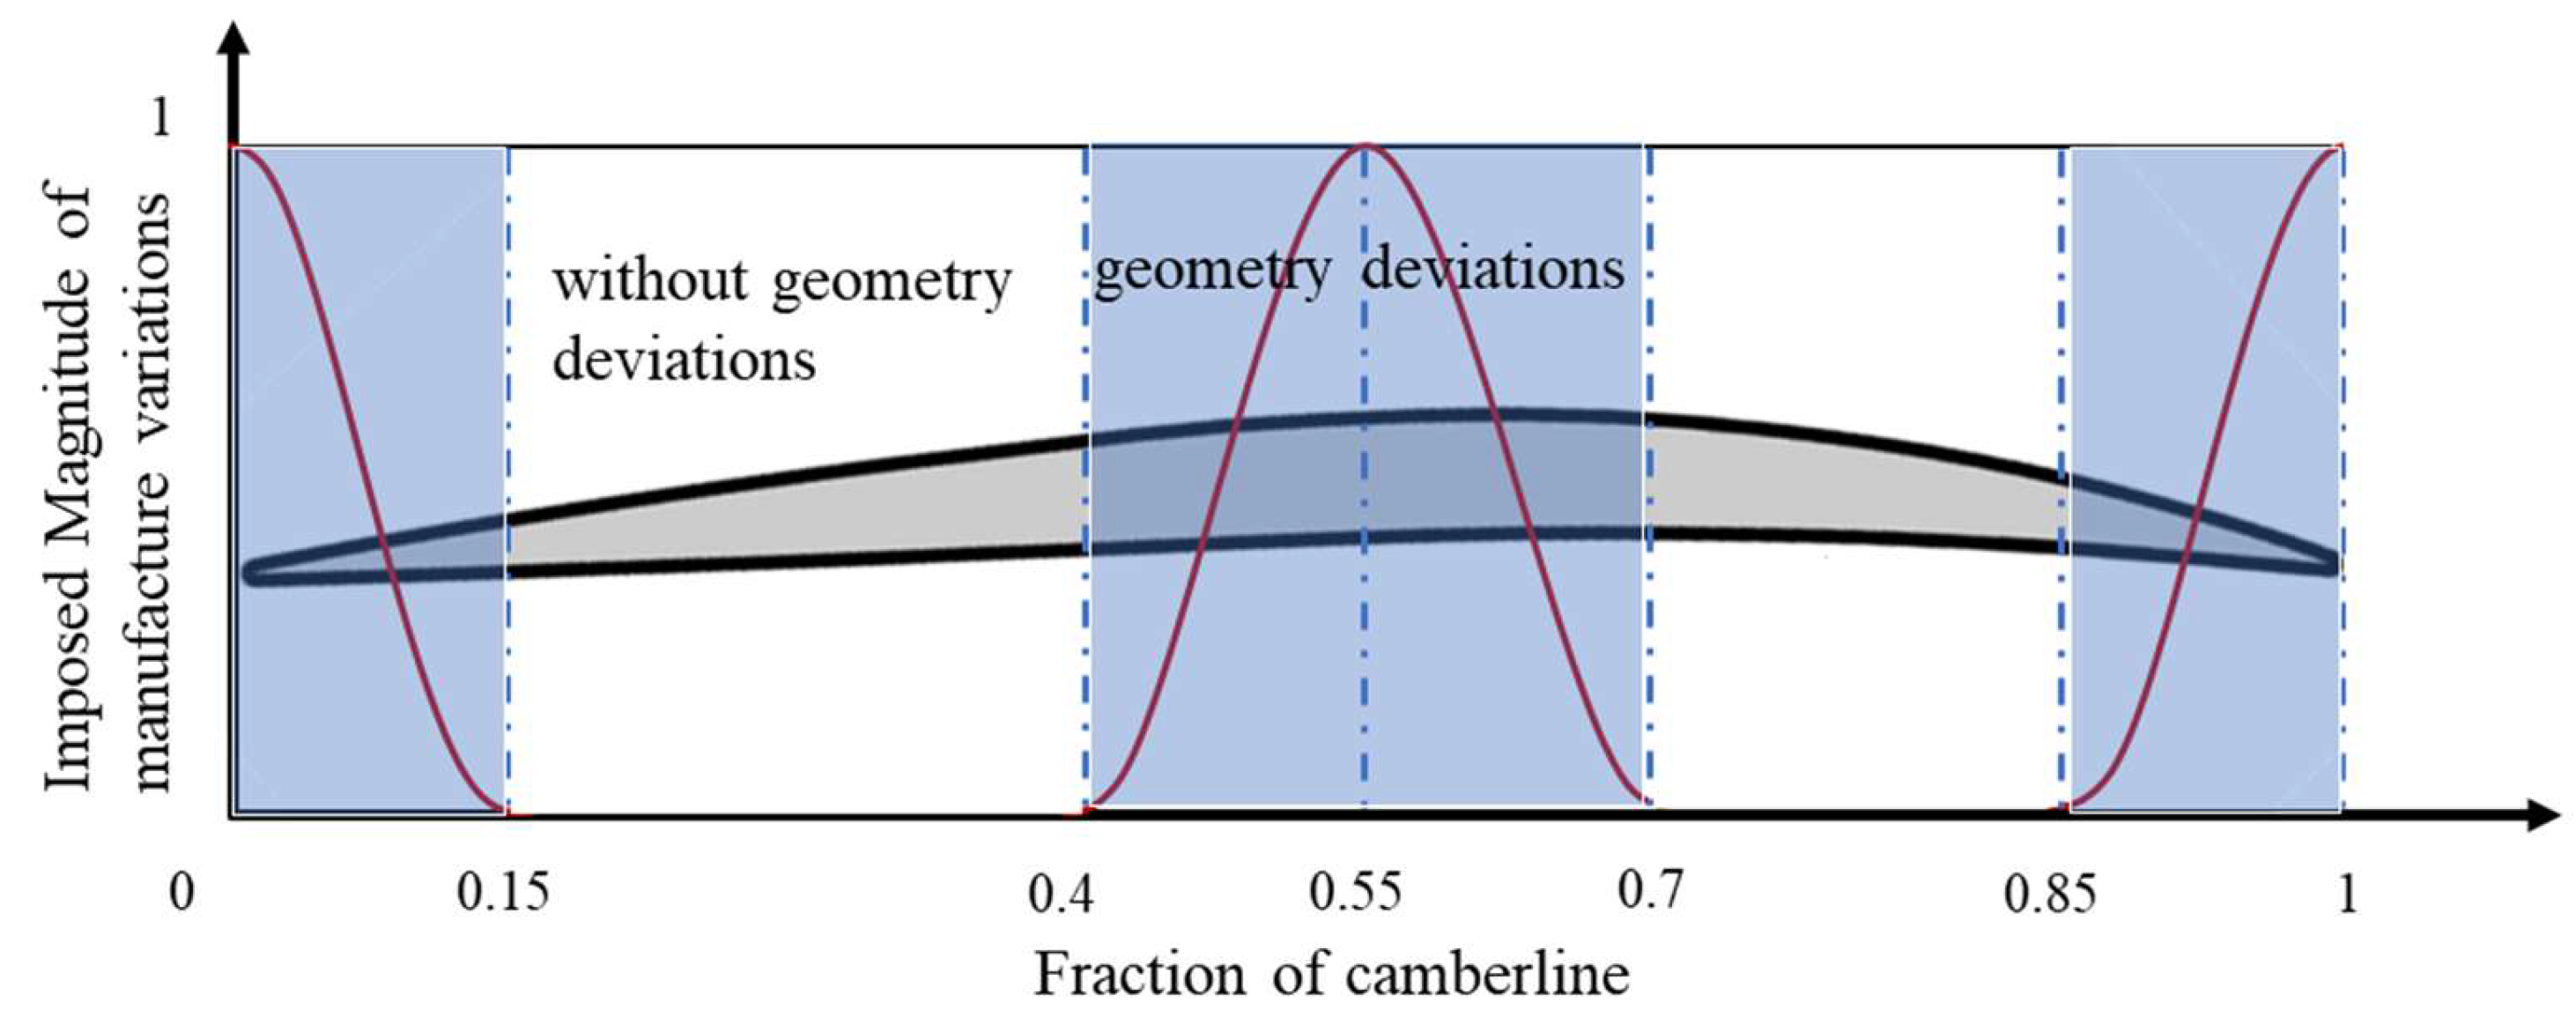
The investigation selected the profile at the 50% span of NASA Rotor 37. Geometric variations were applied to three distinct sections of the camber line: the initial 15%, the central 30%, and the final 15%, as shown in Figure 2. The rationale for this selection is threefold. Firstly, the foremost 15% of the camber line, which includes the LE, encompasses critical regions that are likely pivotal in influencing flow mechanisms. Notably, this area is often where the majority of loss increases due to manufacturing variability are concentrated. Secondly, the maximum thickness of the blade profile, located within the middle 30% of the camber line, is crucial for transonic blades as geometric deviations here may disrupt the development of the boundary layer and alter shock structures. Lastly, variations in the final 15% of the camber line are significant as they can affect work efficiency and stability of the flow. The mathematical equations utilized for modeling the distorted profile are as follows:
where the coordinates (, ) denote the coordinates of the i-th discrete point on the airfoil profile with geometric deviations, while (, ) denote the coordinates of the i-th discrete point on the designed airfoil profile. The term , where , serves as the weighting factor. The variable represents the displacement due to manufacturing variability, and is the angle between the tangent at the point on the airfoil curve and the horizontal direction.
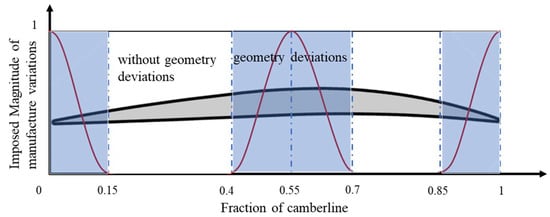
Figure 2.
Two-dimensional blade modeling weight function.
To ensure smooth surface continuity of the blade geometry with deviation features, this study employs a standard sinusoidal function as the weight function. This approach mitigates the impact of geometric variations outside the zones where deviations were introduced. The deviation weight functions for the LE, maximum thickness, and trailing edge (TE) regions were set within the ranges (, ), (), and (), respectively. These ranges facilitate a transition of deviation weights from 1 to 0 for the LE region, from 0 to 1 and back to 0 for the maximum thickness region, and from 1 to 0 for the TE region, as depicted in Figure 1. The uncertainty parameters’ variation range and distribution for each region are detailed in Table 2, based on findings from previous studies [26,27,28].

Table 2.
Geometrical uncertainties to be propagated for the R37.
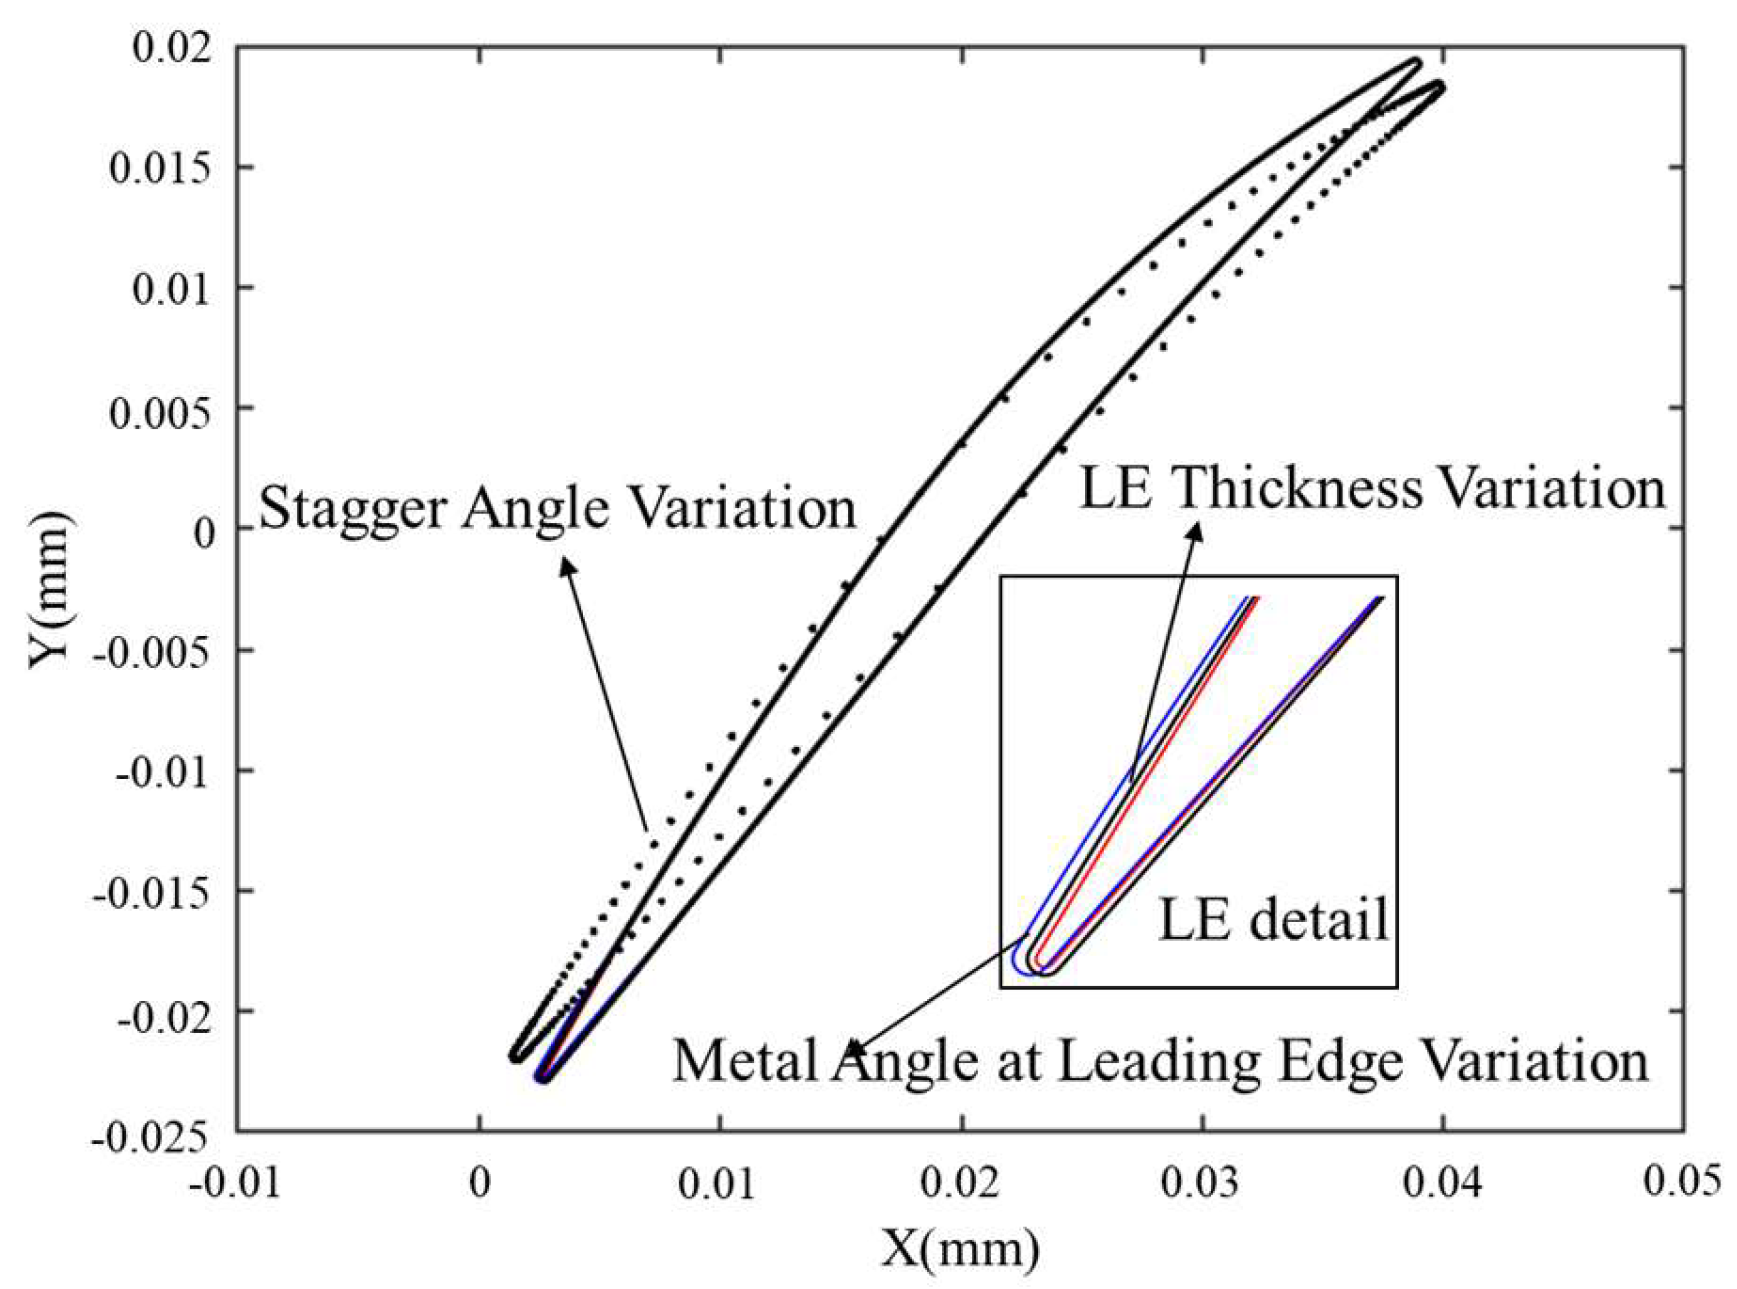
Figure 3 illustrates the deviation at the 50% blade height section, where the red lines indicate negative leading-edge radius deviations, the blue lines indicate metal angle at LE deviations, the black dashed lines indicate stagger angle deviations, and the black solid line represents the original blade profile.
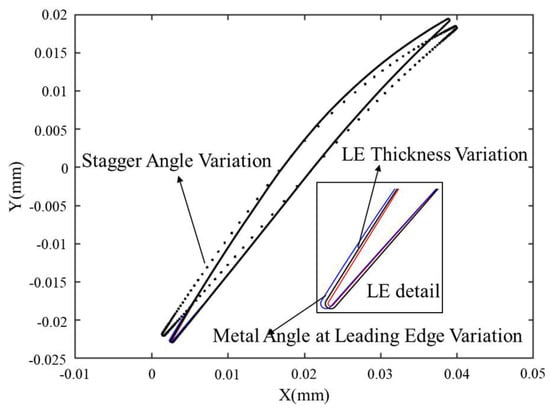
Figure 3.
50% span height section of Rotor 37 with geometric deviation.
2.3. MCS
MCS is acknowledged as a foundational and direct approach for investigating variations related to uncertainty. It employs stochastic processes to approximate complex outcomes by exploring a problem space, and it depends on the law of large numbers to ensure that the approximation converges to the actual value as the sample size increases [29]. In the context of addressing performance uncertainties linked to the variability in blade manufacturing, a set of blade samples characterized by geometric deviations (Xi) is randomly generated. Subsequently, the performance responses () of each sample are determined through CFD calculations. The aggregate performance expectation is calculated by determining the mean value (μ) of the , while the variability or uncertainty in performance is assessed by computing the standard deviation (S).
2.4. Sensitivity Analysis of the Aerodynamic Performance
The aerodynamic performance of airfoils is evaluated using a 2D Eulerian model coupled with the MISES boundary layer approach [30]. The MISES code employs the potential equation for calculating the inviscid flow in the mainstream zone, while the Kamen momentum integral equation and the energy integral equation are utilized for modeling the viscous boundary layer zone. The MISES model has been rigorously validated against experimental data from subsonic and transonic compressors and for transonic LE flow. Its validity is established through its predictive capacity for both bypass and separated flow transitions. Goodhand [31] has demonstrated the model’s proficiency in examining subtle variations in the pressurizer’s LE geometry. Additionally, the model incorporates an advanced Abu–Ghannam–Shaw (AGS) formulation [32], which facilitates a detailed examination of boundary layer characteristics.
This study explores the impact of geometric variations on aerodynamic performance by evaluating the total pressure loss at 0° incidence and within the low-loss angle-of-attack range. The low-loss incidence envelope is defined as the range of incidence angles at which the blade profile’s total pressure loss coefficient remains below twice its minimum value [17]. Total pressure loss is calculated as per Equation (4):
where is the total pressure at the inlet, is the total pressure at the outlet, and represents the static pressure at the inlet. The term expresses the difference between the mass-flow-averaged total pressures at the inlet and outlet of the computational domain.
Standardized regression coefficients are used to measure the impact of blade profile uncertainty parameters on total pressure loss and the low-loss incidence range. These coefficients, by eliminating the influence of measurement units associated with uncertainty parameters, provide a direct quantification of each input variable’s relative significance on the examined performance metrics. The methodological steps for calculating these standardized regression coefficients are outlined as follows:
Step1: Standardize each variable.
where and represent the standardized values of the independent variable and the dependent variable , respectively. Here, and denote the means of and , while and indicate their respective standard deviations
Step2: Construct a regression model.
where is the intercept term, represents the standardized regression coefficient, and denotes the error term.
Step3: Solve the regression equation through Ordinary Least Squares (OLS), and acquire each standardized coefficient.
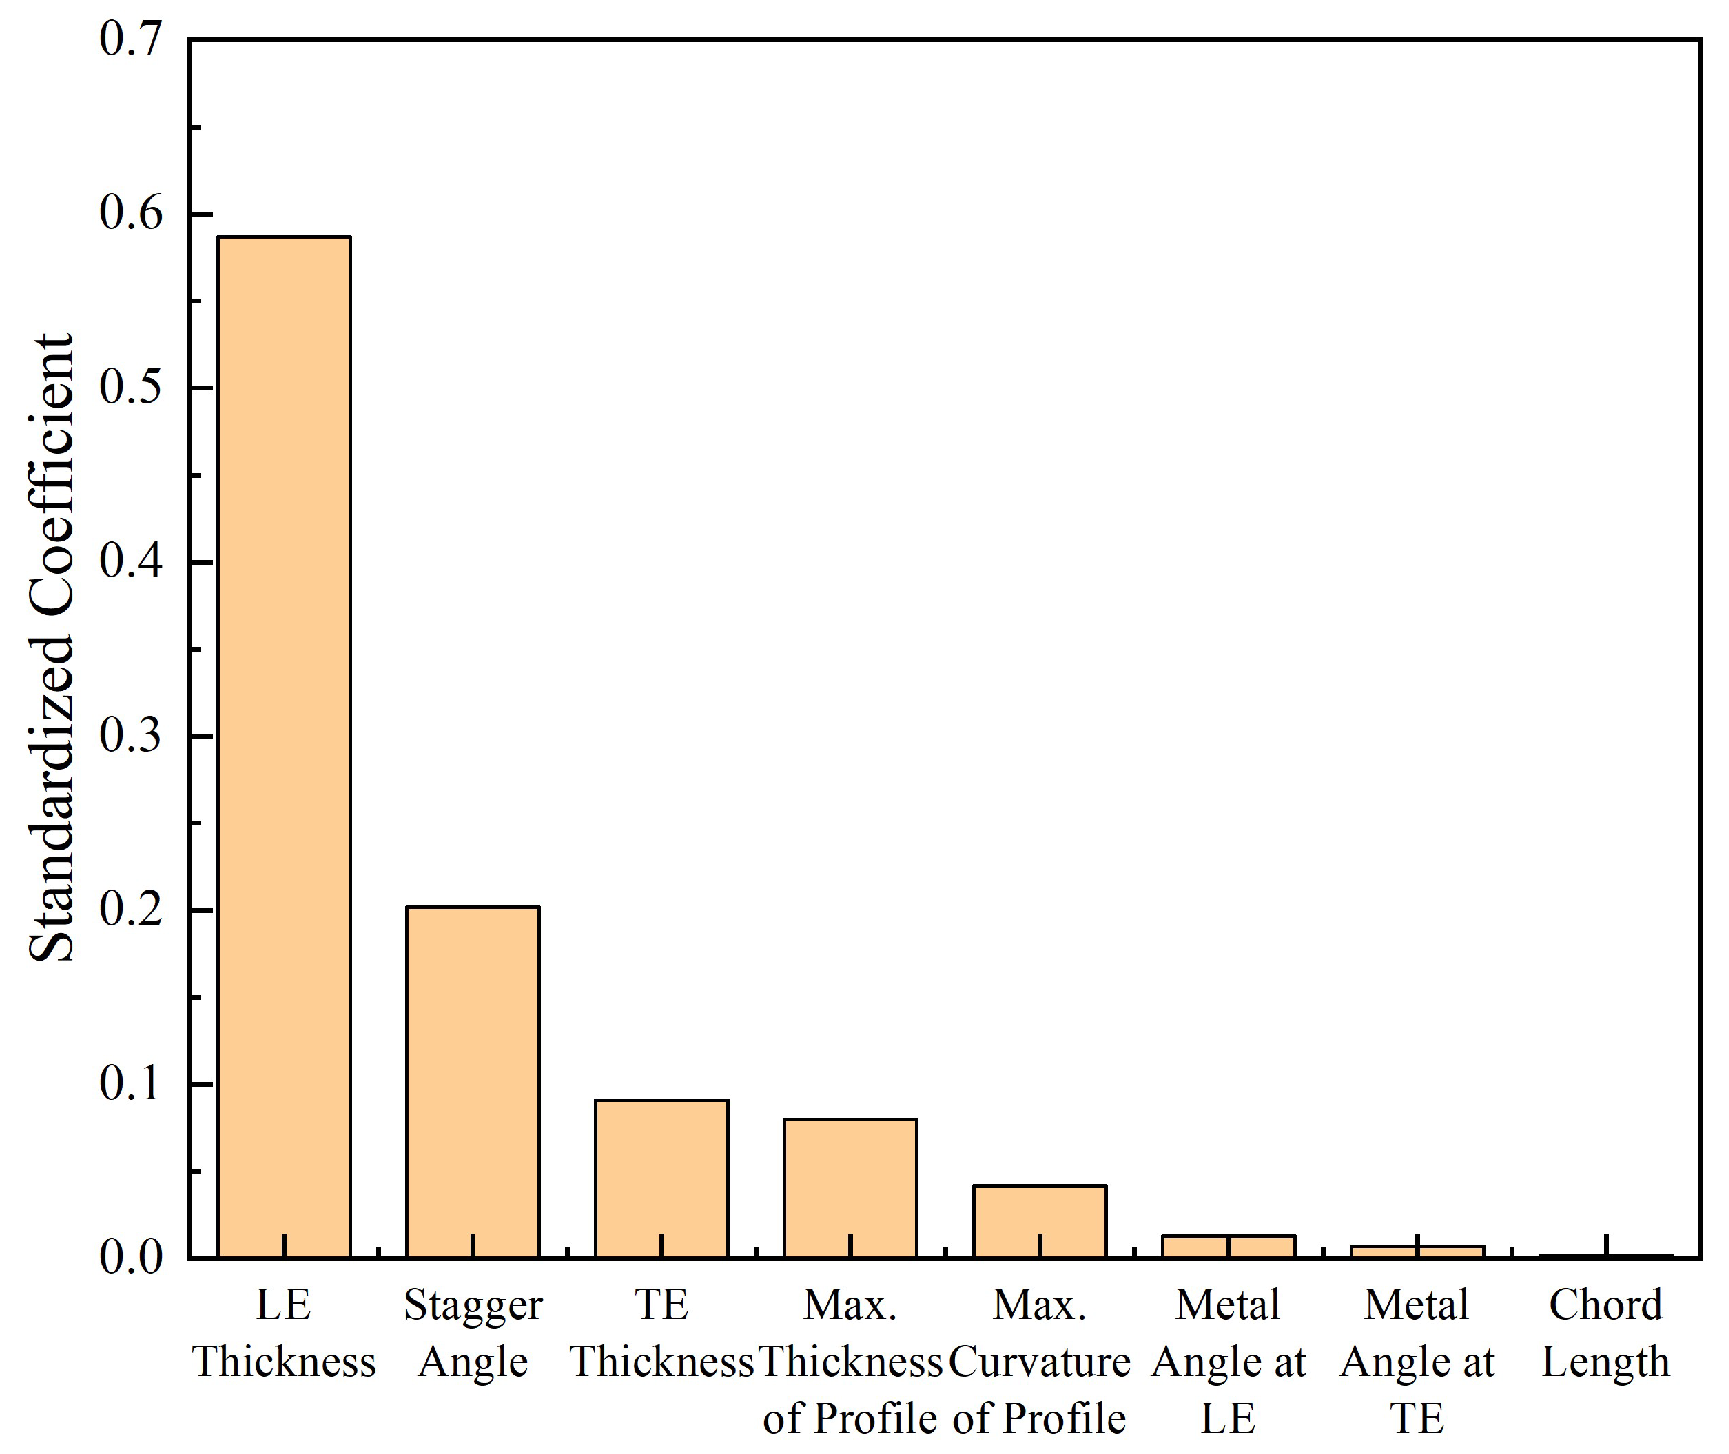
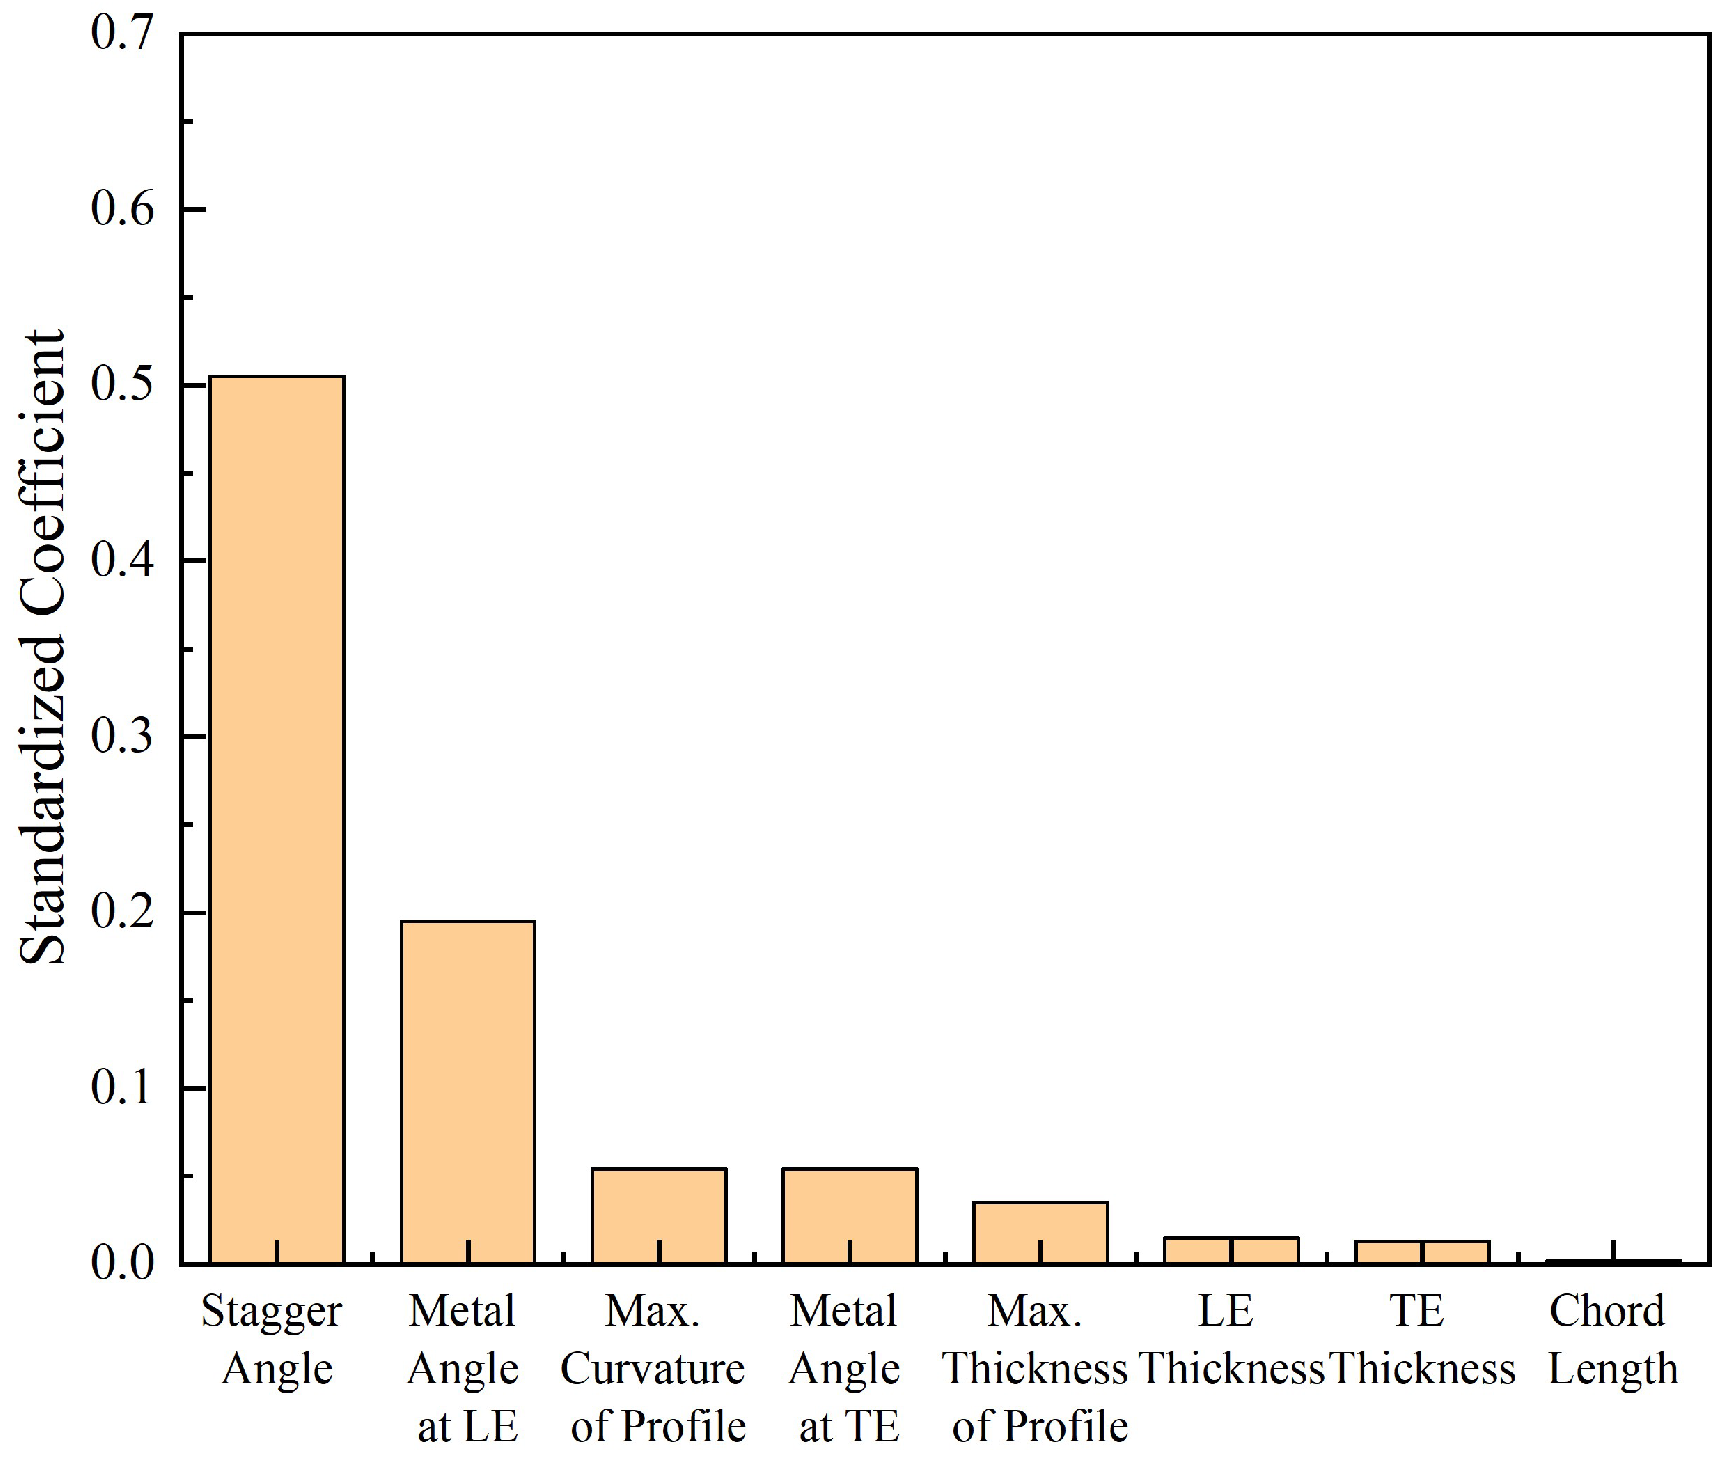
This analysis was conducted on 1000 turbine blades, which exhibited manufacturing-induced variations, to ascertain the design parameters that significantly affect both the total pressure loss at 0° incidence (Figure 4) and the low-loss incidence range (Figure 5).
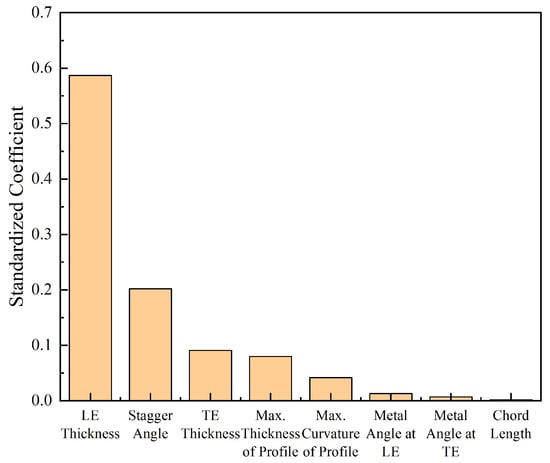
Figure 4.
The impact of geometric variation on total pressure loss at 0° incidence.
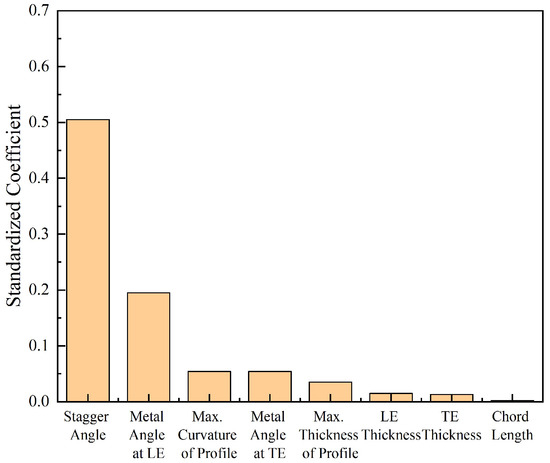
Figure 5.
The impact of geometric variation on low-loss incidence ranges.
Sensitivity analyses reveal that variations in LE thickness and stagger angle significantly influence 2D blade aerodynamic performance. More precisely, variability in LE thickness contributes to 58% of the total pressure loss, while deviations in stagger angle account for an additional 20%. Notably, 50% of the variation in the low-loss incidence range is attributable to stagger angle deviation, with the metal angle at the LE contributing 30% as another influential factor. In an effort to consider the variation in Mach number of the inlet flow at different blade spans, this study employs a consistent methodology to assess the impact of geometric deviations on the performance of the blade profile at 90% span. The findings indicate that changes in blade aerodynamic performance attributed to geometric deviations are more pronounced at higher Mach numbers. Nevertheless, the trends in aerodynamic performance variation, associated with different geometric deviations, coincide with those observed at the 50% span. Consequently, LE thickness, stagger angle, and the metal angle at the LE are identified as critical geometric uncertainty variables for modeling 3D blades with manufacturing variability.
2.5. Modeling 3D Blades with Manufacturing Variability
Modeling 3D blades with manufacturing variability necessitates the superimposition of sections with geometric discrepancies. Practical observations suggest that the distribution of manufacturing variability across the blade surface is non-uniform. Previous research has indicated that manufacturing precision is at its minimum in the upper region near the TE of the high-pressure compressor blade, with more pronounced deviations observed in the LE region at 50% span, as well as in both the LE and TE regions adjacent to the hub. Moreover, certain blades exhibit notable deviations near the hub area [33,34]. Consequently, this study introduces geometric discrepancies at the 10%, 50%, and 90% spans of Rotor 37. A 3 × 3 random number matrix is utilized to depict the deviation factor applied to each span, with the discrepancy at the 50% span illustrated in Figure 3.
3. Modeling and Validation
3.1. Modeling of NIPC
Given the substantial computational demands of MCS, particularly in cases of high complexity, the NIPC algorithm provides an efficient alternative. The NIPC methodology employs series expansions of random variables using orthogonal polynomials. These polynomials’ coefficients encapsulate the crucial stochastic characteristics of the variables. Instead of intervening during the solution process, this approach constructs a surrogate model that relates inputs and outputs after deterministic results have been obtained at sampled points. This response surface facilitates the efficient derivation of the statistical properties of the output variables [5,6].
The first step in this process involves the construction of the NIPC model. Let Y represent the response of an n-dimensional independent random variable. Following Wiener’s approach to constructing the NIPC model using orthogonal polynomials [35], can be expressed as:
where are the coefficients determined using existing data; denotes an orthogonal polynomial of degree i; represents a random variable with a known probability distribution; and Q designates the number of truncation terms.
The stochastic response surface method (SRSM) offers a robust approach for propagating uncertainty by representing the system output as a polynomial expansion of standard random variables. The quality of the sampling points critically influences the fidelity of the surrogate model, thus impacting the reliability of the UQ in the SRSM. In this study, we employ monomial cubature rules (MCR) to generate regression samples. A multivariate integral can be approximated by a weighted sum of the function’s responses at a set of discrete nodes using a minimal number of nodes, which results in an integration rule with high algebraic accuracy. These samples are then utilized to estimate the coefficients in the NIPC expansion, thereby enhancing the accuracy of the uncertainty propagation analysis. The number of samples required for estimating the n-dimensional p-order NIPC model using MCR sampling is detailed as follows:
Once the samples are collected, the sample vector and its corresponding function response values act as the input and output parameters of the NIPC model, respectively. The coefficients are then derived through the least squares approximation method [36].
where A is the matrix composed of the sample points.
3.2. NIPC Model Verification
This study utilizes the 2D Rosenbrock and ten-dimensional Rastrigin functions to assess the NIPC method and confirm its effectiveness in managing problems across various dimensions. The mathematical representations of these functions are outlined in Table 3. Given that the variability in blade manufacturing follows a normal distribution, the input parameters for these evaluations are exclusively modeled using bounded normal distributions.

Table 3.
Test Functions.
Table 4 and Table 5 present a comparative analysis of the NIPC method versus the direct MCS method across the two test functions. The findings indicate that, at p= 4, the mean and standard deviation estimations from both methods closely align. This alignment substantiates the accuracy of the NIPC method in predicting output responses for the test functions, thereby corroborating its reliability.

Table 4.
Test results of the NIPC method for Rosenbrock function.

Table 5.
Test results of the NIPC method for Rastrigin function.
3.3. Numerical Method Verification
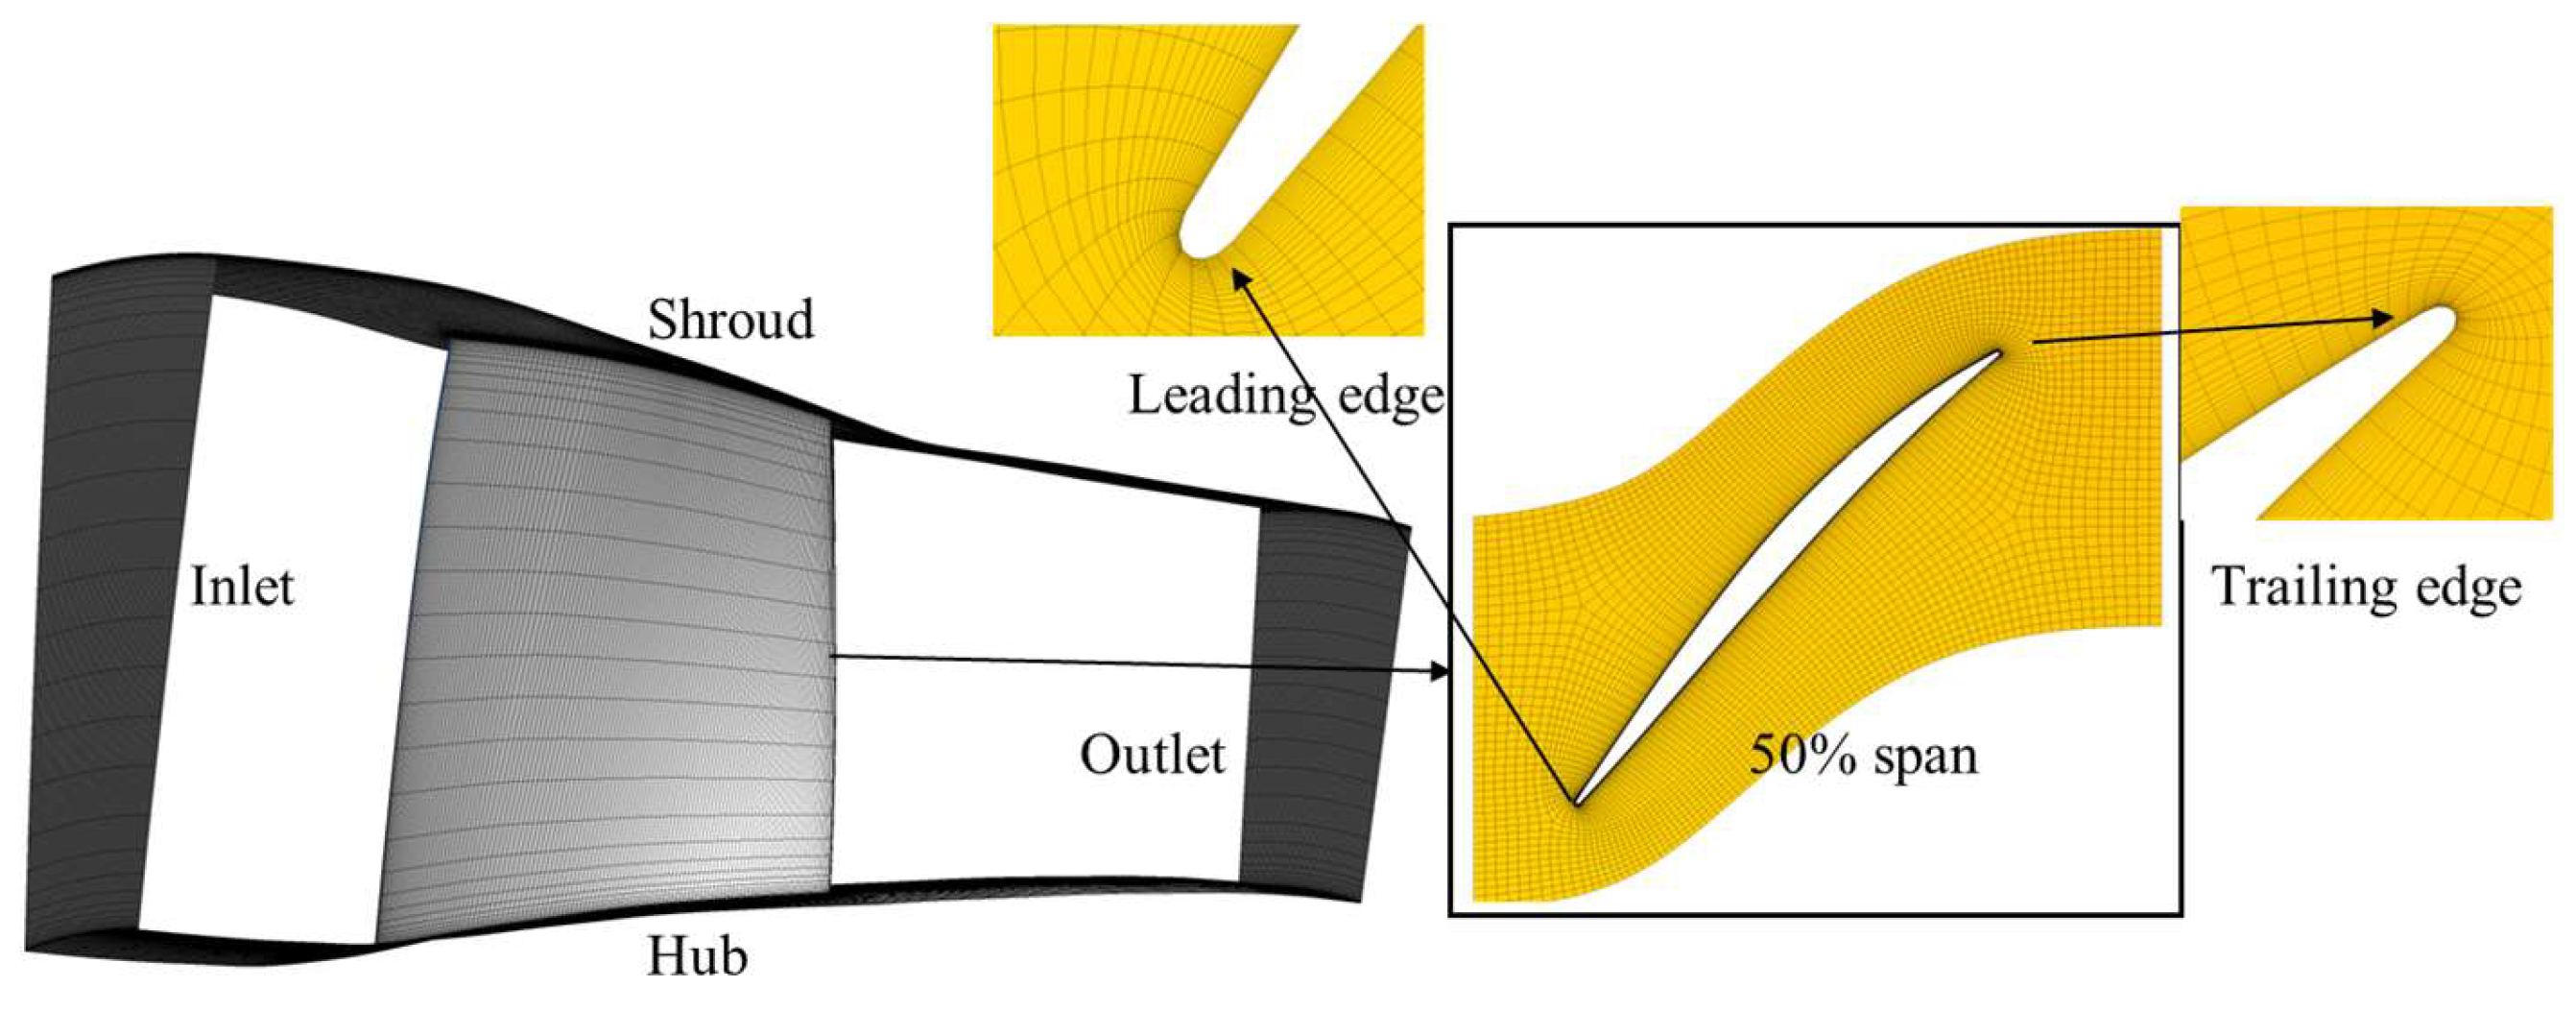
The computational domain’s mesh for this study was generated using the NUMECA/AutoGrid5 module. The primary flow channel employs an “O-4H” mesh topology, while a butterfly-shaped mesh topology is utilized in the blade tip clearance region. To ensure a value below 2, the near-wall meshes were refined, with the first layer having a thickness of m. A detailed representation of the rotor’s computational domain, including a magnified view of the local mesh, is presented in Figure 6.
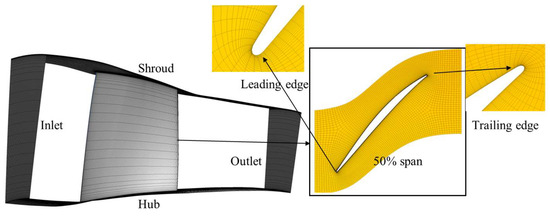
Figure 6.
Mesh configuration of the computational domain for rotor 37.
The computational procedures utilize the NUMECA Fine/Turbo solver, incorporating the Spalart–Allmaras turbulence model, a second-order upwind differential formulation, and a multi-grid method to accelerate convergence. The inlet boundary conditions specify the total temperature and total pressure, set at 288.15 K and 101,325 Pa, respectively. The outlet boundary condition is set with a mean backpressure. Solid wall surfaces are modeled with adiabatic, no-slip boundary conditions. Temporal discretization is handled using the fourth-order Runge–Kutta method. The same grid topology, quantity, and boundary settings across all blades, regardless of geometric deviations.
The mesh independence study conducted by Sun et al. [16] elucidates the significant influence of grid density on computational outcomes. The grid independence criterion is met when the number of grid cells in the single-channel mesh of rotor 37 surpasses . This study selects three sets of grids for grid independence verification. Numerical simulations are conducted for each set to assess. To determine the isentropic efficiency and total pressure ratio at peak efficiency conditions. Using Group 3 as the reference, results from the other groups are normalized, with the computational findings presented in Table 6. It is observed that the performance parameters under both conditions progressively converge with increasing grid points. The deviations in isentropic efficiency and total pressure ratio between Group 2 and Group 3 are 0.02% and 0.05%, respectively, indicating that the grid density in Group 2 sufficiently captures the performance parameters of the studied object.

Table 6.
Grid independency verification results.
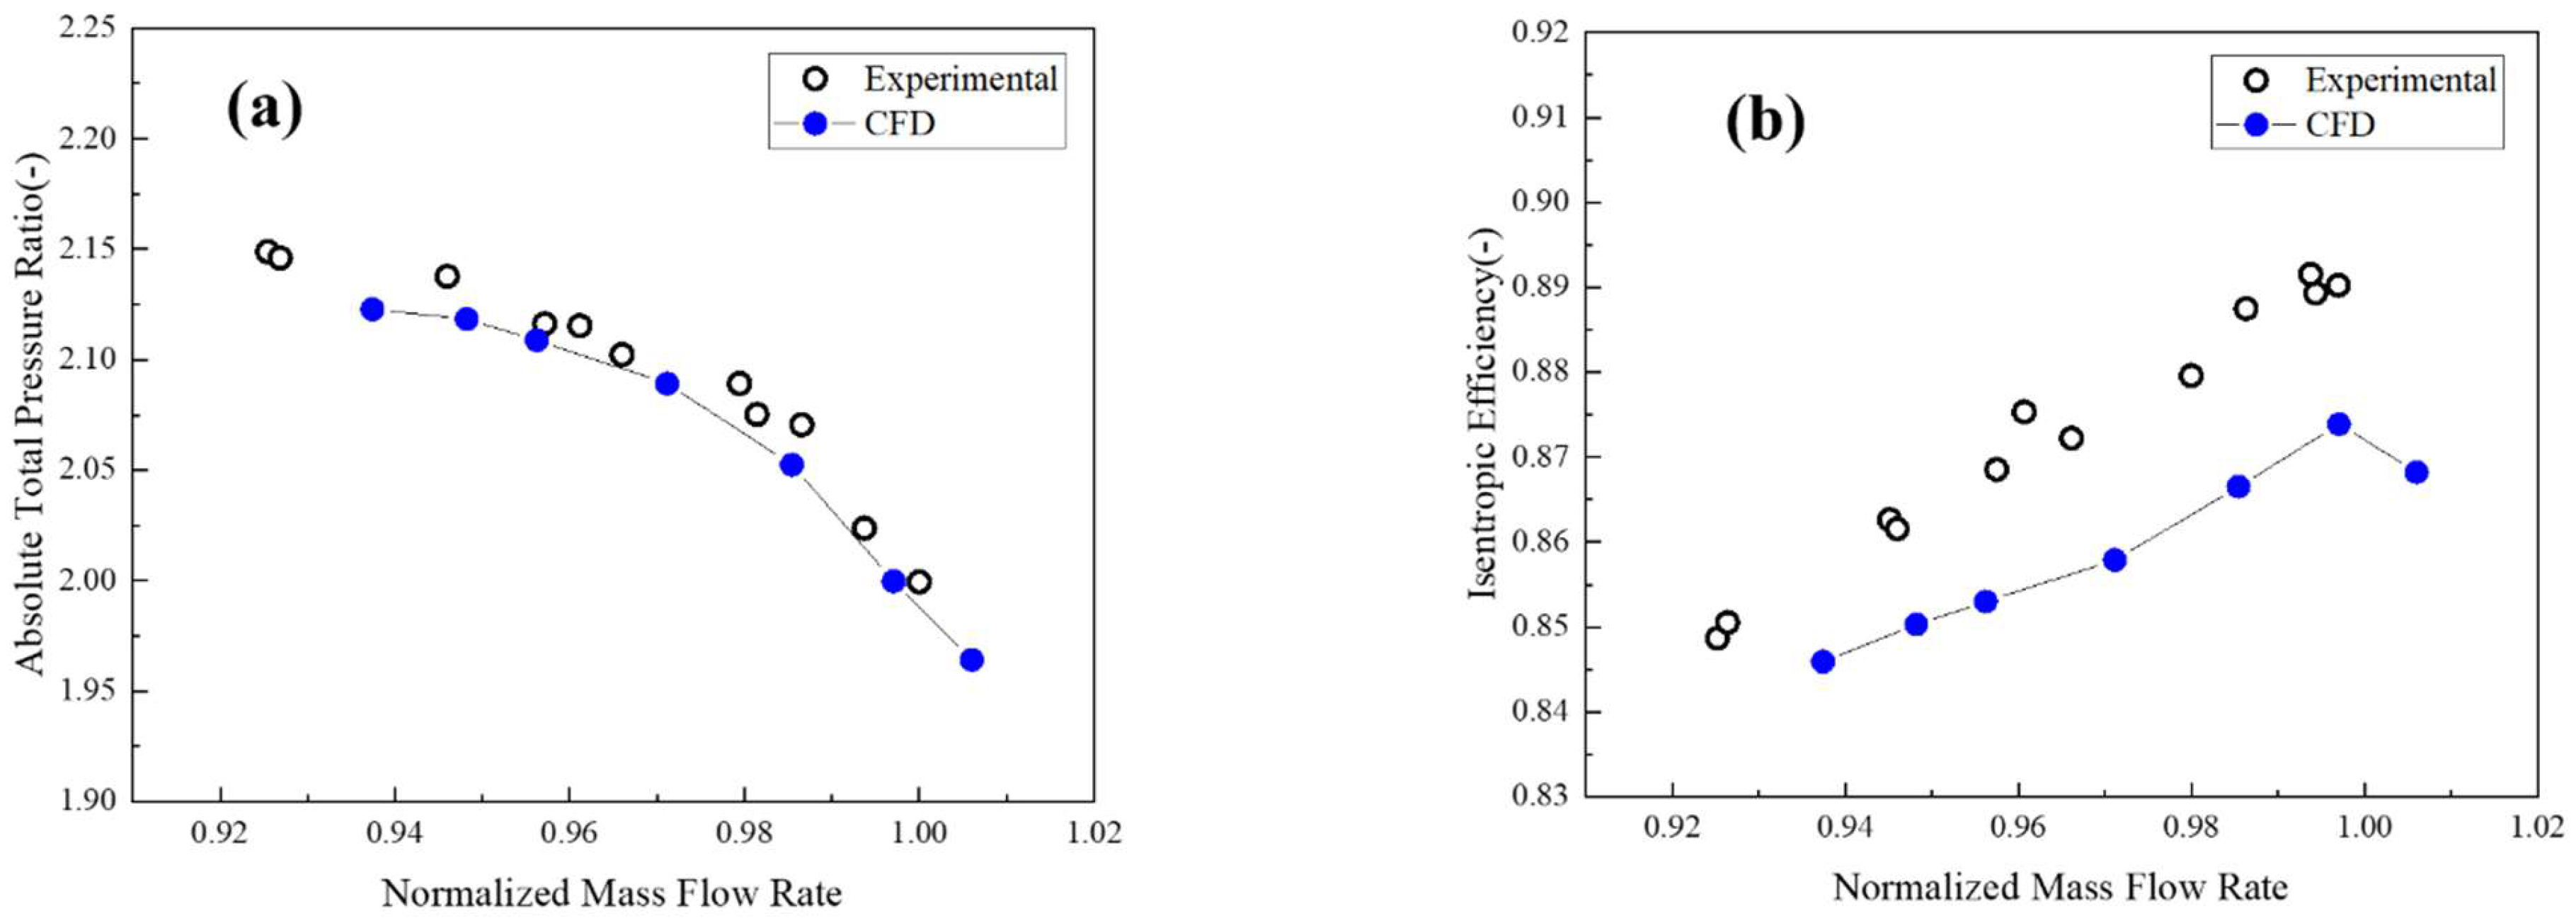
To corroborate the numerical method utilized in this study, Figure 7 presents a compressor map derived from CFD simulations alongside corresponding experimental data [25]. The comparison reveals that the CFD-estimated choking mass flow and total pressure ratio closely align with the experimental results, exhibiting a minimal relative deviation of 0.2% for the choking mass flow. Furthermore, the relative error in the total pressure ratio does not exceed 0.42%. However, the numerically determined isentropic efficiency is marginally lower, particularly under conditions of high flow, where the maximum discrepancy is approximately 2.2% below the experimental values. This variation could stem from the methodological differences in measurement locations; experimental measurements were taken at 95% of the blade span, whereas the numerical simulation accounted for losses across the entire span, potentially leading to an underestimation of losses. Despite these discrepancies, the close correspondence in performance parameters and their trends compared to experimental values suggests that the numerical method used is sufficiently reliable for exploring the impact of blade geometric deviations on compressor characteristics within the context of this study.
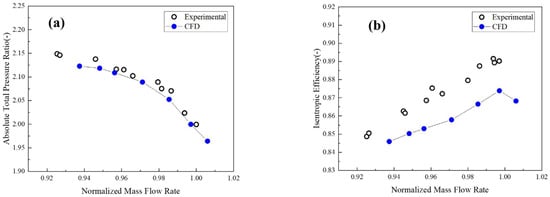
Figure 7.
Comparison of CFD and experiment compressor maps: (a) Pressure ratio as a function of mass flow and (b) Efficiency as a function of mass flow.
4. Results and Discussion
4.1. Impact of Tip Clearance Deviation on Compressor Performance
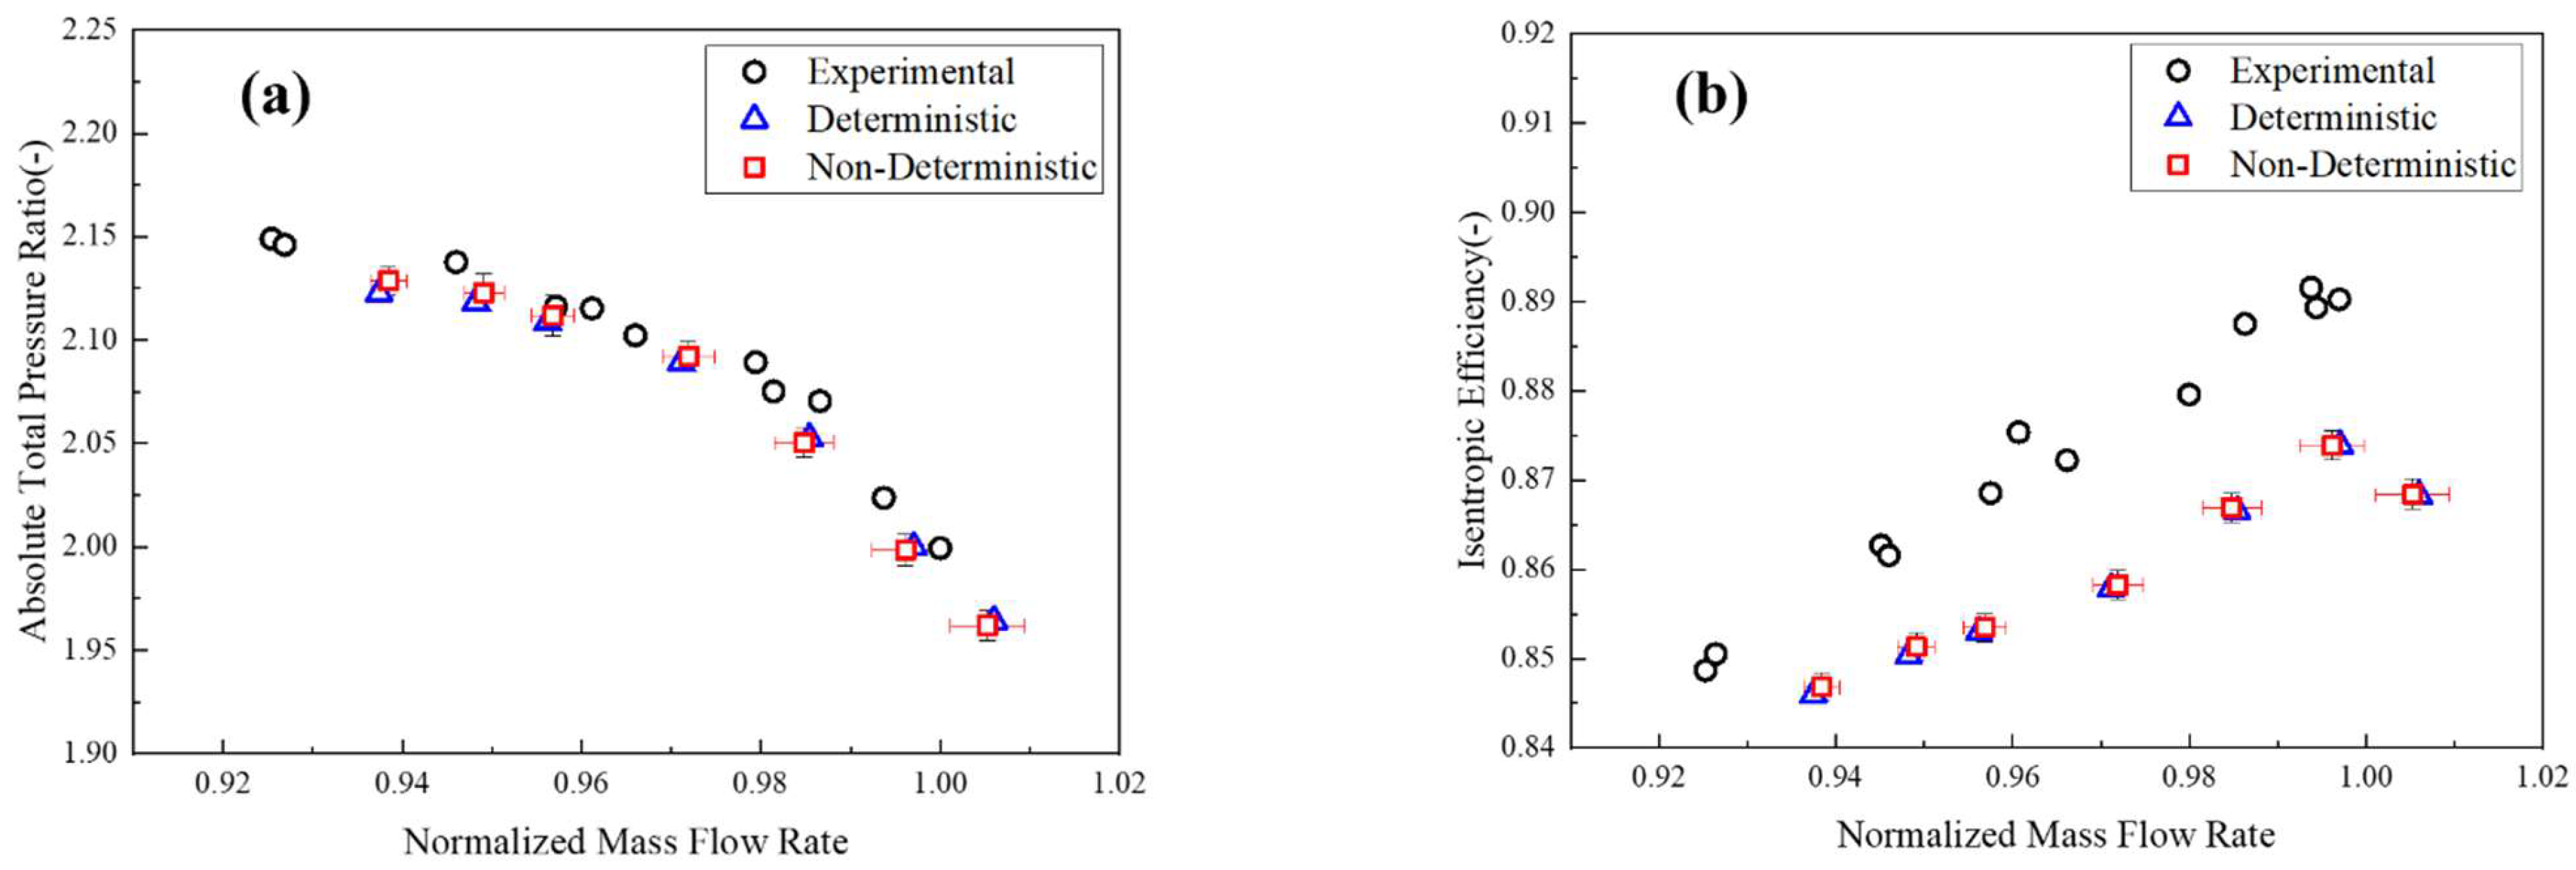
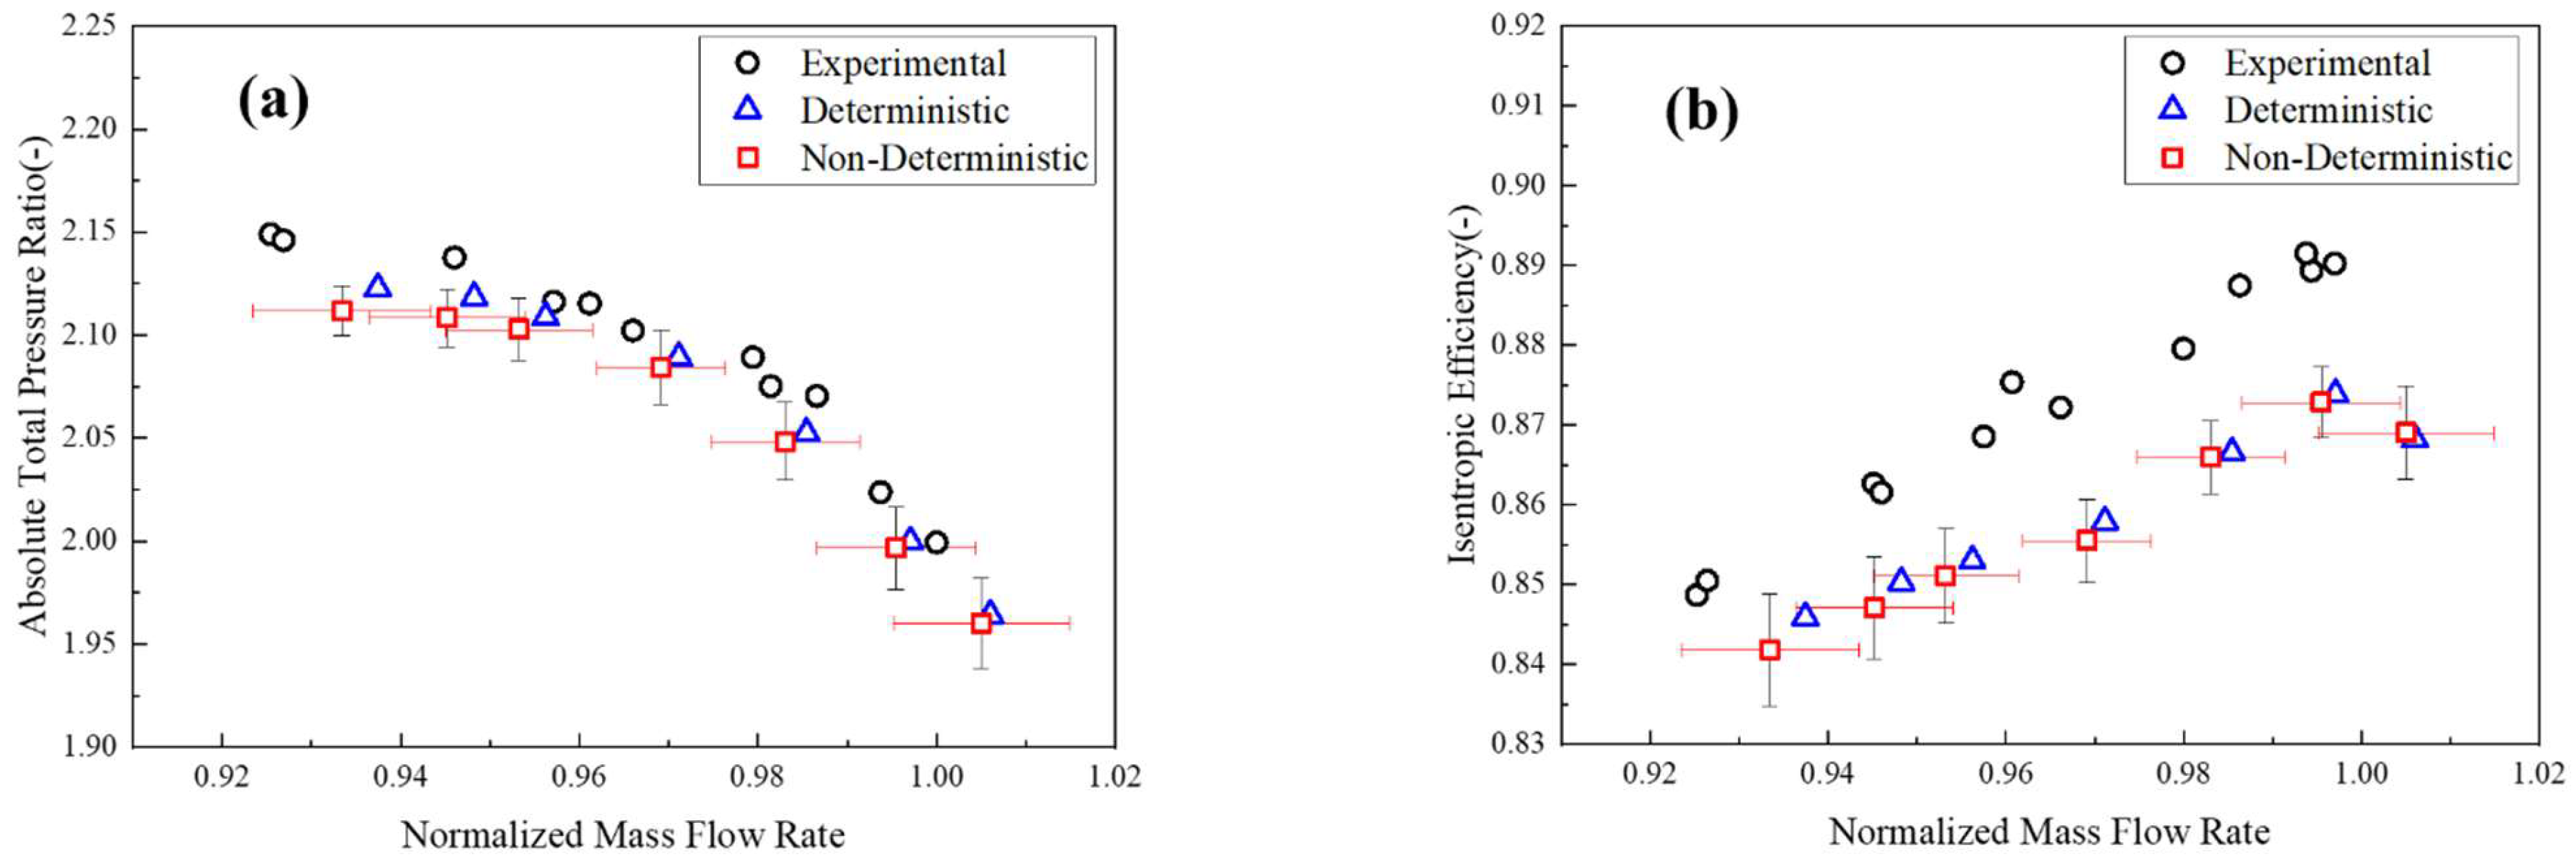
The specified design value for tip clearance is 0.356 mm (Mtip). In this study, the variation in tip clearance adheres to a truncated normal distribution, with bounds set between 50% and 150% of Mtip. The tip clearances near the LEs and TEs are considered as independent variables, each mirroring a truncated normal distribution with a mean of 0.356 mm and a standard deviation of 0.0563 mm, constrained within the aforementioned limits. A 2D, fourth-order NIPC model is employed to address this variability in distribution. The statistical outcomes derived from the NIPC model are depicted in Figure 8. Here, “Deterministic” refers to the characteristic curves of Rotor 37 obtained via CFD simulation, whereas “Non-Deterministic” delineates a range of confidence within which solutions can be expected given the uncertainty in the variations.
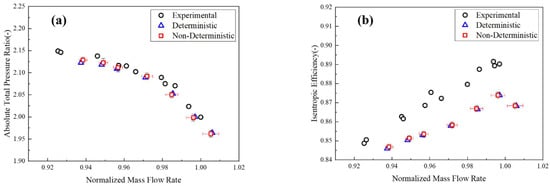
Figure 8.
Comparison of deterministic and non-deterministic compressor maps: (a) Pressure ratio as a function of mass flow and (b) Efficiency as a function of mass flow.
The comparative experimental data are sourced from studies by Reid, L. and Moore, R. D. [25]. An examination of the figure indicates that when the manufacturing variability of the rotor tip clearance follows a normal distribution, the mean values of the rotor mass flow rate, total pressure ratio, and isentropic efficiency closely resemble those observed in the rotor without tip clearance deviation. This suggests that the impact of tip clearance fluctuation on the overall rotor performance is minimal. However, as the operating point nears the choking mass flow rate, the fluctuation amplitudes for the rotor’s mass flow rate, total pressure ratio, and isentropic efficiency generally increase. The analysis of the standard deviation-to-mean ratio (σ/μ) for the rotor’s aerodynamic performance at the choking mass flow rate yields values of 0.4%, 0.38%, and 0.19% for mass flow rate, total pressure ratio, and isentropic efficiency, respectively. These figures further substantiate the low sensitivity of the rotor’s aerodynamic performance to deviations in tip clearance.
4.2. Impact of Blade Surface Deviation on Compressor Performance
A 9-dimensional third-order NIPC model was developed to investigate the impact of blade surface deviations on the aerodynamic performance of a compressor. This model utilized a dataset comprising 220 samples to determine the coefficients of the NIPC model, setting the tip clearance at a specified value of 0.356 mm. Figure 9 illustrates the compressor map generated using both deterministic approaches and uncertainty models, in comparison with experimental data. When the geometric deviations of the blade profiles are assumed to follow a normal distribution with a mean of zero, the average aerodynamic performance of the compressor deviates from the intended design values. More specifically, the deviations in the mass flow rate, total pressure ratio, and isentropic efficiency of the rotor are most significant near-stall mass flow, exhibiting deviations of 0.43%, 0.52%, and 0.49%, respectively. As the rotor transitions from near-stall conditions to the choking point, the deviations in these parameters decrease to 0.1%, 0.21%, and 0.07%, respectively, at the choking point. The pattern of deviation in the standard deviations of these parameters is noteworthy. The standard deviation of mass flow rate diminishes and then increases as the mass flow rate escalates, reaching its minimum near peak efficiency. Conversely, the standard deviation of the total pressure ratio consistently increases with increasing mass flow rate, while that of isentropic efficiency generally decreases, except at the choking point. Due to variations in the dimensions of mass flow rate, total pressure ratio, and isentropic efficiency, it is not feasible to objectively assess the sensitivity of these parameters to tip clearance solely by their absolute standard deviations. Therefore, the coefficient of variation, σ/μ, has been introduced as a criterion for this assessment. Across the entire range of mass flow, the maximal σ/μ values for mass flow rate, total pressure ratio, and isentropic efficiency are 1.12%, 1.07%, and 0.83%, respectively. This analysis reveals that surface deviations due to tip clearance uncertainty lead to more pronounced average performance variations, and the performance fluctuations of Rotor 37 are also more significant.
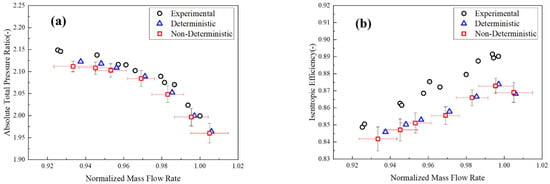
Figure 9.
Comparison of deterministic and non-deterministic performance curves: (a) Pressure ratio as a function of mass flow and (b) Efficiency as a function of mass flow.
4.3. Impact of Span Height Distribution and Manufacturing Variability on Rotor Performance
The relative Mach number increases progressively along the radial direction of the rotor. The degree to which aerodynamic performance is compromised by geometric deviations at various spanwise locations may vary. This section seeks to assess the impact of such deviations on the aerodynamic performance of the rotor. Geometric deviations were introduced at the 10%, 50%, and 90% spans using uniform deviation factors. The performance of the transonic rotor, under the influence of these geometric deviations, was evaluated during near-stall and choking mass flow conditions using a 3D fourth-order NIPC model. Additionally, a statistical analysis was conducted to ascertain the effects of geometric deviations at different radial positions on the performance of the transonic rotor.
Figure 10 illustrates the impact of geometric deviations at the 10%, 50%, and 90% spans on rotor performance under near-stall conditions. The mean performance offsets, determined through the NIPC method, are depicted on the left, while the corresponding standard deviations are shown on the right. As indicated by Figure 10a, geometric deviations at various spans consistently induce variations in the rotor’s mass flow rate. Notably, the deviation at the 50% span results in the most significant change, decreasing the average mass flow rate by 0.97% compared to the baseline mass flow rate of the rotor without geometric deviations. Based on the standard deviations, the deviation at the 90% span causes the largest fluctuations in mass flow rate. Figure 10b presents the statistical results for the total pressure ratio. The mean total pressure ratio at the 90% span, when affected by geometric deviations, shows the greatest reduction, being 0.47% lower than that of the undeviated rotor. The standard deviation of the total pressure ratio suggests that fluctuations in aerodynamic performance due to geometric deviations at the 50% span are comparable to those at the 90% span. Conversely, the influence of geometric deviations at the 10% span on the pressure ratio is the least significant. Figure 10c offers a statistical analysis of isentropic efficiency, revealing that the rotor with deviations at the 90% span displays the most marked variation in the mean isentropic efficiency, showing a decrement of 0.29% relative to the rotor without geometric deviations. Moreover, fluctuations in isentropic efficiency are also most pronounced at this spanwise location.

Figure 10.
Performance variations caused by surface deviations at various span heights under near-stall mass flow conditions: (a) mass flow rate, (b) pressure ratio, (c) isentropic efficiency.
Figure 11 elucidates the impact of geometric deviations across differing spans on the aerodynamic performance of the rotor when operating under choking conditions. In comparison to the near-stall conditions, the variations in average aerodynamic performance are less marked. Furthermore, the pattern of influence due to manufacturing variations mirrors those observed under near-stall mass flow conditions. Nonetheless, the presence of geometric deviations at the 50% and 90% span locations results in more pronounced fluctuations in the total pressure ratio during choking mass flow conditions.

Figure 11.
Performance variations caused by surface deviations at various span heights under chocking mass flow conditions: (a) mass flow rate, (b) pressure ratio, (c) isentropic efficiency.
4.4. Impact of Span Height Distribution of Single-Factor Deviation on Rotor Performance
In this section, we introduce a deviation feature at the 50% and 90% span heights to evaluate the impact of constrained geometric deviations on the aerodynamic performance of a compressor, particularly near-stall and choking mass flow conditions. The objective of this study is to assess how variations in a single deviation feature at different spanwise locations influence aerodynamic performance.
The analysis, illustrated in Figure 12, quantifies the effects of individual geometric deviations on the mass flow rate, total pressure ratio, and isentropic efficiency of the rotor near-stall mass flow condition. On the x-axis, an array of deviation features of the blade is plotted. denotes thickness variation at the LE; indicates metal angle variation at the LE; and represents stagger angle variation. The y-axis shows the changes in blade performance, normalized to negate the influence of magnitude variations. The data presented in the figure reveal that the rotor pressure ratio and isentropic efficiency are predominantly impacted by variations in LE thickness. Positive thickness deviations lead to a deterioration in both the pressure ratio and isentropic efficiency to varying degrees. Notably, the negative impact of thickness variations at the 90% span on transonic rotor performance is more pronounced, resulting in a reduction in the total pressure ratio by 0.019% and a decrease in isentropic efficiency by 0.058%. Conversely, a negative LE thickness deviation enhances performance. Variations in the metal angle at the LE and stagger angle deviations primarily affect the mass flow. Both types of geometric deviations exert similar effects on the mass flow, with positive deviations increasing blade “opening” and airflow, while negative deviations have the opposite effect. Alongside LE thickness, the impact of stagger angle deviation on isentropic efficiency is also noteworthy. This effect can be attributed to its role in modifying the work output of the blade and altering the flow separation location within the boundary layer.

Figure 12.
Performance variations caused by different deviation features under near-stall mass flow conditions: (a) mass flow rate, (b) pressure ratio, (c) isentropic efficiency.
Figure 13 illustrates the impact of individual geometric deviations on the aerodynamic performance of a rotor under choked mass flow conditions. The data confirm that variations in the stagger angle exert a more significant effect on the mass flow rate than near-stall conditions, exhibiting an inverse relationship with isentropic efficiency. Conversely, the influence of geometric deviations on the pressure ratio remains minimal.

Figure 13.
Performance variations caused by different deviation features under chocking mass flow conditions: (a) mass flow rate, (b) pressure ratio, (c) isentropic efficiency.
5. Conclusions
The aerodynamic performance of transonic compressor rotors has a significant impact on the efficiency and reliability of marine gas turbines. However, geometric deviations in rotor blades resulting from manufacturing will lead to compressor performance diverging from design intent. To investigate the uncertainty in the aerodynamic performance of a compressor rotor caused by geometry deviations, this study chooses the transonic compressor rotor, Rotor 37, as the subject of investigation. Geometry deviations are applied at three different spanwise sections. An integrated approach combining MCS and NIPC is utilized to systematically evaluate the effects of manufacturing variability on the aerodynamic performance of a transonic compressor rotor.
The findings indicate that among the myriad factors of geometric deviation, variations in blade LE thickness, inlet metal angle, and twist angle are the primary contributors to the variability in blade profile aerodynamic performance. Collectively, these factors account for over 80% of the total performance variation. When compared with deviations in tip clearance, those in blade profile exert a substantially more pronounced influence on rotor performance. Moreover, profile deviations are identified not only as the root cause for systematic shifts in the mean values of blade performance parameters but also as the primary source of the significant performance fluctuations observed across various operating conditions. Further analysis reveals that geometric deviations located at the 50% and 90% span height sections are the most critical for overall blade performance degradation. Notably, under near-stall conditions, deviations in LE thickness near the 90% span height exhibit a particularly detrimental effect, significantly impacting both the pressure ratio and isentropic efficiency.
This research specifically focused on the influence of manufacturing variability on a single blade within the rotor. Given that manufacturing variability typically exhibits spatial variation across different blades within a rotor assembly, future work will aim to analyze the aerodynamic performance impact of deviations present on multiple blades, incorporating their spatial distribution characteristics.
Author Contributions
Q.Y. Conceptualization, Establishing model, Writing—Original Draft, Formal analysis.; J.C. Conceptualization, Writing—Review & Editing, Revise. W.S. Writing—Review & Editing, Supervision. R.Z. Conceptualization, Methodology, Supervision. All authors have read and agreed to the published version of the manuscript.
Funding
This research was funded by National Natural Science Foundation of China (Grant No.52176038).
Data Availability Statement
The data that support the findings of this study are available from the corresponding author, Ruijie Zhao, upon reasonable request.
Conflicts of Interest
The authors declare no conflicts of interest.
Nomenclature
This section provides a comprehensive list of all key mathematical symbols, variables, and acronyms used throughout the manuscript, along with their definitions, for easy reference.
| Symbol | Description |
| Mean value of the performance response values | |
| Standard deviation | |
| x-coordinate of the i-th discrete point on airfoil profile with geometric deviations | |
| y-coordinate of the i-th discrete point on airfoil profile with geometric deviations | |
| x-coordinate of the i-th discrete point on designed airfoil profile | |
| y-coordinate of the i-th discrete point on designed airfoil profile | |
| The weighting factor for modeling the distorted airfoils | |
| The angle between the tangent line of the point on the airfoil curve and the horizontal direction. | |
| Stagger angle | |
| Leading edge thickness of airfoils | |
| Trailing edge thickness of airfoils | |
| Chord length of airfoils | |
| Max. thickness of airfoils | |
| Max. curvature of airfoils | |
| Metal angle at leading edge of airfoils | |
| Metal angle at trailing edge of airfoils | |
| Total pressure at the inlet | |
| Total pressure at the outlet | |
| Static pressure at the inlet | |
| Standardized value of independent variable | |
| Standardized value of dependent variable Y | |
| Random variable following a standard normal distribution | |
| Orthogonal polynomial of degree i | |
| Quantity of truncation terms | |
| A | Matrix of the sample |
| G | Corresponding function response values |
| Thickness variation at the LE of airfoils | |
| Metal angle variation at the LE of airfoils | |
| stagger angle variation in airfoils |
References
- Prahst, P.S.; Kulkarni, S.; Sohn, K.H. Experimental Results of the First Two Stages of an Advanced Transonic Core Compressor Under Isolated and Multi-Stage Conditions. In Proceedings of the ASME Turbo Expo 2015: Turbine Technical Conference and Exposition, Montreal, QC, Canada, 15–19 June 2015; ASME: New York, NY, USA, 2015; p. 10. [Google Scholar]
- Denton, J.D.; Xu, L. The Effects of Lean and Sweep on Transonic Fan Performance. In Proceedings of the ASME Turbo Expo 2002: Power for Land, Sea, and Air, Amsterdam, The Netherlands, 3–6 June 2002; pp. 23–32. [Google Scholar]
- Goodhand, M.N.; Miller, R.J.; Lung, H.W. The impact of geometric variation on compressor two-dimensional incidence range. J. Turbomach. 2015, 137, 021007.1–021007.7. [Google Scholar] [CrossRef]
- Zhang, Q.; Meng, D.; Xu, S.; Wang, D.X.; Hang, X. Efficient aerodynamic uncertainty quantification for a three-dimensional transonic fan rotor. J. Turbomach. 2025, 147, 081013. [Google Scholar] [CrossRef]
- Ghisu, T.; Shahpar, S. Affordable uncertainty quantification for industrial problems: Application to aeroengine fans. J. Turbomach. 2018, 140, 061005. [Google Scholar] [CrossRef]
- Ghisu, T.; Lopez, D.I.; Seshadri, P.; Shahpar, S. Gradient-enhanced least-square polynomial chaos expansions for uncertainty quantification and robust optimization. In Proceedings of the AIAA Aviation 2021 Forum, Virtual, 2–6 August 2021. [Google Scholar]
- Seshadri, P.; Parks, G.T.; Shahpar, S. Leakage uncertainties in compressors: The case of rotor 37. J. Propuls. Power 2015, 31, 456–466. [Google Scholar] [CrossRef]
- Kumar, A.; Nair, P.B.; Keane, A.J.; Shahpar, S. Robust design using Bayesian monte carlo. Int. J. Numer. Methods Eng. 2008, 73, 1497–1517. [Google Scholar] [CrossRef]
- Wang, X.; Hirsch, C.; Liu, Z.; Kang, S.; Lacor, C. Uncertainty-based robust aerodynamic optimization of rotor blades. Int. J. Numer. Methods Eng. 2013, 94, 111–127. [Google Scholar] [CrossRef]
- Wiegand, M.; Prots, A.; Meyer, M.; Schmidt, R.; Voigt, M.; Mailach, R. Robust design optimization of a compressor rotor using recursive cokriging based multi-fidelity uncertainty quantification and multi-fidelity optimization. J. Turbomach. 2025, 147, 1192–1204. [Google Scholar] [CrossRef]
- Carta, M.; Ghisu, T.; Shahpar, S. High-fidelity computational fluid dynamics analysis of in-serviced shrouded high-pressure turbine rotor blades. J. Turbomach. 2022, 144, 1122–1134. [Google Scholar] [CrossRef]
- Carta, M.; Ghisu, T.; Shahpar, S. Heat transfer analysis of damaged shrouded high-pressure turbine rotor blades. Int. J. Turbomach. Propuls. Power 2023, 8, 24. [Google Scholar] [CrossRef]
- Carta, M.; Putzu, R.; Ghisu, T.; Shahpar, S. Aero-thermal-structural optimization of a high-pressure turbine rotor with robustness evaluation to in-service deterioration. In Proceedings of the ASME Turbo Expo 2025: Turbomachinery Technical Conference and Exposition, Memphis, TN, USA, 16–20 June 2025; ASME: New York, NY, USA; Volume 10, p. 13. [Google Scholar]
- Guo, Z.; Chu, W. Stochastic aerodynamic analysis for compressor blades with manufacturing variability based on a mathematical dimensionality reduction method. Proc. Inst. Mech. Eng. Part C J. Mech. Eng. Sci. 2022, 236, 5719–5735. [Google Scholar] [CrossRef]
- Gambitta, M.; Kühhorn, A.; Beirow, B.; Schrape, S. Stator Blades Manufacturing Geometrical Variability in Axial Compressors and Impact on the Aeroelastic Excitation Forces. J. Turbomach. 2021, 125, 1199–1213. [Google Scholar]
- Sun, Z.; Chu, W.; Qiao, Y.; Ji, T. Uncertainty quantification of geometric deviation effects on compressor performance based on an optimized support vector regression. Phys. Fluids 2025, 37, 066103. [Google Scholar] [CrossRef]
- Lange, A.; Vogeler, K.; Schrapp, H.V.G.; Clemen, C. Introduction of a parameter based compressor blade model for considering measured geometry uncertainties in numerical simulation. In Proceedings of the ASME Turbo Expo 2009: Power for Land, Sea, and Air, Orlando, FL, USA, 8–12 June 2009; pp. 1113–1123. [Google Scholar]
- Lange, A.; Voigt, M.; Vogeler, K.; Schrapp, H.; Gümmer, V. Probabilistic CFD Simulation of a High-Pressure Compressor Stage Taking Manufacturing Variability Into Account. In Proceedings of the ASME Turbo Expo 2010: Power for Land, Sea, and Air, Glasgow, UK, 14–19 June 2010; pp. 617–628. [Google Scholar]
- Ji, T.; Chu, W. Uncertainty quantification of compressor performance affected by data driven blade geometric deviations. J. Eng. Gas Turbines Power 2024, 146, 1208–1221. [Google Scholar] [CrossRef]
- Zheng, S.; Teng, J.; Wu, Y.; Guo, F.; Lu, S.; Qiang, X. Impact of Nonuniform Stagger Angle Distribution on High-Pressure Compressor Rotor Performance. In Proceedings of the ASME Turbo Expo 2018: Turbomachinery Technical Conference and Exposition, Oslo, Norway, 11–15 June 2018; p. 13. [Google Scholar]
- Rendu, Q.; Salles, L. Development of a surrogate model for uncertainty quantification of compressor performance due to manufacturing tolerance. J. Glob. Power Propuls. Soc. 2023, 7, 257–268. [Google Scholar] [CrossRef]
- Liang, T.; Liu, B.; Spence, S.; Mao, X.; Cheng, H. Numerical Investigation into the Effects of Tip Clearance on the Performance of a Counter-Rotating Axial Flow Compressor. J. Appl. Fluid Mech. 2020, 13, 1587–1599. [Google Scholar] [CrossRef]
- Zhang, C.; Ji, L.; Zhou, L.; Zhang, Z. Effects of different blended blade tip and winglets on aerodynamic and aeroacoustic performances of diagonal fans. Aerosp. Sci. Technol. 2020, 106, 106200. [Google Scholar] [CrossRef]
- Drela, M.; Youngren, H. A User’s Guide to MISES 2.53; Massachusetts Institute of Technology: Cambridge, MA, USA, 1998. [Google Scholar]
- Reid, L.; Moore, R.D. Design and Overall Performance of Four Highly Loaded, High Speed Inlet Stages for an Advanced High-Pressure-Ratio Core Compressor; Technical Report for National Aeronautics and Space Administration Lewis Research Center: Cleveland, OH, USA, 1978. [Google Scholar]
- Goodhand, M.N.; Miller, R.J.; Lung, H.W. The Sensitivity of 2D Compressor Incidence Range to In-Service Geometric Variation. In Proceedings of the ASME Turbo Expo 2012: Turbine Technical Conference Exposition, Copenhagen, Denmark, 11–15 June 2012; pp. 159–170. [Google Scholar]
- Wunsch, D.; Rémy Nigro, C.; Coussement, G.; Hirsch, C. Quantification of Combined Operational and Geometrical Uncertainties in Turbo-Machinery Design. In Proceedings of the ASME Turbo Expo 2015: Turbine Technical Conference and Exposition, Montreal, QC, Canada, 15–19 June 2015; p. 11. [Google Scholar]
- Giebmanns, A.; Schnell, R.; Steinert, W.; Hergt, A.; Nicke, E.; Werner-Spatz, C. Analyzing and Optimizing Geometrically Degraded Transonic Fan Blades by Means of 2D and 3D Simulations and Cascade Measurements. In Proceedings of the ASME Turbo Expo 2012: Turbine Technical Conference and Exposition, Copenhagen, Denmark, 11–15 June 2012; pp. 279–288. [Google Scholar]
- Balas, E.A.; Balas, C.E. Maritime risk assessment: A cutting-edge hybrid model integrating automated machine learning and deep learning with hydrodynamic and monte carlo simulations. J. Mar. Sci. Eng. 2025, 13, 939–994. [Google Scholar] [CrossRef]
- Zhang, H.; Zou, Z.; Li, Y.; Ye, J.; Song, S. Conjugate heat transfer investigations of turbine vane based on transition models. Chin. J. Aeronaut. 2013, 26, 890–897. [Google Scholar] [CrossRef]
- Goodhand, M.N.; Miller, R.J. Compressor leading edge spikes: A new performance criterion. J. Turbomach. 2010, 7, 1553–1562. [Google Scholar]
- Shafique, M.S.; Skogerboe, G.V. Impact of seasonal infiltration function variation on furrow irrigation performance. Energy Conserv. Technol. 1983, 360, 285–292. [Google Scholar]
- Lejon, M.; Andersson, N.; Ellbrant, L.; Martensson, H. The impact of manufacturing variations on performance of a transonic axial compressor rotor. J. Turbomach. 2020, 142, 081009. [Google Scholar] [CrossRef]
- Wang, P.; Wang, W.; Zheng, S.; Gao, Z. Fatigue damage evaluation of compressor blade based on nonlinear ultrasonic nondestructive testing. J. Mar. Sci. Eng. 2021, 9, 1358–1375. [Google Scholar] [CrossRef]
- Chen, M.; Zhang, X.; Shen, K.; Pan, G. Sparse Polynomial Chaos Expansion for Uncertainty Quantification of Composite Cylindrical Shell with Geometrical and Material Uncertainty. J. Mar. Sci. Eng. 2022, 10, 670–684. [Google Scholar] [CrossRef]
- Constantine, P.G.; Eldred, M.S.; Phipps, E.T. Sparse pseudo spectral approximation method. Comput. Methods Appl. Mech. Eng. 2012, 229-232, 1–12. [Google Scholar] [CrossRef]
Disclaimer/Publisher’s Note: The statements, opinions and data contained in all publications are solely those of the individual author(s) and contributor(s) and not of MDPI and/or the editor(s). MDPI and/or the editor(s) disclaim responsibility for any injury to people or property resulting from any ideas, methods, instructions or products referred to in the content. |
© 2025 by the authors. Licensee MDPI, Basel, Switzerland. This article is an open access article distributed under the terms and conditions of the Creative Commons Attribution (CC BY) license (https://creativecommons.org/licenses/by/4.0/).

