Abstract
Coastal erosion, exacerbated by climate change, poses a critical global threat to both the environment and human livelihoods. Acquiring accurate, high-resolution topo-bathymetric data is vital for understanding these dynamic environments, without underestimating the hydrodynamic and meteo-oceanographic conditions. However, traditional methods often present significant challenges in achieving comprehensive, high-resolution topo-bathymetric coverage efficiently in shallow coastal zones, leading to a notable ”white ribbon” data gap. This study introduces a novel, integrated methodology combining unmanned aerial vehicles (UAVs) for terrestrial surveys, unmanned surface vehicles (USVs) for bathymetry, and the Global Navigation Satellite System (GNSS) for ground control and intertidal gap-filling. Through this technologically rigorous approach, a seamless Bathymetry-Topography Digital Surface Model for the Guardamar del Segura dune system (Spain) was successfully elaborated using a DJI Mini 2 UAV, Leica Zeno FLX100 GNSS, and Apache 3 USV. The method demonstrated a substantial time reduction of at least 50–75% for comparable high-resolution coverage, efficiently completing the 86.4 ha field campaign in approximately 4 h. This integrated approach offers an accessible and highly efficient solution for generating detailed coastal elevation models crucial for coastal management and research.
1. Introduction
Coastal erosion processes pose a significant and recurring threat to global coastal environments, directly impacting both ecosystems and human populations in these areas [1]. Worldwide, sandy beaches, which constitute over one-third of the global coastline, are particularly vulnerable to erosion due to rising sea levels, increased storm intensity, and human activities. Projections indicate that a significant percentage of these vital ecosystems, potentially up to 50% of the world’s sandy beaches, could face severe erosion or even disappear by the end of the century under high emission scenarios, underscoring the urgent need for comprehensive monitoring and effective management strategies. Climate change is expected to exacerbate erosion and soil loss due to factors such as sea-level rise [2] and intensified winds and storms [3], leading to increased degradation of coastal ecosystems and rapid morphological changes in low-lying sandy areas [4]. Consequently, it is important to systematically assess the topo-bathymetric changes occurring in these zones to better understand the dynamics of these valuable natural environments [5]. However, the high dynamism of coastal systems, shaped by the constant interaction between topography, sediment transport, meteorological phenomena, and anthropogenic activities [6], hinders the availability of up-to-date and reliable topo-bathymetric data [7].
The acquisition of topographic data has seen significant advancements in recent years, thanks to the use of LiDAR (Light Detection and Ranging) systems and, more recently, unmanned aerial vehicles (UAVs). UAVs have been increasingly employed in oceanography for coastal shoreline assessments [8,9]; granulometric and colorimetric analyses [10]; coastal planning [11]; monitoring of coastal protection works [12]; identification of sedimentation patterns [13]; monitoring beach/dune system evolution [14,15]; analysis of sea-level changes due to tides [16]; and cliff erosion measurements [17].
Although bathymetry is also important for understanding coastal dynamics, shallow marine environments (coastal areas) have been defined as the ”white ribbon” (referring to the lack of data), due to the inefficiency of traditional techniques (measurements from large manned vessels) in providing full coverage with high spatial resolution (<5 m) within reasonable timeframes and costs [18]. Thus, for example, high-resolution bathymetric mapping using hydroacoustic technology is limited in coastal zones due to the safe operating depth of the vessel and the restricted coverage by the survey geometry [19].
Other methods, such as in situ monitoring using GNSS-RTK (Global Navigation Satellite System—Real-Time Kinematics) conducted transversally to the coast, only provide accurate information along the measured transects, but their coverage and spatial resolution are very limited [20]. On the other hand, there is the LiDAR methodology (previously mentioned), which also provides high precision and efficiency in underwater terrain measurements, but it is costly for periodic application and is restricted to certain depths [21]. More recently, UAVs have been developed for bathymetric measurements, but they present two main challenges [22]: wind intensity, which, given an operational scenario, requires careful planning [4], and the fact that the study area includes large extensions or breaker zones, which can hinder the application of data processing techniques [23]. Finally, faced with this challenge, unoccupied surface vehicles (USVs) have emerged as a potentially innovative and effective solution for marine-coastal issues [10]. USVs can be equipped with single-beam or multibeam echo sounders to obtain high-precision data [24]. Additionally, they are a good solution in shallow waters due to their small draft (<0.2 m) [25,26].
Given the complex nature of data acquisition in dynamic coastal zones, this study evaluates the feasibility of using autonomous vehicles to produce comprehensive, high-resolution datasets. Specifically, the primary objective is to demonstrate the feasibility of generating a seamless and highly accurate digital elevation model (DEM) encompassing both terrestrial and subaqueous surfaces within the coastal zone.
2. Materials and Methods
2.1. Study Area
The study area lies along the Mediterranean coast of Spain (Figure 1a), specifically within the southern portion of the Alicante province (Figure 1b). It encompasses a section of the Guardamar del Segura dune system, extending southward from the river mouth to the vicinity of the first remains of the traditional style buildings on Babilonia Beach (Figure 1c). This is an approximately 1.5 km stretch of sandy beach (D50 = 0.228 mm) that has been significantly impacted by anthropogenic factors since 1900, including (i) dune fixation between 1900–1934; (ii) residential construction in 1948; (iii) river channelization in 1988; (iv) dredging and dumping of material on the beach in 1998 for the construction of the Guardamar marina; (v) dune restoration between 2002–2011; and (vi) dredging of the river mouth by 2023.
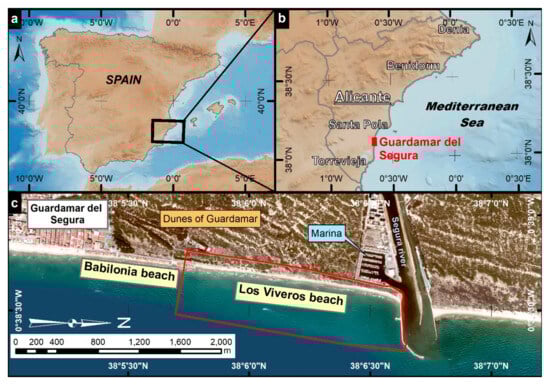
Figure 1.
(a) Area of study located on the Mediterranean coast of Spain, (b) in the south of the province of Alicante, (c) northward of the town of Guardamar del Segura (area of interest in red).
The maritime climate is influenced by Cape Santa Pola and Tabarca Island to the north and Cape Cerbera to the south. The predominant wave directions are from the east (31.4%), followed by ENE (14.6%) and ESE (14.2%), with an annual calm percentage of 10.9%. The significant wave height is less than or equal to 0.5 m for 52.6% of the time and greater than 1.5 m for 12.3% [27]. The most frequent winds in the area are from the ENE and NE with 11.9% and 10.3%, respectively, and an annual calm percentage of 9.2%. The average wind speed is around 4.4 m/s [28]. Finally, this is a microtidal zone with tides oscillating around 0.3 m (www.puertos.es (accessed on 22 January 2025)).
2.2. Measurement Equipment
2.2.1. UAV DJI Mini 2
The aerial survey was performed using a UAV DJI Mini 2 quadcopter (DJI, Shenzhen, China) (Figure 2a). This low take-off weight device (249 g) was equipped with a built-in camera and a 1/2.3” CMOS sensor with a resolution of 12 MP. The lens has a field of view (FOV) of 83° 24 mm (35 mm format equivalent) f/2.8 focus at ∞. It was provided with three 2250 mAh smart batteries that allowed a net flight time of nearly 20 min per battery. For the mission planning and flight control, application Map Pilot Pro (Drones Made Easy, San Diego, CA, USA) was used.
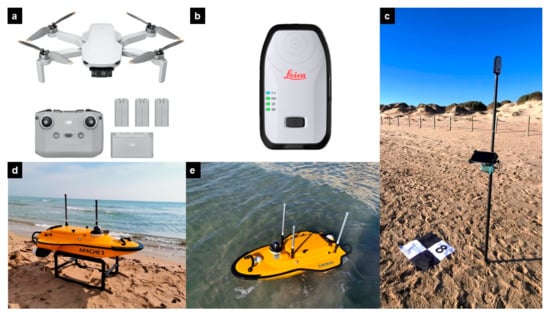
Figure 2.
Research equipment. (a) DJI Mini 2 quadcopter. (b) Leica FLX100 GNSS antenna. (c) Ground Control Point target and FLX100 GNSS antenna mounted on pole, connected to TcpGPS app on an Android Samsung Tab. (d) CHCNAV Apache 3 USV prepared to be launched and (e) Apache 3 USV on the sea.
2.2.2. Leica Zeno FLX100 GNSS Antenna
The topographic survey was performed using a Leica Zeno FLX100 GNSS antenna (Leica Geosystems, St. Gallen, Sweden) (Figure 2b). Data capture was conducted using the TcpGPS v.2.6.4 app installed on an Android Samsung Galaxy Tab tablet. The accuracy obtained by using RTK with the NTRIP-based network solution linked to the GNSS ERVA reference station network via GPRS/3G connection was ±2 cm horizontal and ±3 cm vertical in the UTM ETRS89 H30N (EPSG 25830) coordinate system. Ground Control Points (GCPs) 50 × 50 cm targets were printed and placed on the beach and dune to improve the aerial survey accuracy (Figure 2c).
2.2.3. USV Apache 3
The Apache 3 USV bathymetric survey drone is equipped with a D230 single-beam echosounder and dual GNSS RTK, developed by CHCNAV (CHC Navigation Europe, Budapest, Hungary) (Figure 2d). It is a triple-hulled USV shallow-draft marine drone equipped with a D230 single-beam echosounder (SBES) with a frequency of 200 kHz. Particularly designed for shallow water bathymetric surveys, the D230 features a sounding accuracy of ±0.01 m + 0.1% × D and a detection range of 0.5 m to 200 m. Moreover, dual GNSS RTK positioning and an IMU sensor provide a positional accuracy of 1 cm horizontal and ±2 cm vertical. With seamless 4G, communications have a range of control limited by the SIM network coverage. Surveys can be carried out in automatic cruise mode at a recommended speed of 1.8 m/s (up to 3 m/s if needed) or can be controlled manually at a maximum speed of 5 m/s. It also has a 360° video camera dome and a radar for obstacle avoidance (Figure 2e).
The Apache 3 USV, characterized by its compact dimensions (1 m length) and lightweight construction (7 kg unladen, 20 kg fully equipped with instruments and batteries), exhibits high portability. This facilitates convenient transportation by various means, including vehicular transport, to remote mission locations. Furthermore, the system’s operational simplicity allows for single-operator deployment.
2.3. Data Acquisition and Processing
Figure 3 illustrates the workflow followed for the acquisition of both topographic and bathymetric data in the coastal study area, as well as the subsequent processing steps to generate the coastal SBT-DSM.
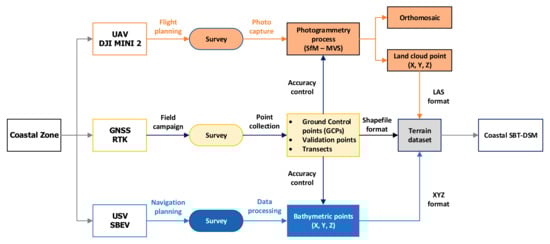
Figure 3.
Workflow followed to obtain the Coastal SBT-DSM.
It is noteworthy that the data acquisition campaign was conducted over a single morning. During the data collection period (from 07:30 to 11:30), the prevailing meteorological conditions were as follows (Figure 4): a mean significant wave height of 0.35 m; a wind speed of 1.57 m/s; and a tidal level of +11.8 cm.
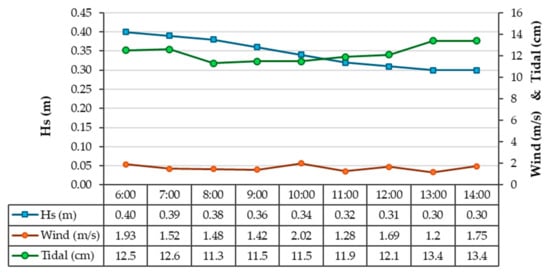
Figure 4.
Meteorological conditions (Hs: significant wave height; wind speed and tidal level) during measuring campaign.
2.3.1. Aerial Campaign and Cloud Point Creation
The UAS field campaign for data acquisition took place with clear skies and calm periods alternating with weak winds of 2–3 m/s. The flight plan was established prior to the field campaign using the Map Pilot Pro application (Drones Made Easy, San Diego, CA, USA). The flight altitude was set at 50 m above ground level to obtain a ground sample distance (GSD) of 2 cm. The latitudinal overlap was set to 75%, and the longitudinal overlap was fixed to 80%, taking pictures every 2.5 s at a constant flight speed of 4.2 m/s. The flights were planned so that each beach was covered in two passes (Figure 5a), taking a photo approximately every 10 m (Figure 5b). At the same time, a total of 36 targets of 50 × 50 cm distributed throughout the study area (12 on the beach and 24 on the dune) were used as Ground Control Points (GCPs) for the photogrammetric georeferencing process.
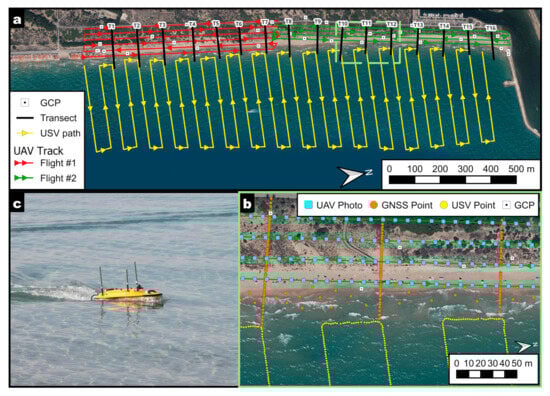
Figure 5.
(a) UAV flight path, USV navigation path, and location of GCPs, transects, and GNSS survey. (b) Detailed view showing the location of the photos acquired by the UAV, the USV bathymetric points, and GNSS survey points. (c) Image of the USV Apache 3 during navigation in very shallow waters.
The photogrammetry process using the Structure-from-Motion MultiView Stereo (SfM-MVS) algorithm enables the reconstruction of a 3D scene by resolving the geometry of the images, the camera positions, and their orientation simultaneously using Agisoft Metashape 2.2.0 software. The 36 GCPs surveyed by GNSS improves the model reconstruction results. Once the accuracy is satisfactory, a reconstruction processing algorithm is applied to generate the dense point cloud with RGB colors, with a resolution of 855 points/m2 (Figure 6a). Through the calculus of the confidence parameter (Figure 6b), the noisy areas of the dense cloud (e.g., the intertidal zone, the swash area, or vegetation) can be deleted prior to generating the point cloud (Figure 6c) and a Digital Surface Model (DSM). This DSM was used to create an orthomosaic of the entire monitored area. Finally, the point cloud was exported in the ASPRS LAS format. While primarily designed for LiDAR data, the LAS format also proves advantageous for handling very large datasets, such as those generated from photogrammetry. This format facilitates efficient data management, visualization, and subsequent analysis.
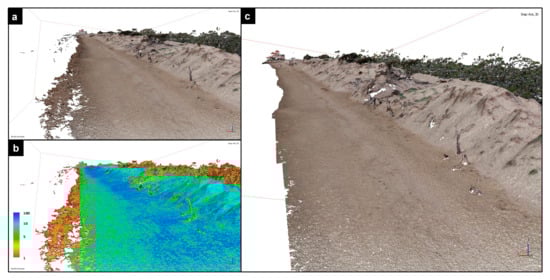
Figure 6.
(a) Original colored point cloud obtained from the SfM-MVS processing. (b) Point cloud represented by the confidence parameter. Note that the lowest values are in the swash zone and in vegetation areas. (c) Filtered point cloud used to generate DSM.
2.3.2. Navigation Campaign and Seabed Data Creation
Coastal bathymetric surveys were performed using the CHCNav Apache 3 USV. The surveyor uploaded the planned navigation path shown in Figure 5a, although it used a remote control to operate the USV for navigation and surveying in ultra-shallow waters. Survey lines were oriented perpendicular to the coastline, in transects of 400 m length and 50 m spacing. The survey area was free of obstructions that could potentially interfere with data acquisition (e.g., aquatic vegetation, fishing nets). Navigational paths for the USV operating in autonomous mode were designed using the USV AutoPlanner v.2.0.11 software (Figure 7a). USV speed was set to 1.8 m/s (Figure 5c). The positioning of USV adopted a fixed GNSS network RTK mode, obtaining real-time data in the UTM ETRS89 H30N (EPSG 25830) coordinate system, with a horizontal and vertical accuracy (HRMS and VRMS) < 3 cm. (Figure 7b).
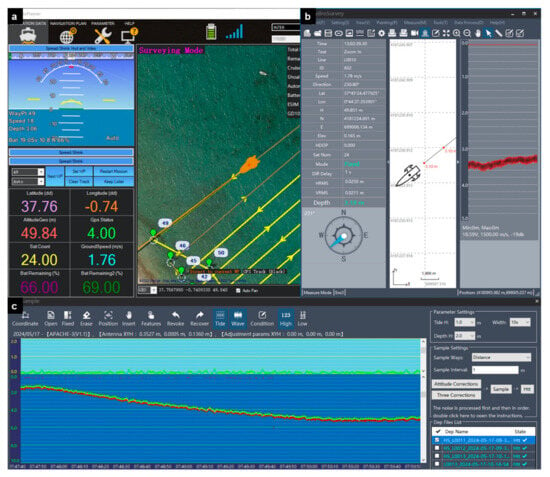
Figure 7.
Snapshot of the software used for the bathymetric survey: (a) AutoPlanner showing the navigation path and the USV navigation parameters. (b) HydroSurvey v7 software with the echosounder record data and (c) data processing with depth sampling and attitude correction process.
The Single Beam Echo Sounder (SBES) D230 transducer (CHC Navigation Europe, Budapest, Hungary) emits ultrasonic waves, and water depth is determined by measuring the time interval between the transmitted and received signals (Figure 7b). Prior to calculating seabed coordinates, it is fundamental to correct for potential errors in the measured water depth. This correction process encompasses the removal of anomalous depth readings, attitude corrections to account for vessel motion, and adjustments for variations in sound speed within the water column, typically set in 1500 m/s. (Figure 7c). Data points were exported in XYZ plain text file format, adding the point ID, timestamp, and sea water level among the coordinates of the bathymetric points.
2.3.3. Topographic Field Campaign
A handheld Leica Zeno FLX100 GNSS RTK was used to measure the GCPs used to create and validate the photogrammetry process. Moreover, topographic and bathymetric control and verification points were surveyed. Overlapping data using the GNSS survey were necessary due to the need for completing the gap of land and sea DEMs created by the lack of data in the intertidal zone from UAV topographic and USV bathymetric surveys. Sixteen transects spaced 100 m were surveyed (Figure 5a). The measurement interval of these points was 2 m. Each transect was repeated three times to validate data collection, for a total of 720 validation points. In addition, intertidal and swash zone points were measured, as well as shoreline and dune toe points, to properly define these important breaklines when creating the coastal SBT-DSM (Figure 5b). Data points were exported in shapefile format, adding the point ID, timestamp, and a code identifying the typology of the surface (dune, beach, shoreline, dune toe, swash) among the coordinates of the GNSS points.
2.4. Creation of Coastal SBT-DSM
The datasets created (orthomosaics, point clouds, and breaklines) were imported into a GIS environment to perform geospatial analysis. A terrain dataset, generated within the ArcGIS Pro 3.0.2 GIS environment, serves as the foundation for SBT-DSM creation. This dataset constitutes a multiresolution surface model, employing a Triangulated Irregular Network (TIN) structure. It leverages geodatabase-stored measurement data from diverse sources, including GNSS, LiDAR, sonar, and photogrammetry. A key advantage of this approach lies in its inherent multiresolution capability and efficient data organization. By incorporating terrain pyramids, the system optimizes data retrieval, enabling rapid construction of surfaces at varying levels of detail.
The land cloud point, with a spatial resolution of 3 cm/pixel, was converted into Multipoint inside the geodatabase to serve the Terrain dataset. Bathymetric points were imported as Multipoint to the geodatabase. Topographic data surveyed by means of GNSS were imported as point datasets, as well as GCPs and validation points. Finally, shoreline and dune toe were imported polyline datasets to serve as breaklines during the SBT-DSM terrain dataset creation. In addition to the 2D and 3D maps of SBT-DSM, slope maps and topographic profile were also used to analyze the topographic features of the coastal zone.
3. Results
3.1. UAV, USV and GNSS Survey Performance
The studied area covered an extension of 86.4 ha (0.864 km2). The terrestrial portion covers 0.257 km2, extending 1.5 km in length and approximately 150 m in width, from the shoreline to a road that defines the inner boundary of the dune system. The remaining area (0.607 km2) is submerged, spanning the same length and width from the shoreline 400 m offshore. All the data collection parameters described below are summarized in Table 1.

Table 1.
Summary of data collection methods, equipment, and survey parameters.
The UAV survey covered the terrestrial surface in two flights. In the first one, the UAV flew 3.75 km in 19 min, whereas in the second one covered 4.68 km in only 16 min. The reason why the UAV takes less time on the second, but it is a longer flight, is that the number of passes was lower (four vs. six). The total time for the UAV survey, including take-off, landing, displacement to the second flight zone, and return to the home point, was 1 h. The UAV survey covered an area of 0.257 km2 and involved 36 control points (12 on the beach and 24 on the dune).
The USV survey necessitated navigation along 13.34 km. The USV operated at 1.8 m/s in automatic survey mode, completing the path in 2 h and 15 min. Including preparation for launch and battery exchanges, the entire USV navigation campaign required 2.5 h. This survey collected bathymetry data and surveyed 9120 points (10% sample used for validation).
The GNSS survey proved to be the most time-consuming (4 h). To ensure optimal ground control point (GCP) distribution for photogrammetric reconstruction, targets were strategically placed in a staggered pattern with 100–200 m spacing across the 0.257 km2. Researchers traveled approximately 6.23 km, in about four hours, through the beach and dune environment for target placement, GNSS georeferencing, data collection at the 16 transects and points in the intertidal and swash zone (720 points), and target recovery. Overall, all field campaigns were carried out in a single working morning.
3.2. Coastal SBT-DSM
3.2.1. Data Processing Performance
The most computationally demanding stage of the workflow involved photogrammetric processing using the Structure-from-Motion (SfM) and Multi-View Stereo (MVS) algorithms within the Agisoft Metashape v.2.2.1 software. Image alignment, GCP marker placement, and point cloud generation required 1 h and 40 min. The following processing steps, including point cloud filtering, orthomosaic creation, and result export, were completed within 20 min. The total duration of this stage was 2 h. The dense point cloud originally generated had more than 220 million points, but after filtering noisy points, it was reduced to 137.7 million points, with an average spacing of 3 cm. The USV survey required 30 min to process and export the data. Finally, creating a terrain dataset, converting the LAS dataset from the land point cloud and the XYZ bathymetric points to Multipoints datasets, and importing the shapefile with the GNSS consumed 25 min.
3.2.2. Coastal SBT-DSM Dataset
The very-high-resolution coastal SBT-DSM obtained is presented in Figure 8. The heights in the studied area range from a maximum height of 10 m located on the dune adjacent to the Segura River to a maximum depth of −5.5 m
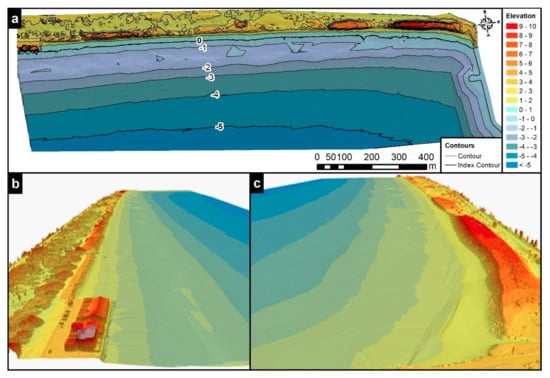
Figure 8.
Coastal SBT-DSM. (a) Overview of the SBT-DSM with 1 m interval contours (elevation in meters). (b) 3D model view from the south and (c) from the north of the area studied.
From the SBT-DSM, contours were extracted at 1 m intervals (Figure 8a). The accurate 3D visualization facilitates the identification and analysis of key geomorphological features such as buildings along the shoreline, vegetation cover, and dune dimensions (Figure 8b,c).
In the terrestrial zone, a resolution of 3.5 cm/pix was obtained in the DSM, which means representing the surface with a density of 855 points per m2. This ultra-high resolution enables a perfect model of the complex shapes of the beach and dune environment. However, within the submerged area, spatial resolution is reduced. Nonetheless, the morphological features of the shoreface exhibit significantly lower variability than the emerged coastline and thus do not require the same spatial resolution.
Slope maps provide critical insights into the topography of coastal areas (Figure 9a). Steep slopes are more susceptible to erosion, making them prime areas for monitoring and management. In our area of study, slopes exceeding 25° (value for natural sandy dunes) were detected in the dunes in both leeward and windward sides. This represents an erosion risk.
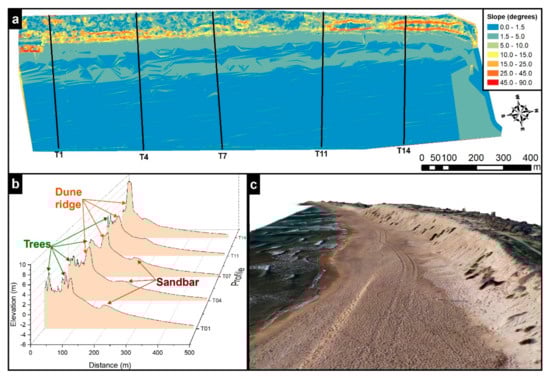
Figure 9.
(a) Slope map of the SBT-DSM. (b) Five representing cross-shore profiles derived from the SBT-DSM. (c) Realistic 3D model using the high-resolution orthomosaic and SBT-DSM.
The level of detail inherent in the SBT-DSM created allowed the identification of significant morphological characteristics, such as beach cusp, berms, scarps and dunes. For example, cross-sections T01, T04, and T07 consistently revealed a submerged longshore sandbar located approximately 190 m offshore at a depth of −1.5 m. This sandbar appears to be a prominent feature across much of the study area, being as evident in both the elevation and slope maps. In addition, the SBT-DSM clearly depicts the dune ridge, along with associated vegetation and tree canopies. Furthermore, beach berm and foredune were accurately and realistically modeled (Figure 9c), combining the orthomosaic (produced at a spatial resolution of 5 cm/pix) and the SBT-DSM at its highest resolution.
3.3. Accuracy of the Results
The accuracy of the USV bathymetric DSM was calculated by reserving a subset of 912 of points surveyed (10% sample) chosen randomly (Figure 10). Cross-validation was performed between the measurements taken by the USV SBES and the coastal SBT-DSM. The root mean squared error (RMSE, that is, the standard deviation of the sample) was adopted as measurement error indicator. The results show a RMSE Z < 5 cm.
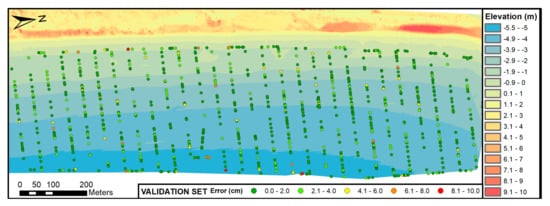
Figure 10.
Spatial distribution of the 912 subset points reserved for validation, SBT-DSM, and error between USV measurements and Z value of the SBT-DSM.
In the case of the GNSS survey, the validation was performed comparing the points surveyed for the 16 transects. The RMSE Z obtained is <2 cm.
The accuracy of the photogrammetrically derived land cloud point was assessed using a subset of seven GCPs, constituting 20% of the total GCPs utilized for georeferencing. A high accuracy has been obtained (RMSE XY < 3 cm and RMSE Z < 1 cm). It is important to note that whilst the GNSS equipment used for establishing ground control points (GCPs) has a vertical precision of ±3 cm, the high accuracy (RMSE Z < 1 cm) achieved in the photogrammetrically derived point cloud is attributed to the photogrammetry process. This method, by integrating multiple overlapping images and employing bundle adjustment, significantly improves the relative geometric accuracy of the final 3D model, averaging and adjusting errors from individual measurements to produce a result with superior consistency and accuracy compared to the absolute precision of the GCPs.
4. Discussion
The acquisition of digital terrain models in coastal zones has faced significant challenges in obtaining high-resolution morphological data. As a dynamic zone, the continuous acquisition of data is scarce and presents a high cost, primarily in obtaining data at shallow depths near the coast. The shallow depth of these waters restricts bathymetric surveys in manned research vessels, which have a limited measurement depth due to their deep draught and safety concerns [18]. On the other hand, alternative systems such as marine hydrographic LiDAR are also subject to limitations such as water clarity and atmospheric conditions like fog, rain, or intense sunlight, which interfere with the signal and reduce image quality, in addition to being a costly technology [29]. Our study builds upon the acknowledged advantages of unmanned vehicles [4,6,10,25,29] by presenting a novel integrated methodology that synergistically leverages UAV and USV platforms, augmented by strategic GNSS ground control, to overcome these limitations and generate a seamless, high-resolution coastal topo-bathymetric digital surface model (SBT-DSM). Table 2 shows a comparison of the advantages and disadvantages of the proposed method compared to traditional methods, which will be developed throughout the following discussion points.
Table 2.
Comparison of the advantages and disadvantages of the proposed method compared to traditional methods.
4.1. Analysis of the Limitations of the Proposed Method
Despite the demonstrable benefits of the integrated UAV-USV-GNSS methodology, it is crucial to acknowledge its inherent limitations. While offering greater flexibility than traditional methods, the proposed approach remains susceptible to adverse meteorological conditions. Strong winds (exceeding 5–7 m/s for small UAVs like the DJI Mini 2) can significantly compromise UAV flight stability, image quality, and battery life, potentially leading to incomplete data coverage or reduced accuracy [4,22]. Similarly, high wave heights can impact USV stability, affect the precision of echosounder readings, and increase the risk of equipment damage. The requirement for calm sea conditions for accurate bathymetric surveys, as noted by Kum, Shin, Jang, Lee, Lee, Moh, Lim, Do, and Cho [24], means that data acquisition windows can be limited, especially in dynamic coastal environments prone to frequent storm events.
Although the GNSS survey effectively “completes the gap” in the intertidal and swash zone, the intrinsic dynamism of this area (e.g., swash zone, tidal variations, shifting sands) means that achieving consistently high-resolution and stable data for repetitive surveys remains a challenge. The tidal range in microtidal zones, as in our study (30 cm), while not conducive to significant USV access, still introduces a variable interface that requires careful timing and dense GNSS sampling to accurately capture. The RMSE of <2 cm for the GNSS survey is excellent, but accurately interpolating between these points in a constantly moving swash zone can introduce localized uncertainties not fully captured by this metric.
4.2. Adaptability of the Methodology
The methodology presented in this study, while demonstrated in a microtidal, sandy beach environment in the Mediterranean, also possesses a high degree of adaptability for deployment in various other coastal settings. For macrotidal environments, the temporal component of the “spatiotemporal divisional measurement method” would become even more critical. UAV flights would ideally be conducted at low tide to maximize exposed intertidal areas, while USV surveys could be planned during higher tides to access greater depths [25]. The GNSS survey would still be essential to bridge any remaining gaps and provide ground control, but its focus might shift to capturing the full extent of the tidal flats at different stages.
The UAV component remains highly effective for mapping complex rocky shorelines and cliffs, where traditional vessel-based surveys are challenging due to navigation hazards [18,19]. The USV, however, might face limitations with its single-beam echosounder over highly irregular rocky seabed, where multibeam systems would offer superior coverage and detail [24]. Adaptations might involve integrating multibeam USVs or complementary techniques like terrestrial LiDAR for nearshore rock features.
The UAV’s ability to penetrate vegetation canopy to some extent (depending on density) can still provide valuable topographic data [30]. However, for dense mangrove forests, the quality of the DEM beneath the canopy would be reduced [31]. Integration with airborne LiDAR might be necessary in such cases to achieve sub-canopy topographic data. The USV’s utility in very shallow, vegetated waterways would depend on its draft and propeller clearance.
For significantly larger coastal stretches, the methodology scales well but would necessitate more UAV batteries, a more extensive network of GCPs, and potentially multiple USVs or longer deployment times. The core workflow of integrating aerial photogrammetry, USV bathymetry, and GNSS control points remains fundamentally sound.
4.3. Contribution to the Understanding of Coastal Dynamics
This integrated methodology significantly advances the theoretical understanding of coastal dynamics by providing unprecedented levels of spatial resolution and accuracy in topo-bathymetric data, particularly across the critical land-sea interface. By effectively resolving the data gap in the intertidal and shallow subtidal zones, the method allows for a truly holistic representation of the coastal profile. This unified dataset is fundamental for developing and validating more accurate numerical models of sediment transport, wave propagation, and coastal geomorphological evolution [32]. Traditional models often rely on interpolated data in these critical areas, leading to uncertainties. Our high-resolution SBT-DSM offers empirical data to constrain and refine these models.
The high spatial and vertical accuracy (RMSE < 5 cm for SBT-DSM, <1 cm for UAV topography) enables the precise quantification of subtle morphological features (e.g., beach cusps, berms, scarps) and changes over time. This is crucial for the following: (i) Understanding storm impacts: Accurately measuring volumetric changes in beaches and dunes post-storm events, allowing for better calibration of storm impact models and erosion prediction. (ii) Dune stability and vulnerability: The ability to model complex dune shapes and slopes with high resolution (e.g., identifying slopes > 25° as erosion risks) directly contributes to understanding dune stability and predicting vulnerability to erosion, which is vital for coastal protection strategies [14].
Ultimately, this method contributes to developing more robust predictive capabilities for coastal change under scenarios of climate change, sea-level rise, and increased storm intensity. By providing better baseline data and enabling more accurate model calibration, it supports more informed decision-making in coastal planning, engineering, and conservation.
4.4. Efficiency and Cost-Effectiveness
The proposed integrated UAV-USV-GNSS methodology offers significant advantages in efficiency and cost-effectiveness when compared to traditional topo-bathymetric survey methods, while also demonstrating some limitations.
The method proposed in this study demonstrates a time reduction of at least 50–75% for comparable high-resolution coverage when contrasted with traditional multi-day campaigns involving separate land and marine teams. The total field time for an area of 86.4 ha was merely a single working morning (approximately 4 h), with three personnel engaged. The most efficient component was the UAV (0.44 km2/h), followed by the USV (0.24 km2/h). The GNSS survey, whilst crucial, reduced the overall acquisition rate to 0.21 km2/h. However, traditional methods typically necessitate significantly more personnel and time. For a comparable area, a manned vessel would probably require a full day or more, and potentially several days, to achieve high-resolution coverage in complex shallow waters, often with depth limitations imposed by safety considerations [33]. Manual GNSS surveys covering such an extensive area (beyond mere transects) would prove to be exceedingly time-consuming and labor-intensive, frequently extending over several days.
The initial equipment outlay for our proposed configuration is an order of magnitude lower, approximating $20,000–$35,000 USD (comprising a DJI Mini 2 at $500–$1000 USD, a Leica Zeno FLX100 at $10,000–$15,000 USD, and an Apache 3 USV at $10,000–$20,000 USD). This contrasts sharply with the hundreds of thousands to millions of US dollars typically associated with comprehensive traditional surveys. Manned research vessels, for instance, entail substantial expenses, covering fuel, crew salaries, vessel maintenance, and specialized hydrographic equipment (e.g., multibeam echosounders, often costing hundreds of thousands to over a million US dollars) [34,35]. Similarly, airborne LiDAR surveys are exceptionally costly, ranging from thousands to tens of thousands of US dollars per flight hour, and demand highly specialized aircraft and extensively trained personnel [36]. Our operational costs are commensurately reduced, with estimated savings of 70–90% per survey campaign achieved by minimizing personnel, fuel consumption, and the need to charter large vessels.
Regarding spatial resolution and coverage, the proposed method achieves ultra-high resolution (3.5 cm/pixel for terrestrial data, sub-meter for bathymetry) with excellent spatial coverage across the crucial land-sea interface. In contrast, traditional methods present distinct limitations. While manual GNSS surveys offer high positional accuracy, their spatial resolution is typically restricted to discrete transects. Manned vessel bathymetry frequently struggles to provide comprehensive coverage in very shallow waters, often leaving the well-known “white ribbon” data gap. Furthermore, although airborne LiDAR delivers high resolution, it is both prohibitively expensive and depth-limited for effective bathymetric mapping. Consequently, the method presented herein offers a resolution improvement of one to two orders of magnitude in numerous areas compared to traditional extensive surveys. This provides a level of detail previously unattainable without incurring prohibitive costs or requiring extensive manual effort.
Finally, it is crucial to highlight the inherent limitations of the proposed method. Firstly, the technique is not entirely autonomous for the intertidal zone. While the issue was successfully addressed through the integration of GNSS data, this remains a key constraint. The GNSS survey alone consumed 4 h of field time, accounting for 50% of the total field effort. This underscores its time-intensive nature, introducing a manual component that diminishes the overall efficiency of the “autonomous vehicle” approach in this critical area. Secondly, as previously indicated, the method’s reliance on specific weather conditions for optimal performance means that survey windows can be significantly limited. Such dependency can lead to unavoidable delays and an increased planning burden, potentially extending project timelines beyond initial field estimations. Consequently, the success rate of planned campaigns might be lower in regions characterized by highly variable weather patterns.
5. Conclusions
In conclusion, this study successfully demonstrates the viability and the remarkable effectiveness of an integrated methodology combining the use of unmanned aerial vehicles (UAVs) for topography and unmanned surface vehicles (USVs) for bathymetry, supported by a precise Global Navigation Satellite System (GNSS). Unlike more traditional surveying methods that often contend with issues of efficiency and logistical complexity in acquiring dense data in dynamic environments, the synergy between these platforms has proven to be an exceptionally robust and efficient solution for the generation of high-resolution coastal elevation models (with an RMSE Z of less than 1 cm). This methodology is capable of delivering seamless coverage across the complex intertidal zone, effectively resolving the traditional “white ribbon” gap that challenges conventional approaches. This effective integration not only provides detailed and precise topo-bathymetric data, which are essential for understanding coastal dynamics and monitoring erosion, but also significantly optimizes data acquisition times, achieving a reduction of up to 50–75% compared to the laborious and time-consuming nature of traditional surveying methods for similar coverages and resolutions. The capacity of this methodology to offer a comprehensive, high-resolution, and safer view of the dune-beach-shallow water system positions it as a superior alternative and an invaluable tool for scientific research, planning, and adaptive coastal management in the face of climate change.
Author Contributions
Conceptualization, J.I.P. and I.L.; methodology, J.I.P., L.B. and I.L.; software, J.I.P. and L.B.; validation, J.I.P., L.B. and I.L.; formal analysis, J.I.P., L.B. and I.L.; investigation, L.B.; resources, J.I.P. and L.B.; data curation, J.I.P. and I.L.; writing—original draft preparation, J.I.P. and I.L.; writing—review and editing, L.B.; visualization, J.I.P., L.B. and I.L.; funding acquisition, J.I.P., L.B. and I.L. All authors have read and agreed to the published version of the manuscript.
Funding
This research was funded by Universidad de Alicante, grant number GRE23-01A.
Data Availability Statement
The original contributions presented in this study are included in the article. Further inquiries can be directed to the corresponding author.
Acknowledgments
The authors would like to thank CHCNav and AC21 Geospatial, particularly Antonio Capel, for their support and assistance with USV.
Conflicts of Interest
The authors declare no conflicts of interest.
References
- Young, S.S.; Rao, S.; Dorey, K. Monitoring the erosion and accretion of a human-built living shoreline with drone technology. Environ. Chall. 2021, 5, 100383. [Google Scholar] [CrossRef]
- Chisholm, L.; Talbot, T.; Appleby, W.; Tam, B.; Rong, R. Projected changes to air temperature, sea-level rise, and storms for the Gulf of Maine region in 2050. Elem. Sci. Anthr. 2021, 9, 00059. [Google Scholar] [CrossRef]
- Passeri, D.L.; Hagen, S.C.; Medeiros, S.C.; Bilskie, M.V.; Alizad, K.; Wang, D. The dynamic effects of sea level rise on low-gradient coastal landscapes: A review. Earth’s Future 2015, 3, 159–181. [Google Scholar] [CrossRef]
- Gonçalves, J.A.; Henriques, R. UAV photogrammetry for topographic monitoring of coastal areas. ISPRS J. Photogramm. Remote Sens. 2015, 104, 101–111. [Google Scholar] [CrossRef]
- Holman, R.A.; Holland, K.T.; Lalejini, D.M.; Spansel, S.D. Surf zone characterization from Unmanned Aerial Vehicle imagery. Ocean Dyn. 2011, 61, 1927–1935. [Google Scholar] [CrossRef]
- Tsukada, F.; Shimozono, T.; Matsuba, Y. UAV-based mapping of nearshore bathymetry over broad areas. Coast. Eng. J. 2020, 62, 285–298. [Google Scholar] [CrossRef]
- Toodesh, R.; Verhagen, S.; Dagla, A. Prediction of Changes in Seafloor Depths Based on Time Series of Bathymetry Observations: Dutch North Sea Case. J. Mar. Sci. Eng. 2021, 9, 931. [Google Scholar] [CrossRef]
- Angnuureng, D.B.; Jayson-Quashigah, P.-N.; Almar, R.; Stieglitz, T.C.; Anthony, E.J.; Aheto, D.W.; Appeaning Addo, K. Application of Shore-Based Video and Unmanned Aerial Vehicles (Drones): Complementary Tools for Beach Studies. Remote Sens. 2020, 12, 394. [Google Scholar] [CrossRef]
- Di Paola, G.; Minervino Amodio, A.; Dilauro, G.; Rodriguez, G.; Rosskopf, C.M. Shoreline Evolution and Erosion Vulnerability Assessment along the Central Adriatic Coast with the Contribution of UAV Beach Monitoring. Geosciences 2022, 12, 353. [Google Scholar] [CrossRef]
- Del Savio, A.A.; Luna Torres, A.; Vergara Olivera, M.A.; Llimpe Rojas, S.R.; Urday Ibarra, G.T.; Neckel, A. Using UAVs and Photogrammetry in Bathymetric Surveys in Shallow Waters. Appl. Sci. 2023, 13, 3420. [Google Scholar] [CrossRef]
- Papakonstantinou, A.; Topouzelis, K.; Pavlogeorgatos, G. Coastline Zones Identification and 3D Coastal Mapping Using UAV Spatial Data. ISPRS Int. J. Geo-Inf. 2016, 5, 75. [Google Scholar] [CrossRef]
- Śledziowski, J.; Terefenko, P.; Giza, A.; Forczmański, P.; Łysko, A.; Maćków, W.; Stępień, G.; Tomczak, A.; Kurylczyk, A. Application of Unmanned Aerial Vehicles and Image Processing Techniques in Monitoring Underwater Coastal Protection Measures. Remote Sens. 2022, 14, 458. [Google Scholar] [CrossRef]
- Dai, W.; Qian, W.; Liu, A.; Wang, C.; Yang, X.; Hu, G.; Tang, G. Monitoring and modeling sediment transport in space in small loess catchments using UAV-SfM photogrammetry. Catena 2022, 214, 106244. [Google Scholar] [CrossRef]
- Pagán, J.I.; Bañón, L.; López, I.; Bañón, C.; Aragonés, L. Monitoring the dune-beach system of Guardamar del Segura (Spain) using UAV, SfM and GIS techniques. Sci. Total Environ. 2019, 687, 1034–1045. [Google Scholar] [CrossRef]
- Bañón, L.; Pagán, J.I.; López, I.; Banon, C.; Aragonés, L. Validating UAS-Based Photogrammetry with Traditional Topographic Methods for Surveying Dune Ecosystems in the Spanish Mediterranean Coast. J. Mar. Sci. Eng. 2019, 7, 297. [Google Scholar] [CrossRef]
- Huang, Z.-C.; Yeh, C.-Y.; Tseng, K.-H.; Hsu, W.-Y. A UAV–RTK Lidar System for Wave and Tide Measurements in Coastal Zones. J. Atmos. Ocean. Technol. 2018, 35, 1557–1570. [Google Scholar] [CrossRef]
- Jaud, M.; Letortu, P.; Théry, C.; Grandjean, P.; Costa, S.; Maquaire, O.; Davidson, R.; Le Dantec, N. UAV survey of a coastal cliff face—Selection of the best imaging angle. Measurement 2019, 139, 10–20. [Google Scholar] [CrossRef]
- Alevizos, E.; Oikonomou, D.; Argyriou, A.V.; Alexakis, D.D. Fusion of Drone-Based RGB and Multi-Spectral Imagery for Shallow Water Bathymetry Inversion. Remote Sens. 2022, 14, 1127. [Google Scholar] [CrossRef]
- Alevizos, E.; Nicodemou, V.C.; Makris, A.; Oikonomidis, I.; Roussos, A.; Alexakis, D.D. Integration of Photogrammetric and Spectral Techniques for Advanced Drone-Based Bathymetry Retrieval Using a Deep Learning Approach. Remote Sens. 2022, 14, 4160. [Google Scholar] [CrossRef]
- Casella, E.; Collin, A.; Harris, D.; Ferse, S.; Bejarano, S.; Parravicini, V.; Hench, J.L.; Rovere, A. Mapping coral reefs using consumer-grade drones and structure from motion photogrammetry techniques. Coral Reefs 2017, 36, 269–275. [Google Scholar] [CrossRef]
- Ramnath, V.; Feygels, V.; Kalluri, H.; Smith, B. CZMIL (Coastal Zone Mapping and Imaging Lidar) bathymetric performance in diverse littoral zones. In Proceedings of the OCEANS 2015—MTS/IEEE, Washington, DC, USA, 19–22 October 2015; pp. 1–10. [Google Scholar] [CrossRef]
- Jessin, J.; Heinzlef, C.; Long, N.; Serre, D. A Systematic Review of UAVs for Island Coastal Environment and Risk Monitoring: Towards a Resilience Assessment. Drones 2023, 7, 206. [Google Scholar] [CrossRef]
- Agrafiotis, P.; Karantzalos, K.; Georgopoulos, A.; Skarlatos, D. Correcting Image Refraction: Towards Accurate Aerial Image-Based Bathymetry Mapping in Shallow Waters. Remote Sens. 2020, 12, 322. [Google Scholar] [CrossRef]
- Kum, B.-C.; Shin, D.-H.; Jang, S.; Lee, S.Y.; Lee, J.H.; Moh, T.; Lim, D.G.; Do, J.-D.; Cho, J.H. Application of Unmanned Surface Vehicles in Coastal Environments: Bathymetric Survey using a Multibeam Echosounder. J. Coast. Res. 2020, 95, 1152–1156. [Google Scholar] [CrossRef]
- Cao, B.; Gao, Z.; Shang, W. Methodology for fine-scale seamless elevation model construction using unoccupied aerial and surface vehicles. Estuar. Coast. Shelf Sci. 2023, 282, 108229. [Google Scholar] [CrossRef]
- Specht, C.; Lewicka, O.; Specht, M.; Dąbrowski, P.; Burdziakowski, P. Methodology for Carrying out Measurements of the Tombolo Geomorphic Landform Using Unmanned Aerial and Surface Vehicles near Sopot Pier, Poland. J. Mar. Sci. Eng. 2020, 8, 384. [Google Scholar] [CrossRef]
- Puertos del Estado. Clima medio de oleaje, Nodo SIMAR 2077097. Available online: https://bancodatos.puertos.es/BD/informes/medios/MED_1_8_2077097.pdf (accessed on 1 May 2025).
- Puertos del Estado. Clima medio de viento, Nodo SIMAR 2077097. Available online: https://bancodatos.puertos.es/BD/informes/medios/MED_3_8_2077097.pdf (accessed on 1 May 2025).
- Specht, C.; Śliwińska, D. Hydrographic Inspection Using a USV of a Harbour Bottom Deepened by the Periodic Actuation of SAR Vessel Propellers. Remote Sens. 2024, 16, 2522. [Google Scholar] [CrossRef]
- Jaud, M.; Grasso, F.; Le Dantec, N.; Verney, R.; Delacourt, C.; Ammann, J.; Deloffre, J.; Grandjean, P. Potential of UAVs for Monitoring Mudflat Morphodynamics (Application to the Seine Estuary, France). ISPRS Int. J. Geo-Inf. 2016, 5, 50. [Google Scholar] [CrossRef]
- Otero, V.; Van De Kerchove, R.; Satyanarayana, B.; Martínez-Espinosa, C.; Fisol, M.A.B.; Ibrahim, M.R.B.; Sulong, I.; Mohd-Lokman, H.; Lucas, R.; Dahdouh-Guebas, F. Managing mangrove forests from the sky: Forest inventory using field data and Unmanned Aerial Vehicle (UAV) imagery in the Matang Mangrove Forest Reserve, peninsular Malaysia. For. Ecol. Manag. 2018, 411, 35–45. [Google Scholar] [CrossRef]
- Cousineau, J.; Murphy, E. Numerical Investigation of Climate Change Effects on Storm Surges and Extreme Waves on Canada’s Pacific Coast. Atmosphere 2022, 13, 311. [Google Scholar] [CrossRef]
- Brodie, K.L.; Palmsten, M.L.; Hesser, T.J.; Dickhudt, P.J.; Raubenheimer, B.; Ladner, H.; Elgar, S. Evaluation of video-based linear depth inversion performance and applications using altimeters and hydrographic surveys in a wide range of environmental conditions. Coast. Eng. 2018, 136, 147–160. [Google Scholar] [CrossRef]
- Francis, H.; Traykovski, P. Development of a Highly Portable Unmanned Surface Vehicle for Surf Zone Bathymetric Surveying. J. Coast. Res. 2021, 37, 933–945. [Google Scholar] [CrossRef]
- Grządziel, A. Method of Time Estimation for the Bathymetric Surveys Conducted with a Multi-Beam Echosounder System. Appl. Sci. 2023, 13, 10139. [Google Scholar] [CrossRef]
- Risbøl, O.; Gustavsen, L. LiDAR from drones employed for mapping archaeology—Potential, benefits and challenges. Archaeol. Prospect. 2018, 25, 329–338. [Google Scholar] [CrossRef]
Disclaimer/Publisher’s Note: The statements, opinions and data contained in all publications are solely those of the individual author(s) and contributor(s) and not of MDPI and/or the editor(s). MDPI and/or the editor(s) disclaim responsibility for any injury to people or property resulting from any ideas, methods, instructions or products referred to in the content. |
© 2025 by the authors. Licensee MDPI, Basel, Switzerland. This article is an open access article distributed under the terms and conditions of the Creative Commons Attribution (CC BY) license (https://creativecommons.org/licenses/by/4.0/).