Article

Challenges Related to Seabed Soil Conditions in Offshore Engineering in China: Findings from Site Investigations

1
POWERCHINA Huadong Engineering Co., Ltd., Hangzhou 311122, China
2
College of Marine Science and Technology, China University of Geosciences, 388 Lumo Road, Wuhan 430074, China
3
Hubei Key Laboratory of Marine Geological Resources, China University of Geosciences, 388 Lumo Road, Wuhan 430074, China
4
Yajiang Clean Energy Science and Technology Research (Beijing) Co., Ltd., 1 Yuyuantan South Road, Haidian District, Beijing 100038, China
5
POWERCHINA Beijing Engineering Co., Ltd., Beijing 100024, China
*
Author to whom correspondence should be addressed.
J. Mar. Sci. Eng. 2025, 13(10), 1893; https://doi.org/10.3390/jmse13101893
Submission received: 16 June 2025 / Revised: 11 September 2025 / Accepted: 16 September 2025 / Published: 2 October 2025
(This article belongs to the Special Issue Submarine Unfavorable Geology and Geological Disasters)

Abstract

Seabed-related issues are common in offshore areas. This poses significant challenges for the design and construction of offshore engineering projects. Under unfavourable seabed soil conditions, foundations may fail to meet the load-bearing capacity requirements, resulting in severe settlement and tilting and, ultimately, the failure of offshore structures. Despite the critical nature of these challenges, a comprehensive literature review for the identification and risk analysis of various unfavourable seabed soil conditions is currently lacking. This paper provides an overview of five key challenges related to seabed soil conditions in China, namely thick, soft mud layers; shallow gas and pockmarks; sand liquefaction; dense sand layers; and boulder stones. The formation mechanisms, distribution areas and engineering characteristics of these conditions are discussed in detail, integrating insights from previous research. Data from site investigations of real-world offshore engineering projects are presented, based on which risk assessment is conducted. This study not only enhances our understanding of the identification, distribution and hazards associated with various unfavourable seabed soil conditions in offshore engineering but also offers guidance on utilizing investigation data for effective risk assessment.

1. Introduction

With the intensive development and comprehensive utilization of marine resources, such as methane hydrate, tidal energy and wind energy, offshore engineering activities are thriving in China. These existing offshore engineering projects are mainly located at shallow waters (less than 100 m in depth) on the continental shelf, such as offshore wind farms and natural gas exploration and production platforms [1,2,3,4]. Taking offshore wind farms as an example, China has put 160 offshore wind farms into operation, including nearly 7000 offshore wind turbines. These farms have a cumulative installed capacity of 37.69 GW, accounting for nearly 50% of the global cumulative offshore wind capacity [5]. Offshore infrastructure typically consists of a superstructure with functional equipment and an underlying foundation system that supports the superstructure. The offshore foundation system primarily includes gravity base, monopile, tripod types for shallow-water fixed structures and suction bucket and anchor types for deep-sea floating structures [6,7,8]. Other professional institutions have also established detailed guidelines for such foundational design principles [9].
The superstructure is primarily subjected to gravity, wind, seismic, wave and current loads, which are ultimately transferred to the foundation and the seabed soil. The routine design of offshore foundations, such as determining size, pile–soil response, critical displacement and rotation angles, penetration depth and scouring prediction, generally follows the following guidelines: ISO 19901-4:2003, API RP 2A-WSD:2014, DNV-OS-J101:2014 and NEA NB\T 10105-2018 [10,11,12,13]. These codes are primarily concerned with ensuring adequate vertical and horizontal bearing capacity. Recently, new ‘failure envelope’ design approaches were developed to consider the combined effects of vertical and horizontal loads, along with moments [14,15]. The improper design of the foundation would lead to excessive displacement and rotation under adverse conditions (e.g., wind loads, wave loads and submarine geohazards), and the cumulative deformation eventually may result in instability or even the collapse of the whole structure. For example, in 2002, a jack-up platform in the Khafji oil field in Saudi Arabia experienced a ‘punch-through’ failure at a location where a dense sand layer was underlain by a soft clay layer [16].
The bearing capacity of a foundation is governed by seabed soil conditions, which constitute soil type, mechanical properties and stratigraphic profile—factors of paramount importance in the feasibility design phase. To obtain accurate data of the seabed soil conditions, offshore geotechnical site investigations are conducted, including offshore drilling, seafloor sampling, in situ testing and laboratory soil testing, performed both offshore and onshore (Figure 1) [17,18,19]. Soil samples retrieved during drilling and sampling allow for the identification of soil types and the measurement of their physical properties. The cone penetration test with pore pressure measurements (CPTU) and the shear vane test are the two most commonly adopted in situ tests to obtain the shear strength of seabed soils [20,21]. Offshore geophysical methods could significantly complement the geotechnical techniques as they are more cost-effective and convenient [22,23,24]; however, they are out of the scope of this study due to the limitation of space.
Site investigations are critical for detecting seabed geohazards that either currently jeopardize offshore infrastructure or have the potential to evolve into significant, uncontrolled risks. This paper presents various adverse seabed soil conditions, which were encountered from marine geotechnical investigations in realistic offshore engineering practices in China waters. These adverse seabed soil conditions include thick, soft mud layers; shallow gas and pockmarks; sand liquefaction; dense sand layers; and boulder stones. The potential challenges of foundation stability are also described from a design perspective, for which the feasible countermeasures are discussed.

2. Investigation Areas

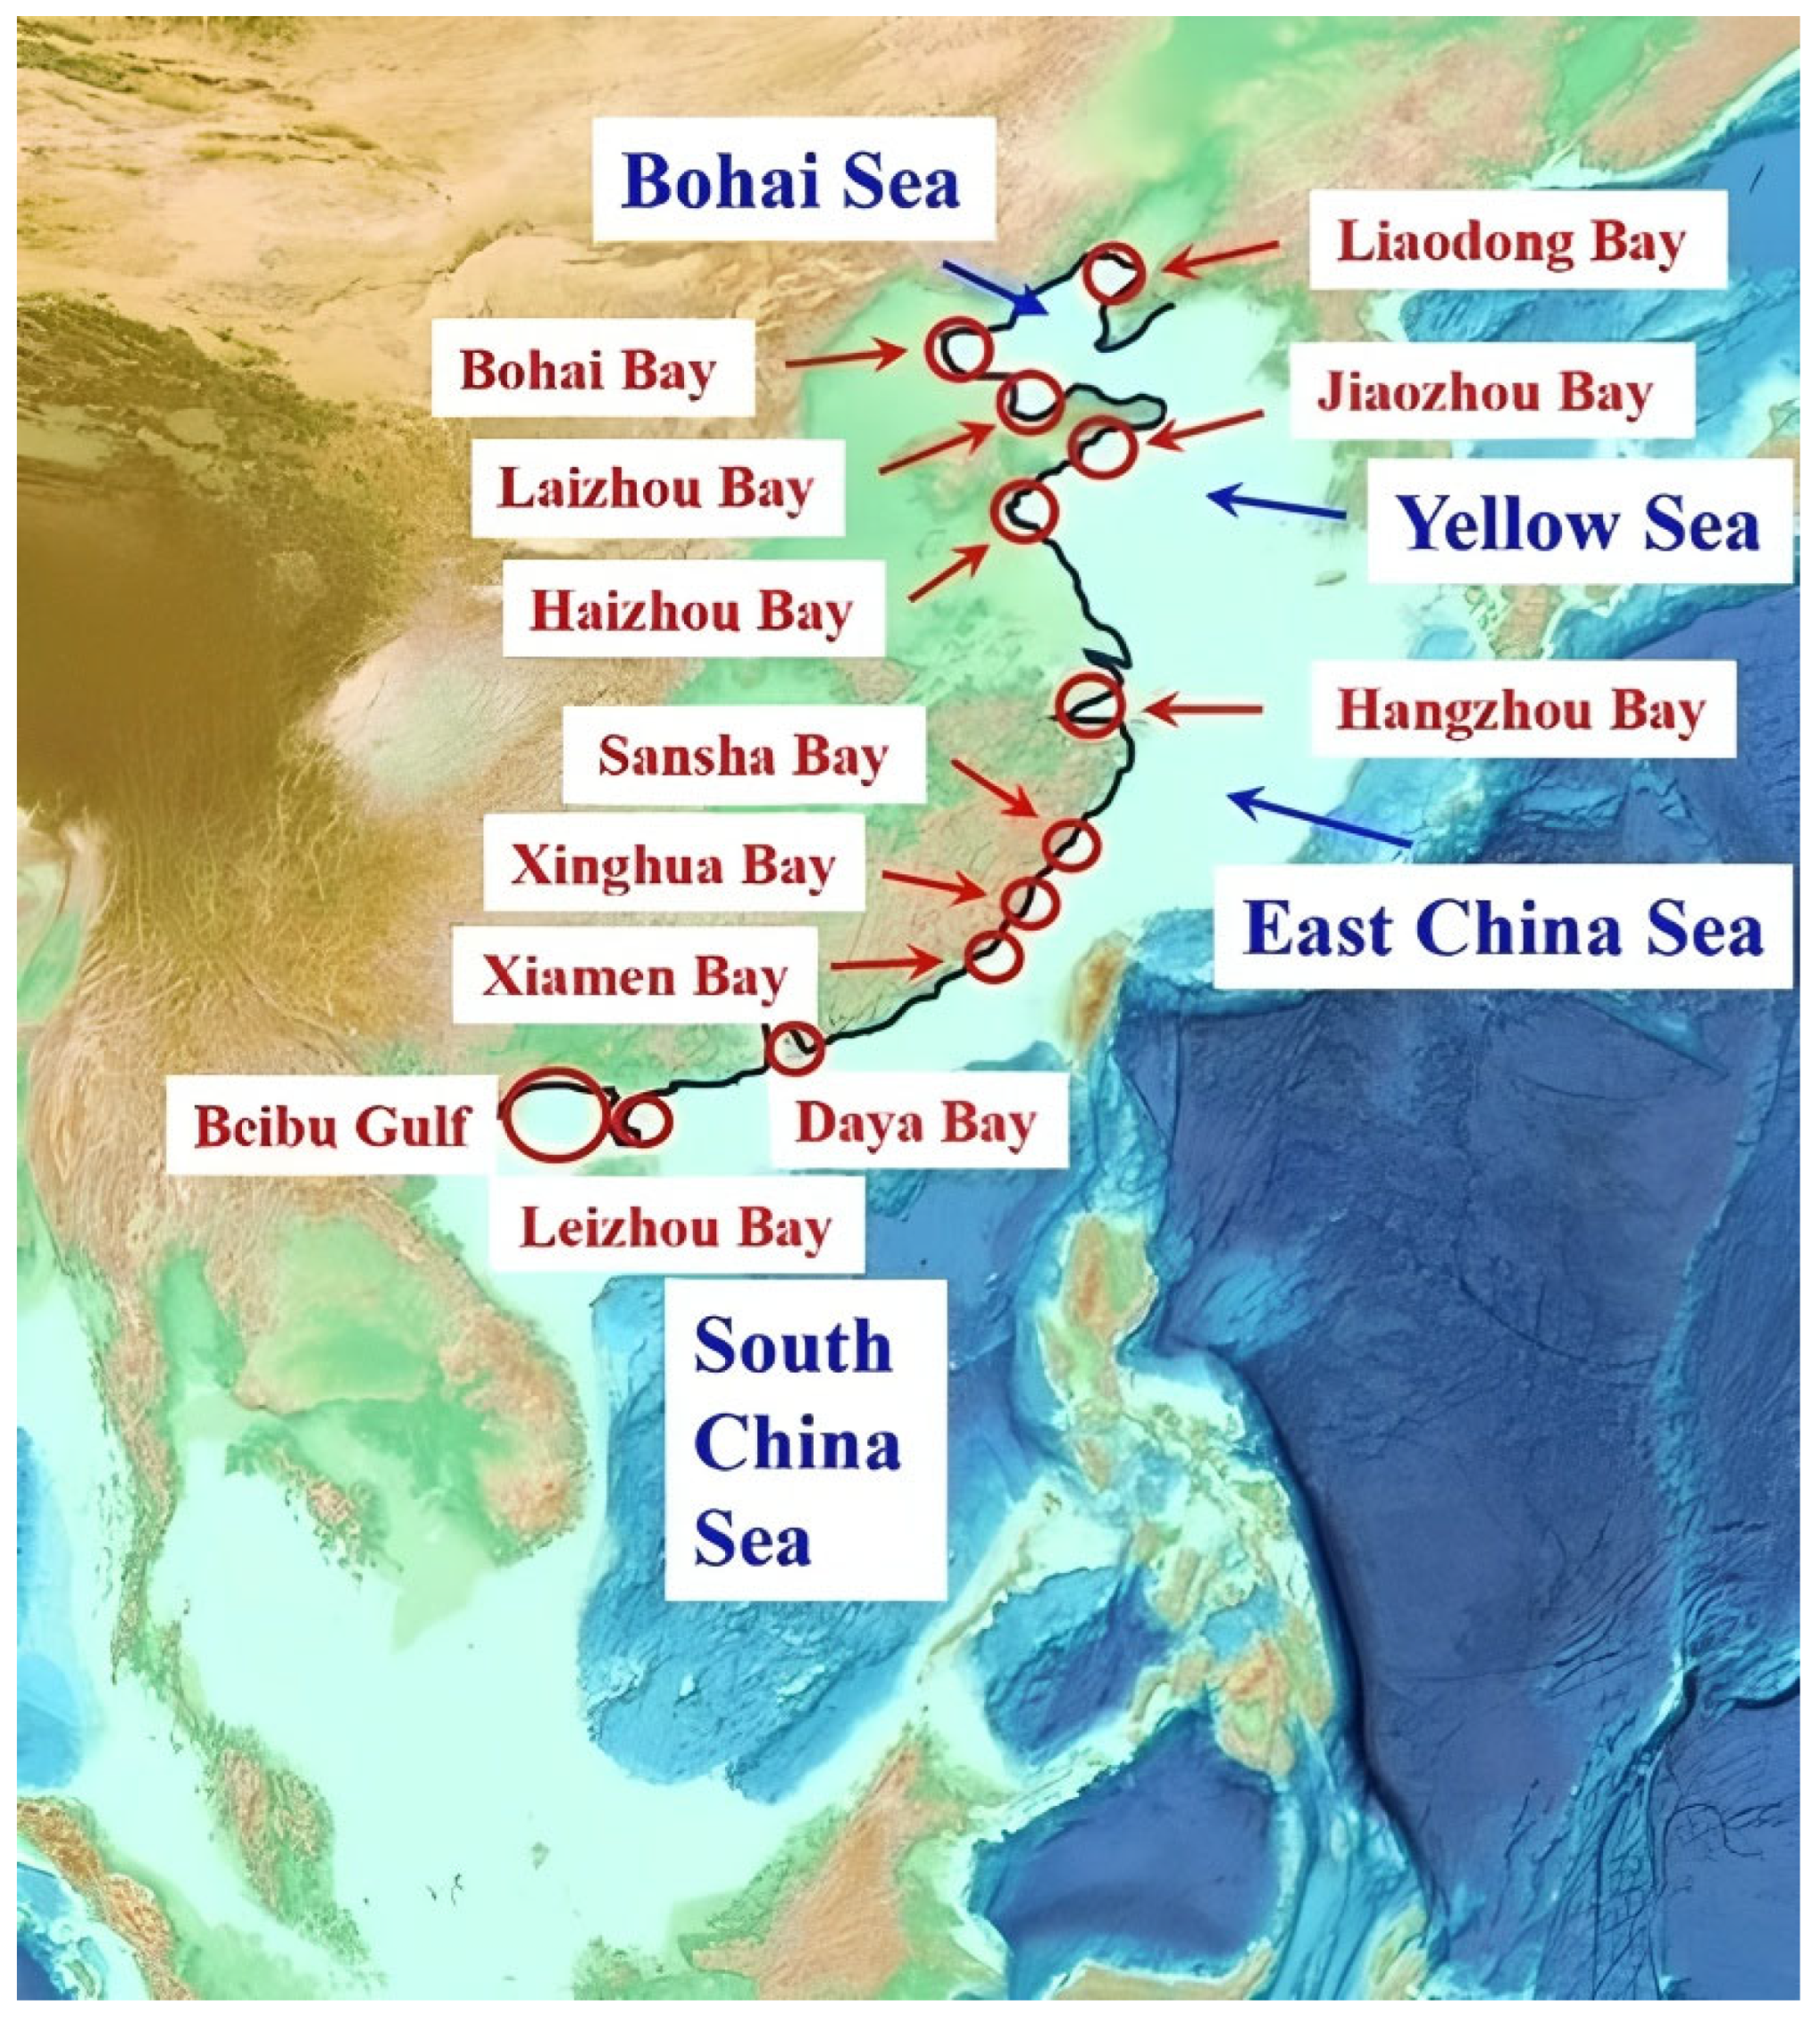
The Chinese mainland is surrounded by four seas that span approximately 4.7 million km2 and located in the following areas: the Bohai Sea, the Yellow Sea, the East China Sea and the South China Sea (Figure 2). The sediments in these seas originate from the inputs (480 Mt/year) of land-based materials carried by the Yangtze River, the Yellow River, the Haihe River, the Pearl River and the Songhua River. Notably, the Yangtze River and the Yellow River account for 70% of the total sediment input. The spatial distribution of surface sediment components, classified by grain size, is depicted for China’s coastal waters. The categories of sand, silt and clay follow the classification scheme established by [25].

2.1. Bohai Sea

The Bohai Sea, situated between 37°07′–41°00′ N and 117°35′–121°10′ E, has a total area of approximately 77,000 km2. It is a semi-enclosed shelf sea bounded by the Shandong Peninsula, the Liaodong Peninsula and the North China Plain, and connects to the Yellow Sea via the Bohai Strait to the east [26]. The seafloor is generally flat and slopes gently toward the Bohai Strait [27]. With an average depth of about 18 m, the deepest area is the Lao Tieshan Channel, reaching 86 m. Tides in the region are predominantly semi-diurnal, with a range of 1–3 m [28]. The highest tidal range, about 2.7 m, is around the Liaodong Bay while the lowest, around 0.8 m, is near Qinhuangdao. Tidal currents generally range from 50 to 100 cm/s, with the strongest tidal currents between 150 and 200 cm/s, found near the Laotieshan Waterway. The Liao River, the Hai River and the Yellow River deposit abundant sediments (1300 Mt/year) into the Bohai Sea. The composition of the sediments varies across the region, with the Bohai Bay dominated by clayey and silty mud, the Liaodong Bay by silty and fine sand, the Laizhou Bay by silty sand and the central Bohai Sea by fine sand.
Laizhou Bay
Laizhou Bay, situated in the southern Bohai Sea, has a total area of approximately 6967 km2 and a coastline stretching 319.1 km. Its average depth is under 10 m, while the maximum depth reaches 18 m [29,30]. The bay has a gently flat seabed and is characterized as a typical low-tidal bay with an average tidal range of 1 m [31,32]. With maximum tidal currents ranging from 100 to 150 cm/s, the western side of the bay experiences a normal semi-diurnal tide; the eastern side of it experiences an irregular semi-diurnal tidal with maximum tidal currents between 50 and 100 cm/s. The major sources of the sediments in the Laizhou Bay are the Yellow River, the Xiaoqing River and the Mia River, as well as the Bailang River. Particularly, the Yellow River is the most significant contributor, and it plays a crucial role in the formation of the Yellow River Delta [33]. The surface soil of the Laizhou Bay consists of silty clay (60.28%), silt (11.06%), muck (15.56%) and clay (12.67%). The yellow river mouth mainly consists of the muck in the northern and southern sides, and the Laizhou Shoal is composed of silt and clay. The remaining areas are characterized by mucky clay.

2.2. Yellow Sea

The Yellow Sea is a semi-enclosed shallow marginal sea of the Pacific Ocean, covering an area of 380,000 km2 with dimensions of approximately 870 km in length and 556 km in width. It has an average depth of around 44 m and a maximum depth of 140 m [34,35]. The seafloor slopes gently toward the central and southeastern regions. Tides in the area are primarily regular semi-diurnal [36], with tidal ranges of 2–4 m on the western side and 4–8 m on the eastern side. Sediment supply to the Yellow Sea is largely contributed by major rivers such as the Yalu, Datong, Han and Huai Rivers. The seabed sediments consist mainly of clayey silt and sandy silt [37]. Silt deposits are distributed along the coasts of the Shandong Peninsula, the central mud zone of the South Yellow Sea, and the offshore mud area near the Yangtze River estuary. Sandy sediments are found off the southern Shandong Peninsula, the northern Jiangsu shoal and the eastern North Yellow Sea, while clay concentrations are limited to the northern part of the central South Yellow Sea.
Western coast of the South Yellow Sea
The South Yellow Sea covers an area of 280,000 km2, with a length of 750 km and a width of 550 km [38]. The western South Yellow Sea can be divided into four distinct regions from north to south, including the area adjacent to the Shandong Peninsula [39,40], the Haizhou Bay area, the Old Yellow River delta [41] and the Radial Sand Ridge Field (RSRF) [42]. The western region of the South Yellow Sea has an average water depth of under 46 m, with the deepest point reaching 80 m at the trough of Chengshanjiao [43]. Although there are more than 8 m tidal bands in the RSRF, the total tidal range in the western coast of the South Yellow Sea is typically low, ranging from 2 to 4 m [44]. Within the RSRF, strong tidal currents and waves frequently cause the merging and elongation of sand ridges. The Yangtze and Yellow rivers are the primary sources of the sediments in the South Yellow Sea. The Shandong Peninsula and the Old Yellow River delta are dominated by clayed silt while the Haizhou Bay area and the RSRF are characterized by silty sand and sand, respectively.

2.3. East China Sea

The eastern China Sea is classified as the western Pacific Ocean’s marginal sea. It has an area of 770,000 km2 with an average depth of 349 m and a maximum depth of 2719 m [45,46]. The East China Sea exhibits a well-developed trench–arc–basin system resulting from the subduction of the Pacific Plate beneath the Eurasian Plate, characterized by the coexistence of extensive marginal basins and deep oceanic trenches. The western section of the sea, which spans approximately 1300 km in length and 740 km in width, comprises a broad and relatively flat continental shelf with an average gradient of 4′17′′. Semi-diurnal tides are predominant across the region [47,48], with tidal ranges generally decreasing from west to east. The maximum tidal range occurs in Hangzhou Bay, where it can reach up to 10.18 m. The strongest tidal currents are observed at the Yangtze River mouth, the Hangzhou Bay and the Zhoushan Islands, with velocities reaching up to 3 m/s [49]. The sediments in the East China Sea are primarily derived from terrestrial sources, including the Yangtze, Qiantang, Oujiang, Minjiang and Jiulong Rivers, with a combined annual input of approximately 2.5 million tons. Notably, the Yangtze River alone accounts for over 50% of this total sediment supply. The broad central and outer shelves are predominantly characterized by sandy deposits, while the inner shelf is dominated by muddy deposits [50]. Prolonged strong hydrodynamic scouring results in sandy sediments that are often coarse-grained and well-sorted, while muddy sediments, mainly formed from terrestrial inputs via modern rivers, are fine-grained and well-graded.
Hangzhou Bay
Hangzhou Bay, which exhibits a distinct funnel-shaped morphology, is located east of the Zhoushan Islands and west of the Qiantang River estuary. It covers an area of 4800 km2, with a width of about 95 km at its mouth [51]. The Hangzhou Bay is divided into two parts, namely, the outer bay extending from Zhapu to mouth and the inner bay located upstream of Zhapu. The outer bay features a relatively flat seafloor with an average depth ranging from 8 to 10 m. In comparison, the inner bay contains a large underwater sandbar extending 130 km in length, where the seabed slopes upward toward the upstream direction [52]. The central part of the bay is characterized by large tide channels and sand ridges [53,54]. The northern shore of Hangzhou Bay forms a major tidal channel, measuring 60 km in length and 20–50 m in depth. In contrast, the southern shore is characterized by extensive shallow tidal flats. Tidal action drives landward sediment transport along the northern bank and seaward transport along the southern bank, leading to deposition in the south and erosion in the north [55,56]. The Hangzhou Bay is a typical macro-tidal estuary with a tidal range of 3–4 m at the mouth and 4–6 m upstream [57]. The maximum tidal range may exceed 10 m, with peak current velocities reaching approximately 3.0 m/s. As one of the three strongest tidal bays in the world, the Hangzhou Bay is characterized by high tides, strong souring, thick and soft mud layers and shallow gas. The sediments in Hangzhou Bay are primarily derived from the Qiantang and Yangtze Rivers, as well as from tidal-induced erosion of the seafloor in the East China Sea [58]. Due to the river inputs and strong tide actions, the sediments in the Hangzhou Bay are mainly clayey sands and silty sands [59].
Fujian offshore area
With 136,000 km2 and 3324 km of coastline, the Fujian waters feature an area of 136,000 km2. The average water depth is about 20 m, with the deepest point reaching 116 m at the Sansha Bay [60,61]. The regional seabed has a relatively steep incline that slopes in a northeast–southwest direction. With the tidal range steadily decreasing towards the south, the Fujian coast is mostly composed of regular semi-diurnal tides. In the north, the average tidal range in the Quanzhou Bay exceeds 4 m [62]. Substantial sediments (20 Mt/year) were added to the Fujian Coast by the Min River, the Jiulong River and the Jinjiang River. The surface soils of the Fujian Coast consist predominantly of clayey silt, muddy clay and mud [63], with muck and mucky clay dominating 90% of the area. In comparison, clayey silt is relatively rare and is typically found in harbours with strong hydrodynamic conditions [64]. Boulders are not rare at short distances along the coast and are often difficult to discern using geophysical techniques.

2.4. South China Sea

The biggest marginal sea in the Western Pacific Ocean is the South China Sea, which is home to about 3,500,000 km2 of land. The sea semi-encloses mainland China, Hainan Island, Taiwan Island and the Philippine Islands. The South China Sea has an average depth of about 1212 m, with a maximum depth of 5559 m [65]. Irregular diurnal tides and a comparatively low tidal range of 2–4 m are the main features of this area. The Beibu Gulf has the greatest tidal range [66] of up to 7 m. With velocities less than 0.5 m/s, the South China Sea has generally weak tidal currents, and the Qiongzhou Strait has the highest current speed of 2.5 cm/s [67]. The Pearl River, Taiwan’s inland waterway, the Red River and the Mekong River are the main sources of the South China Sea. In the shallow-water zone (less than 2000 m in depth), the sediments are primarily composed of silt on the shallow shelf, sand on the shallow outer shelf, clayey silt and silty clay on the land slope semi-deep sea and deep-sea floors and clay on the deep basin. In deep-water regions (exceeding 2000 m in depth), the sediments exhibit distinct deep-sea characteristics, featuring an average grain size finer than 4 μm and a clay content that averages over 50%.
Guangdong offshore area
The coastal waters of Guangdong cover an area of 420,000 km2 and have a coastline stretching 2378 km. From west to east, the region can be divided into three main segments: the Shantou coastal area, the Pearl River estuary and the Leizhou Peninsula. Tidal ranges across Guangdong’s offshore waters are generally small and exhibit a gradual westward increase [68]. Along the Shantou coast, the tidal range is typically under 1 m, while in the Pearl River estuary, the average tidal range is 1–2 m. In the Leizhou Peninsula, the tidal range is the largest, with an average tidal range of 2–2.5 m. The Pearl River, the Han River and the Rong River bring abundant sediments to the Guangdong waters, with the Pearl River as the primary source, contributing 85 Mt/year. The Shantou area is dominated by silty sand, which account for 51% of the sediments [69]. The Pearl River mouth is characterized by sandy silt and fine-grained silt [70]. The Leizhou Peninsula is primarily composed of medium to fine sand with grain sizes smaller than 0.5 mm [71].
Beibu Gulf
The Beibu Gulf is situated in the northwestern South China Sea and has a total area of approximately 130,000 km2. This semi-enclosed bay is bordered by Guangxi Province to the north, Vietnam to the west and Hainan Island to the east. Water depths in the gulf are mostly under 100 m, with an average depth of around 42 m [72]. The Beibu Gulf is dominated by diurnal tides, with the tide range decreasing from the gulf mouth in the north to the South China Sea [73]. The largest tide range, reaching around 4 m, occurs at the Guangxi coast. The sediments in the Beibu Gulf are mainly derived from the inputs (43 Mt/year) of the Red River, the Qin River, the Nanliu River and the Beilun River [74], with the Red River accounting for more than 90% of the total input. The southwestern and central areas of the Beibu Gulf are dominated by sandy silt (35%) and silt (28%), while the eastern and northern areas are dominated by a mixture of muck and sand.

3. Offshore Geological Challenges

3.1. Thick Soft Mud Layers

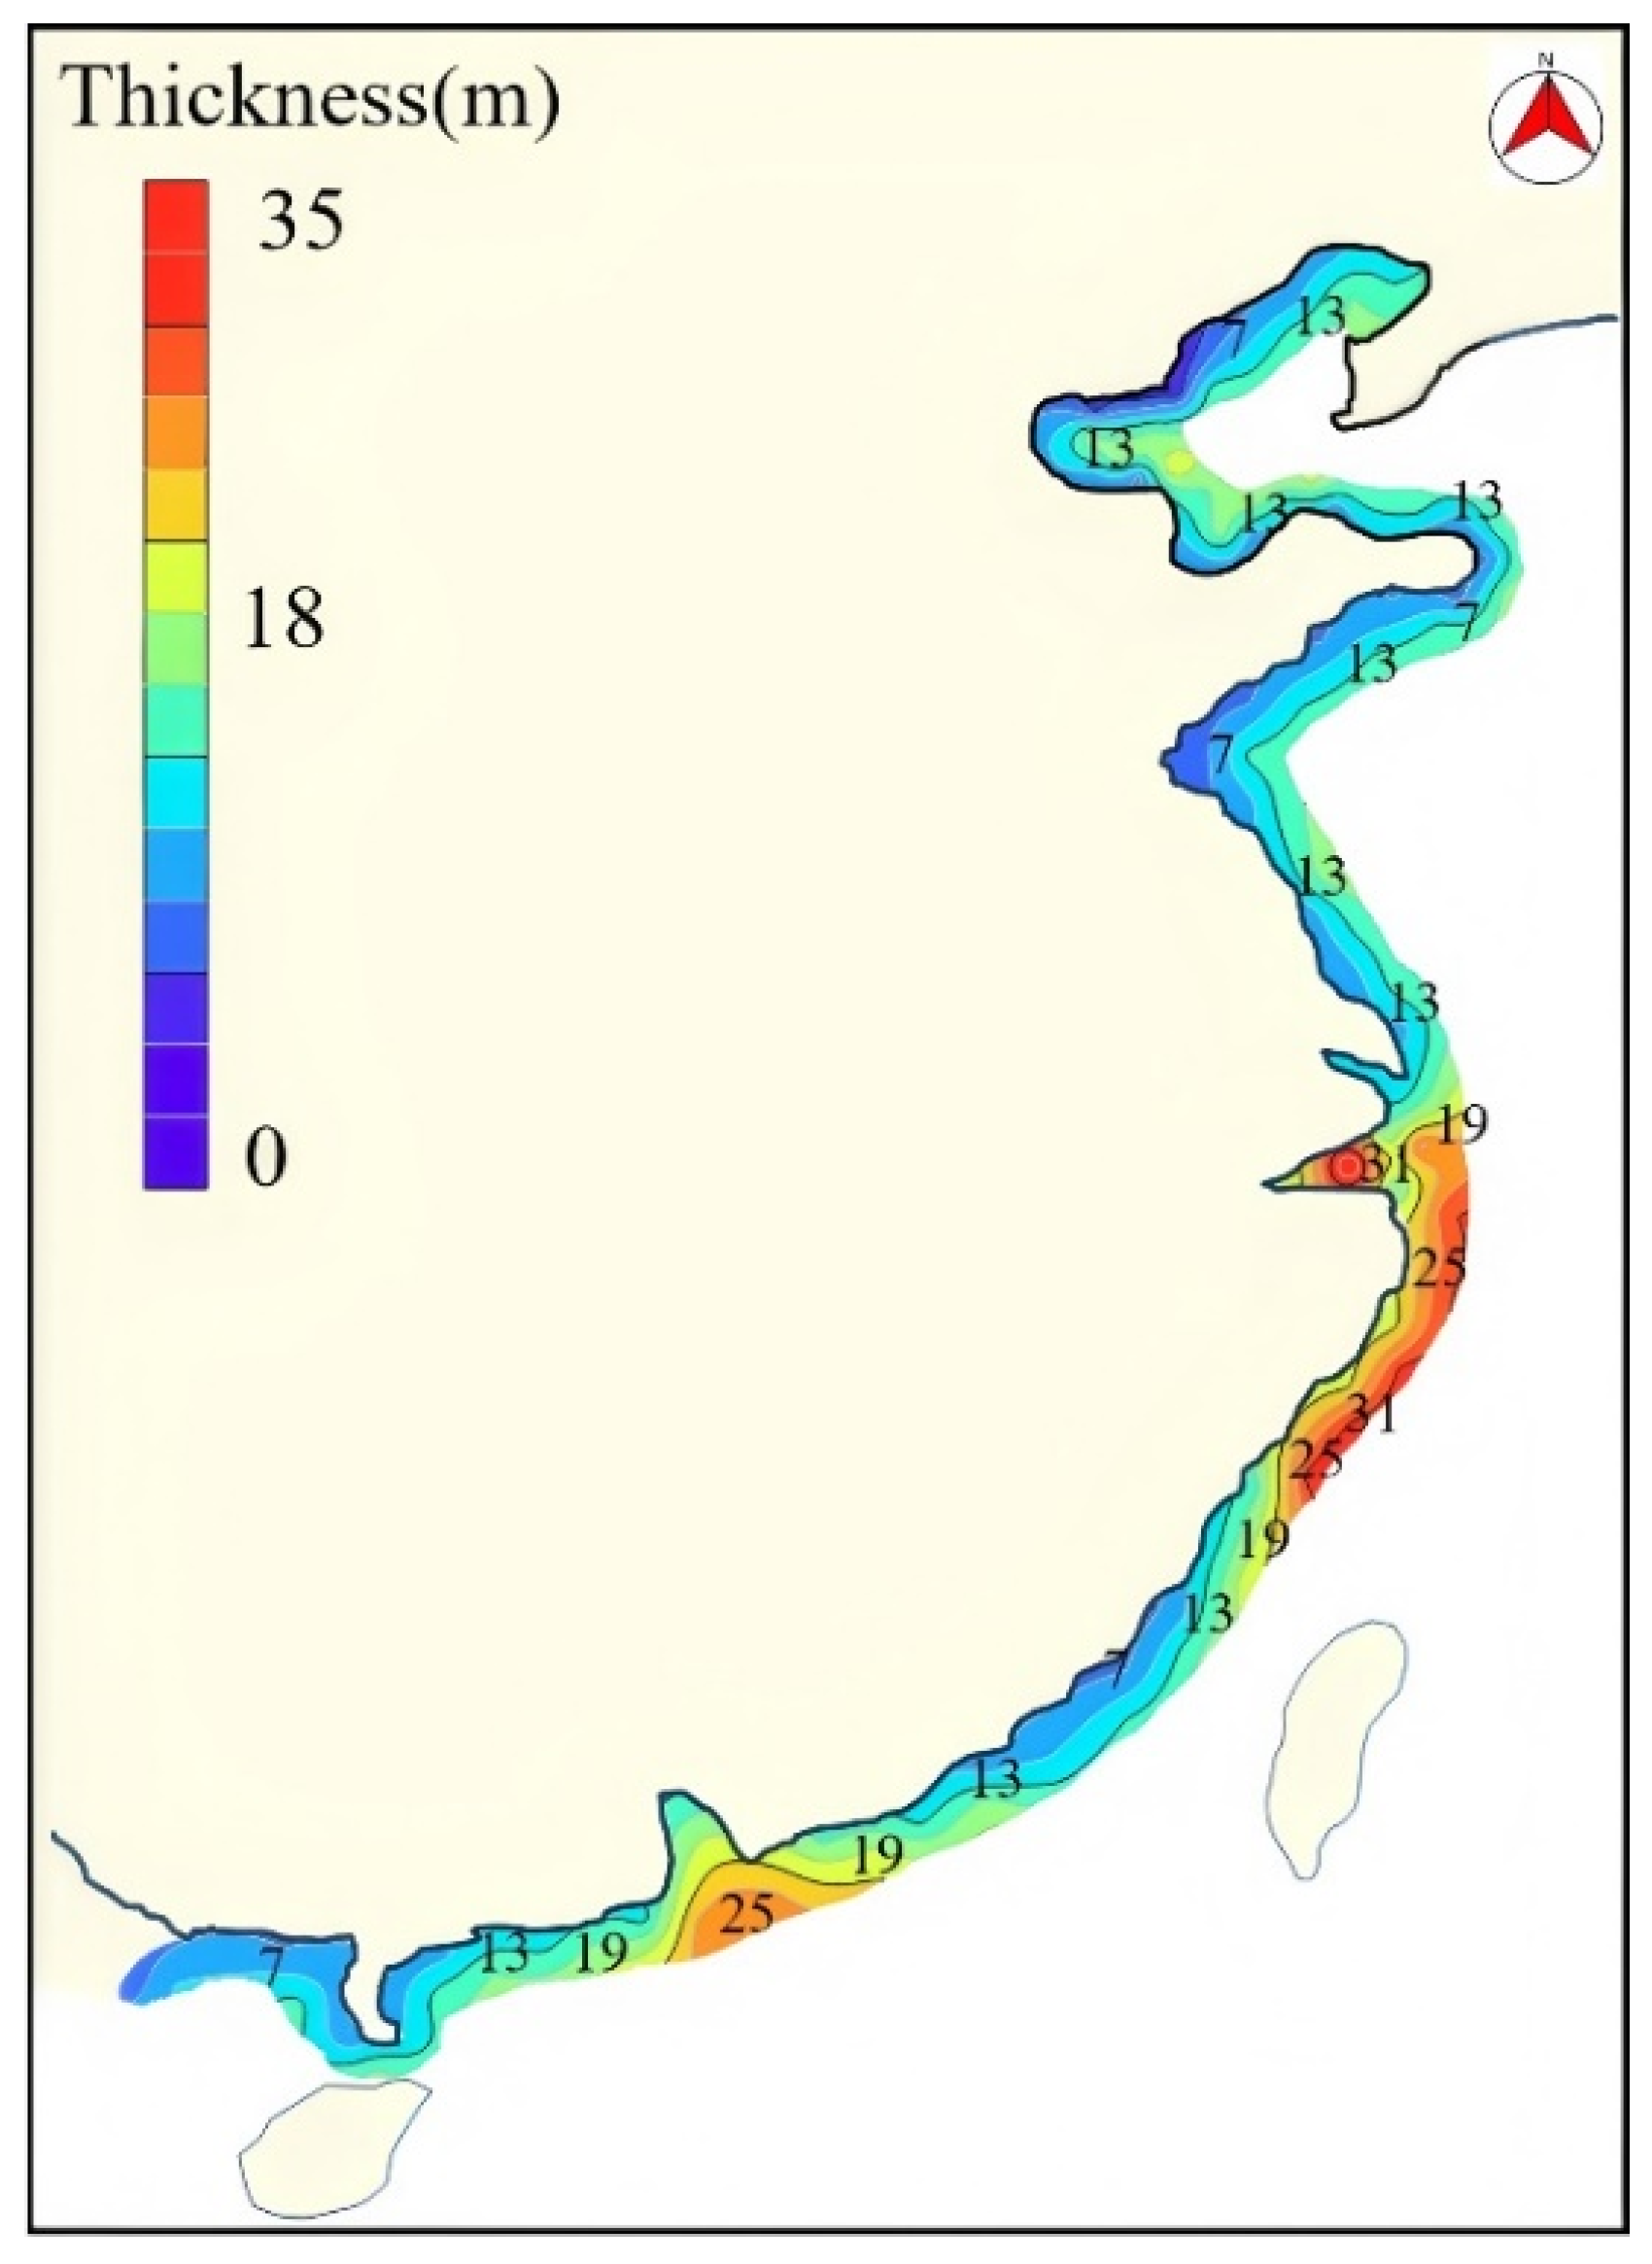
Soft mud layers are defined as layers of marine facies cohesive soils, with low shear strengths (8–50 kPa), low deformation moduli (0.1–2 MPa), high water contents (50–100%), high porosity ratios (1.2–2.3) and sensitive structural properties [75,76]. During transgression–regression cycles, fine materials from deeper waters, including clay, silt, organic matters and minerals, are transported back to the coast by hydraulic forces. Marine facies soft mud layers are eventually formed by the continuous deposition of the fine materials along the coast [77,78]. The formations and distributions of soft mud layers are influenced by various factors, including the supply rate of terrigenous sediments, the hydrodynamic condition and the seabed topography. The compositions of soft mud layers tend to vary. In the near-shore areas, the sediments contain sand, silt and abundant terrigenous materials. In the deeper waters, the sediments contain more clay. In the areas adjacent to a river mouth, the sediments may contain more sand [64]. The total thickness of a soft mud layer generally ranges from 10 m to 30 m along China’s coasts (Figure 3).
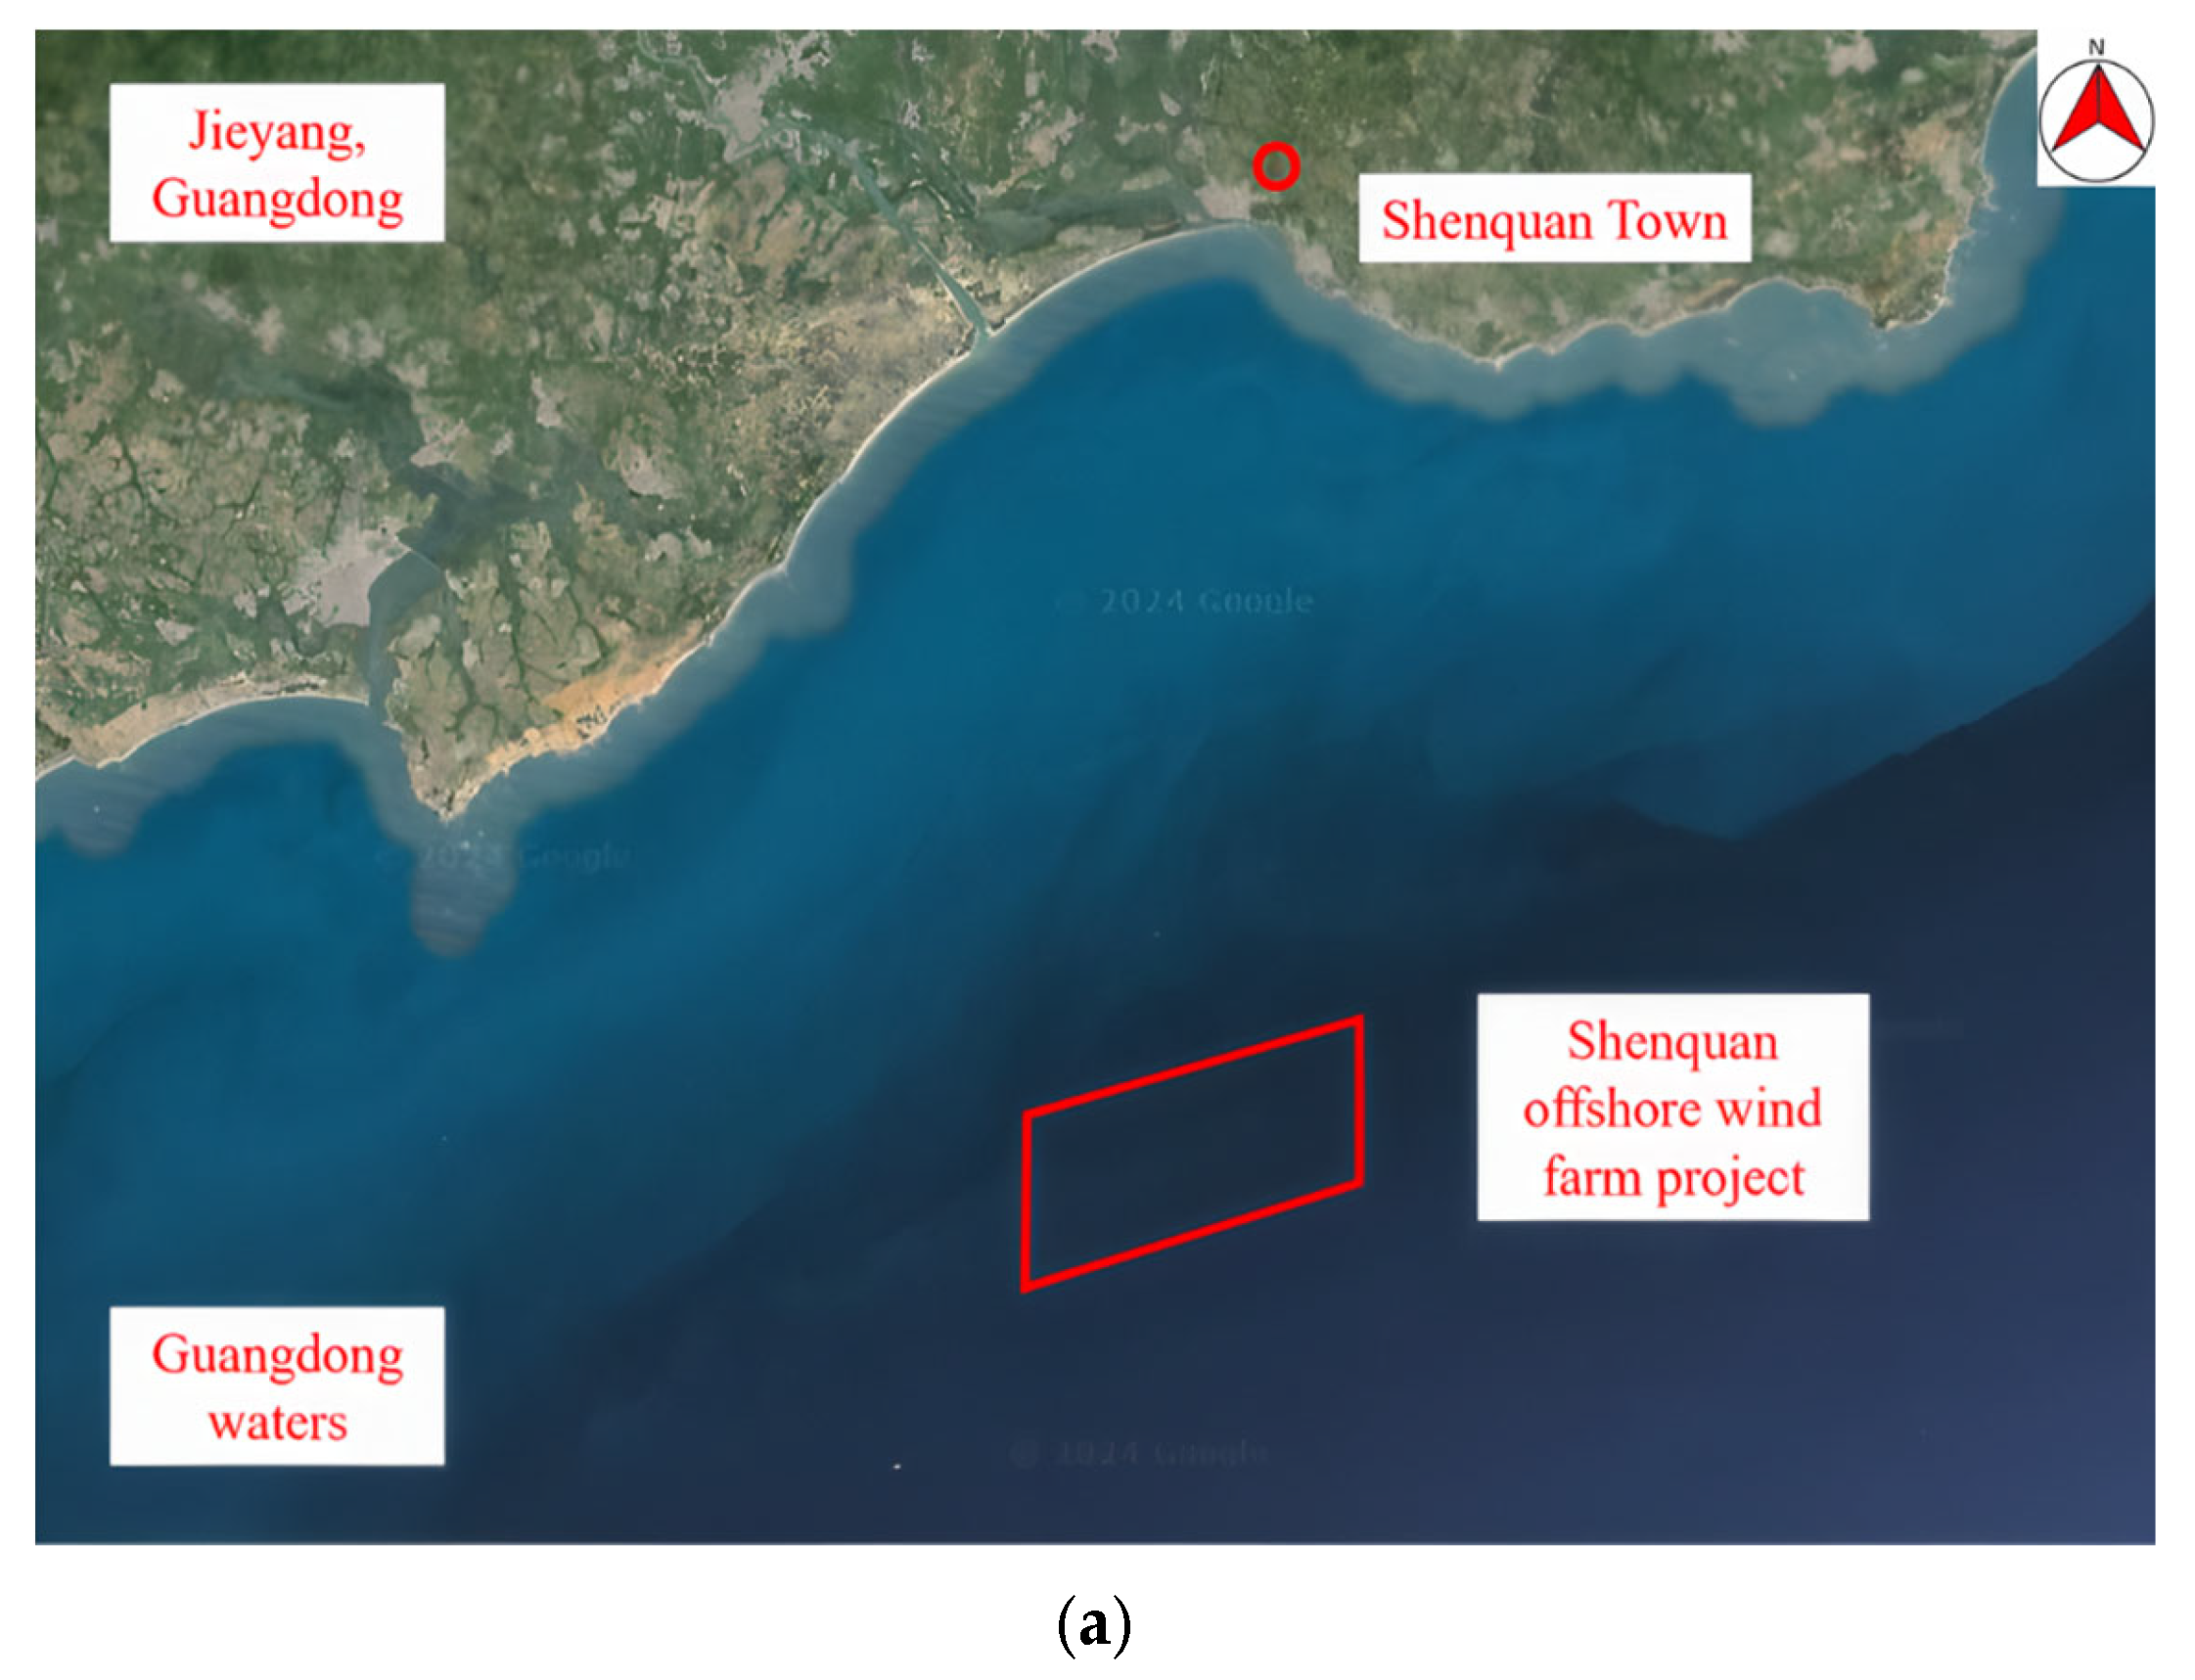
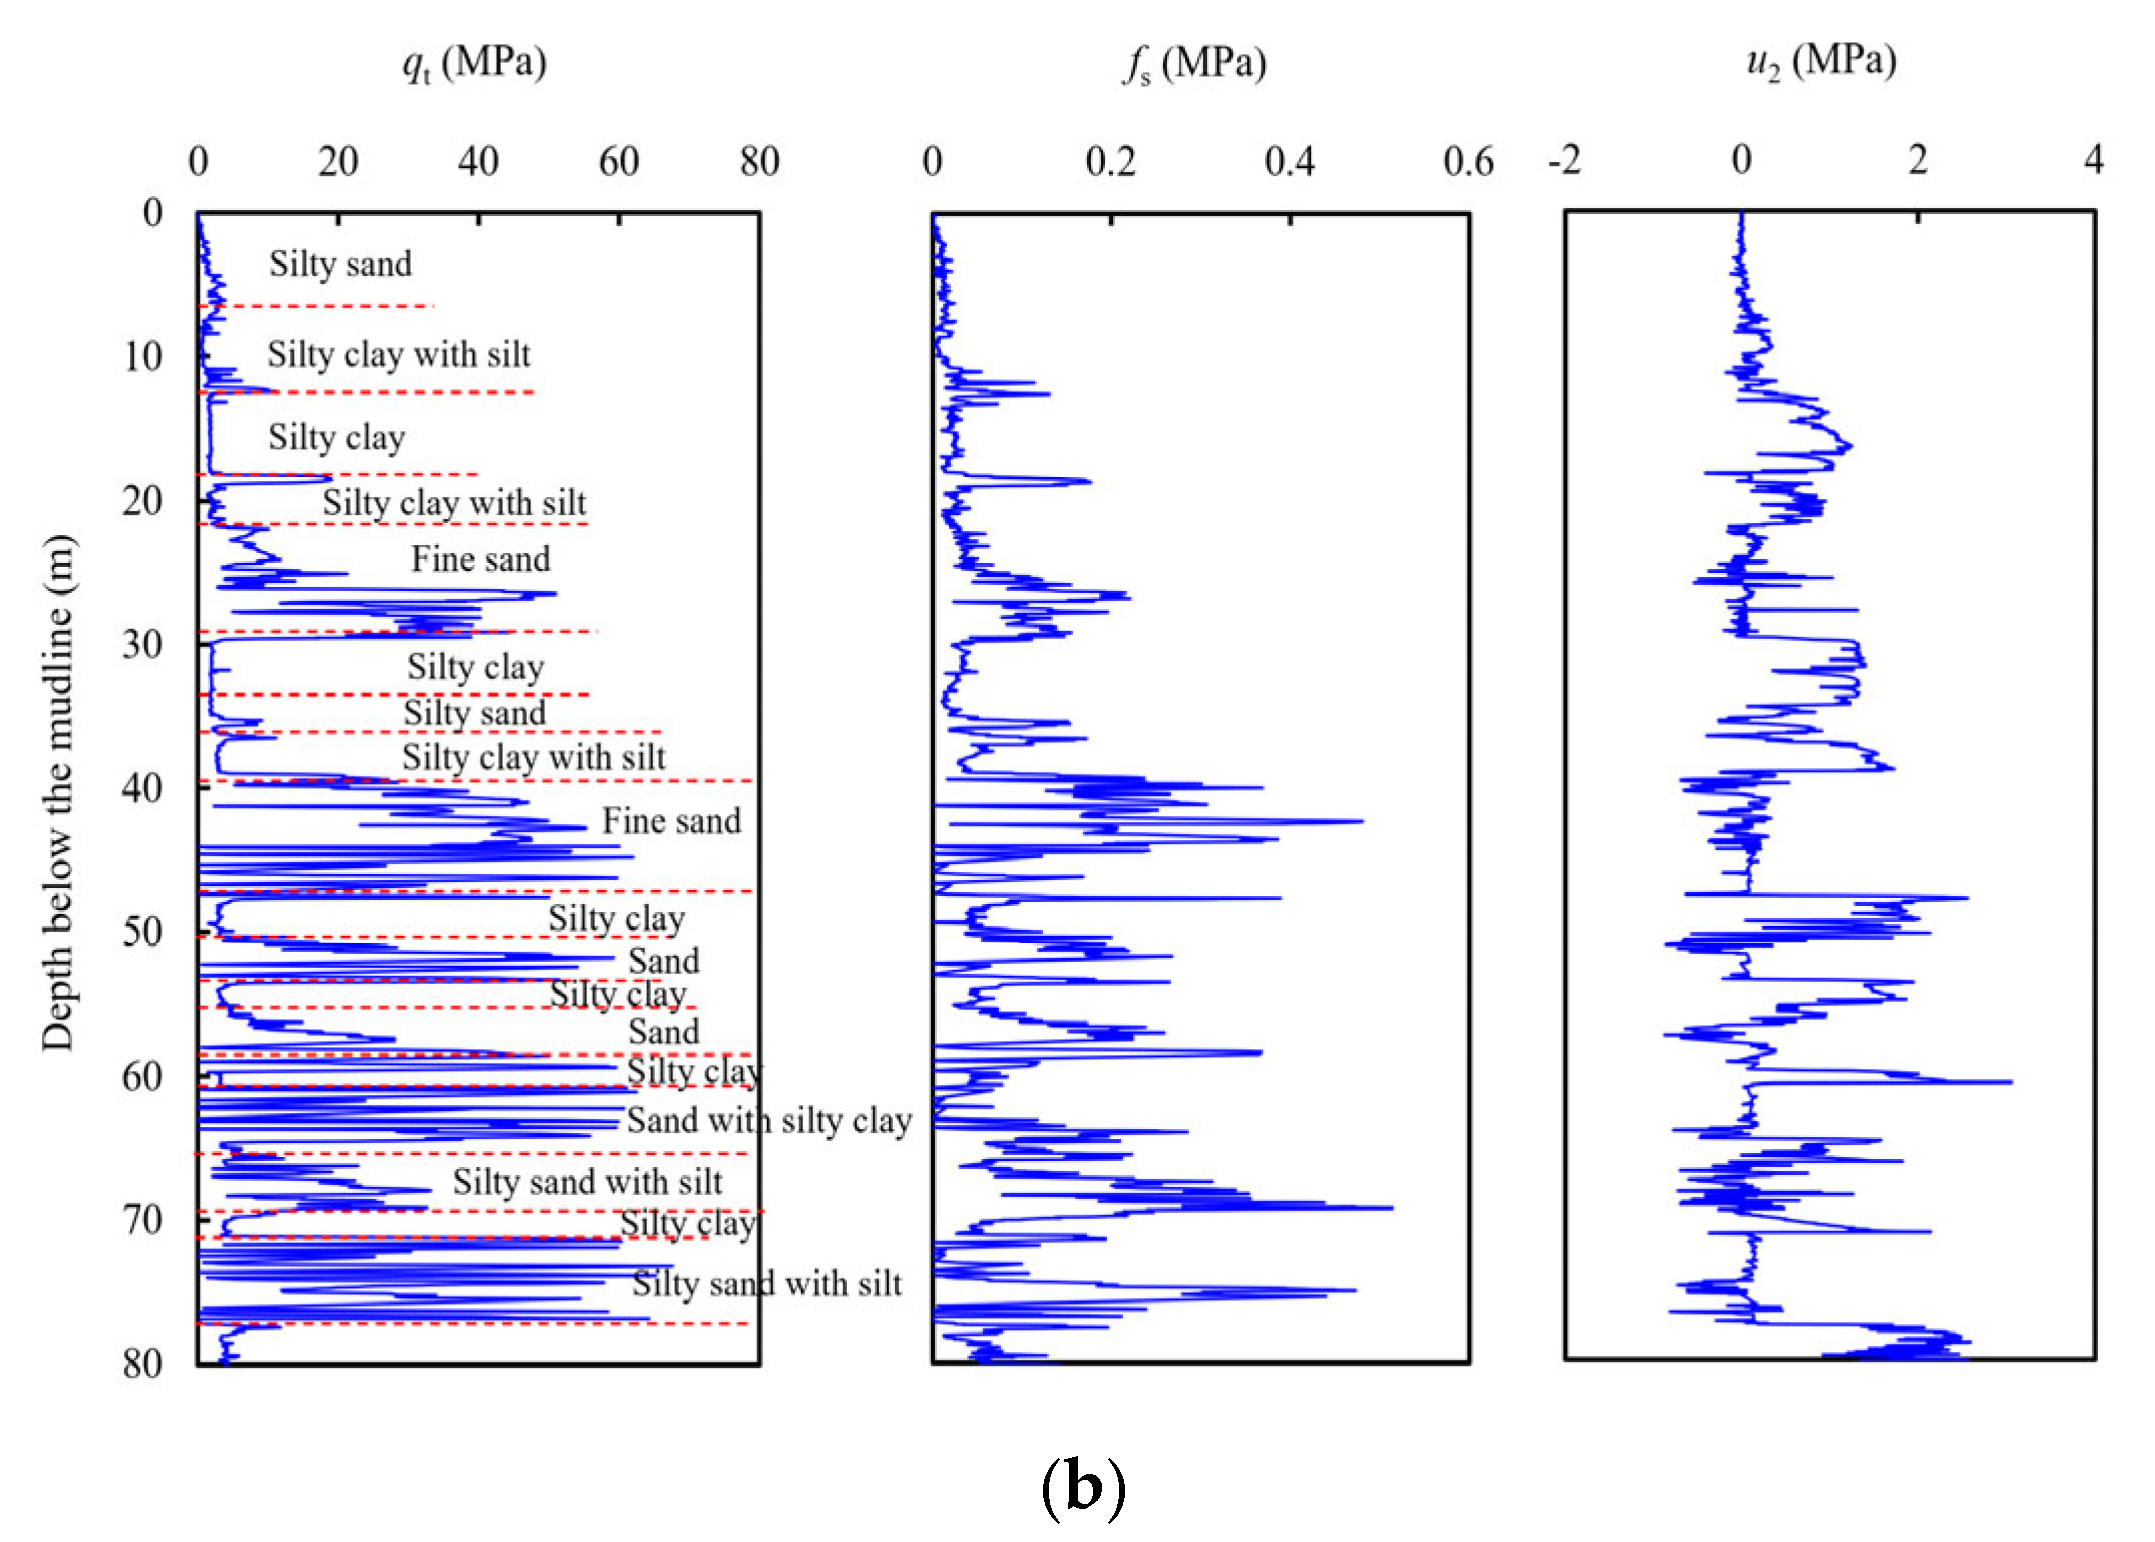
Due to the low bearing capacity and susceptibility to significant settlement, soft mud layers are a common challenge in offshore geotechnical engineering. During the Shenquan offshore wind farm project in the Guangdong offshore areas, three layers (Layers 1-1, 1-2 and 2-1) of soft mud were identified (Figure 4a). The site is located approximately 26 km offshore, with a water depth ranging from 32 to 37 m and covers an area of about 64 km2. The project planned to install 66 wind turbines with a total wind power capacity of 400 MW. The seabed soil properties were obtained by a combination of drilling and CPTU tests. The soil types, shear strengths and stratigraphy were interpreted from the CPTU data, i.e., the tip resistance qc, the friction resistance fs and the pore pressure u2 [21,89], with an example presented in Figure 4b. The detailed soil stratigraphy is outlined as in Table 1, and the soft mud layers are described as follows:
Layer 1-1: This layer consists of silt mixed with mud, and it is grey, saturated and predominantly loose, with some areas slightly dense. The main minerals are quartz and feldspar, with poor gradation. This layer includes shell debris and contains a large amount of fine-grained soil, partially in the form of silt mixed with sand, which is indicative of marine sedimentation. In the CPTU, the tip resistance qc ranges from 0.93 to 3.00 MPa, with an average of 1.71 MPa, while the friction resistance fs ranges from 8.2 to 24.6 kPa, with an average of 13.0 kPa. The thickness of this layer is between 4.9 and 13.5 m.
Layer 1-2: This layer consists of muddy silty clay with silt, and it is grey and plastic, containing silt particles and organic matter with a noticeable odour. Shell fragments with size of 0.2–0.5 cm are visible in some parts, along with a thin layer of silt. The measured cone tip resistance qc falls within the range of 0.48–2.00 MPa, and the sleeve friction fs varies from 6.8 to 28.9 kPa. The layer thickness is observed to be between 0.7 and 15.5 m.
Layer 2-1: This layer consists of silty clay, and it is grey and soft plastic, containing fine sand, with occasional organic matter and shell fragments. The cone tip resistance qc ranges from 1.29 to 2.82 MPa, and the sleeve friction fs varies from 11.8 to 57.7 kPa. The thickness of this layer ranges between 0.6 and 24.3 m.
Based on interpretation of CPTU data, the average undrained shear strength su of the shallow soft mud layers is approximately 20 kPa. This strength is inadequate to serve as a bearing stratum for monopile foundations supporting wind turbines. According to the API RP 2A-WSD:2014 guidelines, the ultimate axial compressive capacity Qd of a single pile includes the side resistance Qf and the tip resistance Qp as follows:
Q d = Q f + Q p = f A s + q A t
where f denotes the unit side resistance, As represents the total shaft area of the pile, q indicates the unit end resistance and At refers to the base area of the pile. For soft mud layers, the unit side resistance f is determined as follows:
f = α s u , α = 0.5 s u / P 0 0.5 s u / P 0 < 1 0.5 s u / P 0 0.25 s u / P 0 1 , α 1
where P0 represents the overburden pressure and α denotes a reduction coefficient. The unit tip resistance q is computed using the following formula:
q = 9 s u
At the base of the initial soft mud layer, which has a depth of 10 m, the calculated unit side resistance f amounts to 19.8 kN/m2 while the unit tip resistance q is measured at 180 kN/m2. Given a pile diameter of 6 m, the ultimate axial compressive capacity Qd is determined to be as low as 8821 kN. This indicates that the soft mud layers are unsuitable to be a bearing stratum.
The risk of seismic subsidence from earthquakes should also be considered for soft mud layers when the design seismic intensity is equal to or greater than 7. If the equivalent shear wave velocity of the soil layer exceeds the critical value specified in Table 2, the effects of seismic subsidence may be considered negligible. Otherwise, the further assessment of seismic subsidence potential is recommended. Due to the complex hydraulic environment underwater, conventional reinforcement techniques for soft soils on land, such as vibro-compaction, deep soil mixing and prefabricated vertical drains, are not applicable to seabed soft mud layers. Consequently, in offshore engineering design, it is advisable to avoid selecting soft mud layers as the bearing strata for undersea structures.

3.2. Shallow Gas and Pockmarks

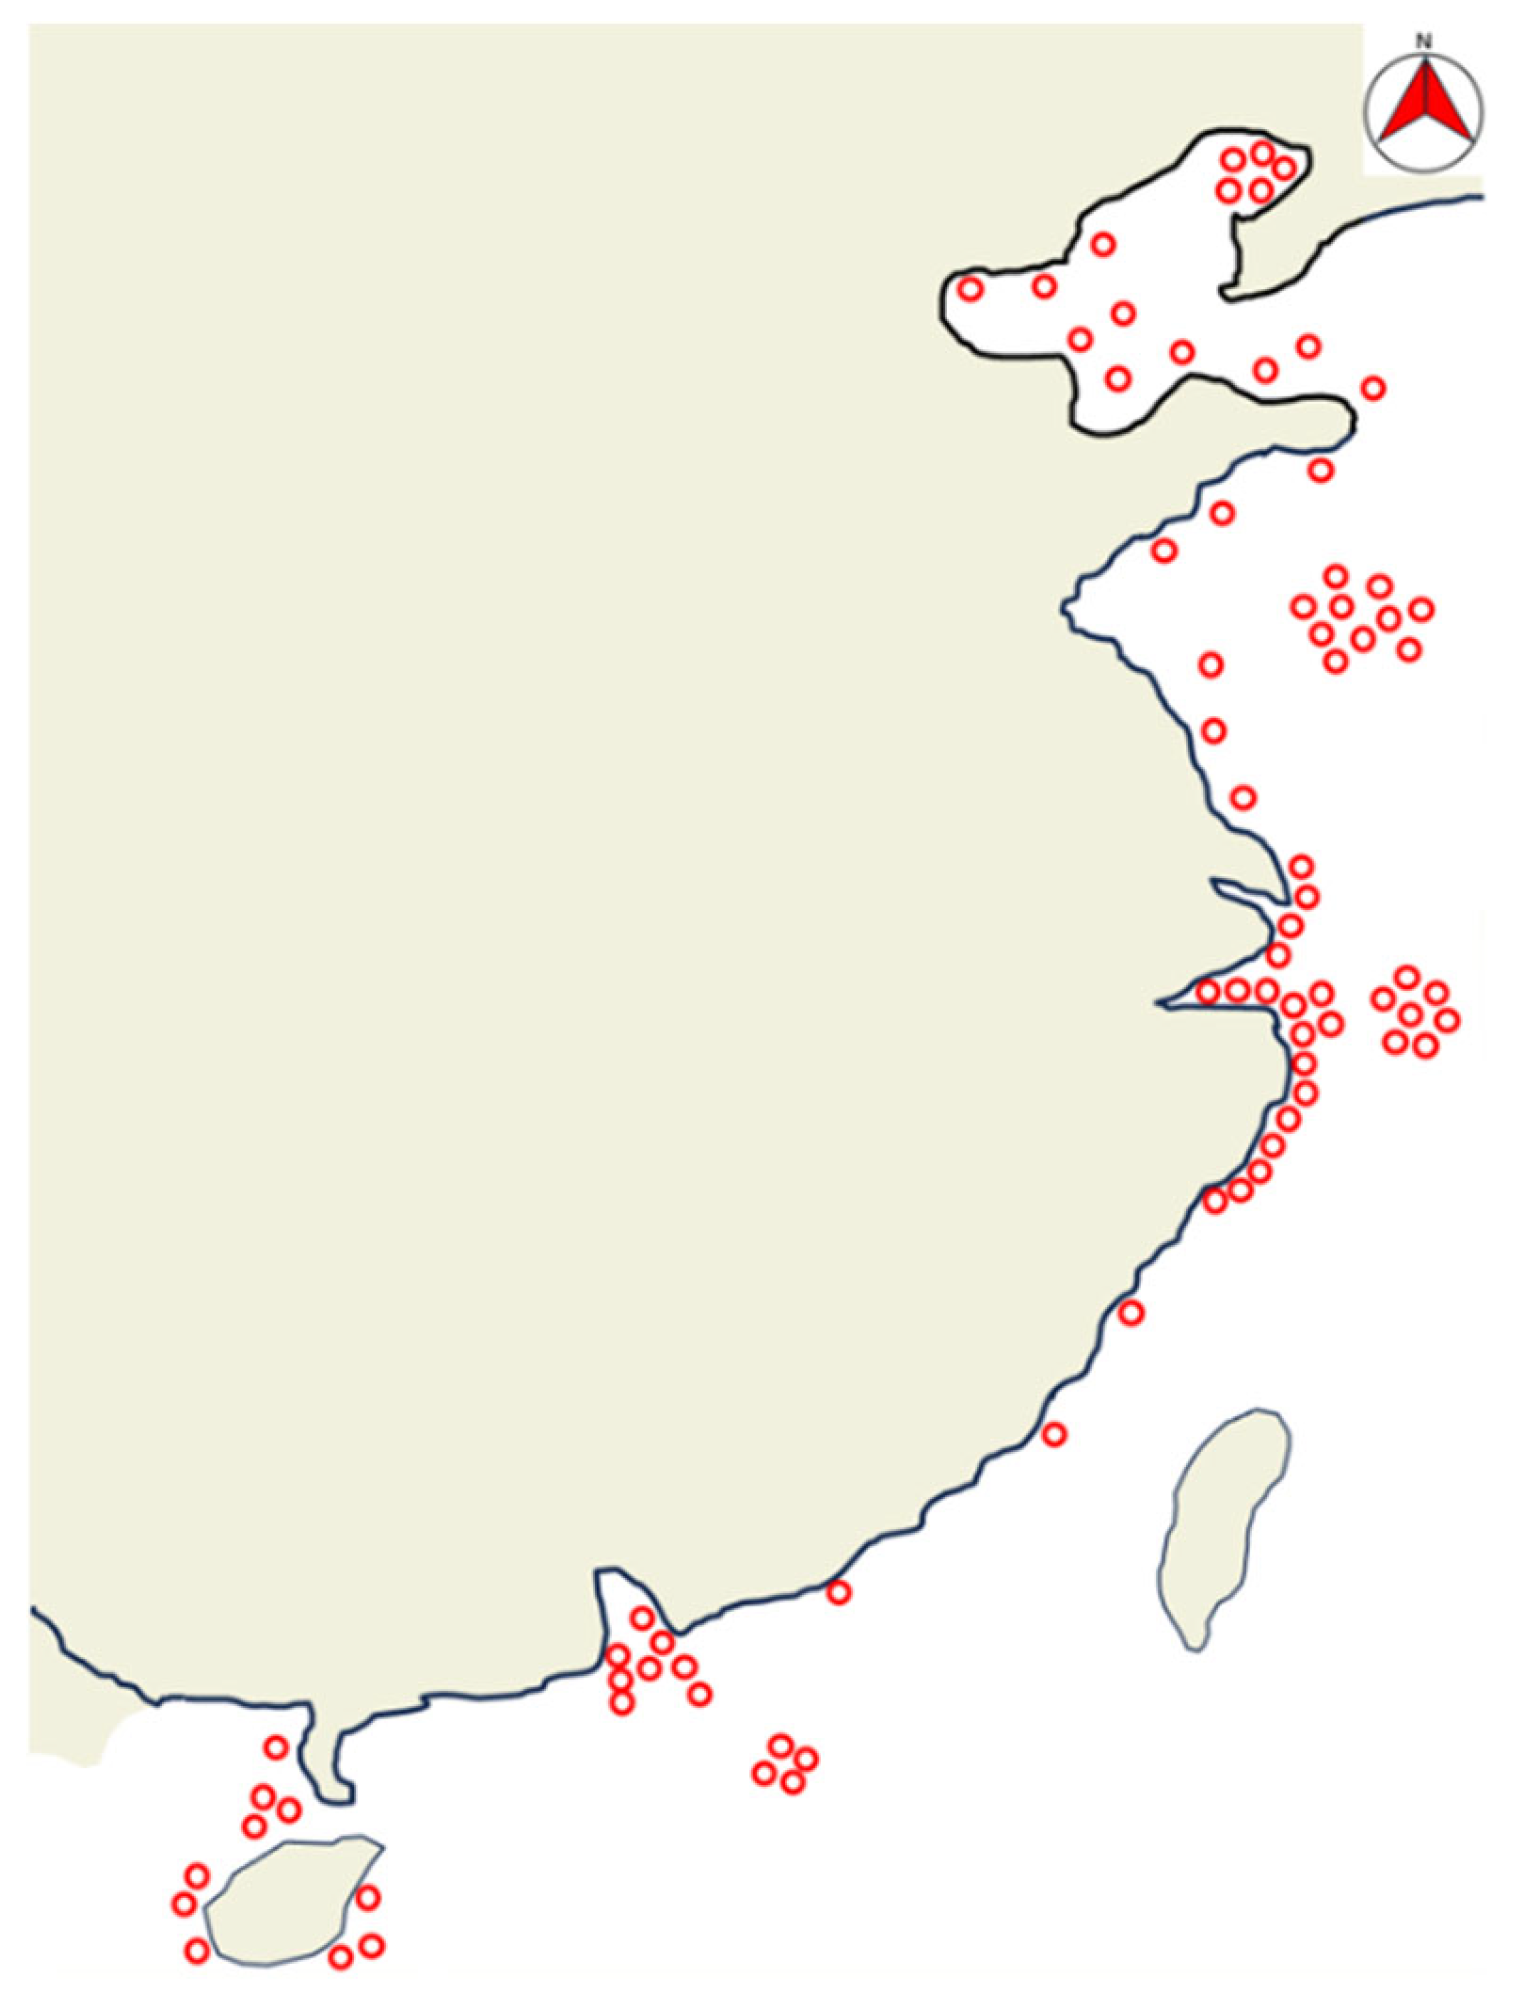
Shallow gas refers to natural gas that accumulates locally within shallow seabed strata. Shallow gas can be categorized into two types according to origin, namely biogenic and thermogenic gases [90]. Biogenic gas originates from the decomposition of shallow terrestrial organic matter through bacterial activities and is found at depths ranging from a few metres to hundreds of metres. It is primarily located in harbours (e.g., Hangzhou Bay, Xiamen Bay) [91,92], buried paleo-deltas [93] and paleo-channels [94]. Thermogenic gas is the accumulation of free gas that is released from source rocks at depths of thousands of metres through faults. It is mainly stored near marine hydrocarbon-rich basins, such as the Yinggehai Basin [95,96]. In coastal plains and offshore areas of China, shallow gas is predominantly stored in incised Quaternary valleys and erosion grooves in the form of high-pressure gas pockets. The distribution of the shallow gas off China’s coasts is presented in Figure 5. A gas-bearing soil layer often has excessive pore waters, resulting in a significant reduction in soil shear strength. With sustained external loading, the soil may creep and lead to anisotropic sliding and severe settlement [97]. Consequently, such a soil layer is unsuitable to be the bearing stratum for undersea structures. When geotechnical investigation instruments are pulled out of the gas-bearing soil stratum, gas can leak or even blow out into the water, posing a risk of explosion if the gas concentration reaches a certain level. There have been reports of injuries and structural damage caused by gas burns and the induced shock waves. In engineering practices, the pre-releasing of gas by digging a vent well is an effective method to mitigate shallow gas hazards [98,99].
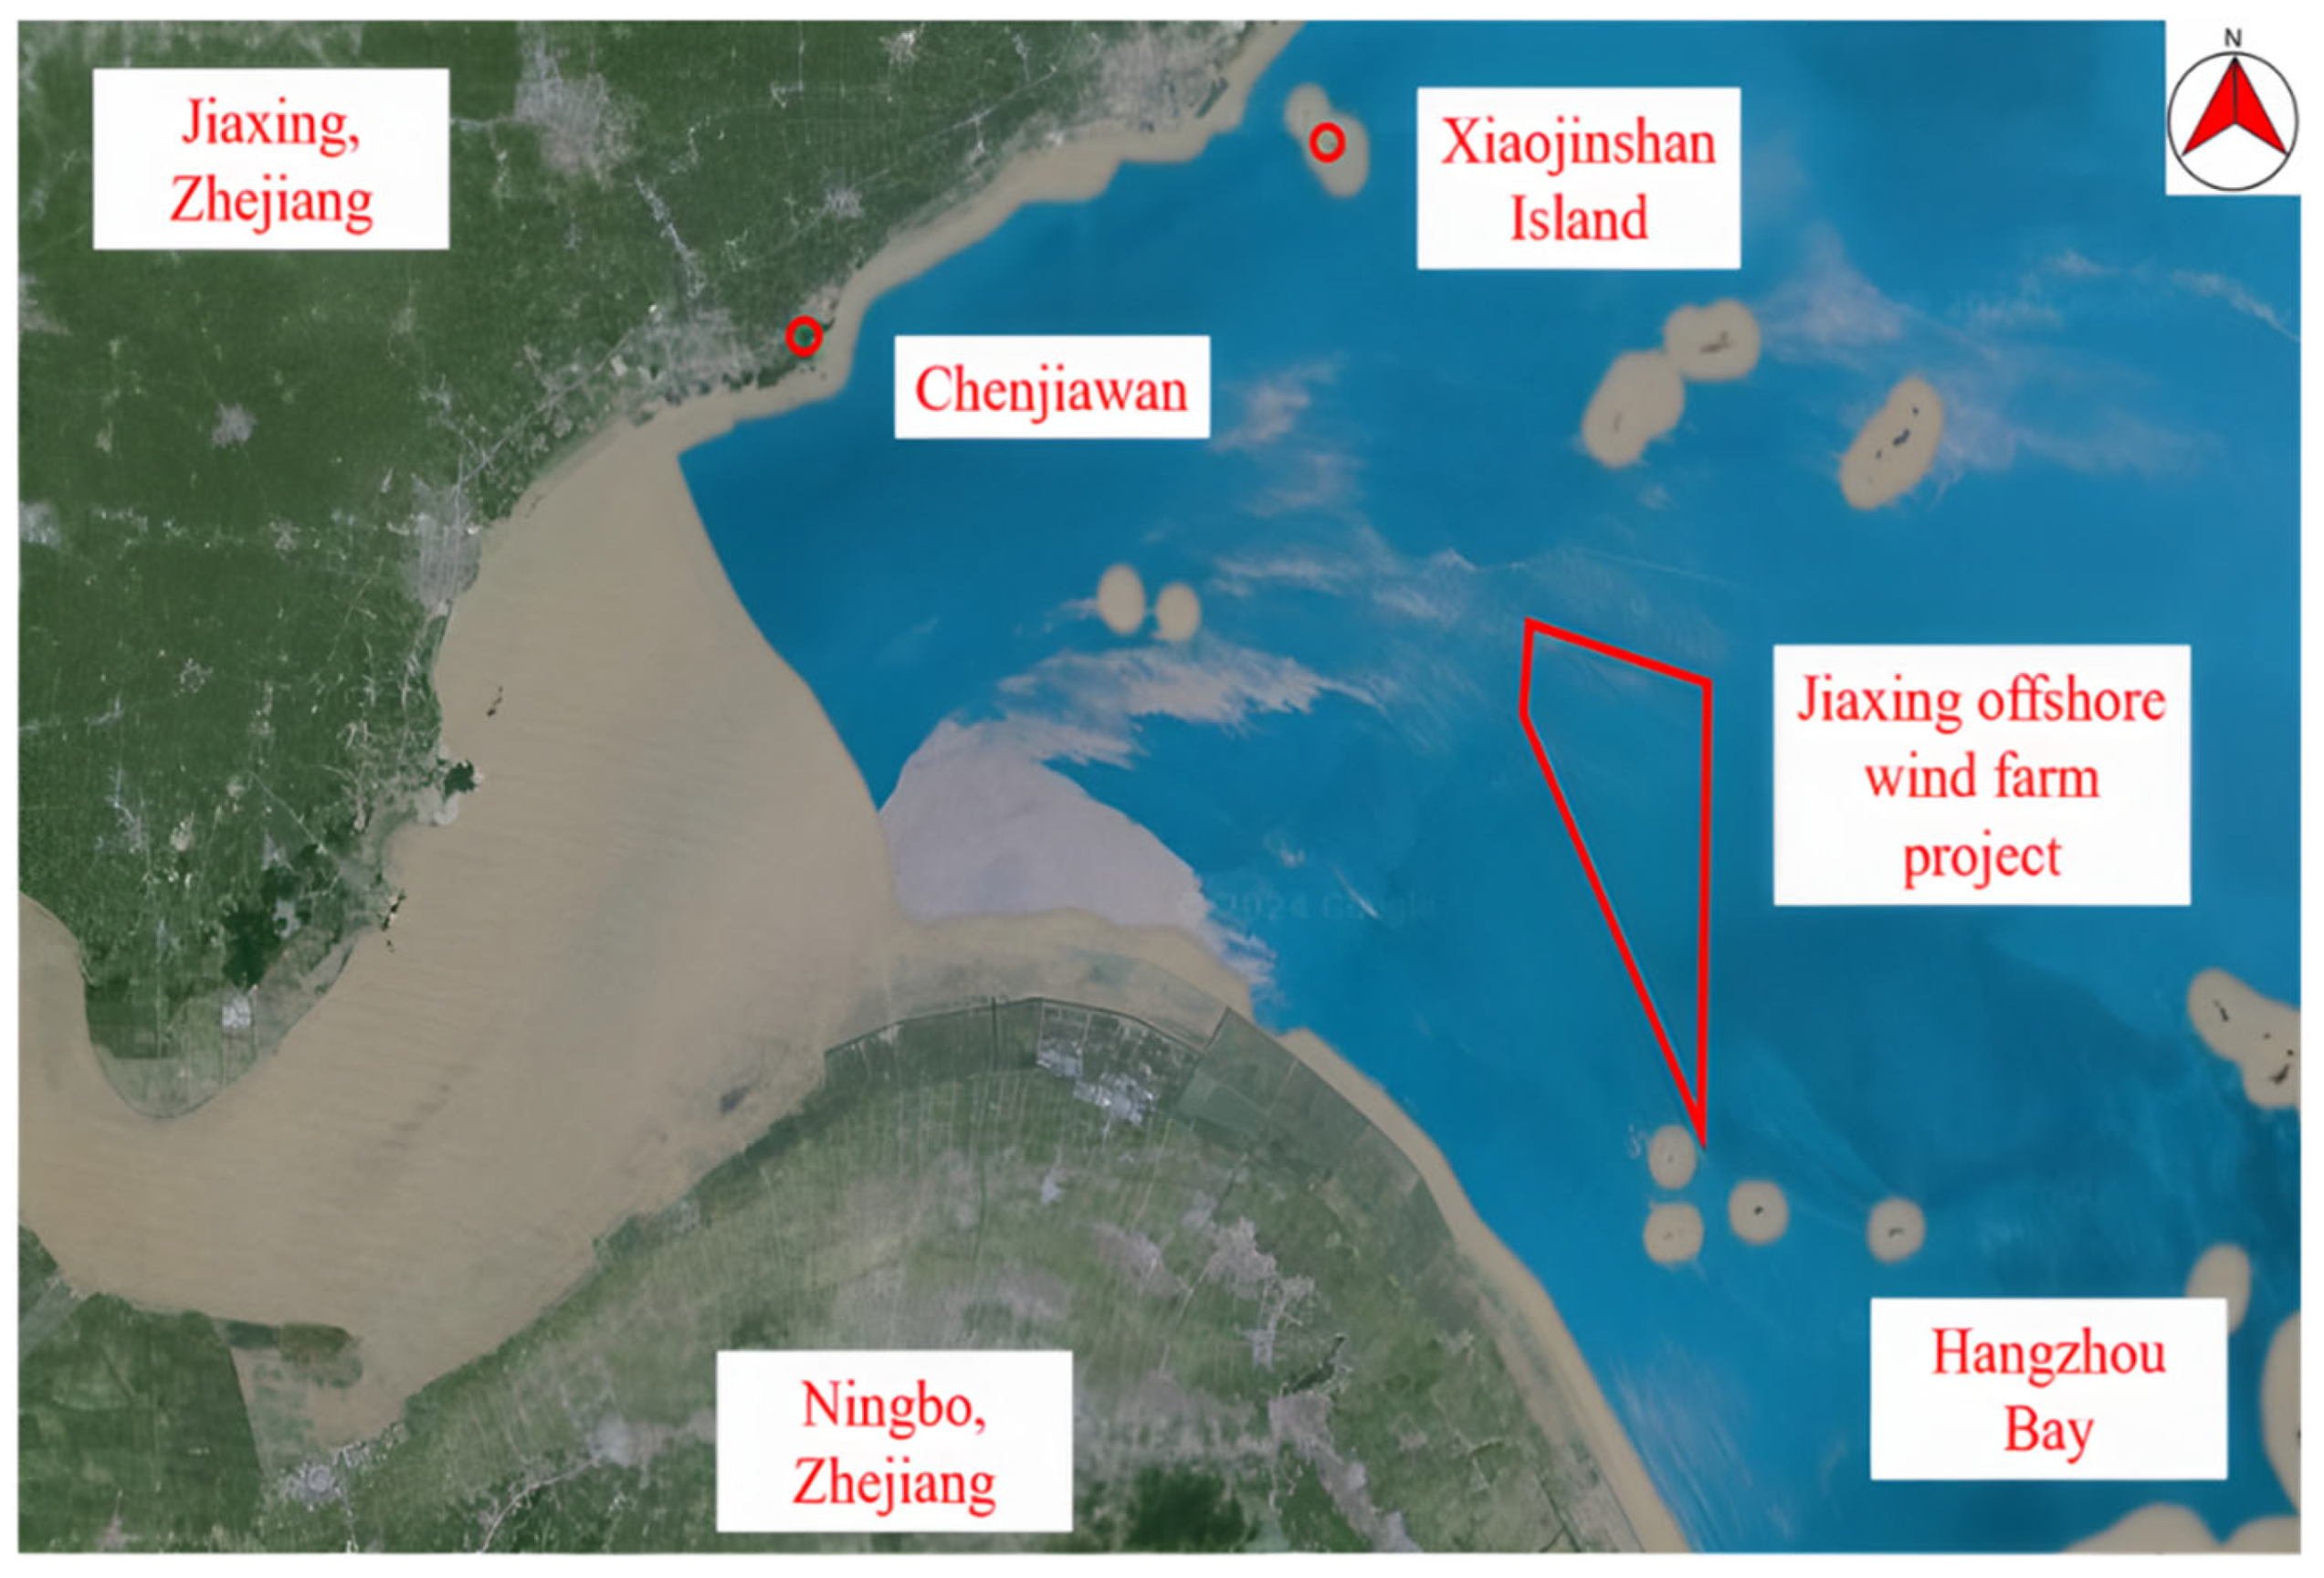
Shallow gas was found at the Pinghu area of the Hangzhou Bay during the Jiaxing offshore wind farm project (Figure 6). The entire project site is roughly 9 km from the east to the west and 2 to 17 km from north to south. There were roughly 20 km offshore at the centre of the wind farm. The water depth ranges between 8 and 12 m. With a maximum slope of less than 1°, the seabed topography is comparatively flat. The project plans include the installation of 72 wind turbines with a single unit capacity of 4.0 MW and 2 wind turbines with a single unit capacity of 6.0 MW, yielding a total wind energy capacity of 300 MW. Shallow gas was detected through drilling and CPTU at wind turbine Positions 37#, 38#, 40#, 46#, 52#, 60#, 61#, 65#, 66#, 70# and 73#, as well as at the offshore booster station Position SJT1 (Table 3). When the cone of the CPTU stops penetrating at a certain depth, the pore water pressure starts to dissipate gradually to a stable value [105]. Shallow gas can be identified by a stable value greater than zero. At the Jiaxing offshore wind farm project site, the shallow gas is mainly buried in early Holocene silty clays, silty sands and clayey silts. The silty sands and clayey silts with large particles and high porosity serve as effective gas storage layers. The silty clay, rich in organic matters and humus, such as mica and shells, acts as both a gas source layer and an overburden layer, preventing shallow gas from escaping. The eruption durations at Positions 38#, 40#, 66#, 70# and 73# were very long, lasting around 7 months.
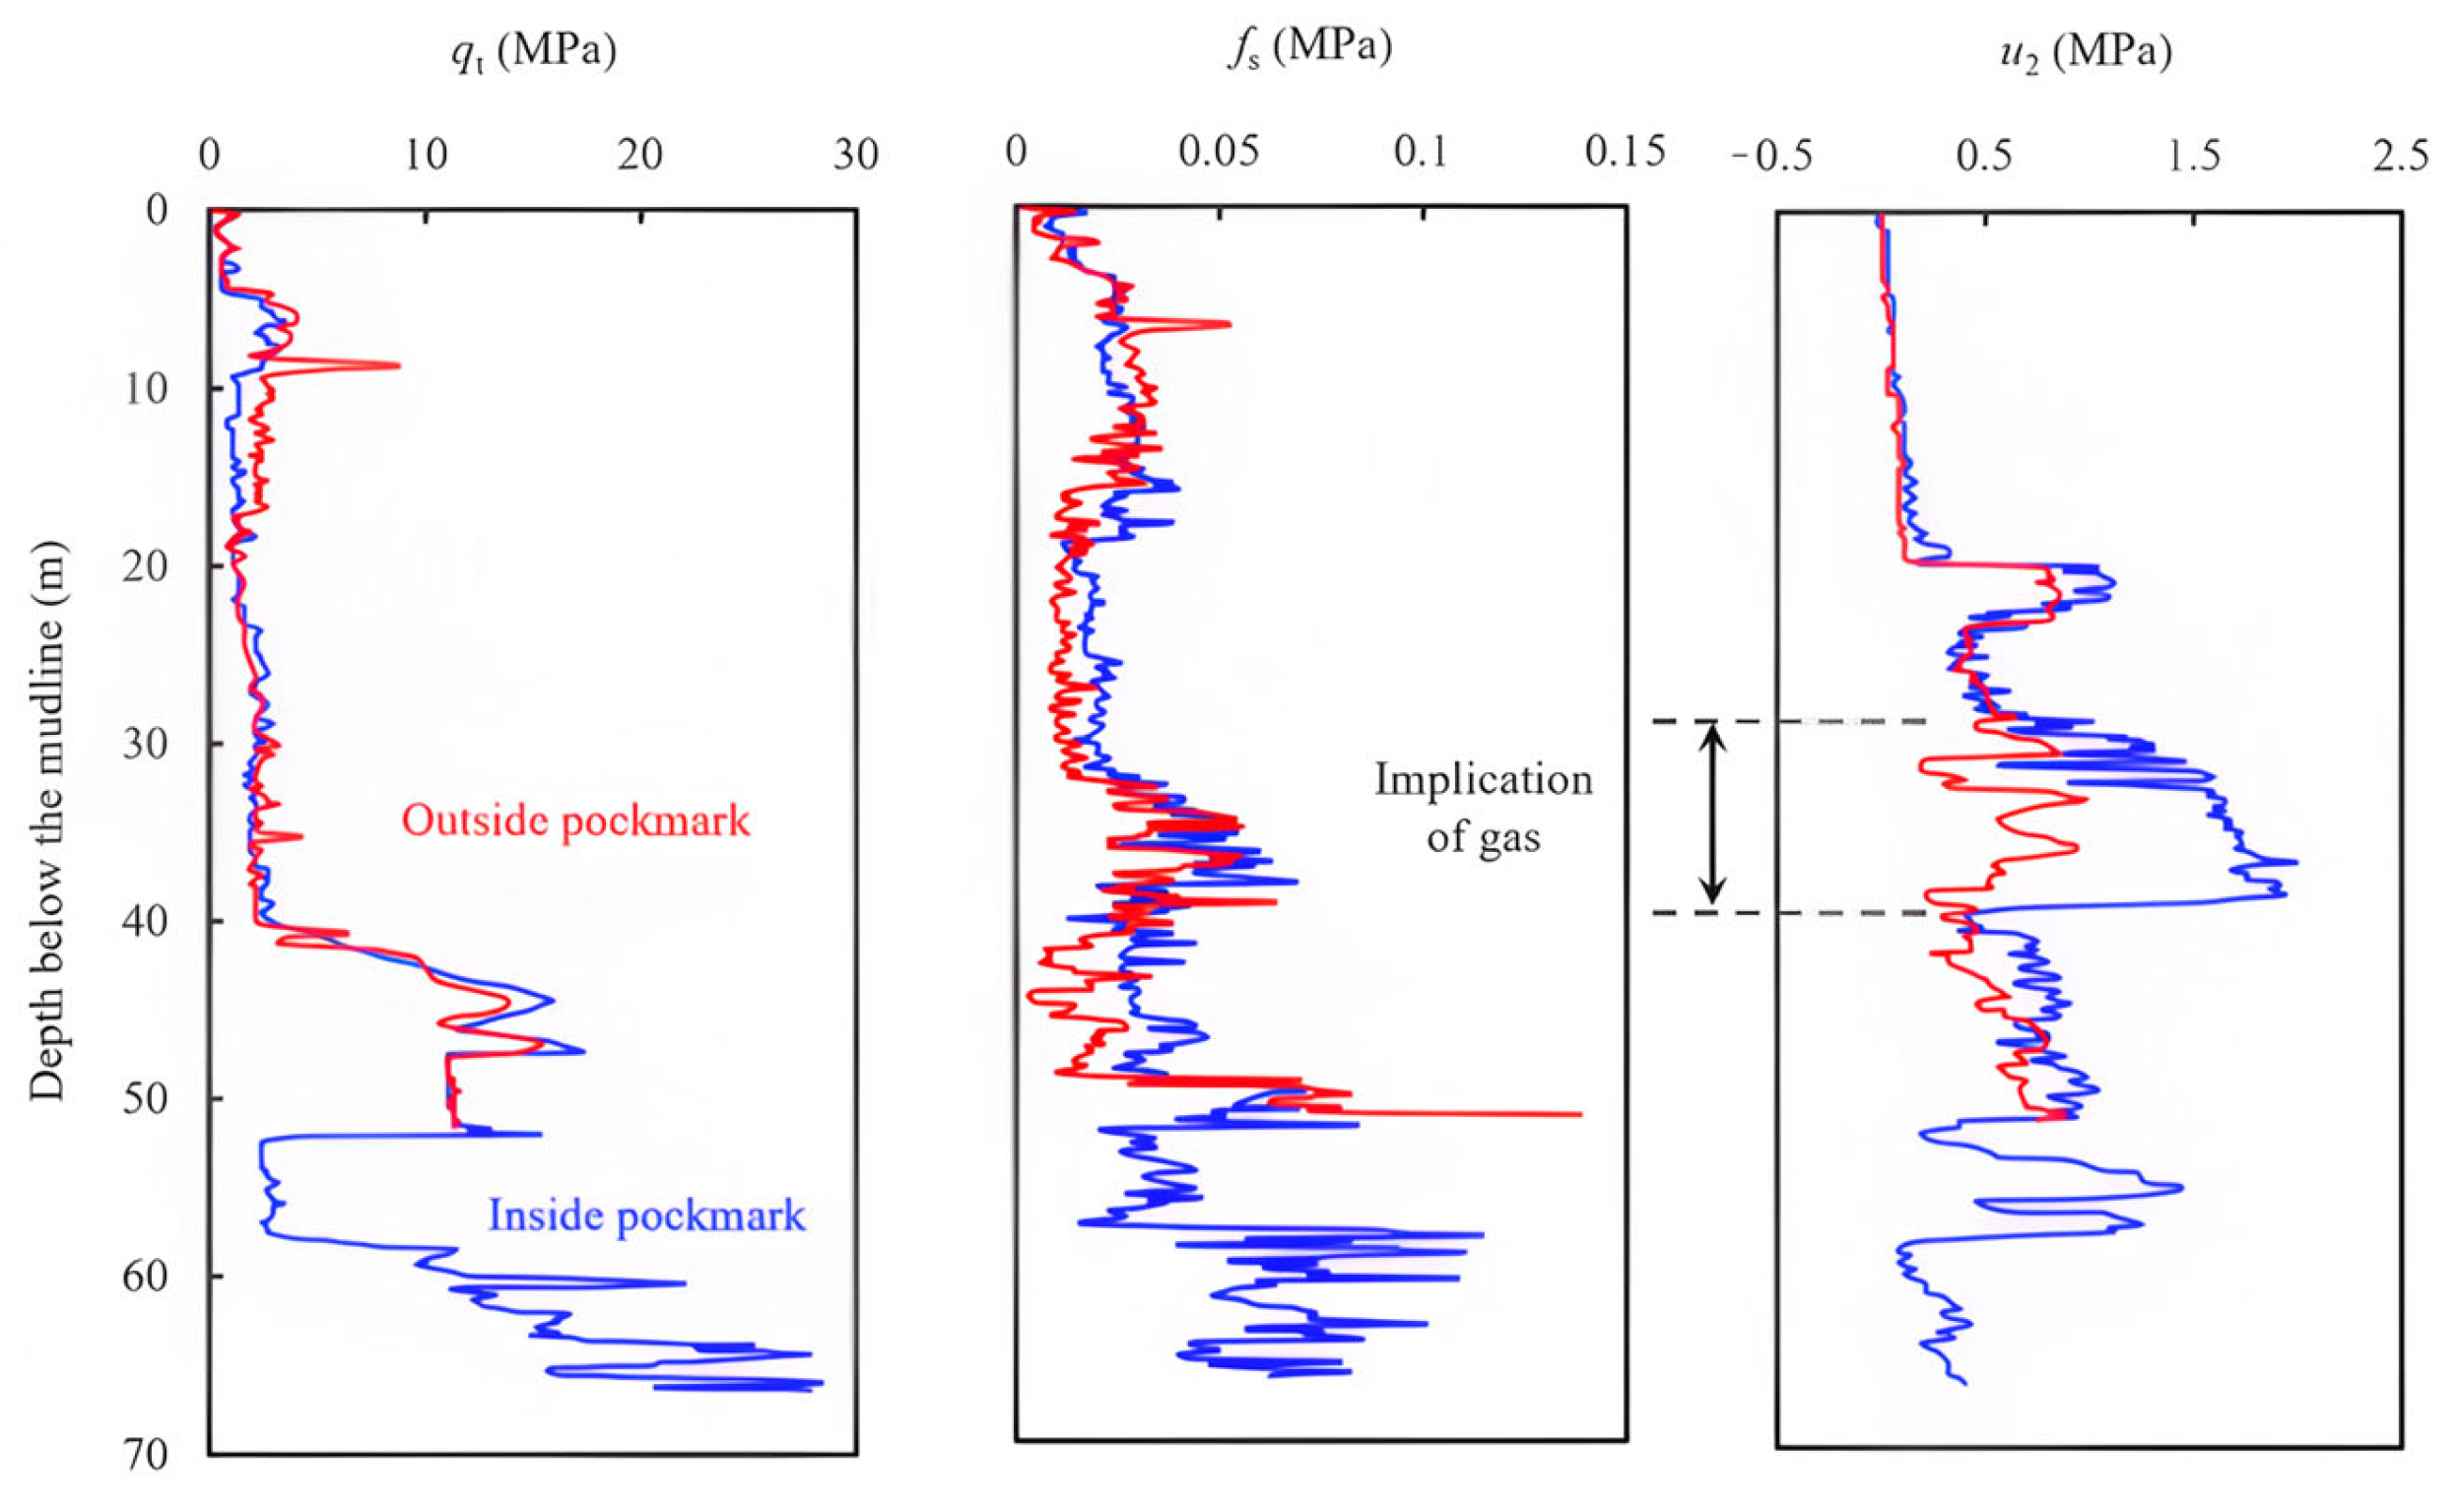
The venting of shallow gas into water is often accompanied by pockmarks, which are induced by the collapse of sediments along the gas transport channel caused by excessive pore pressure [106]. The shear strength of sediments found in the pockmarks typically diminishes as they experience remoulding. At the wind turbine Position 40# in the Pinghu area of the Hangzhou Bay (Table 3), CPTU tests were performed inside and outside of a pockmark on the seabed after two months after the release of shallow gas (Figure 7). The pore pressure inside the pockmark was approximately three times that of on the outside of it at a depth of 30 to 40 m, which suggested that the shallow gas had not been completely released. This observation was confirmed by subsequent tests, which revealed that full gas release at this location took seven months.

3.3. Sand Liquefaction

Sand liquefaction is the process by which a saturated sandy soil transforms from a solid to a liquid state, accompanied by a significant loss of shear strength. Strong vibrations are the primary cause of liquefaction, which increases the pore water pressure within the sand fabric and hence decreases the intergranular contact stresses. Sand liquefaction mainly occurs in areas with predominantly sandy soils, which are common off the coasts of China, including the Laizhou Bay [107], the Hangzhou Bay, the Fujian and Guangdong offshore areas [108] and the Beibu Gulf [109,110].
In engineering practice, the preliminary assessment of soil liquefaction is based on clay content. A soil layer may be preliminarily classified as non-liquefiable if its clay content (particles < 0.005 mm) reaches or exceeds 10%, 13% and 16% under seismic intensities of 7, 8 and 9, respectively. Soil liquefaction can be further investigated using the standard penetration test (SPT), as outlined in MOHURD (2016) [111], the 1996 NCEER guideline [112] and BS (2004) [113].
According to MOHURD (2016), the liquefaction is quantified by an index IlE, which can be calculated as follows:
I l E = i = 1 n 1 N i N cr i d i w i
where Ni and Ncri are the blow counts and its critical value of the SPT at Point i, respectively, n is the total number of SPT points within a single borehole, di is the thickness of the layer at Point i and wi is a dimensionless coefficient determined by the thickness and the depth of the layer at Point i. The critical value of SPT Ncri is calculated as follows:
N cr i = N 0 β ln 0.6 d s + 1.5 0.1 d w 3 / ρ c
where N0 represents the reference standard penetration test (SPT) blow count, ds denotes the depth of the penetration point, dw indicates the groundwater table depth, ρc refers to the clay content percentage and β is the adjustment coefficient for the seismic group.
As recommended in the 1996 NCEER guideline, soil liquefaction can be assessed by the anti-liquefaction safety factor as follows:
F S = C RR / C SR = C RR 7 . 5 / C SR M SF
where CRR refers to the cyclic resistance ratio, CRR7.5 denotes the cyclic resistance ratio for a magnitude 7.5 earthquake, CSR stands for the cyclic stress ratio and MSF is a factor associated with the design seismic intensity. For FS ≥ 1, the soil is non-liquefiable. Otherwise, the soil is liquefiable. The cyclic stress ratio CSR can be calculated as follows:
C SR = 0.65 σ vo / σ vo a max / g r d
where σvo represents the total vertical overburden stress, while the effective vertical overburden stress is denoted as σ vo . The peak horizontal ground surface acceleration is denoted by amax, g is gravitational acceleration and rd is the stress reduction coefficient. The value of rd can be estimated using the following relationship [114]:
r d = 1.0 0.00765 z   for   z 9.15 1.174 0.0267 z   for   9.15 < z 23
where z is the depth of the soil layer. The cyclic resistance ratio for a magnitude 7.5 earthquake CRR7.5 can be derived from the SPT as follows:
C RR 7 . 5 = 1 34 N 1 60 cs + N 1 60 cs 135 + 50 10 N 1 60 cs + 45 2 1 200
where (N1)60cs is the corrected blow counts and is calculated as follows:
N 1 60 cs = α + β N m C N
where α and β denote fines content-dependent correction coefficients, Nm is the measured SPT blow count and Cn is the overburden stress correction coefficient which also incorporates adjustments for equipment and procedures (e.g., hammer energy, borehole diameter, rod length and liner usage). It is evident that the soil layer is regarded as non-liquefiable when (N1)60cs ≥ 30.
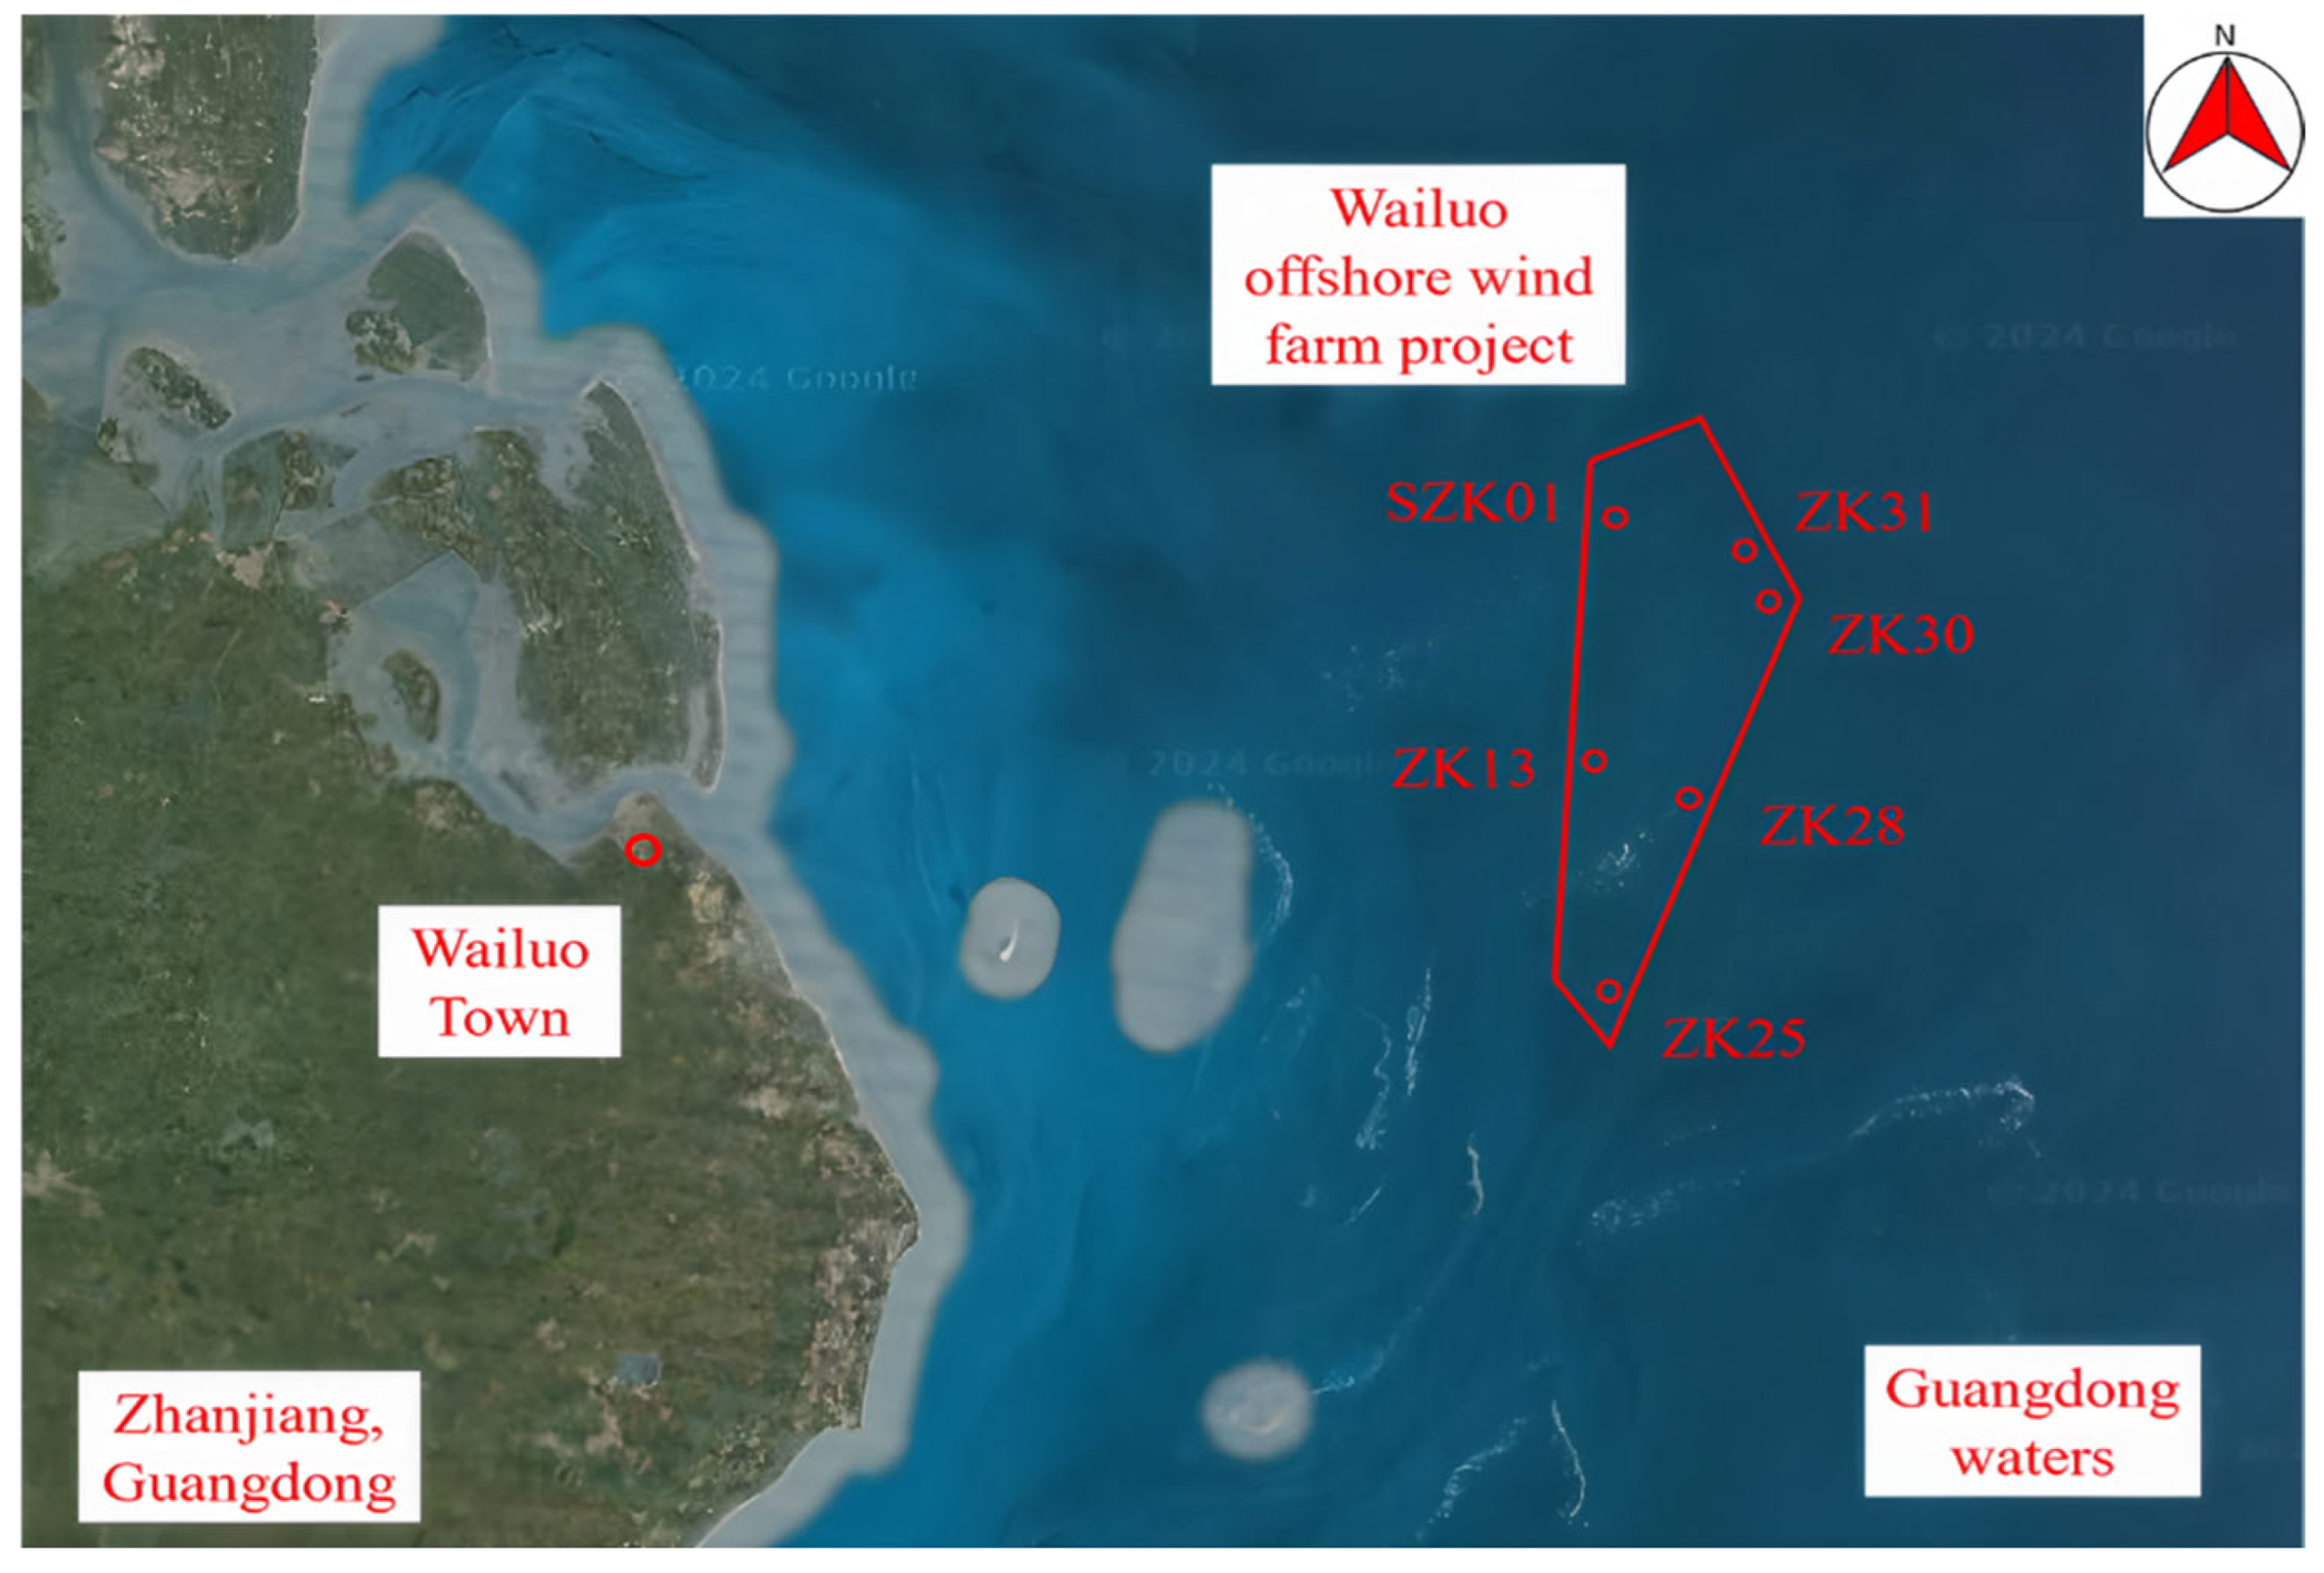
The liquefaction of the seabed soil was assessed at the Wailuo offshore wind farm in the Guangdong offshore area, located 15 km away from the mainland and spanning an area of approximately 23.22 km2 (Figure 8). The project planned to install 32 offshore wind turbines, each with a capacity of 6.25 MW, for a total energy capacity of 200 MW. Based on the preliminary assessment, Table 4 presents the liquefaction evaluation results for soils at various depths across different boreholes. Among these, the N (SPT) values were obtained directly from on-site testing. Both the MOHURD (2016) code and the 1996 NCEER guideline yield similar predictions regarding the liquefaction level. Except for the Holes Z30 and SZK01, all the remaining drilling sites exhibit a high risk of liquefaction. Sand liquefaction may lead to a substantial decrease in the foundation’s bearing capacity and lateral resistance, potentially causing the significant settlement and tilting of the super-structures [115]. Therefore, areas with a high risk of sand liquefaction should be avoided.

3.4. Dense Sand Layer

In real-world offshore engineering applications, dense sand layers are commonly encountered. These layers typically consist of uniformly fine to medium sized particles (0.03–0.2 mm) and exhibit very high compression moduli (1–10 MPa) as well as very high shear strengths (cohesion c = 5–15 kPa, friction angle φ > 30°) [116,117]. Dense sand layers are a landform produced by interactions between water hydrodynamics, suspended sediments and the packed seabed. Fine particles are usually transported to more distant locations, while coarse particles are deposited in local areas. These coarse grains are tightly packed and constitute the primary framework of the dense sand layers, which are extensively present throughout China’s estuaries and coastal waters.
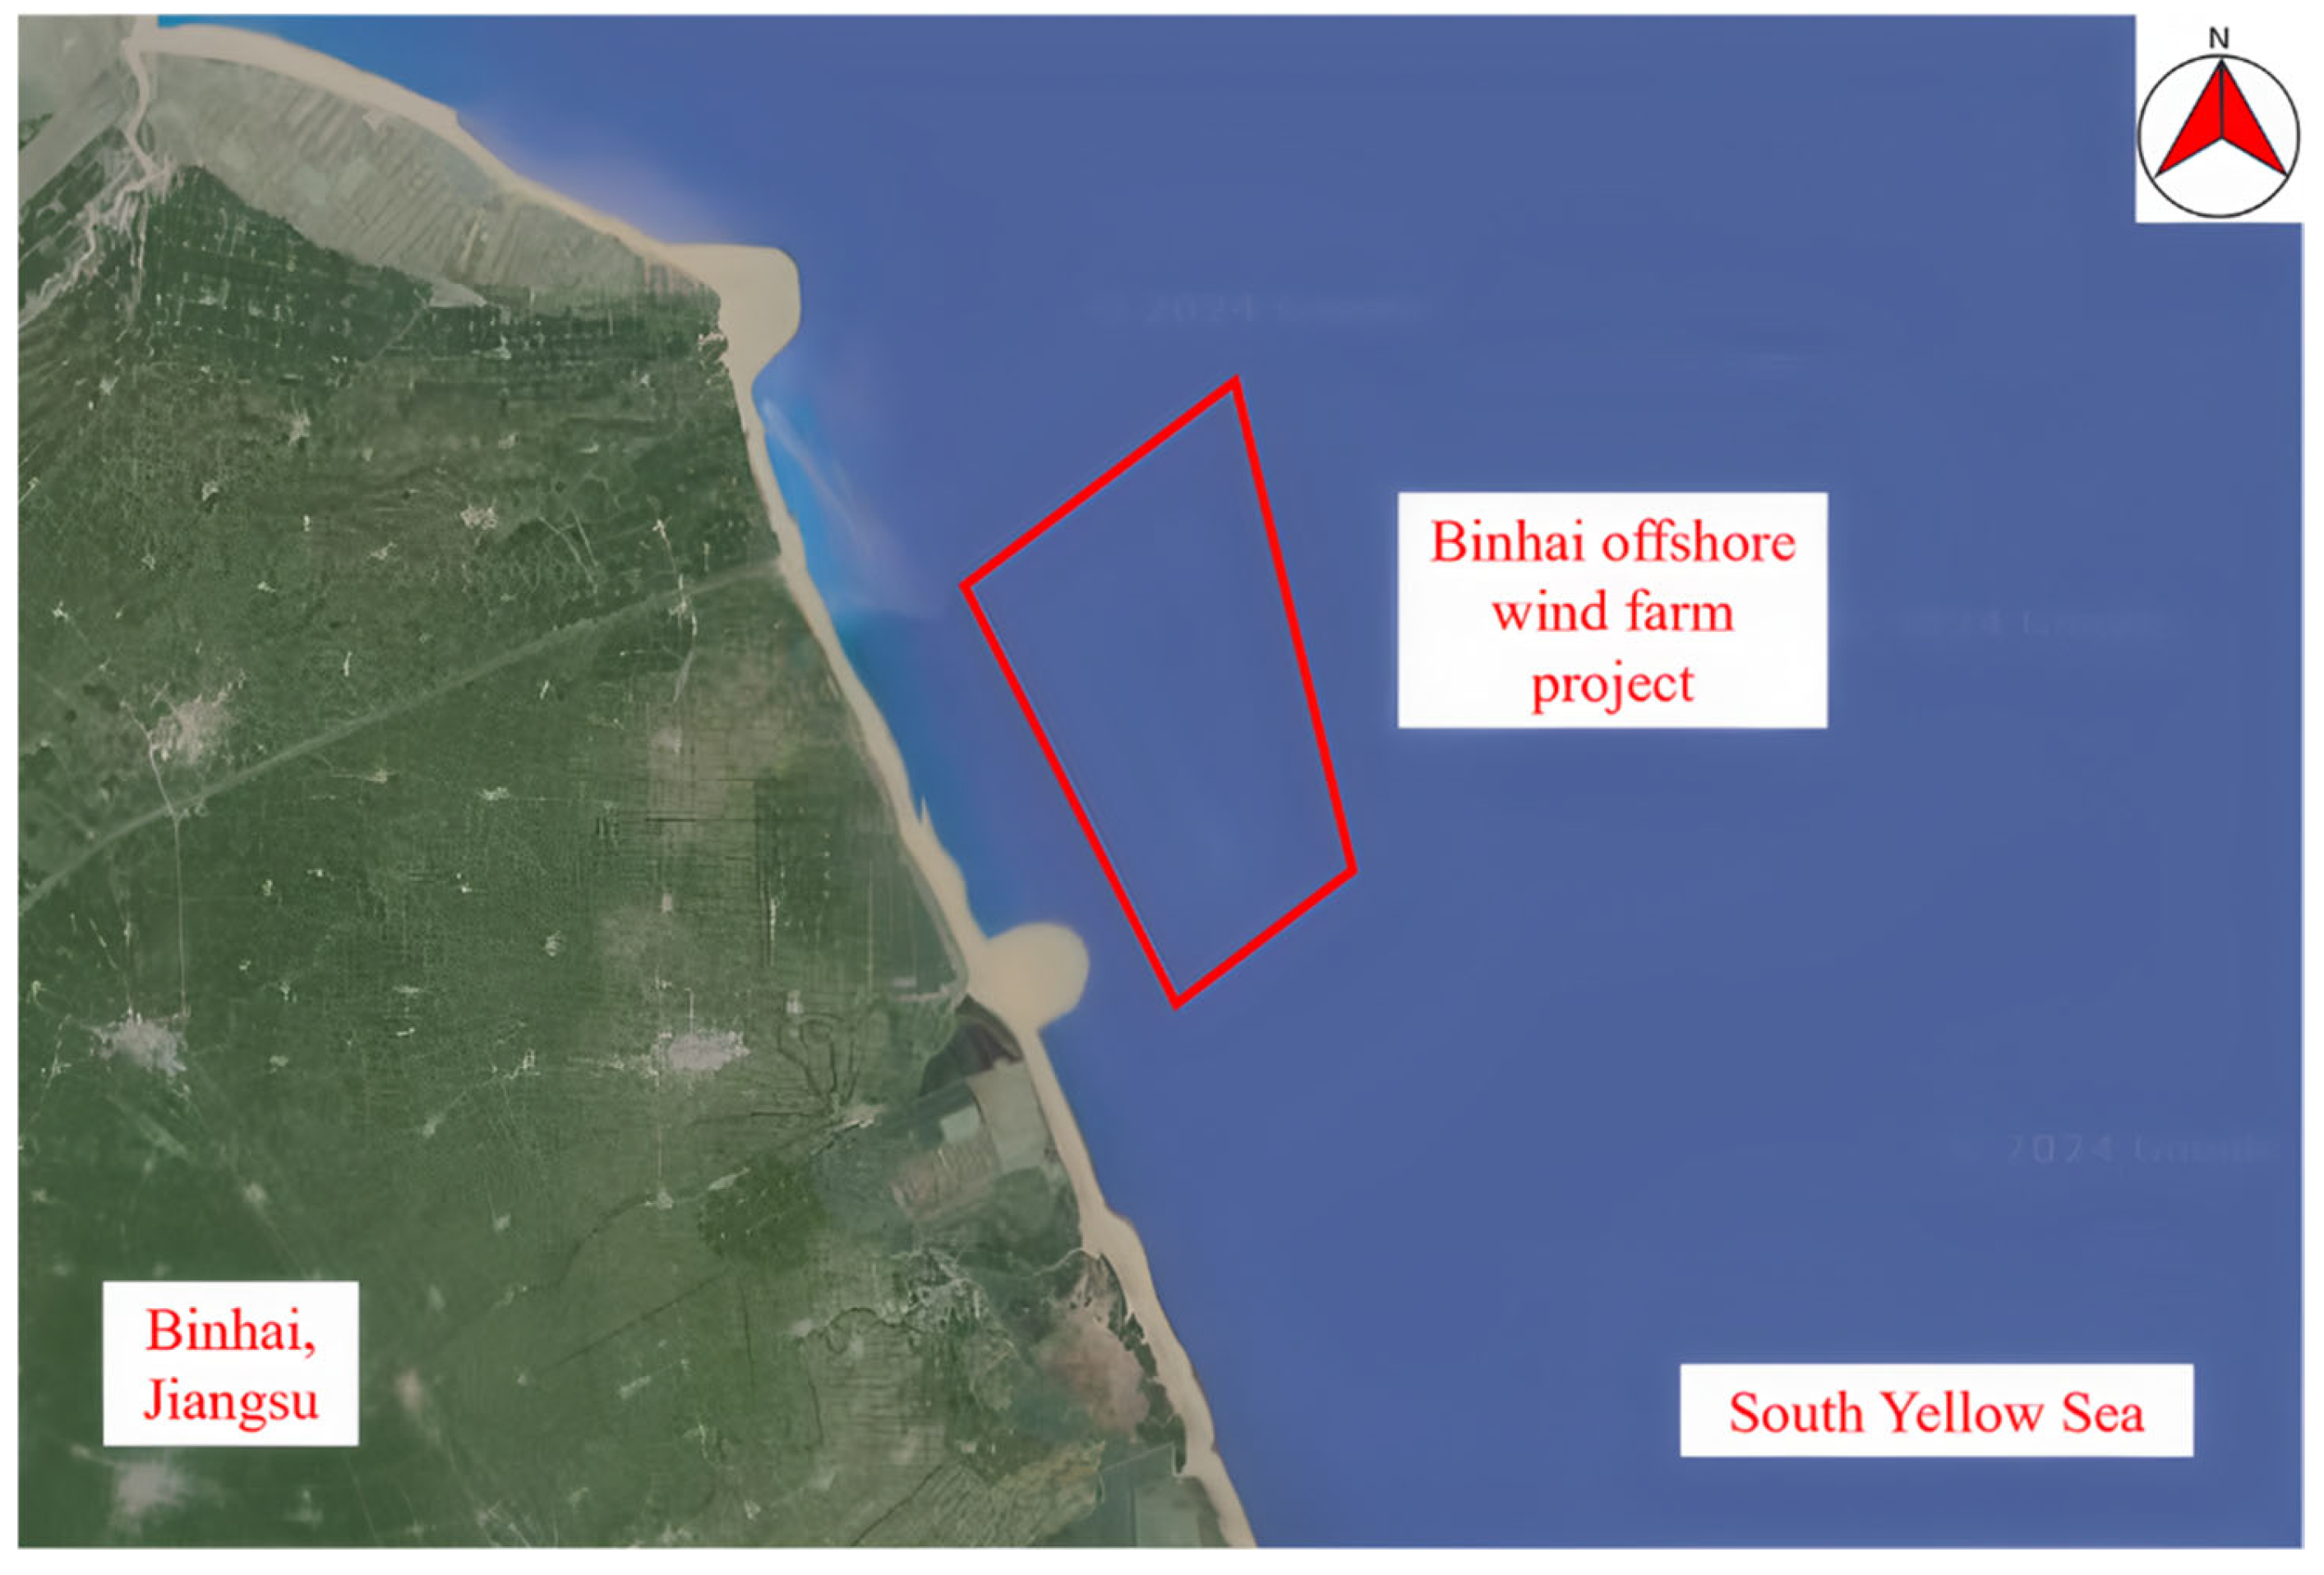
The very high shear strength of the dense sand layers poses significant challenges for in situ geotechnical investigations as probes are difficult to penetrate through such hard strata. In this case, the dense sand layers are drilled to create a hole, allowing the probe to continue advancing. The drilled sample of the dense sand layers can then be taken to a laboratory for further geotechnical tests. Dense sand layers were found at the Yellow Sea during the Binhai offshore wind farm project (Figure 9), which are located approximately 36 km from the shore and has a water depth of about 16–19 m. The planned wind farm extends about 13 km parallel to the coastline with a width of about 6.8 km, covering an area of around 48 km2. The project planned to install 75 offshore wind turbines, each with a capacity of 4.0 MW, for a total capacity of 300 MW. The seabed soil was found to consist of two layers (Layers 1 and 2), as presented in Table 5. The physical and mechanical characteristics of both layers were evaluated using laboratory testing.
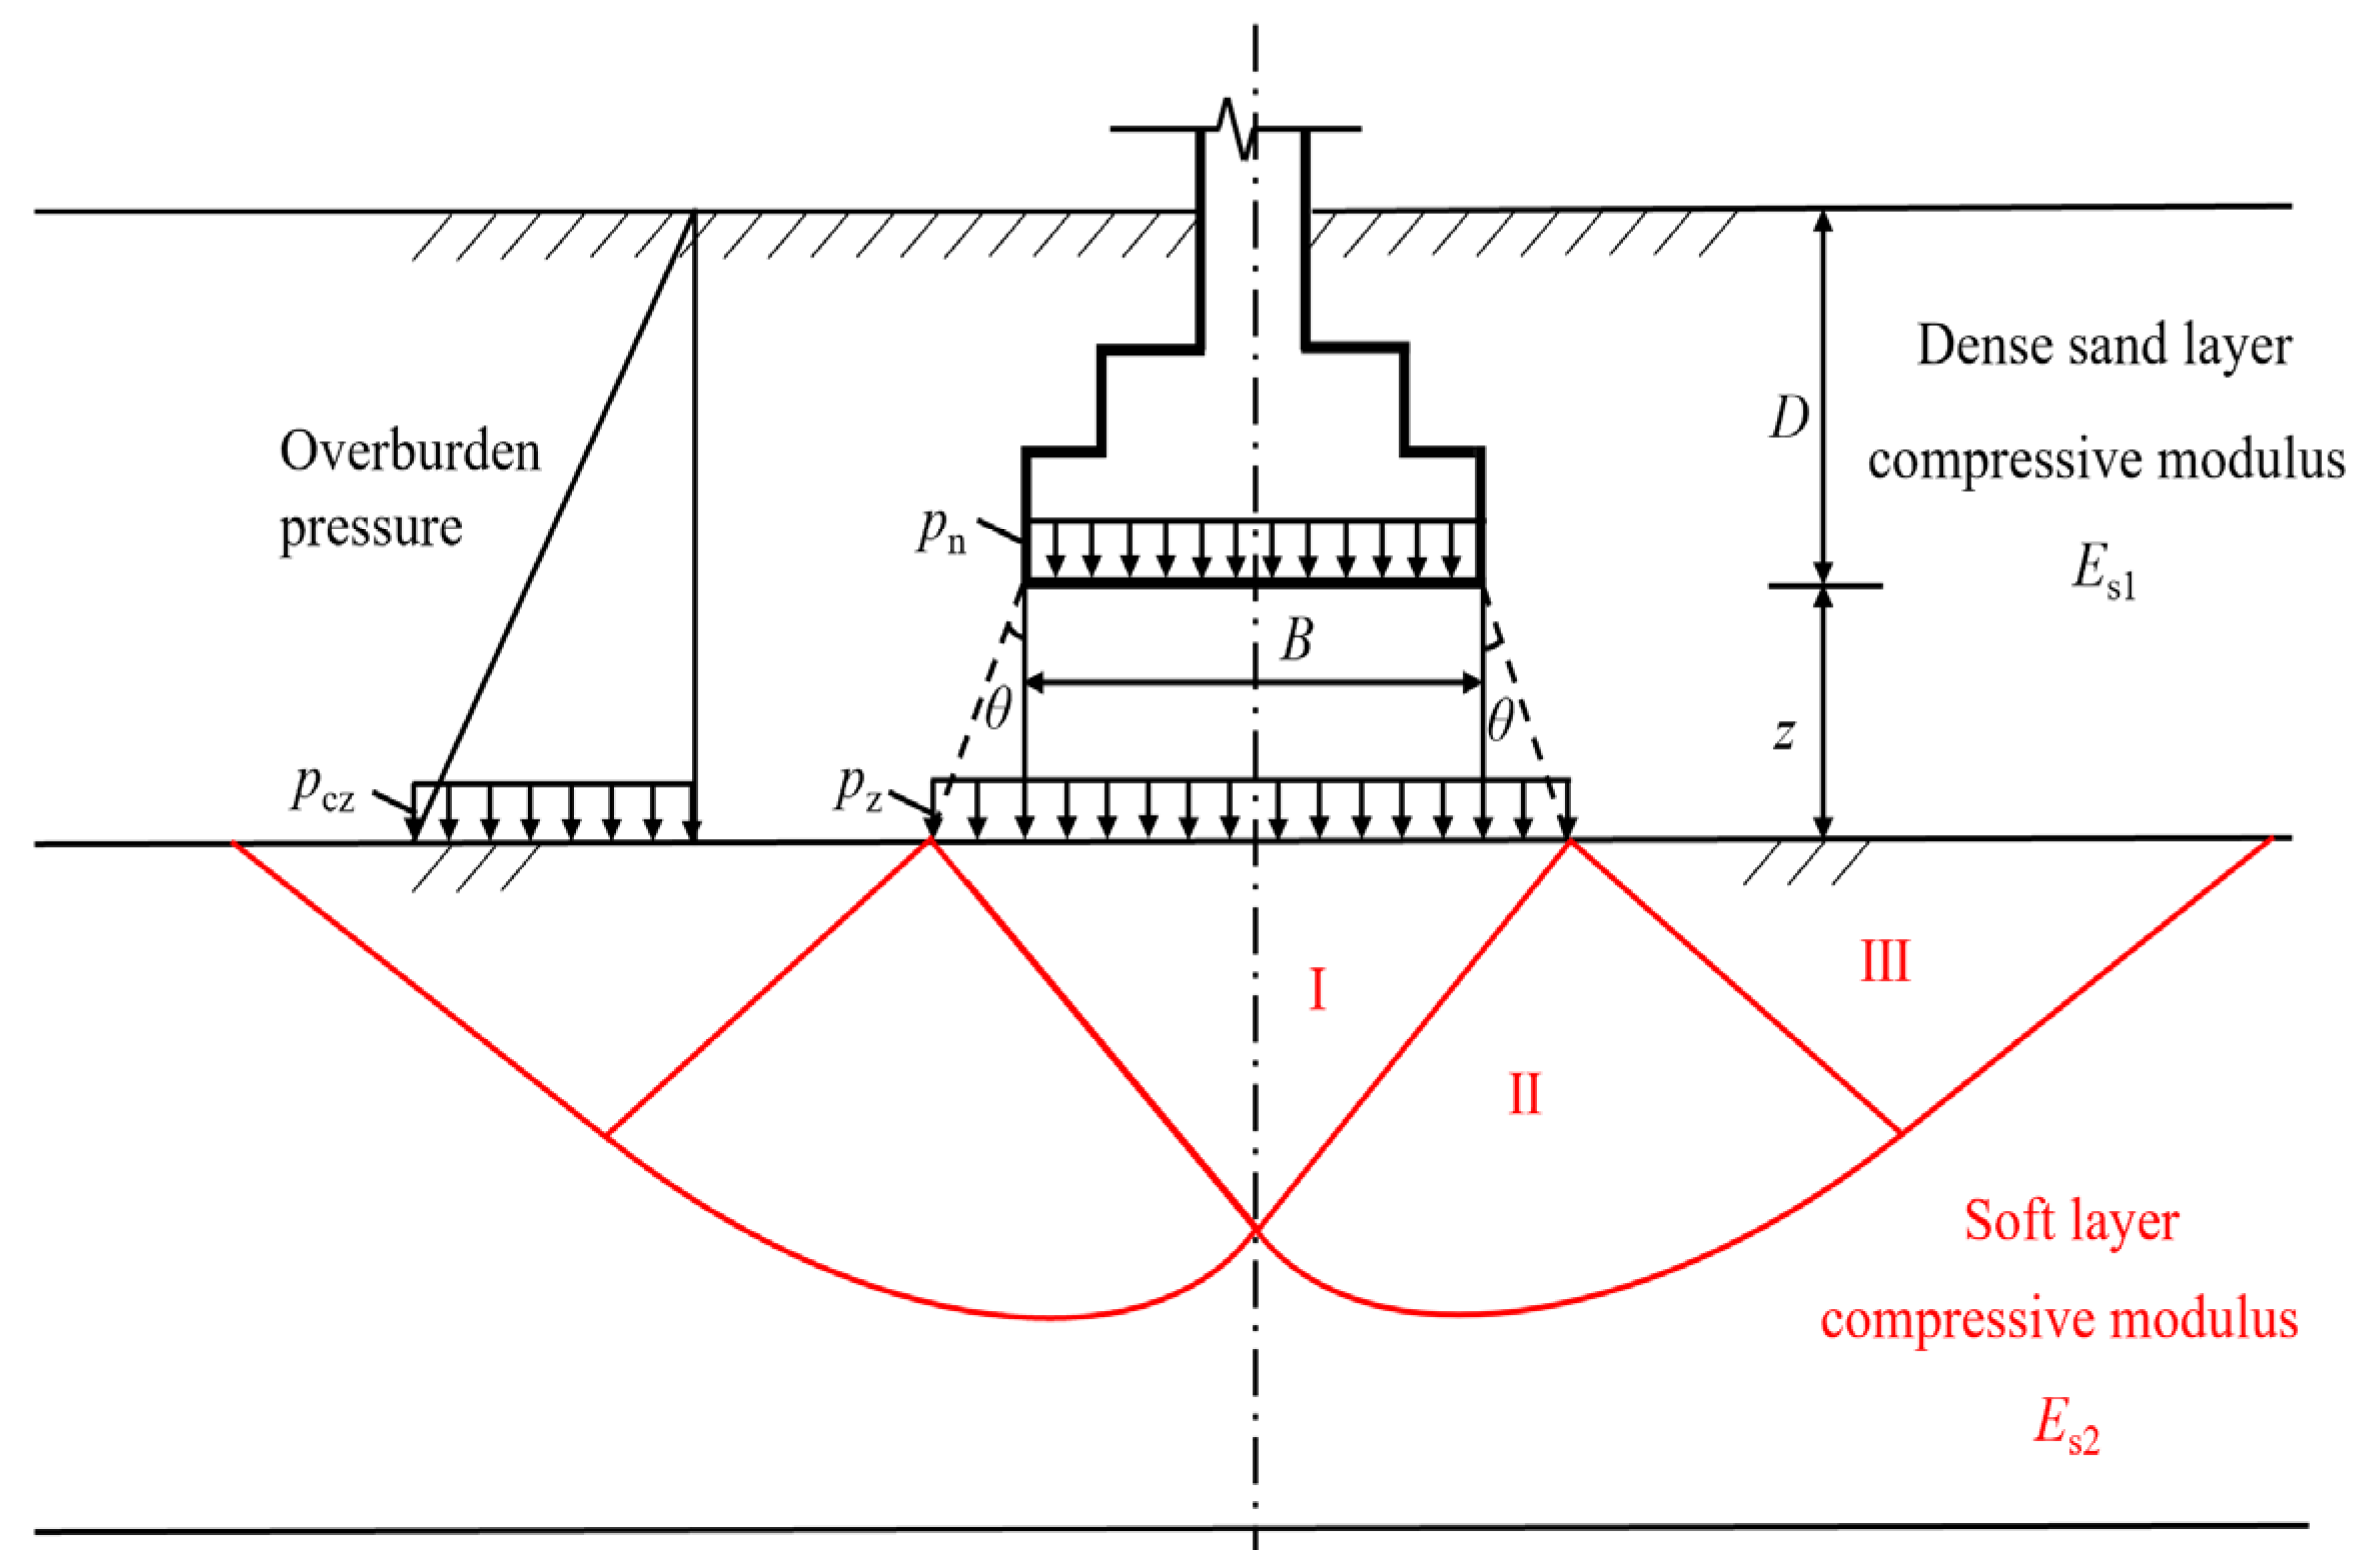
The dense sand layers, due to their very high strength values, can serve as bearing strata for offshore foundations. When the dense sand layers are underlain by a soft soil layer, it is essential to assess the potential for a ‘punch-through’ failure mechanism, where slip lines propagate through both the hard and soft layers [118,119]. The surcharge load on the foundation is distributed to the top surface of the underlying soft layer at a certain expansion angle (Figure 10). The stability of the soft layer, under the combined loading of the expanded surcharge and the self-weight pressure, can be evaluated by Prandtl’s solution [120]. The expanded surcharge can be calculated as follows:
p z = B p n B + 2 z tan θ
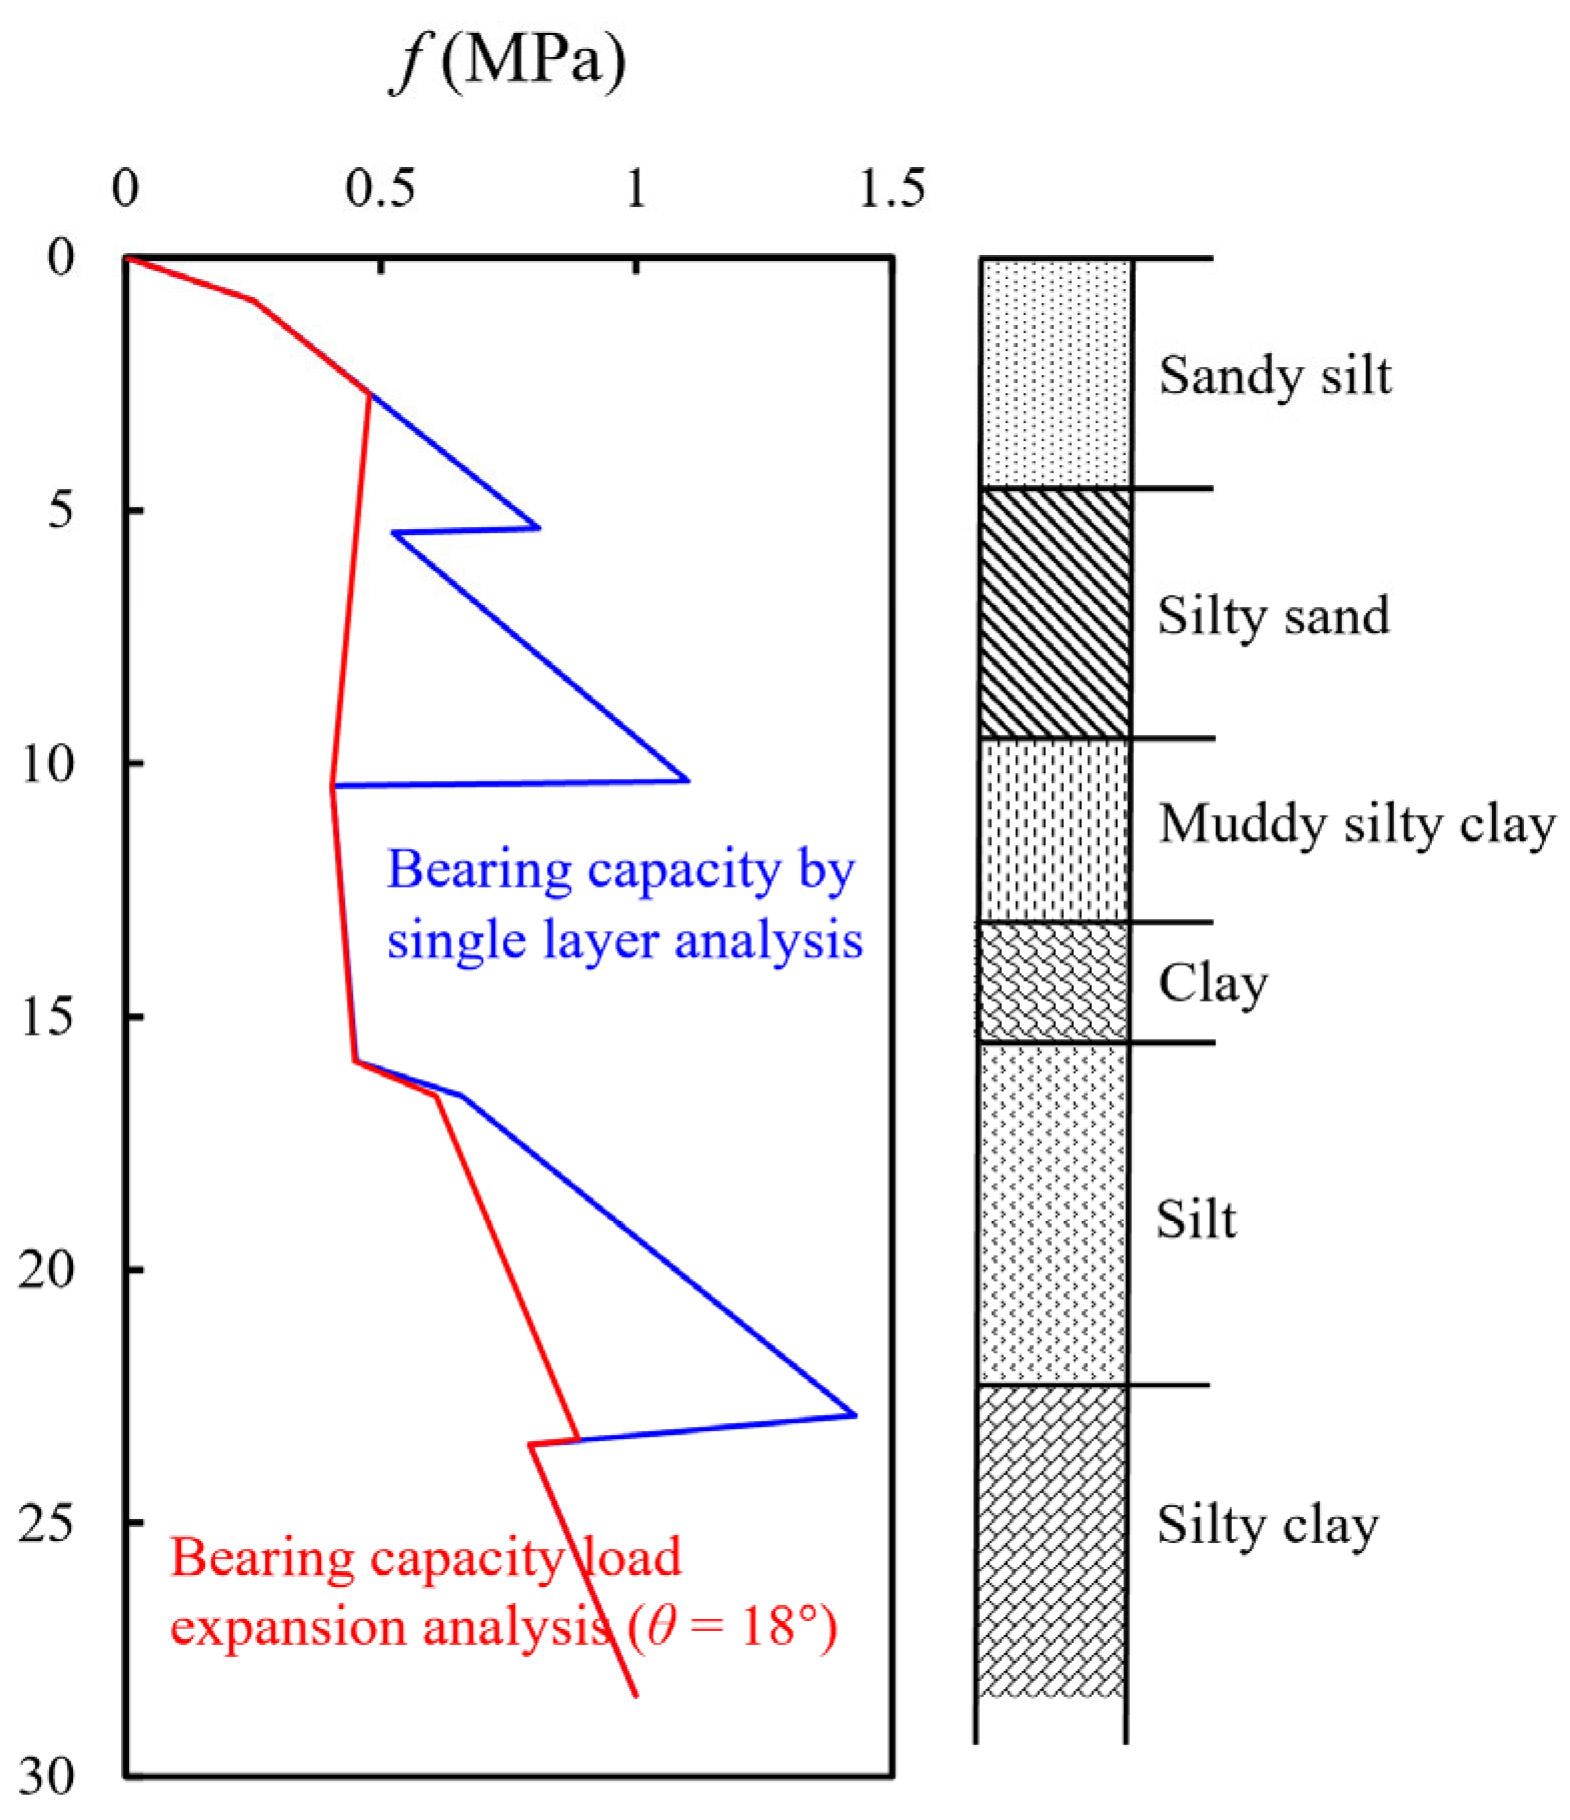
where pn is the surcharge pressure at the foundation base, B is the foundation width and z is the distance from the foundation base to the top of the soft layer. The expansion angle, θ, can be empirically determined from Table 6. Taking the Binhai offshore wind farm project at the South Yellow Sea as an example, both the conventional single-layer analysis and the load expansion analysis methods [11,13,121] were employed to predict the bearing capacity of the soil layer (Figure 11). If the total pressure at the bottom of foundation exceeds the bearing capacity of the underlying soft layer, a punch-through failure will occur.

3.5. Boulder Stones

Boulder stones are the remainders of the originally intact rock blocks that have undergone natural weathering. The boulder stones, also known as granite weathering balls, are generally spherical with diameters ranging from 0.5 to 8 m. The formation of the boulder stones is influenced by various factors, including lithology, joints, climate and topographic conditions [122,123]. The mechanical properties of scattering boulder stones greatly vary from one another and from those of the surrounding residual soils. Unlike the surrounding material, boulder stones lack joints and fissures and consist of moderately to slightly weathered rock mass with a compressive strength of up to 160 MPa.
Due to the extremely high strength of boulder stones, the probes of in situ investigation instruments are hard to penetrate through them. In such cases, the stones must be drilled out to allow the probes to advance. When boulder stones are encountered during pile driving, the pile foundation may fail to reach the designed elevation, which leads to insufficient bearing capacity and additional horizontal resistance. The bottom side of a steel pipe pile that comes into direct contact with the boulder stone is at risk of curling and undermines structural safety [124]. To tackle the challenges posed by boulder stones during pile driving, techniques such as pile planting, pile strengthening and hole-expanding have been developed [125,126]. When a shield machine encounters boulder stones in a stratum, these stones pose significant threats to the shield tool and the stratum stability, potentially causing accidents such as tunnel collapse and roof failures. Consequently, drilling and blasting become the primary method for fragmenting these boulders to facilitate subsequent operations.
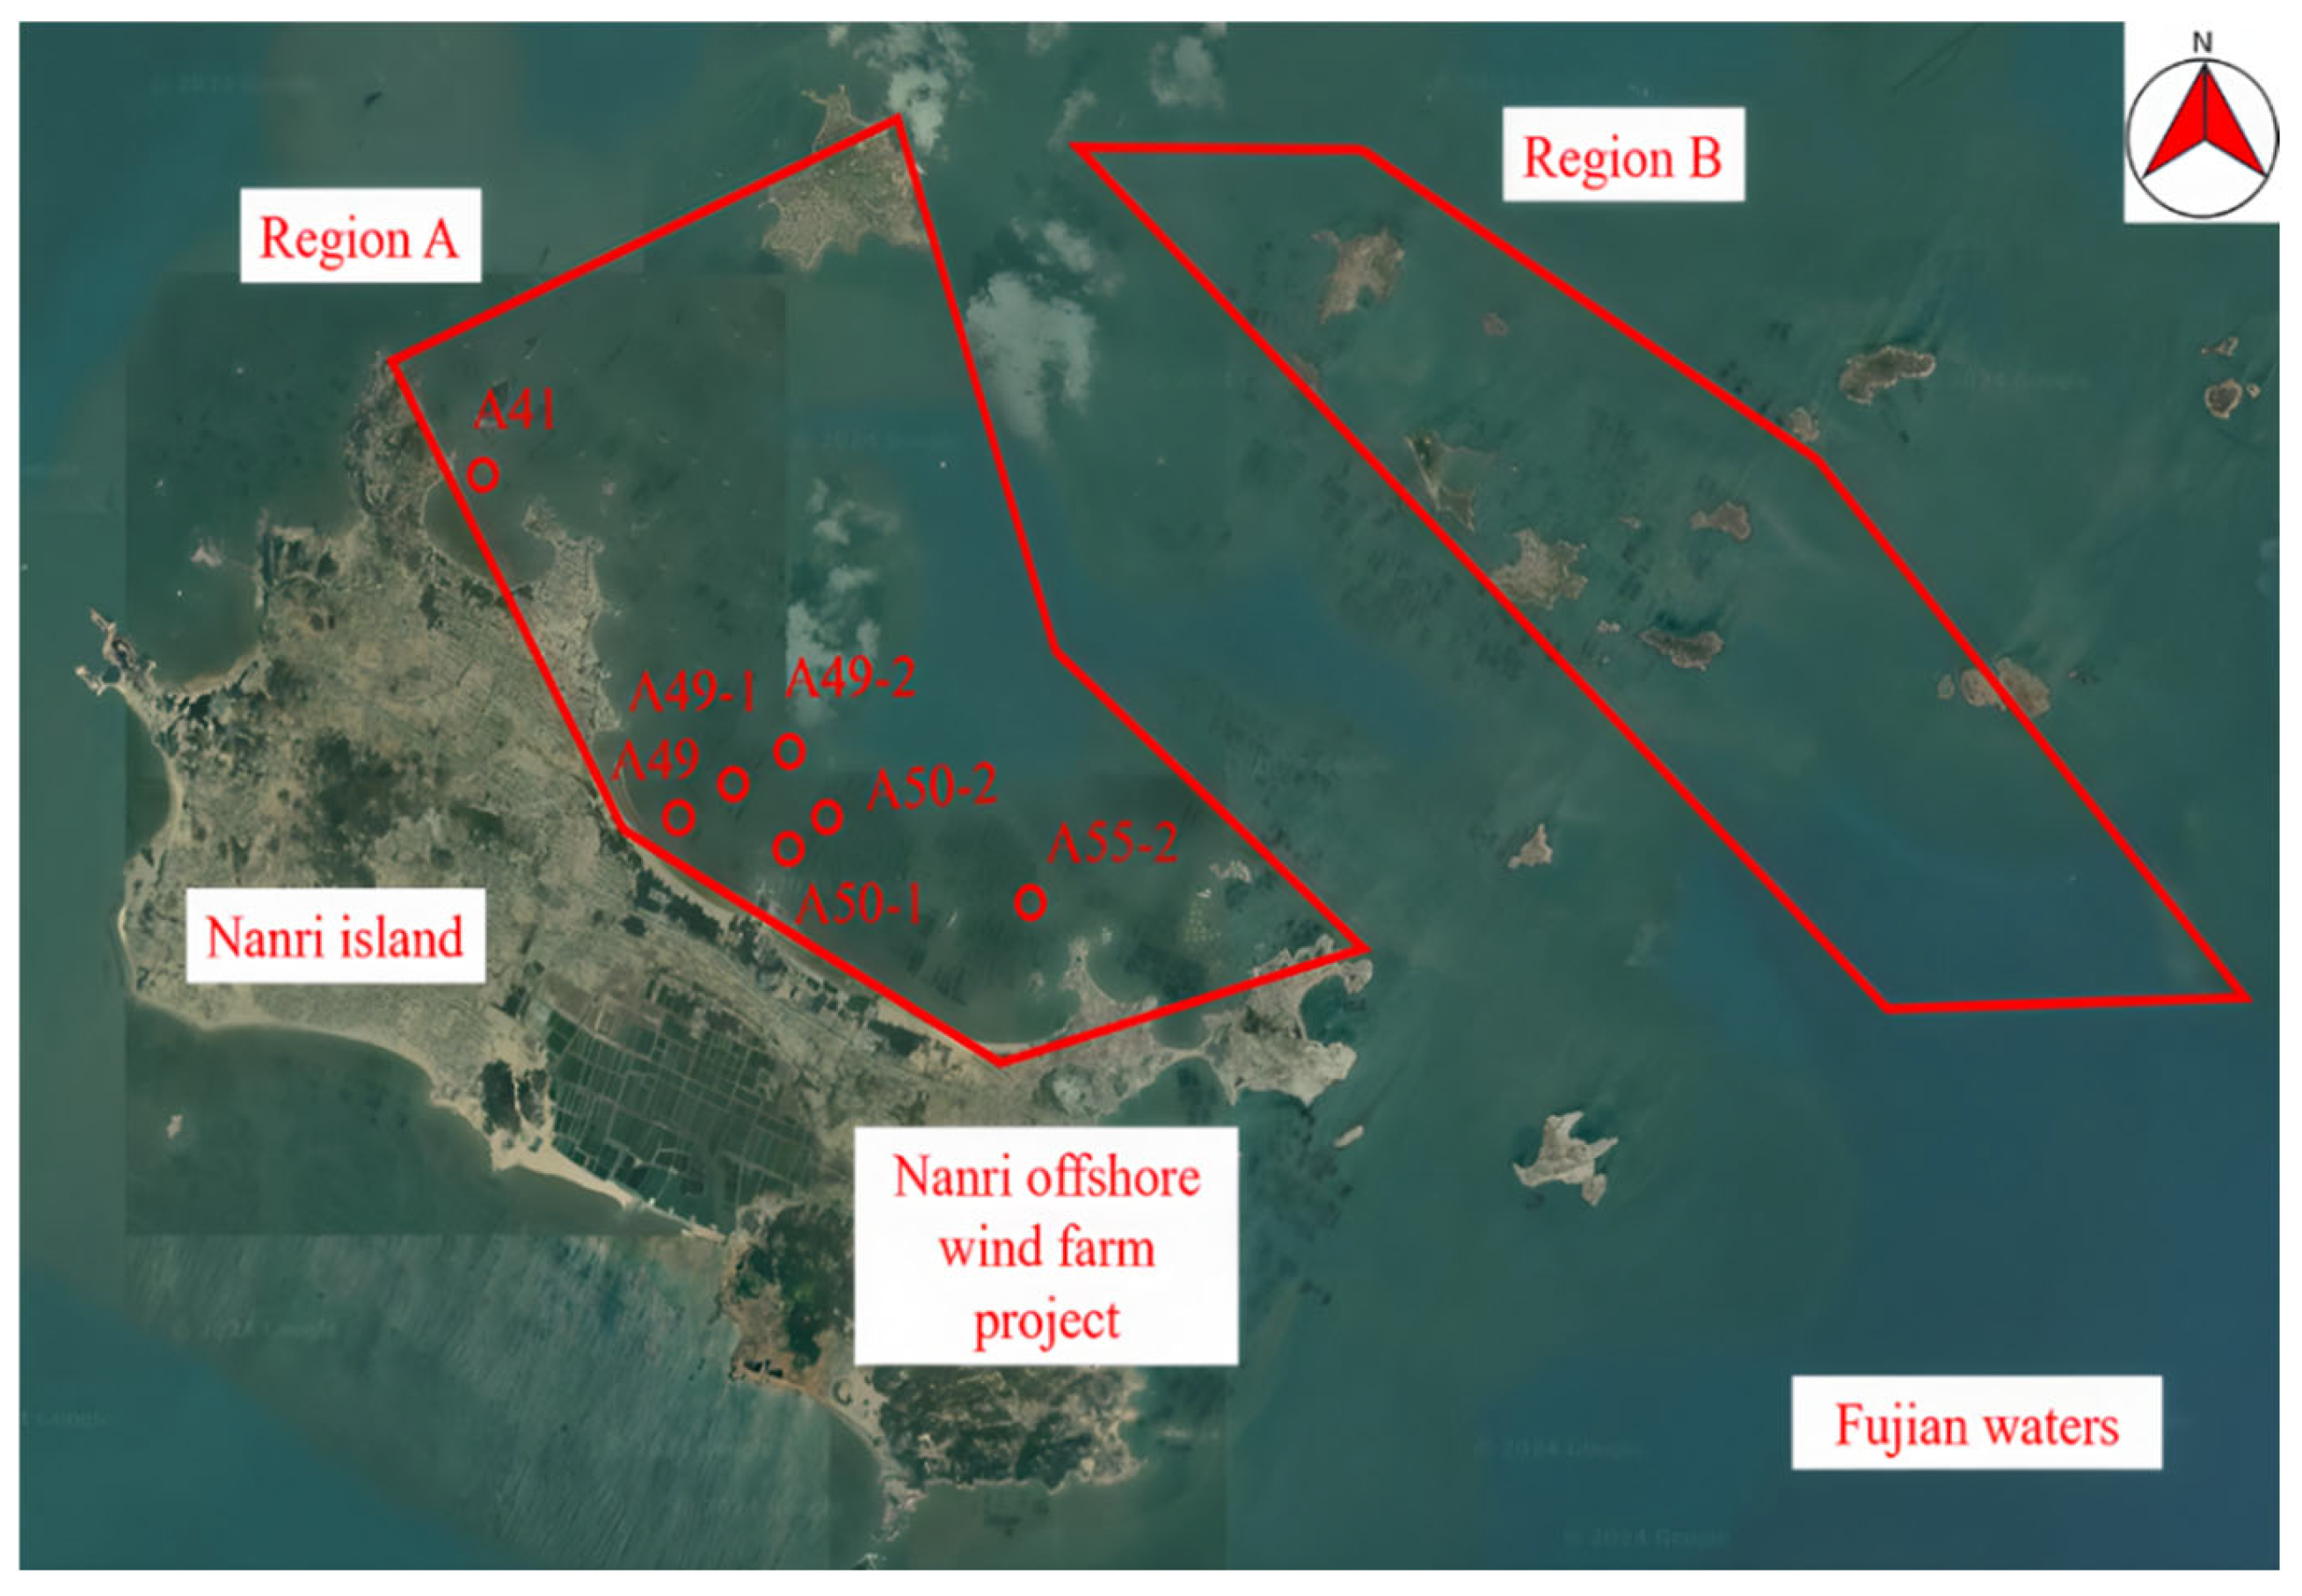
Boulder stones are a common geological phenomenon in granite regions (the eastern and southern parts of China), particularly in the Fujian and Guangdong offshore areas, where their burial and distribution are relatively random. A combination of drilling and geophysical methods is frequently used to identify boulders. Drilling provides the more accurate localization of the stones but is relatively expensive and limited by the survey area. In contrast, geo-physical techniques are more efficient but can be affected by the specific geological environment. During the Nanri offshore wind farm project, boulder stones were found at the Fujian offshore area (Figure 12). Drilling revealed uneven medium weathering (primarily spherical weathering) of the underlying bedrock, which generated boulder stones with sizes between 0.4 and 2.8 m. The distribution of boulder stones is presented in detail in Table 7. In engineering practices, the boulder stones need to be removed or smashed before the project is restarted.

4. Conclusions

This paper provides an overview of the challenges related to seabed soil conditions in offshore engineering in China. Five types of adverse geologic conditions, namely thick, soft mud layers; shallow gas and pockmarks; sand liquefaction; dense sand layers; and boulder stones, were presented with findings from site investigations for practical offshore engineering projects. Their formation mechanisms, engineering characteristics and distribution areas were also discussed. The main conclusions are as follows:
(1) The study areas are characterized by the presence of thick, soft mud layers, with thicknesses on the order of 10 to 30 m. These soft mud layers feature low shear strengths (8–50 kPa), low deformation moduli (0.1–2 MPa), high water contents (50–100%), high porosity ratios (1.2–2.3) and sensitive structural properties. Due to their low bearing capacities and susceptibility to seismic subsidence, the soft mud layers are unsuitable as bearing strata.
(2) Shallow gas can be categorized into biogenic gas, typically found in harbours, buried paleo-deltas and paleo-channels and thermogenic gas prevalent in hydrocarbon-rich basins. Due to its low shear strength and the risk of creep, the gas-bearing soil layer is not suitable as a bearing stratum. When penetrated, the gas-bearing soil layer can release flammable and explosive gases, sometimes erupting for months. Pre-releasing the gas by digging vent wells is an effective method to mitigate shallow gas hazards. Pockmarks, secondary features caused by shallow gas, not only alter the mechanical properties of the soil inside the pockmark but may also retain unreleased gas, posing additional threats. Therefore, in offshore projects, structures should be positioned to avoid pockmarks.
(3) Sand liquefaction primarily occurs in areas with predominantly sandy soils, a condition that is quite common off the coasts of China. To assess the risk of liquefaction, a preliminary evaluation is first made based on the clay content, followed by a more detailed determination using the SPT. Based on data from the SPTs conducted in Guangdong waters, the predictions of liquefaction levels by both the MOHURD code and the 1996 NCEER guideline are largely consistent.
(4) Dense sand layers are extensively found throughout the estuaries and coastal regions of China. Due to their high shear strength (cohesion c = 5–15 kPa; friction angle φ > 30°), these layers present challenges for investigating the underlying strata. The presence of hidden underlain soft soil layers can pose a risk of a ‘punch-through’ failure mechanism. Although dense layers may satisfy the bearing capacity requirements, it is crucial to ensure that the underlying soft soil layer is not punctured by the combined loading of the expanded surcharge and the self-weight pressure.
(5) Boulder stones, primarily granite weathering balls, are commonly found in the eastern and southern regions of China. During probe investigations and pile driving, these stones present significant challenges due to their high compressive strength (160 MPa), making it difficult for probes and piles to penetrate through them. In probe investigations, the probe is allowed to continue along the borehole by drilling. For pile driving, advanced installation techniques and hole-expanding methods have been developed to tackle the difficulties posed by these boulder stones. In shield digging, the presence of these stones pose a threat to both the shield tool and the stability of the surrounding strata. Drilling and blasting are commonly used methods to break up large boulders.
Although this study provides a comprehensive overview of five major adverse seabed conditions in China’s marine engineering industry, it is important to acknowledge its limitations. The findings and conclusions are primarily based on field investigations of specific project areas, which may not fully represent the overall picture of these geological hazards across Chinese waters or account for regional differences. The assessment methodologies, such as relying on standard penetration test (SPT) data from Guangdong for liquefaction evaluations, may not be directly applicable to geological contexts with different soil compositions or seismic activities, and their accuracy may vary under these conditions. Furthermore, the proposed mitigation strategies, including the pre-release of shallow gases or drilling and blasting of boulders, are based on existing engineering practices and may not have considered all potential operational challenges, environmental impacts or economic constraints in future projects. Lastly, this study focuses on the characterization of geological hazards without extensively quantifying threats within a probabilistic framework or providing detailed standardized design guidelines for structural adjustments under each specific condition.

Author Contributions

Conceptualization, X.W. and K.S.; Methodology, X.W. and H.Y.; Software, X.W.; Validation, X.W. and Y.D.; Formal analysis, X.W. and K.S.; Resources, Y.D. and K.S.; Data curation, K.W.; Writing—Original Draft, X.W. and Y.D.; Writing—Review & Editing, Y.D. and K.W.; Visualization, H.Y.; Supervision, Y.D.; Project administration, X.W. and H.Y.; Funding acquisition, Y.D. and K.S. All authors have read and agreed to the published version of the manuscript.

Funding

This research was funded by the National Natural Science Foundation of China (grant no. 42272328).

Data Availability Statement

The data that support the findings of this study are available from the corresponding author upon reasonable request.

Acknowledgments

The authors gratefully thank Xi Mei from the Qingdao Institute of Marine Geology for providing Figure 3.

Conflicts of Interest

No conflicts of interest exist regarding the submission of this manuscript, and the manuscript was approved by all authors for publication. On behalf of my co-authors, I would like to declare that the work described is original research that has not been published previously. All listed authors have approved the enclosed manuscript. The authors declare that they have no known competing financial interests or personal relationships that could have appeared to influence the work reported in this paper.

References

  1. Guo, X.Y.; Chen, X.Y.; Chen, X.; Sherman, P.; Wen, J.Y.; McElroy, M. Grid integration feasibility and investment planning of offshore wind power under carbon-neutral transition in China. Nat. Commun. 2023, 14, 2447. [Google Scholar] [CrossRef]
  2. Xia, S.Y.; Yang, Y.; Liu, Y. Potential of China’s offshore wind energy. Science 2023, 379, 888–899. [Google Scholar] [CrossRef]
  3. Dong, Y.K.; Wang, D.; Randolph, M. Runout of submarine landslide simulated with material point method. J. Hydrodyn. 2017, 29, 438–444. [Google Scholar] [CrossRef]
  4. Dong, Y.K.; Liu, Z.H.; Yan, D.T.; Sun, H.L.; Wang, D. Assessment of horizontal impact forces of submarine landslides upon fixed subsea pile foundations. Ocean. Eng. 2025, 340, 122250. [Google Scholar] [CrossRef]
  5. Global Wind Report 2024; Global Wind Energy Council (GWEC): Brussels, Belgium, 2024.
  6. Fan, N.; Jiang, J.X.; Dong, Y.K.; Guo, L.; Song, L.F. Approach for evaluating instantaneous impact forces during submarine slide-pipeline interaction considering the inertial action. Ocean Eng. 2022, 245, 110466. [Google Scholar] [CrossRef]
  7. Byrne, B.W.; Houlsby, G.T. Foundations for offshore wind turbines. Philos. Trans. R. Soc. London. Ser. A 2003, 361, 2909–2930. [Google Scholar] [CrossRef] [PubMed]
  8. Yang, Z.J.; Zou, X.J.; Chen, S. A parametric study of an innovative offshore foundation by the semi-analytical solution approach. Appl. Ocean Res. 2024, 148, 104036. [Google Scholar] [CrossRef]
  9. Berthelot, P.; Puech, A.; Ropers, F. Recommendations for Planning and Designing Foundations of Offshore Wind Turbines; French Society on Soil Mechanics and Geotechnical Engineering (CFMS): Paris, French, 2020. [Google Scholar]
  10. ISO 19901-4; Petroleum and Natural Gas Industries-Specific Requirements Structures-Part4: Geotechnical and Foundation Design Considerations, 1st Edition. International Organization for Standardization (ISO): Geneva, Switzerland, 2003.
  11. American Petroleum Institute (API). Recommended Practice for Planning, Designing and Constructing Fixed Offshore Platforms—Working Stress Design (API RP 2A—WSD), 22nd ed.; American Petroleum Institute (API): Washington, DC, USA, 2014. [Google Scholar]
  12. Det Norske Veritas (DNV). Design of Offshore Wind Turbine Structures (DNV-OS-J101); Det Norske Veritas: Høvik, Norway, 2014. [Google Scholar]
  13. NB\T 10105-2018; Code for Design of Wind Turbine Generator System Foundations for Offshore Wind Power Projects. National Energy Administration (NEA); China Water and Power Press: Beijing, China, 2018.
  14. Feng, X.W.; Randolph, M.F.; Gourvenec, S. An analytical solution for the undrained horizontal torsional resistance of mudmats. Géotechnique 2017, 67, 325–337. [Google Scholar] [CrossRef]
  15. Dong, Y.K.; Yan, D.T.; Feng, X.W. Stability of tracked vehicles on soft grounds under multi-directional loading. Can. Geotech. J. 2023, 60, 1743–1755. [Google Scholar] [CrossRef]
  16. Hunt, R.J.; Marsh, P.D. Opportunities to improve the operational and technical management of jack-up deployments. Mar. Struct. 2004, 17, 261–273. [Google Scholar] [CrossRef]
  17. Lee, K.; Ng, P. A geotechnical investigation of marine deposits in a nearshore seabed for land reclamation. Can. Geotech. J. 1999, 36, 981–1000. [Google Scholar] [CrossRef]
  18. Wood, M.; Knight, P. Site investigation and geotechnical design strategy for offshore wind development. In Proceedings of the 18th International Conference on Soil Mechanics and Geotechnical Engineering, Paris, French, 2–6 September 2013; pp. 2375–2378. [Google Scholar]
  19. Sanjeev, M.; O’Connell, D. Geohazards to Offshore Wind Farms on the U.S. Atlantic Coast. In Proceedings of the 34th International Ocean and Polar Engineering Conference, Rhodes, Greece, 16–21 June 2024. [Google Scholar]
  20. Lunne, T.; Eidsmoen, T.; Gillespi, D.; Howland, J.D. Laboratory and field evaluation of cone penetrometers. In Proceedings of the In-Situ ‘86, ASCE Specialty Conference, Blacksburg, VA, USA, 23–25 June 1986. [Google Scholar]
  21. Robertson, P.K. Interpretation of cone penetration tests—A unified approach. Can. Geotech. J. 2009, 46, 1337–1355. [Google Scholar] [CrossRef]
  22. Lay, T.; Nishenko, S.P. Updated concepts of seismic gaps and asperities to assess great earthquake hazard along South America. Proc. Natl. Acad. Sci. USA 2022, 119, e2216843119. [Google Scholar] [CrossRef] [PubMed]
  23. Wirth, E.A.; Sahakian, V.J.; Wallace, I.M.; Melnick, D. The occurrence and hazards of great subduction zone earthquakes. Nat. Rev. Earth Environ. 2022, 3, 125–140. [Google Scholar] [CrossRef]
  24. Arnulf, A.F.; Bassett, D.; Harding, A.J.; Kodaira, S.; Nakanishi, A.; Moore, G. Upper-plate controls on subduction zone geometry, hydration and earthquake behaviour. Nat. Geosci. 2022, 15, 143–148. [Google Scholar] [CrossRef]
  25. Folk, R.L. The Distinction between Grain Size and Mineral Composition in Sedimentary-Rock Nomenclature. J. Geol. 1954, 62, 344–359. [Google Scholar] [CrossRef]
  26. Wang, H.J.; Wang, A.M.; Bi, N.S.; Zeng, X.M.; Xiao, H.H. Seasonal distribution of suspended sediment in the Bohai Sea, China. Cont. Shelf Res. 2014, 90, 17–32. [Google Scholar] [CrossRef]
  27. Li, X.S.; Zhao, Y.X.; Yang, Z.S.; Qiao, S.Q.; Liu, B.H.; Xie, Q.H.; Saito, Y.; Liu, C.G. Holocene marine deposits in the Bohai Sea: Depocenters, sediment sources, and oceanic and tectonic influences. Geomorphology 2023, 442, 108913. [Google Scholar] [CrossRef]
  28. Liu, Z.X.; Xia, D.X.; Berne, S.; Wang, K.Y.; Marsset, T.; Tang, Y.X.; Bourillet, J.F. Tidal deposition systems of China’s continental shelf, with special reference to the eastern Bohai Sea. Mar. Geol. 1998, 145, 225–253. [Google Scholar]
  29. Jin, X.S.; Shan, X.J.; Li, X.S.; Wang, J.; Cui, Y.; Zuo, T. Long-term changes in the fishery ecosystem structure of Laizhou Bay, China. Sci. China Earth Sci. 2013, 56, 366–374. [Google Scholar] [CrossRef]
  30. Song, D.B.; Gao, Z.Q.; Zhang, H.; Xu, F.X.; Zheng, X.Y.; Ai, J.Q.; Hu, X.K.; Huang, G.P.; Zhang, H.B. GIS-based health assessment of the marine ecosystem in Laizhou Bay, China. Marine Pollut. Bull. 2017, 125, 242–249. [Google Scholar] [CrossRef] [PubMed]
  31. Zhan, C.; Wang, Q.; Cui, B.L.; Zeng, L.; Dong, C.; Li, X.Y.; Yu, X.; Wang, X.; Liu, X.B. The morphodynamic difference in the western and southern coasts of Laizhou Bay: Responses to the Yellow River Estuary evolution in the recent 60 years. Glob. Planet. Change 2020, 187, 103138. [Google Scholar] [CrossRef]
  32. Shen, W.; Peng, J.B.; Qiao, Z.T.; Li, T.L.; Li, P.; Sun, X.L.; Chen, Y.Q.; Li, J.H. Plowing mechanism of rapid flow-like loess landslides: Insights from MPM modeling. Eng. Geol. 2024, 335, 107532. [Google Scholar] [CrossRef]
  33. Gao, M.S.; Guo, F.; Huang, X.Y.; Hou, G.H. Sediment distribution and provenance since Late Pleistocene in Laizhou Bay, Bohai Sea, China. China Geol. 2019, 2, 16–25. [Google Scholar] [CrossRef]
  34. Wang, Y.H.; Li, G.X.; Zhang, W.G.; Dong, P. Sedimentary environment and formation mechanism of the mud deposit in the central South Yellow Sea during the past 40kyr. Mar. Geol. 2014, 347, 123–135. [Google Scholar] [CrossRef]
  35. Zhang, Z.H.; Qu, F.Y.; Wang, S.Q. Sustainable development of the Yellow Sea Large Marine Ecosystem. Deep. Sea Res. Part II Top. Stud. Oceanogr. 2019, 163, 102–107. [Google Scholar] [CrossRef]
  36. Xia, C.S.; Qiao, F.L.; Yang, Y.Z.; Ma, J.; Yuan, Y.L. Three-dimensional structure of the summertime circulation in the Yellow Sea from a wave-tide-circulation coupled model. J. Geophys. Res. 2006, 111, 2005JC003218. [Google Scholar] [CrossRef]
  37. Yang, S.Y.; Jung, H.S.; Lim, D.I.; Li, C.X. A review on the provenance discrimination of sediments in the Yellow Sea. Earth-Sci. Rev. 2003, 63, 93–120. [Google Scholar] [CrossRef]
  38. Yao, Y.J.; Chen, C.F.; Feng, Z.Q.; Zhang, S.Y.; Hao, T.Y.; Wan, R.S. Tectonic evolution and hydrocarbon potential in northern area of the South Yellow Sea. J. Earth Sci. 2010, 21, 71–82. [Google Scholar] [CrossRef]
  39. Qi, F.K.; Wu, X.; Wang, Z.W.; Wang, C.H.; Duan, H.Q.; Liu, M.; Xu, J.P. Transport and deposition processes of the sediment depocenter off the Shandong Peninsula: An observational study. Cont. Shelf Res. 2022, 244, 104763. [Google Scholar] [CrossRef]
  40. Liu, X.; Tang, L.Q.; Li, L.C.; Zhang, Z.Q.; Sun, J.; Wu, W.B. A novel theoretical model of heterogeneous soil-pile interaction for investigating the torsionally loaded pile. Appl. Math. Model. 2025, 139, 115833. [Google Scholar] [CrossRef]
  41. Fu, Y.T.; Chen, S.J.; Ji, H.Y.; Fan, Y.S.; Li, P. The modern Yellow River delta in transition: Causes and implications. Mar. Geol. 2021, 436, 106476. [Google Scholar] [CrossRef]
  42. Kang, Y.Y.; He, J.Y.; Wang, B.; Lei, J.; Wang, Z.H.; Ding, X.R. Geomorphic evolution of radial sand ridges in the South Yellow Sea observed from satellites. Remote Sens. 2022, 14, 287. [Google Scholar] [CrossRef]
  43. Zhou, C.Y.; Dong, P.; Li, G.X. Hydrodynamic processes and their impacts on the mud deposit in the Southern Yellow Sea. Mar. Geol. 2015, 360, 1–16. [Google Scholar] [CrossRef]
  44. Wang, N.R.; Chen, K.F.; Lu, P.D.; Chen, Y.P.; Wang, Y.H.; Zhang, J.S. Effects of tidal variations on storm waves: A case study of the radial sand ridges along China’s Jiangsu coast during Typhoon Muifa. Ocean Eng. 2019, 190, 106444. [Google Scholar] [CrossRef]
  45. Nakamura, H.; Nishina, A.; Liu, Z.J.; Tanaka, F.; Wimbush, M.; Park, J. Intermediate and deep water formation in the Okinawa Trough. J. Geophys. Res. Ocean 2013, 118, 6881–6893. [Google Scholar] [CrossRef]
  46. Du, W.J.; Fu, X.F.; Sheng, Q.; Chen, J.; Zhou, Y.Q.; Zheng, S.J. Dynamic response of slopes under near-field seismic excitation using the material point method. Comput. Geotech. 2025, 180, 107100. [Google Scholar] [CrossRef]
  47. Yan, D.D.; Wünnemann, B.; Gao, S.; Zhang, Y.Z. Early Holocene tidal flat evolution in a western embayment of East China Sea, in response to sea level rise episodes. Quat. Sci. Rev. 2020, 250, 106642. [Google Scholar] [CrossRef]
  48. Yang, J.; Zhou, S.; Zhou, J.X.; Lynch, J.F. Internal wave characteristics at the ASIAEX site in the East China Sea. IEEE J. Ocean. Eng. 2004, 29, 1054–1060. [Google Scholar] [CrossRef]
  49. Wu, R.H.; Jiang, Z.T.; Li, C.Y. Revisiting the tidal dynamics in the complex Zhoushan Archipelago waters: A numerical experiment. Ocean Model. 2018, 132, 139–156. [Google Scholar] [CrossRef]
  50. Xu, K.H.; Milliman, J.D. Seasonal variations of sediment discharge from the Yangtze River before and after impoundment of the Three Gorges Dam. Geomorphology 2009, 104, 276–283. [Google Scholar] [CrossRef]
  51. Feng, J.L.; Li, W.S.; Wang, H.; Zhang, J.L.; Dong, J.X. Evaluation of sea level rise and associated responses in Hangzhou Bay from 1978 to 2017. Adv. Clim. Change Res. 2018, 9, 227–233. [Google Scholar] [CrossRef]
  52. Xie, D.F.; Pan, C.H.; Wu, X.G.; Gao, S.; Wang, Z.B. Local human activities overwhelm decreased sediment supply from the Changjiang River: Continued rapid accumulation in the Hangzhou Bay-Qiantang Estuary system. Mar. Geol. 2017, 392, 66–77. [Google Scholar] [CrossRef]
  53. Xie, D.F.; Gao, S.; Wang, Z.B.; Pan, C.H.; Wu, X.G.; Wang, Q.S. Morphodynamic modeling of a large inside sandbar and its dextral morphology in a convergent estuary: Qiantang Estuary, China. J. Geophys. Res. Earth Surf. 2017, 122, 1553–1572. [Google Scholar] [CrossRef]
  54. Yu, Q.; Wang, Y.W.; Gao, S.; Flemming, B. Modeling the formation of a sand bar within a large funnel-shaped, tide-dominated estuary: Qiantangjiang Estuary, China. Mar. Geol. 2012, 68, 63–76. [Google Scholar] [CrossRef]
  55. Guo, X.J.; Yan, X.X.; Zheng, S.W.; Wang, H.M.; Yin, P. Characteristics of high-resolution subaqueous micro-topography in the Jinshan Deep Trough and its implications for riverbed deformation, Hangzhou Bay, China. Estuar. Coast. Shelf Sci. 2021, 250, 107147. [Google Scholar] [CrossRef]
  56. Xie, D.F.; Gao, S.; Wang, Z.B.; Pan, C.H. Numerical modeling of tidal currents, sediment transport and morphological evolution in Hangzhou Bay, China. Int. J. Sediment Res. 2013, 28, 316–328. [Google Scholar] [CrossRef]
  57. Xie, D.F.; Wang, Z.B.; Gao, S.; De Vriend, H.J. Modeling the tidal channel morphodynamics in a macro-tidal embayment, Hangzhou Bay, China. Cont. Shelf Res. 2009, 29, 1757–1767. [Google Scholar] [CrossRef]
  58. Fang, H.W.; Huang, L.; Wang, J.Y.; He, G.J.; Reible, D. Environmental assessment of heavy metal transport and transformation in the Hangzhou Bay, China. J. Hazard. Mater. 2016, 302, 447–457. [Google Scholar] [CrossRef]
  59. Zhu, L.J.; Liu, K.P.; Fan, H.X.; Cao, S.; Chen, H.; Wang, J.Z.; Wang, Z.H. Scour Beneath and Adjacent to Submarine Pipelines with Spoilers on a Cohesive Seabed: Case Study of Hangzhou Bay, China. J. Waterw. Port Coast. Ocean Eng. 2019, 145, 05018009. [Google Scholar] [CrossRef]
  60. Han, A.Q.; Kao, S.J.; Lin, W.F.; Lin, Q.Y.; Han, L.L.; Zou, W.B.; Tan, E.H.; Lai, Y.; Ding, G.M.; Lin, H. Nutrient budgets and biogeochemical dynamics in Sansha Bay, China: A coastal bay affected by intensive mariculture. J. Geophys. Res. Biogeosciences 2021, 126, e2020JG006220. [Google Scholar] [CrossRef]
  61. Fan, L.Y.; Cui, L.; Zhu, Z.Q.; Sheng, Q.; Zheng, J.J.; Dong, Y.K. Elaborate numerical analysis and new fibre Bragg grating monitoring methods for the ground pressure in shallow large-diameter shield tunnels: A case study of the yellow crane tower tunnel project. Bull. Eng. Geol. Environ. 2025, 84, 63. [Google Scholar] [CrossRef]
  62. Wang, J.F. Analysis of the Evolution of Troughs and Shoals and Sediment Transport in Quanzhou Bay. Hydro-Science and Engineering. 2007, 3, 26–31. [Google Scholar]
  63. Li, X.; Wang, J.R.; Yin, K.; Chen, Q.; Liu, W.; Huang, Y.N.; Wang, Y.C.; Wu, Z.S.; Lin, J.S. Characteristics of clay minerals in sediments of Xinghua Bay and Nanri Channel in Fujian Province and their paleoenvironmental significance. J. Mar. Sci. Eng. 2024, 12, 1270. [Google Scholar] [CrossRef]
  64. Xu, Y.Q.; Li, P.Y.; Li, P.; Liu, L.J.; Cao, C.X.; Feng, X.L. Physical and mechanical properties of fine-grained soil in the Zhejiang-Fujian coastal area, China. Mar. Georesources Geotechnol. 2011, 29, 333–345. [Google Scholar] [CrossRef]
  65. Chao, S.Y.; Shaw, P.T.; Wu, S.Y. Deep water ventilation in the South China Sea. Deep. Sea Res. Part I Oceanogr. Res. Pap. 1996, 43, 445–466. [Google Scholar] [CrossRef]
  66. Fang, G.H.; Kwok, Y.K.; Yu, K.F.; Zhu, Y.H. Numerical simulation of principal tidal constituents in the South China Sea, Gulf of Tonkin and Gulf of Thailand. Cont. Shelf Res. 1999, 19, 845–869. [Google Scholar] [CrossRef]
  67. Bai, P.; Yang, J.L.; Xie, L.L.; Zhang, S.W.; Ling, Z. Effect of topography on the cold-water region in the east entrance area of Qiongzhou Strait. Coast. Shelf Sci. 2020, 242, 106820. [Google Scholar] [CrossRef]
  68. Zhang, H.; Cheng, W.C.; Qiu, X.X.; Feng, X.B.; Gong, W.P. Tide-surge interaction along the east coast of the Leizhou Peninsula, South China Sea. Cont. Shelf Res. 2017, 142, 32–49. [Google Scholar] [CrossRef]
  69. Wang, H.B.; Wu, Y.X.; Wan, X.M.; Liu, X.; Wang, S. Grain Size Characteristics of Surface Sediments and Their Migration Trends in the Nearshore Waters of East Guangdong. Sustainability 2023, 15, 11069. [Google Scholar] [CrossRef]
  70. Wei, X.; Wu, C.Y.; Ni, P.T.; Mo, W.Y. Holocene delta evolution and sediment flux of the Pearl River, southern China. J. Quat. Sci. 2016, 31, 484–494. [Google Scholar] [CrossRef]
  71. Yang, Z.; Yang, Z.D.; Deng, Z.M.; Chen, Y.; Yang, B.; Hou, Y.; Deng, Z.; Tong, M. Multi-timescale analysis of the evolution of sandy coastline: A case study in South China. J. Mar. Sci. Eng. 2022, 10, 1609. [Google Scholar] [CrossRef]
  72. Gao, J.S.; Wu, G.D.; Ya, H.Z. Review of the circulation in the Beibu Gulf, South China Sea. Cont. Shelf Res. 2017, 138, 106–119. [Google Scholar] [CrossRef]
  73. Shi, H.B.; Niu, X.J.; Yu, X.P. The Beibu Gulf is dominated by diurnal tide, and the tidal range decreases from mouth in north to South China Sea. J. Tsinghua Univ. (Sci. Technol.) 2012, 6, 791–797. [Google Scholar]
  74. Cheng, G.L.; Gong, W.P.; Wang, Y.P.; Xia, Z. Modeling the circulation and sediment transport in the Beibu Gulf. Acta Oceanol. Sin. 2017, 36, 21–30. [Google Scholar] [CrossRef]
  75. Thian, S.Y.; Lee, C.Y. Cyclic stress-controlled tests on offshore clay. J. Rock Mech. Geotech. Eng. 2017, 9, 376–381. [Google Scholar] [CrossRef]
  76. Yang, Q.; Ren, Y.B.; Niu, J.L.; Cheng, K.; Hu, Y.X.; Wang, Y. Characteristics of soft marine clay under cyclic loading: A review. Bull. Eng. Geol. Environ. 2018, 77, 1027–1046. [Google Scholar] [CrossRef]
  77. Wu, C.J.; Ye, G.L.; Zhang, L.L.; Bishop, D.; Wang, J.H. Depositional environment and geotechnical properties of Shanghai clay: A comparison with Ariake and Bangkok clays. Bull. Eng. Geol. Environ. 2015, 74, 717–732. [Google Scholar] [CrossRef]
  78. Ye, G.L.; Lin, N.; Bao, X.H.; Gu, L.; Yadav, S.K. Effect of Quaternary transgression and regression on the engineering properties of Shanghai soft clays. Eng. Geol. 2018, 239, 321–329. [Google Scholar] [CrossRef]
  79. Zong, Y.; Yim, W.W.S.; Yu, F.; Huang, G. Late Quaternary environmental changes in the Pearl River mouth region, China. Quat. Int. 2009, 206, 35–45. [Google Scholar] [CrossRef]
  80. Liu, S.Y.; Shao, G.H.; Du, Y.J.; Cai, G.J. Depositional and geotechnical properties of marine clays in Lianyungang, China. Eng. Geol. 2011, 121, 66–74. [Google Scholar] [CrossRef]
  81. Liu, Y.X.; Du, T.Q.; Huang, H.J.; Liu, Y.L.; Zhang, Y. Estimation of sediment compaction and its relationship with river channel distributions in the Yellow River delta, China. Catena 2019, 182, 104113. [Google Scholar] [CrossRef]
  82. Cai, Y.Q.; Xie, Z.W.; Wang, J.; Wang, P.; Geng, X.Y. New approach of vacuum preloading with booster prefabricated vertical drains (PVDs) to improve deep marine clay strata. Can. Geotech. J. 2018, 55, 1359–1371. [Google Scholar] [CrossRef]
  83. Duan, W.; Cai, G.J.; Liu, S.Y.; Puppala, A.J.; Chen, R.F. In-situ evaluation of undrained shear strength from seismic piezocone penetration tests for soft marine clay in Jiangsu, China. Transp. Geotech. 2019, 20, 100253. [Google Scholar] [CrossRef]
  84. Li, M.D.; Chen, Q.S.; Wen, K.J.; Nimbalkar, S.; Dai, R.H. Improved vacuum preloading method combined with sand sandwich structure for consolidation of dredged clay-slurry fill and original marine soft clay. Int. J. Geomech. 2021, 21, 04021182. [Google Scholar] [CrossRef]
  85. Li, B.Y.; Cheng, X.; Fan, Y.B.; Qian, B.; Chen, Y.H. Settlement mechanism and improvement of thick silty sand layer overlying mud foundation. Geotech. Res. 2022, 9, 2–14. [Google Scholar] [CrossRef]
  86. Dai, S.; Han, B.; Li, N.; Wang, B.; He, B.; Liu, J. Morphologic analysis of hysteretic behavior of China Laizhou Bay submarine mucky clay and its cyclic failure criteria. Bull. Eng. Geol. Environ. 2022, 81, 52. [Google Scholar] [CrossRef]
  87. Zhu, Y.H.; Wu, M.M.; Zhang, G.P.; Yu, J.L.; Xu, Q.L.; Xu, R.Q.; Yu, T.C. The influence of geological conditions in the Hangzhou Bay area on the deformation behavior of deep excavations. J. Mar. Sci. Eng. 2023, 11, 1836. [Google Scholar] [CrossRef]
  88. Guo, L.; Wu, H.; He, Y.P.; Li, H.; Sun, Y.L. Experimental investigation on strength characteristics of marine soft clay under monotonic and cyclic loading. Mar. Georesources Geotechnol. 2024, 21, 1812–1823. [Google Scholar] [CrossRef]
  89. Robertson, P.K. In situ testing and its application to foundation engineering. Can. Geotech. J. 1986, 23, 573–594. [Google Scholar] [CrossRef]
  90. Floodgate, G.D.; Judd, A.G. The origins of shallow gas. Cont. Shelf Res. 1992, 12, 1145–1156. [Google Scholar] [CrossRef]
  91. Hu, Y.; Li, H.D.; Xu, J. Shallow gas accumulation in a small estuary and its implications: A case history from in and around Xiamen Bay. Geophys. Res. Lett. 2012, 39, 2012GL054478. [Google Scholar] [CrossRef]
  92. Song, L.; Fan, D.D.; Su, J.F.; Guo, X.J. Controls on shallow gas distribution, migration, and associated geohazards in the Yangtze subaqueous delta and the Hangzhou Bay. Front. Mar. Sci. 2023, 10, 1107530. [Google Scholar] [CrossRef]
  93. Chen, Y.F.; Deng, B.; Zhang, G.L.; Zhang, W.G.; Gao, S. Response of shallow gas-charged Holocene deposits in the Yangtze Delta to meter-scale erosion induced by diminished sediment supply: Increasing greenhouse gas emissions. J. Geophys. Res. Earth Surf. 2023, 128, e2022JF006631. [Google Scholar] [CrossRef]
  94. Ning, Z.; Lin, M.M.; Zhang, Y.; Zhang, X.B.; Kong, X.H. Distribution of potential geological hazards and control factors in Qingdao offshore, China. China Geol. 2019, 2, 40–48. [Google Scholar] [CrossRef]
  95. Huang, B.J.; Xiao, X.M.; Li, X.S.; Cai, D.S. Spatial distribution and geochemistry of the nearshore gas seepages and their implications to natural gas migration in the Yinggehai Basin, offshore South China Sea. Mar. Pet. Geol. 2009, 26, 928–935. [Google Scholar] [CrossRef]
  96. Yang, J.H.; Huang, B.J. Origin and migration model of natural gas in L gas field, eastern slope of Yinggehai Sag, China. Pet. Explor. Dev. 2019, 46, 471–481. [Google Scholar] [CrossRef]
  97. Wang, Y.; Kong, L.W.; Wang, Y.L.; Wang, M.; Cai, K.J. Deformation analysis of shallow gas-bearing ground from controlled gas release in Hangzhou Bay of China. Int. J. Geomech. 2018, 18, 04017122. [Google Scholar] [CrossRef]
  98. Xu, Y.S.; Wu, H.N.; Shen, J.S.; Zhang, N. Risk and impacts on the environment of free-phase biogas in quaternary deposits along the Coastal Region of Shanghai. Ocean Eng. 2017, 137, 129–137. [Google Scholar] [CrossRef]
  99. Garcia-Gil, S.; Vilas, F.; Garcia-Garcia, A. Shallow gas features in incised-valley fills (Ría de Vigo, NW Spain): A case study. Cont. Shelf Res. 2002, 22, 2303–2315. [Google Scholar] [CrossRef]
  100. Zhang, G.L.; Zhang, J.; Kang, Y.B.; Liu, S.M. Distributions and fluxes of methane in the East China Sea and the Yellow Sea in spring. J. Geophys. Res. 2004, 109, 2004JC002268. [Google Scholar] [CrossRef]
  101. Zhu, W.L.; Huang, B.J.; Mi, L.J.; Wilkins, R.W.T.; Fu, N.; Xiao, X.M. Geochemistry, origin, and deep-water exploration potential of natural gases in the Pearl River Mouth and Qiongdongnan basins, South China Sea. AAPG Bull. 2009, 93, 741–761. [Google Scholar] [CrossRef]
  102. Li, Y.L.; Lin, C.M. Exploration methods for late Quaternary shallow biogenic gas reservoirs in the Hangzhou Bay area, eastern China. AAPG Bull. 2010, 94, 1741–1759. [Google Scholar] [CrossRef]
  103. Sun, Q.L.; Wu, S.G.; Cartwright, J.; Dong, D.D. Shallow gas and focused fluid flow systems in the Pearl River Mouth Basin, northern South China Sea. Mar. Geol. 2012, 315–318, 1–14. [Google Scholar] [CrossRef]
  104. Ren, J.F.; Cheng, C.; Xiong, P.F.; Kuang, Z.G.; Liang, J.Q.; Lai, H.F.; Chen, Z.G.; Chen, Y.; Li, T.; Jiang, T. Sand-rich gas hydrate and shallow gas systems in the Qiongdongnan Basin, northern South China Sea. J. Pet. Sci. Eng. 2022, 215, 110630. [Google Scholar] [CrossRef]
  105. Lin, C.M.; Li, Y.L.; Zhuo, H.C.; Shurr, G.W.; Ridgley, J.L.; Zhang, Z.P.; Xue, T. Features and sealing mechanism of shallow biogenic gas in incised valley fills (the Qiantang River, eastern China): A case study. Mar. Pet. Geol. 2010, 27, 909–922. [Google Scholar] [CrossRef]
  106. Cathles, L.M.; Su, Z.; Chen, D.F. The physics of gas chimney and pockmark formation, with implications for assessment of seafloor hazards and gas sequestration. Mar. Pet. Geol. 2010, 27, 82–91. [Google Scholar] [CrossRef]
  107. Gao, M.S.; Hou, G.H.; Dang, X.Z.; Huang, X.Y. Sediment distribution characteristics and environment evolution within 100 years in western Laizhou Bay, Bohai Sea, China. China Geol. 2020, 3, 445–454. [Google Scholar]
  108. Duan, W.; Cai, G.J.; Liu, S.Y.; Du, Y.; Zhu, L.W.; Puppala, A.J. SPT–CPTU correlations and liquefaction evaluation for the island and tunnel project of the Hong Kong–Zhuhai–Macao bridge. Int. J. Civ. Eng. 2018, 16, 1423–1434. [Google Scholar] [CrossRef]
  109. Zhao, K.; Wang, Q.Z.; Chen, W.Y.; Zhuang, H.Y.; Chen, G.X. Uplift of immersed tunnel in liquefiable seabed under wave and current propagation. Eng. Geol. 2020, 278, 105828. [Google Scholar] [CrossRef]
  110. Cui, L.; Yang, W.Y.; Sheng, Q.; Zheng, J.J.; Nafees, A. Deformation behaviour of strain-softening rock mass in tunnels considering deterioration model of elastic modulus. Geomech. Geophys. Geo-Energy Geo-Resour. 2024, 10, 171. [Google Scholar] [CrossRef]
  111. GB/T50011-2010; Code for Seismic Design of Buildings. Ministry of Housing and Urban-Rural Development (MOHURD); China Architecture and Building Press: Beijing, China, 2016.
  112. Youd, T.L.; Idriss, I.M. Technical Report NCEER-970022. In Proceedings of the NCEER Workshop on Evaluation of Liquefaction Resistance of Soils, Salt Lake City, UT, USA, 5–6 January 1997. [Google Scholar]
  113. BS EN 1998-5:2004; Eurocode 8: Design of Structures for Earthquake Resistance. British standards (BS): London, UK, 2004.
  114. Liao, S.S.C.; Whitman, R.V. Overburden correction factors for SPT in sand. J. Geotech. Eng. 1986, 112, 373–377. [Google Scholar] [CrossRef]
  115. Yu, H.; Zeng, X.W.; Li, B.; Lian, J.J. Centrifuge modeling of offshore wind foundations under earthquake loading. Soil Dyn. Earthq. Eng. 2015, 77, 402–415. [Google Scholar] [CrossRef]
  116. Jia, Y.G.; Liu, X.L.; Shan, H.X.; Zheng, J.W.; Huo, S.X. The effects of hydrodynamic conditions on geotechnical strength of the sediment in Yellow River Delta. Int. J. Sediment Res. 2011, 26, 318–330. [Google Scholar] [CrossRef]
  117. Zhang, H.; Liu, X.L.; Jia, Y.G.; Du, Q.Z.; Sun, Y.F.; Yin, P.; Shan, H.X. Rapid consolidation characteristics of Yellow River-derived sediment: Geotechnical characterization and its implications for the deltaic geomorphic evolution. Eng. Geol. 2020, 270, 105578. [Google Scholar] [CrossRef]
  118. Hu, P.; Wang, D.; Stanier, S.A.; Cassidy, M.J. Assessing the punch-through hazard of a spudcan on sand overlying clay. Géotechnique 2015, 65, 883–896. [Google Scholar] [CrossRef]
  119. Khatri, V.N.; Kumar, J.; Akhtar, S. Bearing capacity of foundations with inclusion of dense sand layer over loose sand strata. Int. J. Geomech. 2017, 17, 06017018. [Google Scholar] [CrossRef]
  120. Prandtl, L. Hauptaufsätze: Über die Eindringungsfestigkeit (Härte) plastischer Baustoffe und die Festigkeit von Schneiden. J. Appl. Math. Mech. 1921, 1, 15–20. [Google Scholar] [CrossRef]
  121. Young, A.G.; House, H.F.; Turner, R.D.; Helfrich, S.C. Foundation performance of mat-supported jackup rigs in soft clays. J. Pet. Technol. 1982, 34, 2958–2966. [Google Scholar] [CrossRef]
  122. Dai, S.; Yu, X.R.; Han, B.; He, B. Cyclic behavior of seabed building material of offshore wind farm in rock-based sea area: Submarine completely weathered granite. Ocean Eng. 2024, 296, 117024. [Google Scholar] [CrossRef]
  123. Niu, X.R.; Yao, Y.P.; Sun, Y.F.; Luo, Z.L. Weathering process of in situ granite and particle breakage characteristics of compacted weathered granite. Appl. Sci. 2018, 8, 1108. [Google Scholar] [CrossRef]
  124. Yin, J.S.; Li, S.; Sun, L.Q.; Li, T.T. Pile installation assessment of offshore wind jacket foundation in completely weathered rock: A case study of the South China Sea. J. Mar. Sci. Eng. 2022, 10, 900. [Google Scholar] [CrossRef]
  125. Gong, W.M.; Zhang, Z.T.; Lin, Y.F.; Dai, G.L.; Huang, H. Full-scale field test study of bearing characteristics of post-grouting pile for offshore wind turbines. Ocean Eng. 2023, 268, 113451. [Google Scholar] [CrossRef]
  126. Hu, T.; Dai, G.L.; Wan, Z.H.; Fang, B.W.; Chen, X.Y. Full-scale tests on the grouting effectiveness of offshore bored piles with various bearing strata. Appl. Ocean Res. 2023, 141, 103791. [Google Scholar] [CrossRef]
Figure 1. Equipment for offshore geotechnical investigations. (a) Survey ship; (b) seabed cone penetration test device.
Jmse 13 01893 g001
Figure 2. Seas surrounding China’s mainland.
Jmse 13 01893 g002
Figure 3. Thickness of soft mud layers off China’s coast [34,79,80,81,82,83,84,85,86,87,88].
Jmse 13 01893 g003
Figure 4. Site investigation at the Guangdong offshore areas. (a) Location of the Shenquan offshore wind farm project; (b) Interpretation of soil stratigraphy from CPTU data.
Jmse 13 01893 g004aJmse 13 01893 g004b
Figure 5. Distribution of shallow gas [71,100,101,102,103,104].
Jmse 13 01893 g005
Figure 6. Location of the Jiaxing offshore wind farm project.
Jmse 13 01893 g006
Figure 7. Cone penetration tests inside and outside of a pockmark.
Jmse 13 01893 g007
Figure 8. Location of the Wailuo offshore wind farm project.
Jmse 13 01893 g008
Figure 9. Location of the Binhai offshore wind farm project.
Jmse 13 01893 g009
Figure 10. Expansion of the surcharge load.
Jmse 13 01893 g010
Figure 11. Bearing capacities determined by different methods.
Jmse 13 01893 g011
Figure 12. Location of the Nanri offshore wind farm project.
Jmse 13 01893 g012
Table 1. Seabed stratigraphy derived from CPTU data.
Layer NumberSoil TypeTip Resistance qc (MPa)Friction Resistance fs (kPa)Burial Depth (m) Thickness (m)
1-1Silty sand mixed with mud0.93–3.008.2–24.604.9–13.5
1-2Muddy silty clay mixed with silt0.48–2.006.8–28.90.0 –13.00.7–15.5
2-1Silty clay1.29–2.8211.8–57.78.9–27.90.6–24.3
2-2Silty sand2.25–18.5138.2–145.56.0–28.90.5–10.0
3-1Silty sand4.62–20.6351.8–272.78.9–39.10.6–22.2
3-2Fine sand14.00–40.3952.0–419.720.7–40.00.8–8.9
3-3Silty clay mixed with silty sand1.86–6.7018.9–154.115.9–36.20.7–8.9
4-1Silty clay1.64–6.0521.4–108.516.6–46.50.5–13.6
4-2Silty clay mixed with silt2.01–7.2224.0–188.121.5–49.11.3–14.8
4-3Fine sand11.49–40.2667.0–532.331.4–48.40.6–11.1
4-4Silty sand5.46–24.9571.7–481.227.4–53.20.5–8.6
Table 2. Critical equivalent shear wave velocity.
Design Seismic IntensityCritical Equivalent Shear Wave Velocity (m/s)
790
8140
9200
Table 3. Information of detecting shallow gas at different locations.
Position NumberDetecting Depth (m)Detecting LayerEruption DurationQuantity Evaluation
37#48.5Silty clay–silty sandOver 34 hMedium
38#57.0Silty clay–silty sandAbout 7 monthsHigh
40#30.0Silty clay–silty sandAbout 7 monthsHigh
46#53.0Silty clay–silty sandAbout 15 hHigh
52#53.0Silty clay–silty sandAbout 14 hHigh
60#46.0Silty clay–silty sandAbout 10 hMedium
61#45.5Silty sandAbout 6 hMedium
65#48.0Silty clay–clayey siltAbout 16 hMedium
66#52.0Silty clay–silty sandAbout 7 mouthsHigh
70#49.0Silty clay–silty sandAbout 7 mouthsHigh
73#53.0Silty clay–silty sandAbout 7 mouthsHigh
Boosting station SJT147.0Silty clay–clayey siltAbout 3 hMedium
Table 4. Assessment and degree of sand liquefaction at drilling holes.
Hole NumberDepth (m)Clayey Grain Content (%)Calculated Counts of SPTBlow Counts of SPTMOHURD (2016)1996 NCEER
Liquefaction IndexLiquefaction LevelAnti-Liquefaction Safety FACTOR Liquefaction
Z131.93.010.1975.01Mild0.66Liquefiable
Z253.03.012.54113.19Mild0.92Liquefiable
Z282.03.010.4384.08Mild0.72Liquefiable
Z301.83.09.9513NANon-liquefiable1.05Non-liquefiable
Z311.23.08.3780.45Mild0.72Liquefiable
SZK012.23.010.8913NANon-liquefiable1.05Non-liquefiable
Table 5. Soil parameters at the Binhai waters.
Layer NumberSoil TypeDepth (m)Water Content (%)Void RatioCohesion (kPa)Friction Angle (°)
1Silty sandN/A24.30.711N/A28–31
2Sandy silt4.6–9.618.60.618N/A30–31
3Muddy silty clay9.6–13.341.21.16423.5–39.5N/A
4Silty clay13.3–15.742.61.20448.2–51.3N/A
5Silt15.7–22.624.10.666N/A30–31
6Silty clay22.6–32.236.11.04362.6–75.1N/A
7Clay32.2–40.652.91.50244.5–52.3N/A
Note: N/A means not applicable.
Table 6. Expansion angle for hard-soft layers.
Es1/Es2z/B
0.250.5
3623
51025
102030
Table 7. Distribution and characterization of boulder stones revealed through drilling.
Hole NumberBurial Depth (m)Thickness (m)
A419.70–10.100.40
A4912.30–13.100.80
A49-134.20–35.601.40
A49-24.10–6.902.80
A50-112.00–13.401.40
A50-22.30–3.501.20
A50-27.90–10.202.30
A55-221.20–23.702.50
Disclaimer/Publisher’s Note: The statements, opinions and data contained in all publications are solely those of the individual author(s) and contributor(s) and not of MDPI and/or the editor(s). MDPI and/or the editor(s) disclaim responsibility for any injury to people or property resulting from any ideas, methods, instructions or products referred to in the content.