Article

Mechanism of Permeability Evolution in Coral Reef Limestone Under Variable Confined Pressure Using Nuclear Magnetic Resonance Technology

1
School of Urban Construction, Wuhan University of Science and Technology, Wuhan 430065, China
2
State Key Laboratory of Geomechanics and Geotechnical Engineering Safety, Institute of Rock and Soil Mechanics, Chinese Academy of Sciences, Wuhan 430071, China
3
CCCC Second Harbour Engineering Company Ltd., Wuhan 430040, China
4
China Railway Siyuan Survey and Design Group Co., Ltd., Wuhan 430063, China
*
Author to whom correspondence should be addressed.
J. Mar. Sci. Eng. 2025, 13(12), 2218; https://doi.org/10.3390/jmse13122218
Submission received: 2 September 2025 / Revised: 16 November 2025 / Accepted: 19 November 2025 / Published: 21 November 2025
(This article belongs to the Special Issue Submarine Unfavorable Geology and Geological Disasters)

Abstract

The development of underground space in the South China Sea islands is an important way to enhance their protection capabilities. This study focuses on the stress loading and unloading conditions of surrounding rock during the excavation of underground caverns in island reefs. Laboratory variable confining pressure permeability tests were conducted to quantify the stress sensitivity of permeability in coral reef limestone based on Darcy’s law and the stress sensitivity index model equation for permeability. In addition, the use of nuclear magnetic resonance technology reveals the microscopic mechanism of coral reef limestone permeability evolution. The results of the experiments show that the permeability of coral reef limestone sample is mainly controlled by the advantaged permeable channels formed by large pores. During the stress loading stage, the pore structure inside the sample changes, with compression of large pores and generation of smaller pores, resulting in a decrease in effective permeable pathways and a decrease in permeability. When the stress loading reaches 4 MPa, the damage rate of the sample’s permeability is 19.6%. During the stress unloading stage, the recovery of the sample’s permeability shows a significant hysteresis effect. Due to the irreversible damage caused by the compression and collapse of the pore structure during the loading stage, the permeability of the sample cannot fully recover when unloaded to the initial stress state. Based on the experimental results, calculations show that the stress sensitivity coefficient of coral reef limestone permeability is 1.1 × 10⁻¹ MPa−1, which is higher than that of conventional land-based rocks. The conclusions of this study can provide important design references for the stability control of surrounding rocks and geological hazard prevention during the excavation of underground chambers on the islands.

1. Introduction

During the construction of artificial coral reef islands, engineering activities such as underground excavation, sea-level changes, dredging, and reclamation can alter the confining pressure conditions of coral rock masses. Reef limestone serves as the primary load-bearing structure in underground engineering on coral reef engineering. Therefore, it is crucial to study the permeability changes in coral reef limestone under varying confining pressures for disaster prevention during island construction [1].
Specifically, reef limestone is mainly composed of accumulated biological skeletal remains that have accumulated over long periods of time. The biological composition of the reef limestone includes corals, foraminifera, algae, and gastropods; the mineral composition of reef limestone mainly consists of aragonite and calcite [2,3,4,5]. It is noteworthy that previous studies have established that beach rock in the South China Sea exhibits significant porosity (18.36% to 53.78%) and high permeability [6]. Experimental data indicate that the bulk volume of reef limestone sample was an order of magnitude higher than the pore volume, with over 85% of the pores categorized as mesopores [7]. According to their different origins, terrigenous rocks can be divided into igneous, sedimentary, and metamorphic rocks. However, the geological genesis of coral reefs differs from traditional land-based geological bodies. Coral reefs are geological bodies formed by biogenic processes in marine environments. The unique fabric of reef limestone gives it distinct physical and mechanical properties compared to traditional rocks. In addition to the influence of intergranular pore connectivity, the connectivity of primary pores in coral also plays a crucial role in determining the permeability of reef limestone. Therefore, a thorough understanding of its permeability characteristics is crucial for the development of island reef enterprises and the design and construction of island reef projects.
The reef limestone exhibits notable inhomogeneity and anisotropy [8,9]. Current research primarily focuses on its mechanical properties and damage mechanisms. This material possesses high porosity, well-developed pore structures, and low strength. It retained significant residual strength even after experiencing a tensile failure [10]. Despite extensive research on the mechanical issues related to reef limestone, comparatively little attention has been devoted to its permeability. Permeability is critical in activities such as underground cavern excavation, petroleum reservoirs, and natural gas extraction [11,12,13]. For most rocks, the characteristics of pore structure in porous media are closely related to their seepage properties [14,15,16]. The key interconnected pore structure in the reef limestone determines its permeability [17,18].
In terms of research methodologies, both nuclear magnetic resonance (NMR) technology and CT scanning technology are characterized by non-destructive testing and environmental friendliness, allow for the real-time monitoring of rock permeability, and provide insights into the permeability mechanisms and the relationship between confining pressure and permeability. Consequently, scholars worldwide have increasingly applied NMR technology and CT scanning technology to rock testing [19,20,21,22,23]. For example, scholars use CT technology to characterize the pore structure of rock samples; the permeability trends of both coarse-pored and fine-pored reef limestone were determined [24,25]. Scholars conducted seepage tests on a large number of fissured sandstone samples using MRI-based real-time imaging. They revealed that seepage occurred within the medium’s pores while aggregation happened in the fractures, forming a seepage channel [26]. Additionally, as the confining pressure increased, the permeability coefficient increased before stabilizing. Similarly, scholars investigated the permeability mechanism of dolomite using the NMR technique and concluded that the pore water pressure did not affect rock deformation. They observed that as the unloading ratio of confining pressure increased, the number of cracks and the degree of penetration within dolomite increased dramatically, resulting in a sudden rise in permeability before the rock ultimately failed. It should be noted that the confining pressure in seepage tests often results in damage to the internal structure of the rock [27]. The researchers also conducted triaxial permeability tests on coal samples using nuclear magnetic resonance technology. By studying the evolution of T2 relaxation time, the effects of CO2 adsorption and water content on the permeability and mechanical properties of coal were discussed [28]. Furthermore, researchers have conducted tests on the permeability and stress sensitivity of volcanic rocks from the same reservoir but with different pore structures. They have found that pore structure is a crucial factor in determining the permeability stress sensitivity of samples, with fractured rocks exhibiting more significant stress-sensitive characteristics compared to porous and dense rocks. The loading and unloading processes primarily involve elastic deformation, with fractured rocks showing a stronger stress lag effect than dense and porous rocks. Repeated loading and unloading tests on rocks have shown that the stress release during drilling and coring can affect the pore structure of the rock, leading to the permeability stress lag effect and plastic deformation of the pores [29]. The stress sensitivity coefficients of limestone under loading paths vary among samples and are higher than those under unloading paths. Additionally, the stress sensitivity of permeability is positively correlated with porosity [30]. Scholars have suggested that the stress sensitivity of shale is related to the contribution of mesopores to permeability. As effective stress increases, the closure of flaky pores in shale reduces pore connectivity, thereby affecting its permeability [31]. While nuclear magnetic resonance technology can introduce errors in the analysis of rock sample porosity and permeability, particularly for low-porosity specimens, these errors are negligible for high-porosity samples [32,33,34].
Based on this research background, this study utilized NMR technology to elucidate the real-time permeability behavior of reef limestone and analyze the T2 spectra to determine the underlying mechanisms of its permeability changes. The variations in effective stress during loading and unloading were also used to evaluate the stress sensitivity of reef limestone based on the permeability damage rate and stress sensitivity coefficient.

2. Test Sample and Test Methods

2.1. Physical Properties of Sample

The samples were sourced from the coral reefs in the South China Sea. They are characterized by distinct walls and well-developed micropores. Standard cylinder samples with a diameter of 25 mm and a height of 50 mm were prepared in accordance with standard procedures, as shown in Figure 1a. This study selected one sample as the test sample, as shown in Figure 1b. The sample was then scanned using a full-diameter core X-ray CT system, as shown in Figure 1c. The scans revealed notable pore development in the reef limestone, predominantly consisting of macropores. In the sphere-and-rod model, spheres represent the pores while rods represent the channels connecting them, as illustrated in Figure 1d. The overall pore size distribution in the reef limestone is uniform, demonstrating a relatively concentrated pore distribution.
The reef limestone sample was tested to determine their basic physical properties, including dry and saturated densities. First, the sample is placed in a vacuum saturation container and completely immersed in water. After 48 h of vacuum saturation, it is removed and immediately weighed using an electronic balance. Then, the RSM-SY6 non-metallic ultrasonic detector is used to test the longitudinal wave velocity of the coral reef limestone sample. Before testing, the transducer is aligned and docked with the receiving end, and the saturated coral reef limestone sample is placed on the receiving end. The direct wave method is used for measurement. After completing the saturation test, the sample is placed in a constant-temperature drying oven and baked at 105 °C for 48 h and then weighed. Based on the results of the saturation and dry mass tests, the dry density, saturation density, and saturation water absorption rate are calculated, as shown in Table 1.

2.2. Microstructural Characteristics and Mineral Composition of the Sample

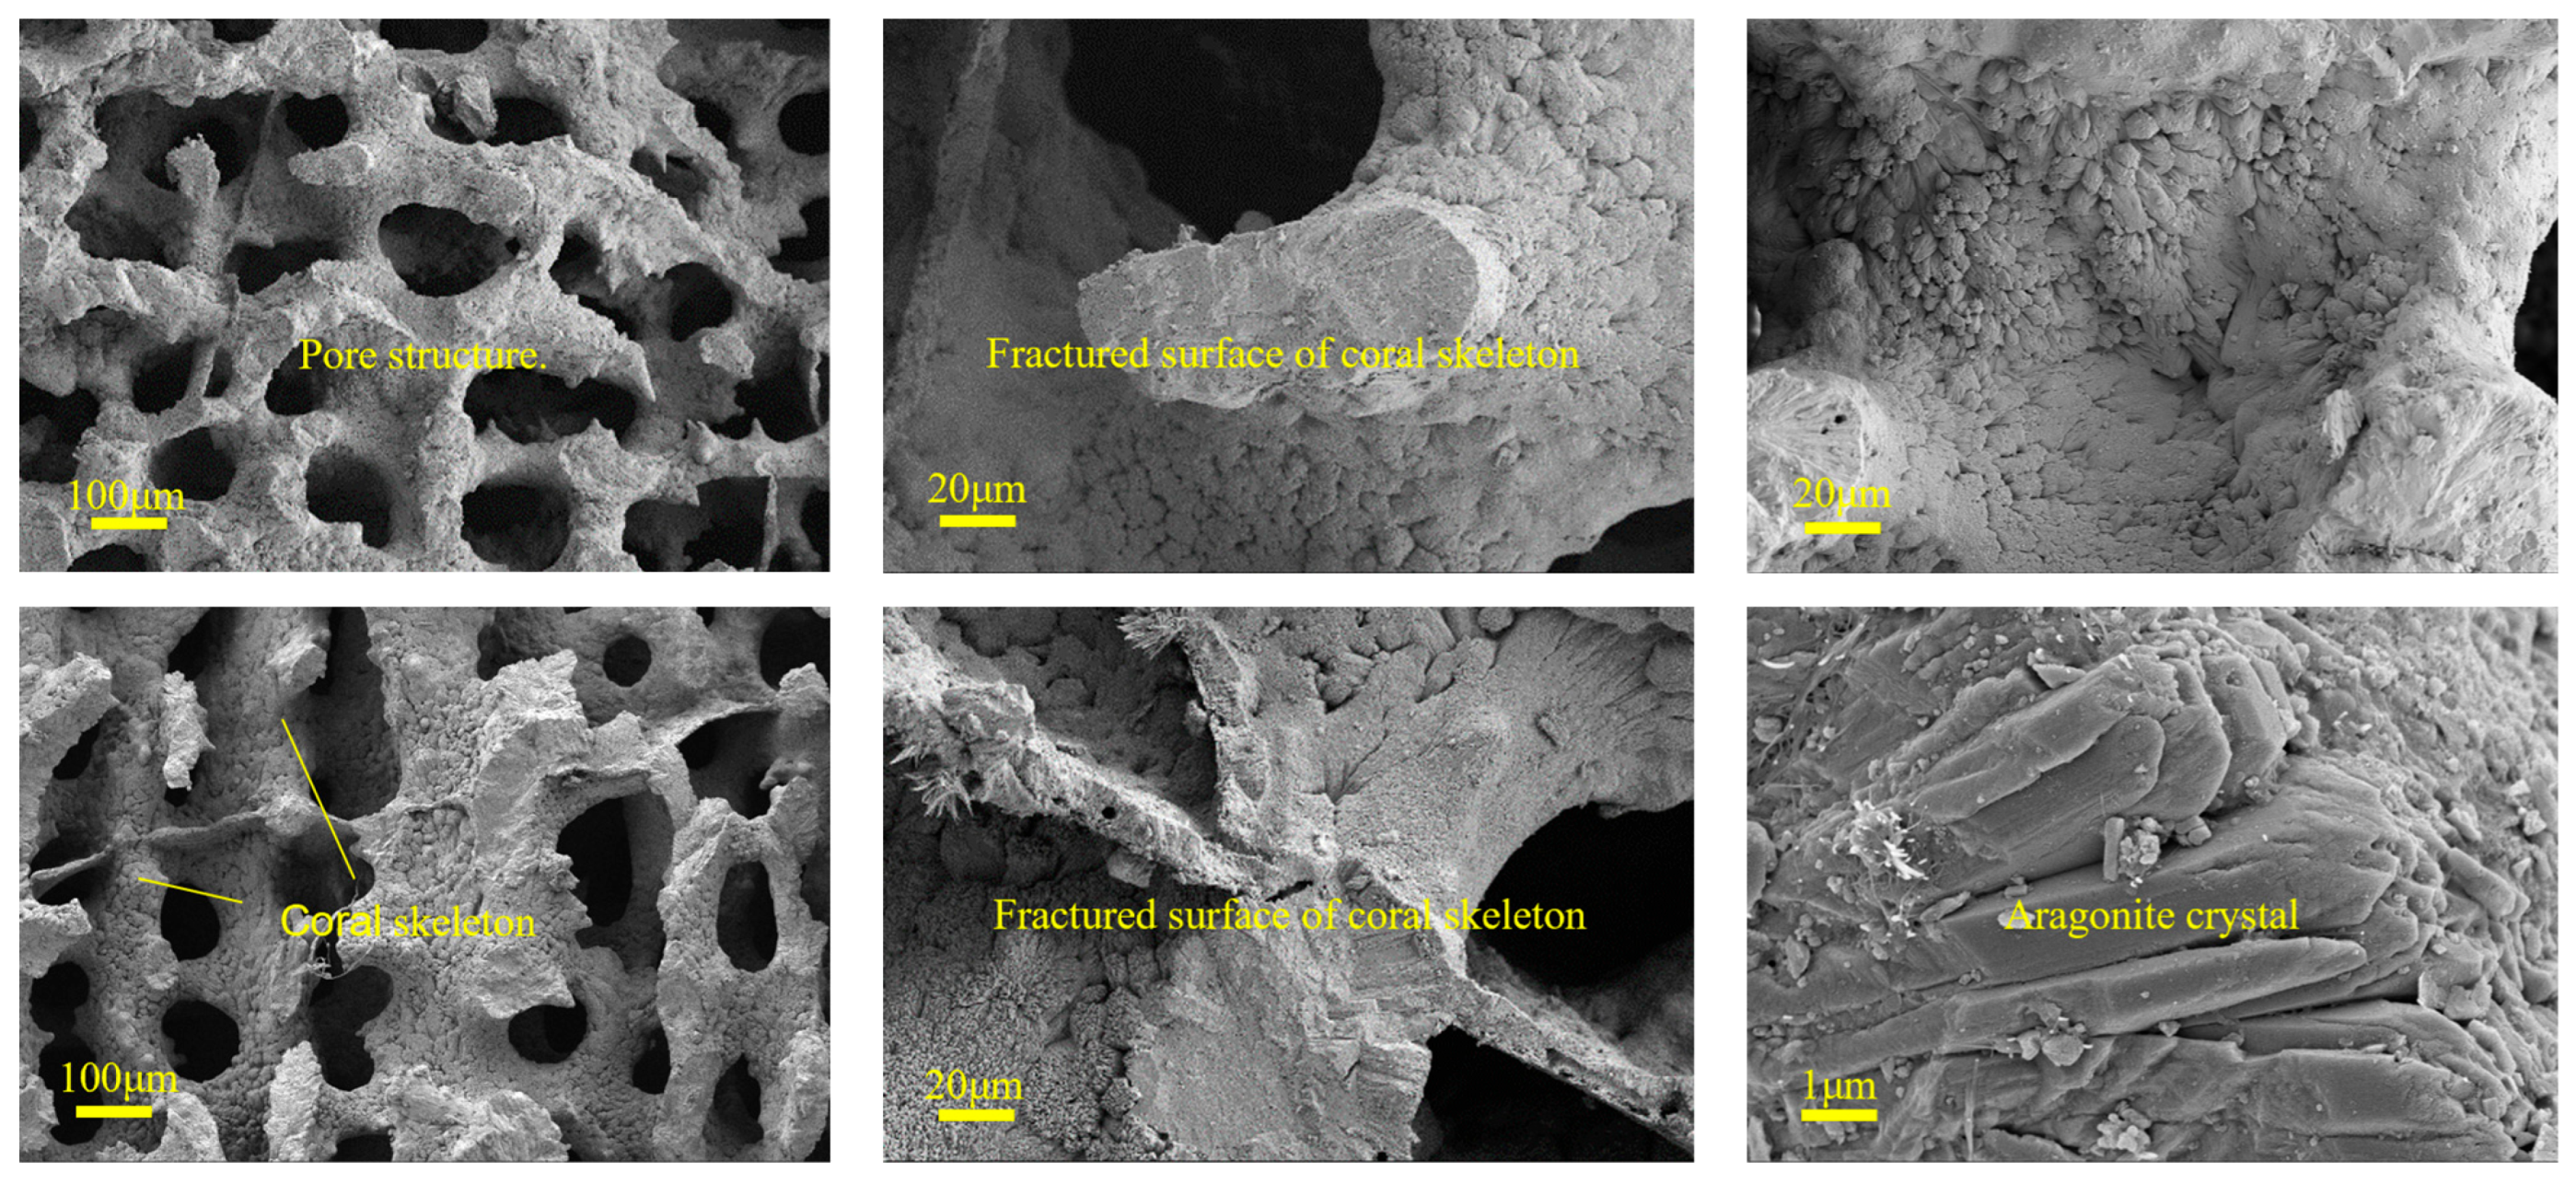
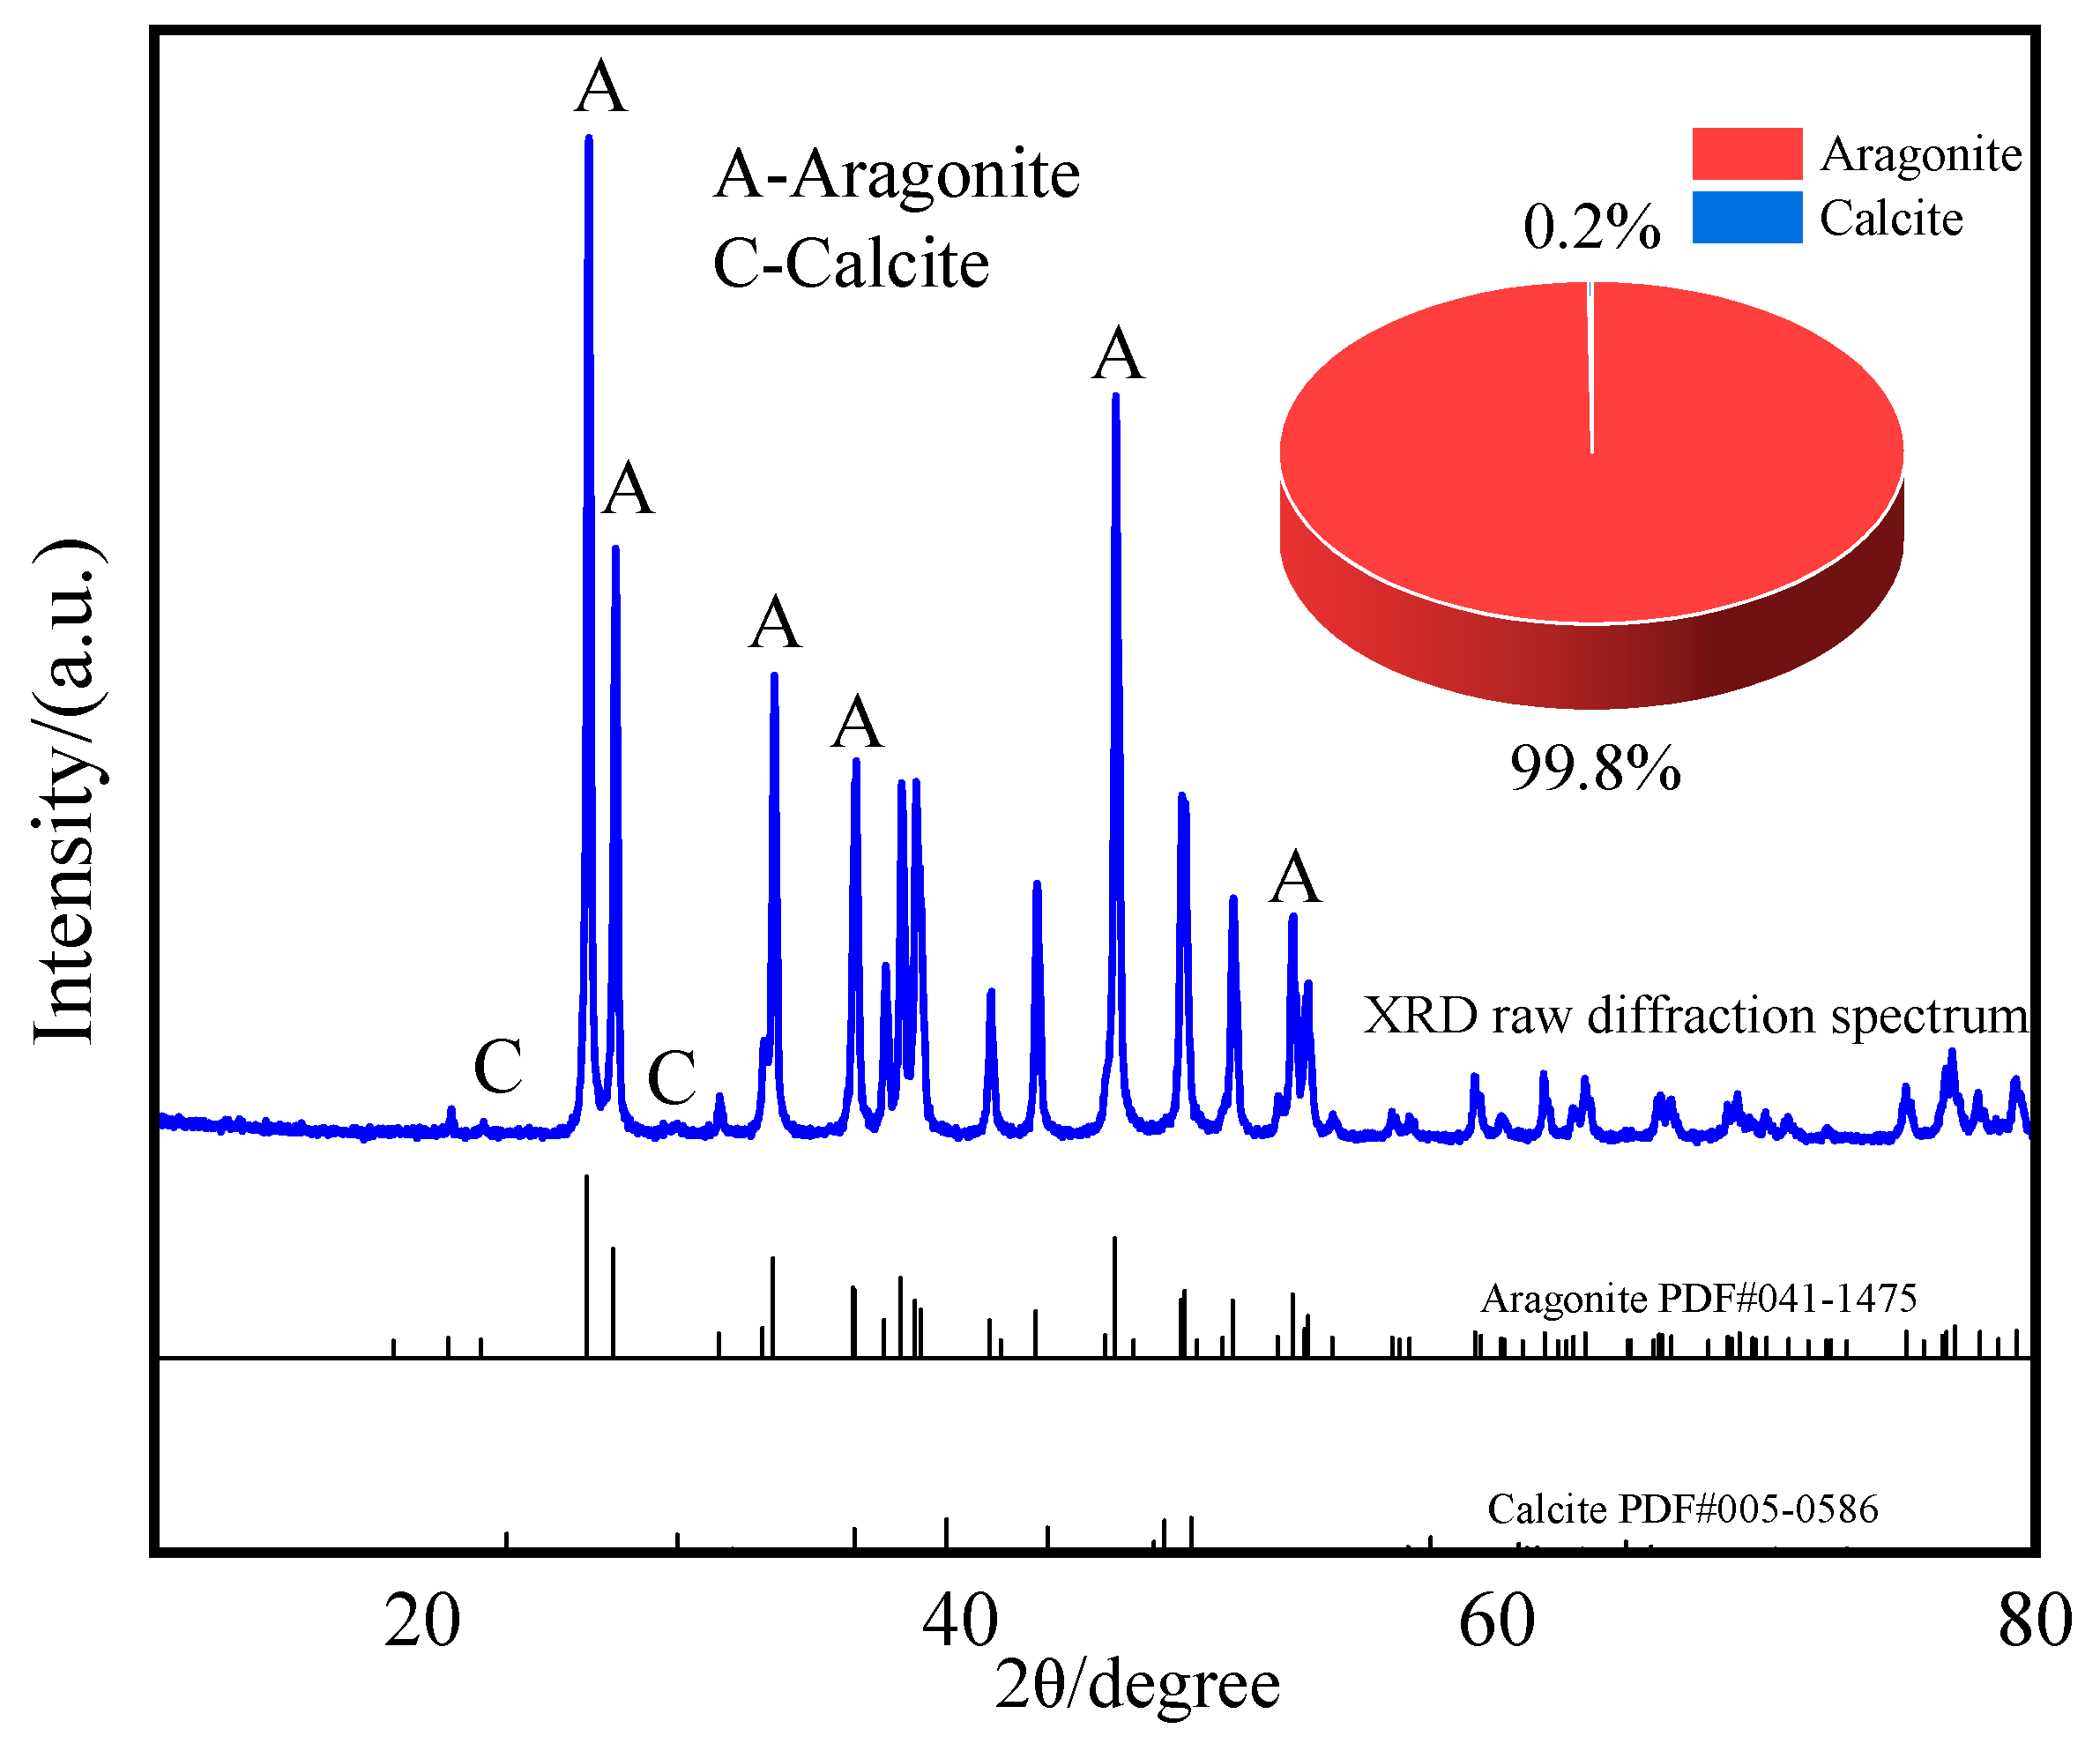
Reef limestone is a mineral structure formed by the deposition of substantial amounts of bioclastic debris over time. It is classified as a marine biogenic carbonate rock, primarily cemented by CaCO3. Due to variations in its formation, the properties of reef limestone differ significantly from those of ordinary rocks. The microstructure and material composition of the sample were examined using scanning electron microscopy (SEM) and an X-ray diffractometer. Figure 2 presents SEM images of the sample, with the insets showing views at different magnification levels. SEM images revealed numerous uniformly sized pores with well-developed pore throats. They are interconnected through a skeletal framework, resulting in a network-like structure. Figure 3 shows the XRD diffraction pattern of the sample. XRD analysis indicates that aragonite is the primary component, with aragonite content exceeding 99%.

2.3. Test Apparatus

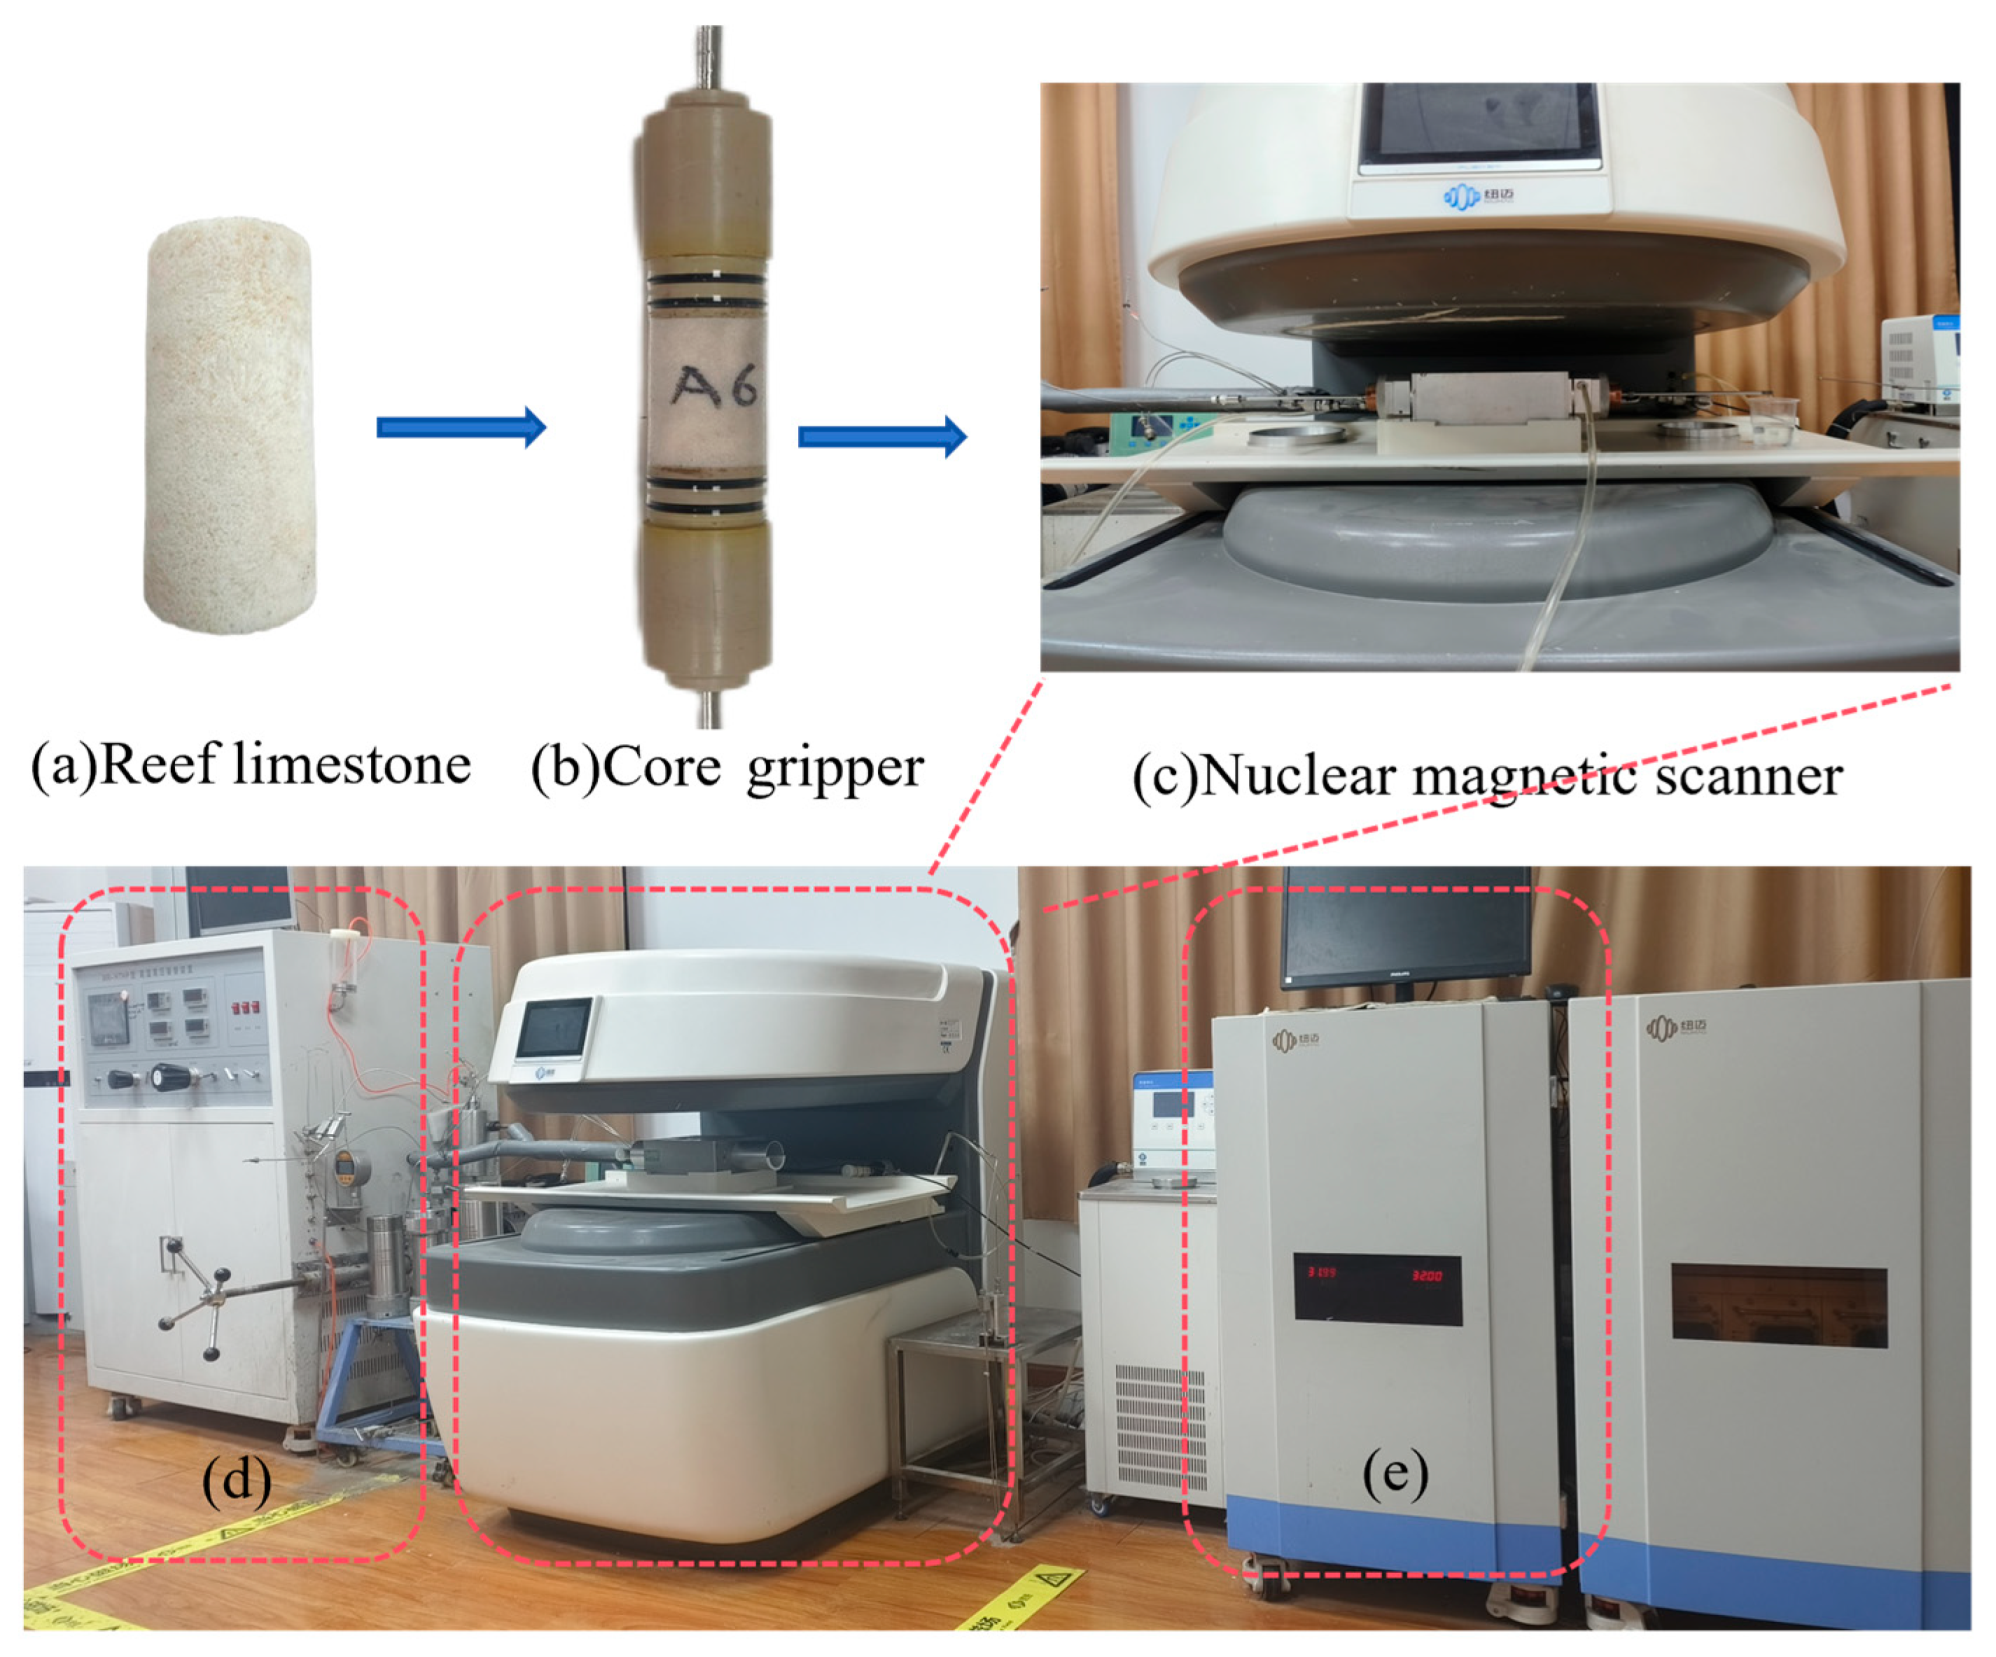
The test employed a low-field NMR rock seepage real-time online analysis and imaging system produced by Suzhou Niumag Analytical Instrument Corporation, Suzhou City, Jiangsu Province, China, as shown in Figure 4 and Figure 5. This system comprises a double-cylinder constant-pressure replacement apparatus, a confining pressure pump, a data acquisition instrument, and an NMR scanner. The sample is connected to the NMR scanner via heat-shrinkable tubes and core grippers, while the confining pressure and osmotic pressure pumps are controlled by the system’s control unit. The system operates according to the specified confining pressure and osmotic pressure settings.

2.4. Principles of Nuclear Magnetic Resonance

According to the “Determination of pore size distribution of coal and rock, nuclear instruments magnetic resonance method” (GB/T 42035-2022) [35], the transverse relaxation time of fluid within rock pores can be measured in a uniform magnetic field:
1 T 2 = 1 T 2 B + ρ 2 S V + D ( γ G T E ) 2 12
where T 2 B denotes the volume relaxation time of fluid. ρ denotes the rock transverse surface relaxation strength. S denotes the pore surface area. V denotes the pore volume. D denotes the diffusion coefficient. G denotes the magnetic field gradient. T E denotes the echo interval.
The value of T 2 B typically varies between 2 and 3 s, which is much larger than the transverse relaxation time T 2 of the fluid in the porous medium. Therefore, the term first in Equation (1) can be ignored. When the magnetic field is homogeneous (corresponding to a very small G ) and small, the third term T E in Equation (1) can also be disregarded.
Consequently, Equation (1) can be simplified to Equation (2).
1 T 2 = ρ 2 S V
Equation (2) indicates that the relaxation time of the fluid in rock pores is primarily influenced by the lithology and specific surface area of the pores. The surface area is related to the shape factor and radius of the pores, as described in Equation (3):
S V = F S γ
where F S is the pore shape factor, which is dimensionless.
The transverse relaxation time T 2 is theoretically linearly proportional to pore diameter. This relationship can also be represented by a power exponent, as indicated in Equation (4).
γ = C T 2 n
Therefore, the transverse relaxation time is directly proportional to pore radius. Since rocks typically contain multiscale pore systems where each pore size corresponds to a distinct relaxation time, the T2 spectrum obtained in a single-fluid medium accurately represents the pore size distribution. Spectral peaks and their areas correspond to pore volume, while curve continuity reflects pore connectivity. NMR spectral analysis thus provides critical insights into fluid relaxation and decay processes within pores. Dynamic evolution of pore structure and seepage characteristics can be monitored, enabling precise microscopic interpretation of permeability evolution during loading–unloading cycles.

2.5. Test Procedure and Program

Generally, two types of media, gas and liquid, can pass through rock samples. However, for the same sample, the measured permeability for gas is often greater than that for liquid. Pre-experimental observations revealed that gas flow through the rock sample led to rapid equilibrium at both ends, resulting in shorter test durations that are more challenging to control. Furthermore, since reef limestone originates from the seabed, using liquid as the flow medium can better simulate its occurrence conditions. During the pre-experiment, it was observed that gas flow through the sample quickly reached a steady state, indicating that the rock sample exhibited relatively high permeability. Therefore, this study employed the steady-state method to measure permeability.
Prior to testing, the rock sample was vacuum-saturated for 24 h using a vacuum-pressurized saturation device. During the experiment, changes in permeability were measured under constant-permeability conditions while adjusting the confining pressure.
I. After placing the saturated reef limestone sample within the NMR rock seepage real-time imaging test system, the initial T2 spectrum of the sample was recorded.
II. A confining pressure of 2 MPa was applied and maintained for 0.5 h, followed by the determination of the T2 spectrum. A pore water pressure of 500 kPa was applied and maintained for 0.2 h. Under drainage conditions, a constant flow rate is applied, and when the pressure difference is stable, the seepage ends, and the initial permeability is calculated using Darcy’s law.
k = Q μ L A P
where k is the permeability; μ is the viscosity; L is the length of the sample; A is the cross-sectional area of the sample; Q is the flow rate; and p is the pressure difference between the inlet and outlet.
III. The confining pressure was then raised to predetermined levels (3 MPa and 4 MPa), following which the procedures in Steps I–II were repeated to measure sample permeability and T2 spectra at each pressure stage.
IV. After completing the 4 MPa permeability test, the confining pressure was reduced to 3 MPa and held for 0.5 h before T2 spectrum measurement. With a maintained pore water pressure of 500 kPa for 0.2 h under drainage conditions, steady-state flow was established at constant rate. Permeability was calculated using Darcy’s law upon pressure stabilization.

3. Analysis of Test Results

3.1. Permeability Evolution

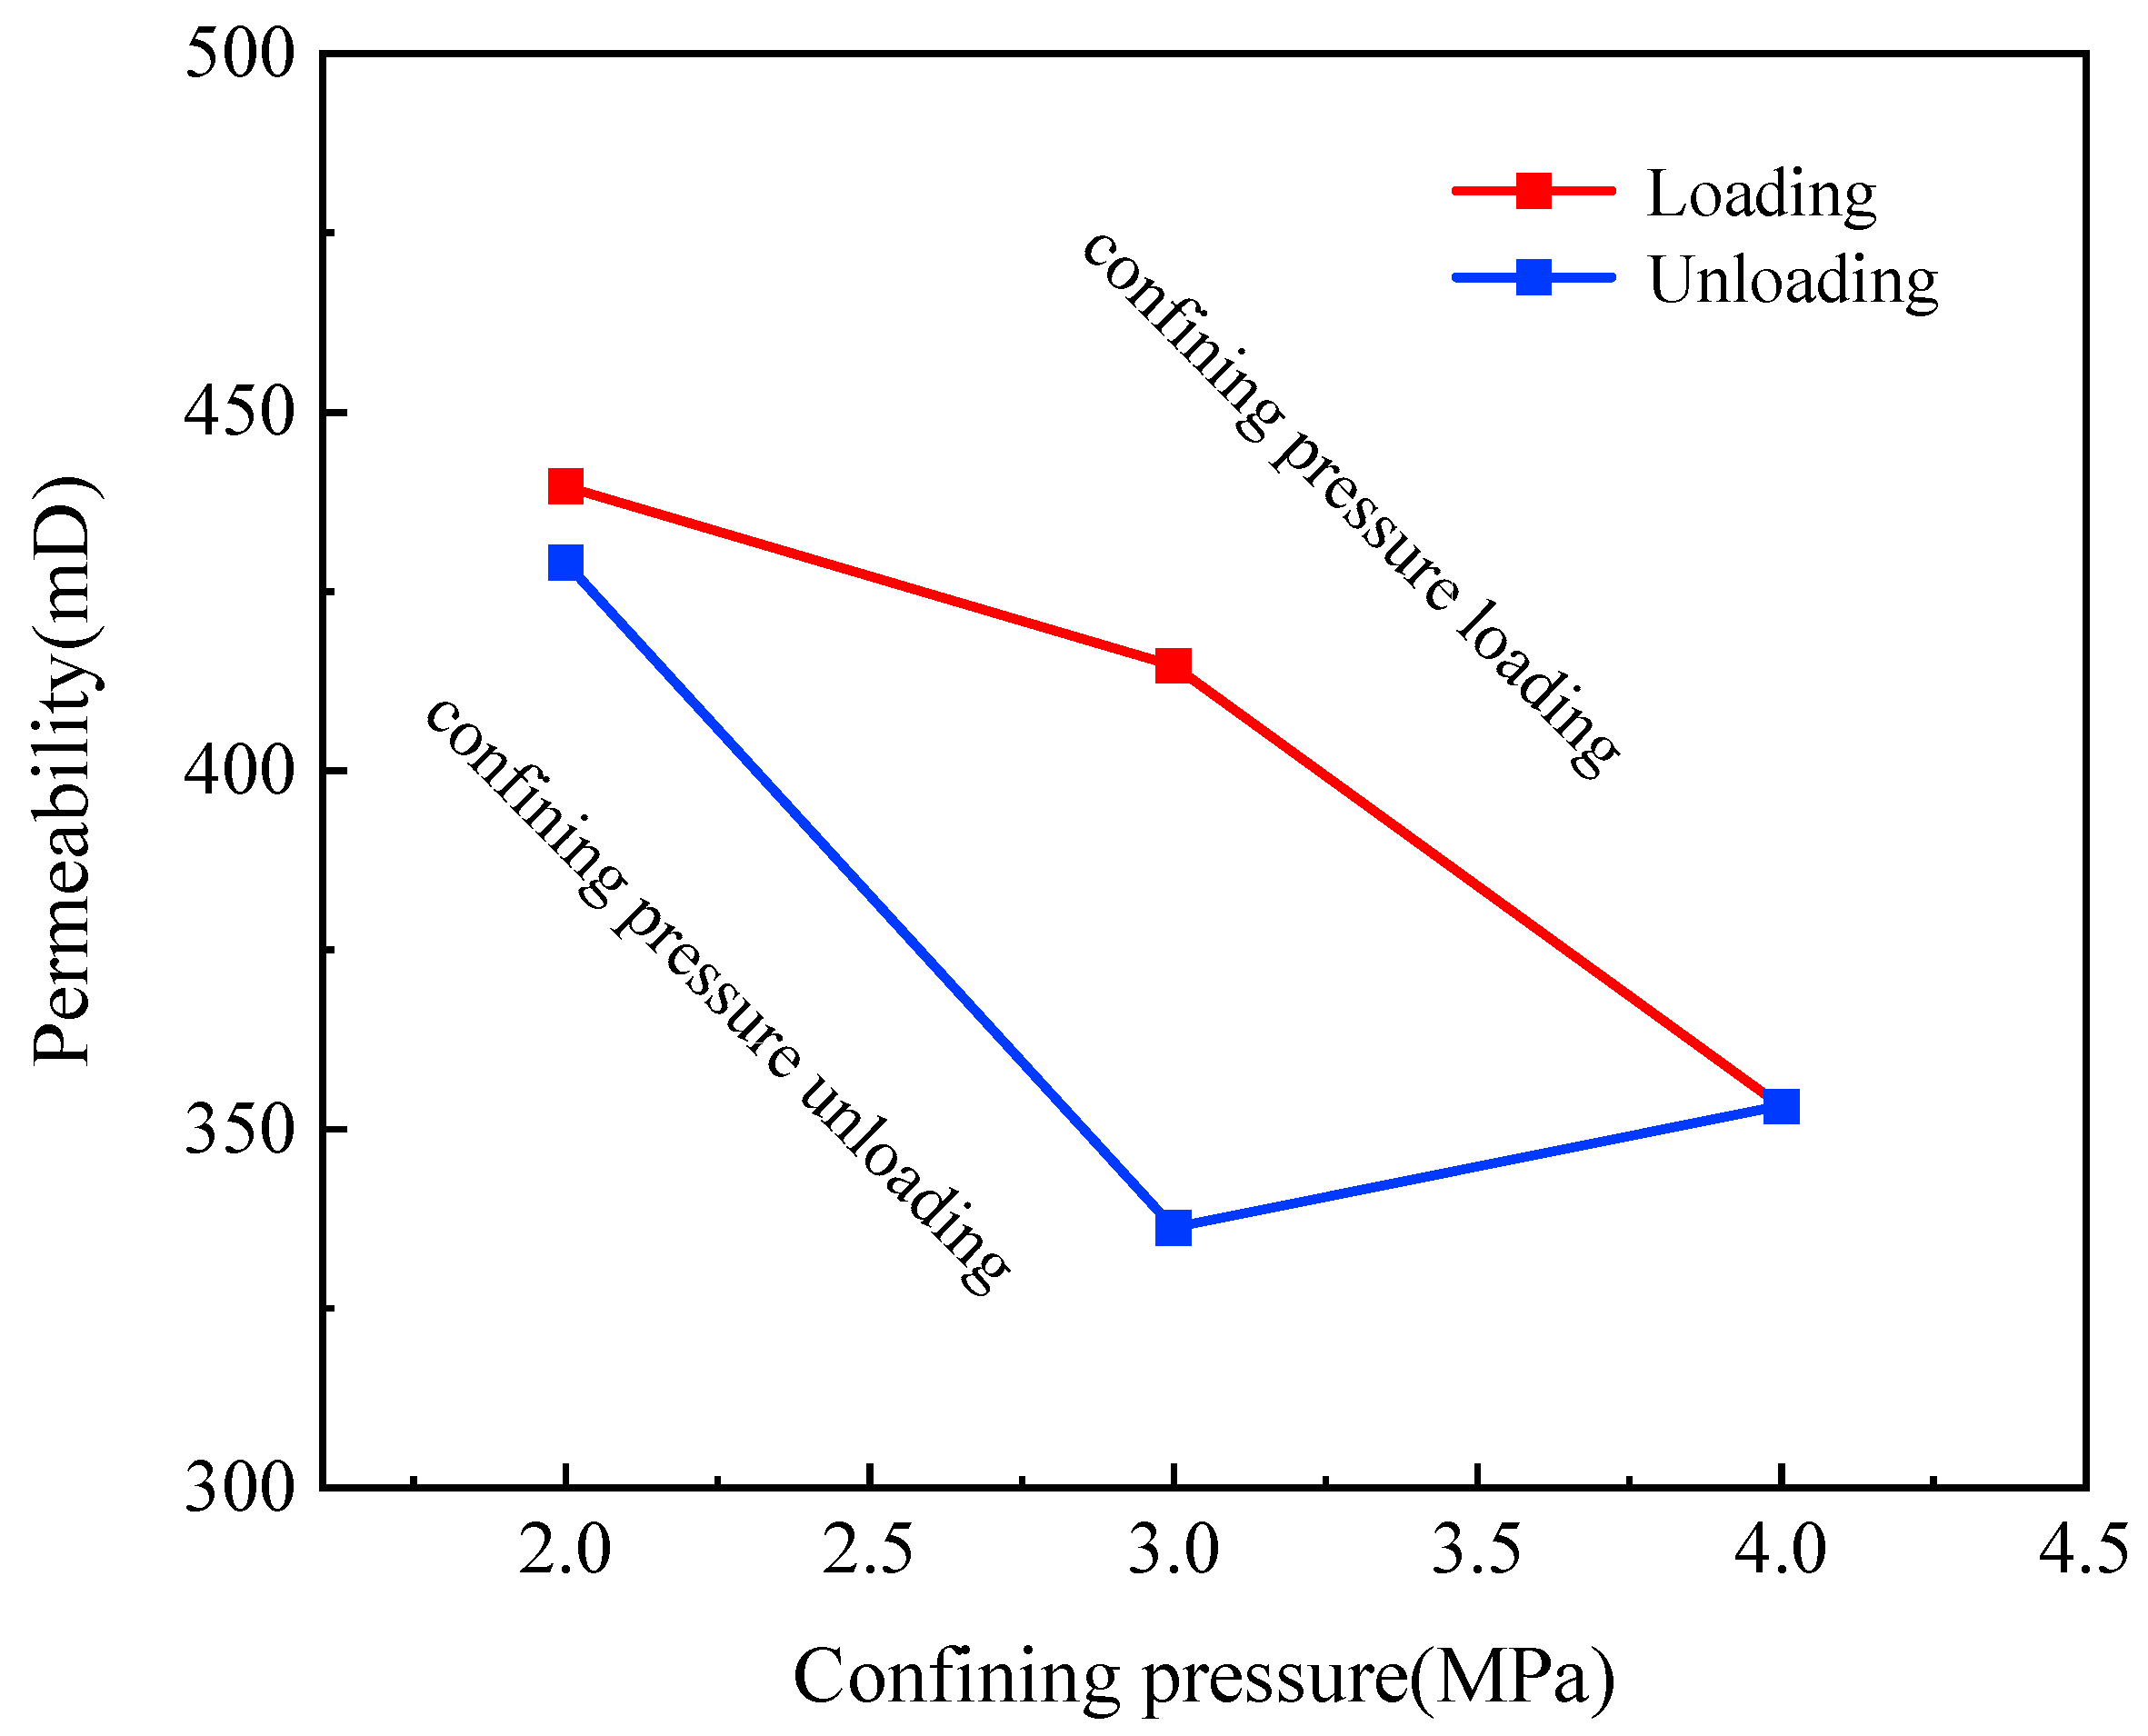
As revealed in Table 2, the permeability of the sample during loading and unloading of confining pressure ranged from 336.2 mD to 439.6 mD. This range demonstrated favorable permeability properties of reef limestone, suggesting well-developed porosity and effective seepage channels.
Figure 6 illustrates the evolution of sample permeability with confining pressure under a constant osmotic pressure. The reef limestone, primarily formed from the accumulation of seafloor plant and animal debris, exhibits properties that differ slightly from those of typical rocks, resulting in a nonlinear relationship between confining pressure and permeability. As the confining pressure increased from 2 MPa to 4 MPa, the permeability of the sample decreased. This decrease can be attributed to the compression of the sample’s pore throats under confining pressure, which reduced the seepage channels. As a result, the amount of medium passing through the cross-section per unit time decreased, ultimately leading to a decline in permeability. When the confining pressure was reduced from 4 MPa to 3 MPa, the permeability recovery was not significant and even exhibited a downward trend. This indicated that, in the initial stage of unloading, the sample still maintains a large confinement pressure constraint. At the same time, the internal debris generated during the loading stage was not timely removed from the rock sample by the permeating medium, resulting in a lower permeability at a confinement pressure of 3 MPa during unloading compared to a confinement pressure of 4 MPa during loading. This experimental result is similar to the permeability sensitivity test conducted by scholars on granite and sandstone, respectively [36,37]. As the confining pressure decreased to 2 MPa, a sudden increase in permeability was observed. This change suggested that the compressed pores and throat channels within the sample recovered during the unloading process, without substantial internal damage. Overall, fewer seepage channels were compromised during the loading process. Therefore, the permeability after unloading to the initial confining pressure state was still smaller than the initial permeability.
The analysis revealed that the permeability of reef limestone is primarily related to the internal effective seepage channels. During loading, the permeability demonstrated a negative nonlinear relationship with the confining pressure. Compression and potential collapse of internal pores led to limited recovery in some sample during unloading. Due to the unique properties of reef limestone, the degree of irreversible permeability recovery varied among the sample.

3.2. Evolution of Pore Distribution in Reef Limestone

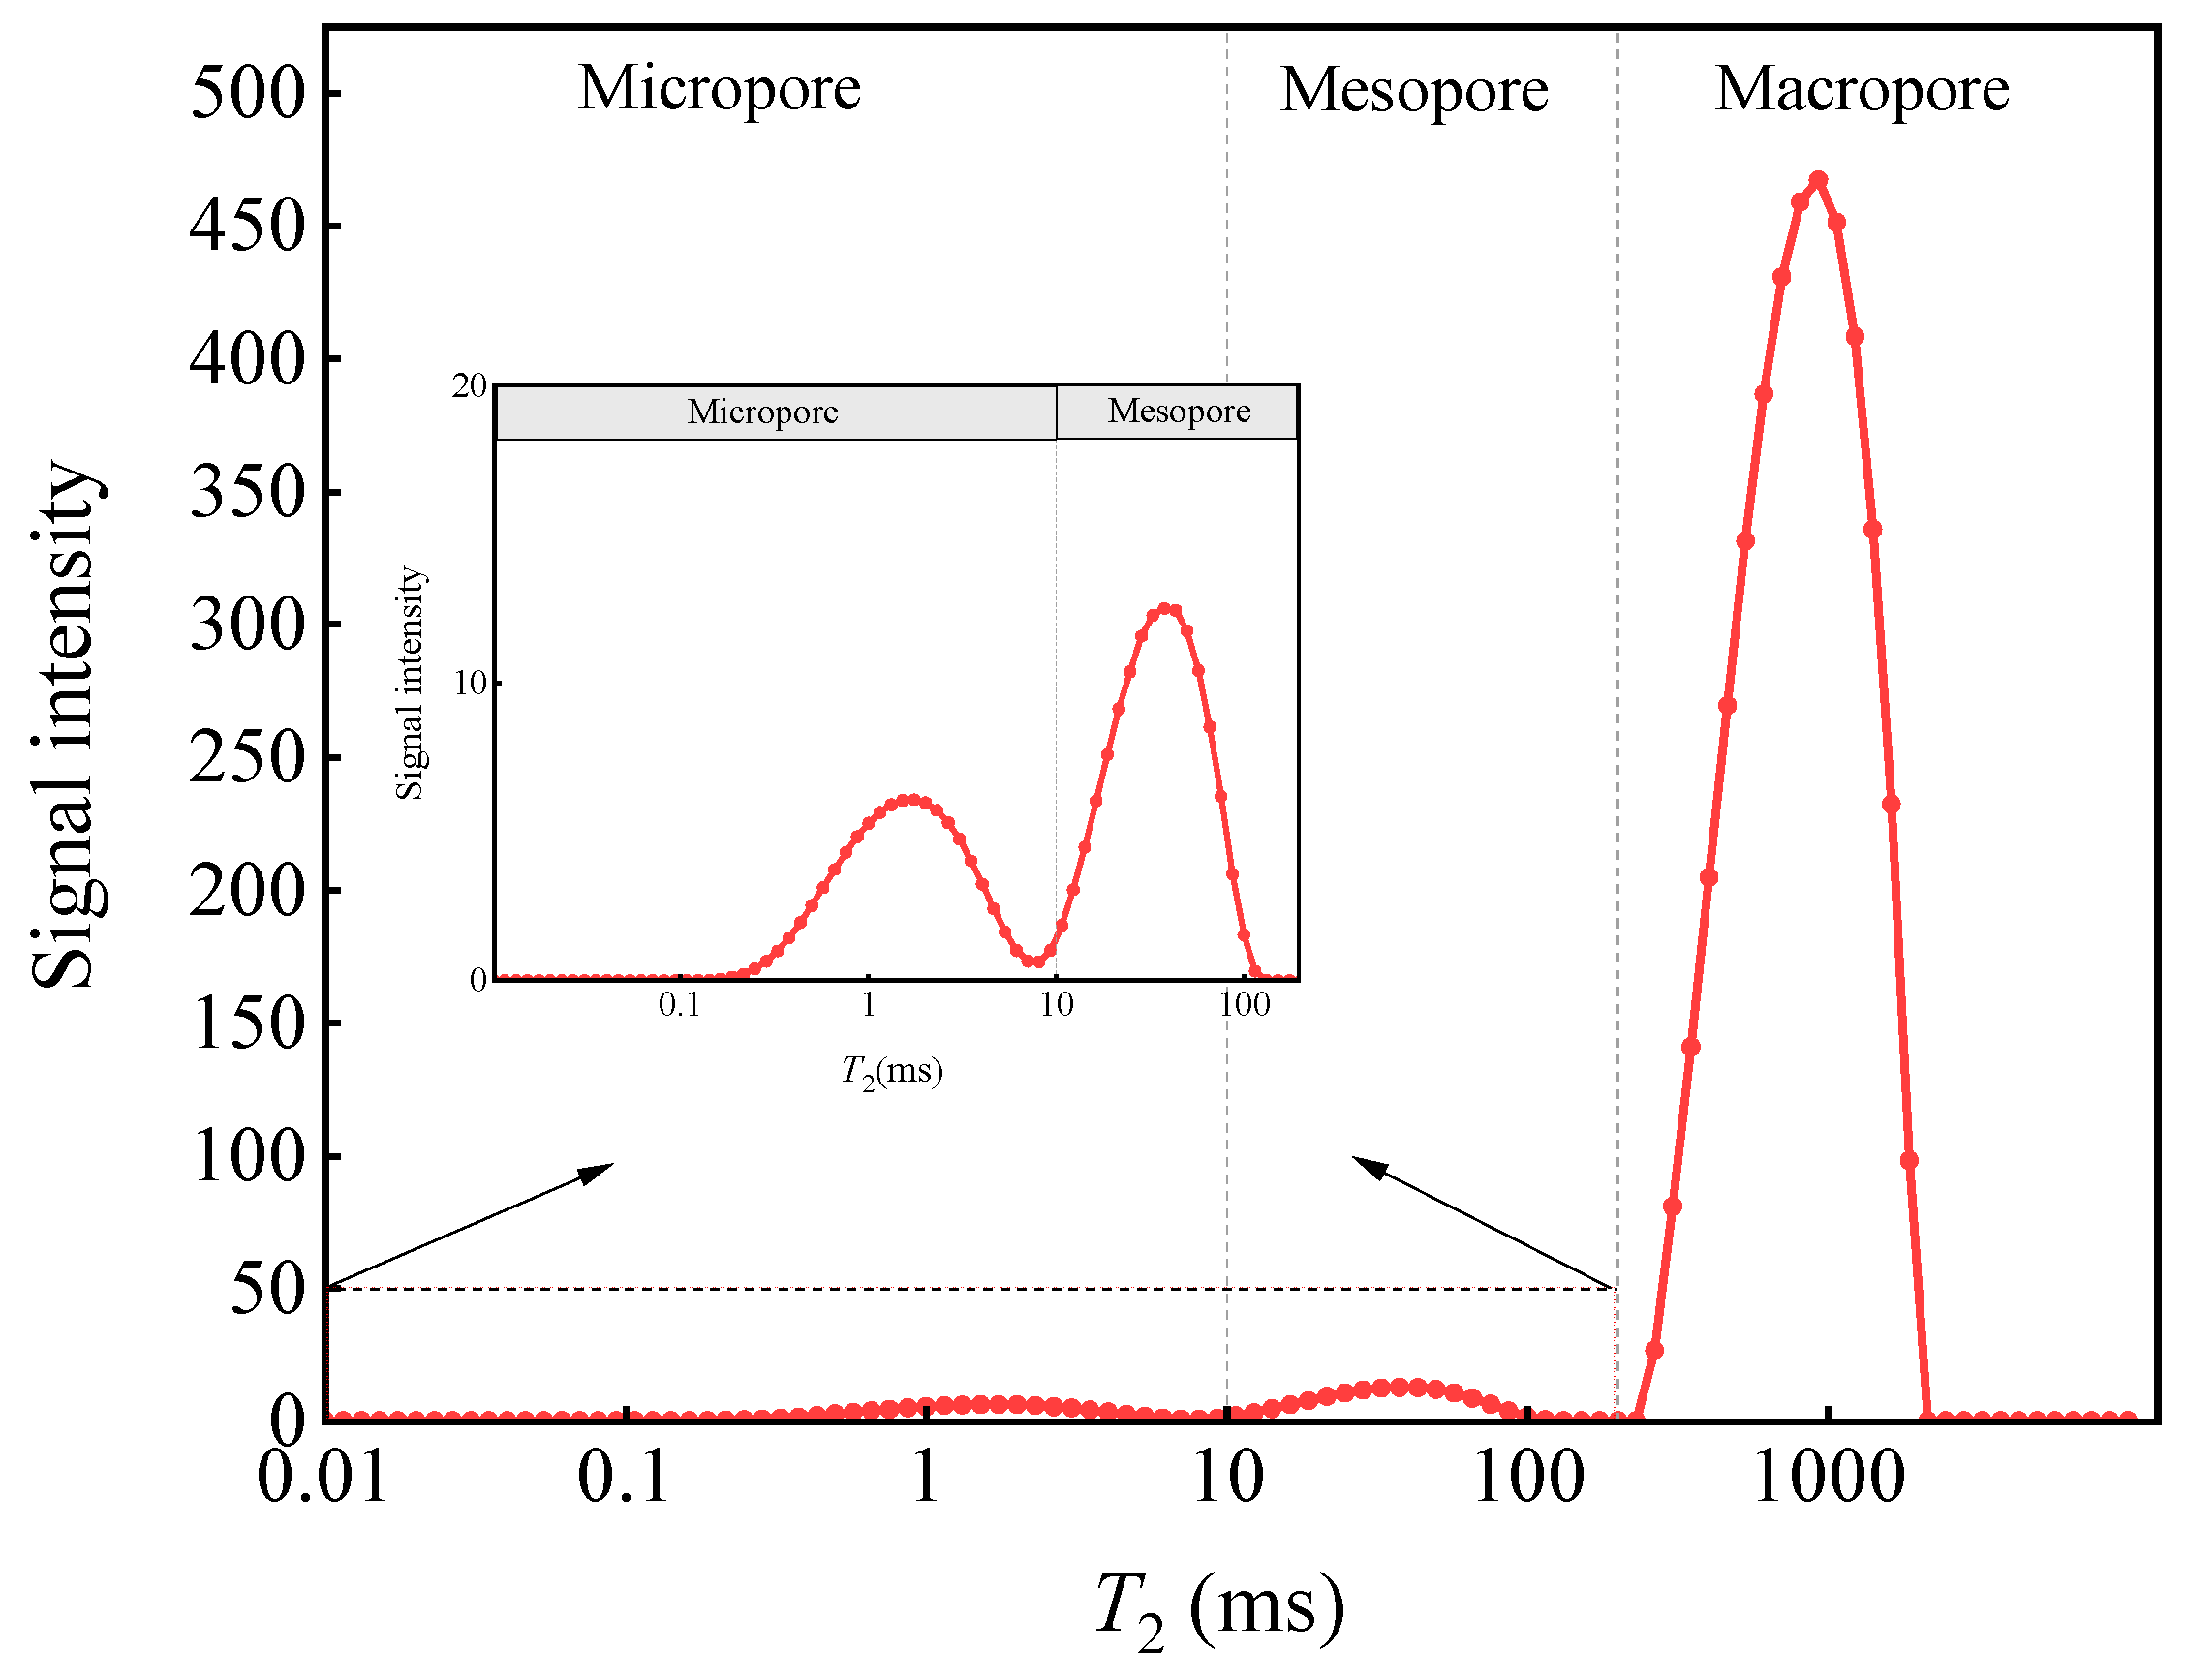
The initial unpressurized T2 spectra of saturated sample is presented in Figure 7. The T2 spectra of reef limestone exhibited multiple peaks, demonstrating a more complex pore structure. The pores can be classified into micropores, mesopores, and macropores based on relaxation time and peak shape [26]. Notably, the main peak of the T2 spectrum was broad, while the relaxation time ranged from 100 ms to 10,000 ms. These observations indicated that the rock sample was mainly dominated by macropores, while micropores and mesopores, with relaxation times between 1 ms and 100 ms, were relatively scarce.
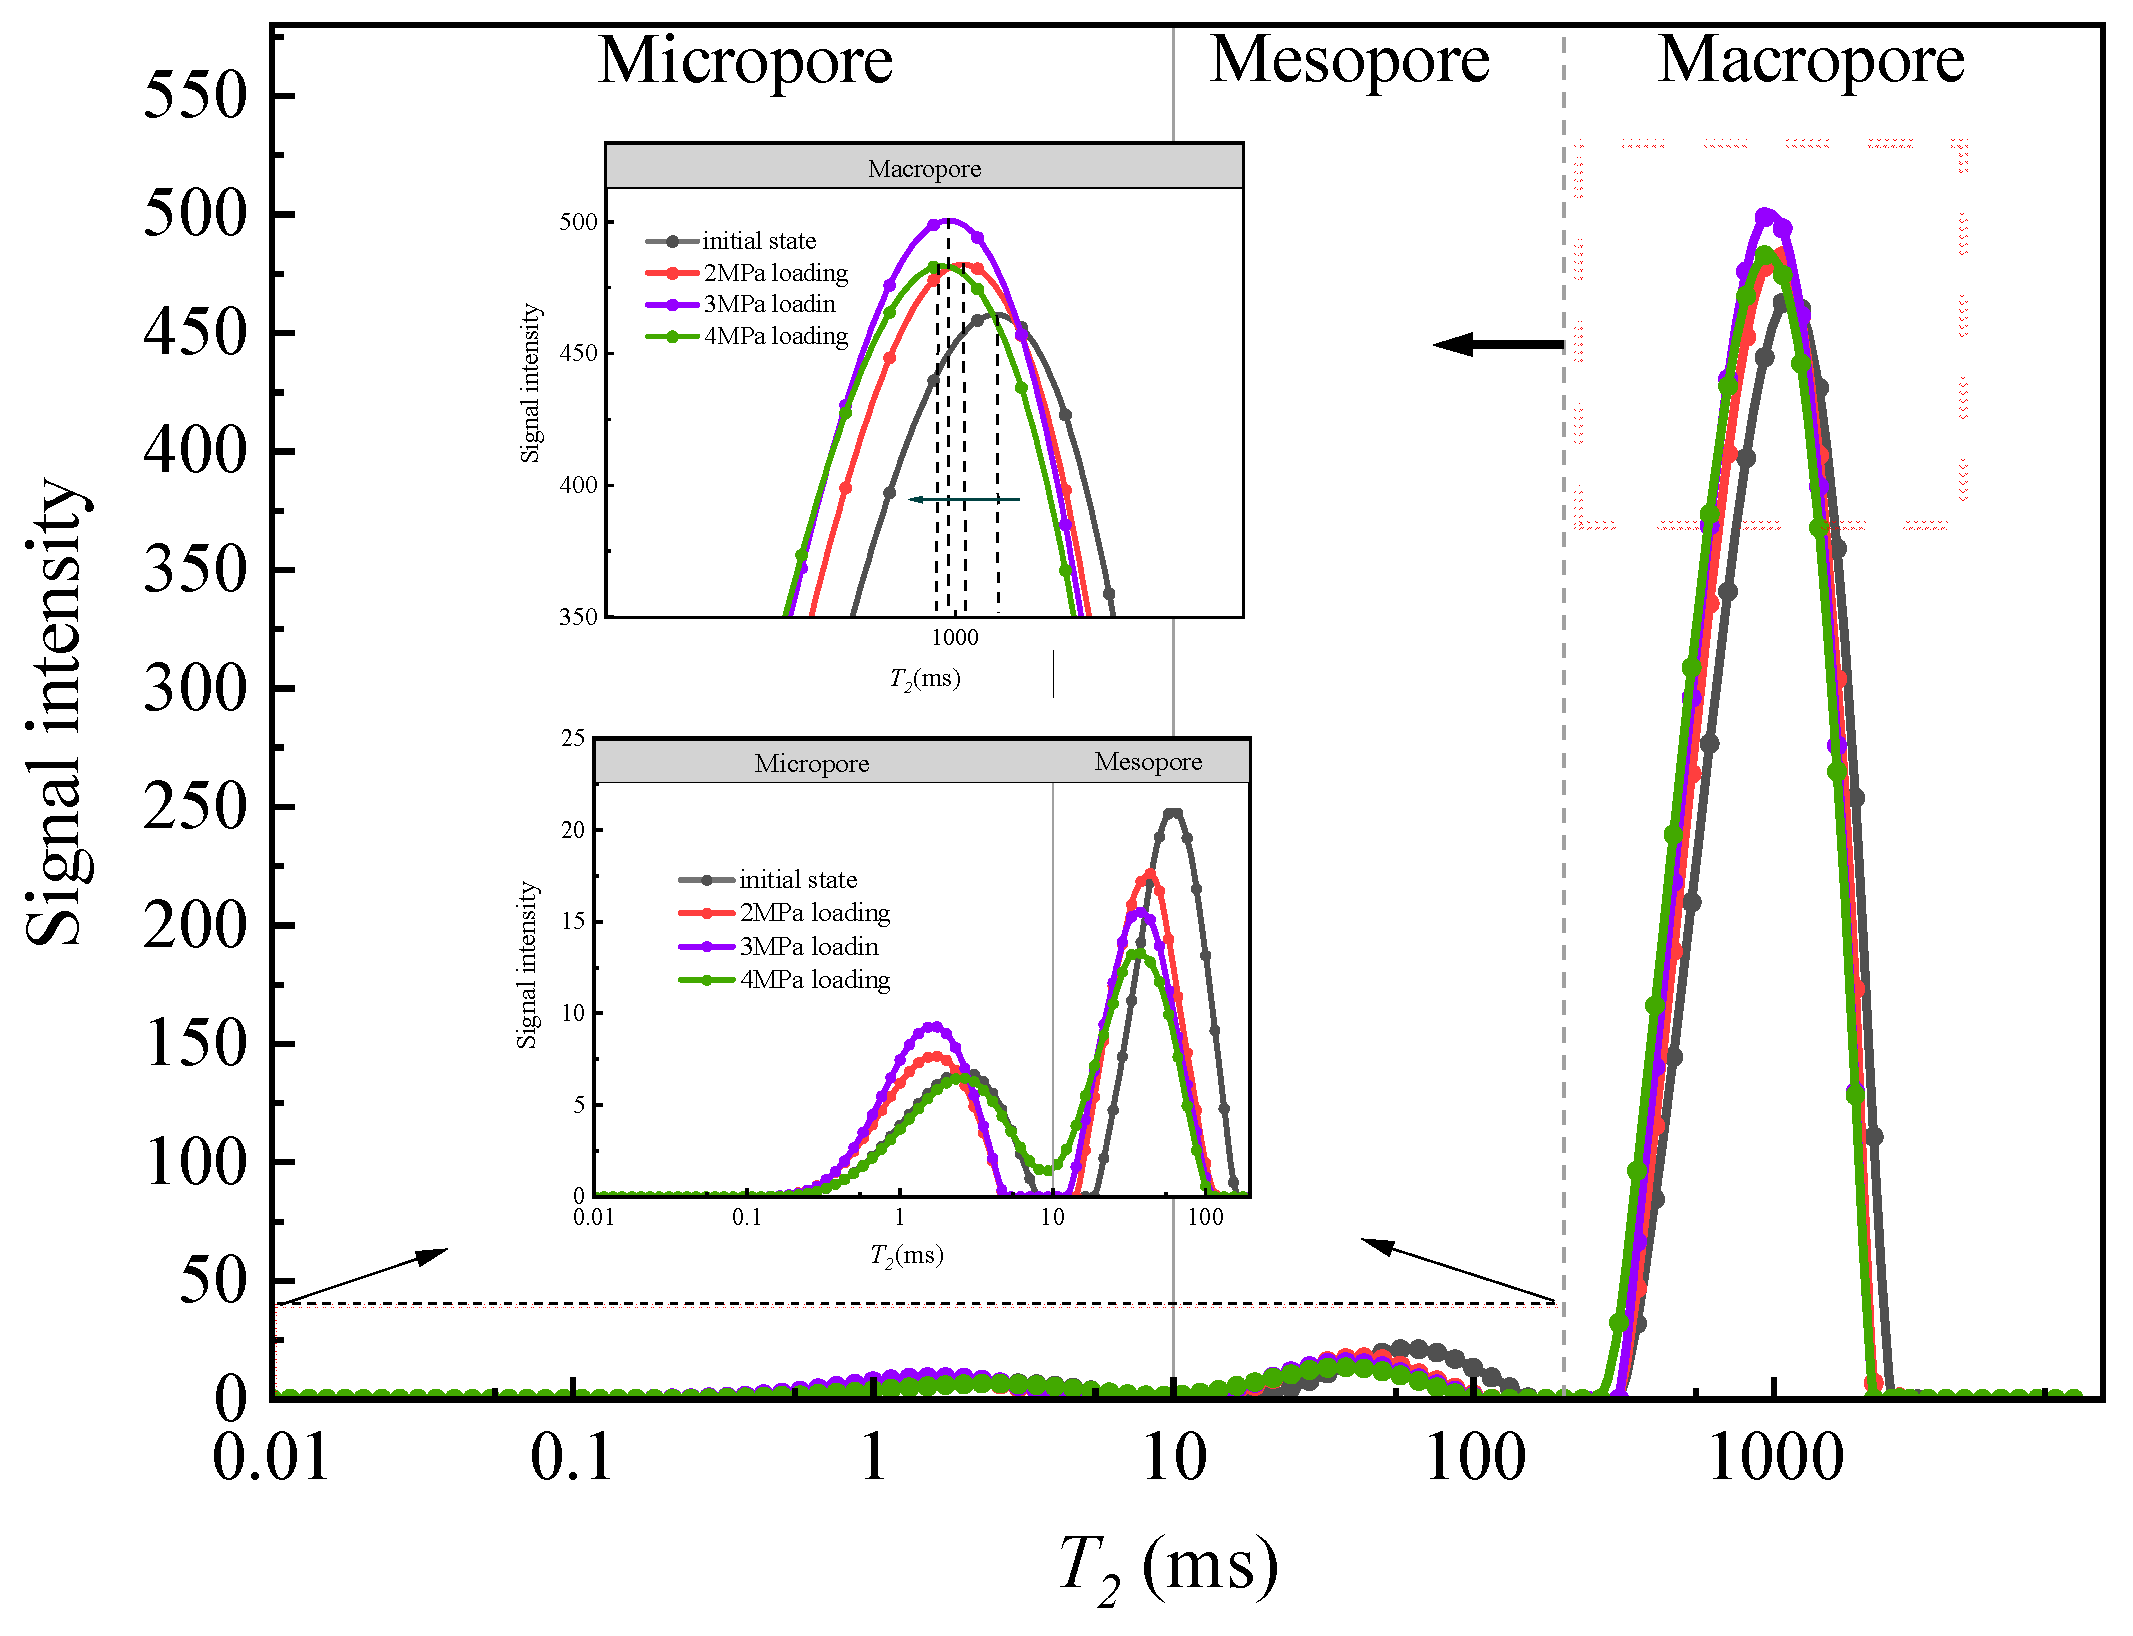
Figure 8 illustrates the T2 spectra of the sample during the loading process. The relaxation time in the T2 spectra corresponds to the pore size distribution, while the signal intensity represents the pore volumes at specific pore sizes. Initially, the unpressurized rock sample was saturated without confining pressure. As the confining pressure increased from the initial unpressurized state to 4 MPa, a slight increase in peak value was observed, accompanied by a leftward shift in the main peak. This shift indicated that during loading, the water-filled pores were compressed, causing the liquid in macropores to be forced into micropores and macropores. Therefore, both the main peak and the secondary peak show a leftward trend, with the main peak exhibiting an increasing trend in its peak value. The movement trend of the secondary peak’s peak value differs from that of the main peak. The signal strength and relaxation time of the secondary peak differ greatly from those of the main peak, and the trend of the secondary peak differs significantly from the evolution trend of permeability, indicating that the contribution of small and medium pores is minimal in the process of infiltration. This also suggests that the small and medium pores corresponding to the secondary peak have a small impact on the change in permeability of the sample.
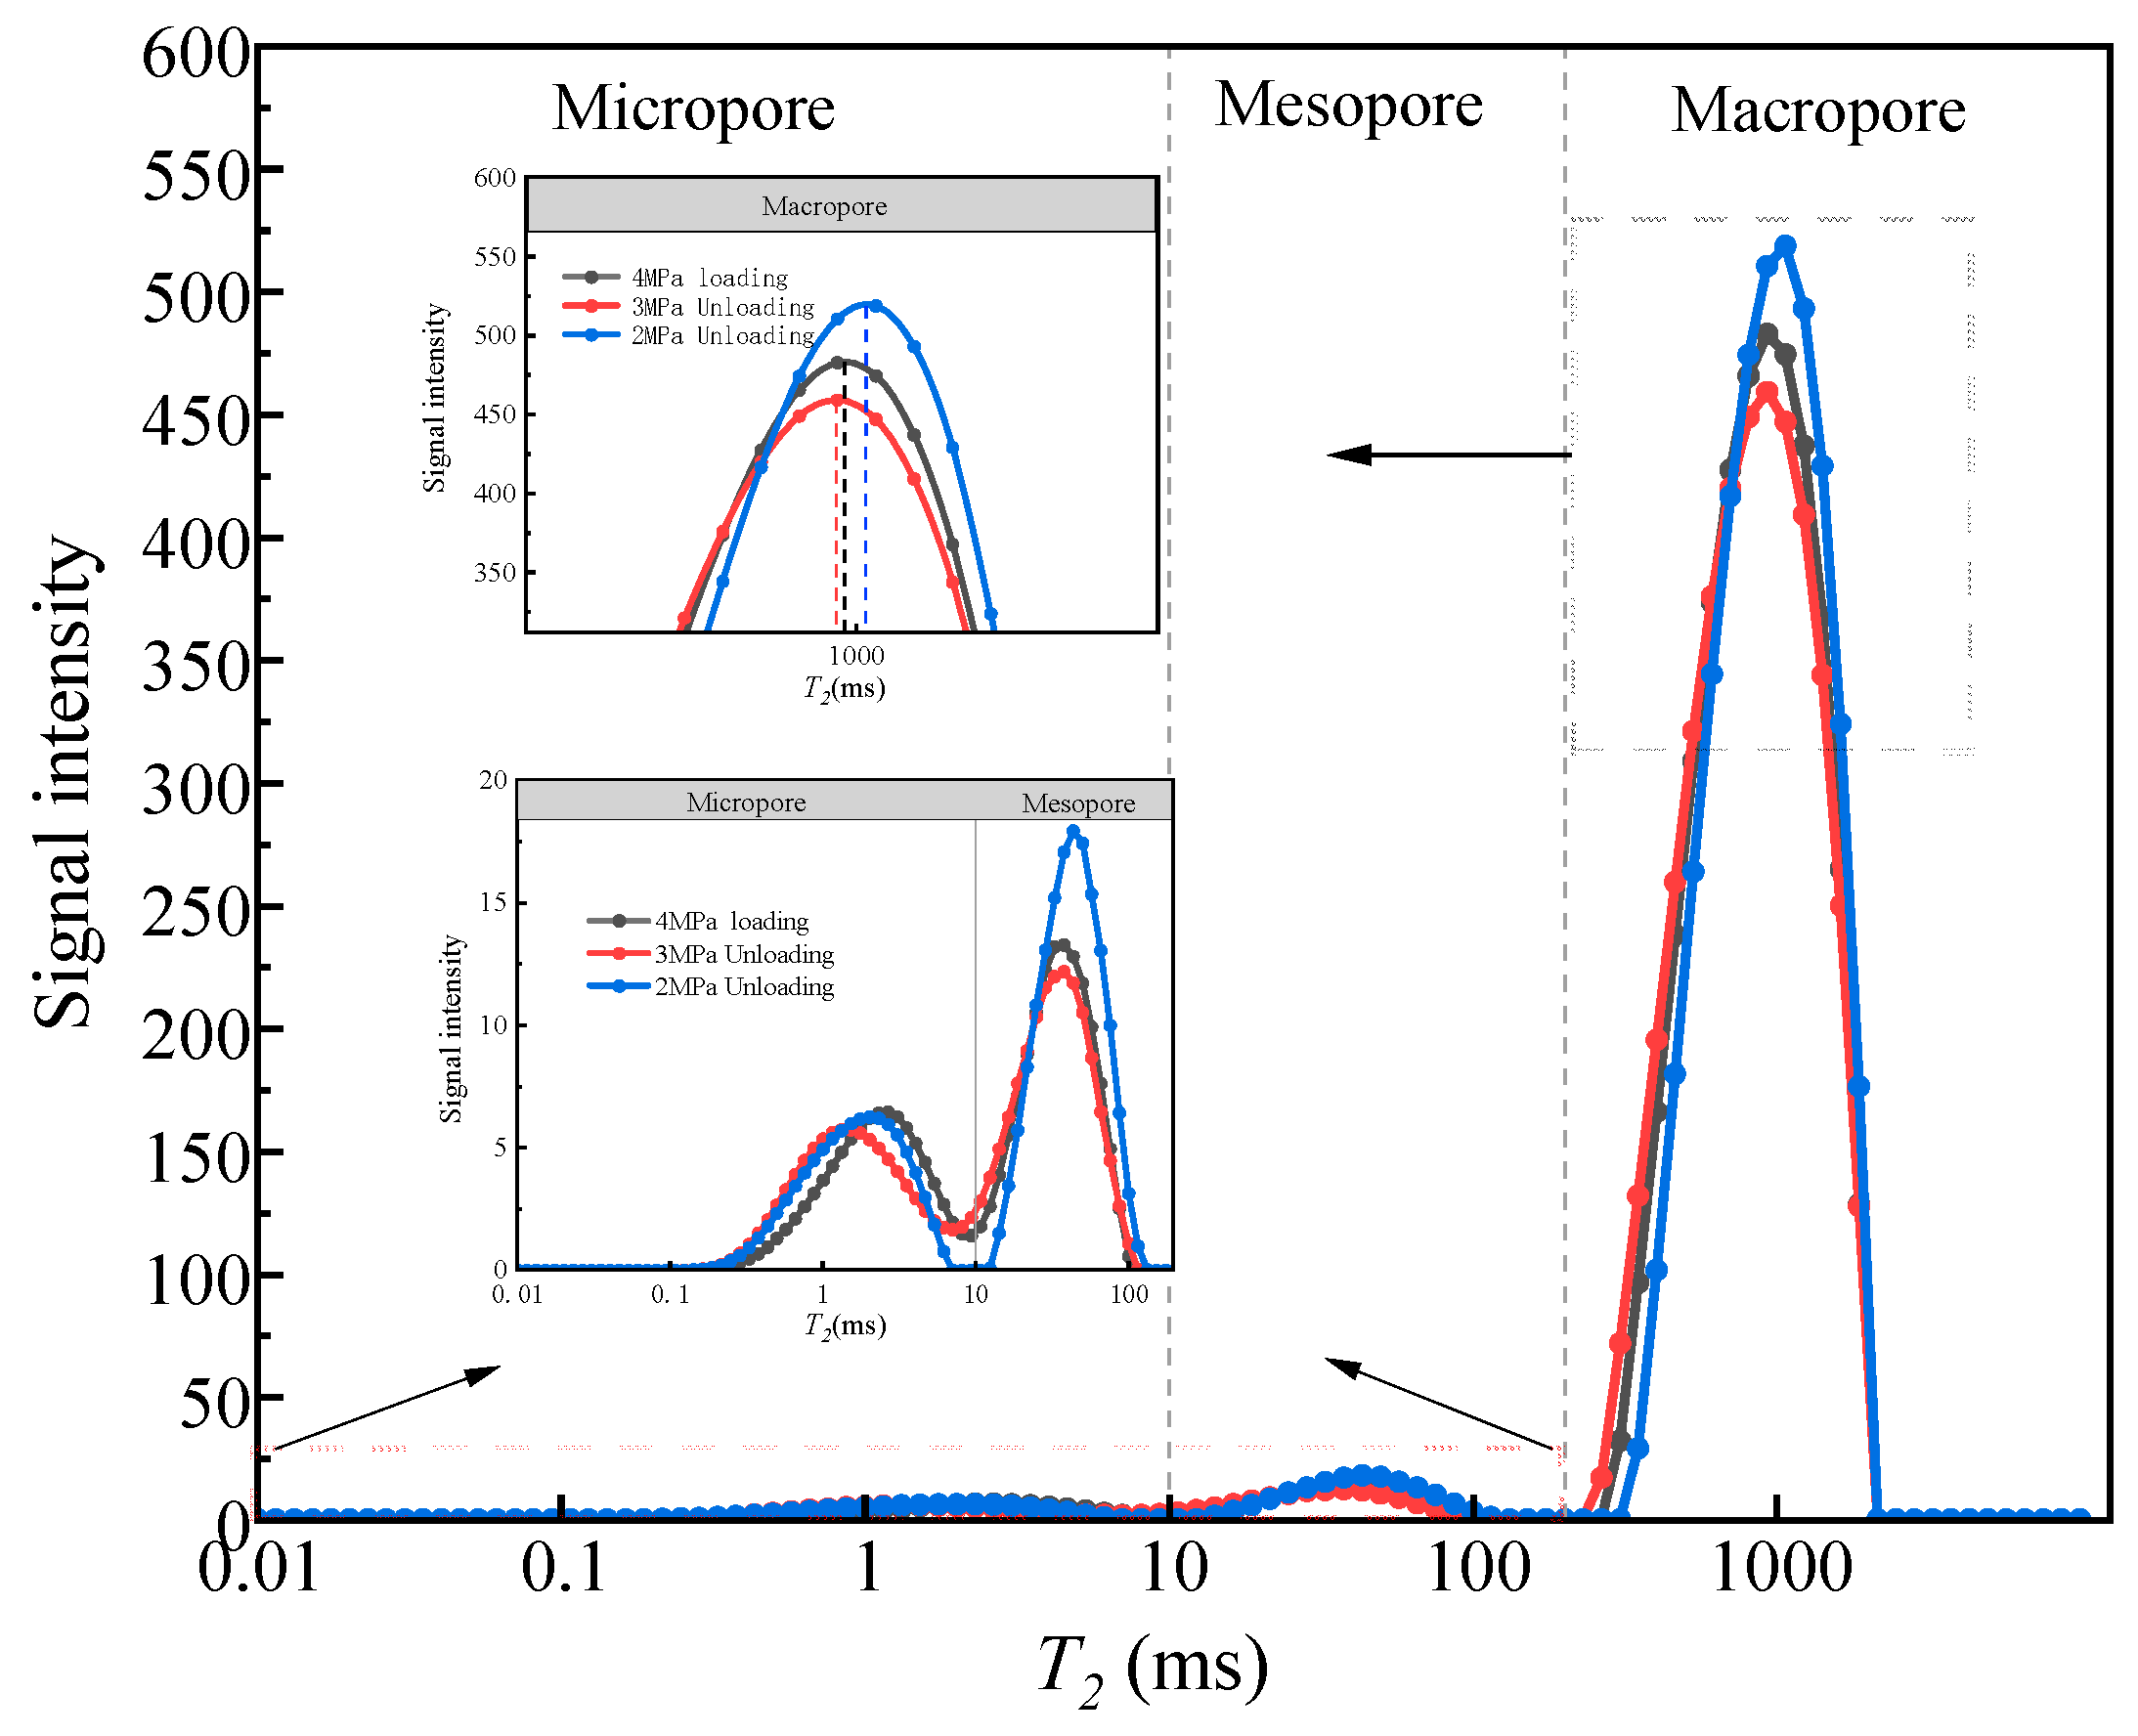
Figure 9 presents the T2 spectra of reef limestone during the unloading process, which exhibited a different trend of movable water flow compared to that observed during the loading process. As the confining pressure decreased from 4 MPa to 3 MPa, the main peak exhibited an overall leftward shift, with a decrease in peak frequency. This indicated a loss of movable water from the macropores. Further unloading to 2 MPa resulted in a significant increase in the main peak, which shifted to the right. This shift indicated that macropores recovered from compression during unloading, resulting in an increase in both the size and total volume of macropores beyond their dimensions at 3 MPa and 4 MPa. Consequently, the amount of movable water increased, and the number of effective seepage channels rose.
During the loading process, the main peak showed an overall leftward shift, indicating the compression of macropores, which reduced effective seepage channels and decreased permeability. In contrast, during the unloading process, the main peak of the T2 spectrum initially decreased and then increased. A sudden rise in permeability was observed when the confining pressure was reduced from 3 MPa to 2 MPa. This increase is supported by the T2 spectrum analysis during the unloading process. The recovery of macropores within the rock sample enlarged the seepage channel size, increased the volume of movable water, and created new effective seepage channels, thereby enhancing permeability.

3.3. Relationship Between Pore Volume Increment and Permeability

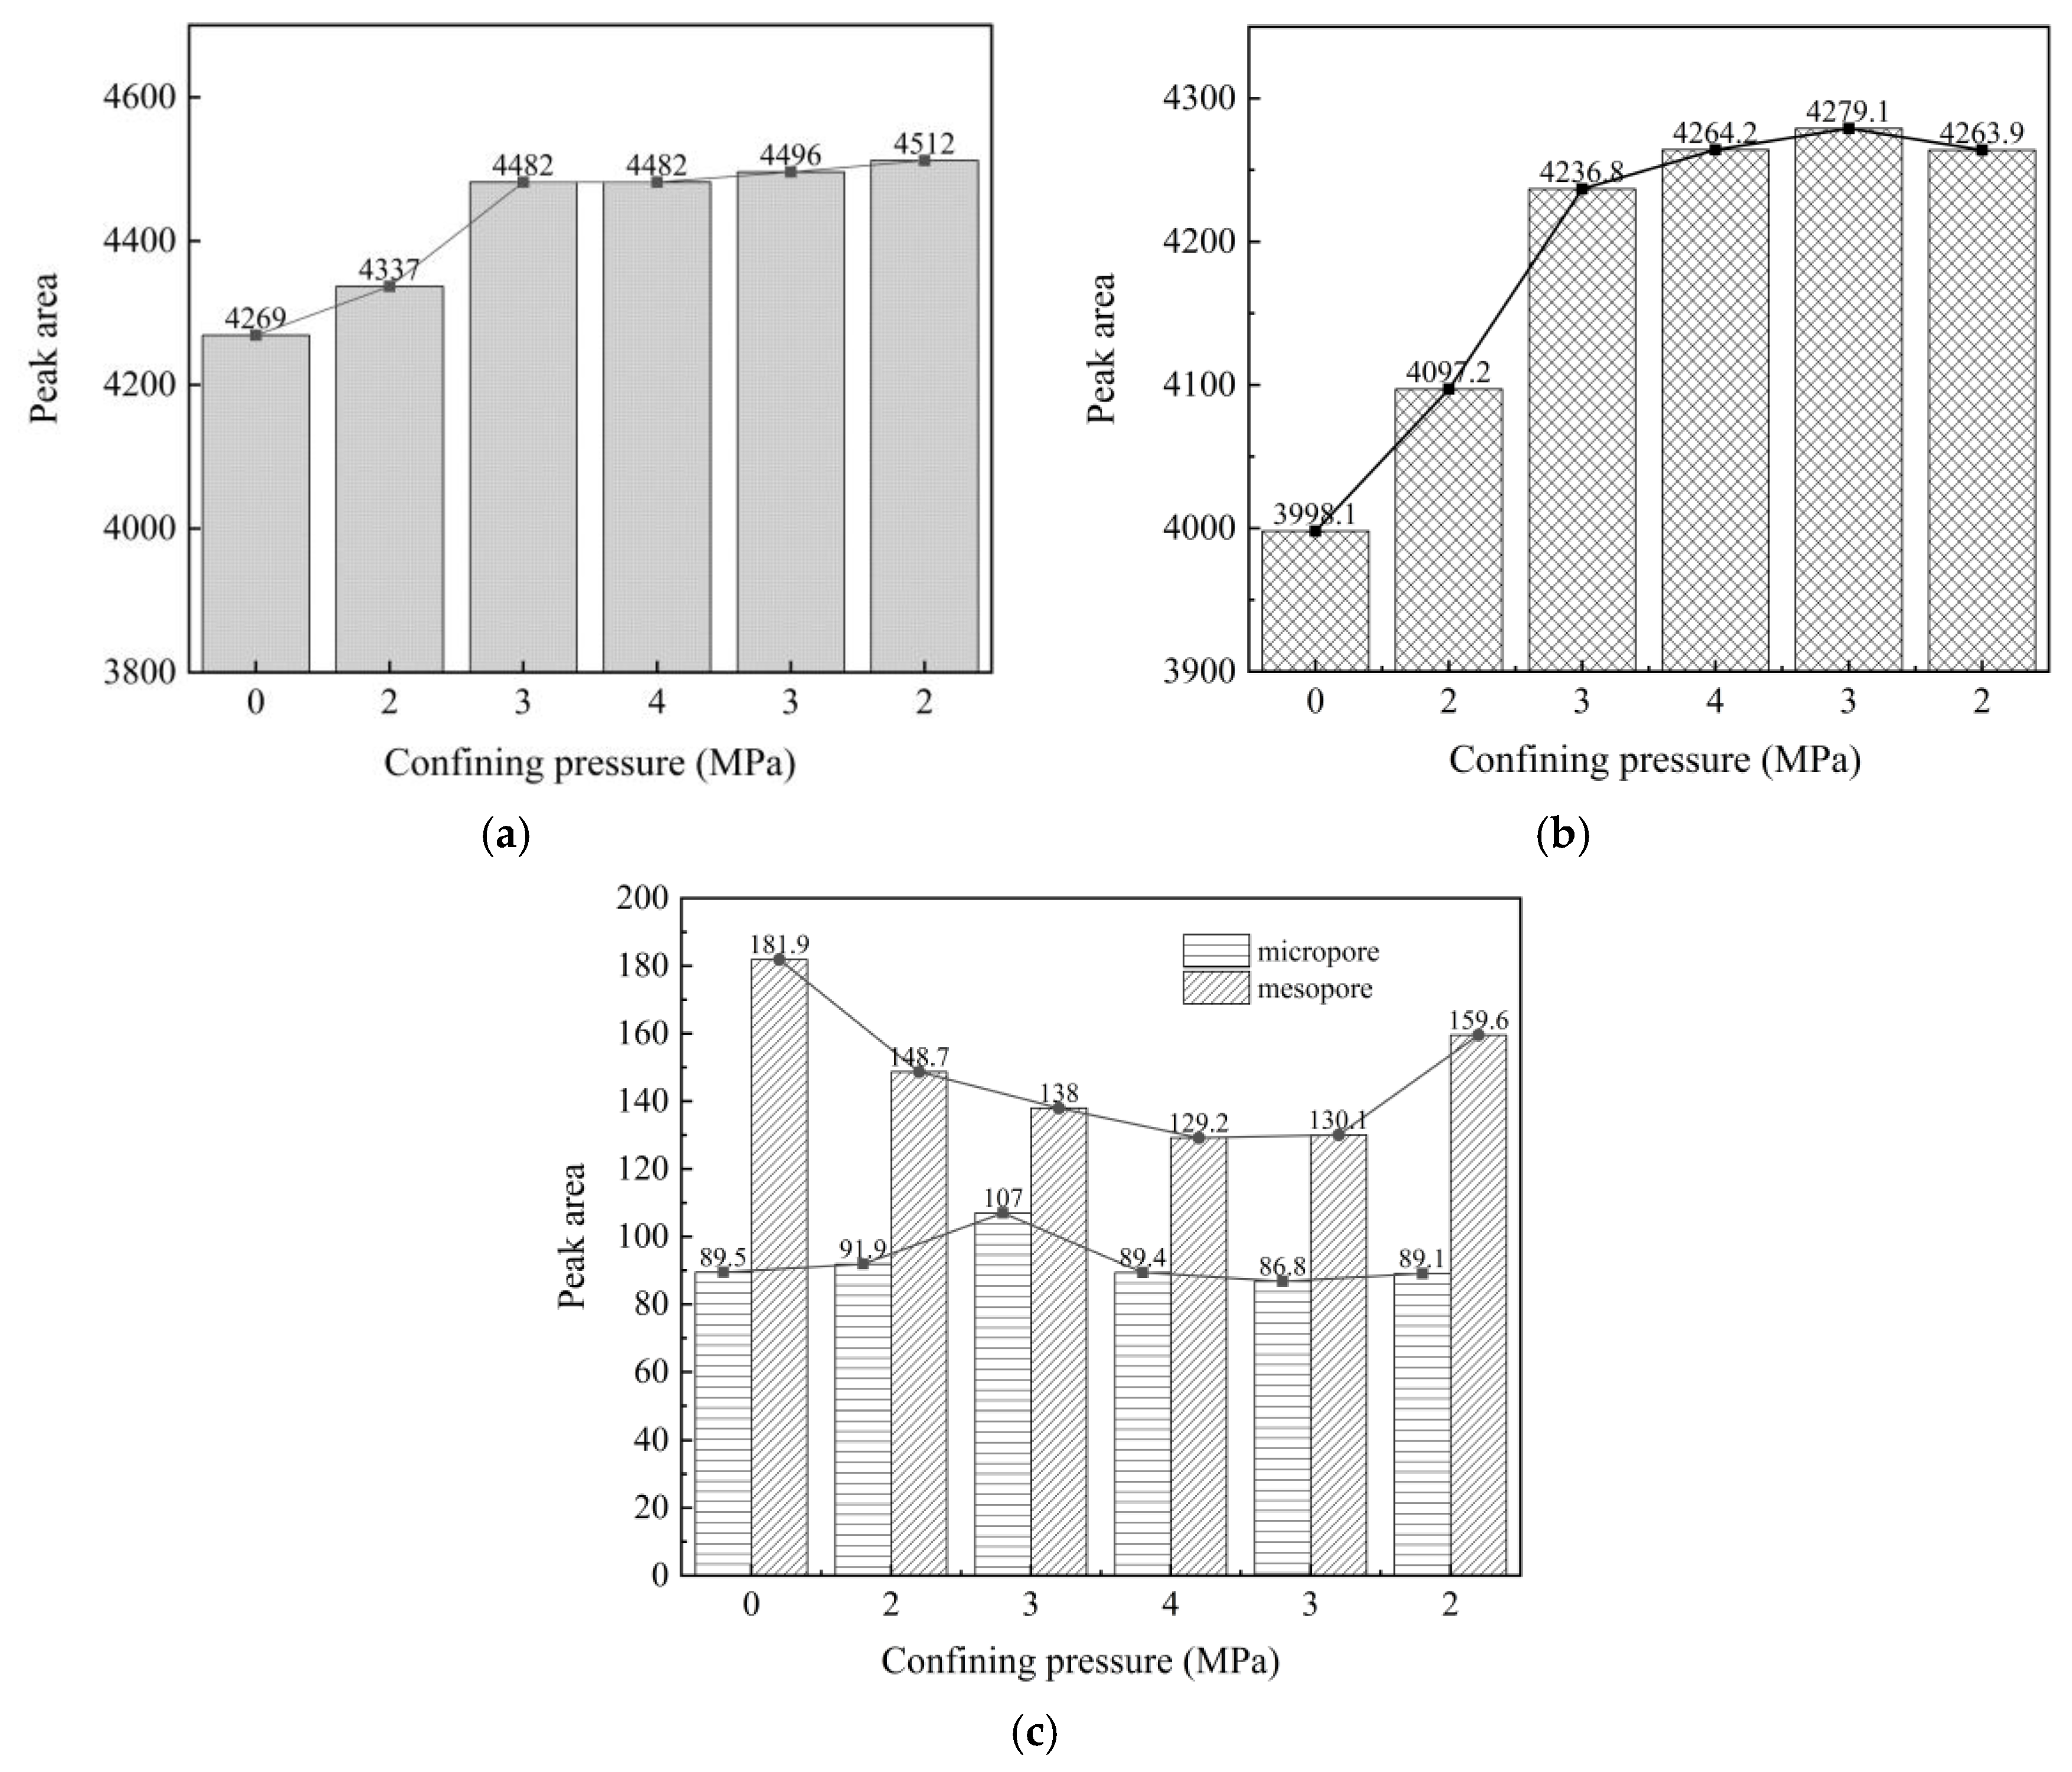
As shown in Figure 10a, the total pore volume increased during the loading process. This observation indicated that the initial application of confining pressure caused some pores to fracture, resulting in an increase in pore volume. Figure 10b shows the trend of the change in the main peak area of the sample. With the increase in confining pressure, the main peak area increases to different extents, indicating that during the loading process, some large pores are compressed, resulting in the formation of new relatively smaller pores or the generation of small cracks due to external forces. These pores and cracks are formed due to the reconstruction of external forces, but their corresponding relaxation time still falls within the main peak range, belonging to relatively small pores in the large pores. When the confining pressure is unloaded to 3 MPa, the main peak area shows a slight increase, indicating that during the release of confining pressure, some undamaged large pores begin to recover.
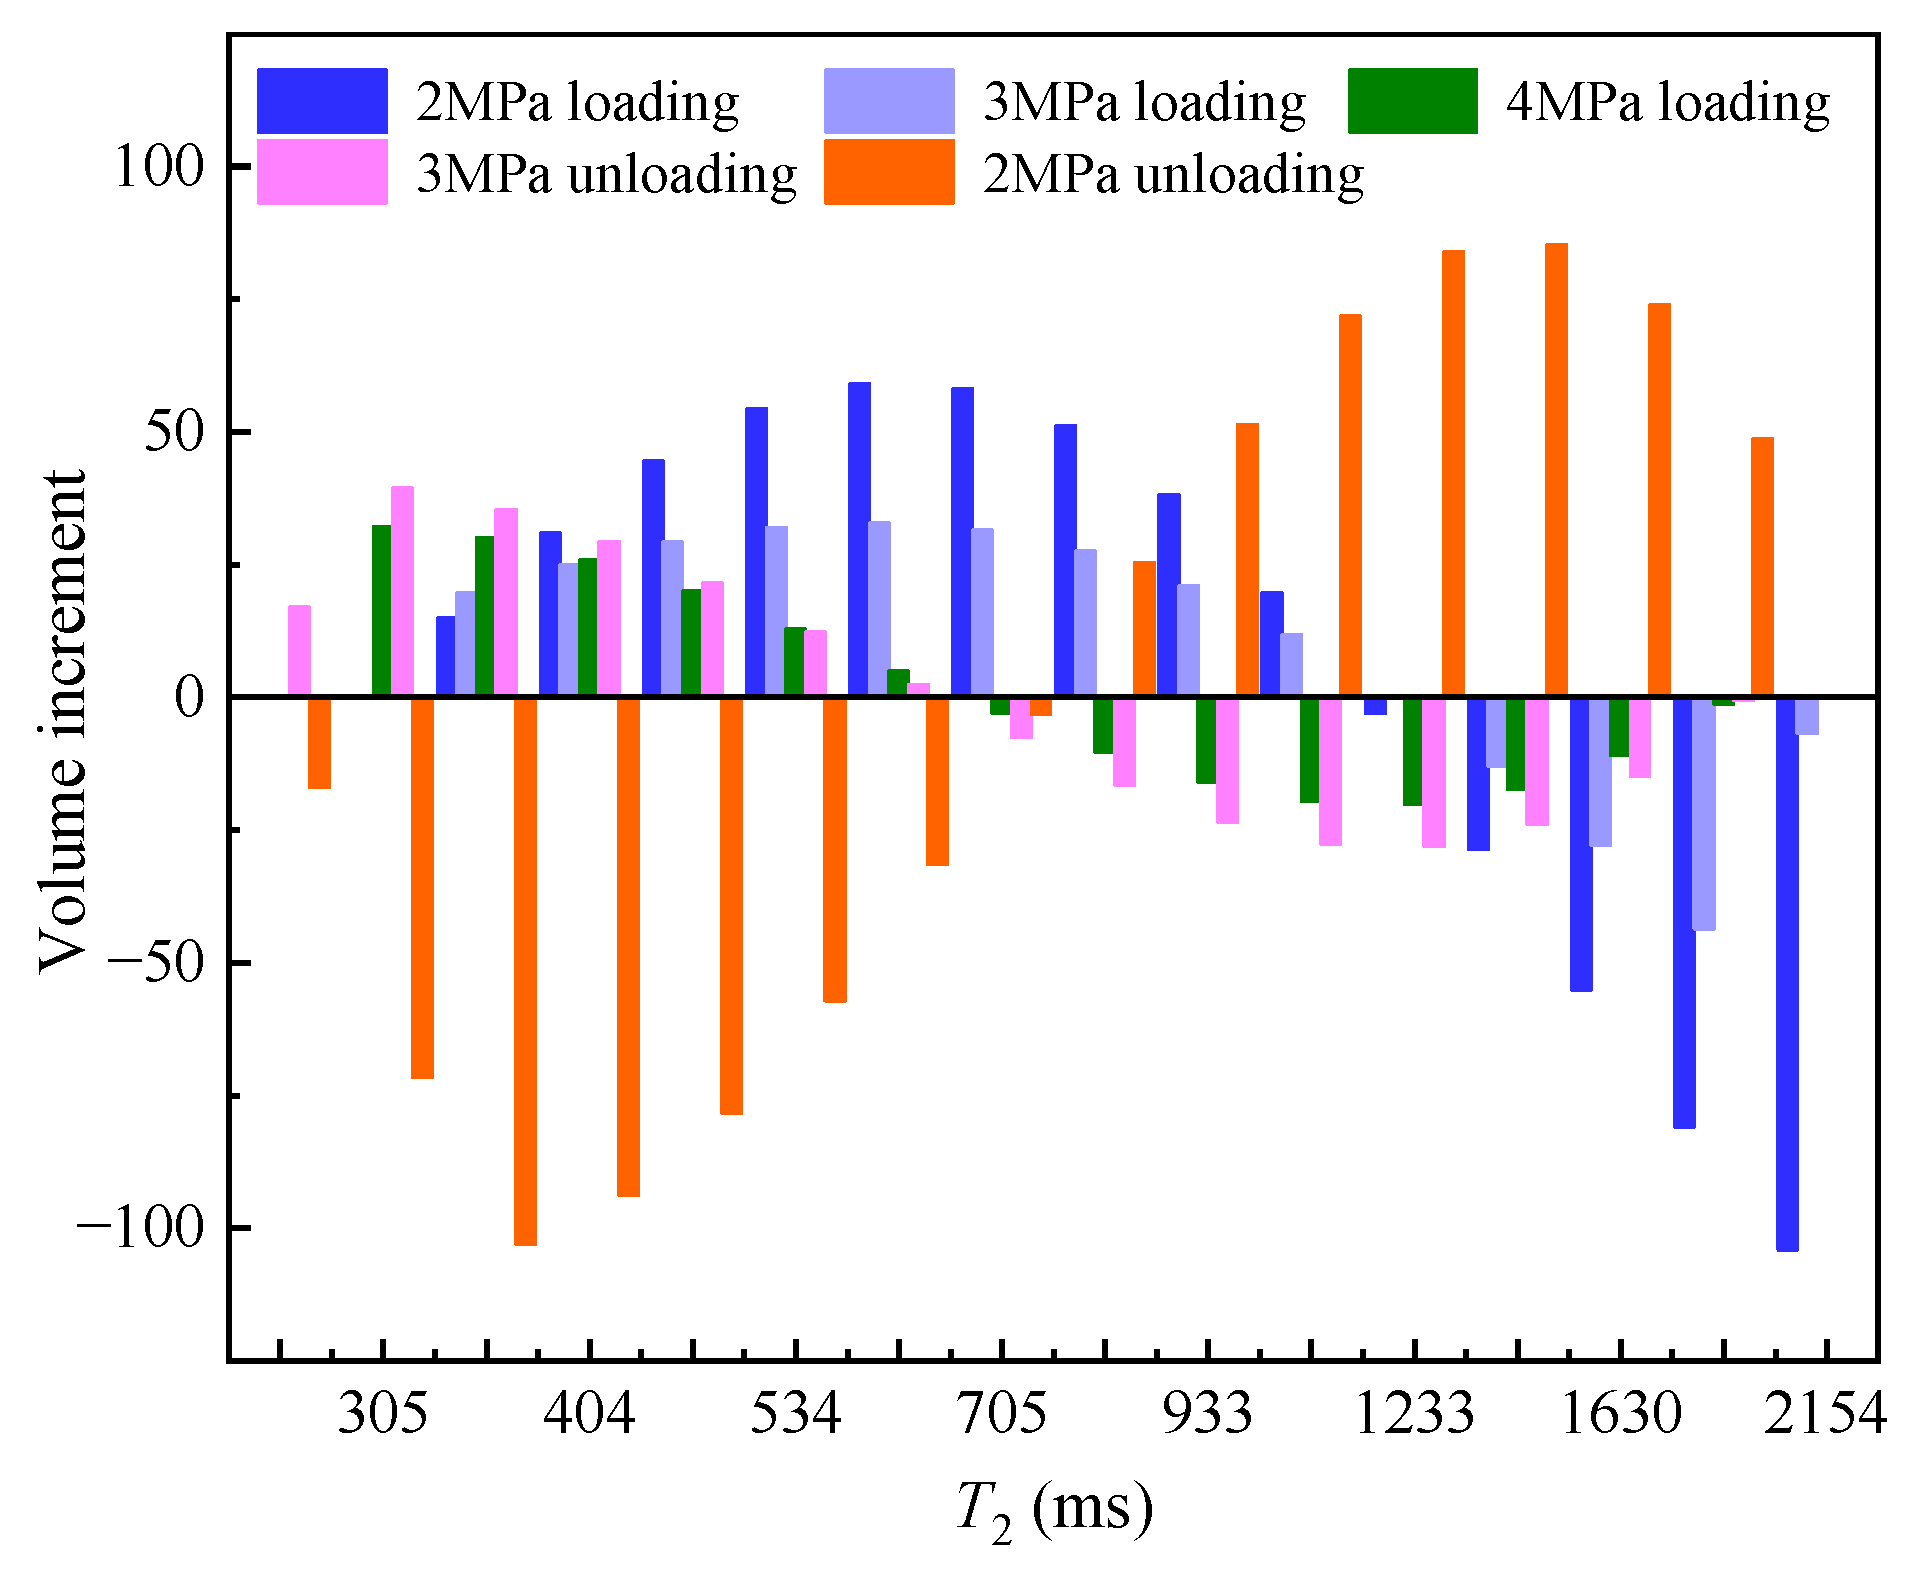
Figure 11 presents the variation in the volume of the macropore. As the confining pressure increased from 2 MPa to 4 MPa, the macropores corresponding to the relaxation time of 2000 ms disappeared, while the pores corresponding to the relaxation times between 1000 ms and 2000 ms were compressed. Additionally, a series of relatively smaller pores and new cracks emerged near the relaxation time of 300 ms, which significantly contributed to the observed decrease in permeability. When the confining pressure was reduced from 3 MPa to 2 MPa, a sudden increase in the fraction of macropores corresponding to the relaxation time between 1000 ms and 2000 ms was observed. Additionally, Figure 6 highlights a sudden increase in permeability during the unloading process. Therefore, it can be concluded that the macropores essential for effective seepage channels were not destroyed by compression and were restored during the unloading process. The permeability of reef limestone is primarily influenced by partial pores and is determined by the effective seepage channels formed by macropores.
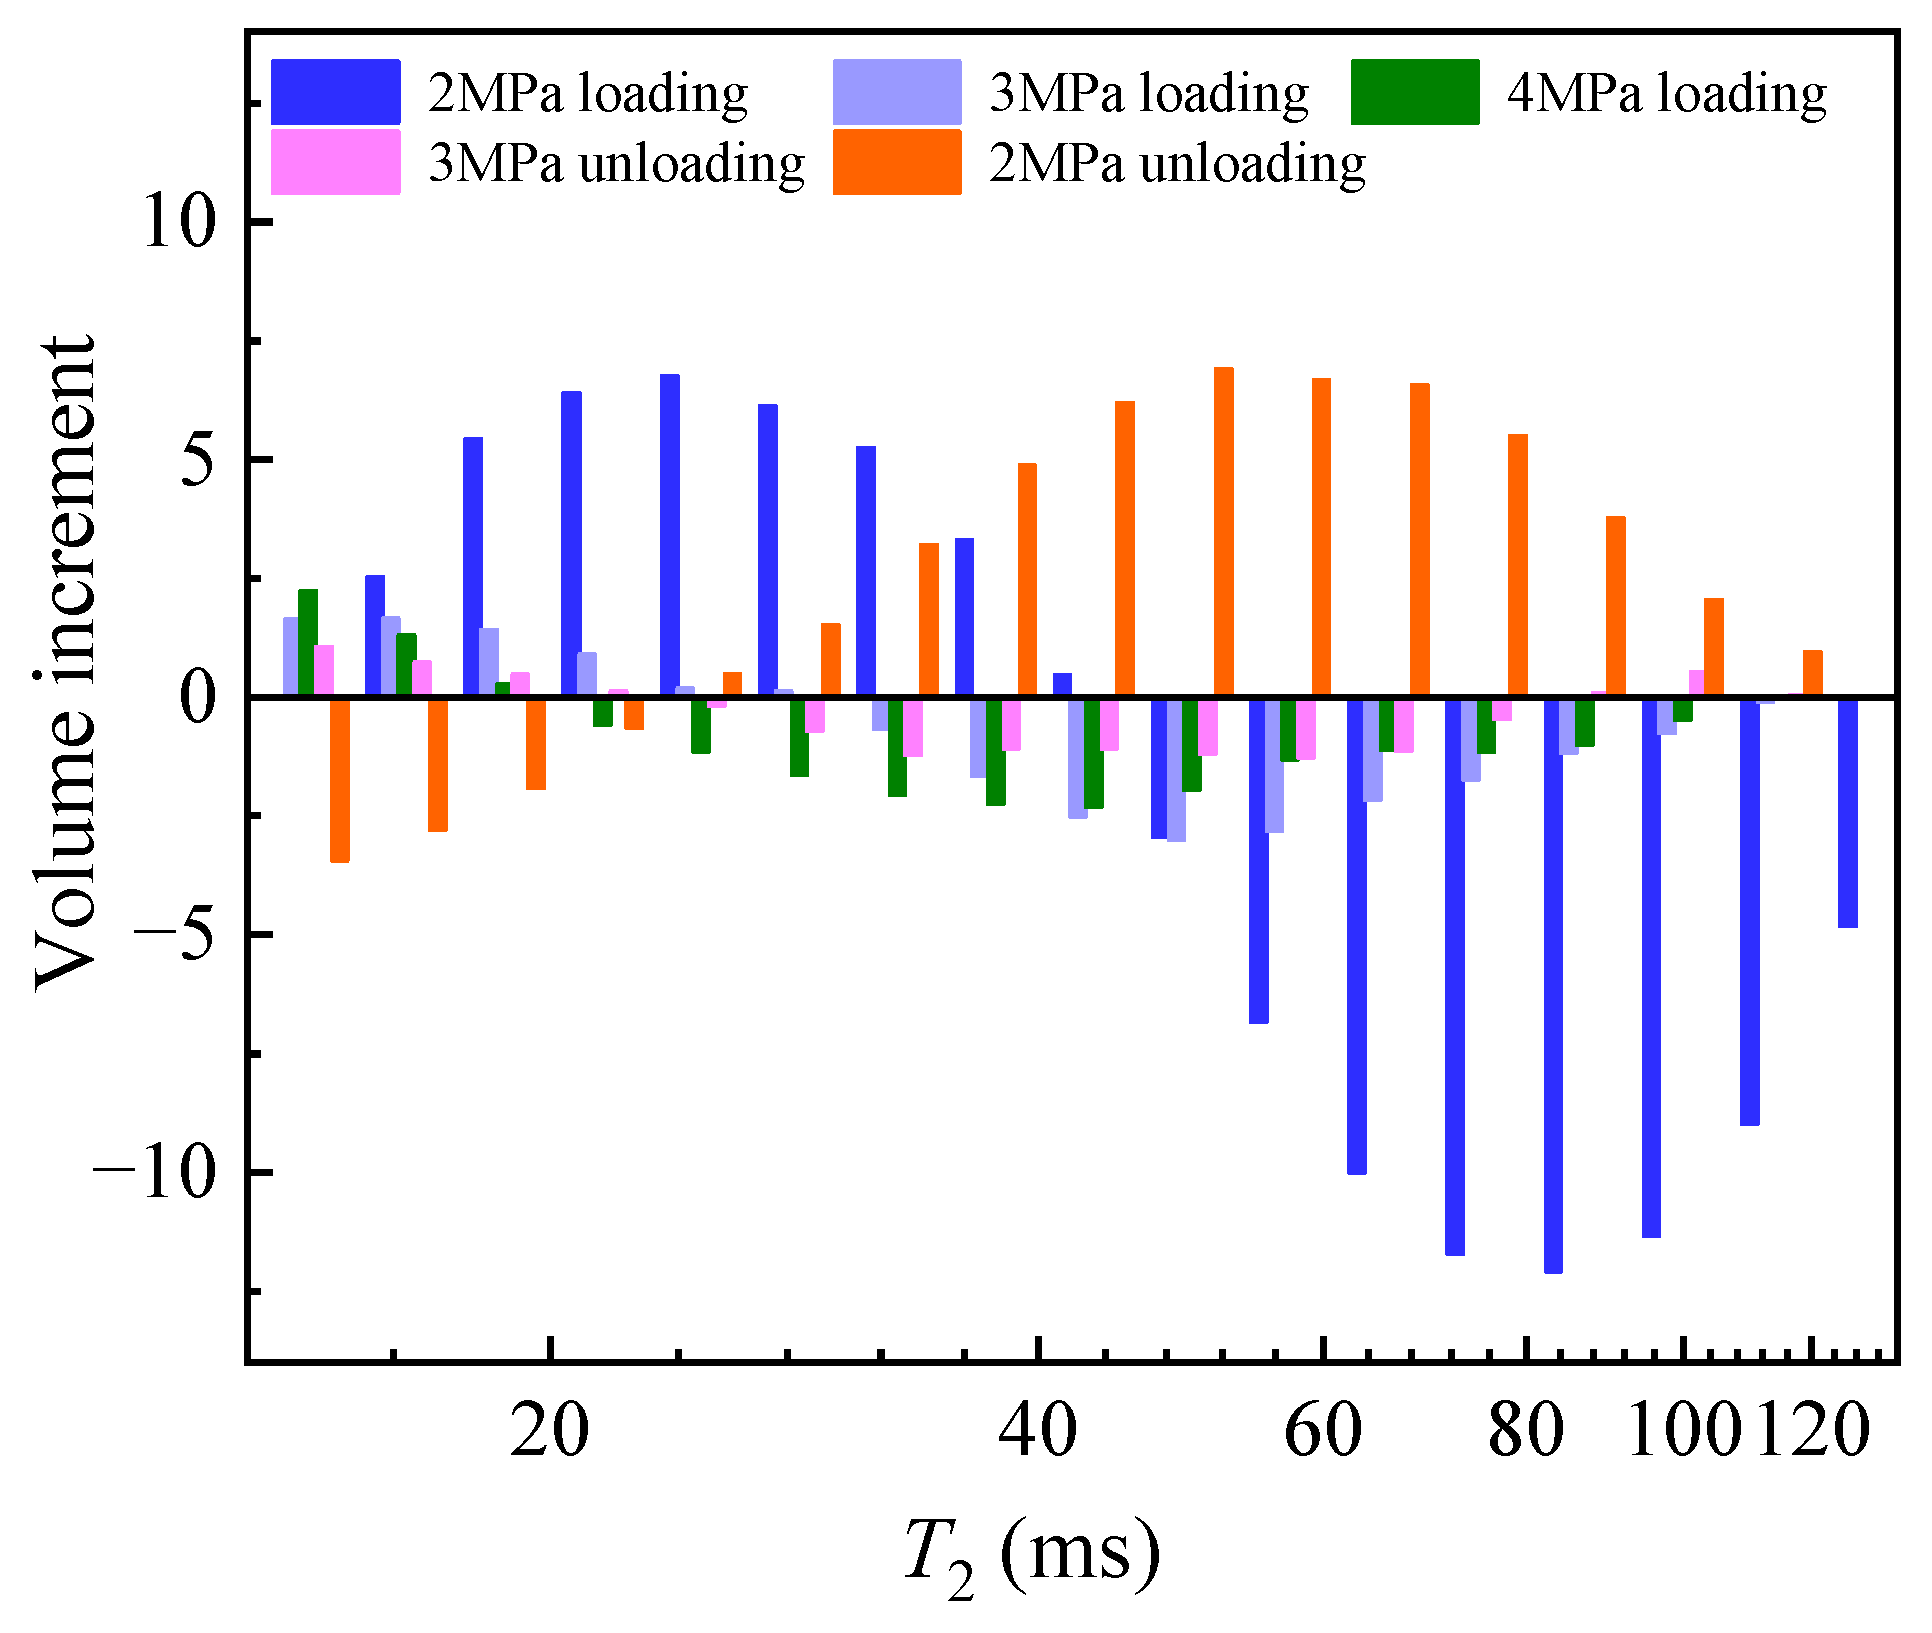
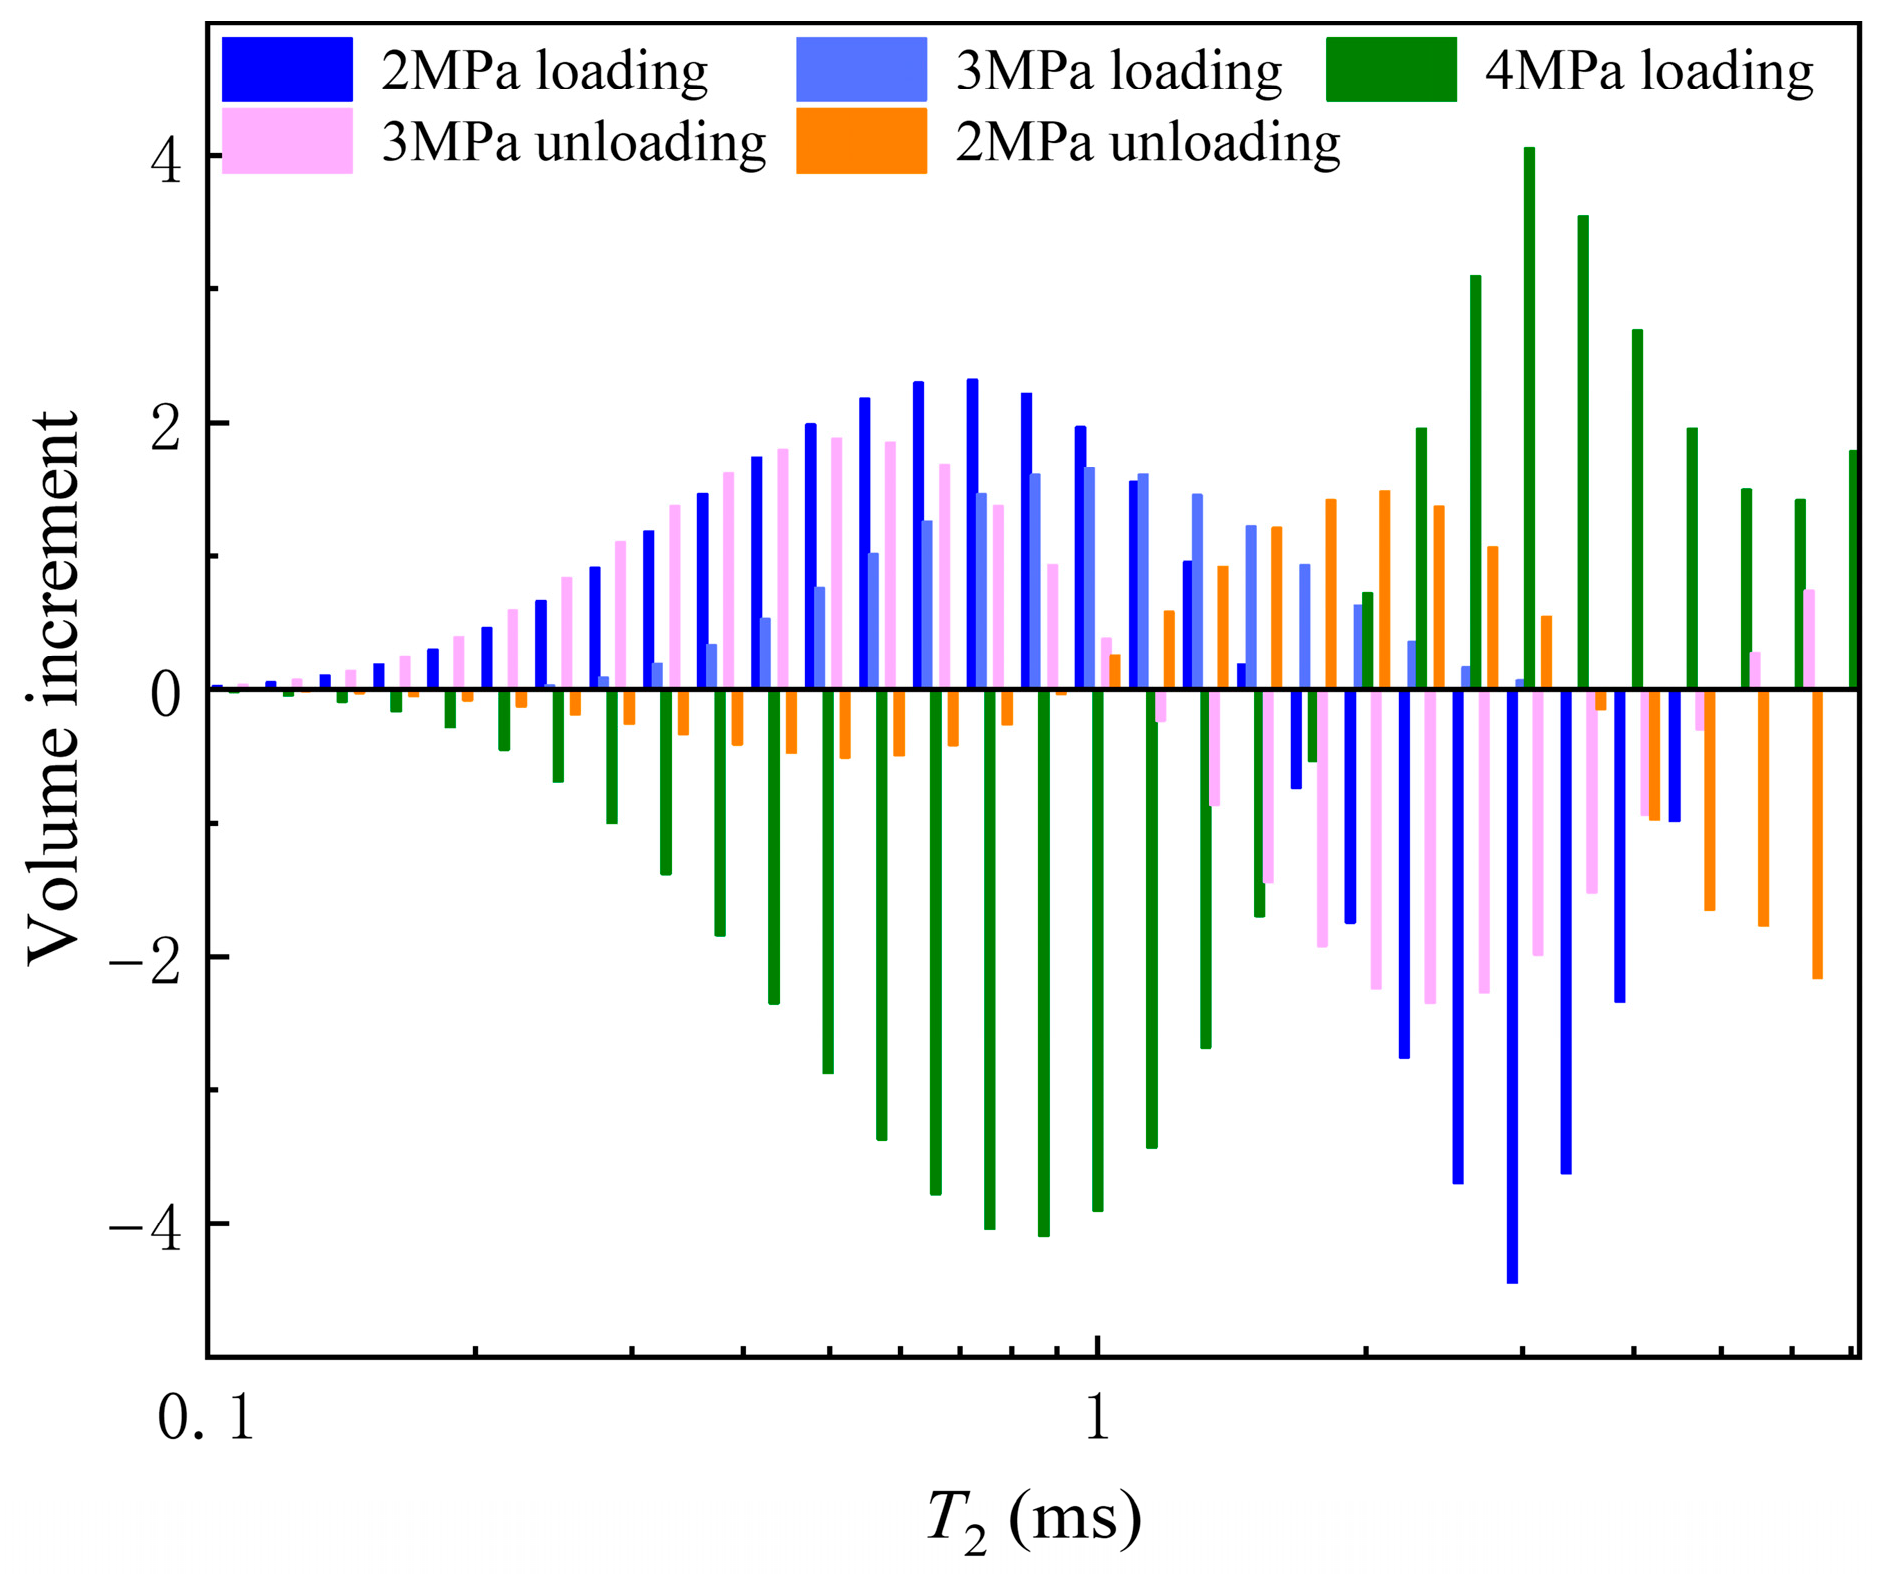
Figure 10c illustrates the changes in the volumes of secondary peaks. A significant difference was identified between the macropore volume and the secondary peak. The volume of the mesopores was much smaller than that of the macropores. As depicted in Figure 10c and Figure 12, the volume of the mesopores initially decreased and then increased during loading and unloading of confining pressure. This trend aligned with that of permeability, suggesting that mesopores are sensitive to variations in confining pressure. The seepage flow within the medium transitions from macropores to mesopores. While the permeability is primarily determined by the effective seepage channels formed by macropores, the changes in volume of the mesopores also affects the rock sample permeability. Figure 10c and Figure 13 indicated that the response of micropore volume in response to confining pressure changes showed minimal correlation with the permeability of the rock sample. This is mainly due to their small sizes and the presence of numerous isolated pores that do not function as effective seepage channels.
Overall, the permeability of reef limestone is mainly influenced by the effective seepage channels formed by macropores, and variations in macropore volume within the main peak range do not dictate permeability trends in the rock sample.

3.4. Permeability Damage Rate

Based on the “Experimental evaluation method of reservoir sensitivity flow” (SY/T 5358-2010) [38], the permeability damage rate was introduced to analyze the changes in the permeability of the rock sample during loading and unloading of confining pressure. This evaluation was conducted through calculations using Equation (6) and Table 3.
D k = K 0 K i K 0 × 100 %
where D k is the permeability damage rate of the rock sample; K i is the measured permeability (mD) of the rock sample at a given stress value; and K 0 is the initial permeability (mD) of the rock sample.
The effective stress points were calculated and analyzed. The maximum penetration damage rate of the sample did not exceed 30% in the loading and unloading, as shown in Table 4. According to the industry standard, this degree of damage can be classified as weak.

3.5. Stress Sensitivity of Permeability

The model function typically used for analyzing stress sensitivity coefficients is the exponential function [30], as shown in Equation (7):
k = k 0 exp ( α P e )
where k   is the permeability under the effective stress P e , and k 0 is the initial permeability.
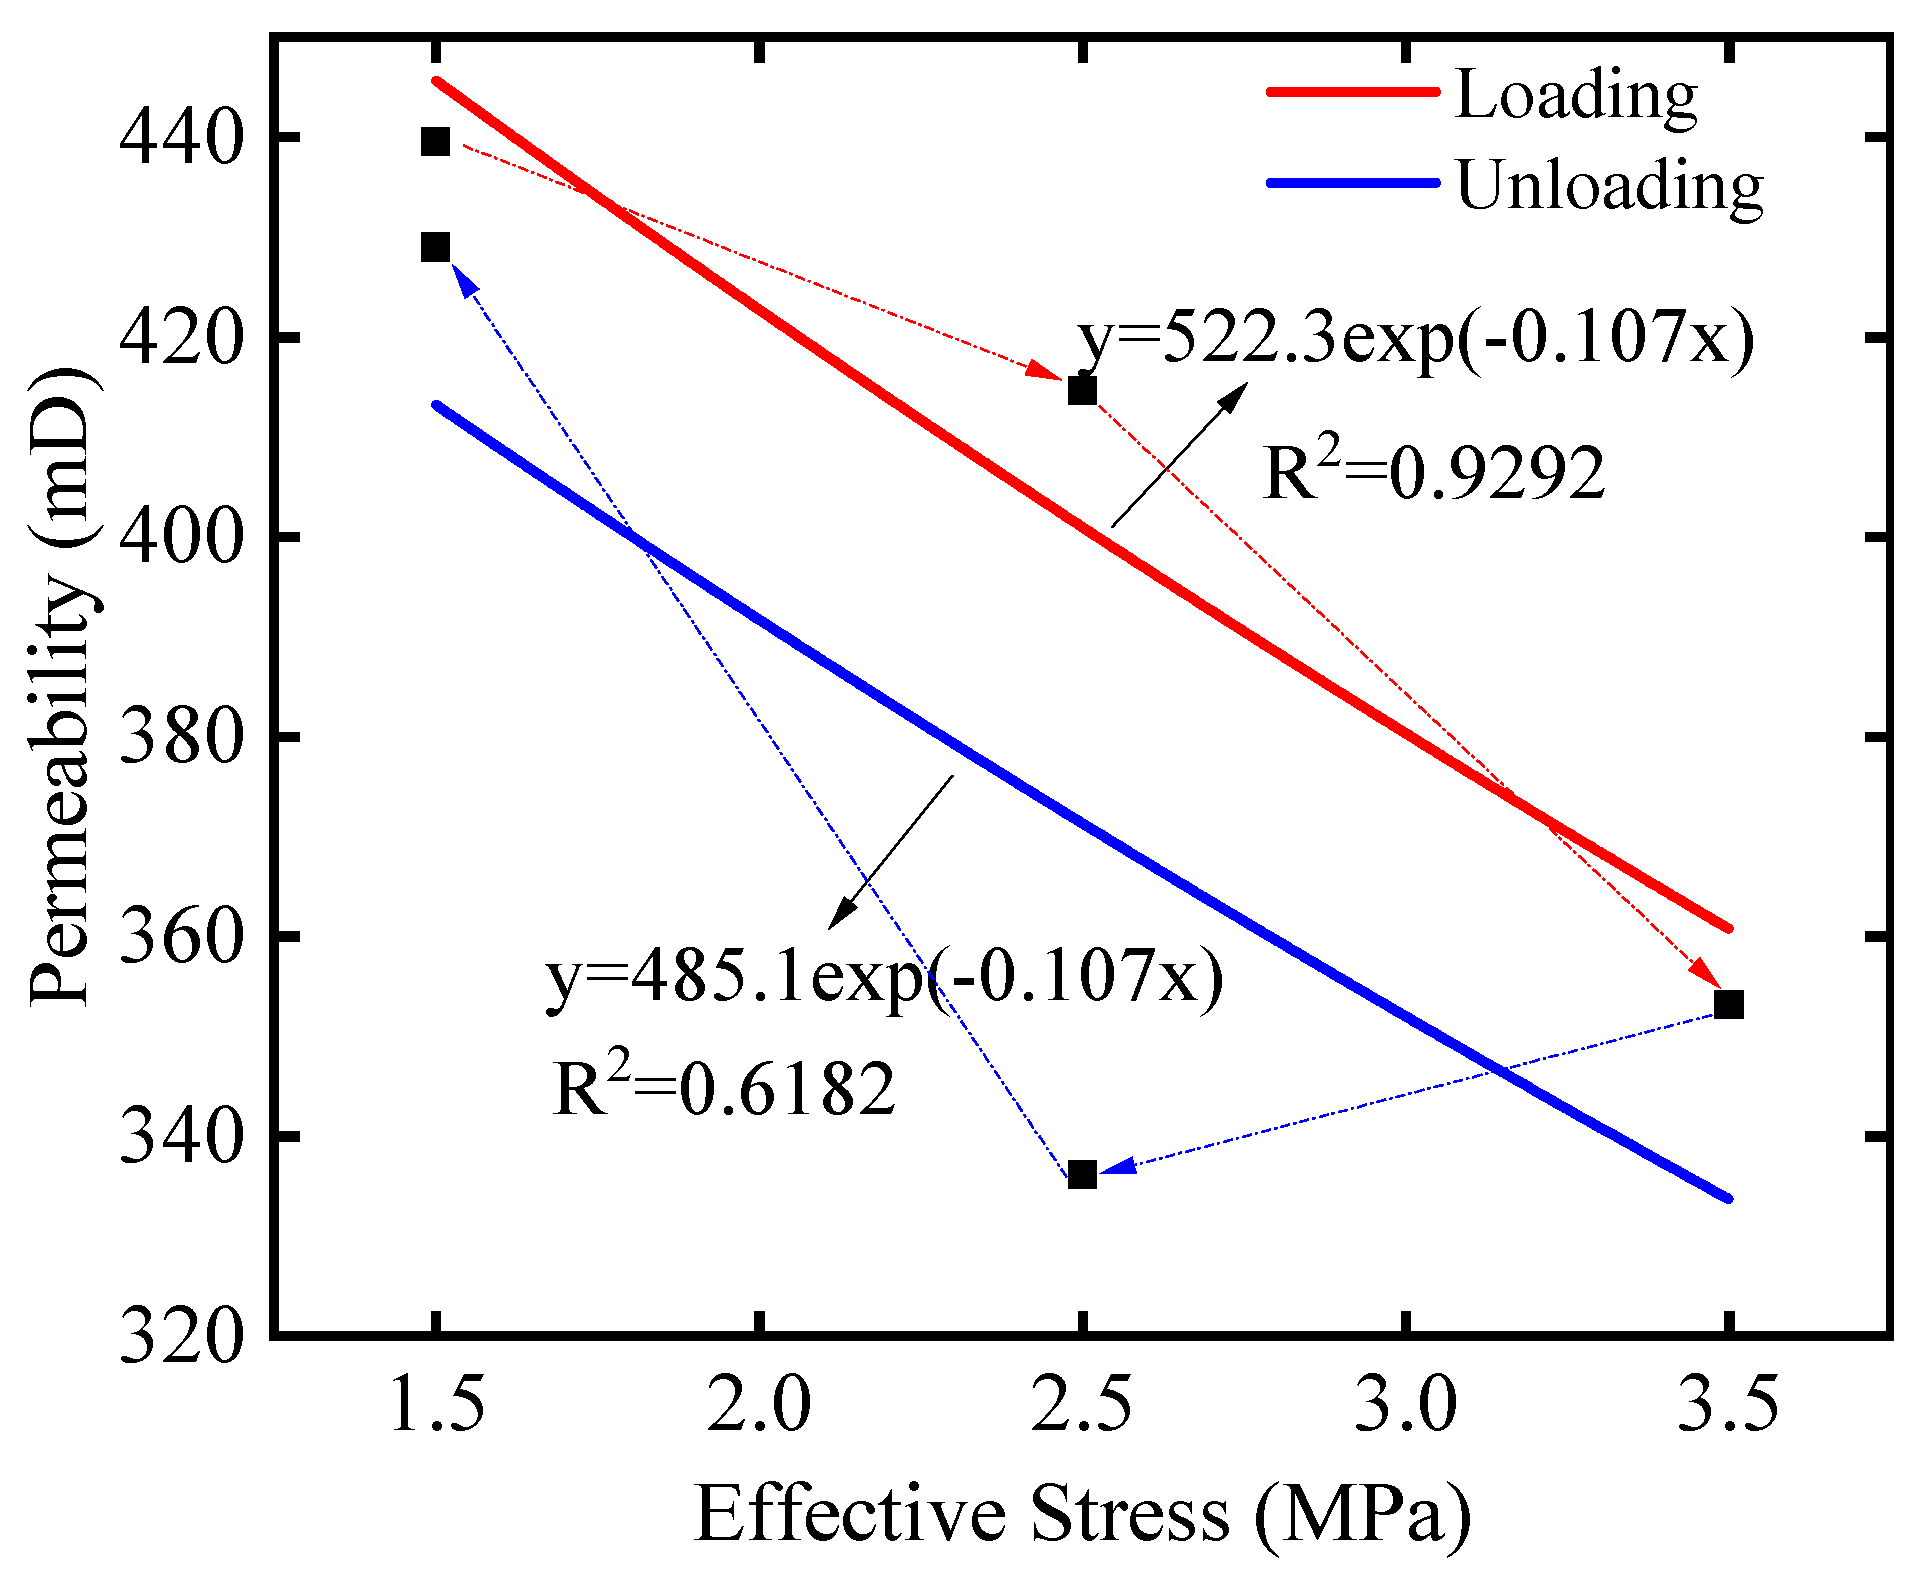
Figure 14 illustrates the calculated and fitted stress sensitivity coefficient curves for reef limestone. The stress sensitivity coefficient of permeability for reef limestone during the loading process was 0.11 MPa−1. Due to the unique characteristics of reef limestone, varying degrees of hysteresis effects occurred during the unloading process. This behavior is significantly different from that of the other rocks, resulting in different irreversible permeability damage rates.
This study focuses on the unique limestone of reef origin, known as reef limestone, which exhibits a high degree of stress sensitivity due to special geological genesis. The rock physics characteristics of this limestone are dominated by large pores. The stress sensitivity coefficient of the coral reef limestone studied in this research is significantly higher than that of other types of sandstone and limestone studied by previous researchers, as shown in Table 5. This suggests that reef limestone exhibits a moderate-to-strong level of stress sensitivity in the low pressure range of 2 MPa–4 MPa.

4. Discussion

This article is based on a study of the permeability stress sensitivity of homogeneous coral samples, where we aimed to determine the permeability stress sensitivity coefficient of coral reef limestone. The research results have important innovative and enlightening significance for revealing the engineering geological characteristics of coral reef rock masses and are applicable to evaluating the short-term response of surrounding rock permeability during excavation and support stages. Due to the high heterogeneity of geological conditions in coral reef sites, in future studies, the author will expand the sampling methods for different types of reef limestone and conduct permeability stress sensitivity studies covering a wider range of reef limestone types. Additionally, the author will consider the stress state of surrounding rock during the long-term service of the chamber and conduct research on the evolution of reef limestone permeability under creep conditions.

5. Conclusions

This study focuses on the permeability test of reef limestones under confining pressure and an unloading process. The test results show the permeability of reef limestones at different effective stress states during loading and unloading stages, quantifying the sensitivity of reef limestones’ permeability. Based on nuclear magnetic resonance testing conducted during the experiment, the micro-mechanism of permeability evolution in reef limestones is revealed. The experimental techniques and methods used in this study can serve as a reference for the permeability sensitivity testing of related rocks. The innovative findings of this study are summarized as follows:
(1)
Reef limestone samples have a significant primary pore structure, with a highly developed pore network. The T2 transverse relaxation time of the sample in a saturated state is mainly distributed between 100 ms and 10,000 ms, with large pores dominating the sample.
(2)
The permeability of the reef limestones is mainly controlled by the dominant flow channels formed by large pores, rather than the total pore volume. During the confining pressure loading process, the pore structure inside the sample undergoes reorganization, with compression of large pores and generation of smaller pores, resulting in a decrease in effective flow paths and a decrease in permeability.
(3)
During the unloading stage, there is a significant hysteresis effect in the permeability recovery. Due to irreversible damage caused by pore structure compression and collapse during the loading stage, the permeability of the sample cannot fully recover when unloaded to the initial stress state, with an irreversible permeability damage rate of 2.4%.
(4)
Based on the experimental results, the permeability stress sensitivity coefficient of reef limestones is calculated to be 1.1 × 10⁻¹ MPa−1. This is higher than that of conventional terrestrial rocks. The results of this study will enhance researchers’ and engineers’ understanding of biogenic rocks in marine environments. The conclusions of this study provide important design references for excavation and support design in reef limestone formations.

Author Contributions

Data curation, Y.M. and S.Z.; formal analysis, F.J.; funding acquisition, H.L. and Y.Z.; investigation, S.Z. and F.J.; methodology, H.L. and Y.Z.; resources, H.L.; software, S.Z. and R.Q.; supervision, P.C. and Y.Z.; validation, P.C.; writing—original draft, Y.M.; writing—review and editing, Y.M., H.L., and R.Q. All authors have read and agreed to the published version of the manuscript.

Funding

This work was supported by the National Key R&D Program of China (2021-06), the Hubei Province Science and Technology Innovation Talent Plan Project (2025DJB007), the National Natural Science Foundation of China (42107202, 42277185), and the Research Fund of State Key Laboratory of Geomechanics and Geotechnical Engineering Safety (SKLGME02202, SKLGME022032, SKLGME-JBGS2405).

Data Availability Statement

The raw data supporting the conclusions of this article will be made available by the authors on request.

Conflicts of Interest

Authors Yongtao Zhang, Peishuai Chen, and Fuquan Ji were employed by CCCC Second Harbour Engineering Company Ltd., and Shun Zhai is employed by China Railway Siyuan Survey and Design Group Co., Ltd. The remaining authors declare that the research was conducted in the absence of any commercial or financial relationships that could be construed as a potential conflict of interest.

References

  1. Wang, R.; Yu, K.; Wang, Y.; Bian, L. The diagenesis of coral reefs. Adv. Earth Sci. 2017, 32, 221–233. [Google Scholar]
  2. Meng, Q.; Wu, K.; Zhou, H.; Qin, Q.; Wang, C. Mesoscopic damage evolution of coral reef limestone based on real-time CT scanning. Eng. Geol. 2022, 307, 106781. [Google Scholar] [CrossRef]
  3. Wu, K.; Meng, Q.; Luo, L.; Qin, Q.; Wang, C.; Wang, X.; Shen, T.; Ding, H. A unique time-dependent deformation behavior of coral reef limestone. J. Rock. Mech. Geotech. Eng. 2025, 17, 1862–1875. [Google Scholar] [CrossRef]
  4. Liu, H.; Zhu, C.; Zheng, K.; Ma, C.; Yi, M. Crack Initiation and Damage Evolution of Micritized Framework Reef Limestone in the South China Sea. Rock. Mech. Rock. Eng. 2021, 54, 5591–5601. [Google Scholar] [CrossRef]
  5. Khitab, U.; Umar, M.; Jamil, M. Microfacies, Diagenesis and Hydrocarbon Potential of Eocene Carbonate Strata in Pakistan. Carbonates Evaporites 2020, 35, 70. [Google Scholar] [CrossRef]
  6. Zhu, C.; Zhou, B.; Liu, H. Micro-structures and fundamental engineering properties of beach calcarenite from south China sea. Chin. J. Rock. Mech. Eng. 2015, 34, 683–693. [Google Scholar] [CrossRef]
  7. Liu, H.; Ma, C.; Zhu, C. X-ray Micro CT Based Characterization of Pore-Throat Network for Marine Carbonates from South China Sea. Appl. Sci. 2022, 12, 2611. [Google Scholar] [CrossRef]
  8. Zheng, K.; Meng, Q.; Wang, R.; Yu, J.; Wu, W. Advances in study of engineering geological characteristics of coral reef limestone. Mar. Geol. Quat. Geol. 2020, 40, 42–49. [Google Scholar] [CrossRef]
  9. Zhang, H.; Ren, H.; Mu, C.; Wu, X.; Huang, K.; Zhang, H.; Wang, F. Experimental study on dynamic mechanical properties and damage characteristics of coral reef limestone. Constr. Build. Mater. 2023, 384, 131007. [Google Scholar] [CrossRef]
  10. Wang, X.; Wang, R.; Meng, Q. Research on characteristics of coral reef calcareous rock in nan sha islands. Chin. J. Rock. Mech. Eng. 2008, 27, 2221–2226. [Google Scholar]
  11. Amour, F.; Nick, H. Porosity and permeability variability across a chalk reservoir in the Danish North Sea: Quantitative impacts of depositional and diagenetic processes. Eng. Geol. 2021, 285, 106059. [Google Scholar] [CrossRef]
  12. Kimura, S.; Kaneko, H.; Noda, S.; Ito, T.; Minagawa, H. Shear-induced permeability reduction and shear-zone development of sand under high vertical stress. Eng. Geol. 2018, 238, 86–98. [Google Scholar] [CrossRef]
  13. Zhang, P.; Zhao, C.; Hou, J.; Li, T. Experimental study on seepage characteristics of deep sandstone under high temperature and different hydraulic pressures. Chin. J. Rock. Mech. Eng. 2020, 39, 1117–1128. [Google Scholar] [CrossRef]
  14. Huang, Z.; Jiang, Z.; Zhu, S.; Wu, X.; Yang, L. Influence of structure and water pressure on the hydraulic conductivity of the rock mass around underground excavations. Eng. Geol. 2016, 202, 74–84. [Google Scholar] [CrossRef]
  15. Liu, Z.; Yang, H.; Wang, W.; Cheng, W.; Xin, L. Experimental Study on the Pore Structure Fractals and Seepage Characteristics of a Coal Sample Around a Borehole in Coal Seam Water Infusion. Transp. Porous Media. 2018, 125, 289–309. [Google Scholar] [CrossRef]
  16. Zhou, G.; Zhang, Q.; Bai, R.; Ni, G. Characterization of Coal Micro-Pore Structure and Simulation on the Seepage Rules of Low-Pressure Water Based on CT Scanning Data. Minerals 2016, 6, 78. [Google Scholar] [CrossRef]
  17. Wang, J.; Huang, X.; Xu, J.; Zhang, Z.; Wang, S. Network analysis of pore structure of coral reef limestone and its implications for seepage flow. Eng. Geol. 2023, 318, 107103. [Google Scholar] [CrossRef]
  18. Qin, X.; Xia, Y.; Qiao, J.; Chen, J.; Zeng, J.; Cai, J. Modeling of Multiphase Flow in Low Permeability Porous Media: Effect of Wettability and Pore Structure Properties. J. Rock. Mech. Geotech. Eng. 2024, 16, 1127–1139. [Google Scholar] [CrossRef]
  19. Chu, Z.; Wu, Z.; Liu, Q.; Weng, L.; Xu, X. Preliminary investigation on the hydrophysical properties and fracture seepage characteristics of 3D-printed gypsum specimens based on nuclear magnetic resonance technology. Sci. Sin. Technol. 2023, 53, 1871–1884. [Google Scholar] [CrossRef]
  20. Fu, T.; Xu, T.; Heap, M.; Meredith, P.; Yang, T.; Mitchell, T.; Nara, Y. Analysis of capillary water imbibition in sandstone via a combination of nuclear magnetic resonance imaging and numerical DEM modeling. Eng. Geol. 2021, 285, 106070. [Google Scholar] [CrossRef]
  21. Rezaee, R.; Saeedi, A.; Clennell, B. Tight gas sands permeability estimation from mercury injection capillary pressure and nuclear magnetic resonance data. J. Petrol. Sci. Eng. 2012, 88–89, 92–99. [Google Scholar] [CrossRef]
  22. Sun, Y.; Zhai, C.; Xu, J.; Cong, Y.; Qin, L. Characterisation and evolution of the full size range of pores and fractures in rocks under freeze-thaw conditions using nuclear magnetic resonance and three-dimensional X-ray microscopy. Eng. Geol. 2020, 271, 105616. [Google Scholar] [CrossRef]
  23. Wan, H.; Huang, X.; Wang, J.; Zhang, Z. Importance of Appropriate Segmentation in Pore Structure Analysis of Coral Reef Limestone from CT Images. Mar. Georesour. Geotechnol. 2024, 42, 327–347. [Google Scholar] [CrossRef]
  24. Bai, J.; Huang, X.; Lei, Q. Characterizing the Permeability Anisotropy of Coral Reef Limestone Based on CT Scanning and CFD Modeling. Rock Mech. Rock Eng. 2025, 58, 11715–11737. [Google Scholar] [CrossRef]
  25. Wang, J.; Huang, X.; Xu, J.; Wang, S.; Jin, G.; Zhang, Z. Identifying the Pore Structure and Permeability Anisotropy of Coral Reef Limestone Based on CT Image Analysis. Mar. Georesour. Geotechnol. 2023, 42, 993–1010. [Google Scholar] [CrossRef]
  26. Wu, Z.; Lu, H.; Weng, L.; Liu, Q.; Shen, J. Investigations on the seepage characteristics of fractured sandstone based on NMR real-time imaging. Chin. J. Rock. Mech. Eng. 2021, 40, 263–275. [Google Scholar] [CrossRef]
  27. Li, K.; Yang, B.; Qin, Q. Experimental study on unloading damage and permeability of dolomite based on nuclear magnetic resonance technique. China J. Rock. Mech. Geotech. Eng. 2019, 38, 3493–3502. [Google Scholar] [CrossRef]
  28. Wang, Y.; Wang, H.; Sun, D.; Lin, C.; Yu, X.; Hou, F.; Bai, Z. Permeability Evolution of Deep-Buried Coal Based on NMR Analysis: CO2 Adsorption and Water Content Effects. Energy 2024, 289, 129877. [Google Scholar] [CrossRef]
  29. Sun, J.; Yang, Z.; Wei, G.; Zhou, X. Characterization of stress-dependent permeability of volcanic gas reservoir of different types of pore structure. Rock. Soil. Mech. 2012, 33, 3577–3584. [Google Scholar] [CrossRef]
  30. Hu, Z.; Klaver, J.; Schmatz, J.; Dewanckele, J.; Littke, R.; Krooss, B.; Amann, H. Stress sensitivity of porosity and per-meability of Cobourg limestone. Eng. Geol. 2020, 273, 105632. [Google Scholar] [CrossRef]
  31. Zhang, R.; Ning, Z.; Yang, F.; Zhao, H.; Du, L.; Zhou, X. Experimental study of stress sensitivity of shale reservoirs. Chin. J. Rock. Mech. Eng. 2015, 34, 2617–2622. [Google Scholar] [CrossRef]
  32. Catinat, M.; Fleury, M.; Brigaud, B.; Antics, M.; Ungemach, P. Estimating Permeability in a Limestone Geothermal Reservoir from NMR Laboratory Experiments. Geothermics 2023, 111, 102707. [Google Scholar] [CrossRef]
  33. Ge, X.; Fan, Y.; Liu, J.; Zhang, L.; Han, Y.; Xing, D. An Improved Method for Permeability Estimation of the Bioclastic Limestone Reservoir Based on NMR Data. J. Magn. Reson. 2017, 283, 96–109. [Google Scholar] [CrossRef]
  34. Arnold, J. Mobile NMR for Rock Porosity and Permeability. Ph.D. Thesis, Rheinisch-Westfälische Technische Hochschule Aachen, Aachen, Germany, 2007. [Google Scholar]
  35. GB/T 42035-2022; Determination of Pore Size Distribution of Coal and Rock, Nuclear Instruments Magnetic Resonance Method. National Standard of the People’s Republic of China: Beijing, China, 2022.
  36. Morrow, C.A.; Zhang, B.C.; Byerlee, J.D. Effective Pressure Law for Permeability of Westerly Granite under Cyclic Loading. J. Geophys. Res. Solid. Earth. 1986, 91, 3870–3876. [Google Scholar] [CrossRef]
  37. Wang, H.L.; Xu, W.Y.; Cai, M.; Xiang, Z.P.; Kong, Q. Gas Permeability and Porosity Evolution of a Porous Sandstone Under Repeated Loading and Unloading Conditions. Rock. Mech. Rock. Eng. 2017, 50, 2071–2083. [Google Scholar] [CrossRef]
  38. SY/T 5358-2010; Experimental Evaluation Method of Reservoir Sensitivity Flow. Oil and Gas Industry Standard of the People’s Republic of China: Beijing, China, 2010.
  39. David, C.; Wong, T.F.; Zhu, W.; Zhang, J. Laboratory measurement of compaction-induced permeability change in porous rocks: Implications for the generation and maintenance of pore pressure excess in the crust. Pure Appl. Geophysics. 1994, 143, 425–456. [Google Scholar] [CrossRef]
  40. Wang, Y.; Meng, F.; Wang, X. Effective Stress Law for the Permeability and Deformation of Four Porous Limestones. J. Geophys. Res. Solid. Earth. 2018, 123, 4707–4729. [Google Scholar] [CrossRef]
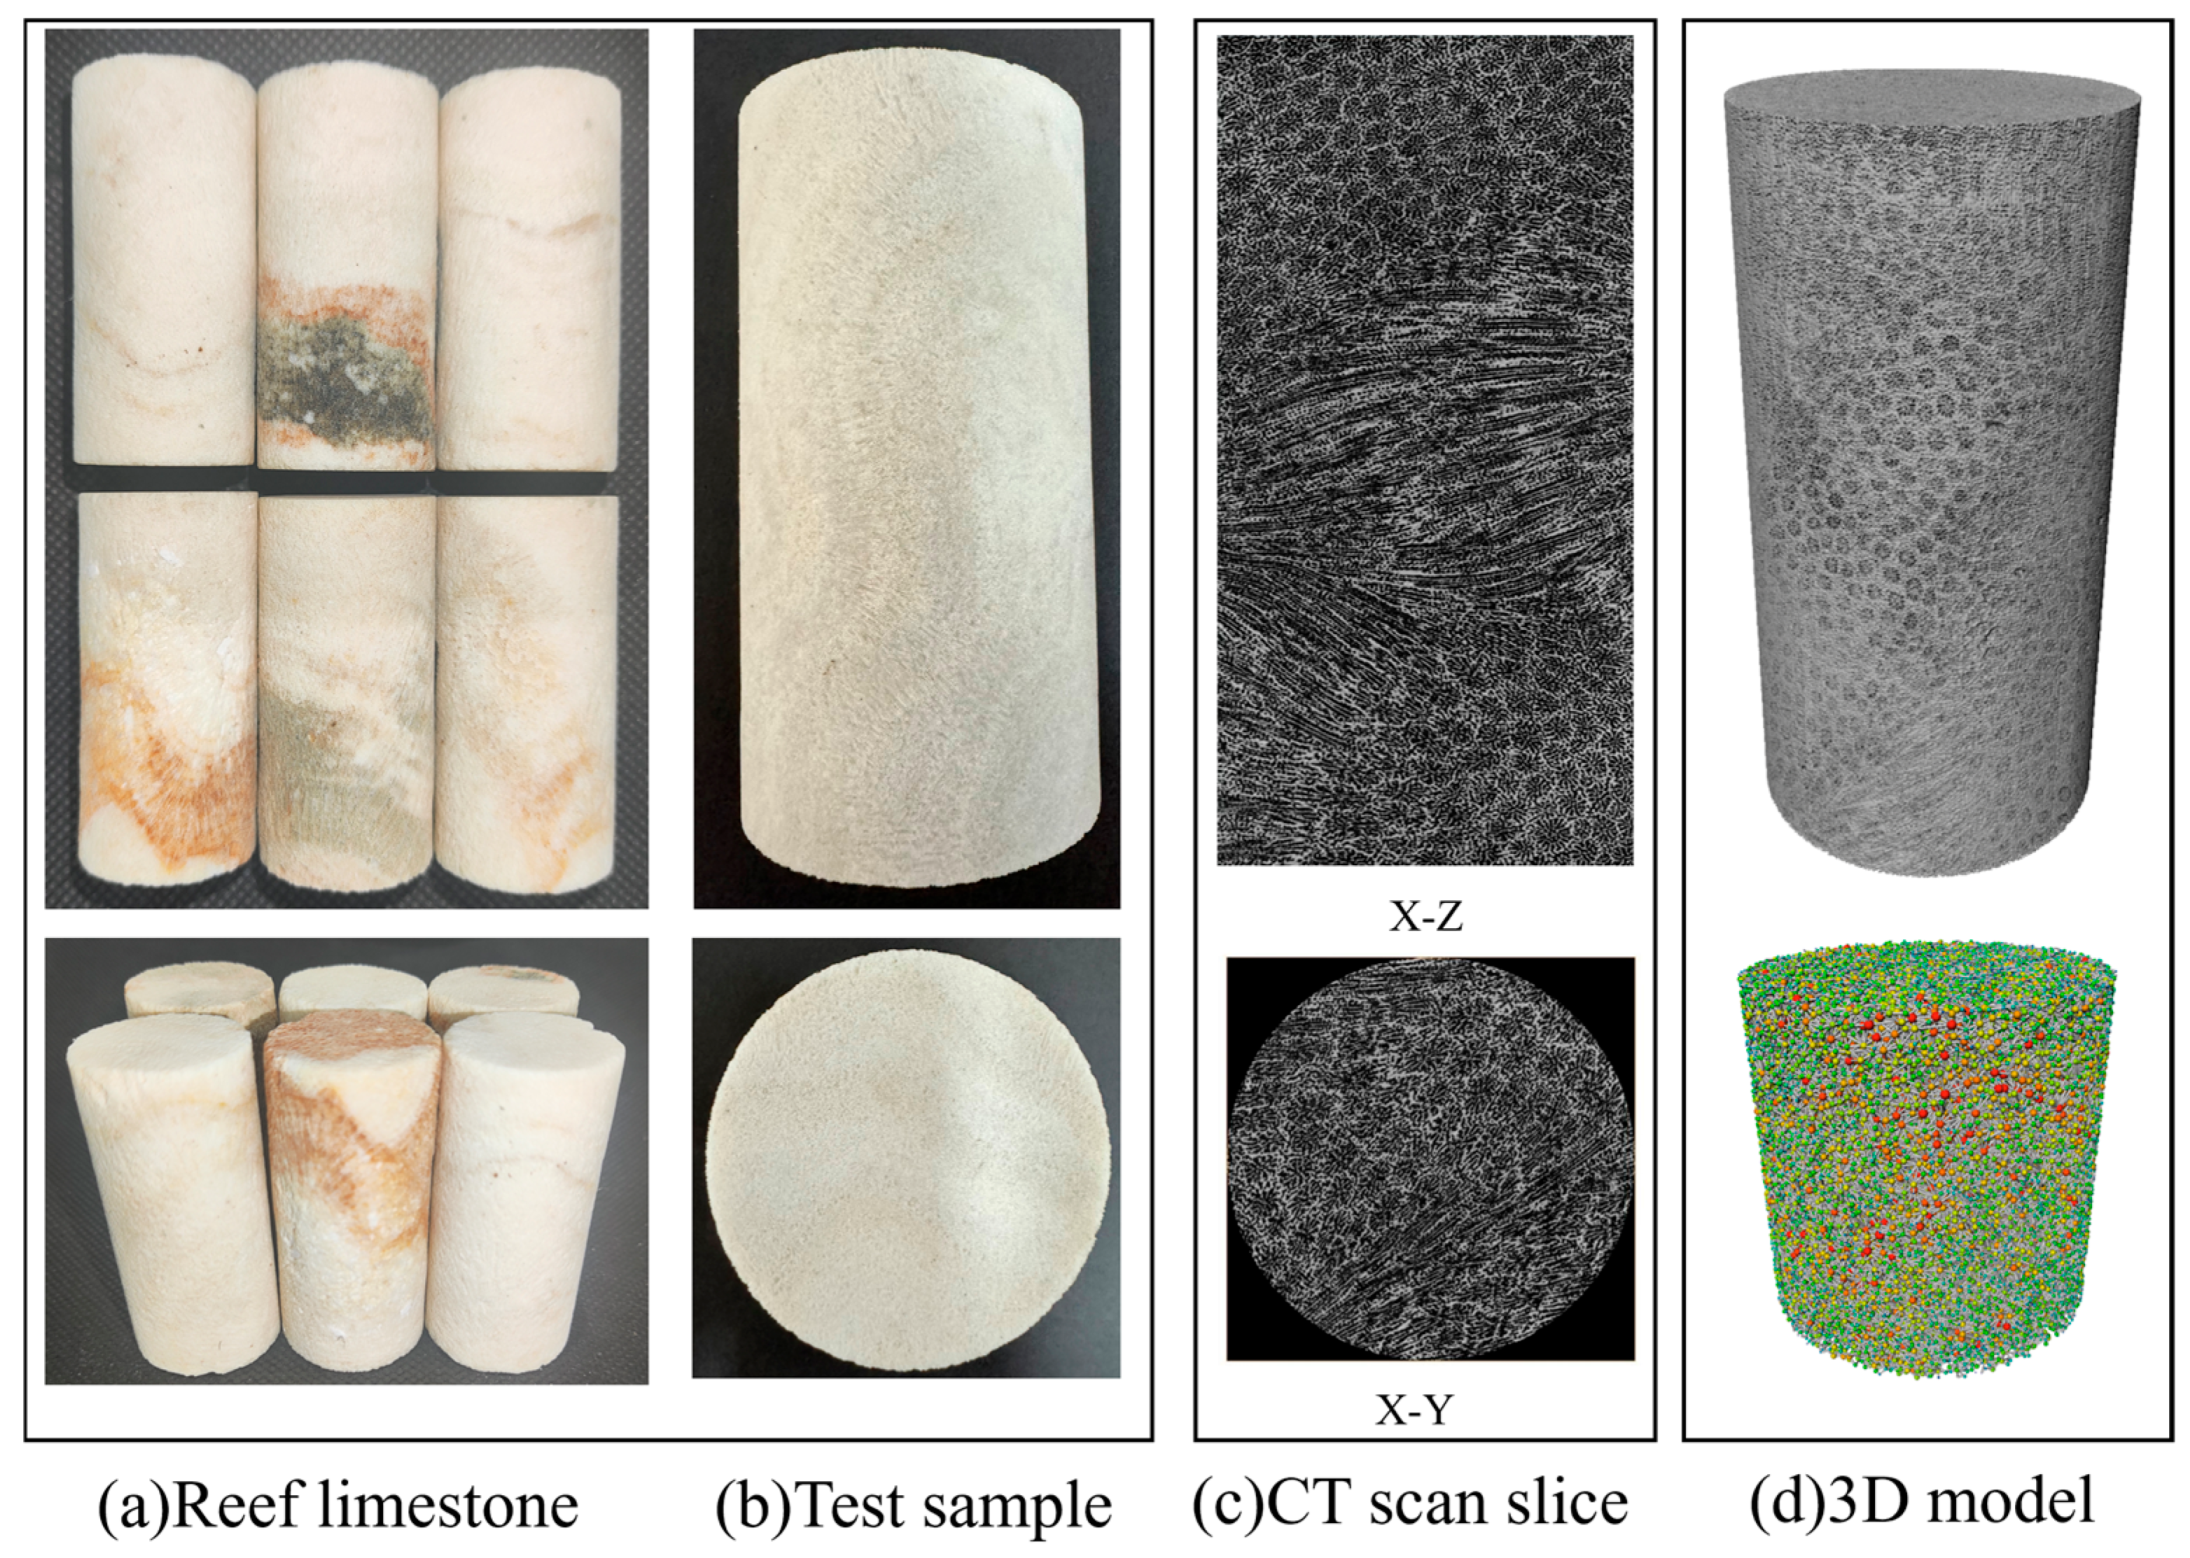
Figure 1. Reef limestone sample. (a) Reef limestone. (b) Test sample. (c) Longitudinal section of CT scan. (d) Ball-and-stick models.
Jmse 13 02218 g001
Figure 2. SEM images of reef limestone.
Jmse 13 02218 g002
Figure 3. XRD diffraction spectrum and mineral composition pie chart of reef limestone.
Jmse 13 02218 g003
Figure 4. Schematic diagram of the NMR system.
Jmse 13 02218 g004
Figure 5. Low-field NMR online seepage system. (a) Reef limestone. (b) Core gripper: the rock specimen is encased using heat-shrink tubing and a pressure head. (c) NMR scanner: the NMR scanner is used to monitor the status of the rock sample in the pressure cylinder in real time. (d) Constant-pressure pump. (e) Data acquisition and analysis system.
Jmse 13 02218 g005
Figure 6. Permeability change during confining pressure loading and unloading.
Jmse 13 02218 g006
Figure 7. Initial unpressurized T2 spectrum of reef limestone sample.
Jmse 13 02218 g007
Figure 8. T2 spectrum during the loading process.
Jmse 13 02218 g008
Figure 9. T2 spectrum during the unloading process.
Jmse 13 02218 g009
Figure 10. Evolution of T2 spectrum area during confining pressure loading–unloading cycles. (a) Variation in total peak area in T2 spectrum curve. (b) Variation in main peak area in T2 spectrum curve. (c) Peak area of mesopores and micropores in T2 spectrum curve.
Jmse 13 02218 g010
Figure 11. Increment in macropore volume.
Jmse 13 02218 g011
Figure 12. Increment in mesopore volume.
Jmse 13 02218 g012
Figure 13. Increment in micropore volume.
Jmse 13 02218 g013
Figure 14. Fitting curve of stress sensitivity coefficient of permeability.
Jmse 13 02218 g014
Table 1. Basic physical properties of reef limestone.
ρd (g/cm3)ρsat (g/cm3)ws (%)vsat (m/s)
0.871.4667.02500.0
Note: ρd is the dry density; ρsat is the saturated density; ws is the saturated water absorption; vsat is the saturated longitudinal wave velocity.
Table 2. Permeability test results for sample.
Osmotic
Pressure/kPa
Confining Pressure (MPa)Stress PathPermeability (mD)
5002Loading439.6
3Loading414.6
4Loading353.2
3Unloading336.2
2Unloading429.0
Table 3. Evaluation index of the damage degree for stress sensitivity of permeability.
Penetration Damage Rate (%)Damage Degree
D ≤ 5None
5 < D ≤ 30Weak
30 < D ≤ 50Moderately weak
50 < D ≤ 70Moderately strong
D > 70Strong
Table 4. Penetration damage rates under different stresses.
Stress PathEffective Stress (MPa)Penetration Damage Rate (%)Damage Degree
Loading2.55.7Weak
3.519.6Weak
Unloading2.523.5Weak
1.52.4Weak
Table 5. Stress sensitivity coefficients of different rock types.
SourceRock TypeConfining Pressure (MPa) Stress Sensitivity Coefficient/(MPa−1)
This study Reef limestone2–41.1 × 10⁻¹
David
1994 [39]
Adamswiller 80.5–1511.2 × 10−2
Fontainebleau80.5–1511 × 10−2
Berea 80.5–1511 × 10−2
Rothbach80.5–1511.8 × 10−2
Boise80.5–1510.7 × 10−2
Wang
2018 [40]
Purbeck limestone6–183.6 × 10⁻³
Indiana limestone3–153.2 × 10⁻³
Thala limestone7–151.2 × 10⁻³
Leitha limestone7–151.1 × 10⁻³
Hu 2020 [30]Cobourg limestone5–204.5 × 10⁻²–7.1 × 10⁻²
Disclaimer/Publisher’s Note: The statements, opinions and data contained in all publications are solely those of the individual author(s) and contributor(s) and not of MDPI and/or the editor(s). MDPI and/or the editor(s) disclaim responsibility for any injury to people or property resulting from any ideas, methods, instructions or products referred to in the content.