Article

Coupled Vibration Response Analysis of Tension Leg Platform Tendon Under Irregular Ocean Wave Action

1
Zhejiang Communications Construction Group Co., Ltd., Hangzhou 310051, China
2
School of Civil Engineering and Architecture, Zhejiang Industry Polytechnic College, Shaoxing 312000, China
3
College of Civil Engineering and Architecture, Wenzhou University, Wenzhou 325035, China
4
Key Laboratory of Engineering and Technology for Tideland Reclamation and Life-Cycle Intelligent Monitoring of Zhejiang Province, Wenzhou 325000, China
*
Author to whom correspondence should be addressed.
J. Mar. Sci. Eng. 2025, 13(10), 1836; https://doi.org/10.3390/jmse13101836
Submission received: 3 September 2025 / Revised: 21 September 2025 / Accepted: 22 September 2025 / Published: 23 September 2025
(This article belongs to the Special Issue Advanced Studies in Marine Structures)

Abstract

To analyze the dynamic response of tension leg platform (TLP) tendons under irregular ocean wave action, the governing equations of coupled vibration between the platform and tendon under irregular wave action are established based on Hamilton’s principle and the Kirchhoff hypothesis. Using the spectrum representation–random function method, the power spectral density function of the irregular wave load is derived, and the lateral wave forces at different tendon locations are calculated. The coupled lateral and axial responses of the tendon system are obtained through the fourth-order Runge–Kutta method. Considering the parametric vibrations of both the platform and tendon, the extreme lateral deflection of the tendon is employed as the control index to derive the probability density curves of the tendon deflection under irregular wave load. The results show that the amplitude of the wave load increases gradually along the height of the tendon, with a faster growth rate at locations closer to the water surface. The tendon’s lateral deflection response changes more drastically due to coupled parametric vibration of the platform. Based on 628 complete samples of irregular wave loads, the probability density curve and cumulative distribution curve of the extreme lateral deflection of the tendon under irregular wave loads are obtained. Under typical sea state conditions generated from the P-M wave spectrum, the reliability of the tendon under irregular wave load increases with the initial tension force.

1. Introduction

With the rapid development of the global economy and the increasing demand for resources, greater attention has been given to the development and utilization of marine resources, further driving innovation and practice in marine engineering technology. As a typical mooring system for offshore floating platforms, the tension leg mooring system has been widely applied in various scenarios such as deep-sea oil and gas extraction [1,2], offshore floating wind turbines [3,4,5], and submerged floating tunnel anchorage support [6,7], owing to its excellent motion stability and adaptability. The characteristic of this system relies on vertically arranged tendons, which anchor the floating structure to the seabed foundation through pretension, ensuring the stability of the floating structure in harsh marine environments. Therefore, the characteristics of the hydrodynamic coupled vibrations of the tendon in the marine environment have attracted widespread discussion, and the construction of structural models from different aspects, such as structural stress and deformation [8], material fatigue failure [9], and coupled vibration behavior [10], has laid the foundation for its design.
The randomness and nonlinearity of ocean wave loads are among the key factors contributing to the complex variations in the dynamic response of tension leg platform tendons. Considering that waves typically move in a circular motion, transferring energy across the ocean, the ocean wave spectrum can be utilized to further analyze and understand the energy distribution and characteristics of these waves. The Pierson–Moskowitz (P-M) spectrum and the JONSWAP spectrum are the most widely used models for describing open ocean conditions [11,12]. Through the analysis of ocean wave spectra, different wave conditions can be reconstructed, enabling quantitative assessment of structural loads and dynamic responses on offshore structures. Taghipour et al. [13] and Aggarwal. et al. [14] obtained time histories of artificially simulated irregular waves through inverse Fourier transforms and analyzed the dynamic behavior of offshore structures. For minimizing computation and storage, Winterstein et al. [15] proposed a method for simulating random wave spectra through the application of the Hartley transform. Afterwards, Chen et al. [16] and Liu et al. [17] developed an updated spectral presentation scheme through constructing so-called random harmonic functions. These random harmonic functions are capable of deriving a consistent spectrum that corresponds to the target spectral function. The efficiency of simulating wave spectra holds crucial importance in the analysis of dynamic behaviors of marine structures, particularly in the context of coupled vibrations.
As a critical support component in the tension leg platform, the tendons’ dynamic behavior in the marine environment determines the stability of the entire system. Jameel et al. [18] regarded the tendons of the tension leg platform as nonlinear springs and analyzed the drag force, variable added mass, large displacement effects, and tendon tension variations under eight sea states based on numerical simulations. Abaiee et al. [19] designed a 1:100 scaled tension leg test model to validate that the first-order diffraction method and quasi-static tendon modeling are sufficient in general for the hydrodynamic analysis of tendons. However, due to the complex boundary conditions of the tension leg platform, such as the nonlinear stiffness of the seabed foundation and the dynamic behavior of the platform at the top connection, stress concentration on the tendon components may be amplified, potentially leading to failure effects. Choi et al. [20] conducted experimental and numerical analyses on the coupled behavior of the tension leg platform and the tender semi-submersible platform. The results indicated that the system exhibited complex coupling behavior with multiple natural mode frequency components. Soeb et al. [21] conducted numerical simulations on the dynamic responses of an offshore Spar platform under combined wave and current conditions, which revealed consistent patterns in both platform motions and mooring line tension variations. Based on that, some studies focusing on the tension leg platform have also been conducted on the impact of material fatigue failure [22,23] and the coupled vibration characteristics of platforms or wind turbines [24,25]. And the discussion is unending due to the need for new concepts, improvements, and better understanding of the TLP behavior.
The aim of this study is to analyze the coupled vibration characteristics of TLP tendons under irregular wave loads. Based on Hamilton’s principle and the Kirchhoff hypothesis, the vibration control equations of the vertical tension leg are derived, and the tension leg platform is simplified as a concentrated mass to account for the effects of parametric coupled vibrations. By introducing the concept of random functions, the irregular wave process is simulated using the spectrum representation–random function method. The power spectral density function of the random wave loading is derived, and, in conjunction with the probabilistic density evolution theory, a refined analysis of the structural dynamic response under continuous wave action is conducted, with the purpose of providing a feasible methodological framework for TLP structure design.

2. Structural Idealization of Tension Leg Platform Tendon Model

2.1. Governing Equations

At present, mooring-tendon-constrained floating structures are widely used in coastal engineering, such as floating flexible anti-collision structures and tension leg platforms for offshore wind turbines. One end of the tendon is connected to the seabed foundation, while the other end is attached to the floating platform. Figure 1 shows a schematic diagram and a simplified model of a tension leg platform tendon. Considering the coupling effect of the tendon’s axial and lateral motions, the tendon is regarded as a nonlinear beam model with a fixed hinge support at the lower end and a free hinge support at the upper end. Taking the seabed anchoring point as the coordinate origin, a coordinate system o-xyz is established for the vertically tensioned tendon, where L represents the tendon length. Using Hamilton’s principle and the Kirchhoff hypothesis [6,26], the vibration control equations of the vertically tensioned tendon can be expressed as
m v ¨ E A ( v + 1 2 u 2 ) = f z ( z , t )
m u ¨ + c u ˙ E A ( v + 1 2 u 2 ) u + ( E A u ) = f x ( z , t )
where E, A, and I represent the elastic modulus, cross-sectional area, and moment of inertia of the tendon, respectively. m denotes the mass per unit length of the tendon. u and v represent the displacements in the x-direction and z-direction, respectively. The dot “·” denotes differentiation with respect to time, and the prime “′“ denotes differentiation with respect to space.
In Equations (1) and (2), fz(z, t) and fx(z, t) are the distributions of axial and lateral unit length, respectively. fz(z, t) is the difference between the buoyancy and gravity acting on the mooring line per unit length and can be expressed as
f z ( z , t ) = ρ w A f g ρ A g
In this context, ρw and ρ represent the densities of seawater and the tendon, respectively, Af denotes the net cross-sectional area of the tendon that displaces seawater per unit length, and g is the gravitational acceleration. As for small-scale structures, the influence of tendon vibrations on the ocean wave field is neglected, and the Morison equation is used for calculations [27]. Therefore, the expression for the ocean wave force acting on a vertically tensioned tendon is
f x ( z , t ) = 1 2 C D ρ w D x ˙ ( z , t ) x ˙ ( z , t ) + π D 2 4 C I ρ w x ¨ ( z , t )
in which CI and CD are the additional mass coefficient and the drag coefficient, respectively. x represents the displacement of water particles in the wave field; D represents the diameter of the tendon.

2.2. Irregular Ocean Wave Action Calculation

The long-term state of ocean waves can be regarded as a sequence of many short-term sea states. In each short-term sea state, the wave is a stationary normal random process with a mean of zero, and this random process possesses ergodicity [28]. Based on that, the irregular ocean wave force spectrum can be obtained from the ocean wave spectrum by the transfer function H(z, ω). So the spectrum expressions for the velocity and acceleration of water particles in Equation (5) are as follows:
S x ˙ ( z , ω ) = H 2 ( z , ω ) S η ( ω ) S x ¨ ( z , ω ) = ω 2 H 2 ( z , ω ) S η ( ω )
where Sη(ω) represents the power spectral density of the wave random process η(t), and ω is the wave frequency. According to Borgman’s linearization process [29], the equivalent linear expression for ocean wave force can be written as
f x ( z ,   t ) = 1 2 C D ρ w D 8 π σ x ˙ ( z ) x ˙ ( z ,   t ) + π D 2 4 C I ρ w x ¨ ( z ,   t )
where σ x ˙ ( z ) is the mean square deviation of the lateral velocity process x ˙ ( z , t ) of water particles at the z position, and the relationship is as follows:
σ x ˙ 2 ( z ) = 0 S x ˙ ( z , ω ) d ω = 0 H 2 ( z , ω ) S η ( ω ) d ω
By combining Equations (5) and (6), the irregular ocean wave force spectrum is obtained as follows:
S f ( z , ω ) = 2 π C D 2 ρ w 2 D 2 σ x 2 ( z ) + π 2 D 4 16 C I 2 ω 2 ρ w 2 H 2 ( z , ω ) S η ( z , ω )
where Sf(z, ω) represents the power spectral density function of the irregular wave force at any position coordinate z. It can be seen that the irregular ocean wave force is also a stationary random process with zero mean. Based on the linear wave theory, the transfer function H(z, ω) has the following form:
H ( z , ω ) = ω cos h ( k w z ) sin h ( k w h )
in which kw is the wave number and has the following relationship with the wave frequency ω: ω2 = gkwtanh(kwh). h is the ocean water depth.
In recent years, to address the issues of efficiency and practicality in the application of stochastic engineering excitation, the methods of constructing random harmonic function [16] or introducing low-dimensional orthogonal random functions [17] have been developed, which are named the spectrum representation–random function. For a zero-mean real stationary wave random process, the source spectrum expression of the wave load at any given position z can be written as
f x ( z , t ) = n = 1 N S f ( z , ω n ) Δ ω X n cos ( ω n t ) + Y n sin ( ω n t )
ω n = ( n 0.5 ) Δ ω , Δ ω = ω u / N
where ωn represents the frequency of the n-th discrete point; Δω denotes the frequency step which should be small enough to guarantee the accuracy requirements; N is the number of frequency truncation terms; ωu is the truncation frequency. {Xn, Yn} is a set of standard orthogonal random variables, which needs to satisfy the following basic conditions:
E [ X n ] = E [ Y n ] = 0 , E [ X j Y k ] = 0 , E [ X j X k ] = E [ X k X j ] = δ j k
where E[.] is the mathematical expectation, and δjk is the Kronecker Delta.
Based on the idea that random functions could serve as rigorous constraints [30], the standard orthogonal random variables can be defined as follows:
X n = 2 cos ( n ¯ Θ + α ) Y n = 2 sin ( n ¯ Θ + α ) n ¯ , n = 1 , 2 , , N
where Θ is an elementary random variable following a uniform distribution in the range [−π, π); α is a constant in the range [0, 2π), which is set as π/4; and n ¯ ( n   ¯ = 1, 2, …, N) is deterministic one-to-one mapping of n (n = 1, 2, …, N), i.e., n ¯ n . The mapping operation can be conveniently carried out by the MATLAB toolbox version 9.4 (R2022b) functions rand (state,0) and temp = randperm (N). It has been proven that Equation (13) satisfies the basic conditions included in Equation (12). Therefore, the expression for irregular wave actions based on the representation of random function source spectrum can be written as
f x ( z , t ) = n = 1 N 2 S f ( z , ω n ) Δ ω cos ( ω n t + ϕ n ( Θ ) )
where ϕn(.) is the function of the elementary random variable Θ, representing the deterministic one-to-one mapping process of the random function {Xn, Yn}. To ensure simulation accuracy, the truncation error of the wave action calculation process at any given position coordinate z is defined as
ε ( N ) = 1 0 ω u S f ( z , ω k ) d ω 0 S f ( z , ω k ) d ω
For the simulation of the continuous field of random wave loads, ε (N) < 0.001 is adopted here.

2.3. Numerical Solution Methods

By simplifying the tension leg platform with tendon connections as articulated mass blocks, its heave Va(t) and surge Ua(t) motions in the wave field can be represented using trigonometric functions of a single degree of freedom. Based on the displacement VL1 at the top of the tendons due to the initial pretension T0, the boundary conditions for this simplified theoretical model can be expressed as
v ( 0 ,   t ) = 0 ,   v ( L ,   t ) = V a ( t ) + V L 1
u ( 0 ,   t ) = 0 ,   u ( L ,   t ) = U a ( t )
U a ( t ) = U L 0 cos   ω u t ,   V a ( t ) = V L 0 sin   ω u t
where UL0 and VL0 represent the amplitudes of surge and heave motions for the tension leg platform, respectively; ωu and ωv denote the circular frequencies of vibration for the surge and heave motions of the tension leg platform, respectively.
When the aspect ratio (L/D) of a vertically tensioned tendon is relatively large, the effects of its moment of inertia and bending stiffness can be neglected. Therefore, the mode shape function of the tendon in axial and lateral directions that satisfies the boundary conditions can be taken as
v ( z ,   t ) = V a ( t ) z L + z T 0 E A + n = 1 N v n ( t ) sin n π z L
u ( z ,   t ) = U a ( t ) z L + n = 1 N u n ( t ) sin n π z L
Meanwhile, by applying the Galerkin method, Equations (19) and (20) are substituted into Equations (1) and (2), thereby reducing the partial differential equations into a series of ordinary differential equations, which can be expressed as
v ¨ n ( t ) + E A m n π L 2 v n ( t ) + E A m n π L 2 U a ( t ) L u n ( t ) + ( 1 ) n + 1 2 n π V ¨ a ( t ) = [ 1 ( 1 ) n ] 2 m n π f z ( z , t )
u ¨ n ( t ) + 2 ω n ξ u ˙ n ( t ) + E I m ¯ n π L 4 + E A m ¯ V a ( t ) L + T 0 E A n π L 2 + 3 E A 2 m ¯ U a ( t ) L 2 n π L 2 u n ( t ) + 3 E A 8 m ¯ n π L 4 u n 3 ( t ) + E A m ¯ U a ( t ) L n π L 2 v n ( t ) + ( 1 ) n + 1 2 n π U ¨ a ( t ) = 2 m ¯ L 0 L f x ( z , t ) sin n π z L d z
where ω n 2 = E I m ¯ n π L 4 + T 0 m ¯ n π L 2 represents the natural frequencies of each mode for the lateral vibration of the tendon; ξ represents the damping ratio for the self-vibration of the tendon, which can be taken as 0.0018.
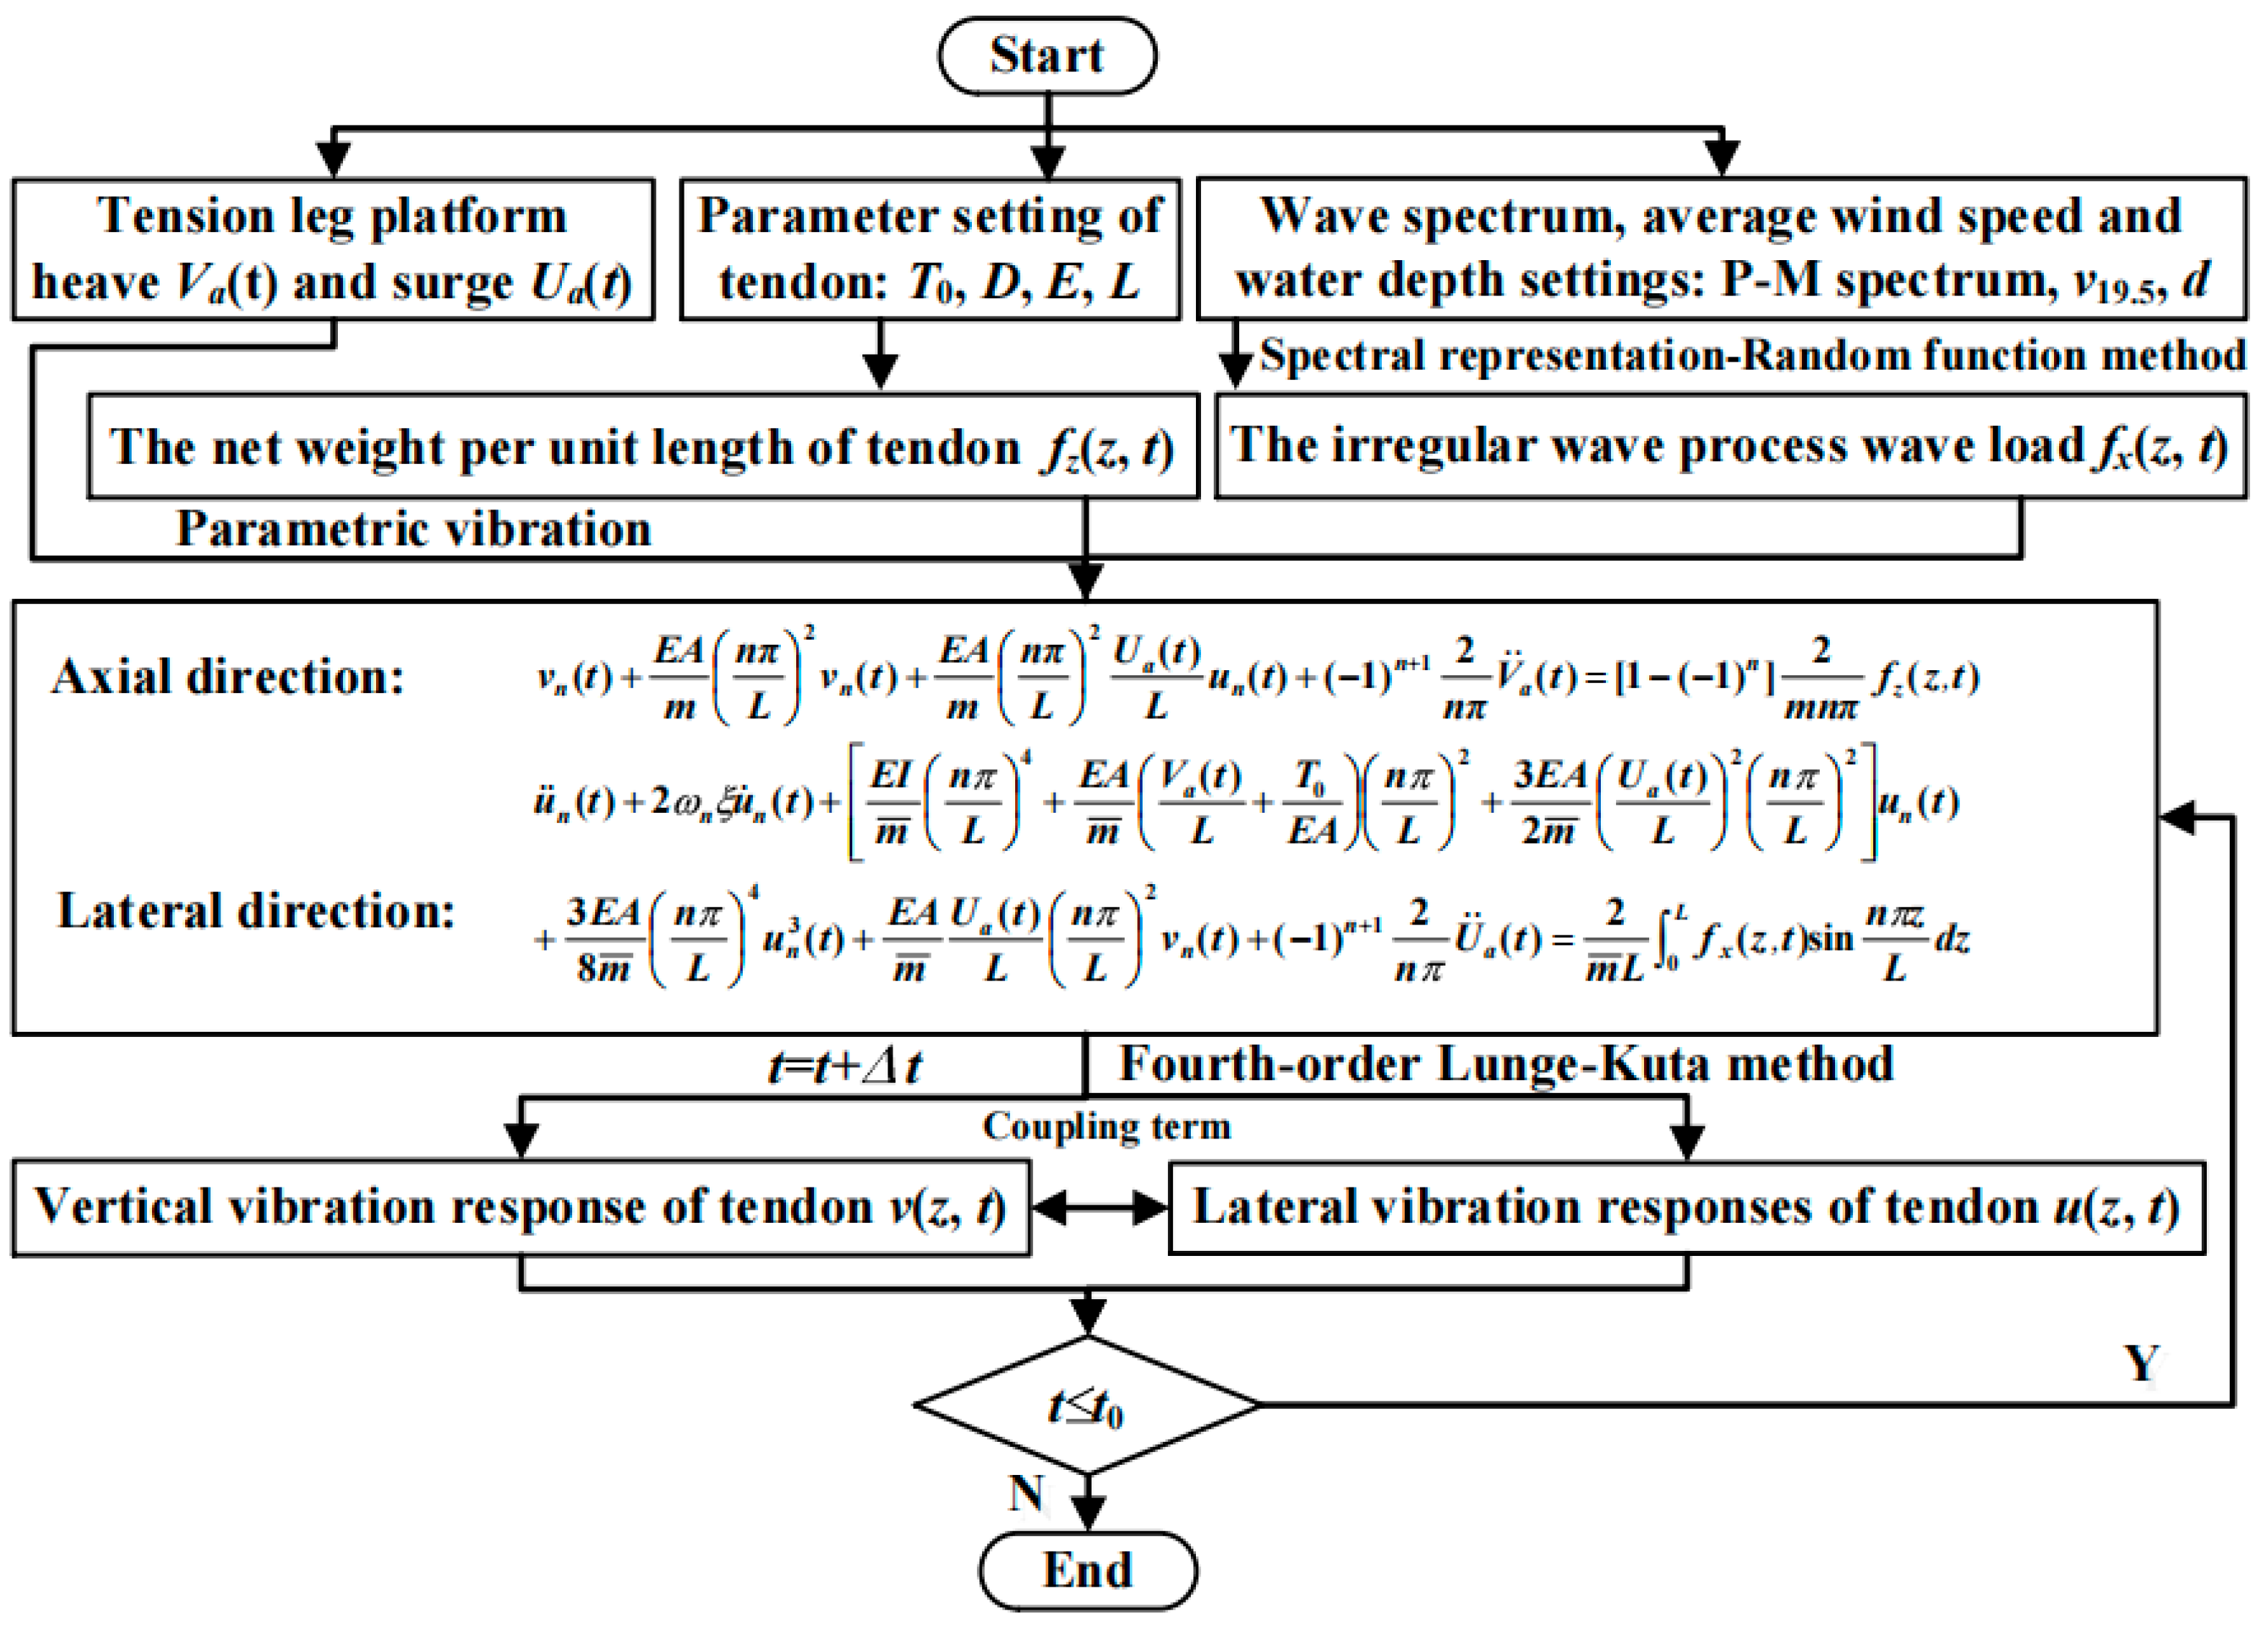
From the differential equations, it can be seen that an axial tendon under wave loading constitutes a nonlinear coupled vibration system. Moreover, the axial and lateral vibrations of the tendon are mutually coupled. Additionally, the random wave loading along the length of the tendon varies both temporally and spatially. Based on the proposed theory and established equations, numerical solutions were obtained using a self-programmed fourth-order Runge–Kutta method in MATLAB version 9.4 (R2022b).

3. Numerical Simulation Method and Examples

Based on the theory presented and the established equations, the first three mode shapes in both the axial and lateral directions of the tendon are considered. First, the wave-induced lateral forces at various positions along the tendon during wave action are computed using the spectral representation–random function method. Then, a coupled numerical analysis of the tendon system in both lateral and axial directions is conducted using the fourth-order Runge–Kutta method in MATLAB. If the influence of irregular ocean waves is neglected, the entire calculation process can be regarded as the coupled parametric vibration between the platform and the tendons. The overall solution process is illustrated in Figure 2. The parameters are referenced from the flexible floating structure for ship-collision protection, while the wave and water depth are specified based on the medium-depth sea areas in the southeastern coastal waters of China [31,32]. The classic P-M spectrum is adopted as the target spectrum for analysis, and its one-sided power spectral density function is expressed as [33,34]
S η ( ω ) = 0.0081 g 2 ω 5 exp 0 . 74 g v 19.5 ω 4
In the equation, v19.5 represents the average wind speed at a height of 19.5 m above the sea surface. To simulate the irregular wave loads along the length of the tendon, the uniformly distributed basic random variables Θ are discretized over the interval [−π, π]. The discretized representative points are calculated using the expression νk+315 = 0.01k + 0.005, where k is an integer selected from the range [−314, 313]. Table 1 presents the fundamental computational parameters used in the numerical example.
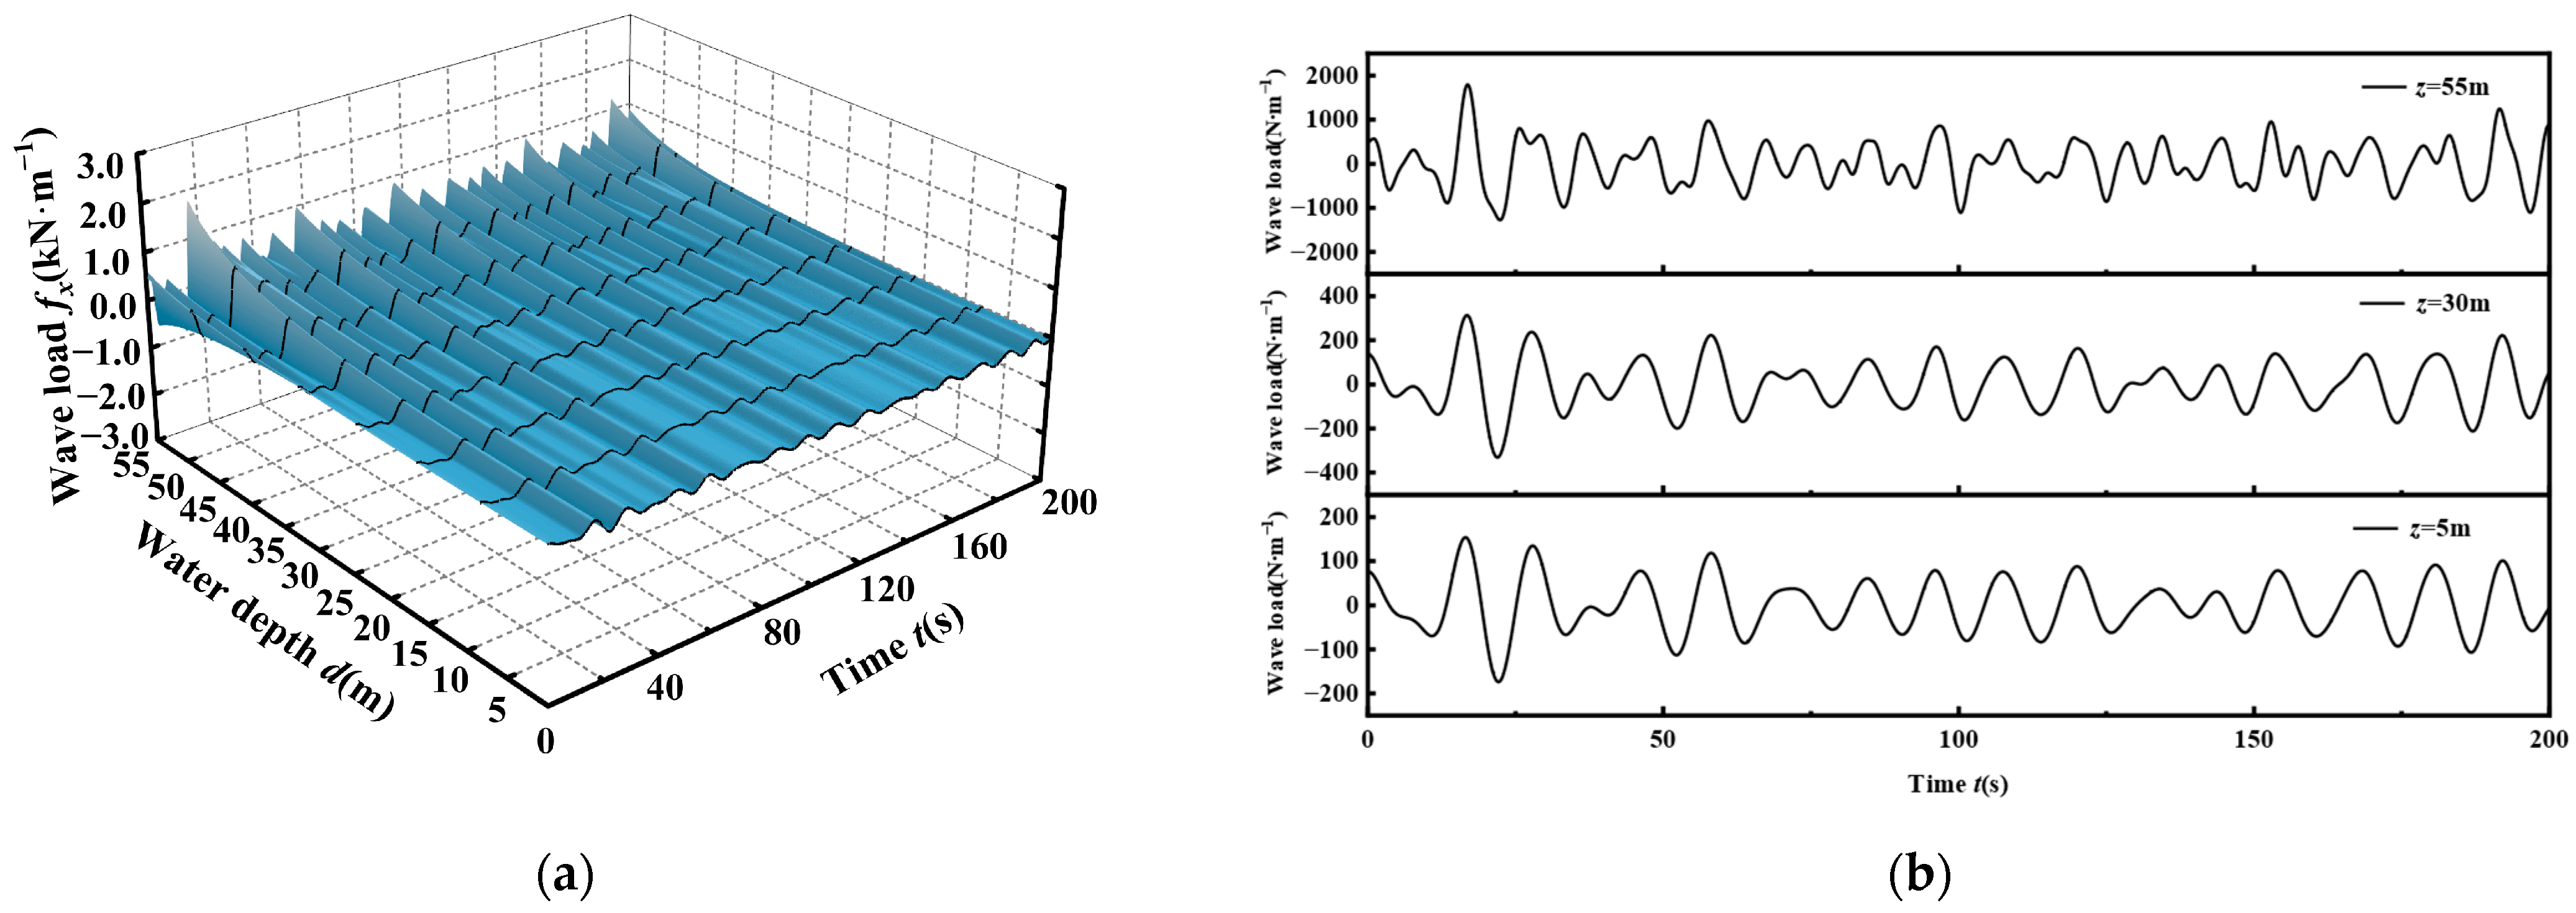
Based on the spectrum representation–random function method, 628 random wave samples were obtained. Figure 3a illustrates the distribution of the first representative random wave load sample over 200 s in the dimensions of time and height, where it can be observed that the wave load amplitude gradually increases along the mooring line height direction. Meanwhile, Figure 3b presents the time histories of the wave loads at mooring line positions with heights of z = 5 m, 30 m, and 55 m. The corresponding root mean square (RMS) values of the loads at different heights are 60.003 N/m, 110.870 N/m, and 509.935 N/m, respectively, showing increases of 84.77% and 359.94%. This indicates that the rate of increase in wave load amplitude becomes faster at mooring line positions closer to the water surface. This is consistent with the general rules of wave theory, which predicts that the wave-induced pressure and load amplitudes decrease exponentially with water depth and therefore exhibit more rapid growth at positions closer to the free surface. In addition, the wave load response exhibits clear stationary behavior with a zero-mean characteristic.

4. Results and Discussion

4.1. Tension Leg Platform and Tendon Coupled Vibration Analysis

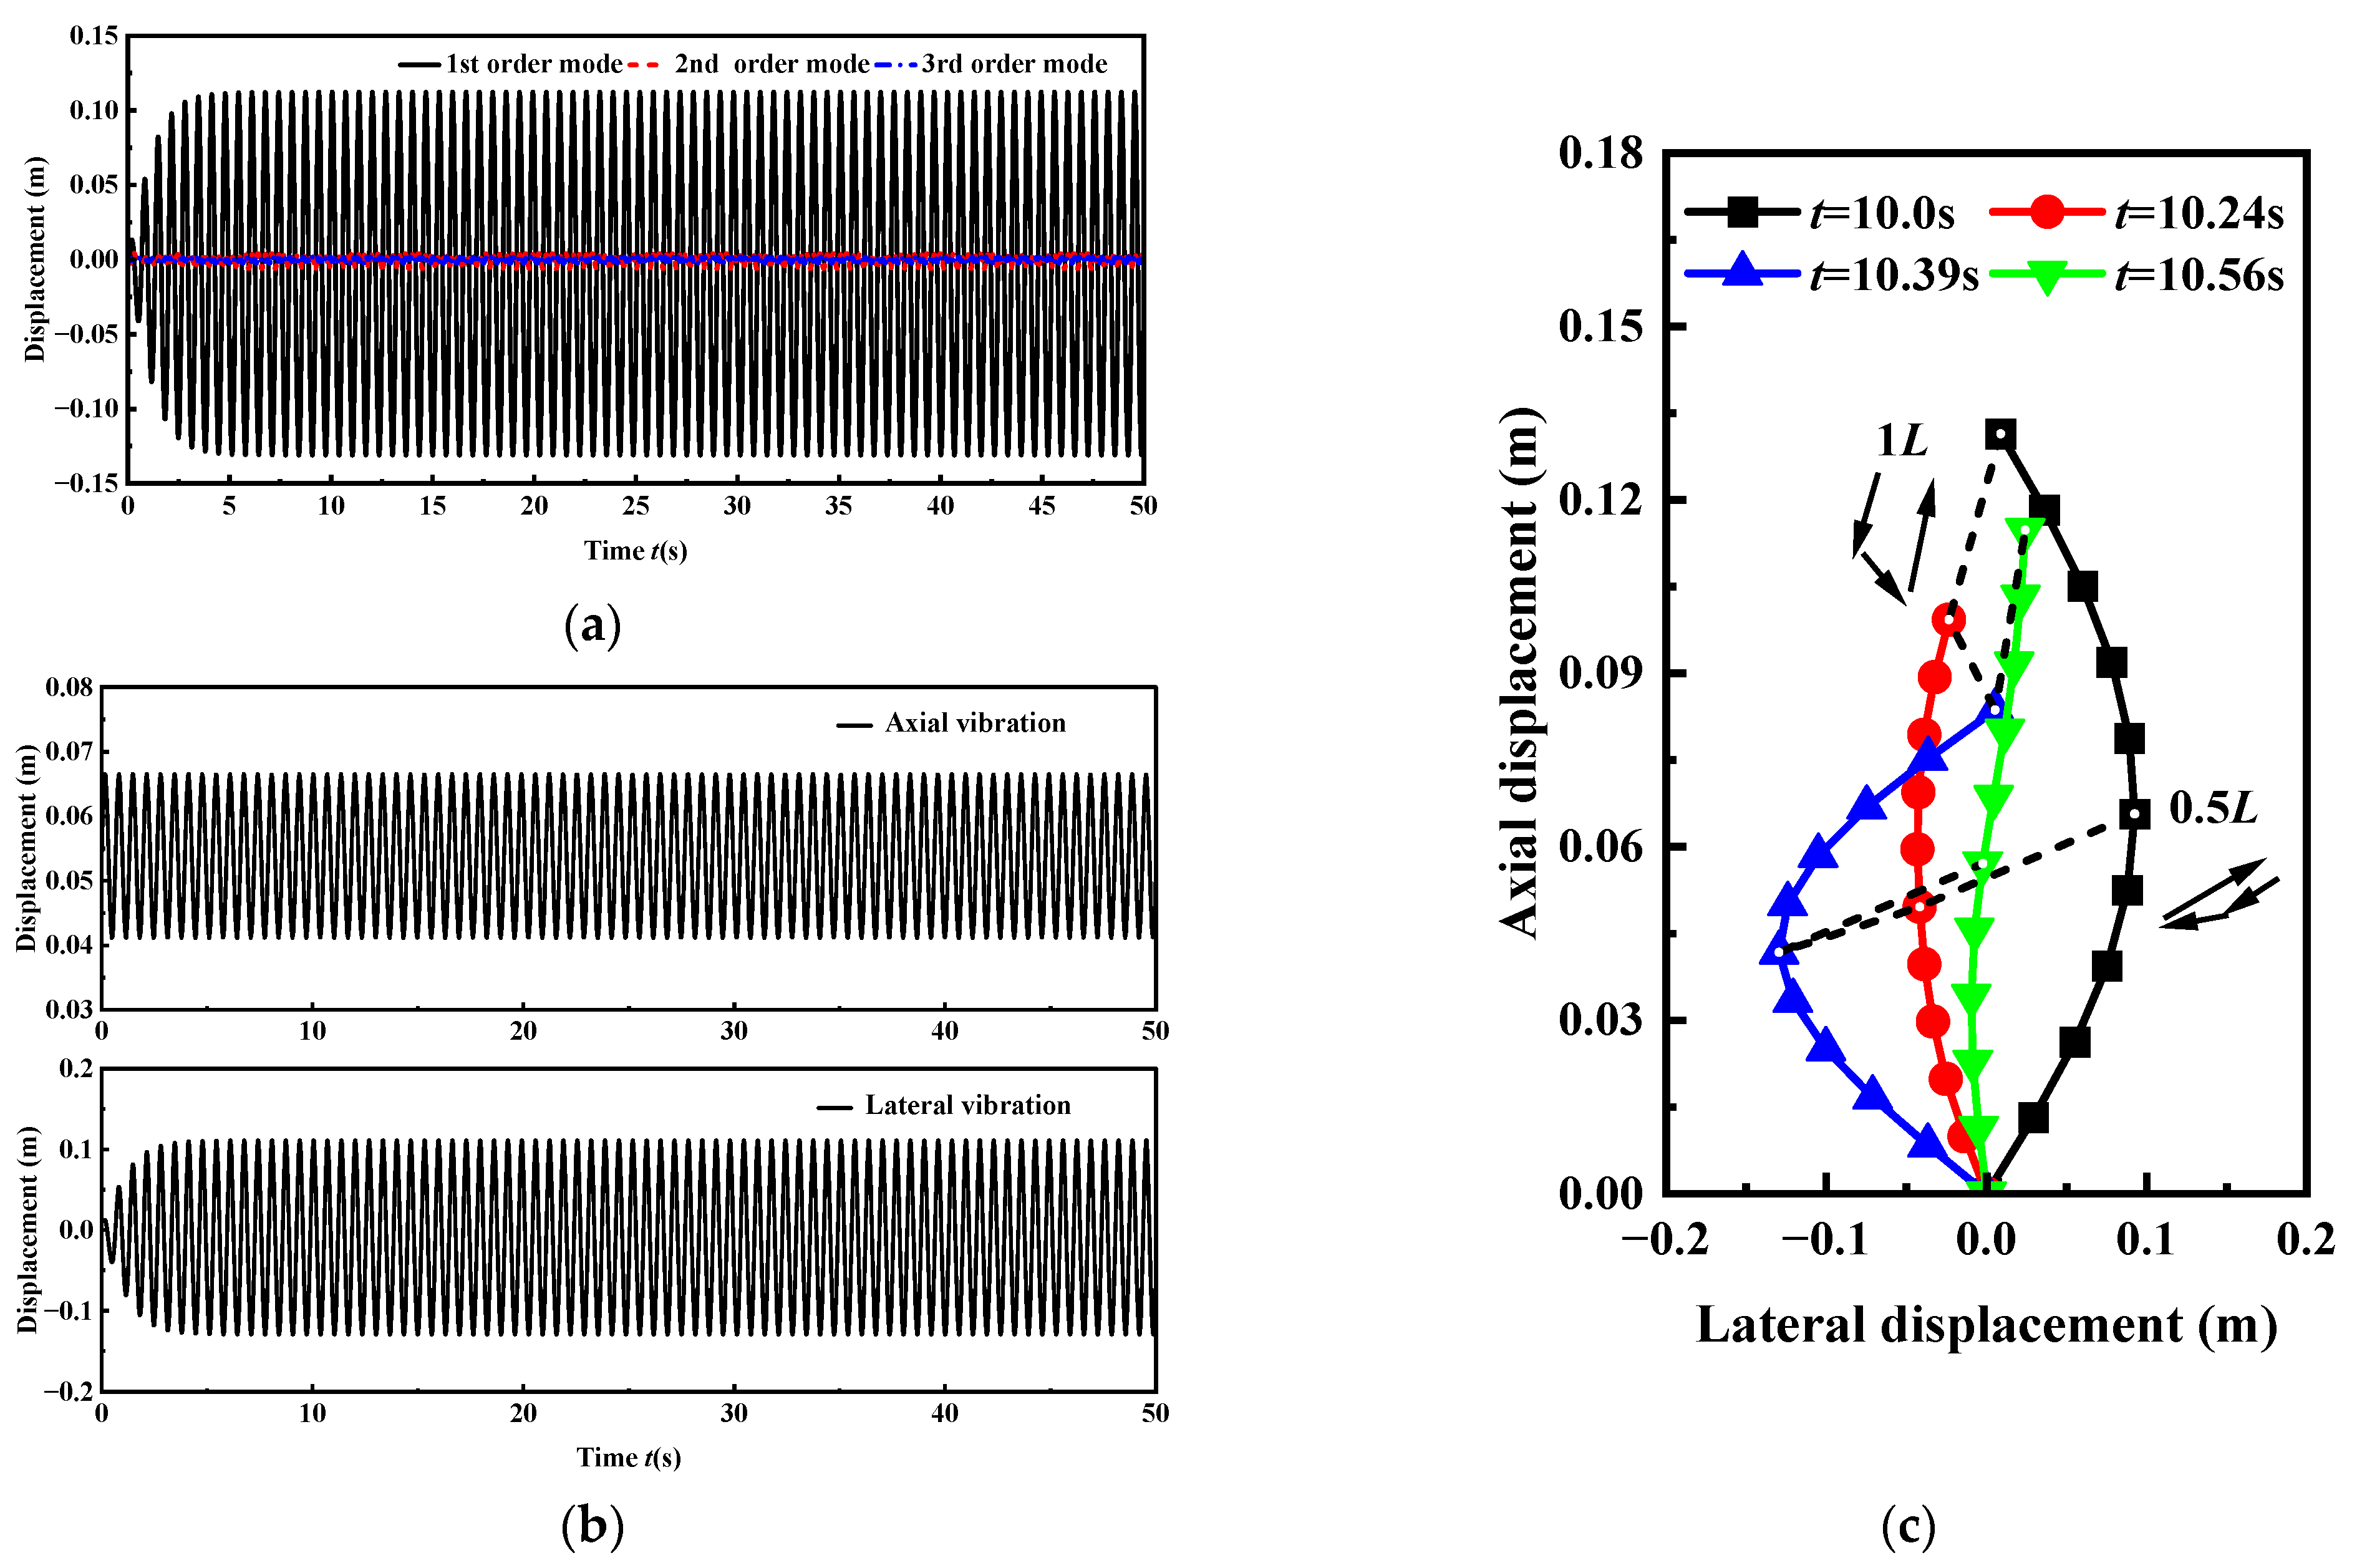
According to Equation (16), the first-order vibration frequency of the tension leg platform is calculated as ω1 = 8.216 rad/s. The heave and surge vibration frequencies of the platform are set as ωu = ωv = ω1, and the dynamic response of the platform tendon’s parametric vibration is analyzed without considering the influence of random waves. Figure 4a shows the first- to third-order modal displacement responses of the transverse vibration of the tendon, where the vibration amplitudes of the first-, second-, and third-order modes are 0.243 m, 0.010 m, and 0.004 m, respectively. It can be seen that the first-order mode plays an absolutely dominant role. Therefore, without considering the resonance effect between the platform and the tendon parametric vibration, selecting the first three modes for the vibration analysis of the tendon can meet the computational accuracy requirements. Figure 4b presents the vibration time history curve at the mid-span of the tendon. The equilibrium position of the axial vibration deviates from zero due to the influence of the initial tension and is governed by the heave motion of the platform, while the transverse vibration amplitude gradually increases from zero to a stable value, exhibiting the typical characteristics of parametric vibration. Taking the point at 0.1 L along the tendon length as the trajectory recording point, Figure 4c further shows the vibration shapes of the tendon at different times. From the vibration shapes of the entire tendon at t = 10.0 s, 10.24 s, 10.39 s, and 10.56 s, it can be seen that the platform and tendon vibrated in a spatially coupled manner within the plane. Affected by the platform’s heave and sway motions, the vibration trajectories of the tendon at the 0.5 L and 1.0 L positions are not synchronized.
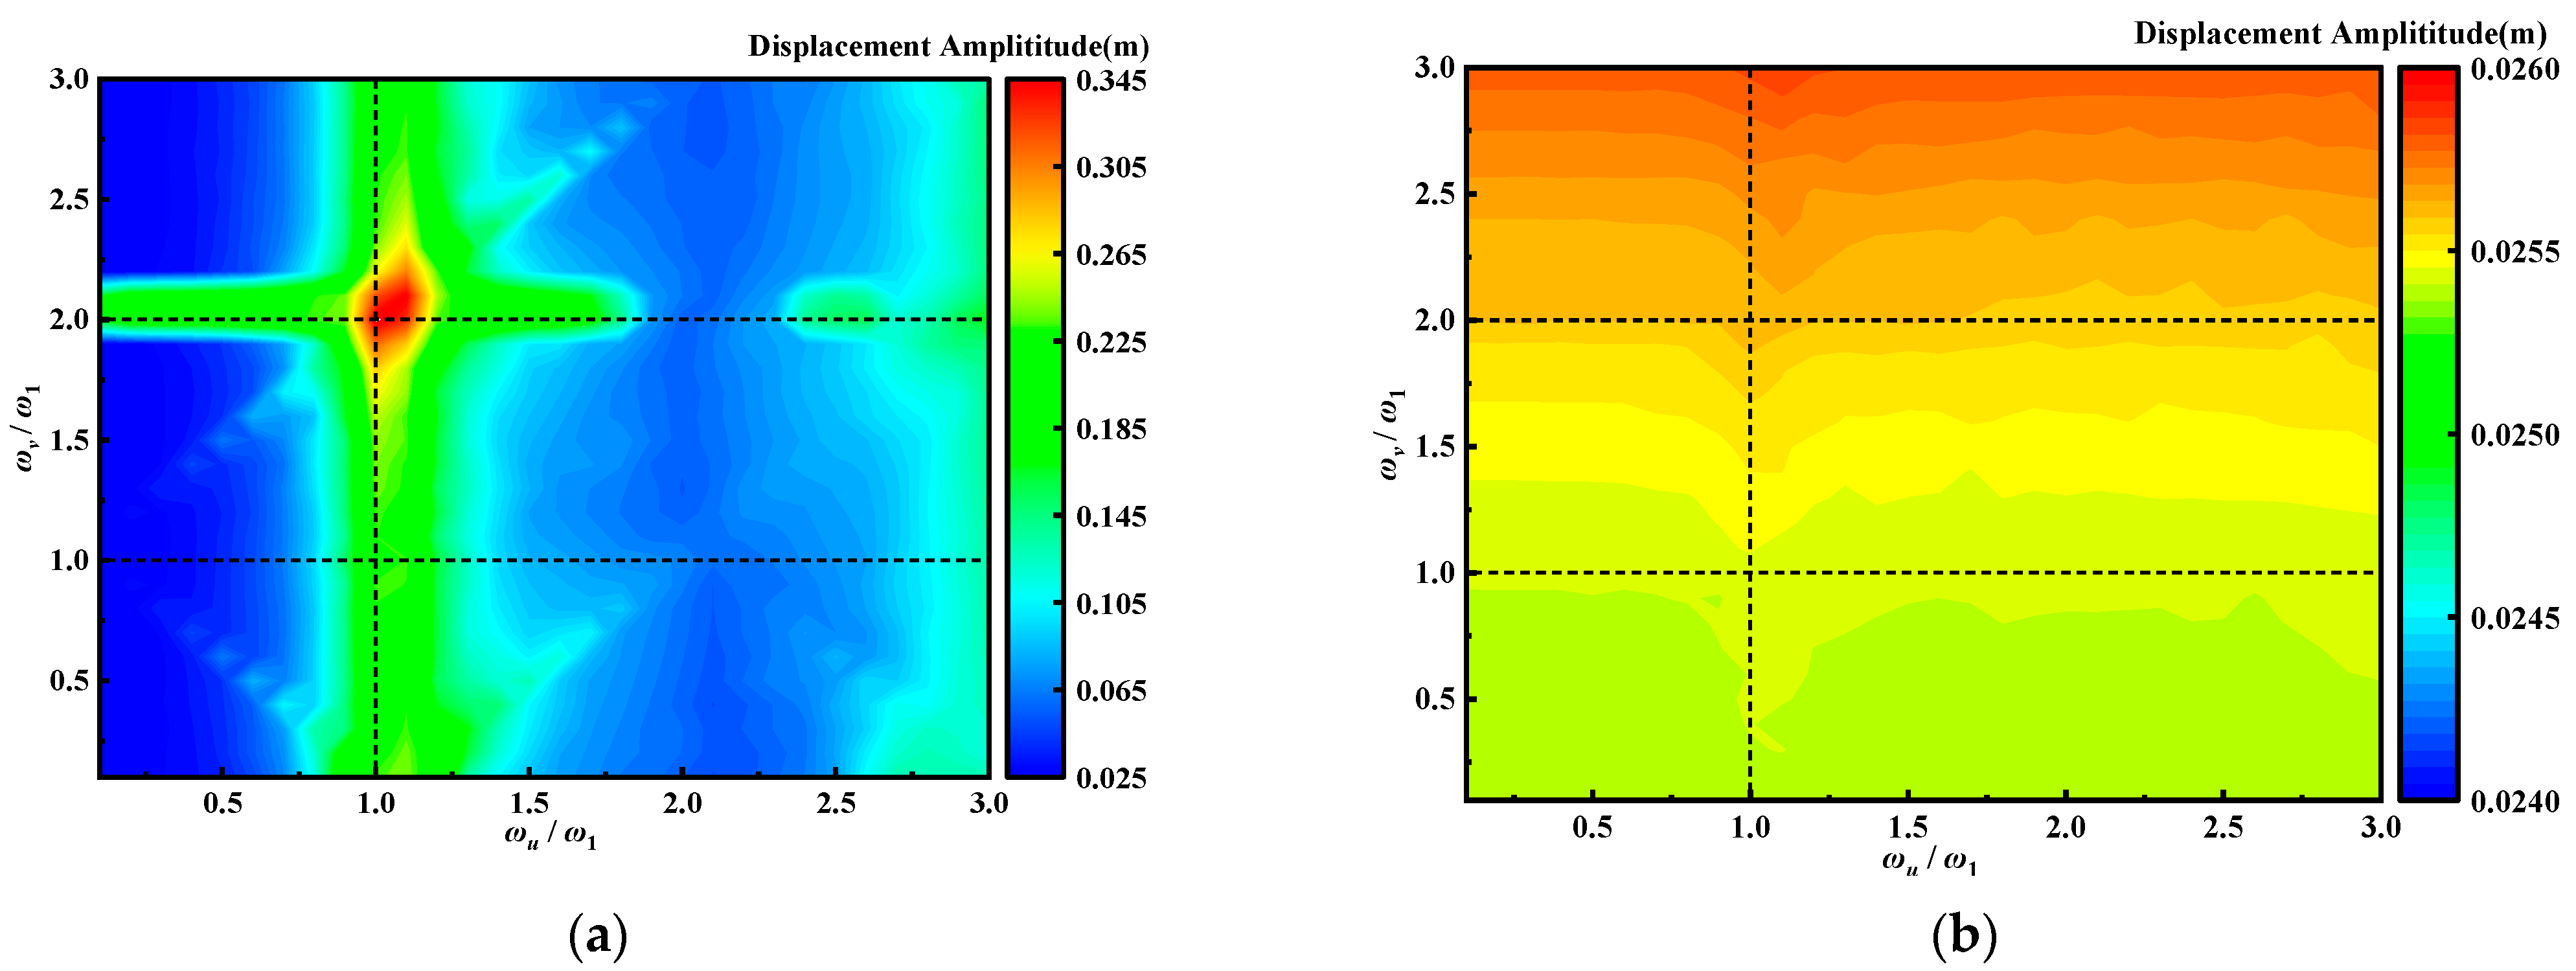
With the amplitudes of the platform’s heave and sway motions kept constant, Figure 5a,b show the displacement amplitudes of the tendon at mid-span in different directions with varying platform heave and sway frequencies, respectively. By comparing the axial and lateral displacement amplitudes at the mid-span under different vibration frequencies, it can be observed that the transverse displacement amplitude changes significantly with variations in the platform’s heave and sway frequencies. When the platform’s sway frequency ωv/ω1 is 1.0, and its heave frequency ωu/ω1 is adjusted from 0.1 to 3.0, the lateral displacement amplitude of the tendon at mid-span reaches a peak at a heave frequency ωu/ω1 of 1.0, with a maximum amplitude of 0.213 m. Meanwhile, if the platform’s sway frequency ωv/ω1 is adjusted to 2.0, the lateral displacement amplitude of the tendon further increases to 0.345 m. It can be seen that when the excitation frequencies of the platform’s heave and sway motions satisfy a multiple relationship with the natural frequencies of the tendon, energy accumulates in the vibration process of the platform and the tendon, leading to parametric resonance. This is characterized by a significant increase in the lateral vibration amplitude of the tendon. Since the occurrence of parametric resonance is unfavorable for the tendon system of a tension leg platform, engineering measures such as adjusting the tendon length, modifying the initial tension, or installing additional vibration dampers are required to prevent parametric resonance.

4.2. Dynamic Characteristics of the Tendon Under Irregular Wave Load

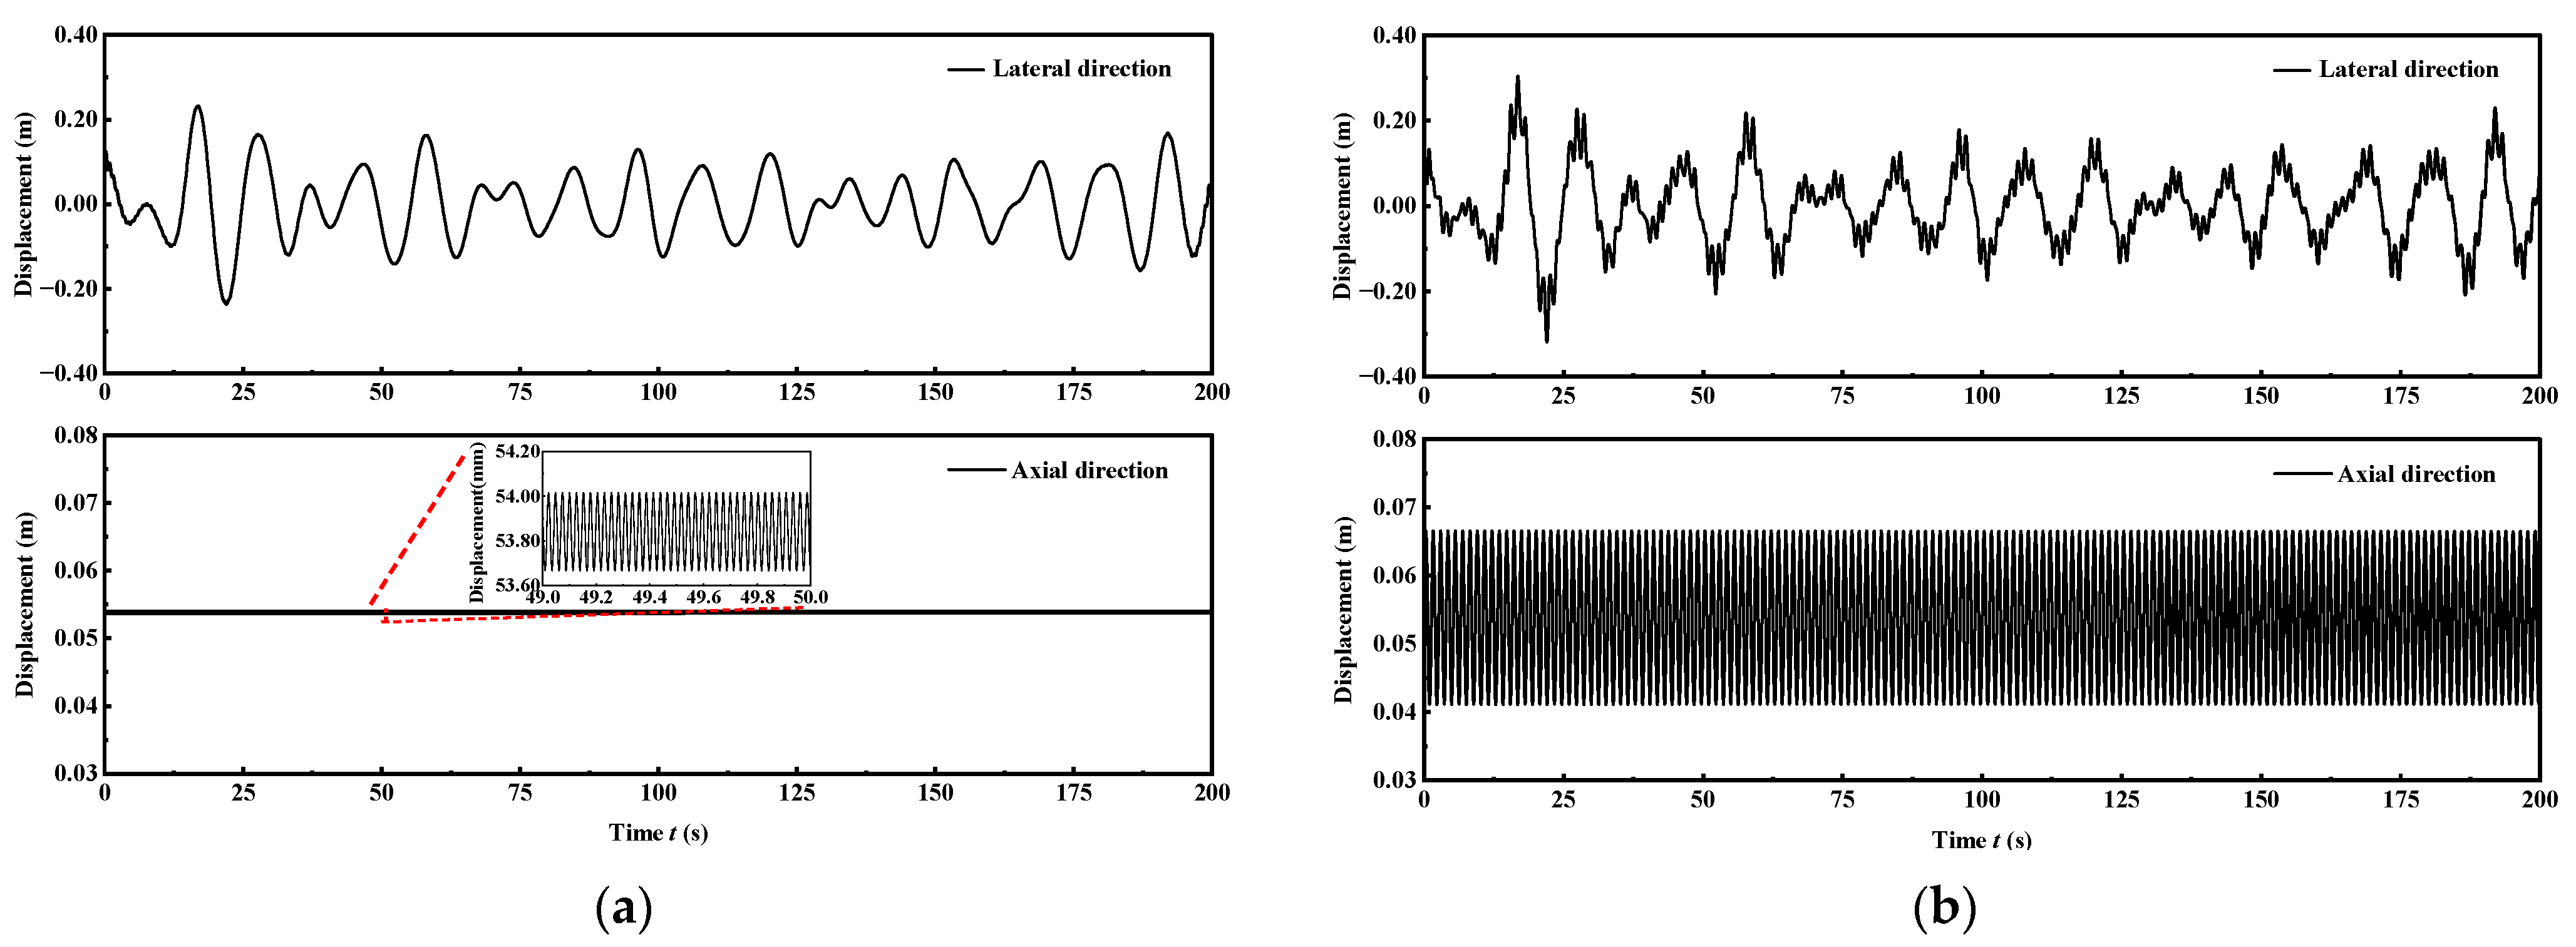
To avoid the influence of parametric resonance vibration of the platform and tendon under wave load, the frequencies of the platform’s heave and sway direction vibrations are set as ωv = 0, ωu = 0 and ωv = 0.5ω1, ωu = 0.5ω1, respectively. Figure 6a,b shows the vibration time history curves at the mid-span of the tendon under irregular wave load at different conditions. When the excitation frequencies of the platform are ωv = 0 and ωu = 0, the tendon undergoes lateral vibration under the action of irregular wave load, while the axial displacement at the mid-span remains stable. In contrast, when the excitation frequencies are ωv = 0.5ω1 and ωu = 0.5ω1, significant coupled lateral and axial vibrations occur at the mid-span of the tendon affected by parametric vibration. Considering that the platform itself experiences structural vibrations in a wave environment, its influence on the tendon vibrations is inevitable. Therefore, analyzing the tendon vibrations under irregular waves while considering parametric vibration effects better reflects the actual operational conditions of the structure.
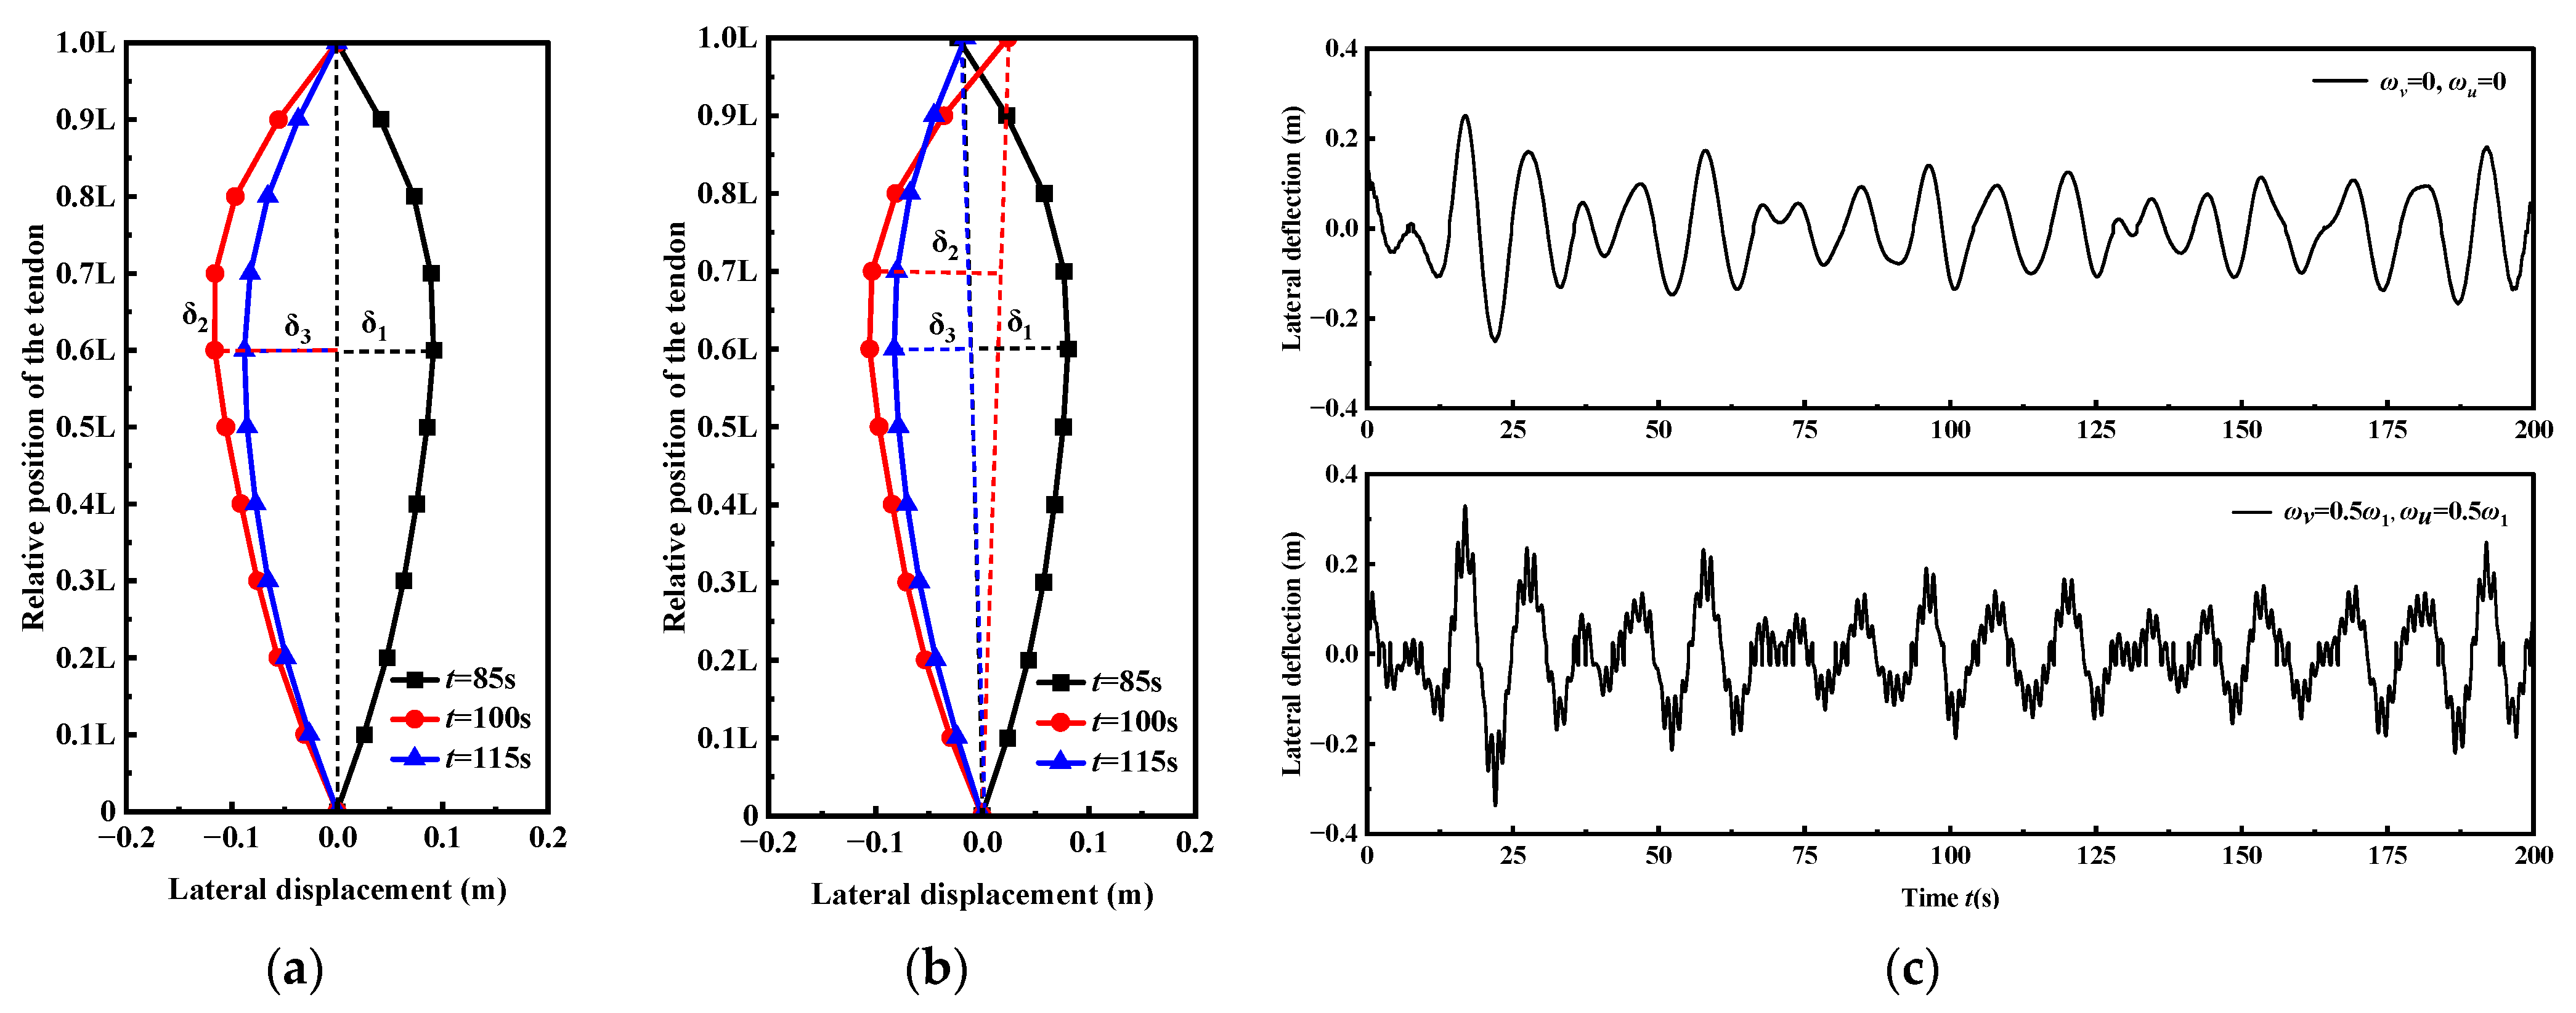
Figure 7a,b show the evolution process of the tendon vibration shapes when the excitation frequencies of the platform are ωv = 0, ωu = 0 and ωv = 0.5ω1, ωu= 0.5ω1, respectively. Due to the parametric vibration between the platform and the tendon, the lateral displacement of the tendon itself contains a superimposed rigid-body motion component of the platform. Therefore, a lateral deflection index of the tendon is proposed to eliminate the interference of the platform’s rigid displacement on the tendon’s lateral displacement, thereby characterizing the deformation behavior of the tendon under the coupled action of wave and parametric excitation. At t = 85 s, 100 s, and 115 s, after subtracting the rigid displacement of the platform at the tendon mid-span position, the maximum lateral deflections of the tendon δ1, δ2, and δ3, are 0.092 m, −0.116 m, and −0.088 m, respectively, as shown in Figure 7a. At the corresponding times, Figure 7b gives the tendon’s maximum lateral deflection responses δ1, δ2, and δ3 as 0.095 m, −0.120 m, and −0.073 m, respectively. Due to the gradual increase in irregular wave load along the tendon height and the influence of the platform’s parametric vibration, the maximum lateral deflection of the tendon does not occur at its mid-span. Figure 7c shows the response curves of the maximum lateral deflection of the tendon at different times under the condition of ωv = 0, ωu = 0 and ωv = 0.5ω1, ωu = 0.5ω1. Compared with the case of ωv = 0, ωu = 0, the tendon’s lateral deflection response changes more drastically due to the coupled parametric vibration of the platform. It indirectly confirms that the system’s vibration modes become more complex, and the tendon may enter a more pronounced unstable state, under the combined action of wave load and parametric excitation.

4.3. Reliability Analysis of the Tendon Under Irregular Wave Load

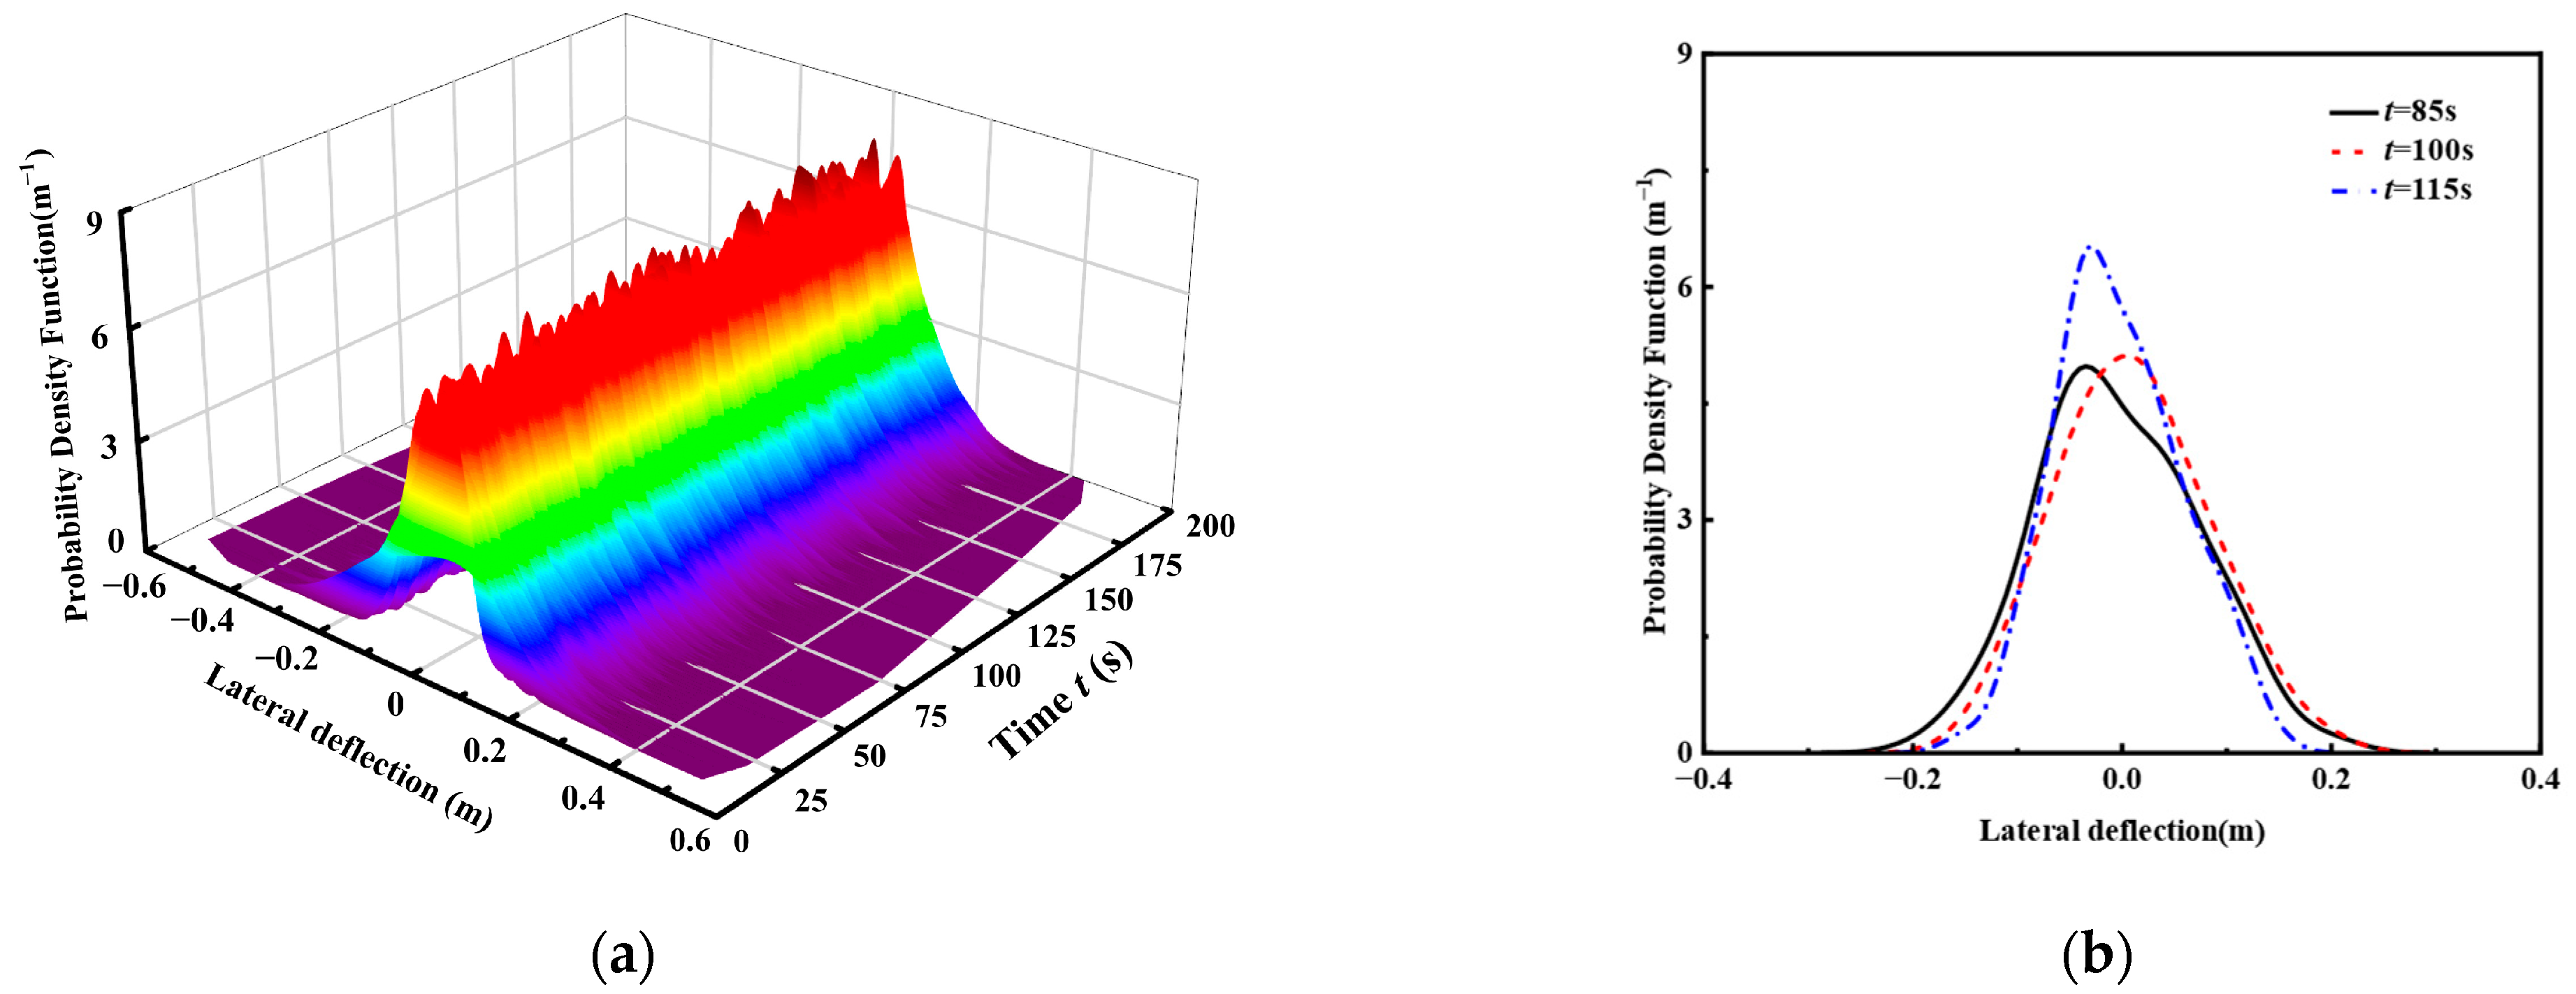
As the primary load-transferring element of the tension leg platform, the reliability of the tendon under irregular wave excitation is critical to ensuring the safe operation of the entire system. Using the spectrum representation–random function method, 628 random wave samples were generated to investigate the lateral deflection response of the tendon. Figure 8a illustrates the evolution surface of the probability density of the maximum lateral deflection at different times under irregular wave load. The results show that the probability density distribution of the lateral deflection response evolves dynamically over time. This behavior reflects the combined effects of wave energy accumulation and the nonlinear coupling of the tendon system, which progressively amplify the uncertainty of the deflection response. Figure 8b further presents the probability density curves of the maximum lateral deflection at t = 85 s, 100 s, and 115 s. A noticeable mean shift is observed among the curves. In particular, relative to the distribution at t = 115 s, those at t = 85 s and t = 100 s exhibit changes in kurtosis and thickening of the tails. Moreover, the distribution at t = 115 s displays skewness, indicating that under certain realizations of irregular wave load, the tendon undergoes large deformations, thereby revealing the potential for extreme response events.
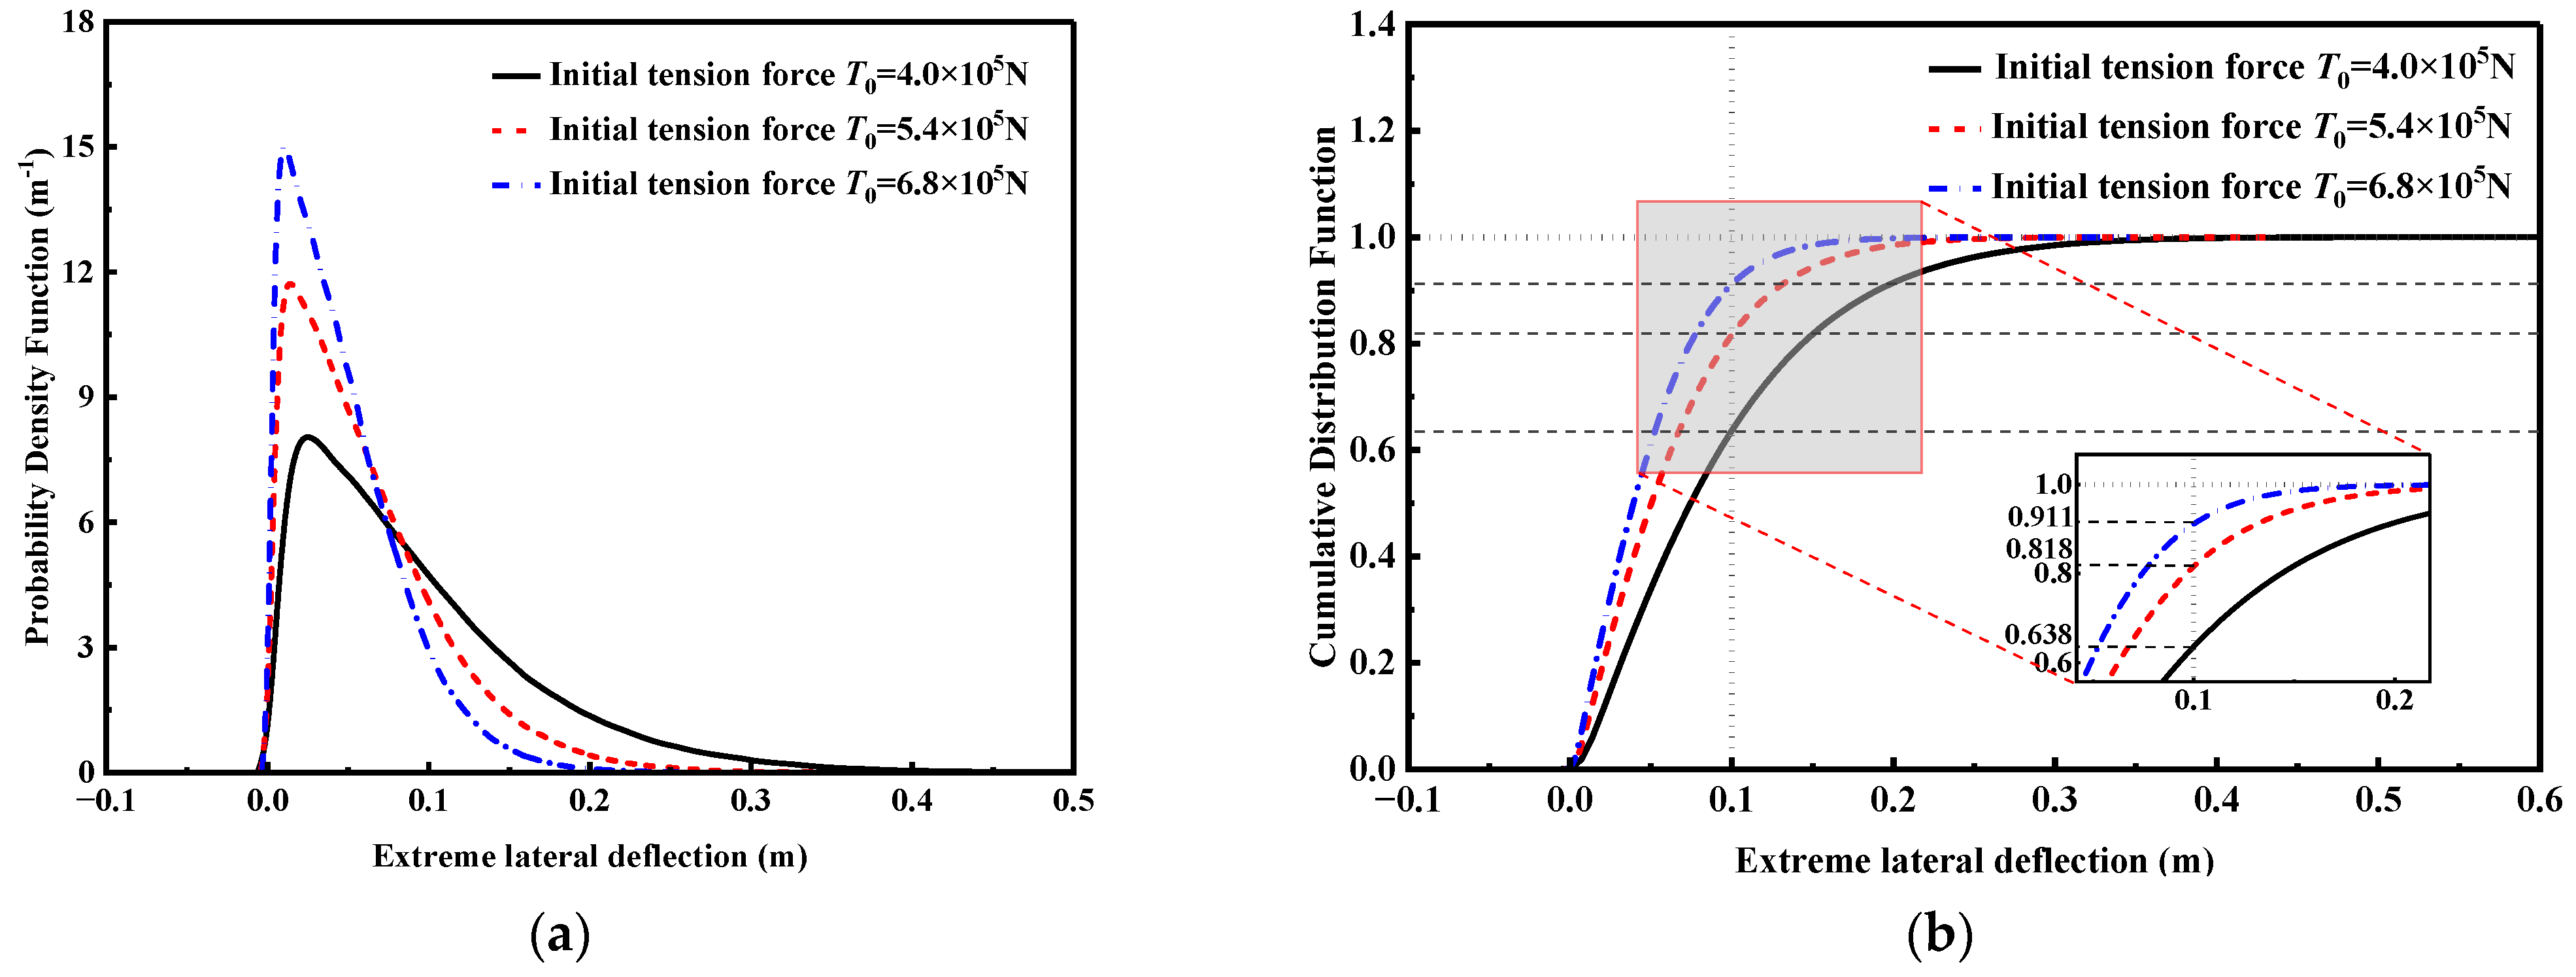
The statistical characteristics of the maximum mid-span lateral deflection of the tendon under irregular wave loading exhibit pronounced time-dependent and nonlinear behavior. Taking the maximum mid-span lateral deflection as the reliability index, and invoking the equivalent extreme event assumption, the probabilistic density evolution method is applied to perform a dynamic reliability assessment of the tension leg platform system with respect to first-passage failure. Figure 9a presents the probability density curves of the extreme lateral deflection of the tendon under initial tension forces of T0 = 4.0 × 10⁵ N, 5.4 × 10⁵ N, and 6.8 × 10⁵ N. The curves reflect the characteristics of a non-Gaussian stationary process. Based on the probability density curves, the cumulative distribution function of the extreme lateral deflection of the tendon can also be obtained, as shown in Figure 9b. If an extreme lateral deflection of 0.1 m is taken as the failure criterion for the tendon, the corresponding failure probabilities of the tendon with initial tension force are T0 = 4.0 × 10⁵ N, 5.4 × 10⁵ N, and 6.8 × 10⁵ N are 0.362, 0.182, and 0.089, respectively. And it can be seen that the reliability of the tendon under different initial tension force is 63.8%, 81.8%, and 91.1%, respectively. The reliability of the tendon increases with the initial tension force. This indicates that increasing the initial tension of the tendon can improve its dynamic performance under irregular wave load and parametric excitation.

4.4. Discussion

The results of this study indicate that investigating the coupled lateral–axial responses of TLP tendons under irregular wave loads is meaningful. Compared with previous studies [32,34], the spectrum representation–random function method is shown to be a reasonable approach for simulating random wave loads. Our findings provide a more refined assessment by incorporating the parametric vibrations of both the platform and tendons, and by introducing the extreme lateral deflection as a reliability index. This approach not only confirms some earlier observations on tendon deflection and tension fluctuations but also highlights the importance of considering coupled dynamic effects, which are often neglected in conventional analyses [6,35]. From a practical perspective, the refined probability density curves of tendon deflection can guide the design and safety assessment of TLP tendon systems, potentially reducing the risk of fatigue or failure under irregular wave conditions. Future research could extend this framework to include multi-directional wave loads, tendon–anchor interactions, or long-term fatigue effects, thereby further improving the predictive capability of tendon reliability under complex ocean environments.

5. Conclusions

To investigate the dynamic response of tension leg platform (TLP) tendons under irregular wave conditions, this study develops a modeling framework that integrates both tendon vibrations and platform–tendon coupling. The governing equations are derived based on Hamilton’s principle and the Kirchhoff hypothesis, while the spectrum representation–random function method is applied to obtain the power spectral density of irregular wave loads and to determine the lateral forces along the tendons. The coupled lateral–axial responses are then calculated using the fourth-order Runge–Kutta scheme. By further incorporating the parametric vibrations of the platform and tendons, the extreme lateral deflection is introduced as a reliability index, from which probability density curves of tendon deflection are derived, enabling a refined reliability assessment of the TLP tendon system. The following conclusions can be drawn:
(1) A total of 628 complete irregular wave load samples were generated using the spectrum representation–random function method, providing the basis for conducting refined analysis of structural dynamic responses through the probabilistic density evolution method. The analysis reveals that the amplitude of the wave load increases gradually along the height of the tendon, with a faster growth rate at locations closer to the water surface.
(2) The influence of the parametric vibrations of the TLP tendon system and the wave load on the tendon vibrations is inevitable. Due to the gradual increase in irregular wave load along the tendon height, the maximum lateral deflection of the tendon occurs at the top of the position where the lateral wave load is larger. In addition, the tendon’s lateral deflection response changes more drastically due to the coupled parametric vibration of the platform.
(3) Based on 628 complete samples of irregular wave loads, the probability density curve and cumulative distribution curve of the extreme lateral deflection of the tendon under irregular wave loads are obtained. Using a lateral deflection of 0.1 m as the failure criterion for the tendon, under typical sea state conditions generated from the P-M wave spectrum, the reliability of the tendon under irregular wave load increases with the initial tension force.

Author Contributions

Conceptualization, writing—review and editing, Q.W.; conceptualization, methodology, Y.D.; validation, formal analysis, T.S.; investigation, Y.D.; resources, H.L.; data curation, writing—original draft preparation, X.L.; visualization, H.L.; project administration, T.S.; funding acquisition, H.L. All authors have read and agreed to the published version of the manuscript.

Funding

This research was supported by Zhejiang Provincial Natural Science Foundation of China under Grant No. LQN25E090009.

Data Availability Statement

The original contributions presented in the study are included in the article. Further inquiries can be directed to the corresponding author.

Conflicts of Interest

Author Qiangqiang Wu, Yinguang Du, and Tao Sun were employed by the company Zhejiang Communications Construction Group Co., Ltd. The remaining authors declare that the research was conducted in the absence of any commercial or financial relationships that could be construed as a potential conflict of interest.

References

  1. Islam, A.S.; Jameel, M.; Jumaat, M.Z.; Shirazi, S.M.; Salman, F.A. Review of offshore energy in Malaysia and floating Spar platform for sustainable exploration. Renew. Sust. Energ. Rev. 2012, 16, 6268–6284. [Google Scholar] [CrossRef]
  2. Zhen, X.W.; Huang, Y. Parametric study on the behavior of an innovative subsurface tension leg platform in ultra-deep water. China Ocean Eng. 2017, 31, 589–597. [Google Scholar] [CrossRef]
  3. Manikandan, R.; Saha, N. Dynamic modelling and non-linear control of TLP supported offshore wind turbine under environmental loads. Mar. Struct. 2019, 64, 263–294. [Google Scholar] [CrossRef]
  4. Ren, Y.; Venugopal, V.; Shi, W. 2022. Dynamic analysis of a multi-column TLP floating offshore wind turbine with tendon failure scenarios. Ocean Eng. 2022, 245, 110472. [Google Scholar] [CrossRef]
  5. Wang, Y.; Yao, T.; Zhao, Y.; Jiang, Z. Review of tension leg platform floating wind turbines: Concepts, design methods, and future development trends. Ocean Eng. 2025, 324, 120587. [Google Scholar] [CrossRef]
  6. Sun, S.N.; Su, Z.B.; Feng, Y.F.; Xu, X.Y. Parametric vibration analysis of submerged floating tunnel tension legs. China Ocean Eng. 2020, 34, 131–136. [Google Scholar] [CrossRef]
  7. Cantero, D.; Rønnquist, A.; Naess, A. Tension during parametric excitation in submerged vertical taut tethers. Appl. Ocean Res. 2017, 65, 279–289. [Google Scholar] [CrossRef]
  8. Hsu, W.T.; Thiagarajan, K.P.; Manuel, L. Extreme mooring tensions due to snap loads on a floating offshore wind turbine system. Mar. Struct. 2017, 55, 182–199. [Google Scholar] [CrossRef]
  9. He, C.; Sun, T.; Zhang, Z.; Liu, H.; Wang, C.; Wang, J. Numerical investigation on the second-order sum-frequency wave forces induced mooring fatigue of a 15 MW TLP FOWT. Ocean Eng. 2025, 322, 120463. [Google Scholar] [CrossRef]
  10. Wei, N.; Zhang, Z.; Xu, X.; Yao, W. Stability analysis of a TLP with inclined tension legs under different marine survival conditions. J. Mar. Sci. Eng. 2022, 10, 1058. [Google Scholar] [CrossRef]
  11. Hasselmann, K.; Barnett, T.P.; Bouws, E.; Carlson, H.; Cartwright, D.E.; Enke, K.; Ewing, J.A.; Gienapp, A.; Hasselmann, D.E.; Kruseman, P.; et al. Measurements of wind-wave growth and swell decay during the Joint North Sea Wave Project (JONSWAP). Ergaenzungsheft Zur Dtsch. Hydrogr. Z. Reihe A 1973, 12. Available online: https://pure.mpg.de/pubman/faces/ViewItemOverviewPage.jsp?itemId=item_3262854 (accessed on 2 September 2025).
  12. Bozzi, S.; Giassi, M.; Miquel, A.M.; Antonini, A.; Bizzozero, F.; Gruosso, G.; Archetti, R.; Passoni, G. Wave energy farm design in real wave climates: The Italian offshore. Energy 2017, 122, 378–389. [Google Scholar] [CrossRef]
  13. Taghipour, R.; Perez, T.; Moan, T. Hybrid frequency–time domain models for dynamic response analysis of marine structures. Ocean Eng. 2008, 35, 685–705. [Google Scholar] [CrossRef]
  14. Aggarwal, A.; Chella, M.A.; Kamath, A.; Bihs, H.; Arntsen, Ø.A. Irregular wave forces on a large vertical circular cylinder. Energy Procedia 2016, 94, 504–516. [Google Scholar] [CrossRef]
  15. Winsterstein, S.R. Random process simulation with the fast Hartley transform. J. Sound Vib. 1990, 137, 527–531. [Google Scholar] [CrossRef]
  16. Chen, J.; Sun, W.; Li, J.; Xu, J. Stochastic harmonic function representation of stochastic processes. J. Appl. Mech. 2013, 80, 011001. [Google Scholar] [CrossRef]
  17. Liu, Z.; Liu, W.; Peng, Y. Random function based spectral representation of stationary and non-stationary stochastic processes. Probabilist Eng. Mech. 2016, 45, 115–126. [Google Scholar] [CrossRef]
  18. Jameel, M.; Oyejobi, D.O.; Siddiqui, N.A.; Ramli Sulong, N.H. Nonlinear dynamic response of tension leg platform under environmental loads. KSCE J. Civ. Eng. 2017, 21, 1022–1030. [Google Scholar] [CrossRef]
  19. Abaiee, M.M.; Ketabdari, M.J.; Ahmadi, A.; Ardakani, H.A. Numerical and experimental study on the dynamic behavior of a sea-star tension leg platform against regular waves. J. Appl. Mech. Tech. Phys. 2016, 57, 510–517. [Google Scholar] [CrossRef]
  20. Choi, Y.M.; Nam, B.W.; Hong, S.Y.; Jung, D.W.; Kim, H.J. Coupled motion analysis of a tension leg platform with a tender semi-submersible system. Ocean Eng. 2018, 156, 224–239. [Google Scholar] [CrossRef]
  21. Soeb, M.R.; Islam, A.S.; Jumaat, M.Z.; Huda, N.; Arzu, F. Response of nonlinear offshore spar platform under wave and current. Ocean Eng. 2017, 144, 296–304. [Google Scholar] [CrossRef]
  22. Li, Y.; Zhu, Q.; Liu, L.; Tang, Y. Transient response of a SPAR-type floating offshore wind turbine with fractured mooring lines. Renew. Energ. 2018, 122, 576–588. [Google Scholar] [CrossRef]
  23. Zhang, Z.; Du, M.; Li, Y.; Liu, W.; Wu, H.; Cui, L.; Yan, Z.; Wang, X.; Liao, Q.; Li, M. Effects of mooring configuration on the dynamic behavior of a TLP with tendon failure. Desalin. Water Treat. 2022, 268, 215–228. [Google Scholar] [CrossRef]
  24. Jin, R.; Jiang, Y.; Shen, W.; Zhang, H.; Geng, B. Coupled dynamic response of a tension leg platform system under waves and flow at different heading angles: An experimental study. Appl. Ocean Res. 2021, 115, 102848. [Google Scholar] [CrossRef]
  25. Hmedi, M.; Uzunoglu, E.; Medina-Manuel, A.; Mas-Soler, J.; Vittori, F.; Pires, O.; Azcona, J.; Souto-Iglesias, A.; Guedes Soares, C. Experimental analysis of CENTEC-TLP self-stable platform with a 10 MW turbine. J. Mar. Sci. Eng. 2022, 10, 1910. [Google Scholar] [CrossRef]
  26. Gadagi, M.M.; Benaroya, H. Dynamic response of an axially loaded tendon of a tension leg platform. J. Sound Vib. 2006, 293, 38–58. [Google Scholar] [CrossRef]
  27. Lin, H.; Xiang, Y.; Yang, Y. Vehicle-tunnel coupled vibration analysis of submerged floating tunnel due to tether parametric excitation. Mar. Struct. 2019, 67, 102646. [Google Scholar] [CrossRef]
  28. Baldock, T.E.; Swan, C. Numerical calculations of large transient water waves. Appl. Ocean Res. 1994, 16, 101–112. [Google Scholar] [CrossRef]
  29. Borgman, L. Computation of the ocean-wave forces on inclined cylinders. Eos Trans. Amer. Geophys. Union 1958, 39, 885–888. [Google Scholar]
  30. Liu, Z.; Liu, Z.; Chen, D. Probability density evolution of a nonlinear concrete gravity dam subjected to nonstationary seismic ground motion. J. Eng. Mech-ASCE. 2018, 144, 04017157. [Google Scholar] [CrossRef]
  31. Sun, Z.; Song, Y.; Tian, Y.; Huang, G.; Zhang, N. Hydrodynamic characteristics of a flexible floating anti-collision system under beam and oblique irregular waves. Ocean Eng. 2022, 251, 111107. [Google Scholar] [CrossRef]
  32. Liu, Z.; Liu, L. Simulation of stochastic ocean states by random function methods. J. Vib. Shock. 2014, 33, 1–6. (In Chinese) [Google Scholar]
  33. Pierson, W.J., Jr.; Moskowitz, L. A proposed spectral form for fully developed wind seas based on the similarity theory of SA Kitaigorodskii. J. Geophys. Res. 1964, 69, 5181–5190. [Google Scholar] [CrossRef]
  34. Lv, K.; Liu, Z. Dimension-reduction simulation for continuous random wave force field. Hydro-Sci. Eng. 2020, 5, 9–15. (In Chinese) [Google Scholar]
  35. Qiao, D.; Li, B.; Yan, J.; Qin, Y.; Liang, H.; Ning, D. Transient Responses Evaluation of FPSO with Different Failure Scenarios of Mooring Lines. J. Mar. Sci. Eng. 2021, 9, 103. [Google Scholar] [CrossRef]
Figure 1. The schematic diagram and a simplified model of a tension leg platform tendon.
Jmse 13 01836 g001
Figure 2. Numerical calculation flow chart.
Jmse 13 01836 g002
Figure 3. Sample functions of random wave load: (a) time history of wave loads at different heights; (b) time history curves of wave loads at heights of z = 5 m, 30 m, and 55 m.
Jmse 13 01836 g003
Figure 4. Parametric vibration response analysis of the tendon: (a) transverse responses of the tendon in the first three modal orders; (b) vibration time history curve at the mid-span of the tendon; (c) vibration mode shapes and trajectories of the entire tendon at different times.
Jmse 13 01836 g004
Figure 5. Relationship between vibration frequencies and the amplitude of tendon mid-span displacement: (a) lateral direction; (b) axial direction.
Jmse 13 01836 g005
Figure 6. Vibration time history curves at the mid-span of the tendon under irregular wave load: (a) ωv = 0,ωu = 0; (b) ωv = 0.5ω1,ωu = 0.5ω1.
Jmse 13 01836 g006
Figure 7. Lateral deflection responses of the tendon under irregular wave load: (a) ωv = 0, ωu = 0; (b) ωv = 0.5ω1, ωu = 0.5ω1; (c) maximum lateral deflection response of the tendon.
Jmse 13 01836 g007
Figure 8. Probability information of tendon lateral deflection under irregular wave load: (a) probability density curves of extreme lateral deflection; (b) probability density curves at t = 85 s, 100 s, and 115 s.
Jmse 13 01836 g008
Figure 9. Dynamic reliability curves of the tendon with different initial tension forces: (a) probability density curves of the extreme lateral deflection; (b) cumulative distribution curves of the extreme lateral deflection.
Jmse 13 01836 g009
Table 1. Basic parameters of wave and tendon.
ObjectParametersValue
Tension leg platformAmplitude of axial vibration VL0/(m)0.025
Amplitude of lateral vibration UL1/(m)0.025
TendonElastic modulus E/(MPa)1.4 × 105
Density ρ/(kg·m−3)7850
Diameter D/(m)0.5
Initial tension force T0/(N)5.4 × 105
Length L/(m)55
Wave conditionSea depth d/(m)60
Sea density ρw/(kg·m−3)1000
Disclaimer/Publisher’s Note: The statements, opinions and data contained in all publications are solely those of the individual author(s) and contributor(s) and not of MDPI and/or the editor(s). MDPI and/or the editor(s) disclaim responsibility for any injury to people or property resulting from any ideas, methods, instructions or products referred to in the content.