Article

Spatiotemporal Dynamics and Drivers of Wetland Change on Chongming Island (2000–2020) Using Deep Learning and Remote Sensing

1
National Key Laboratory for Climate System Prediction and Response to Changes, Nanjing University of Information Science & Technology, Nanjing 210044, China
2
School of Marine Science, Nanjing University of Information Science & Technology, Nanjing 210044, China
3
International Center for Earth Fluid Research, Nanjing University of Information Science & Technology, Nanjing 210044, China
4
Fujian Provincial Meteorological Observatory, Fuzhou 350007, China
5
School of Marine Science & Technology, Zhejiang Ocean University, Zhoushan 316022, China
6
Southern Marine Science and Engineering Guangdong Laboratory (Zhuhai), Zhuhai 519000, China
*
Author to whom correspondence should be addressed.
J. Mar. Sci. Eng. 2025, 13(10), 1837; https://doi.org/10.3390/jmse13101837
Submission received: 11 August 2025 / Revised: 15 September 2025 / Accepted: 20 September 2025 / Published: 23 September 2025
(This article belongs to the Section Coastal Engineering)

Abstract

Using Landsat series imagery and the deep learning model CITNet, this study conducted high-accuracy classification and spatiotemporal change analysis of wetlands on Chongming Island from 2000–2020 and explored the driving mechanisms by integrating climatic and anthropogenic factors. The results demonstrate that the total wetland area decreased by approximately 125.5 km2 over the two decades. Among natural wetlands, tidal mudflats and shallow seawater zones continuously shrank, while herbaceous marshes exhibited a “decline recovery” trajectory. Artificial wetlands expanded before 2005 but contracted significantly thereafter, mainly due to aquaculture pond reduction. Wetland transformation was dominated by wetland-to-non-wetland conversions, peaking during 2005–2010. Driving factor analysis revealed a “human pressure dominated, climate modulated” pattern: nighttime light index (NTL) and GDP demonstrated strong negative correlations with wetland extent, while minimum temperature and the Palmer Drought Severity Index (PDSI) promoted herbaceous marsh expansion and accelerated artificial wetland contraction, respectively. The findings indicate that wetland changes on Chongming Island result from the combined effects of policy, economic growth, and ecological processes. Sustainable management should focus on restricting urban expansion in ecologically sensitive zones, optimizing water resource allocation under drought conditions, and incorporating climate adaptation and invasive species control into restoration programs to maintain both the extent and ecological quality of wetlands.

1. Introduction

Wetlands represent one of the planet’s richest ecosystems in both biodiversity and ecological value. They contribute essential services, ranging from supplying fresh water and producing food to regulating floods, filtering water, and sequestering carbon [1,2,3]. On a worldwide scale, the combined economic worth of these ecological functions has been assessed at approximately 47 trillion international dollars annually [3,4], yet wetlands have declined rapidly under human pressures: from 1970–2015, global wetland coverage declined by nearly 35%, a pace close to triple the loss rate observed for forests during the same period [5] and a rate roughly three times faster than forest loss [6]. Over the longer term, more than 85% of wetlands present in the 1700s had disappeared by the early twenty-first century [7]. Such losses diminish biodiversity and hydrological regulation and weaken climate resilience, given wetlands’ roles in carbon sequestration and buffering extreme events [8,9].
Both anthropogenic activities and climate change contribute to these declines. Intensive coastal development and land conversion directly eliminate or degrade wetland areas [10,11,12,13,14,15,16], while sea-level rise and more frequent extreme storms exacerbate erosion, inundation, and functional impairment [17,18,19,20]. Without additional space for landward migration, high sea-level-rise scenarios project that approximately 20–30% of remaining coastal wetlands could be lost by 2100 [9,21,22]. These combined stressors underscore the urgency of scalable, reliable monitoring and evidence-based conservation.
The Yangtze River estuary exemplifies these challenges. Rapid economic growth in the Yangtze River Delta has driven extensive land reclamation, causing substantial wetland loss and ecological degradation [10,18]. On Chongming Island at the estuary mouth, wetland landscapes have changed markedly under the dual influences of human activity and climate variability [23,24]. Remote sensing demonstrates that from 1985 to 2019, the island’s total land area expanded through embankment and island-linking projects [25,26,27], while natural coastal wetland vegetation declined [28]. Vegetation area reached a minimum around 2002 (approximately 3813 ha) and subsequently recovered gradually [29], coincident with a policy shift from extensive reclamation to conservation in the 2000s [30,31,32,33]. Nationally, China has lost a large fraction of its coastal wetlands in recent decades, mainly due to reclamation and development.
Robust, long-term monitoring requires approaches that capture both fine-scale spatial patterns and multi-decadal dynamics. Deep learning-based remote sensing has become a powerful solution for high-accuracy, large-area land-cover mapping. In particular, Wang et al. (2024) proposed the Convolutional Interaction Transformer Network (CITNet), which couples convolutional feature extraction with Transformer attention for a global context, achieving strong performance in hyperspectral and LiDAR image classification [4]. Related studies show the value of time series learning and advanced feature modeling: Cai (2018) built a high-performance in-season crop classification system from Landsat time series [34], and Fang et al. (2023) retrieved the leaf area index of Spartina alterniflora from UAV hyperspectral data using optimized machine-learning algorithms [35]. For wetland delineation and water detection, comparative assessments of Landsat-based indices (e.g., Fisher et al., 2016) and long-term change mapping at continental scales (e.g., Souza et al., 2013) provide methodological references for dynamic environments [36,37]. On Chongming specifically, Shen et al. (2015) linked land-use/land-cover dynamics with surface temperature, highlighting the need for fine-resolution, time-series classification to disentangle human and climatic effects [23].
Building on these advances, this study applies CITNet to Landsat time-series imagery (2000–2020) to generate high-resolution maps of wetland distribution and multi-decadal change trajectories on Chongming Island. We then integrate these classifications with climate indicators (e.g., sea level trends) and records of human activities (e.g., reclamation history, land-use change) to diagnose the dominant drivers of transformation. Historical evidence indicates that large-scale reclamation fundamentally reshaped tidal hydrodynamics, reduced intertidal habitats, and converted wetlands to agricultural or industrial uses [22]. In parallel, the exotic marsh grass Spartina alterniflora spread rapidly and altered native habitats: Zhang et al. (2020) quantified its 1995–2018 expansion and targeted removal on Chongming using Landsat time series [28]; Ai et al. (2017) leveraged phenology from GaoFen-1 imagery to map Spartina alterniflora in the Yangtze Estuary [31]; Liu et al. (2018) documented rapid coastal spread across mainland China with Landsat OLI [32]; and Xiao et al. (2010) detailed estuarine range expansion patterns and displacement of native salt marsh vegetation [33]. Recent restoration of Spartina alterniflora removal, native revegetation, and hydrological rehabilitation shows localized gains in stabilizing or regaining wetland cover, consistent with broader evidence that proactive management can enhance tidal wetland stability despite ongoing human pressure and sea level rise.

2. Materials and Methods

2.1. Study Area Overview

Chongming Island is located at the core of the Yangtze River estuary, with geographic coordinates ranging from 121.15–122.02° E and 31.42–31.88° N. Shaped by the dual hydrodynamic forces of Yangtze River runoff and East China Sea tides, extensive sediment deposition has created a unique land–water interface, characterized by turbid water due to high suspended sediment content. The island stretches approximately 80 km east–west and up to 18 km north–south, with a terrestrial area of 1269.1 km2. This study extends the analysis to include surrounding waters, covering a total area of 1825.76 km2. The region experiences a humid subtropical monsoon climate, with an average annual temperature of 16.6 °C and precipitation of approximately 1476 mm, supported by abundant light and heat resources. The tidal regime is an irregular semidiurnal mixed tide, significantly influencing regional hydrodynamic patterns. The coastal zone exhibits diverse characteristics, including natural sandy and muddy shorelines alongside artificial shorelines dominated by large-scale aquaculture zones. Accordingly, this study classifies wetlands into natural and artificial categories, with their spatial distributions detailed in Figure 1 and Table 1.

2.2. Remote Sensing Data and Driving Factors

This study utilized Landsat series satellite imagery at five-year intervals from 2000–2020 via the Google Earth Engine (GEE) platform. Imagery from 2000, 2005, and 2010 was obtained from the Landsat 5 TM sensor (six spectral bands: blue, green, red, NIR, SWIR1, and SWIR2, Hughes Santa Barbara Research Center, Goleta, CA, USA; operated by NASA/USGS, Reston, VA, USA), whereas data from 2015 and 2020 came from the Landsat 8 OLI sensor (seven spectral bands, including an additional coastal/aerosol band, Ball Aerospace & Technologies Corp., Boulder, CO, USA; operated by NASA/USGS, Reston, VA, USA). To ensure comparability, only the six bands common to both sensors were retained for analysis (Table 2).
Preprocessing included: (1) filtering out all scenes with >10% cloud cover using the QA band and the F-mask algorithm to guarantee high-quality inputs; (2) compositing multi-temporal images from the growing season (June–September) using the per-pixel median, thereby reducing noise from transient weather and tidal variations. Tidal stages were checked with local tide tables, prioritizing mid-to-low tide imagery when available; (3) applying radiometric calibration to surface reflectance (LEDAPS for Landsat 5 TM, LaSRC for Landsat 8 OLI). Cross-sensor differences were minimized through published cross-calibration coefficients. Ancillary datasets, including GDP, nighttime light (NTL), and population (POP), were resampled to a 30 m grid using bilinear or nearest-neighbor interpolation as appropriate. All cloud and shadow pixels were masked prior to compositing to ensure data integrity.
To investigate the drivers of wetland change, we assembled a natural social coupled dataset from multiple sources. Climate variables—annual mean temperature, extreme high/low temperature, precipitation, and relative humidity—were obtained from the China Meteorological Administration’s Ecological Cloud Platform. Hydroclimatic stress was represented by the Palmer Drought Severity Index (PDSI) from Figshare. Human activity was proxied by regional gross domestic product (GDP), nighttime light index (NTL), and population density (POP), retrieved from the Resource and Environment Science Data Center (RESDC) and the CASEARTH Data Sharing and Service Portal. All datasets were quality checked, coregistered, and temporally aligned before analysis. Together, these layers form a coherent natural social framework for attributing wetland dynamics (Table 3).

2.3. Classification Method

Before introducing the classification model, we first describe the preparation of training samples and the validation of ground-truth labels. To ensure reliability, we adopted a three-step “multi-source reference + visual verification” strategy. First, candidate samples were extracted from the CNLUCC and CLCD datasets, which follow the GB/T 35643-2017 classification standard [38]. Second, a temporal consistency filter was applied: only pixels with consistent labels across the target year and its two adjacent products were retained, while inconsistent pixels were discarded. Finally, candidate samples were cross-checked with high-resolution imagery from GF-2 (0.8 m) and Sentinel (10 m), and those that were inconsistent or located at mixed-pixel boundaries were removed. Landsat composites were used only as auxiliary consistency checks rather than as the primary basis for manual labeling. This three-level quality control process ensured reliable training samples, with confidence exceeding 0.90.
The classification model employed is the Convolutional Interaction Transformer Network (CITNet), a hybrid CNN–Transformer architecture specifically designed for remote sensing applications. CITNet integrates three principal modules: (1) the Multiscale Asymmetric Deep Convolution (MADC), which extracts fine grained spatial features across multiple scales using asymmetric convolutional kernels; (2) the Local Global Transformer Module (LGTM), which applies self-attention within and across patches to capture both fine details and broad contextual dependencies; and (3) the Optimized Convolutional Cross-Attention (OCA), which fuses multi-scale and multi-channel features, enhancing robustness to spectral similarity, spatial heterogeneity, and mixed pixels. Together, these modules allow CITNet to capture both detailed spatial patterns and long-range dependencies, thereby improving the discrimination of wetland subclasses with similar spectral signatures. Comparable hybrid CNN-Transformer approaches include CVTNet (Marjani et al., 2024) [39] and cross-attention-based-CNN-Transformer models (Li et al., 2025) [40]. For full architectural details of CITNet, readers are referred to Wang et al. [4].
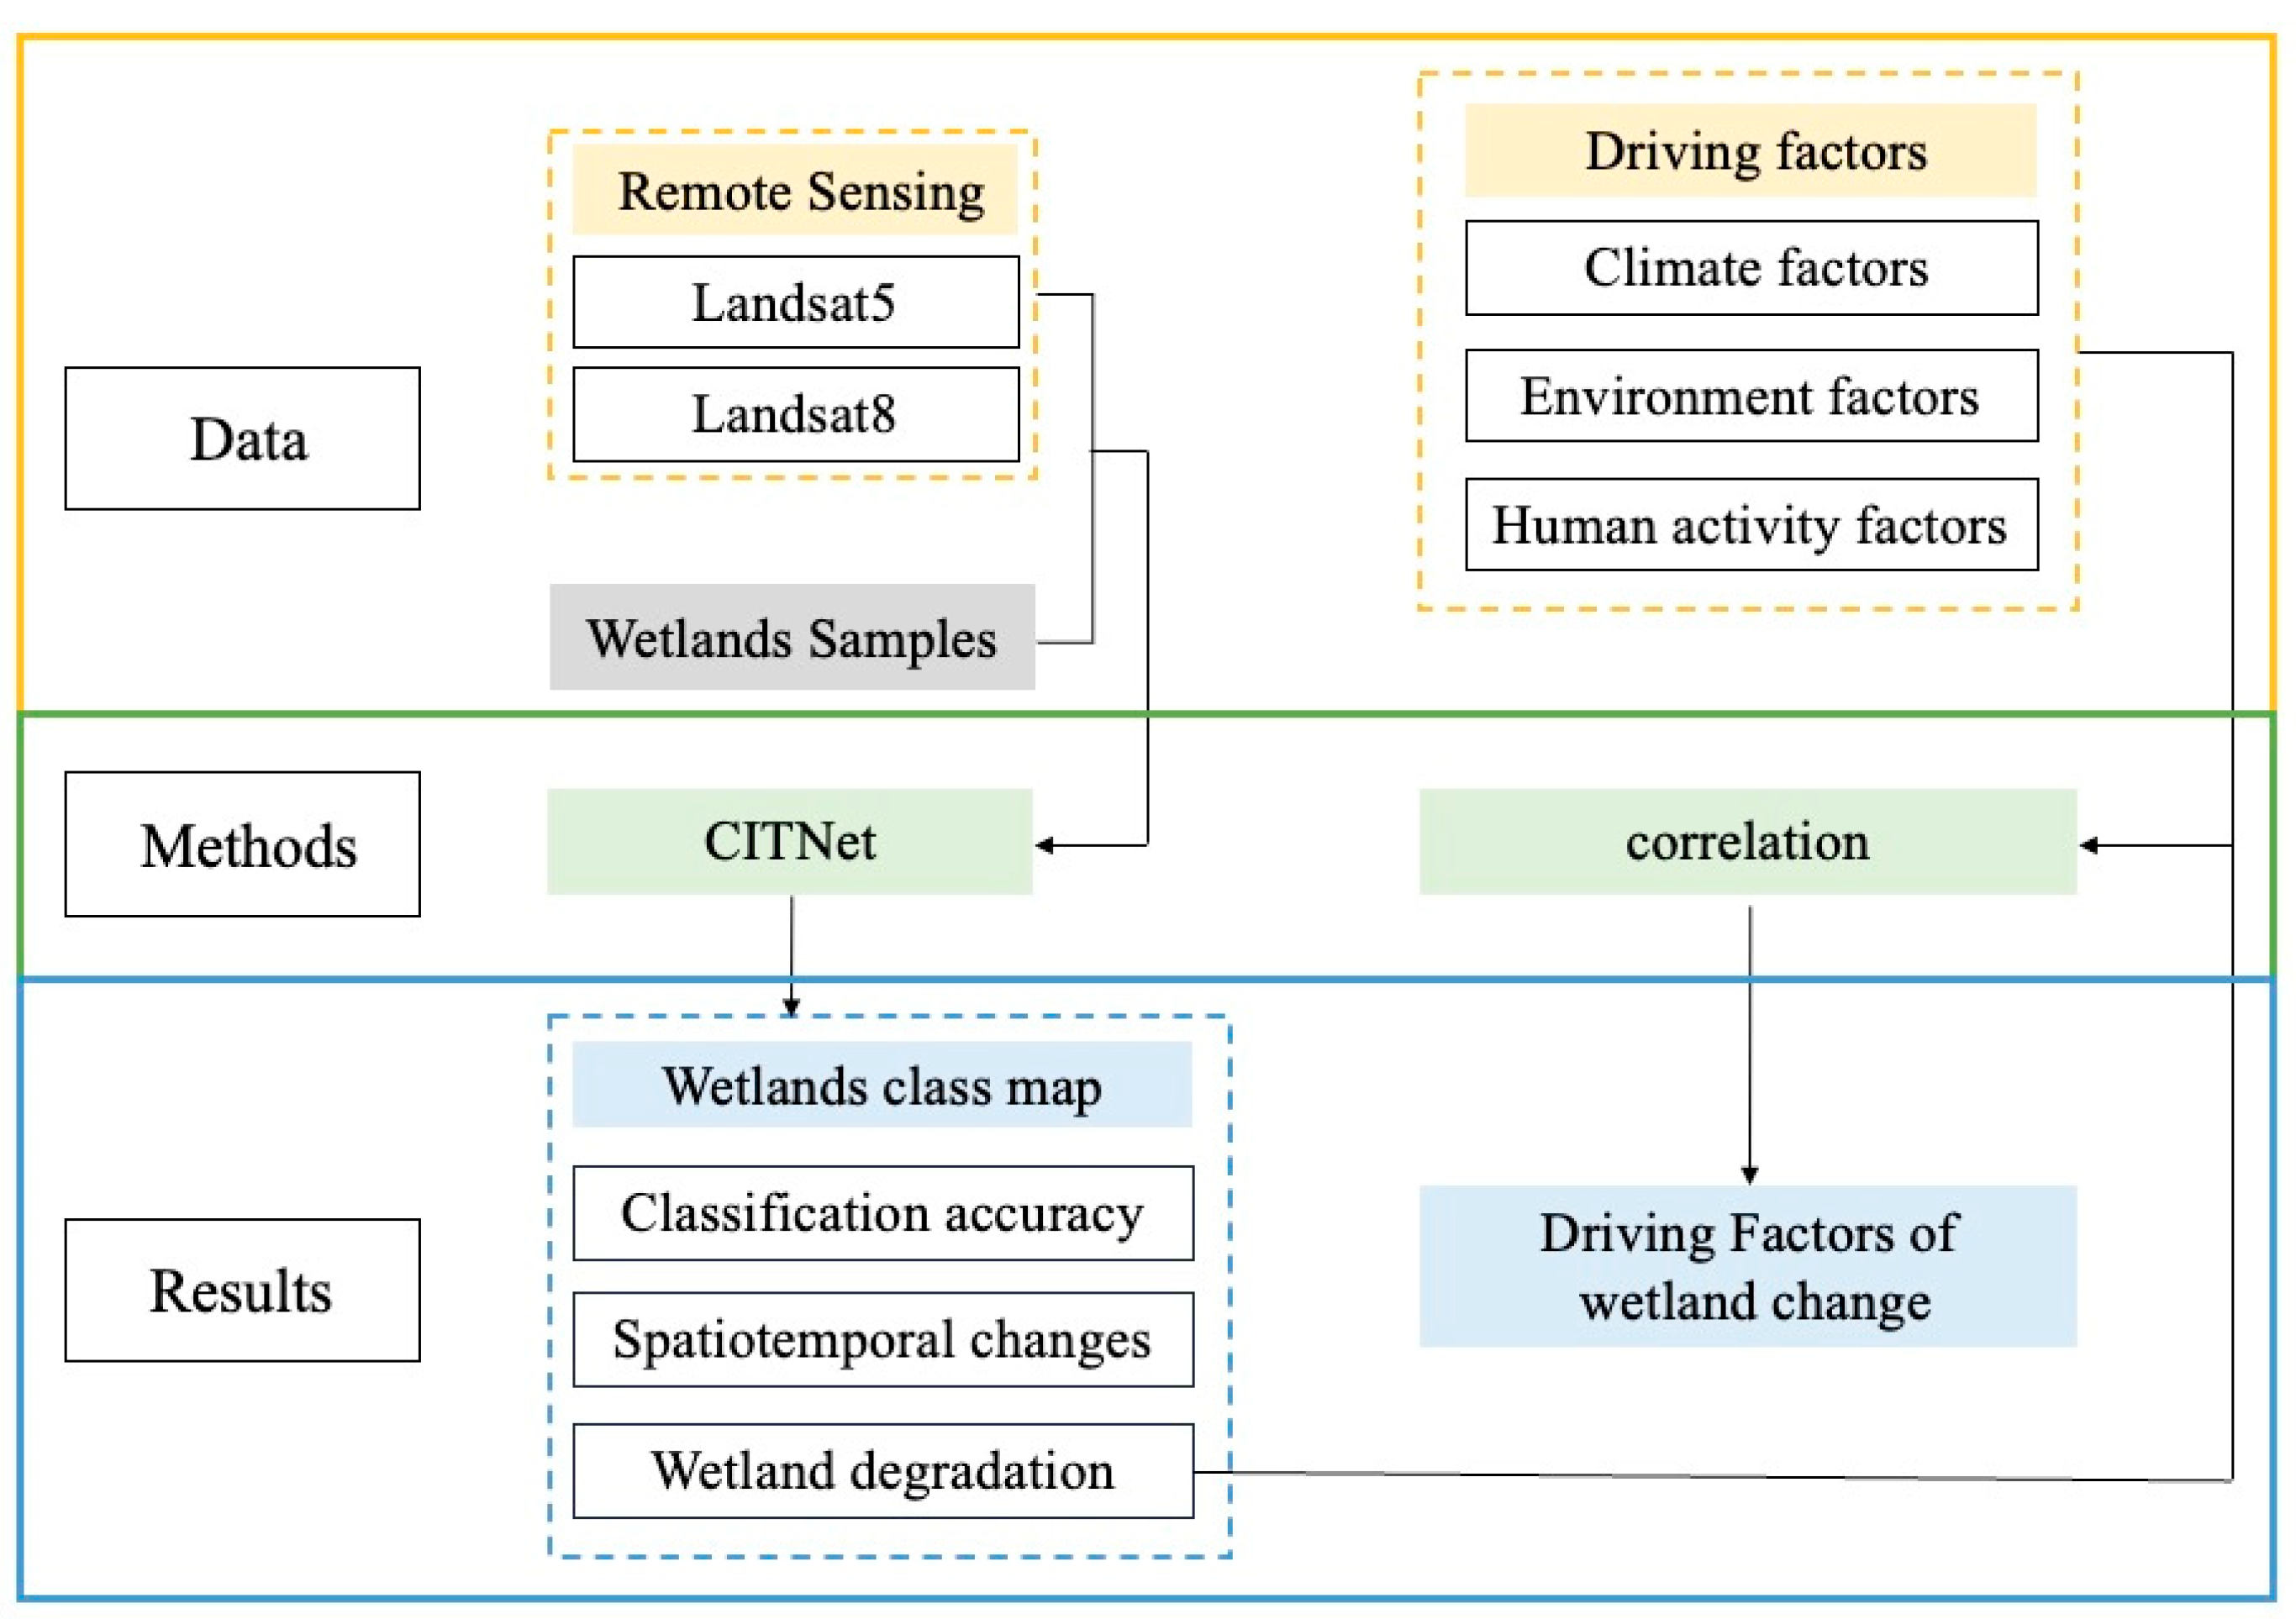
The overall technical workflow is illustrated in Figure 2. As shown, multi-source remote sensing data (Landsat 5 and Landsat 8 imagery) and multiple driving factor datasets (climatic, environmental, and human activity variables) are first collected and preprocessed. CITNet is then applied to produce high-resolution wetland classification maps along with quantitative accuracy assessments. As part of this workflow, CITNet was trained with 13 × 13 pixel patches (169 pixels), chosen to balance computational efficiency and accuracy while minimizing the effects of cloud edges and misregistration. Each labeled pixel produced one unique patch, resulting in more than one million samples across the study period. No rotation-based augmentation was applied, since at a 30 m resolution, rotations do not add meaningful variability and may introduce artifacts. Some class imbalance was present due to the natural dominance of farmland and water bodies, but this reflected the true land cover distribution and did not impair performance. For validation, the dataset was divided into non-overlapping spatial subsets (80% training, 20% validation), ensuring independence between the two sets and avoiding overestimation of accuracy. Finally, classification outputs were integrated with the driving factor datasets to analyze spatiotemporal changes in wetland extent, identify degradation patterns, and evaluate correlations between environmental and anthropogenic drivers.
All data analyses were conducted using MATLAB R2022b (MathWorks, Natick, MA, USA; https://www.mathworks.com) and Python 3.9 (Python Software Foundation, Wilmington, DE, USA; https://www.python.org). Spatial analyses and visualization were supported by ArcGIS 10.4 (Esri, Redlands, CA, USA; https://www.esri.com) and QGIS 3.28 (QGIS Development Team, Open Source Geospatial Foundation; https://qgis.org).

3. Results

3.1. Classification Accuracy

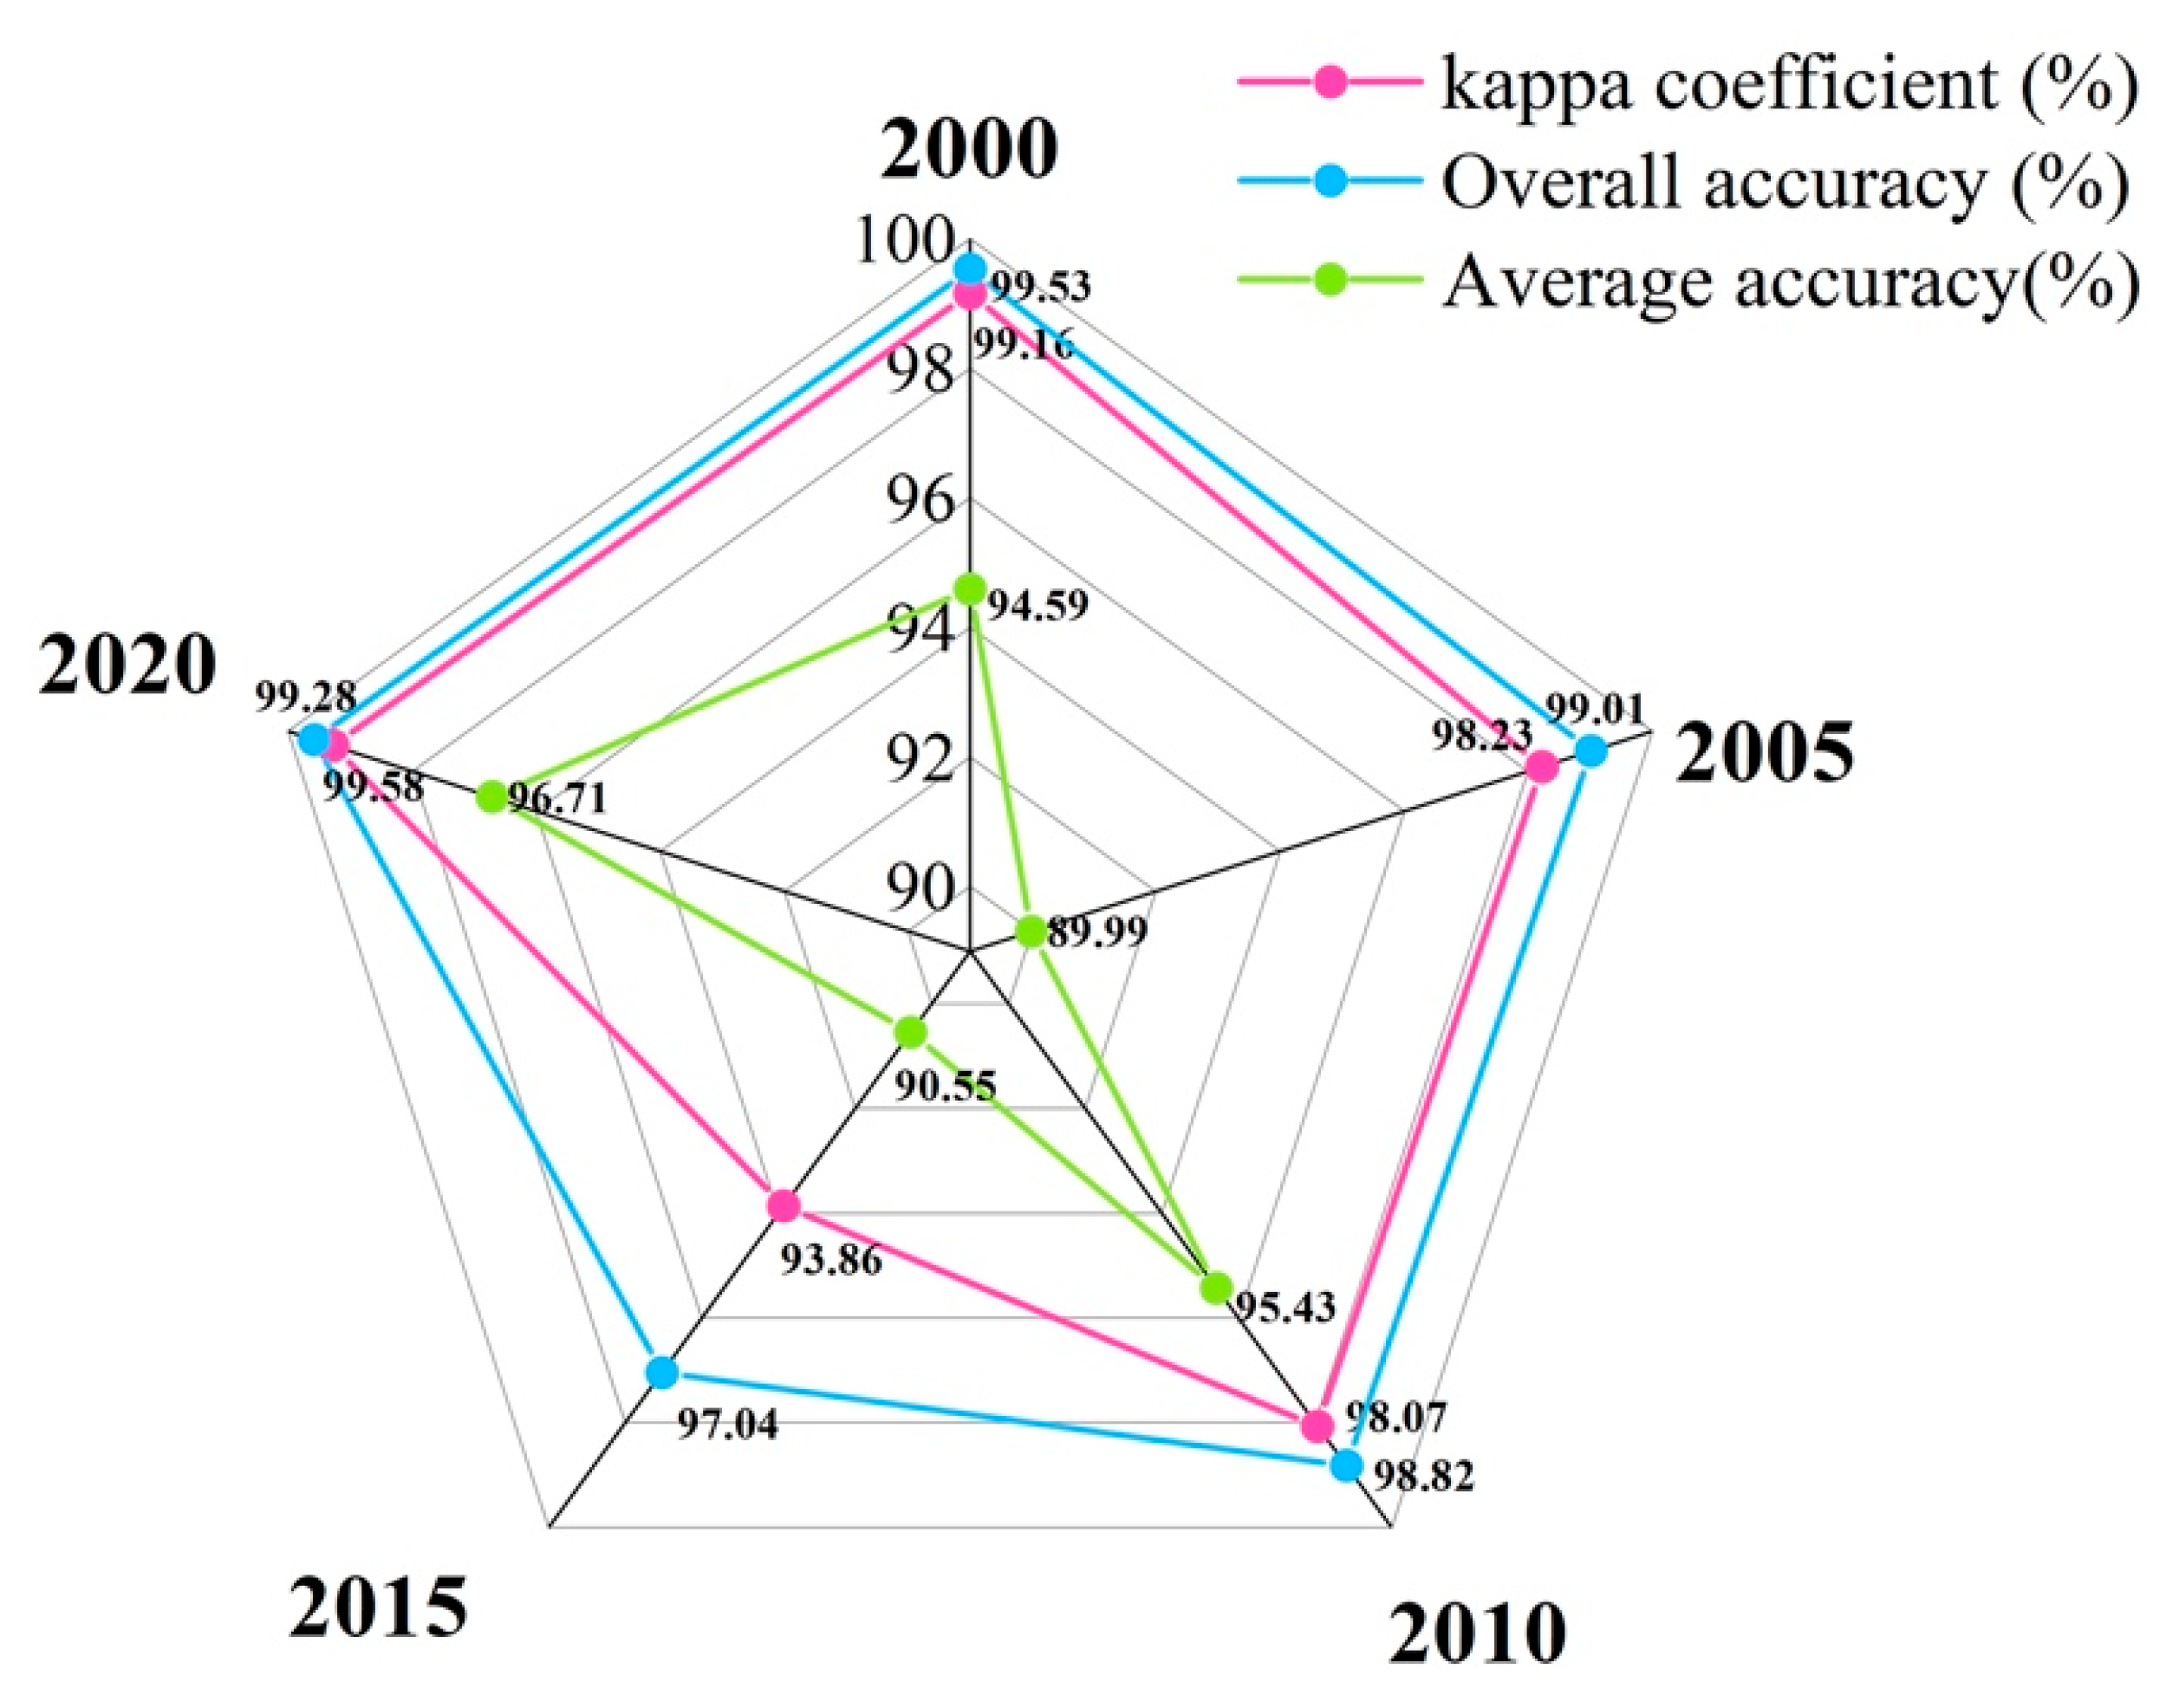
Using the six-class wetland classification system defined in Table 1, the CITNet-based mapping of Chongming Island wetlands from 2000–2020 achieved consistently high accuracy across all evaluation years (Figure 3). In all cases, the Kappa coefficient, overall accuracy (OA), and average accuracy (AA) exceeded 90%, confirming the model’s robust capability to distinguish both natural (mudflat, herbaceous marsh, and seawater zone) and artificial (pond, aquaculture pond, and river) wetland types.
As shown in Figure 3, classification performance peaked in 2000 with a Kappa of 99.53%, OA of 99.16%, and AA of 94.59%. A slight decline occurred in 2005 (99.01%, 98.23%, and 89.99%), followed by a recovery in 2010 (98.82%, 98.07%, and 95.43%). The lowest values were recorded in 2015 (93.86%, 97.04%, and 90.55%), likely reflecting limitations in available mid-to-low tide imagery that year. By 2020, accuracy rebounded to near peak levels (99.28%, 99.38%, and 96.71%). Overall, the metrics illustrate only modest fluctuations over two decades, with all values above the 90% threshold. This stability demonstrates the method’s adaptability to interannual variations in imagery quality, tidal stage, and spectral conditions, ensuring reliable long-term monitoring of wetland changes on Chongming Island.

3.2. Spatiotemporal Changes in Wetlands on Chongming Island

3.2.1. Temporal Dynamics of Wetland Area

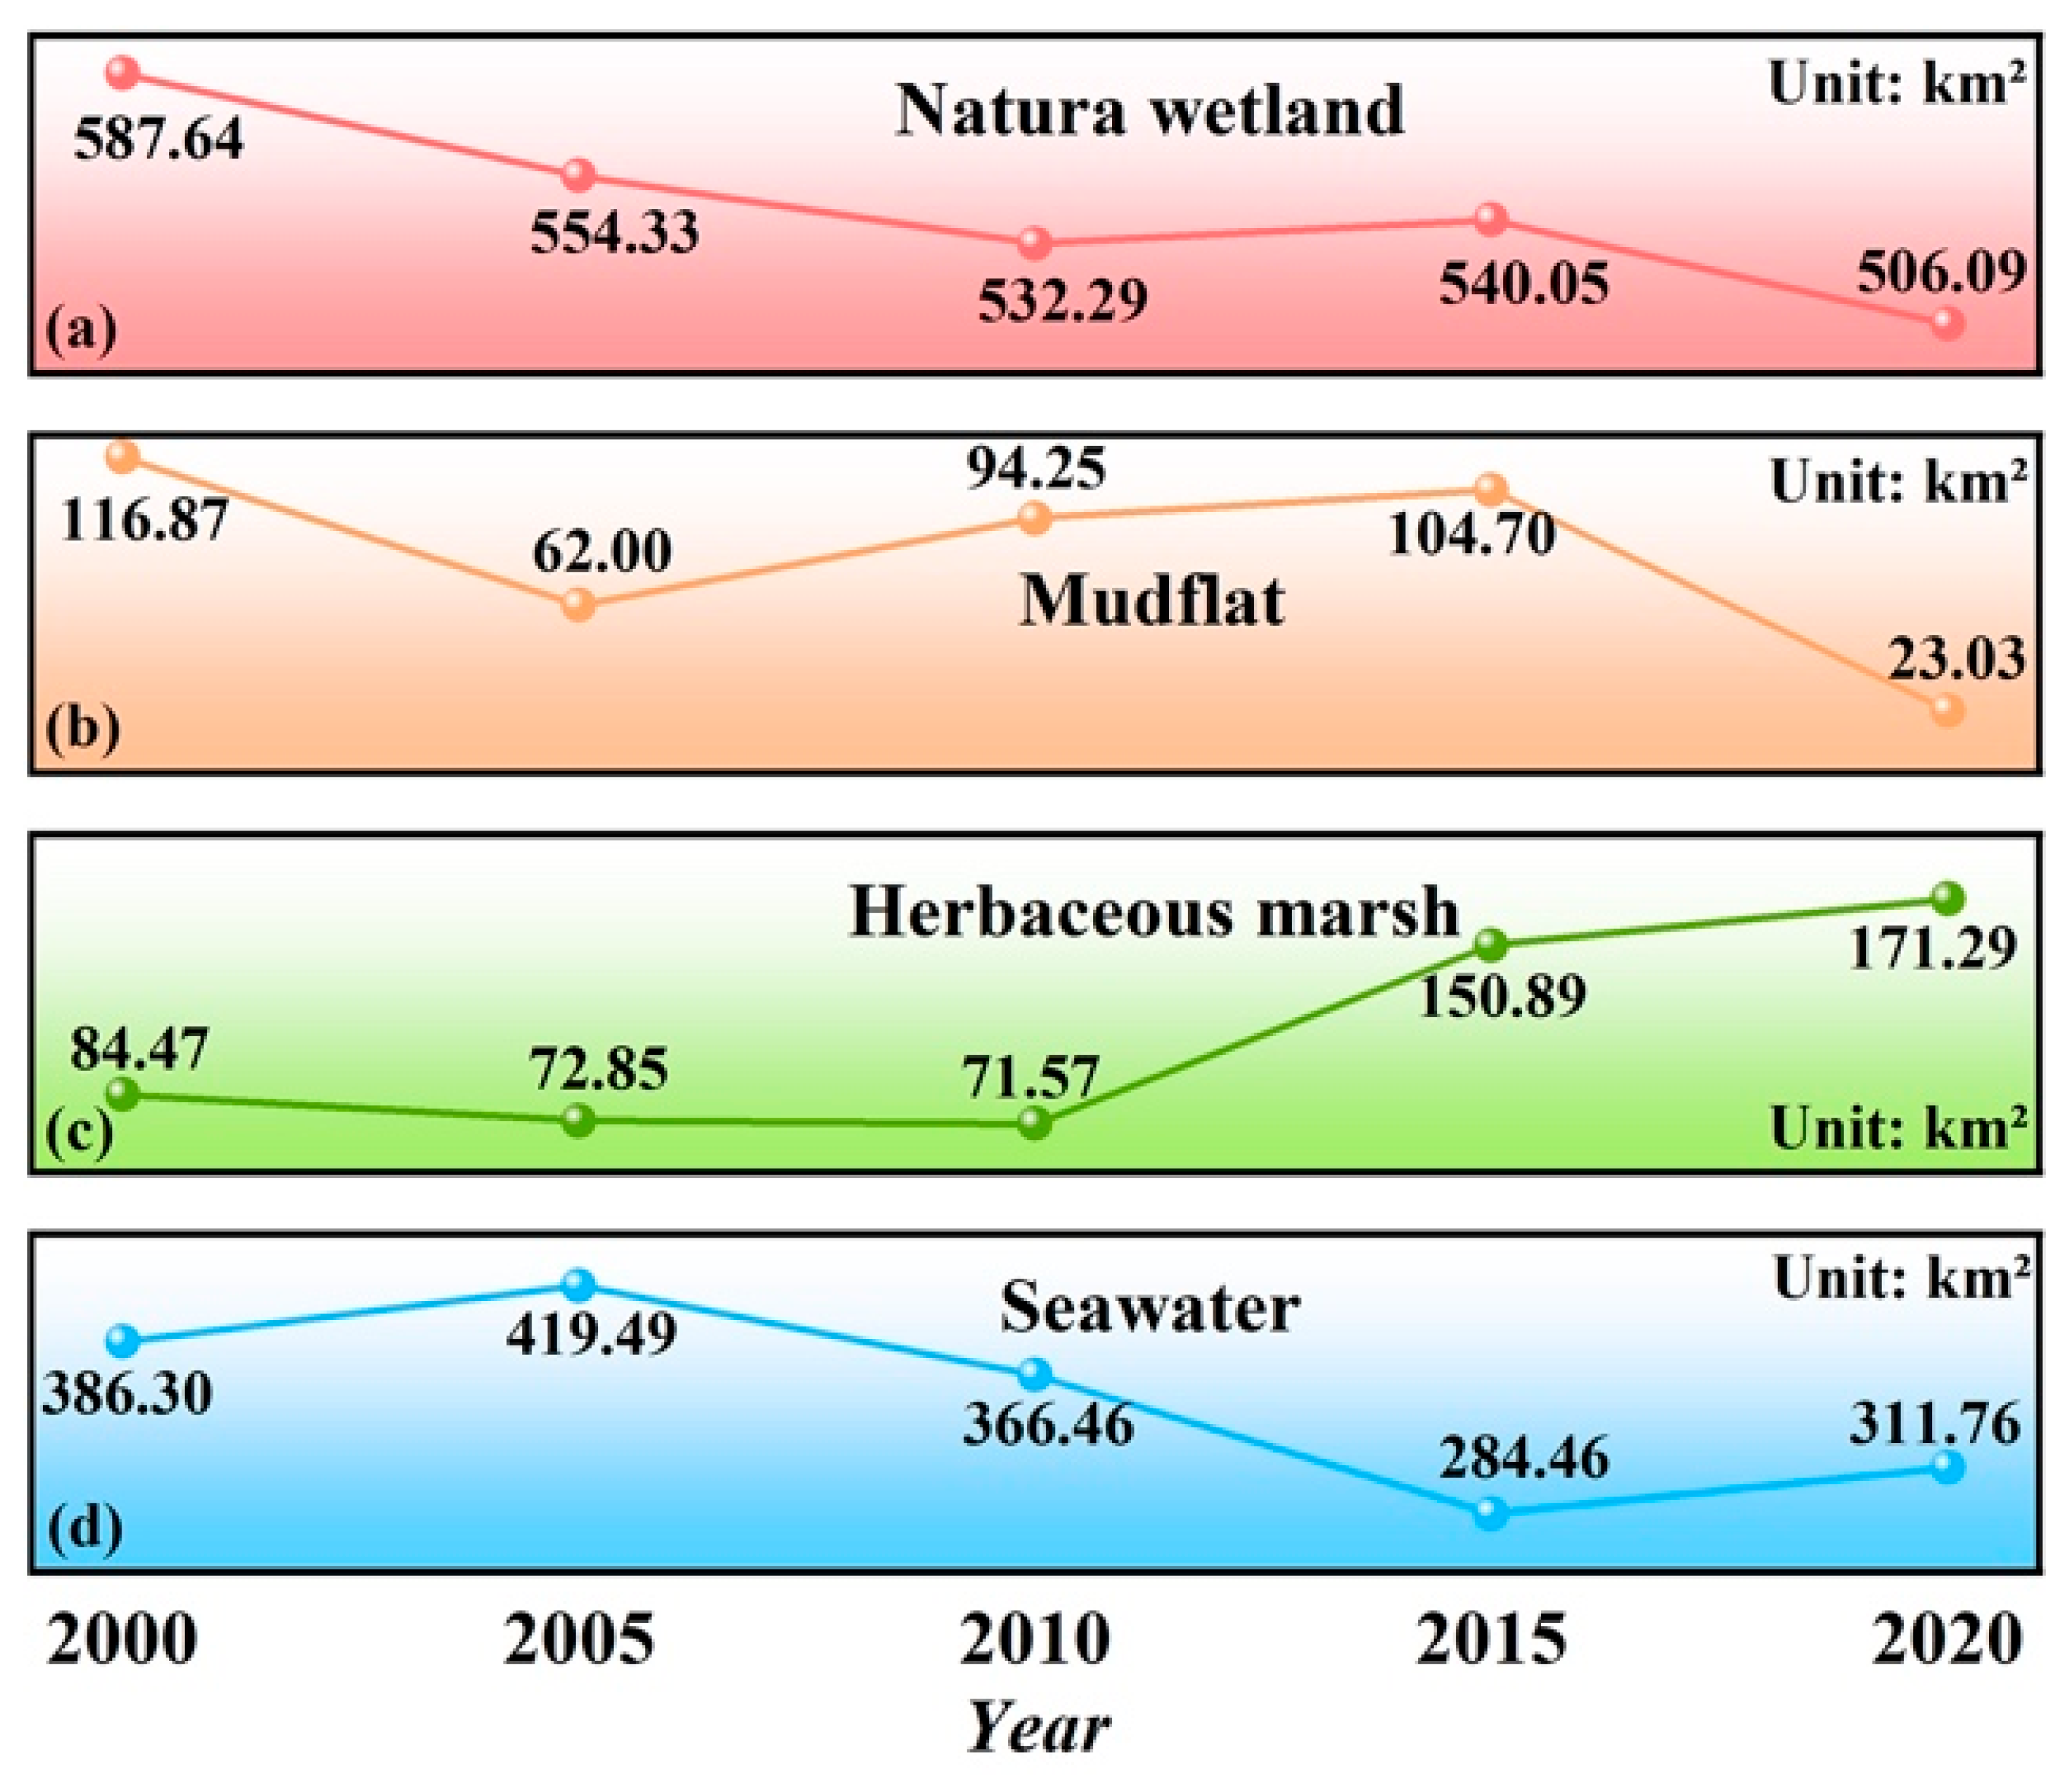
From 2000–2020, Chongming Island’s wetland composition changed significantly, as illustrated in Figure 4 and Figure 5. The total area of natural wetlands decreased from 587.64 km2 in 2000 to 506.09 km2 in 2020, averaging a loss of about 20 km2 per five-year interval. Within this category, subtypes showed contrasting trends. Mudflats experienced the steepest decline, shrinking from 116.87 km2 to 23.03 km2 for an overall reduction of nearly 80% despite a brief recovery around 2010–2015. This loss is closely linked to large-scale land reclamation, coastal engineering works, and the encroachment of Spartina alterniflora, which converted open intertidal flats into vegetated marshes or reclaimed land. In contrast, herbaceous marshes more than doubled in extent, increasing from 84.47 km2 to 171.29 km2, with most of the expansion occurring after 2010. This growth is likely associated with vegetation colonization following reduced reclamation activities, as well as targeted ecological restoration projects. The seawater zone decreased from 386.30 km2 to 311.76 km2, reflecting habitat conversion to other wetland types or terrestrial land uses, although a modest rebound between 2015 and 2020 suggests localized restoration or reduced disturbance in certain coastal sectors.
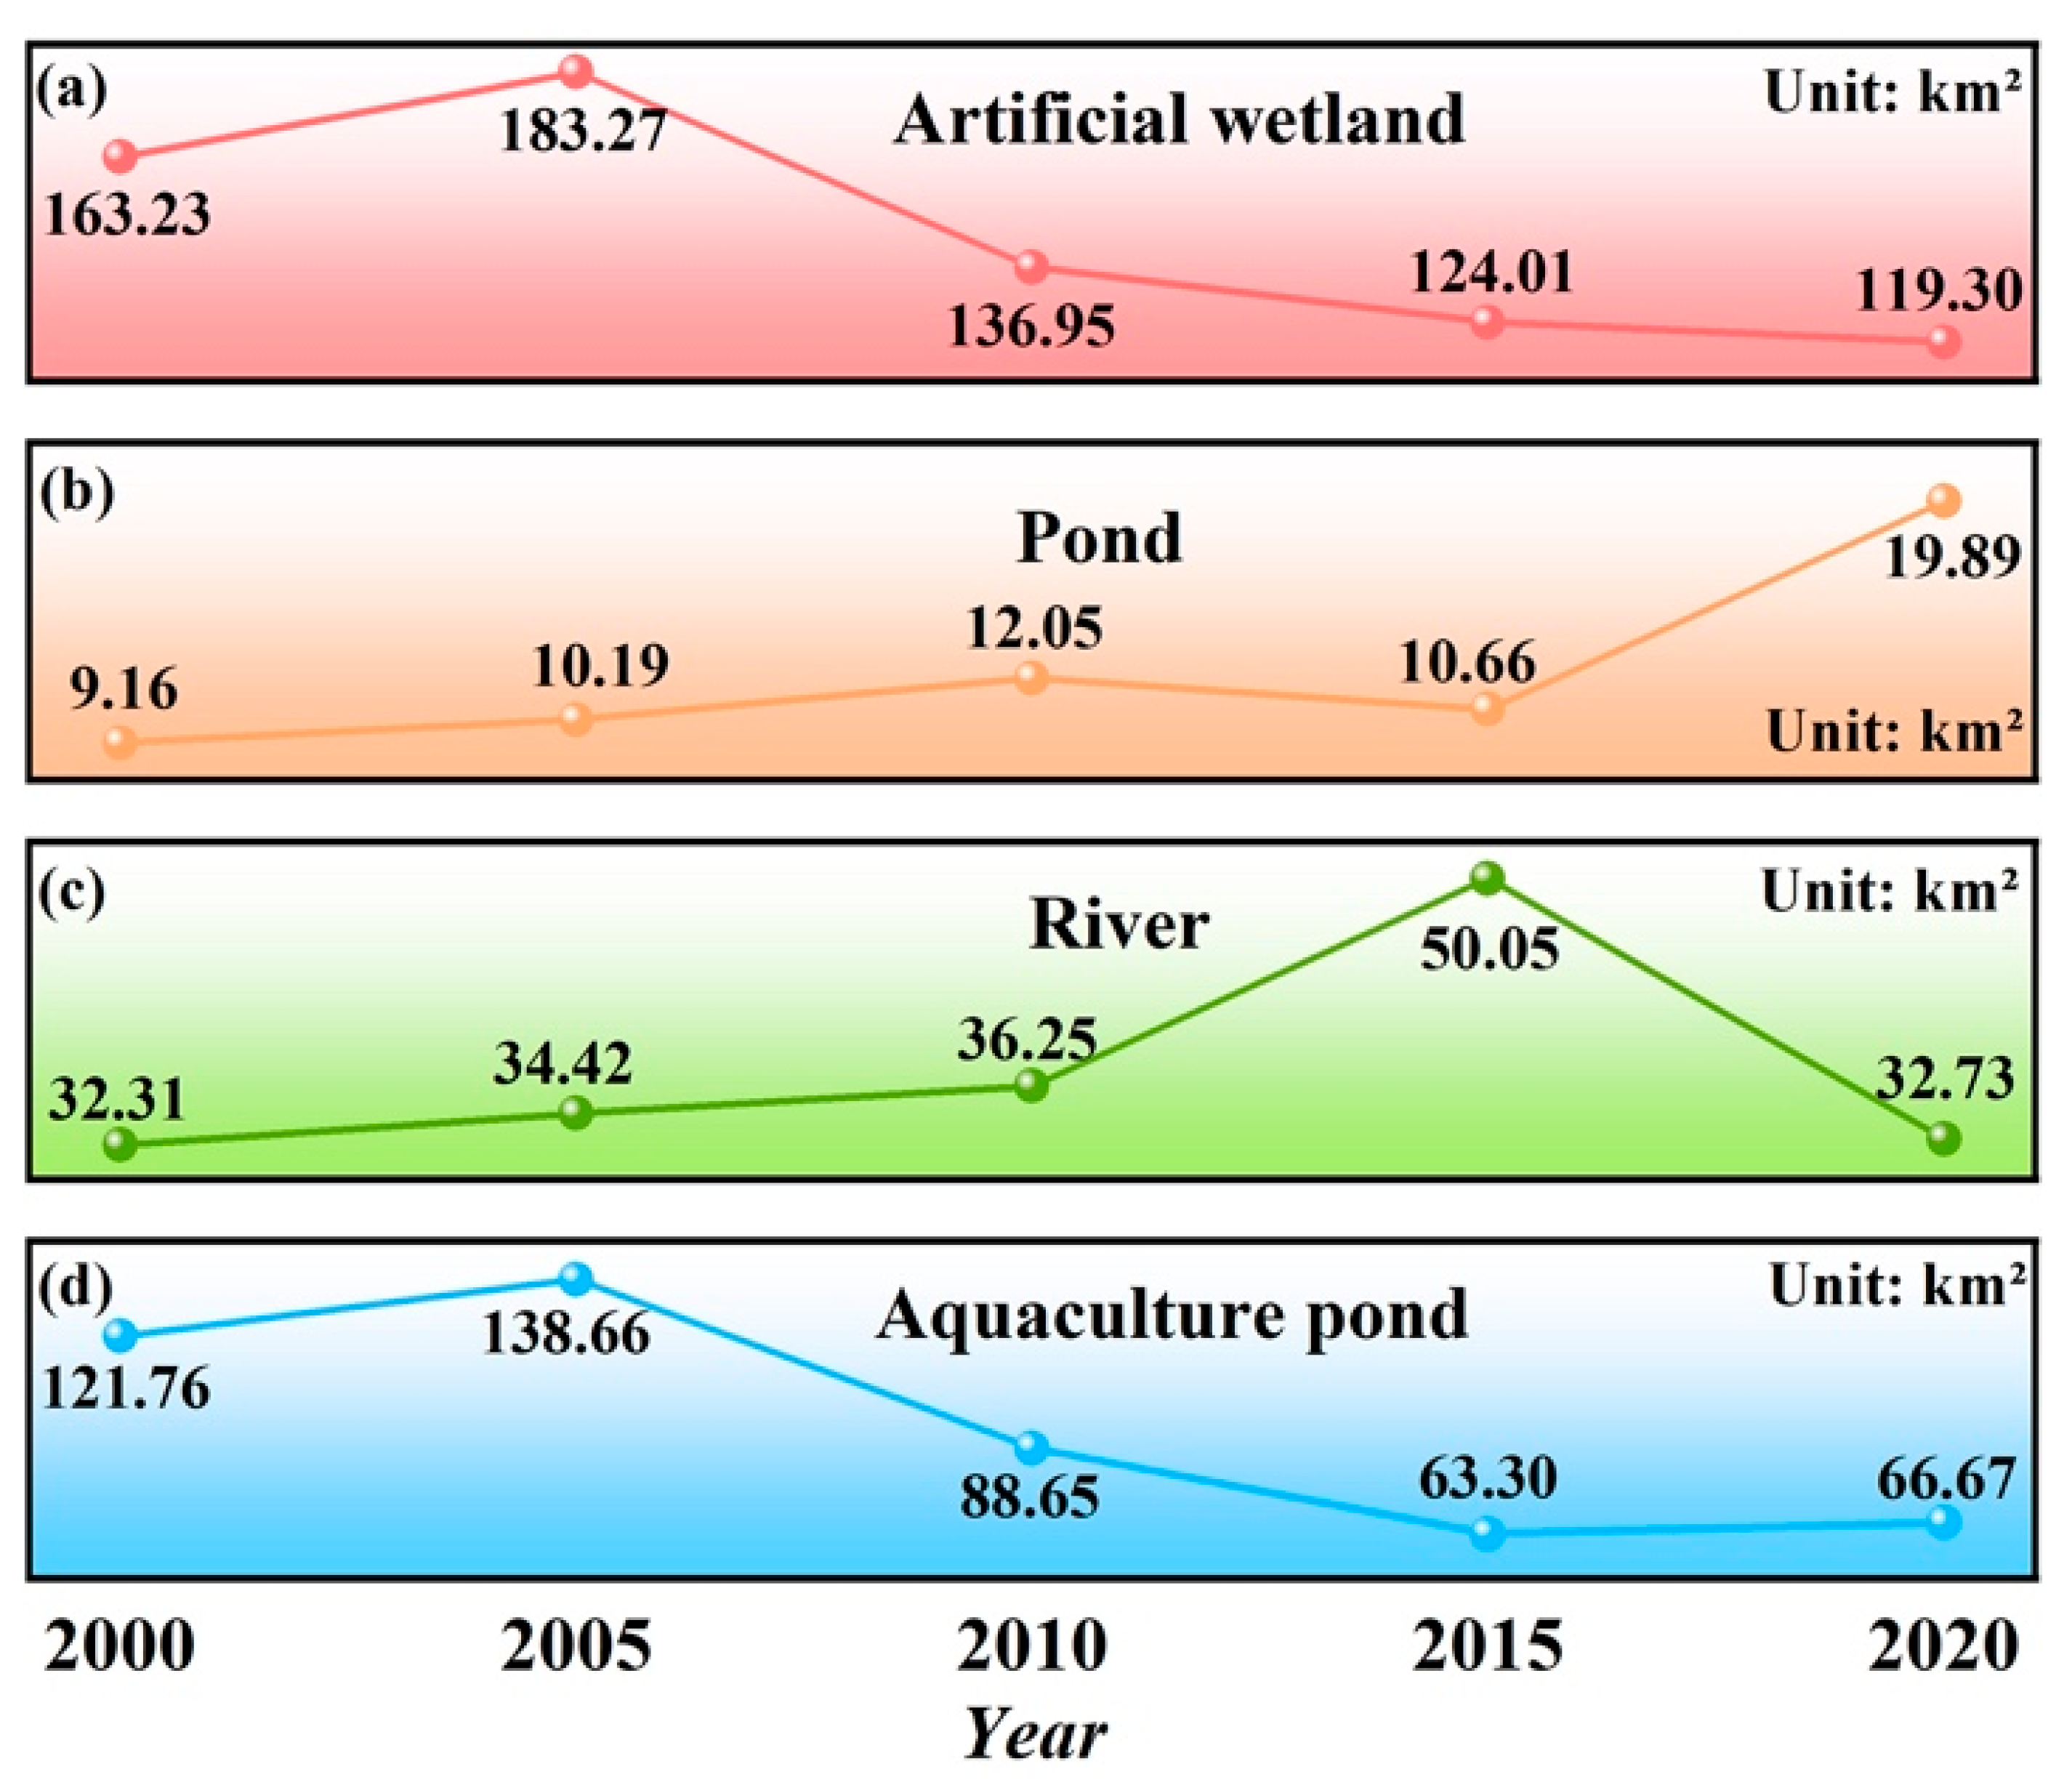
Artificial wetlands also declined overall, from 163.23 km2 in 2000 to 119.30 km2 in 2020. This trend was largely driven by the reduction in aquaculture ponds, which expanded to a peak of 138.66 km2 in 2005 before steadily decreasing to 66.67 km2 by 2020. The contraction of aquaculture ponds may reflect shifts in economic activities, stricter environmental regulations, and the conversion of aquaculture areas back to natural wetland or other land uses. In contrast, general ponds nearly doubled in area, from 9.16 km2 to 19.89 km2, likely due to the construction of new freshwater and storage ponds for agriculture and urban water supply. Riverine wetlands showed fluctuations without a consistent trend, rising from 32.31 km2 in 2000 to a high of 50.05 km2 in 2015, then returning to 32.73 km2 by 2020, with these changes possibly influenced by river channel modifications, hydrological engineering, and seasonal flow variability. Collectively, these trends highlight the combined influence of human interventions such as reclamation, aquaculture expansion/contraction, and restoration initiatives and natural processes, including vegetation succession and hydrodynamic changes, in shaping the spatial dynamics of Chongming’s wetlands over the past two decades.
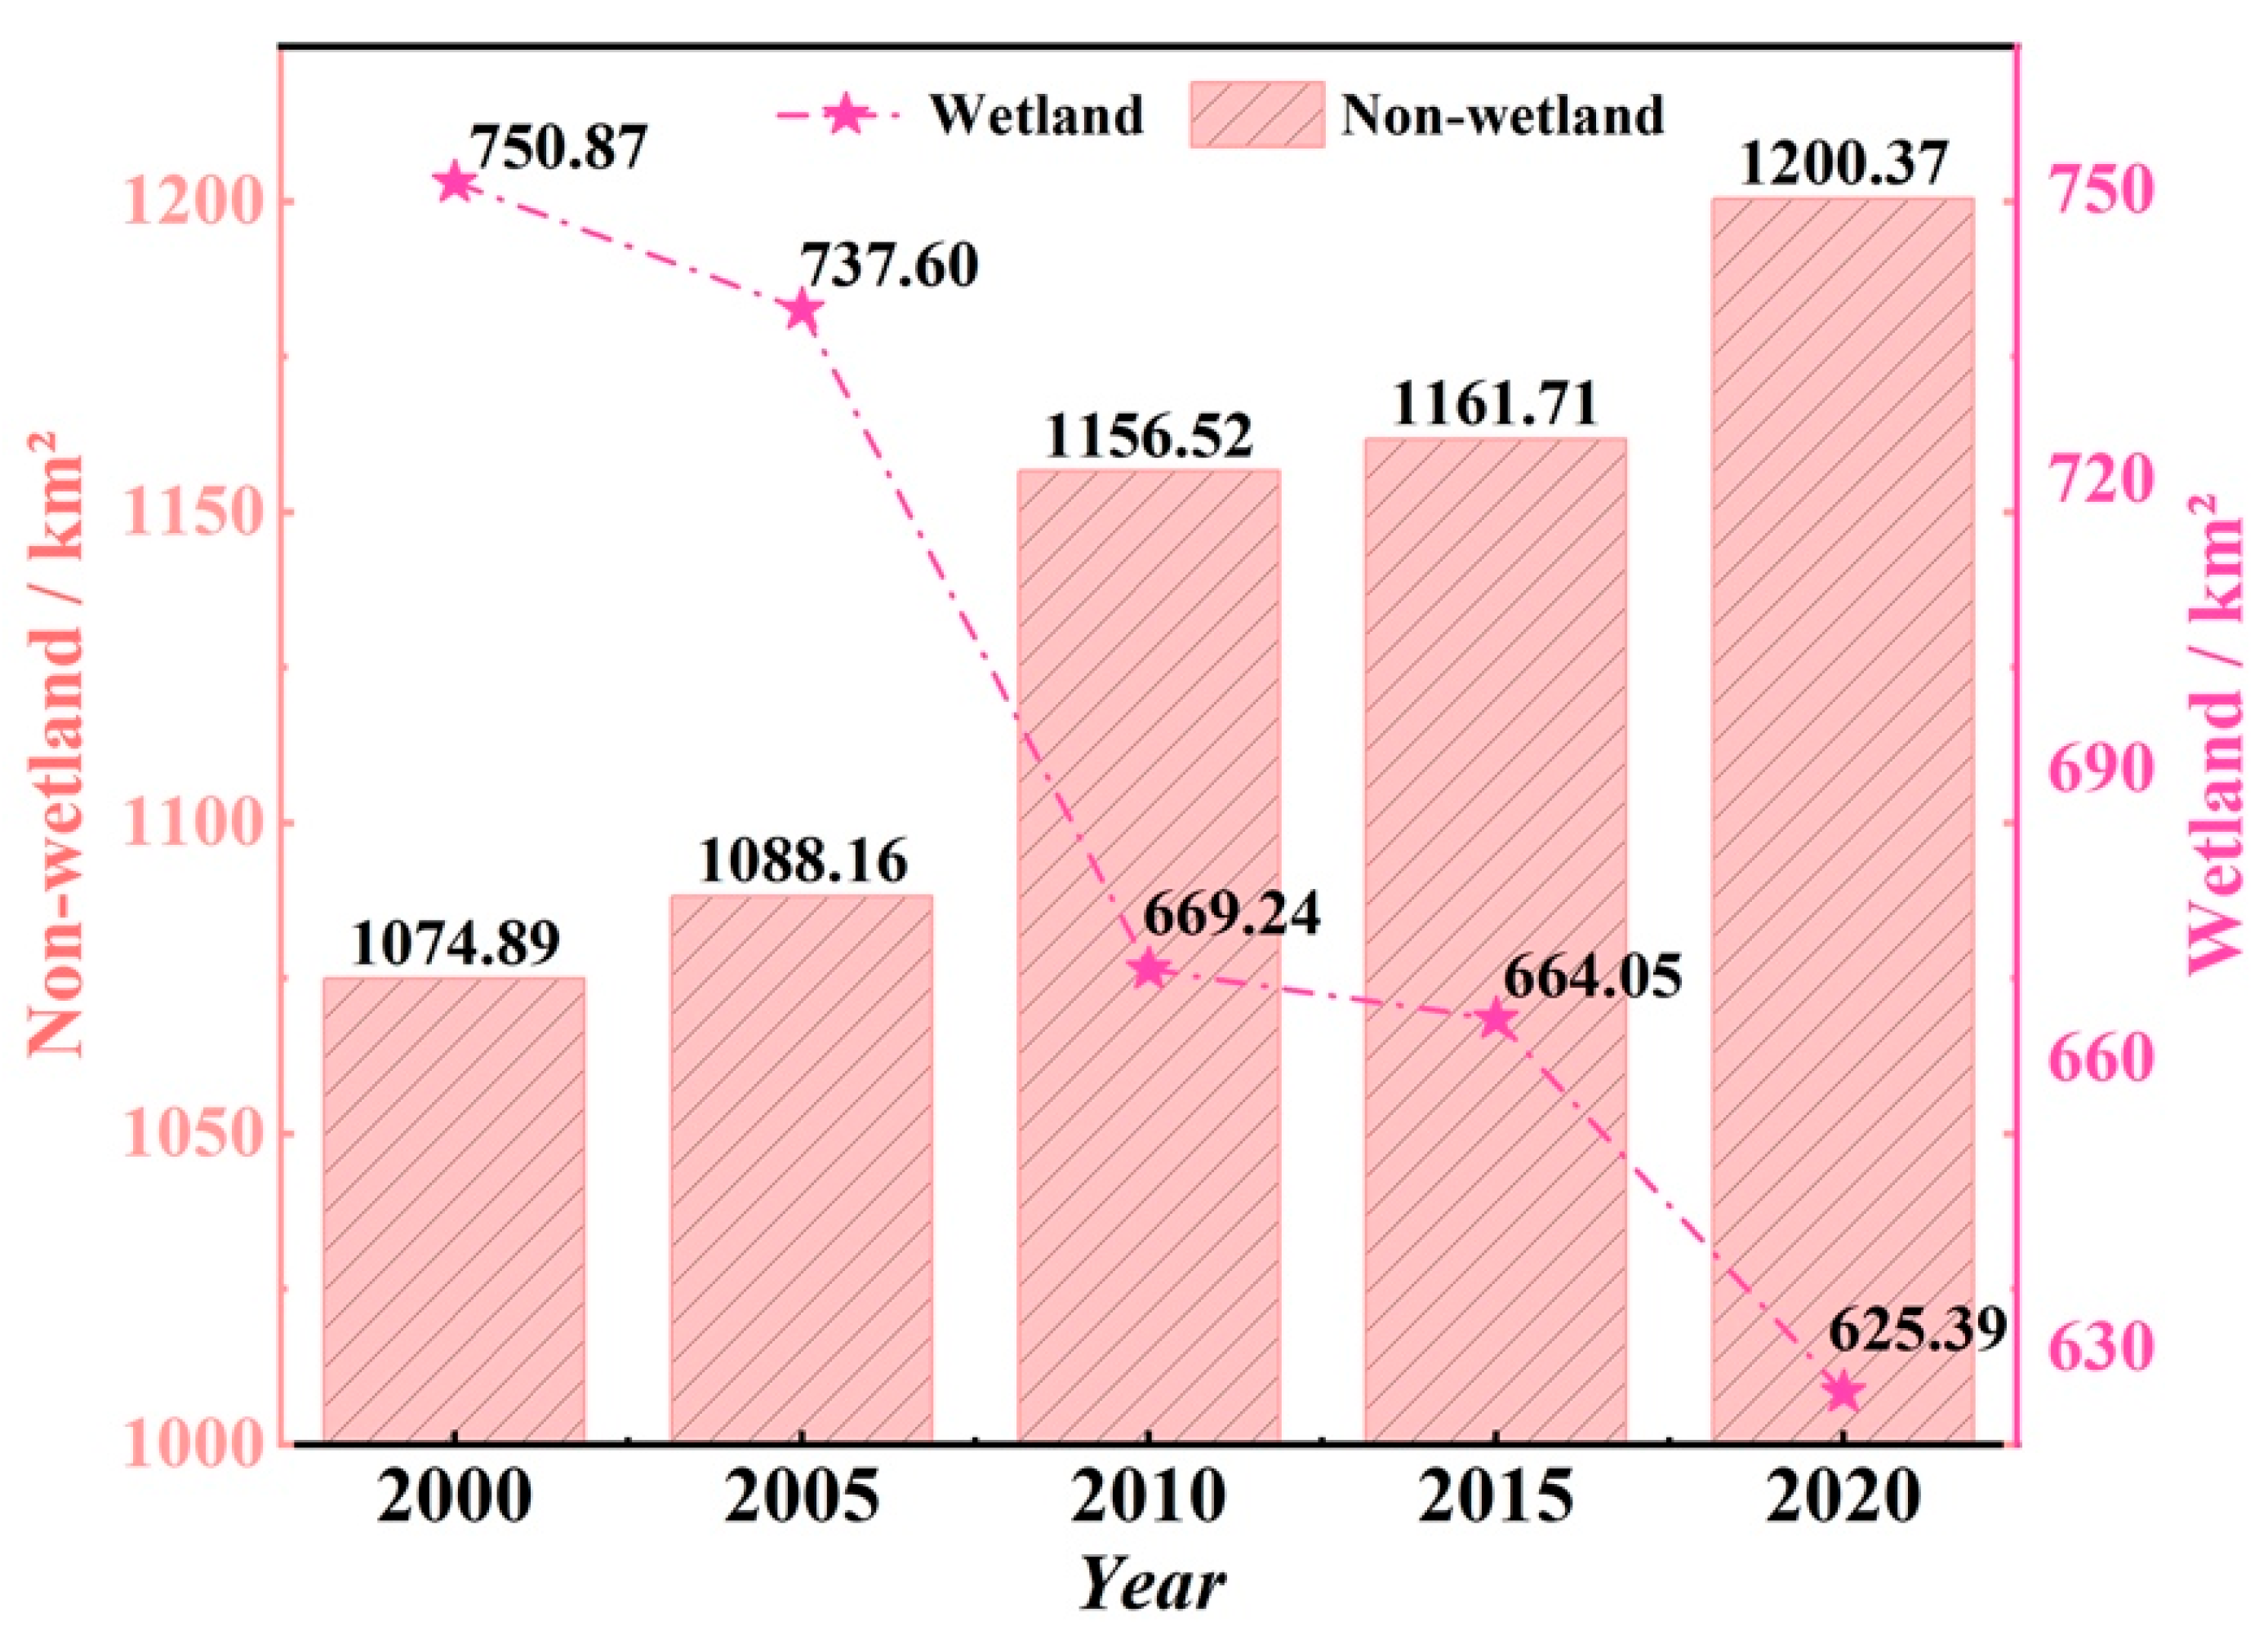
As shown in Figure 6, Chongming Island’s total wetland area declined from 750.87 km2 in 2000 to 625.39 km2 in 2020, representing a net loss of approximately 125.5 km2 (16.7%). This reduction was mirrored by a nearly equivalent increase in non-wetland (terrestrial) area, which grew from 1074.89 km2 to 1200.37 km2, indicating a sustained conversion of wetland to upland habitats or built-up land.
The decline was not uniform, with distinct trends in four phases:
(1) 2000–2005: Wetland area decreased moderately by 13.27 km2 (−2.65 km2/year). Losses were concentrated in natural wetlands, particularly tidal mudflats, due to localized reclamation and early-stage development along the island’s coast. However, this was partially offset by the expansion of artificial wetlands, especially aquaculture ponds, which grew in response to rising demand for aquaculture production. The net effect was a relatively mild reduction in total wetland extent.
(2) 2005–2010: The period experienced the most severe decline, during which the wetland area contracted by 68.36 km2, averaging a reduction of about 13.67 km2 annually. Both natural wetlands (mudflats, open tidal waters) and artificial wetlands (aquaculture ponds) contracted sharply. This trend corresponds to the recorded peak of reclamation efforts in the Yangtze Estuary, a time when extensive intertidal flats and aquaculture ponds were transformed into farmland, infrastructure zones, and urban developments. Intensive land-use change during this phase accounted for more than half of the total 20-year wetland loss.
(3) 2010–2015: The rate of loss slowed markedly, with only a 5.19 km2 decrease (−1.04 km2/year). Natural wetlands showed a modest recovery, driven by herbaceous marsh expansion and limited mudflat regeneration, likely linked to sediment deposition, reduced reclamation intensity, and the initiation of ecological restoration projects. At the same time, artificial wetlands, particularly aquaculture ponds, continued to decline due to abandonment, policy-driven conversion, and reduced economic returns. Gains in natural wetlands largely balanced losses in artificial wetlands, resulting in a near-stable total wetland extent.
(4) 2015–2020: Losses accelerated again to 38.66 km2 (−7.73 km2/year), dominated by an approximately 81 km2 collapse in mudflat area. This drastic reduction was likely caused by large-scale coastal engineering, ongoing reclamation, and possibly storm-induced erosion. Although herbaceous marshes and open water zones expanded partly due to vegetation succession and the conversion of some mudflats to shallow sea, their gains could not offset the scale of mudflat loss. Artificial wetlands continued a gradual decline, reflecting persistent conversion pressures.
In summary, the total wetland trajectory corresponds closely to the subcategory patterns in Figure 4 and Figure 5. Periods of rapid total loss (2005–2010, 2015–2020) coincide with simultaneous declines in multiple wetland types, whereas stability (2010–2015) arises from compensating gains and losses within categories. Despite intermittent recovery in certain wetland types, the prevailing long-term trend is one of sustained wetland attrition driven primarily by reclamation, aquaculture transformation, and coastal erosion, underscoring the need for strengthened conservation and adaptive management.

3.2.2. Spatial Dynamics of Wetland Distribution

In this section, we examine both the temporal and spatial dynamics of wetlands on Chongming Island, based on classification results from 2000 to 2020.
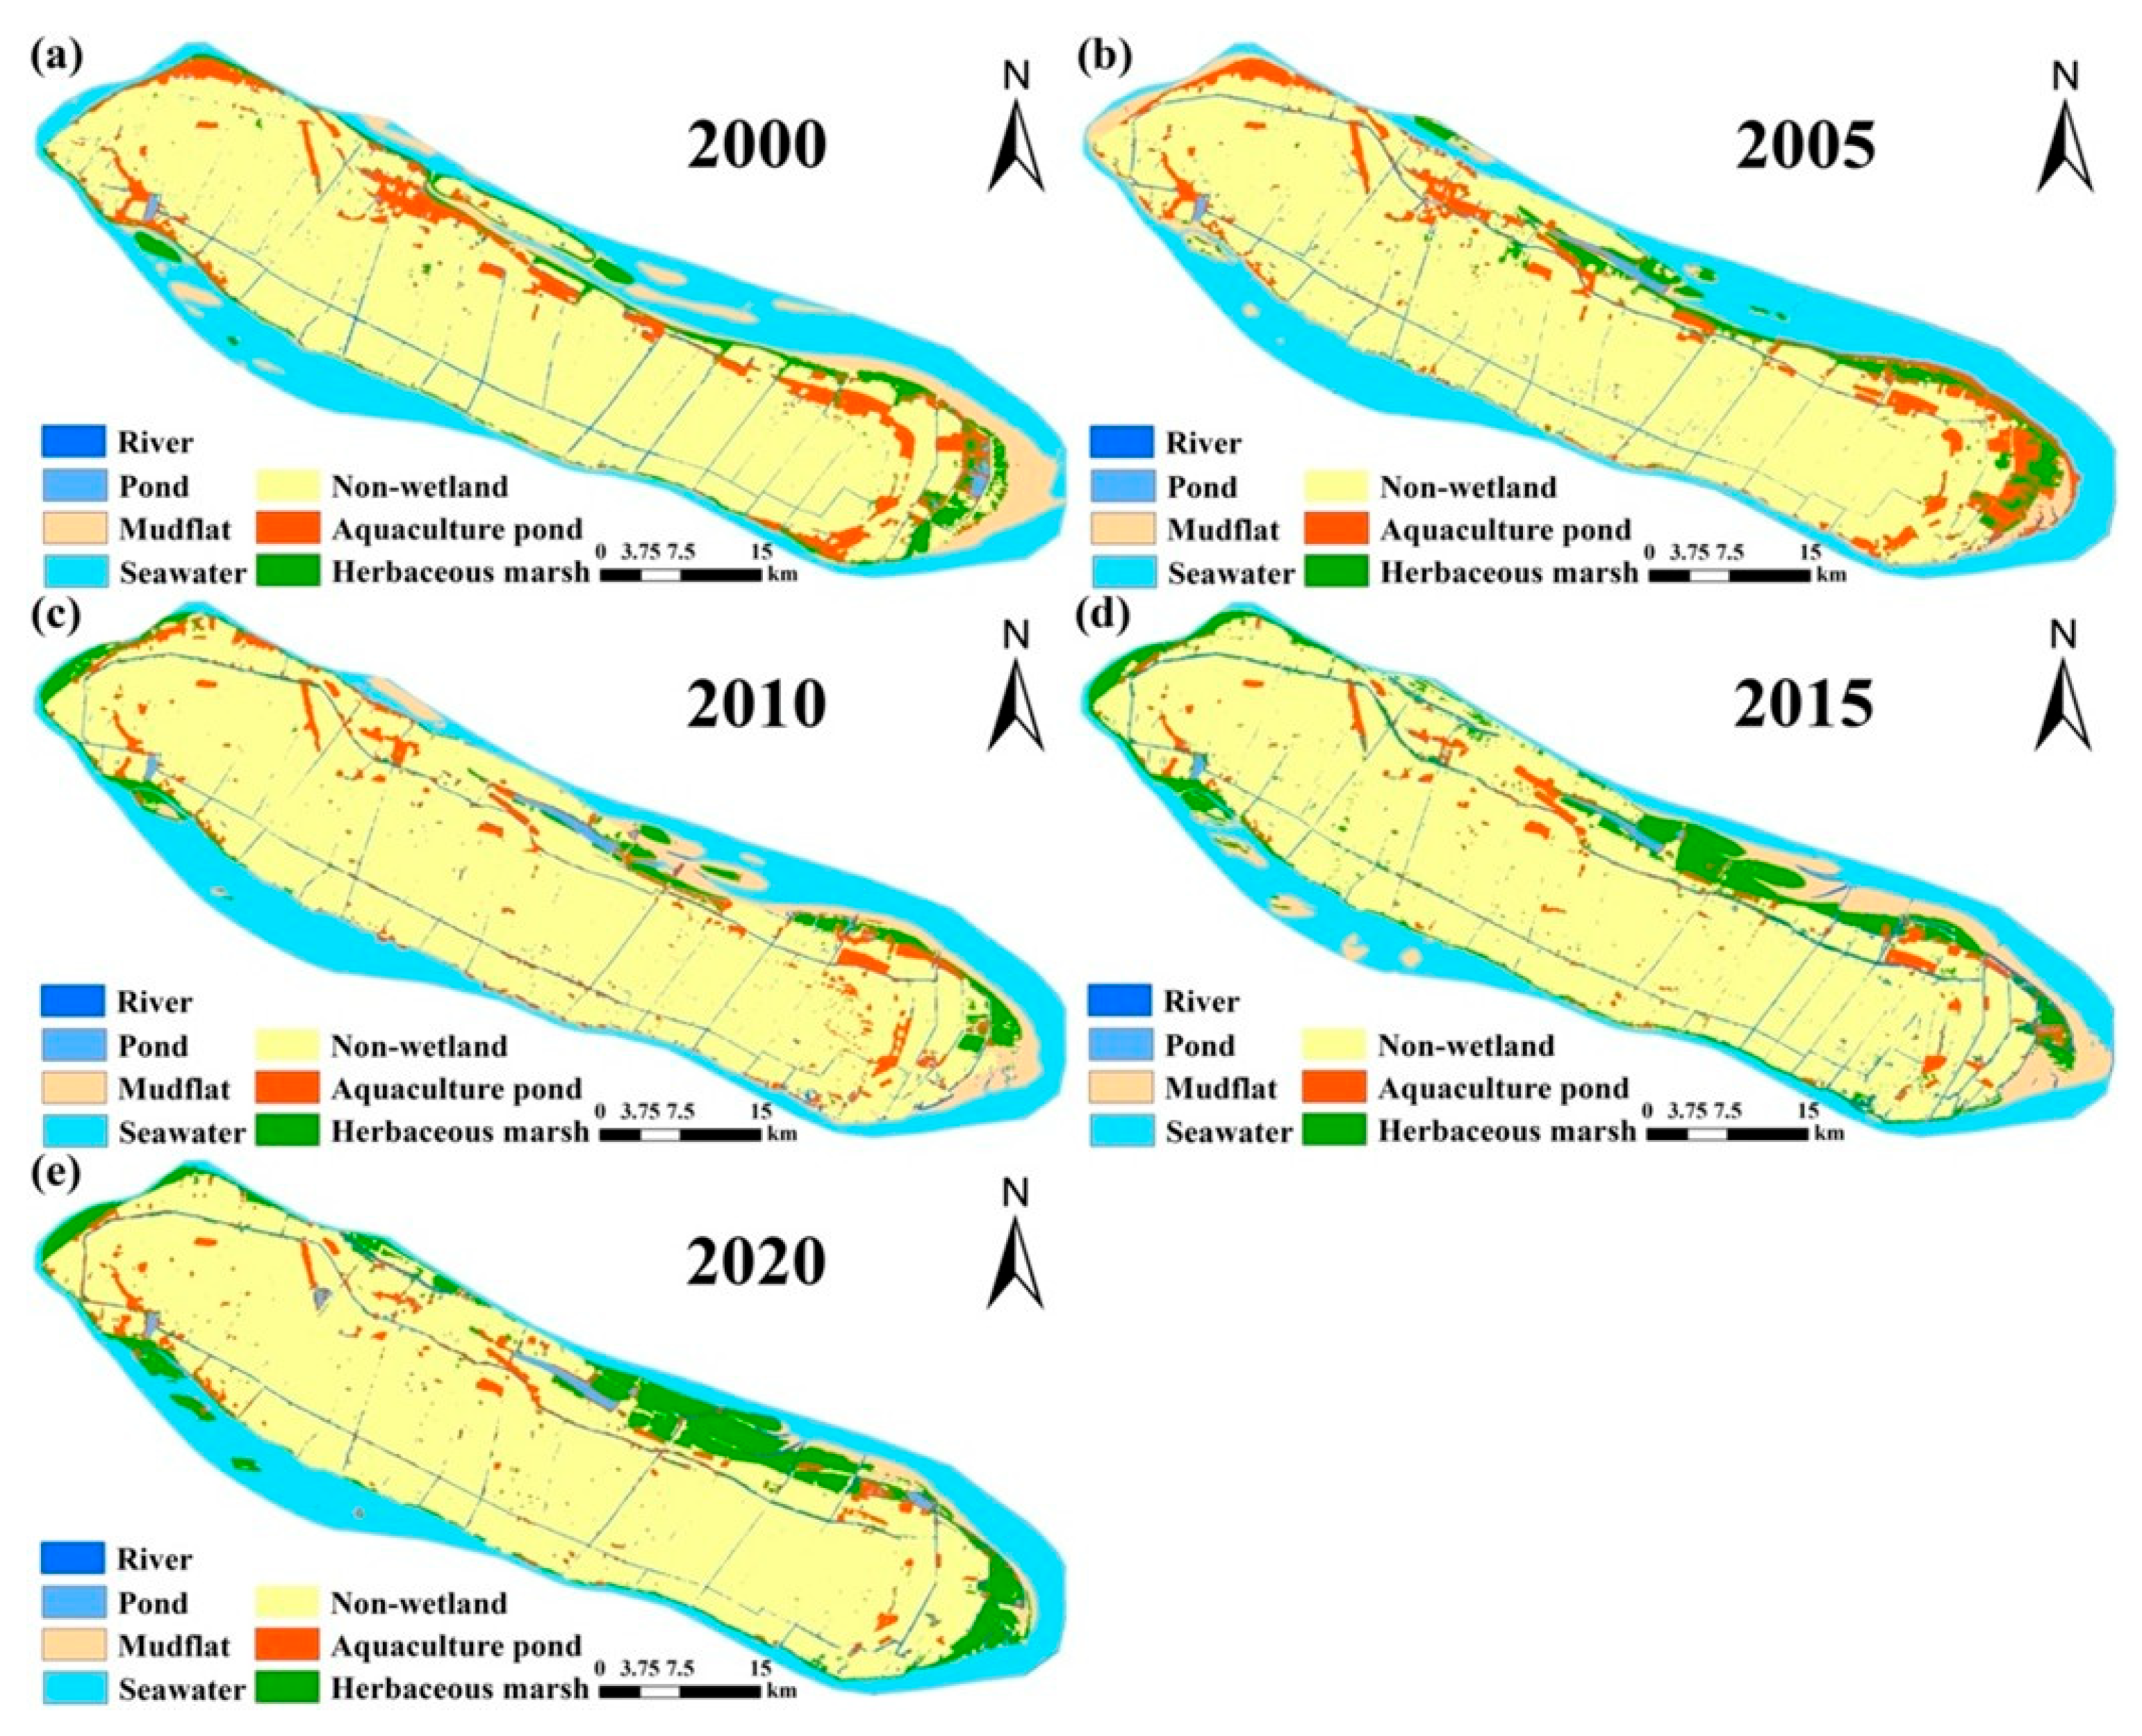
Figure 7 illustrates the spatial distribution and transformation of natural and artificial wetlands on Chongming Island from 2000–2020. Natural wetlands show clear regional differentiation, with most concentrated along the island’s coastal ecotone. Over the two decades, pronounced shrinkage occurred in the northwest, largely due to reclamation and shoreline modification, while localized expansion was observed in the north central sector. Herbaceous marshes displayed the most dynamic and directional spread: initially (2000–2005) restricted mainly to the northern and eastern coasts, they extended westward to the island’s western shore by 2010, formed extensive contiguous patches in the north-central region by 2015, and advanced eastward toward nearshore marine areas by 2020. This progression reflects both natural vegetation succession over former mudflats and targeted restoration activities in certain coastal zones.
Mudflats remained largely concentrated along the northern and eastern tidal flats. However, under combined pressures of reclamation (direct conversion to non-wetland) and ecological succession (replacement by herbaceous marsh), their spatial extent contracted steadily, leaving only a narrow residual strip in the northeast by 2020. In the western coastal waters, a successional sequence from seawater to mudflat to herbaceous marsh was evident, whereas in northern nearshore areas, reclamation bypassed intermediate stages, directly converting seawater to terrestrial land uses. These contrasting pathways highlight how both gradual ecological processes and abrupt human interventions reshape coastal wetland structure.
Artificial wetlands exhibit a distinct “core periphery” configuration. Aquaculture ponds, predominantly situated along the island’s periphery within the transition zone between natural wetlands and non-wetland areas, formed large contiguous belts in the early years. This arrangement fostered a mosaic landscape where natural and artificial elements were closely interwoven. The island’s river network maintained stable east–west and north–south connectivity throughout the study period, serving as ecological corridors. Scattered inland ponds persisted as isolated point features with little spatial reorganization.
The spatial evolution of aquaculture ponds reflects shifts in land-use priorities and regulatory pressures. In the early 2000s, extensive pond clusters encircled much of the coastline. After a brief eastward expansion, significant anthropogenic modification between 2010 and 2020, driven by aquaculture restructuring, land conversion, and possibly stricter environmental control led to the removal or repurposing of large pond areas in the northwest, north-central, and eastern sectors. By 2020, formerly continuous belts had fragmented into smaller, isolated patches, signaling a transition toward a more heterogeneous landscape under intensified human influence.
Taken together, these spatial changes underscore the dual role of natural succession and human activities in determining wetland configuration. While herbaceous marsh expansion illustrates the capacity for natural recovery or assisted restoration, the rapid loss of mudflats and fragmentation of aquaculture zones reveal ongoing anthropogenic pressures that continue to reshape Chongming’s coastal environment.

3.3. Patterns and Processes of Wetland Landscape Transformation

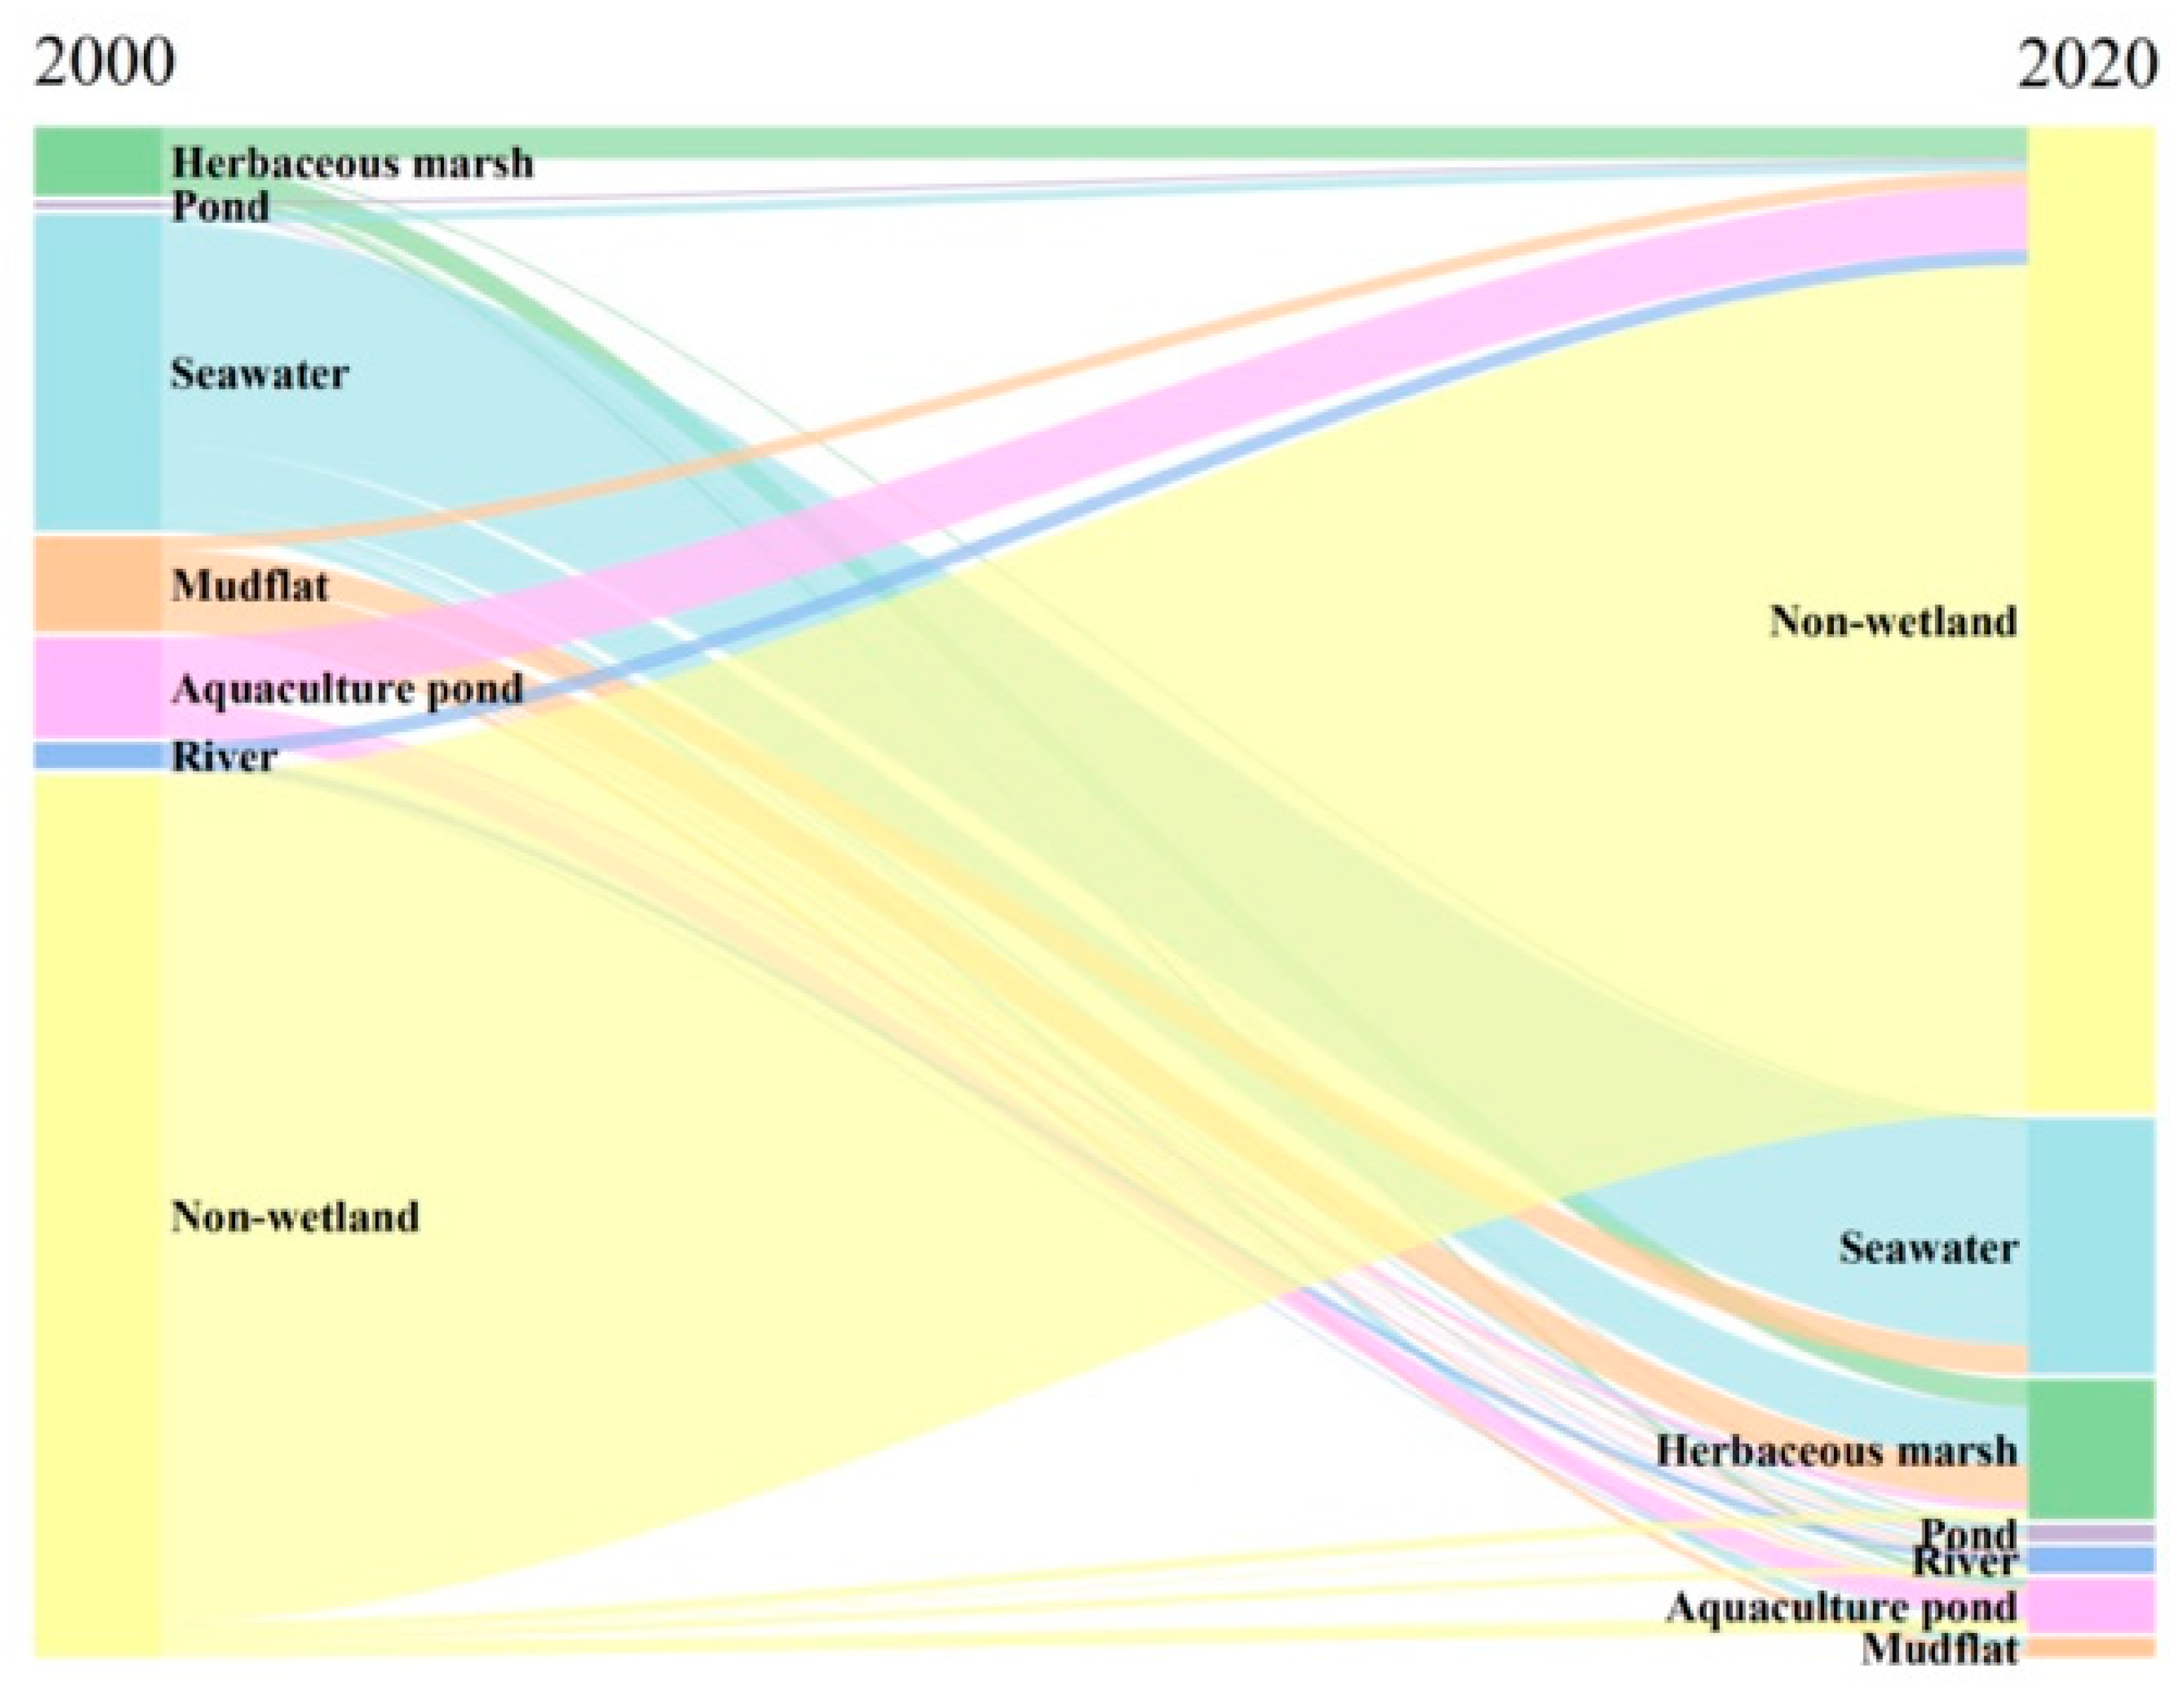
Figure 8 and Figure 9 together depict the characteristics and spatiotemporal evolution of wetland landscape transformations on Chongming Island from 2000–2020. The analysis reveals that wetland change is dominated by wetland-to-non-wetland conversion, with limited gains from non-wetland to wetland transitions.
From a type perspective (Figure 8), natural wetlands followed divergent trajectories. Herbaceous marshes achieved net expansion, primarily by encroaching into mudflats and shallow seawater areas, a process driven by vegetation succession, reduced reclamation pressure, and localized ecological restoration. Nevertheless, substantial portions of existing marshland were converted to non-wetland due to infrastructure construction and agricultural expansion. Mudflats experienced the largest net loss, with most areas converted to non-wetland under intense human disturbance such as large-scale reclamation, shoreline hardening, and altered sediment supply, though a minority succeeded into marshes or reverted to open water. Seawater areas underwent both natural sedimentation-driven succession (forming mudflats or marshes) and direct reclamation to non-wetland.
Artificial wetlands including aquaculture ponds, rivers, and excavated ponds were also highly dynamic. While aquaculture ponds expanded in the early 2000s, especially in the northeast, large tracts were subsequently abandoned or converted to non-wetland after 2010, reflecting policy changes, reduced profitability, and environmental regulations. The overall transformation pattern is highly asymmetrical: wetland-to-non-wetland conversion totaled 167.41 km2, about four times the 41.9 km2 gained from non-wetland to wetland transitions, underscoring persistent anthropogenic pressure outweighing restoration gains.
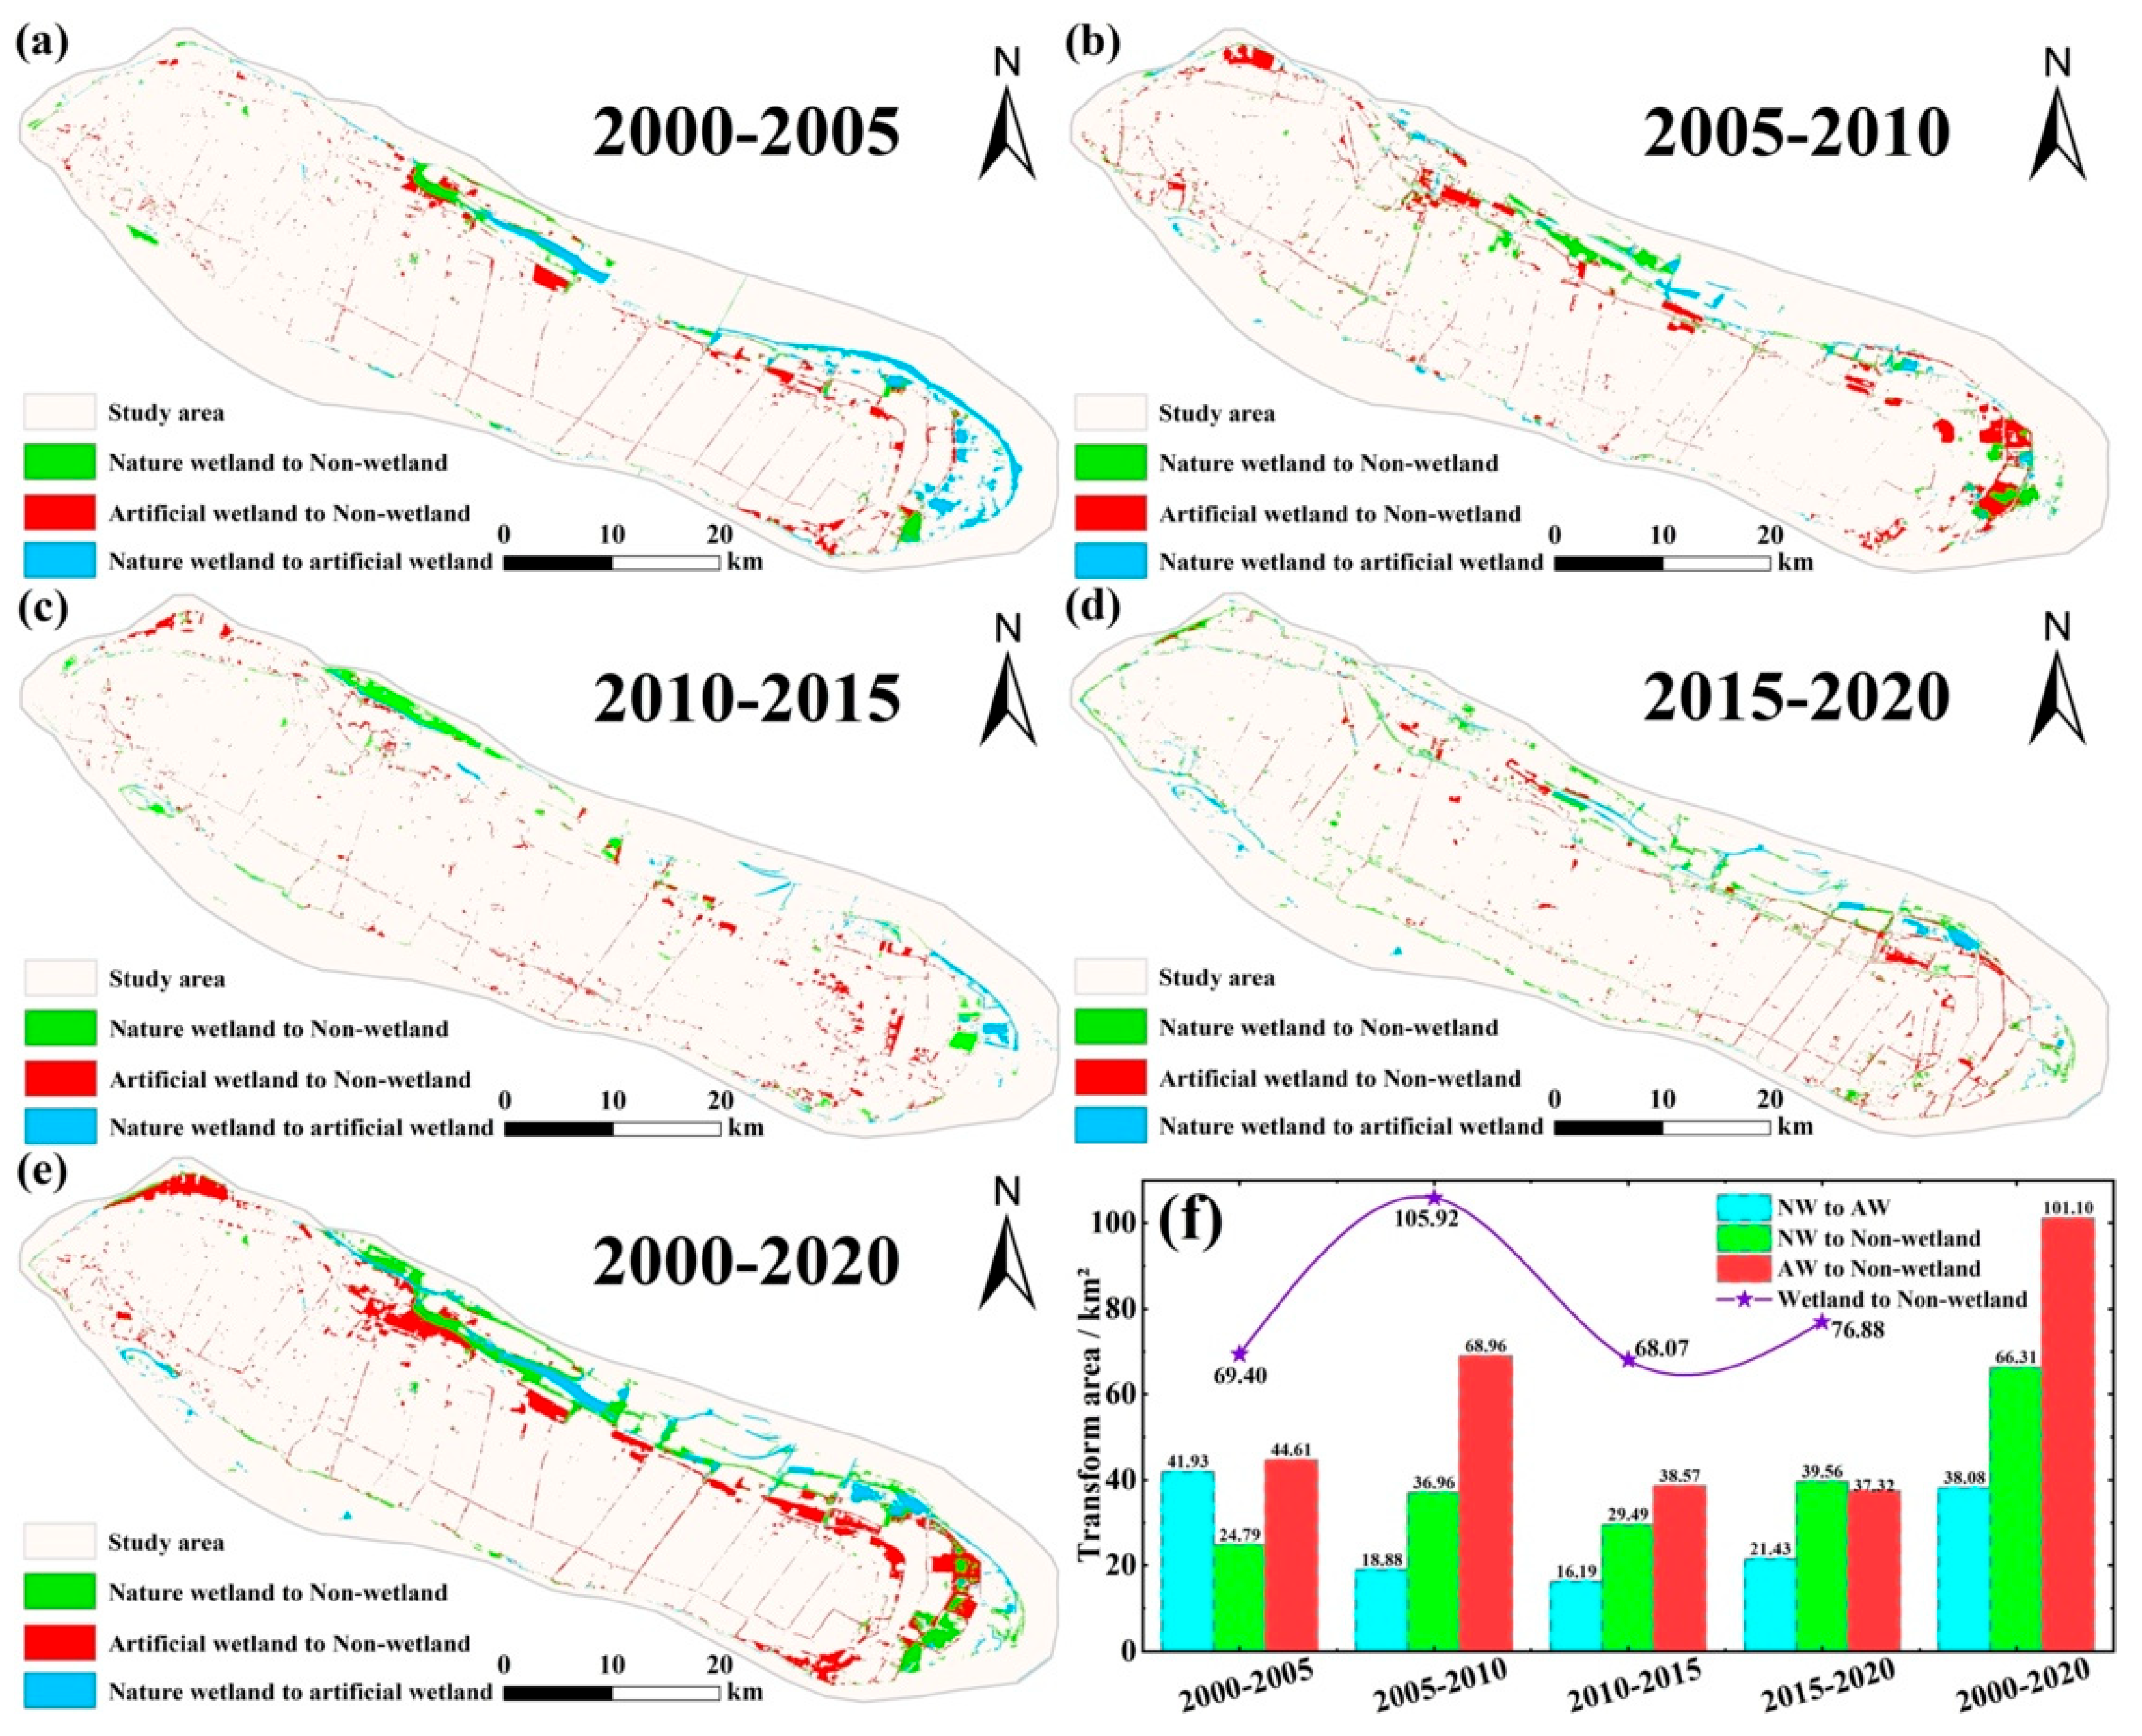
From a temporal spatial process perspective (Figure 9), the twenty-year change can be divided into four phases:
(1) 2000–2005: Natural-to-artificial conversions dominated in the northeast, with mudflats and marshes converted to aquaculture ponds, alongside seawater to pond conversions in northern inshore waters. Artificial-to-non-wetland transitions were concentrated along northern and eastern coasts.
(2) 2005–2010: Wetland-to-non-wetland conversion peaked at 105.92 km2, driven by simultaneous natural and artificial wetland losses. Artificial-to-non-wetland transitions expanded eastward and north westward, while natural-to-non-wetland conversions intensified along reclaimed mudflat fringes.
(3) 2010–2015: Transition patterns became more fragmented, with mutual conversions between natural and artificial wetlands reaching a low of 16.19 km2. Localized marsh expansion partially offset artificial wetland losses, coinciding with reduced reclamation intensity.
(4) 2015–2020: Wetland-to-non-wetland transitions regained dominance, marked by mudflat erosion and large-scale aquaculture pond abandonment, particularly in northern and eastern sectors.
Cumulatively, artificial-to-non-wetland conversion (167.41 km2) far exceeded natural-to-non-wetland conversion (66.31 km2) and natural-to-artificial conversion (38.08 km2). Spatial hotspots of change remained concentrated along the northern and eastern periphery, where aquaculture dynamics, reclamation projects, and shoreline engineering have most profoundly restructured the wetland landscape.
The integrated evidence from Figure 8 and Figure 9 highlights that Chongming Island’s wetland transformations are shaped by the interplay of human-driven land-use shifts, including reclamation, aquaculture expansion and abandonment, and infrastructure construction and natural geomorphological processes such as sediment deposition and vegetation succession. The overwhelming dominance of wetland loss pathways reflects a development-oriented land-use pattern, with ecological gains largely localized and insufficient to offset losses. Targeted conservation policies, stricter coastal development controls, and restoration of abandoned aquaculture zones could help reverse current trends, promoting a more balanced and sustainable wetland landscape in the future.

3.4. Driving Factors of Wetland Change

Figure 10 and Figure 11 collectively illustrate that wetland dynamics on Chongming Island are shaped by a complex interplay of anthropogenic and climatic forces, with urbanization and economic growth exerting dominant pressures and climate variability modulating both the rate and spatial pattern of change.
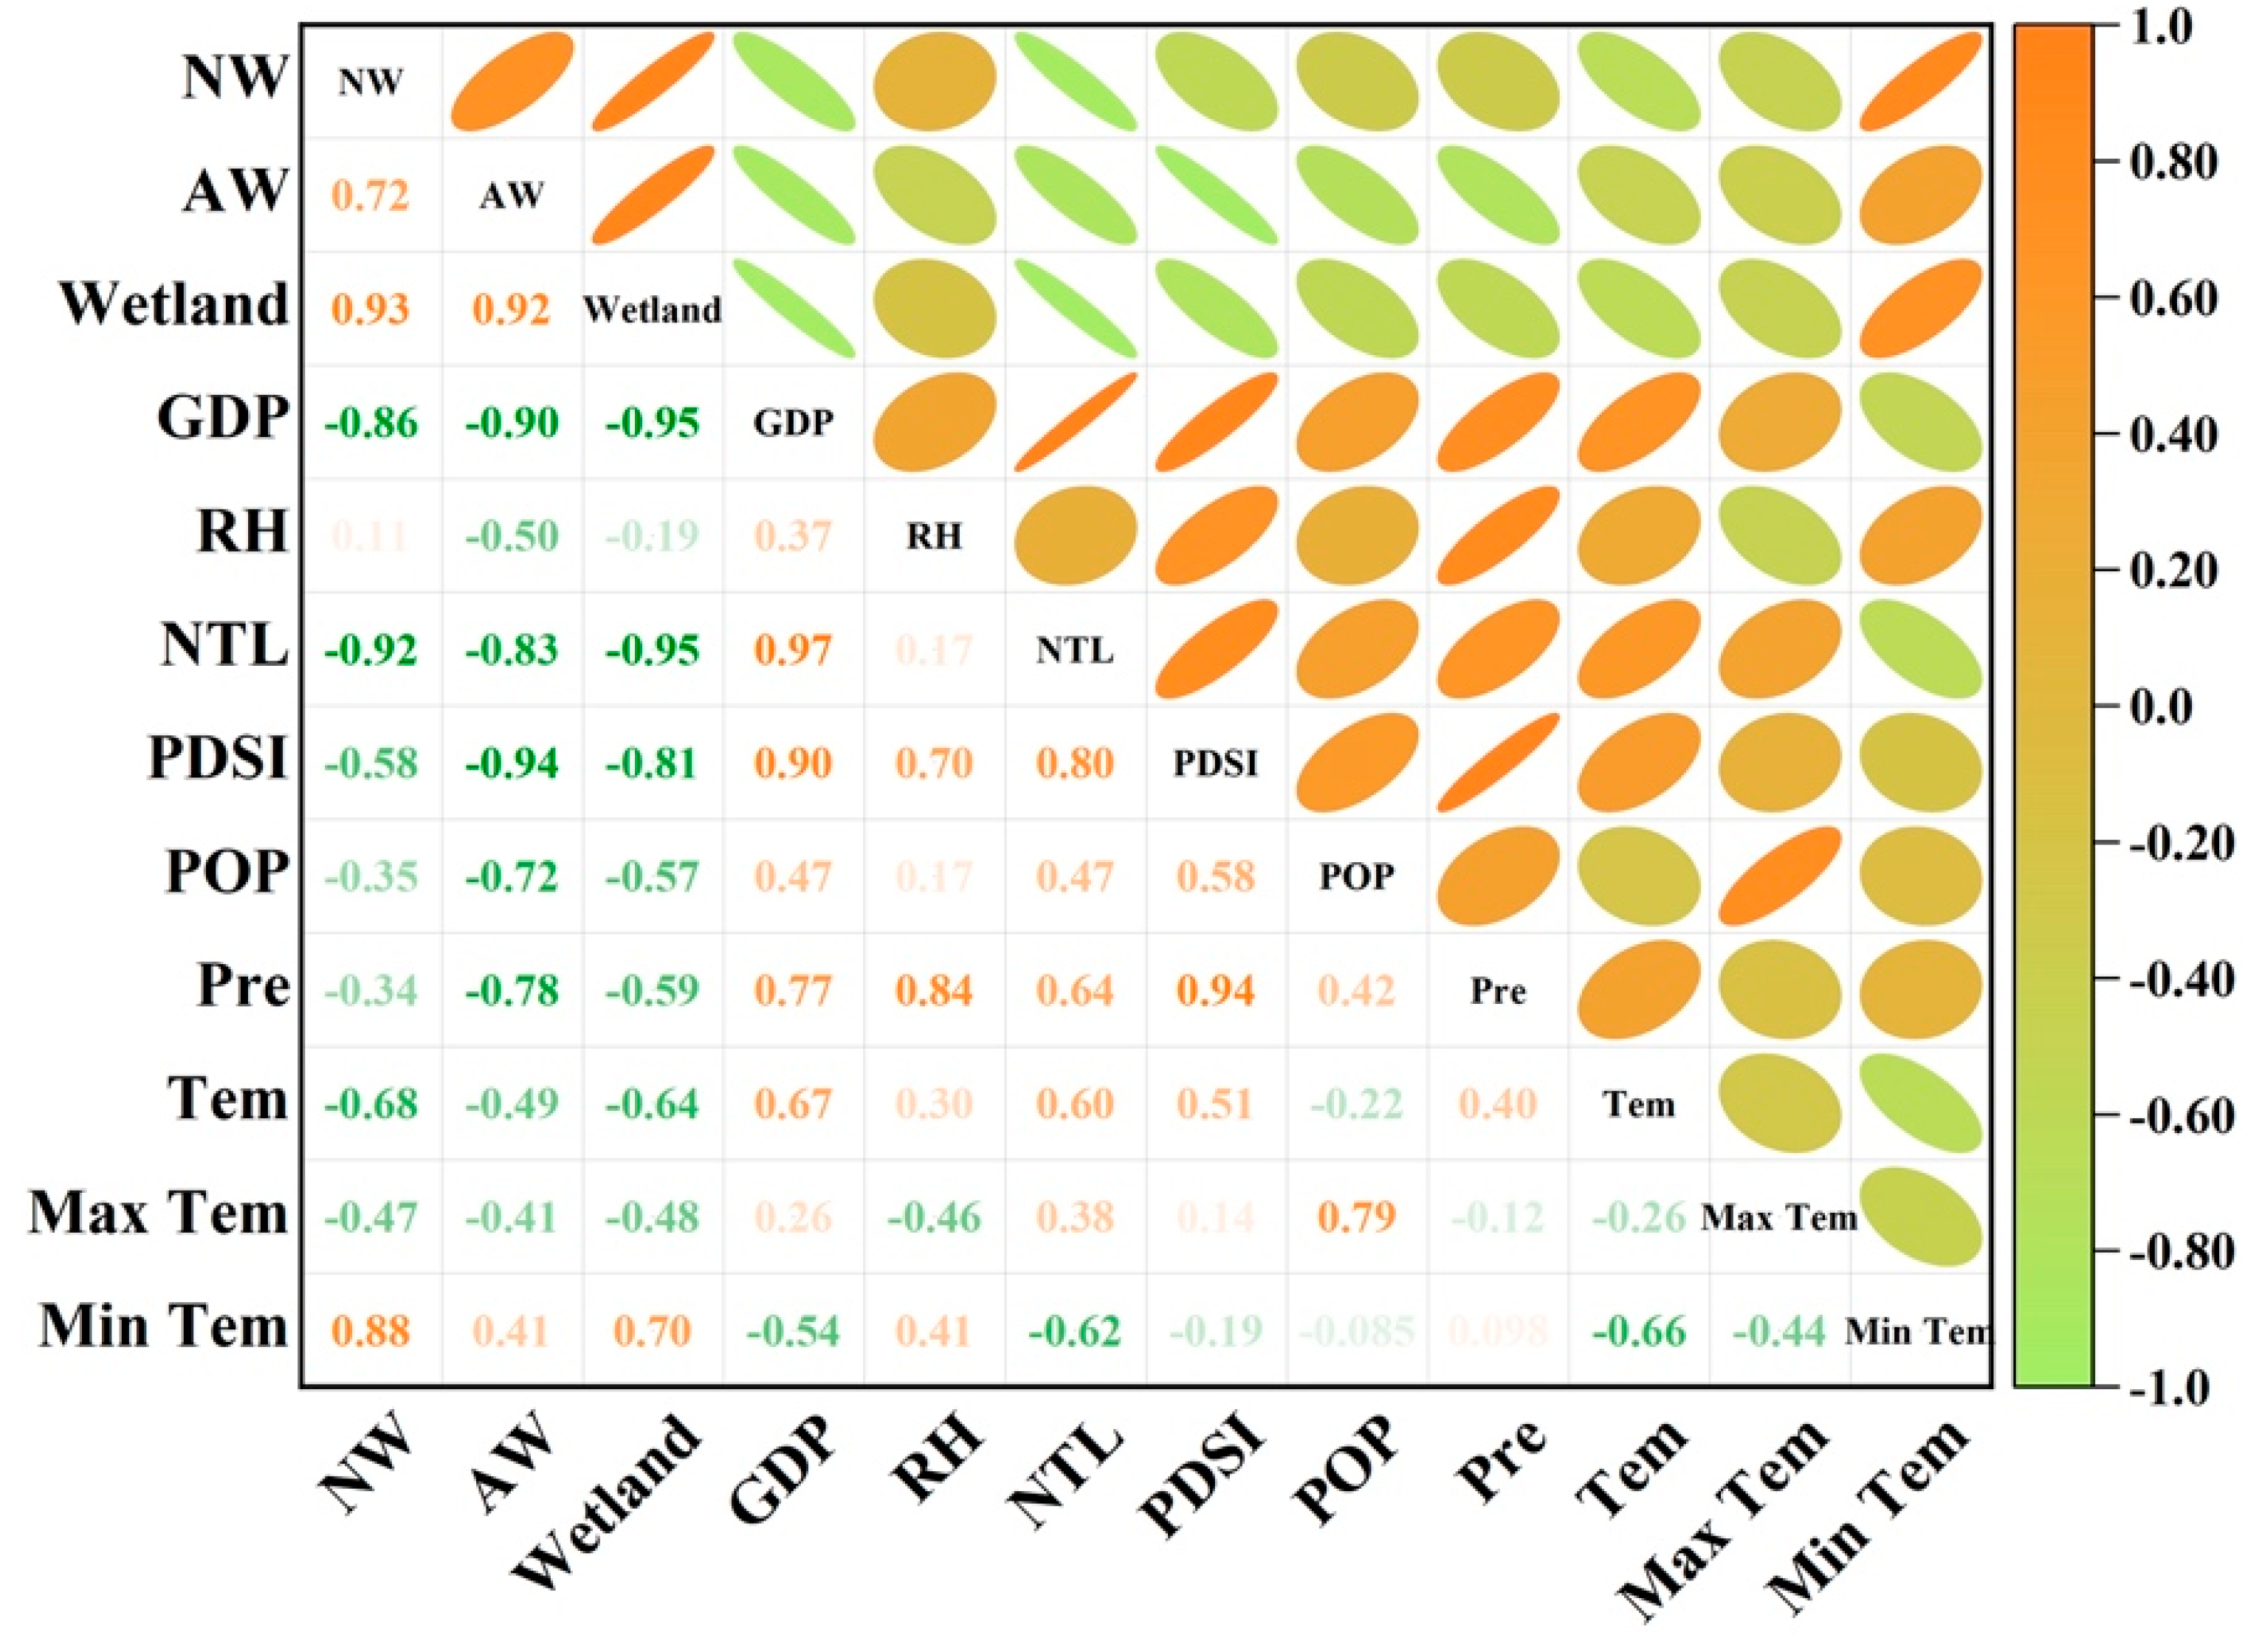
For natural wetlands, Pearson correlation results (Figure 10) reveal strong negative relationships with Nighttime Light (NTL, r = −0.92) and GDP (r = −0.86), alongside a strong positive correlation with minimum temperature (r = 0.88). High NTL and GDP values are spatially aligned with intensive urban development zones along the northern and eastern coasts, where reclamation and infrastructure expansion have progressively displaced coastal wetland habitats. In contrast, the positive temperature wetland relationship likely reflects vegetation gains in herbaceous marshes during warmer years, potentially due to extended growing seasons and altered tidal inundation. However, Figure 11a confirms that such climatic benefits cannot offset urbanization pressures: every 10-unit rise in NTL predicts a 1.2 km2 loss of natural wetlands, particularly in mudflat and open-water areas adjacent to high-intensity development.
For artificial wetlands, particularly aquaculture ponds, the strongest correlations are with PDSI (r = −0.94), GDP (r = −0.90), and NTL (r = −0.83). Spatial patterns show that low PDSI values coincide with zones of aquaculture pond abandonment in the northwest and north-central areas. Figure 11b quantifies this relationship, with each 1 unit drop in PDSI linked to a 15.09 km2 reduction in artificial wetlands, suggesting that water scarcity not only undermines aquaculture viability but also accelerates conversion to urban or industrial uses when coupled with economic incentives.
For total wetland area, the same set of drivers (GDP, NTL, and PDSI) shows strong and spatially coherent correlations, with Figure 11c indicating that every 10 billion CNY rise in GDP corresponds to a 4 km2 decline. This robust linear relationship suggests that long-term economic trajectories, rather than short-term variability, govern the magnitude of wetland change.
In synthesis, wetland transformation on Chongming Island follows a “human pressure dominated, climate modulated” model. Urban expansion and economic growth determine the underlying direction of change, while climate variables such as temperature and drought regulate its pace and distribution. Areas with lower NTL, more favorable PDSI, and slower economic growth emerge as critical refugia, where targeted conservation measures could yield the highest returns for maintaining wetland integrity.

4. Discussion

4.1. Natural Wetland Dynamics Under Anthropogenic and Ecological Pressures

Over the past two decades, Chongming Island’s natural wetlands have undergone substantial transformation under the combined influence of human activities and ecological processes. Our analysis reveals a marked reduction in mudflats (−93.8 km2) and shallow open-water areas (−74.5 km2) between 2000 and 2020, consistent with estuarine-scale observations of intertidal habitat loss due to land reclamation and coastal engineering. As dike construction and shoreline fixation have constrained tidal exchange, mudflats have been progressively squeezed and retreated seaward, reducing their ecological extent and function.
Herbaceous marshes exhibited a more complex trajectory, with a decline of approximately 15% between 2000 and 2010 followed by a sharp rebound, with the area more than doubling by 2020. This V-shaped pattern reflects the interplay between engineered projects that initially restricted tidal flow (e.g., levee construction, “tidal flat connecting” projects) and the subsequent proliferation of Spartina alterniflora. Introduced in the 1990s, Spartina alterniflora rapidly colonized intertidal zones after 2010, converting bare mudflats and shallow water into dense saltmarsh. While this expansion enhanced sediment stabilization, it reduced habitat heterogeneity and threatened native biodiversity. Localized marsh reversion to mudflat, such as in Dongtan after targeted Spartina removal campaigns (2013–2016), demonstrates that active management can alter these trajectories. Overall, the net effect on natural wetlands has been a decline in total area, accompanied by a shift in habitat composition from open intertidal flats to invasive-dominated marshes.

4.2. Policy-Driven Trajectories of Artificial Wetland Change

Artificial wetlands, mainly aquaculture ponds and irrigation reservoirs, mirrored shifts in policy and land-use priorities. Early 2000s “fishing for growth” policies encouraged rapid pond expansion, peaking around 2005. Thereafter, the combination of urban-industrial expansion in the Yangtze Delta, rising labor costs, declining aquaculture profitability, and shifting market conditions triggered large-scale pond conversion. From 2005 to 2020, Chongming lost approximately 55 km2 of aquaculture ponds, much of it reclaimed for non-wetland uses along the eastern and northern coasts.
Policy transitions played a decisive role in this trajectory. Mid-2000s to early 2010s infrastructure and reclamation projects prioritized land for urban and industrial functions, accelerating pond-to-terrestrial conversions. By the late 2010s, ecological “red line” policies curtailed further reclamation and mandated restoration of some areas, indirectly limiting artificial wetland expansion. Rivers and irrigation channels remained spatially stable, but their ecological functions likely shifted under surrounding land-use changes, including increased nutrient and sediment inputs from adjacent urban and agricultural areas. The Chongming case typifies the policy sensitivity of artificial wetlands in rapidly developing coastal regions: expansion, contraction, and partial restoration occurred in step with evolving economic strategies and environmental regulations.

4.3. Comparison with Previous Studies and Integrated Driving Mechanisms

Our findings corroborate earlier research in the Yangtze River Delta documenting wetland loss under sustained anthropogenic pressure. Lin and Yu (2018) reported a 574 km2 loss of natural coastal wetlands between the 1960s and 2015, primarily due to reclamation [41]. In Chongming, total wetland area declined by approximately 125.5 km2 since 2000, with wetland to non-wetland transitions outnumbering gains fourfold, consistent with national trends demonstrating that development has far outpaced restoration in the early 21st century. Where this study extends previous work is in quantifying the layered interaction of policy, economic activity, and climate variability. GDP and Nighttime Light Index (both r ≈ −0.95) emerged as dominant negative correlates of wetland extent, confirming human influence as the primary driver. However, we emphasize that correlation does not imply direct causation. GDP and NTL are composite indicators that capture multiple processes, including reclamation intensity, industrial expansion, and urban infrastructure growth. Previous wetland studies have raised similar cautions: agricultural expansion in the Sanjiang Plain was correlated with wetland decline but was ultimately driven by land-use policies [15]; national scale inventories linked wetland loss with GDP but highlighted reclamation and land conversion as the mediating mechanisms [10]; and Lin and Yu (2018) demonstrated that socioeconomic indicators often serve as proxies for broader human pressures rather than direct causal factors [41]. Therefore, our conclusion of a “human pressure dominated; climate modulated” pattern should be understood as an integrated association rather than a deterministic causal mechanism.
Climate acted as a secondary modulator. Rising minimum temperatures correlated positively with natural wetland extent, likely via enhanced growth of Spartina alterniflora. Conversely, drought severity (low PDSI) reduced artificial wetland area by constraining pond water availability and increasing maintenance costs effects, which were sometimes amplified by concurrent policy shifts in water allocation. Future research should employ causal inference approaches such as structural equation modeling, panel data analysis, or Granger causality tests, and combine them with multi-source datasets, including policy records and high-resolution imagery. These methods can help disentangle the direct and indirect effects of human and climatic drivers, thereby providing a stronger causal foundation for studies of wetland change [42,43]. This would also enhance the robustness of management recommendations and strengthen the policy relevance of future research.
In the global context, Chongming’s pattern resembles other large deltas (e.g., Mississippi, Mekong) where economic development drives wetland conversion. Yet the large-scale spread of Spartina alterniflora distinguishes China’s eastern coastal wetlands, producing significant vegetation gains even amid net wetland loss. This invasive expansion enhances sediment stability and carbon storage but diminishes biodiversity and ecosystem complexity.
Chongming thus represents a coupled human–natural system: policy and economic drivers dictate the pace and magnitude of wetland change, while ecological processes and climate variability determine the composition and function of the remaining wetlands. Effective conservation must therefore integrate land-use regulation with ecological management, controlling invasive species, managing sediment regimes, and adapting to climate-driven hydrological shifts.

4.4. Synthesis and Implications

The evidence from Chongming Island demonstrates that wetland change is the outcome of intertwined anthropogenic, climatic, and ecological processes. Urban expansion, economic growth, and land-use policies set the overarching trajectory of wetland loss, while climate variability and ecological succession adjust its pace, distribution, and ecological consequences. In particular, the dominance of Spartina alterniflora in formerly open mudflats highlights that not all wetland gains are ecologically equivalent. Vegetation recovery may stabilize sediments but can simultaneously reduce biodiversity and alter habitat functions. These findings echo patterns observed in other deltaic systems, yet Chongming’s experience underscores the uniquely strong role of policy-driven land reallocation in shaping both natural and artificial wetland outcomes.
From a management perspective, this coupled human–natural system framework suggests three priority actions: (1) Regulating urban and infrastructure expansion in ecotones where natural wetlands are most vulnerable to NTL- and GDP-linked pressures. (2) Enhancing water resource management to buffer artificial wetlands against drought-induced losses; and (3) integrating climate resilience and invasive species control into restoration planning to ensure that wetland recovery addresses both habitat extent and ecological quality.

5. Conclusions

This study provides a comprehensive assessment of spatiotemporal changes and driving mechanisms of wetlands on Chongming Island from 2000–2020, revealing that the island’s wetland system has been reshaped by a persistent interplay between human activities and natural processes.
(1) Overall wetland changes and spatial patterns: Total wetland area declined by approximately 125.5 km2, with natural wetlands showing contrasting internal trends: tidal flats and seawater-covered areas consistently shrank, while herbaceous marshes followed a “decline recovery” trajectory. Artificial wetlands, dominated by aquaculture ponds, expanded briefly in the early 2000s before sustained contraction. Natural wetlands were mainly located along coastal margins, whereas artificial wetlands formed transitional belts between natural and terrestrial landscapes.
(2) Conversion pathways: The conversion of wetlands into non-wetland land uses was the prevailing form of land-use change, reaching its highest extent of 105.9 km2 between 2005 and 2010. Losses of natural wetlands occurred mainly along the northern and eastern shorelines, whereas the decline of artificial wetlands was most evident in the northwest, north-central, and eastern parts of the island.
(3) Driving mechanisms: Wetland change followed a “human pressure dominated, climate modulated” model. Measures of urban development, including the Nighttime Light Index (NTL) and GDP, proved to be the most significant indicators of overall wetland reduction, whereas climatic factors like minimum temperature and drought severity (PDSI) were linked to changes in marsh growth and declines in aquaculture areas.
(4) Management implications: Achieving sustainable wetland management will depend on comprehensive planning that limits urban expansion in vulnerable regions, enhances water resource distribution during dry periods, and embeds both climate adaptation and invasive species control into restoration initiatives.
Finally, we acknowledge that this study is limited to Chongming Island. Although the island offers a representative case of wetland change under intense human pressure in the Yangtze Delta, the “human pressure dominated, climate modulated” pattern observed here reflects the specific ecological, economic, and policy context of this location and may not be directly generalizable to other coastal or deltaic wetlands. Comparative analyses across different regions, such as the Pearl River Delta, the Sanjiang Plain, and other major global deltas, are needed to test the applicability of this framework and to improve understanding of how diverse socioeconomic and climatic conditions shape wetland change mechanisms.
Although this study leveraged a 20-year Landsat time series, the 30 m spatial resolution is insufficient to capture very small or highly fragmented wetlands, and this limitation may lead to classification uncertainties or an underestimation of fine-scale ecological heterogeneity. In particular, small ponds, narrow linear wetland features, or rapidly shifting shoreline components may be misclassified or omitted, reducing the accuracy of dynamic assessments [42,43,44]. To address this, future work should therefore integrate multi-source, higher-resolution imagery (e.g., Sentinel-2, Gaofen-6) together with ancillary data (elevation, SAR, etc.) to improve fine-scale mapping, capture small wetland patches, and enhance the precision and ecological relevance of long-term monitoring and conservation strategies.

Author Contributions

Conceptualization, A.Y. and J.J.; methodology, H.F.; software, A.Y.; validation, A.Y., Y.Y., and J.F.; formal analysis, Y.Y.; investigation, A.Y.; resources, A.Y.; data curation, J.F.; writing—original draft preparation, A.Y.; writing—review and editing, J.J.; visualization, H.F.; supervision, Y.Y.; project administration, J.J.; funding acquisition, Y.Y. All authors have read and agreed to the published version of the manuscript.

Funding

This research was funded by the National Natural Science Foundation of China (Grant No. 42306031), the NUIST Students’ Platform for Innovation and Entrepreneurship Training Program (Grant No. 202410300024Z), and the Project Supported by Fujian Provincial Natural Science Foundation of China (Grant No. 2022J01442).

Data Availability Statement

All data used in this study are publicly accessible. Landsat series imagery (Landsat 5 TM for 2000, 2005, and 2010; Landsat 8 OLI for 2015 and 2020) were acquired via the Google Earth Engine platform (https://earthengine.google.com/), accessed on 25 June 2025. Climatic variables—annual mean temperature, maximum and minimum temperature, precipitation, and relative humidity—were obtained from the Meteorological Ecological Cloud Platform of the China Meteorological Administration (https://em.cams.cma.cn/), accessed on 25 June 2025. Palmer Drought Severity Index (PDSI) data were downloaded from Figshare (https://figshare.com/), accessed on 25 June 2025. Gross Domestic Product (GDP) and population density (POP) data were acquired from the Resource and Environmental Science Data Center of the Chinese Academy of Sciences (https://www.resdc.cn/), accessed on 25 June 2025. Nighttime Light (NTL) index data were obtained from the Data Sharing and Service Portal (Data sharing and Service Portal), accessed on 25 June 2025.

Acknowledgments

We would like to thank the data centers for collecting, computing, and supplying the accessible high-quality data in Section 2.

Conflicts of Interest

The authors declare no conflicts of interest. The funders had no role in the design of the study; in the collection, analyses, or interpretation of data; in the writing of the manuscript; or in the decision to publish the results.

References

  1. Davidson, N. Wetland losses and the status of wetland-dependent species. In The Wetland Book II: Distribution, Description, and Conservation; Springer: Berlin/Heidelberg, Germany, 2018; pp. 369–381. [Google Scholar]
  2. Wan, L.; Zhang, Y.; Zhang, X.; Qi, S.; Na, X. Comparison of land use/land cover change and landscape patterns in Honghe National Nature Reserve and the surrounding Jiansanjiang region, China. Ecol. Indic. 2015, 51, 205–214. [Google Scholar] [CrossRef]
  3. Ramachandra, T.V.; Rajinikanth, R.; Ranjini, V.G. Economic valuation of wetlands. J. Environ. Biol. 2005, 26, 439. [Google Scholar]
  4. Wang, M.; Sun, Y.; Xiang, J.; Zhong, Y. CITNet: Convolution interaction transformer network for hyperspectral and LiDAR image classification. IEEE Trans. Geosci. Remote Sens. 2024, 62, 5535918. [Google Scholar] [CrossRef]
  5. Wei, W.; Tang, Z.; Dai, Z.; Lin, Y.; Ge, Z.; Gao, J. Variations in tidal flats of the Changjiang (Yangtze) estuary during 1950s–2010s: Future crisis and policy implication. Ocean. Coast. Manag. 2015, 108, 89–96. [Google Scholar] [CrossRef]
  6. Bao, J.; Gao, S. Long-term reclamation of tidal flats of Chongming Island and ecological security of Yangtze estuary, China. Reg. Environ. Change 2024, 24, 74. [Google Scholar] [CrossRef]
  7. Zhang, L.; Yuan, L.; Huang, H. Coastal wetlands in the Changjiang estuary. In Ecological Continuum from the Changjiang (Yangtze River) Watersheds to the East China Sea Continental Margin; Springer: Cham, Switzerland, 2015; pp. 137–159. [Google Scholar]
  8. Deegan, L.A.; Johnson, D.S.; Warren, R.S.; Peterson, B.J.; Fleeger, J.W.; Fagherazzi, S.; Wollheim, W.M. Coastal eutrophication as a driver of salt marsh loss. Nature 2012, 490, 388–392. [Google Scholar] [CrossRef]
  9. Nicholls, R.J.; Hoozemans, F.M.J.; Marchand, M. Increasing flood risk and wetland losses due to global sea-level rise: Regional and global analyses. Glob. Environ. Change 1999, 9, S69–S87. [Google Scholar] [CrossRef]
  10. Bian, H.; Li, W.; Li, Y.; Ren, B.; Niu, Y.; Zeng, Z. Driving forces of changes in China’s wetland area from the first (1999–2001) to second (2009–2011) National Inventory of Wetland Resources. Glob. Ecol. Conserv. 2020, 21, e00867. [Google Scholar] [CrossRef]
  11. Meng, W.; He, M.; Hu, B.; Mo, X.; Li, H.; Liu, B.; Wang, Z. Status of wetlands in China: A review of extent, degradation, issues and recommendations for improvement. Ocean. Coast. Manag. 2017, 146, 50–59. [Google Scholar] [CrossRef]
  12. Niu, Z.G.; Zhang, H.; Wang, X.; Yao, W.B.; Zhou, D.M.; Zhao, K.Y.; Zhao, H.; Li, N.N.; Huang, H.B.; Li, C.C.; et al. Mapping wetland changes in China between 1978 and 2008. Chin. Sci. Bull. 2012, 57, 2813–2823. [Google Scholar] [CrossRef]
  13. Liu, J.; Tian, H.; Liu, M.; Zhuang, D.; Melillo, J.M.; Zhang, Z. China’s changing landscape during the 1990s: Large-scale land transformations estimated with satellite data. Geophys. Res. Lett. 2005, 32, L02405. [Google Scholar] [CrossRef]
  14. Zeng, H.; Gao, Q.; Chen, X.; Li, G. Changes of the wetland landscape in Shenzhen City from 1988 to 2007 and the driving force analysis. Acta Ecol. Sin. 2010, 30, 2706–2714. [Google Scholar]
  15. Song, K.; Wang, Z.; Du, J.; Liu, L.; Zeng, L.; Ren, C. Wetland degradation: Its driving forces and environmental impacts in the Sanjiang Plain, China. Environ. Manag. 2014, 54, 255–271. [Google Scholar] [CrossRef]
  16. Zhang, J.; Ma, K.; Fu, B. Wetland loss under the impact of agricultural development in the Sanjiang Plain, NE China. Environ. Monit. Assess. 2010, 166, 139–148. [Google Scholar] [CrossRef] [PubMed]
  17. Zhuo, W.; Wu, N.; Shi, R.; Cui, Y.; Zhang, C.; Liu, S.; Zhu, F.; Zhang, B.; Liu, P. Assessing the impacts of reclamation and invasion on ecological dynamics of coastal wetland vegetation in the Yangtze Estuary from 1985 to 2019: A case study of Chongming Island, China. J. Environ. Manag. 2025, 376, 124505. [Google Scholar] [CrossRef] [PubMed]
  18. Yang, S.L.; Zhang, J.; Zhu, J.; Smith, J.P.; Dai, S.B.; Gao, A.; Li, P. Impact of dams on Yangtze River sediment supply to the sea and delta intertidal wetland response. J. Geophys. Res. Earth Surf. 2005, 110, F03006. [Google Scholar] [CrossRef]
  19. Zhao, P.; Yang, Y.; Jia, J.; Zhao, N.; Zhang, W.; Gao, S. Typhoon and flooding occurrences on Chongming Island, Changjiang Estuary, as revealed by a newly acquired sedimentary record. Front. Mar. Sci. 2024, 11, 1366676. [Google Scholar] [CrossRef]
  20. Tian, D.; Guo, Y.; Dong, W. Future changes and uncertainties in temperature and precipitation over China based on CMIP5 models. Adv. Atmos. Sci. 2015, 32, 487–496. [Google Scholar] [CrossRef]
  21. Zhang, Y.; Zhang, X. Tendency of land reclamation in coastal areas of Shanghai from 1998 to 2015. Land Use Policy 2020, 91, 104370. [Google Scholar] [CrossRef]
  22. Kirwan, M.L.; Megonigal, J.P. Tidal wetland stability in the face of human impacts and sea-level rise. Nature 2013, 504, 53–60. [Google Scholar] [CrossRef]
  23. Shen, G.; Ibrahim, A.N.; Wang, Z.; Ma, C.; Gong, J. Spatial–temporal land-use/land-cover dynamics and their impacts on surface temperature in Chongming Island of Shanghai, China. Int. J. Remote Sens. 2015, 36, 4037–4053. [Google Scholar] [CrossRef]
  24. Wu, S.; Chen, R.; Meadows, M.E. Evolution of an estuarine Island in the anthropocene: Complex dynamics of Chongming Island, Shanghai, PR China. Sustainability 2019, 11, 6921. [Google Scholar] [CrossRef]
  25. Wang, H.; Xu, D.; Zhang, D.; Pu, Y.; Luan, Z. Shoreline dynamics of Chongming Island and driving factor analysis based on landsat images. Remote Sens. 2022, 14, 3305. [Google Scholar] [CrossRef]
  26. Shen, G.; Ibrahim Abdoul, N.; Zhu, Y.; Wang, Z.; Gong, J. Remote sensing of urban growth and landscape pattern changes in response to the expansion of Chongming Island in Shanghai, China. Geocarto Int. 2017, 32, 488–502. [Google Scholar] [CrossRef]
  27. Shen, G.; Sarris, A.; Huang, X. Remote sensing monitoring and analysis of expansion characteristics of Chongming Island in Shanghai, China. In Proceedings of the 2013 Second International Conference on Agro-Geoinformatics (Agro-Geoinformatics), Fairfax, VA, USA, 12–16 August 2013; IEEE: New York, NY, USA, 2013; pp. 556–561. [Google Scholar]
  28. Zhang, X.; Xiao, X.; Wang, X.; Xu, X.; Chen, B.; Wang, J.; Ma, J.; Zhao, B.; Li, B. Quantifying expansion and removal of Spartina alterniflora on Chongming island, China, using time series Landsat images during 1995–2018. Remote Sens. Environ. 2020, 247, 111916. [Google Scholar] [CrossRef]
  29. Bao, J.; Gao, S. Wetland utilization and adaptation practice of a coastal megacity: A case study of Chongming Island, Shanghai, China. Front. Environ. Sci. 2021, 9, 627963. [Google Scholar] [CrossRef]
  30. Zhao, Q.; Wang, X.; Zhang, Q.; Long, X.; Song, Y.; Lu, F.; Song, J.; Zhang, B.; Han, G. Spatial-temporal evolution characteristics and driving factors of coastal aquaculture ponds in China from 1985 to 2023. Ying yong sheng tai xue bao. J. Appl. Ecol. 2025, 36, 1519–1530. [Google Scholar]
  31. Ai, J.; Gao, W.; Gao, Z.; Shi, R.H.; Zhang, C. Phenology-based Spartina alterniflora mapping in coastal wetland of the Yangtze Estuary using time series of GaoFen satellite no. 1 wide field of view imagery. J. Appl. Remote Sens. 2017, 11, 026020. [Google Scholar] [CrossRef]
  32. Liu, M.; Mao, D.; Wang, Z.; Li, L.; Man, W.; Jia, M.; Ren, C.; Zhang, Y. Rapid invasion of Spartina alterniflora in the coastal zone of mainland China: New observations from Landsat OLI images. Remote Sens. 2018, 10, 1933. [Google Scholar] [CrossRef]
  33. Xiao, D.; Zhang, L.; Zhu, Z. The range expansion patterns of Spartina alterniflora on salt marshes in the Yangtze Estuary, China. Estuar. Coast. Shelf Sci. 2010, 88, 99–104. [Google Scholar] [CrossRef]
  34. Cai, Y. A high-performance and in-season classification system of field-level crop types using time-series landsat data and a machine learning approach. Remote Sens. 2018, 210, 35–47. [Google Scholar] [CrossRef]
  35. Fang, H.; Man, W.; Liu, M.; Zhang, Y.; Chen, X.; Li, X.; He, J.; Tian, D. Leaf area index inversion of Spartina alterniflora using UAV hyperspectral data based on multiple optimized machine learning algorithms. Remote Sens. 2023, 15, 4465. [Google Scholar] [CrossRef]
  36. Fisher, A.; Flood, N.; Danaher, T. Comparing landsat water index methods for automated water classification in eastern Australia. Remote Sens. Environ. 2016, 175, 167–182. [Google Scholar] [CrossRef]
  37. Souza, J.; Siqueira, J.V.; Sales, M.H.; Fonseca, A.V.; Ribeiro, J.G.; Numata, I.; Cochrane, M.A.; Barber, C.P.; Roberts, D.A.; Barlow, J. Ten-year landsat classification of deforestation and forest degradation in the Brazilian Amazon. Remote Sens. 2013, 5, 5493–5513. [Google Scholar] [CrossRef]
  38. GB/T 35643-2017; Land Use Classification Standard. Standardization Administration of China: Beijing, China, 2017.
  39. Marjani, M.; Mahdianpari, M.; Mohammadimanesh, F.; Gill, E.W. CVTNet: A fusion of convolutional neural networks and vision transformer for wetland mapping using sentinel-1 and sentinel-2 satellite data. Remote Sens. 2024, 16, 2427. [Google Scholar] [CrossRef]
  40. Li, Z.; Liu, T.; Lu, Y.; Tian, J.; Zhang, M.; Zhou, C. Enhanced hyperspectral image classification for coastal wetlands using a hybrid CNN-transformer approach with cross-attention mechanism. Front. Mar. Sci. 2025, 12, 1613565. [Google Scholar] [CrossRef]
  41. Lin, Q.; Yu, S. Losses of natural coastal wetlands by land conversion and ecological degradation in the urbanizing Chinese coast. Sci. Rep. 2018, 8, 15046. [Google Scholar] [CrossRef] [PubMed]
  42. Amani, M.; Salehi, B.; Mahdavi, S.; Granger, J. Spectral Analysis of wetlands in Newfoundland using Sentinel 2A and Landsat 8 imagery. In Proceedings of the Imaging and Geospatial Technology Forum, Baltimore, MD, USA, 12–16 March 2017; pp. 11–17. [Google Scholar]
  43. Guo, M.; Li, J.; Sheng, C.; Xu, J.; Wu, L. A review of wetland remote sensing. Sensors 2017, 17, 777. [Google Scholar] [CrossRef]
  44. Zhang, X.; Liu, L.; Zhao, T.; Lin, S.; Wang, J.; Mi, J.; Liu, W. GWL_FCS30: Global 30 m wetland map with fine classification system using multi-sourced and time-series remote sensing imagery in 2020. Earth Syst. Sci. Data Discuss. 2023, 15, 265–293. [Google Scholar] [CrossRef]
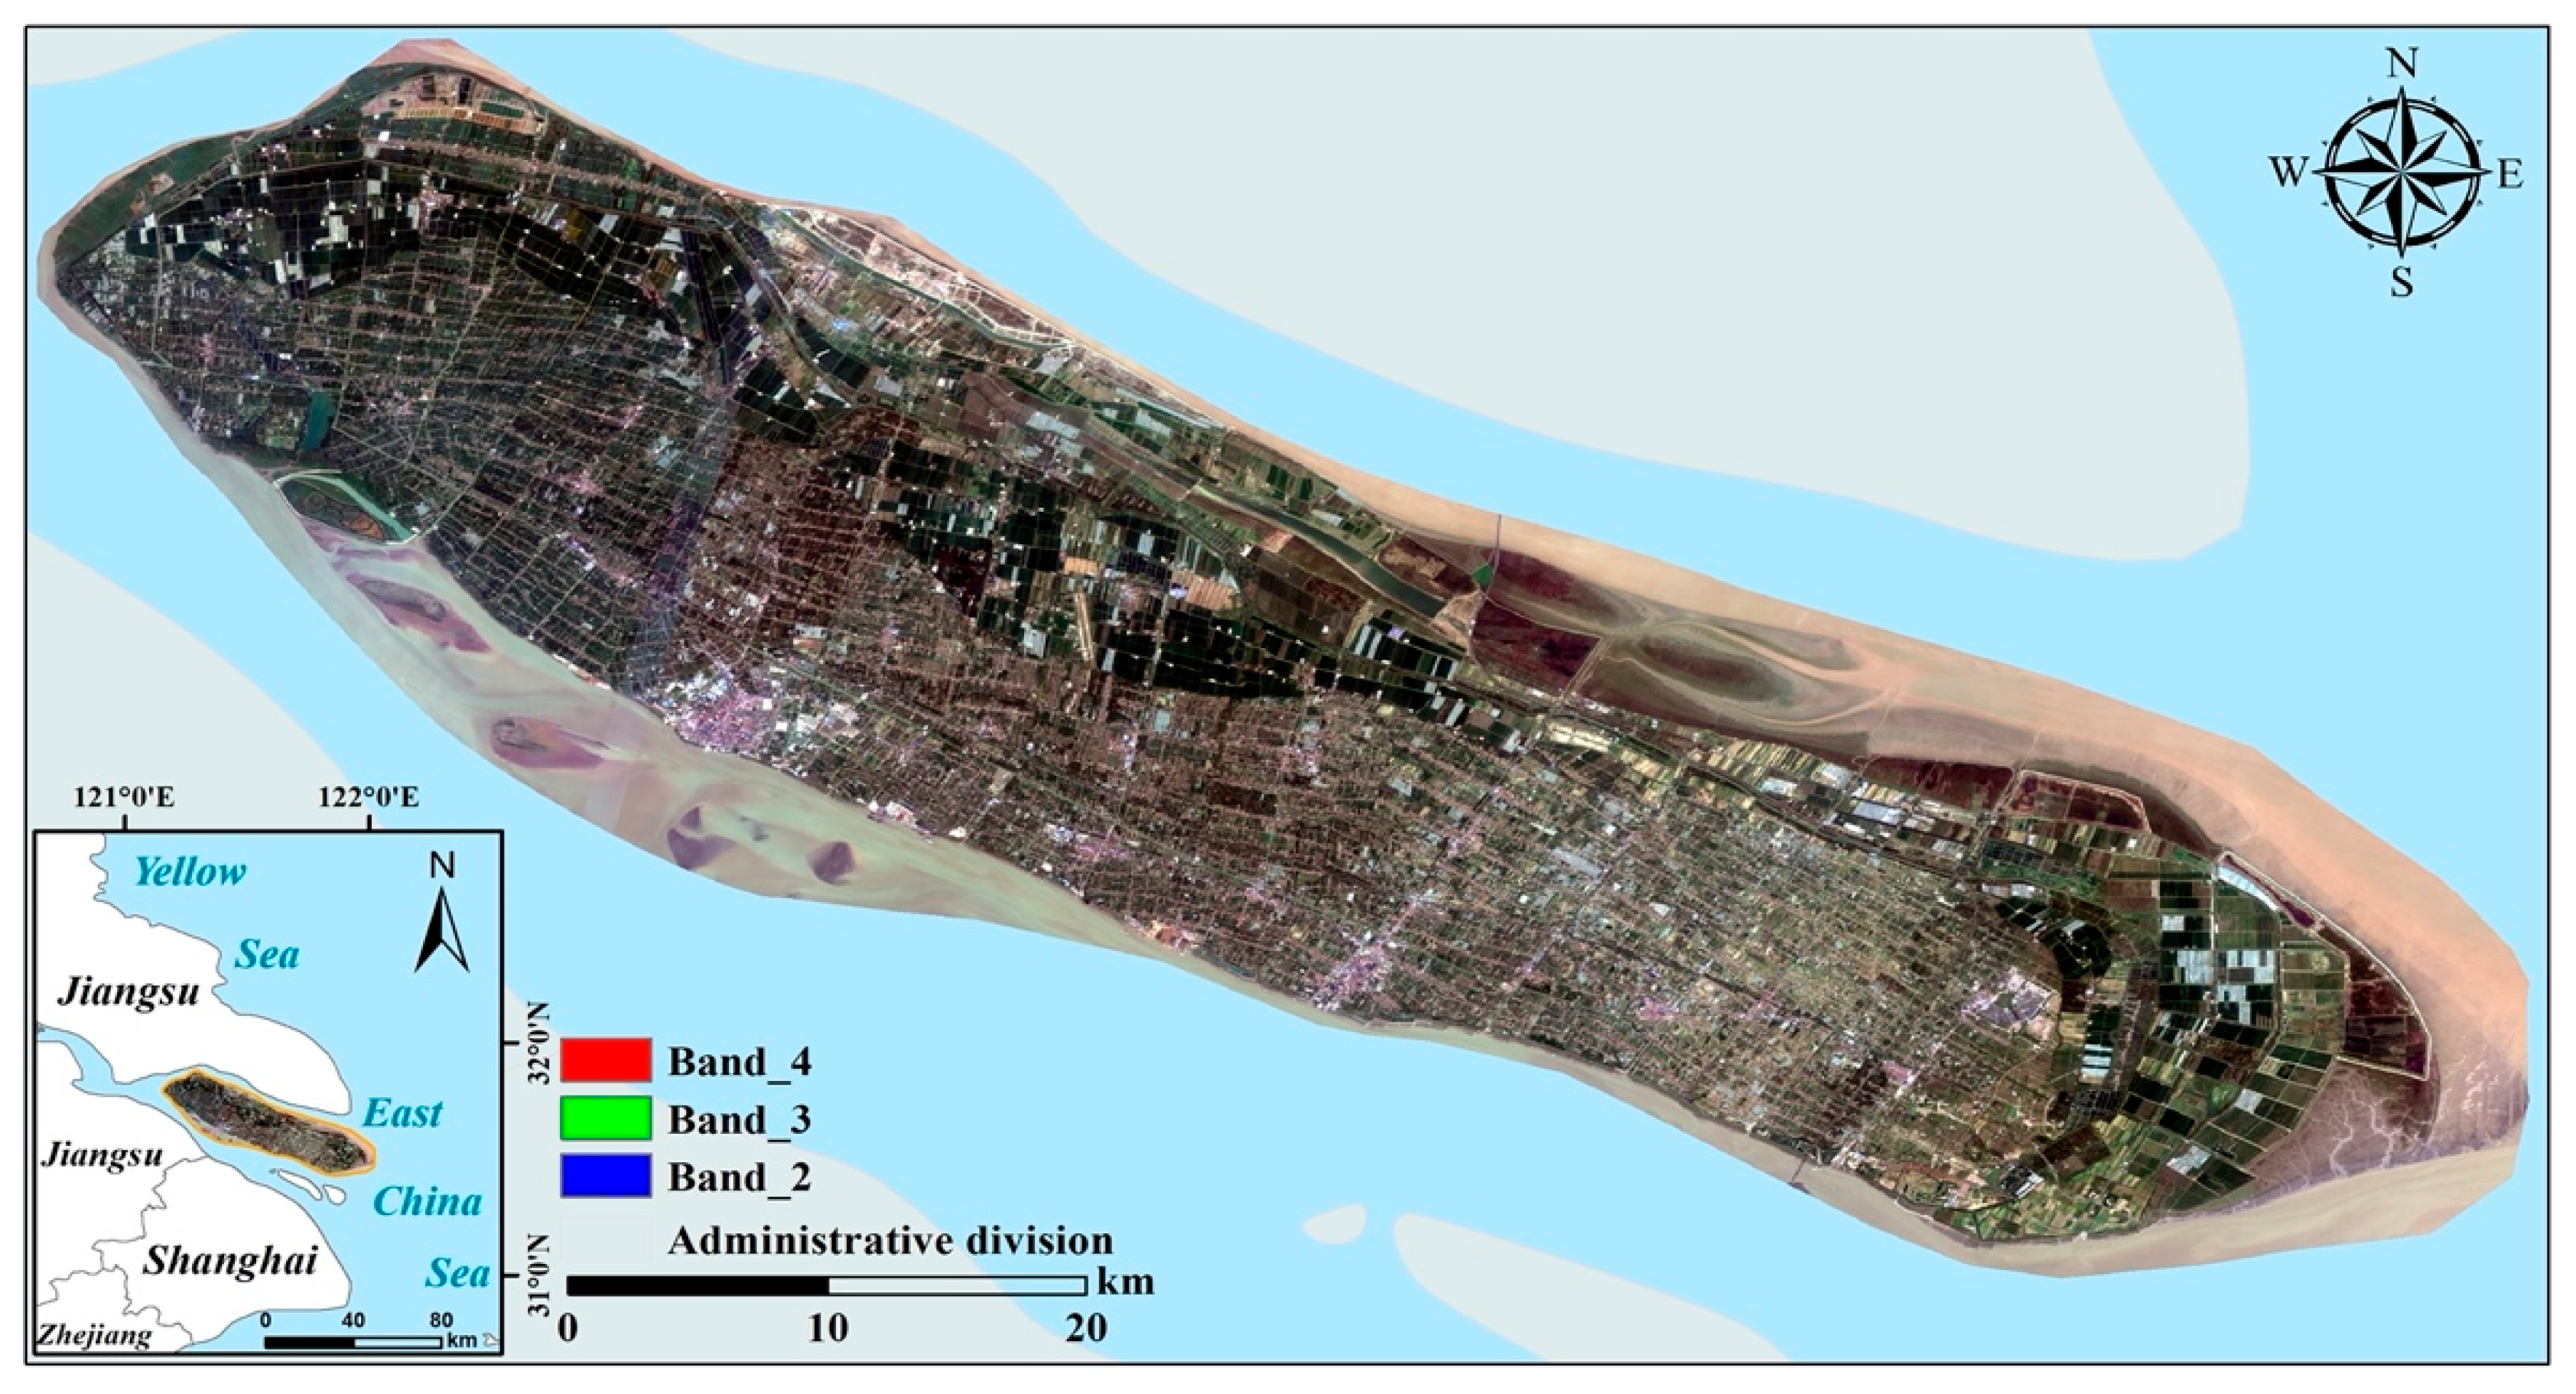
Figure 1. Location and overview of the study area (inset shows Chongming Island in the context of China).
Jmse 13 01837 g001
Figure 2. Flowchart of technical framework for analyzing wetland changes and their driving factors based on remote sensing and correlation analysis.
Jmse 13 01837 g002
Figure 3. Classification accuracy of Chongming Island wetlands.
Jmse 13 01837 g003
Figure 4. Area changes in natural wetlands of Chongming Island. (a) Natural wetland. (b) Mudflat. (c) Herbaceous marsh (d) Seawater zone.
Jmse 13 01837 g004
Figure 5. Area changes in artificial wetlands of Chongming Island. (a) Artificial wetland. (b) Pond. (c) River. (d) Aquaculture pond.
Jmse 13 01837 g005
Figure 6. Temporal changes in total wetland area of Chongming Island.
Jmse 13 01837 g006
Figure 7. Spatial distribution changes of wetlands on Chongming Island.
Jmse 13 01837 g007
Figure 8. Bidirectional transformations among wetland types and between wetlands and non-wetlands on Chongming Island from 2000–2020. Herbaceous marshes expanded mainly at the expense of mudflats and seawater areas, while mudflats and artificial wetlands (aquaculture ponds, rivers, and ponds) were predominantly converted to non-wetland. The asymmetry in wetland-to-non-wetland conversion losses being roughly four times greater than gains reflects strong anthropogenic land-use pressures.
Jmse 13 01837 g008
Figure 9. Spatiotemporal evolution of wetland landscape transformation on Chongming Island during four consecutive five-year intervals and the cumulative 2000–2020 period. (ad) Spatial distribution of dominant conversions in each interval, showing shifting hotspots from concentrated coastal zones to more fragmented patterns over time. (e) Cumulative spatial distribution of transformations. (f) Temporal trends of transformation area by type, highlighting peaks in wetland-to-non-wetland conversion during 2005–2010 and sustained losses of artificial wetlands in aquaculture zones.
Jmse 13 01837 g009
Figure 10. Pearson correlation coefficients between wetland type areas (natural, artificial, and total) and key driving factors: Nighttime Light (NTL), minimum temperature (Min Temp), Gross Domestic Product (GDP), and Palmer Drought Severity Index (PDSI).
Jmse 13 01837 g010
Figure 11. Linear regression models quantifying the relationship between core drivers and wetland area change: (a) NTL vs. natural wetland area (R2 = 0.85), where every 10-unit NTL increase predicts a 1.2 km2 loss, especially evident in mudflat and seawater contraction near high NTL clusters; (b) PDSI vs. artificial wetland area (R2 = 0.89), showing that a 1-unit PDSI decrease corresponds to a 15.09 km2 reduction in aquaculture pond area; (c) GDP vs. total wetland area (R2 = 0.90), where each 10 billion CNY increase is associated with a 4 km2 decline. The combined results indicate a “human pressure dominated, climate modulated” pattern of wetland change, with urban expansion, economic growth, and drought severity as the principal drivers.
Jmse 13 01837 g011
Table 1. Chongming Island wetland classification system.
Primary TypeSecondary TypeDescriptionImage
Natural wetlandMudflatIntertidal zone between high and low tide levels.Jmse 13 01837 i001
Herbaceous marshMarsh wetlands dominated by herbaceous plants and adjacent shallow water areas.Jmse 13 01837 i002
Seawater ZoneShallow marine waters covered by seawater.Jmse 13 01837 i003
Artificial wetlandPondArtificial surface water bodies, including reservoirs, ponds, and storage pools.Jmse 13 01837 i004
Aquaculture pondArtificial water bodies for fish, shrimp and crab farming.Jmse 13 01837 i005
RiverNarrow, naturally of flowing water bodies.Jmse 13 01837 i006
Table 2. Remote sensing imagery bands.
Optical ImageSpectral FeatureParameter VariableDefine or Describe
Landsat8 OLISpectral bandB1Coastal aerosol
B2Blue band
B3Green band
B4Red band
B5NIR band
B6SWIR 1 band
B7SWIR 2 band
Landsat5 TMSpectral bandB1Blue band
B2Green band
B3Red band
B4NIR band
B5SWIR 1 band
B7SWIR 2 band
Table 3. Driving factors and their sources.
Driving FactorFeatureData NameUnitData SourceData Description
Climatic FactorPrePrecipitationmmhttps://em.cams.cma.cn (accessed on 11 October 2024) 2000–2020
1 km spatial resolution
TempTemperature°C
Max TempMax Temperature°C
Min TempMin Temperature°C
RHRelative humidity%
Environmental IndexPDSIPalmer Drought Severity Index-Figshare
https://figshare.com (accessed on 15 September 2021)
Human ActivityPOPPopulation Densitypeople/km2Resource and Environmental Science Data Platform
https://www.resdc.cn (accessed on 15 January 2023)
GDPGross National ProductTen thousand yuan/km2
NTLNight Light-Data sharing and Service Portal https://data.casearth.cn (accessed on 9 October 2023)2000–2020
80 m spatial resolution
Disclaimer/Publisher’s Note: The statements, opinions and data contained in all publications are solely those of the individual author(s) and contributor(s) and not of MDPI and/or the editor(s). MDPI and/or the editor(s) disclaim responsibility for any injury to people or property resulting from any ideas, methods, instructions or products referred to in the content.