
Seafloor Sediment Acoustic Properties on the Continental Slope in the Northwestern South China Sea

 , , ,
, , ,
Abstract
1. Introduction
2. Regional Settings

3. Materials and Methods
4. Results
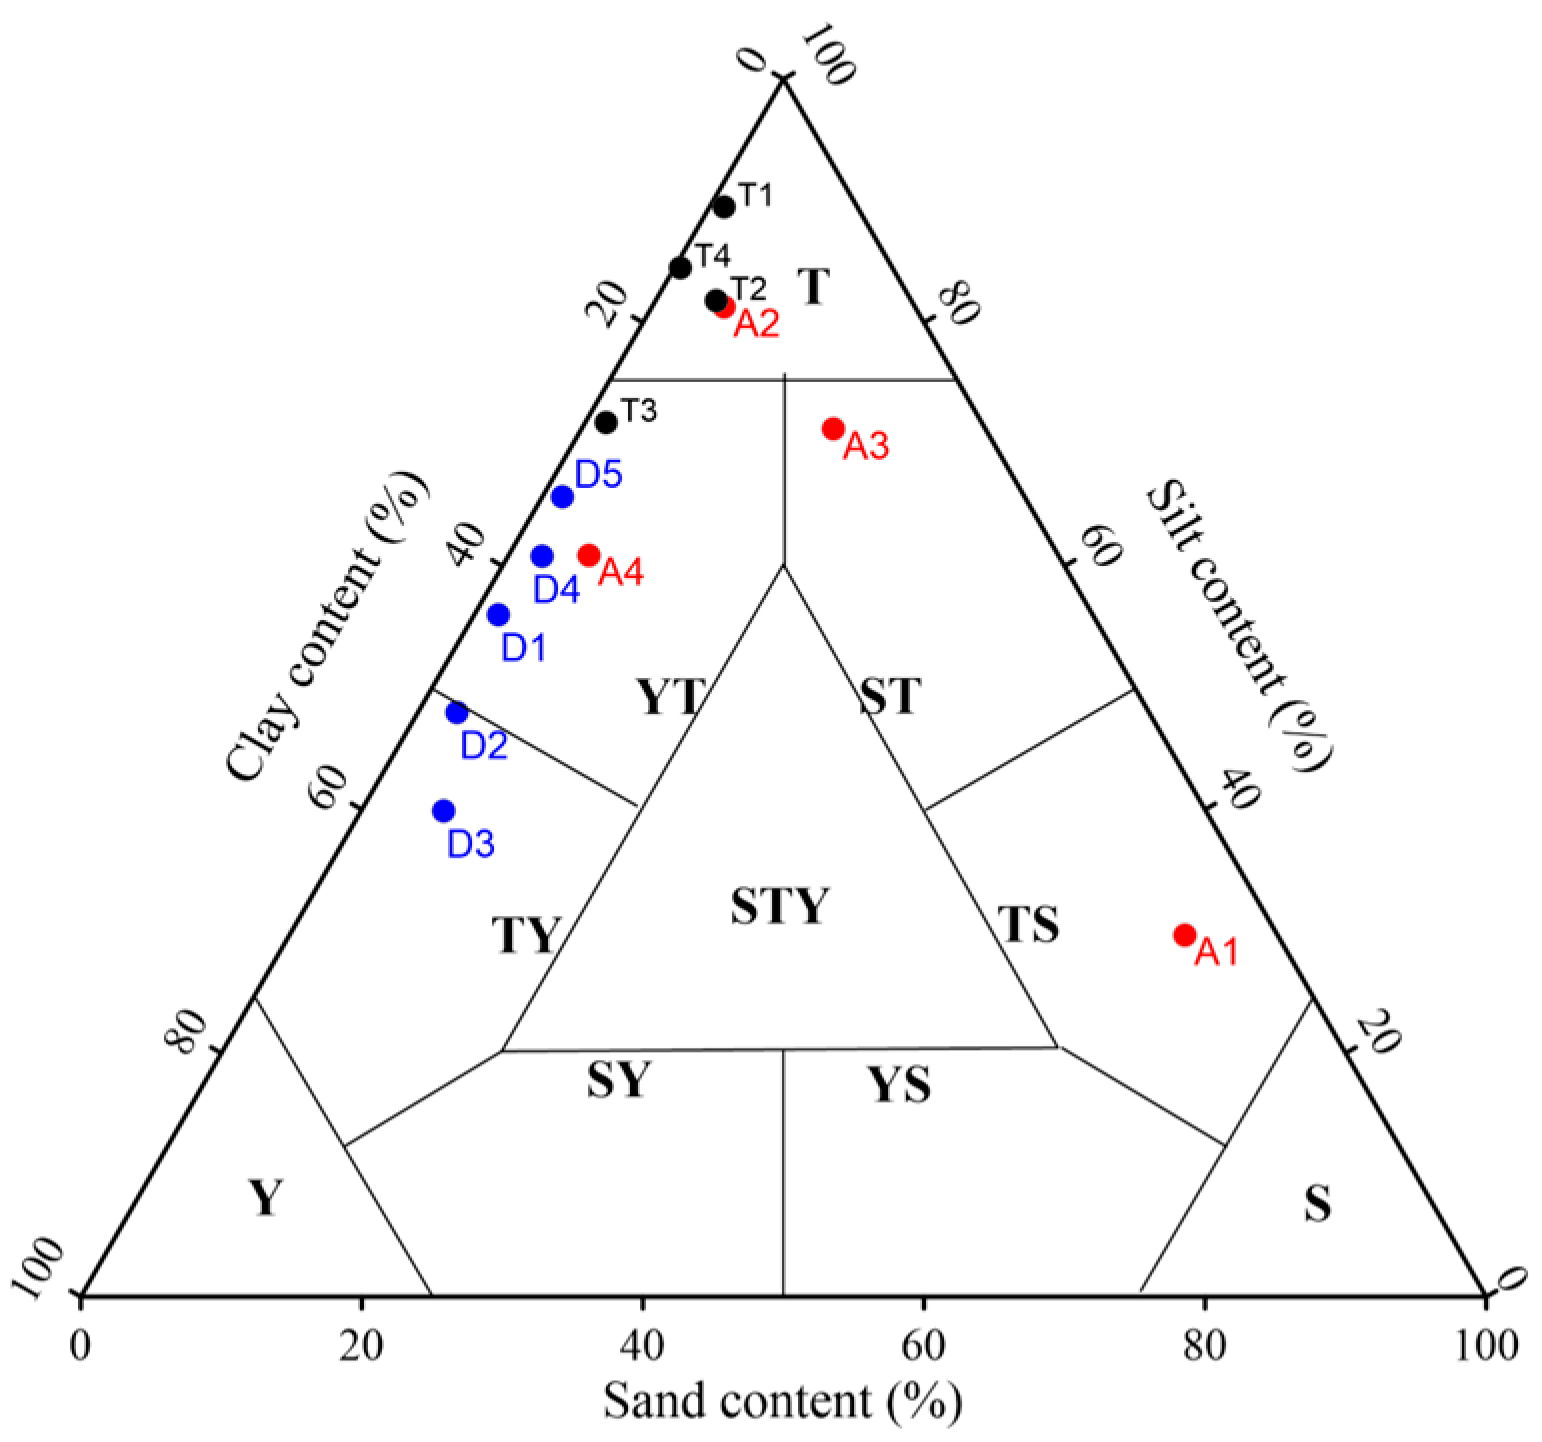
4.1. Sediment Types
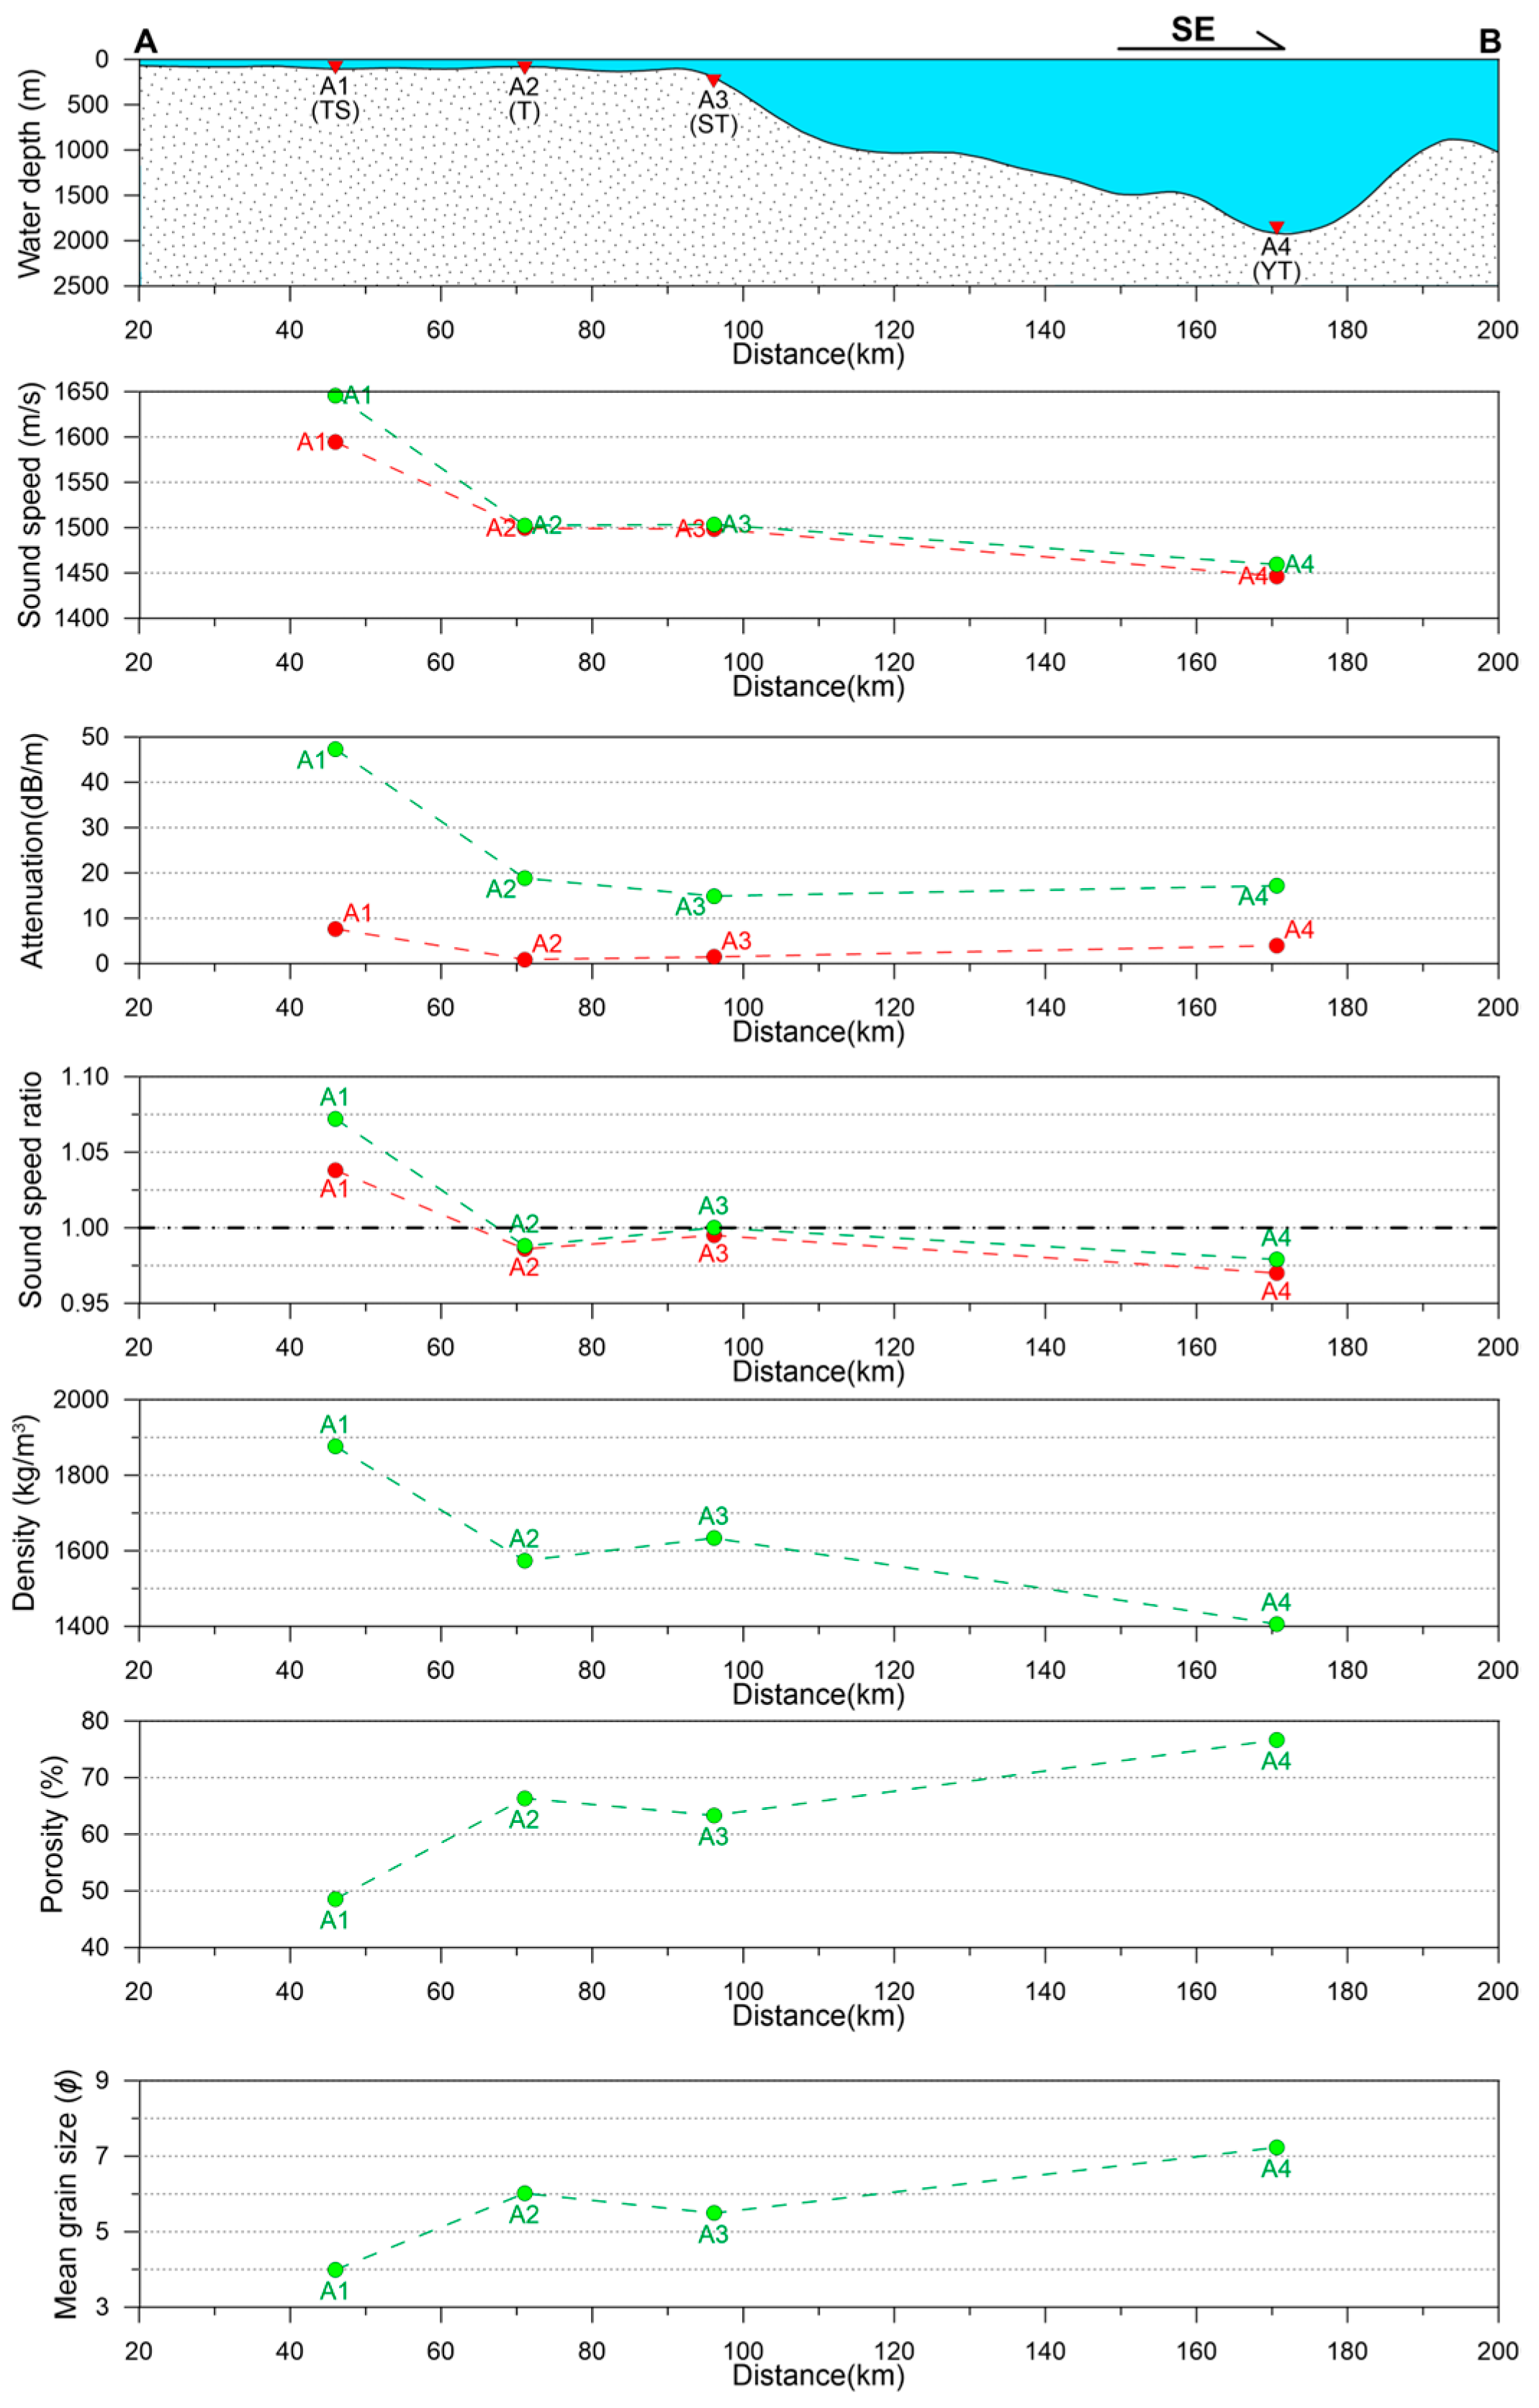
4.2. Acoustic Properties and Corresponding Physical Properties on Section AB
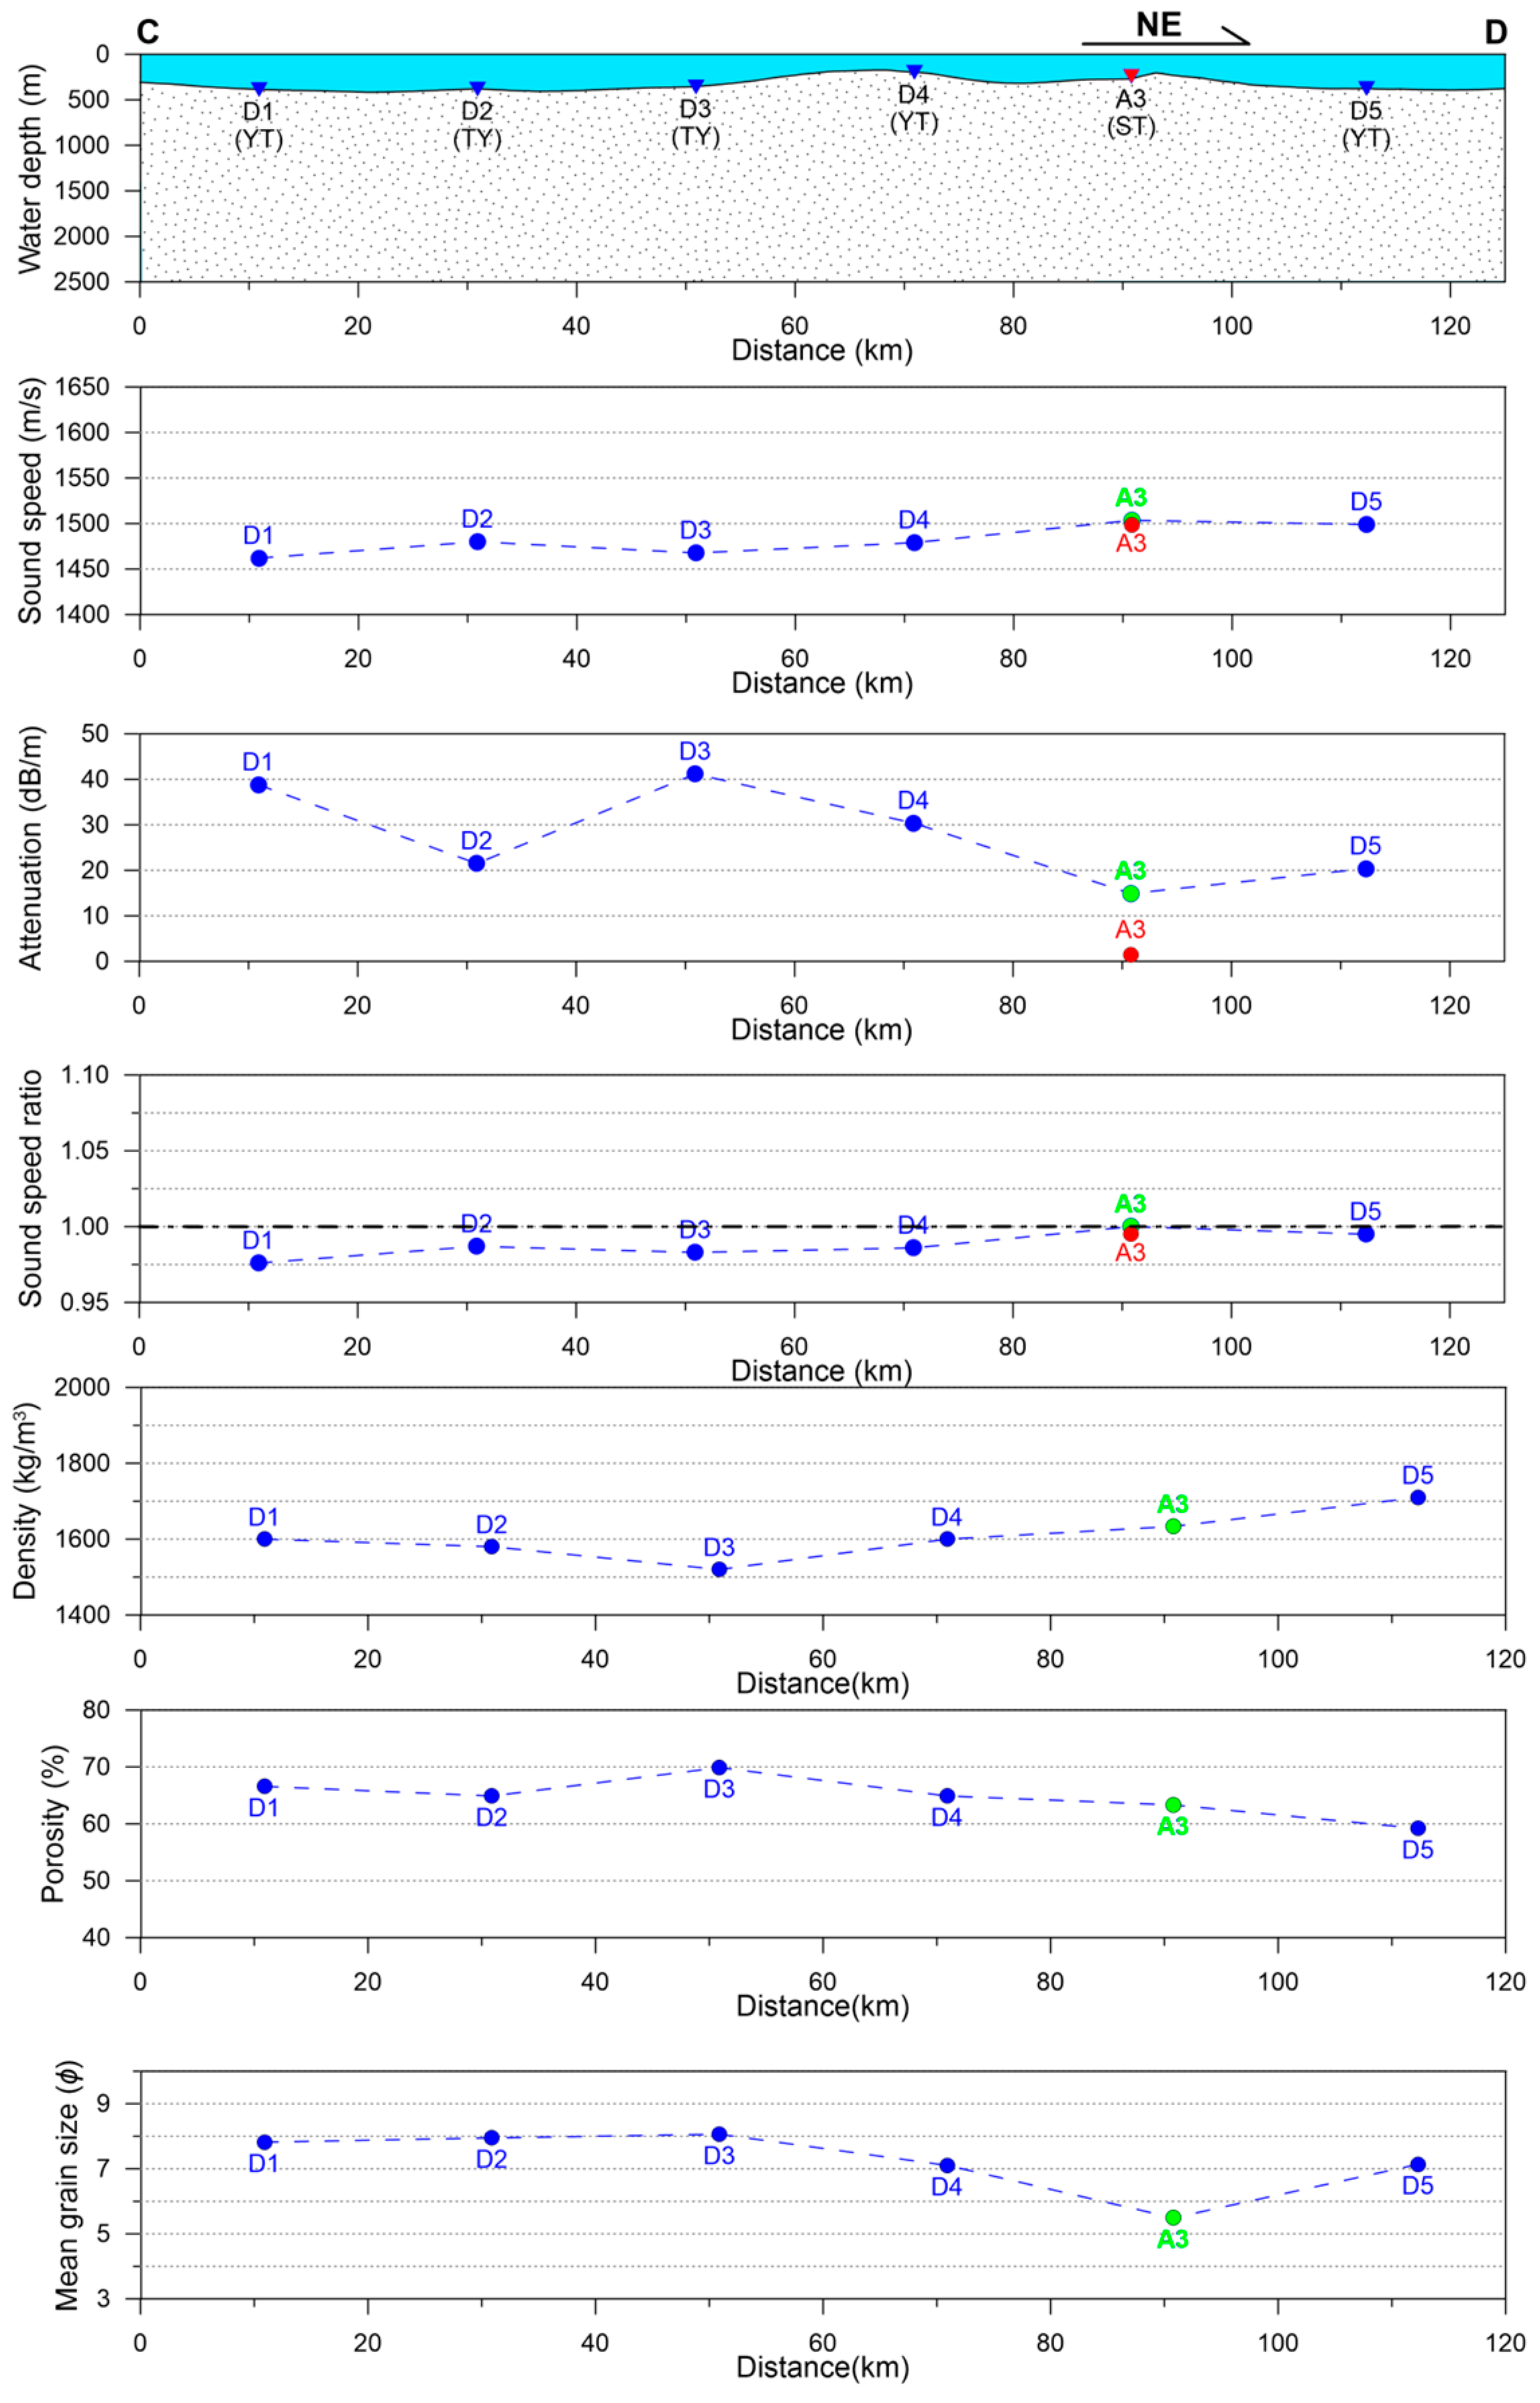
4.3. Acoustic Properties and Corresponding Physical Properties on Section CD
5. Discussion
5.1. Differences between In Situ and Laboratory Acoustic Properties Measurements
5.2. Relationship between Acoustic and Physical Properties
5.3. Sedimentary Environment Controls on Sediment Acoustic Properties
6. Conclusions
Author Contributions
Funding
Institutional Review Board Statement
Informed Consent Statement
Data Availability Statement
Acknowledgments
Conflicts of Interest
References
- Katsnelson, B.; Petnikov, V.; Lynch, J. Fundamentals of Shallow Water Acoustics; Springer: New York, NY, USA, 2012; pp. 55–62. [Google Scholar]
- Frisk, G.V. Ocean and Seabed Acoustics: A Theory of Wave Propagation; P T R Prentice-Hall: Upper Saddle River, NJ, USA, 1994; pp. 1–16. [Google Scholar]
- Jackson, D.R.; Richardson, M.D. High-Frequency Seafloor Acoustics; Springer: New York, NY, USA, 2007; pp. 134–170. [Google Scholar]
- Kim, S.R.; Lee, G.S.; Kim, D.C.; Bae, S.H.; Kim, S.P. Physical properties and geoacoustic provinces of surficial sediments in the southwestern part of the Ulleung Basin in the East Sea. Quat. Int. 2017, 459, 35–44. [Google Scholar] [CrossRef]
- Hamilton, E.L. Sound velocity and related properties of marine sediments, North Pacific. J. Geophys. Res. 1970, 75, 4423–4446. [Google Scholar] [CrossRef]
- Hamilton, E.L. Geoacoustic modelling of the seafloor. J. Acoust. Soc. Am. 1980, 68, 1313–1340. [Google Scholar] [CrossRef]
- Williams, K.L.; Jackson, D.R.; Thorsos, E.I.; Tang, D.; Schock, S.G. Comparison of sound speed and attenuation measured in a sandy sediment to predictions based on the Biot theory of porous media. IEEE J. Ocean. Eng. 2002, 27, 413–428. [Google Scholar] [CrossRef]
- Buckingham, M.J. Compressional and shear wave properties of marine sediments: Comparisons between theory and data. J. Acoust. Soc. Am. 2005, 117, 137–152. [Google Scholar] [CrossRef] [PubMed]
- Zhou, J.; Zhang, X.; Knobles, D.P. Low-frequency geoacoustic model for the effective properties of sandy seabottoms. J. Acoust. Soc. Am. 2009, 125, 2847–2866. [Google Scholar] [CrossRef]
- Hines, P.C.; Osler, J.C.; Scrutton, J.G.E.; Halloran, L.J.S. Time-of-flight measurements of acoustic wave speed in a sandy sediment at 0.6–20 kHz. IEEE J. Ocean. Eng. 2010, 35, 502–515. [Google Scholar] [CrossRef]
- Yang, J.; Tang, D. Direct measurements of sediment sound speed and attenuation in the frequency band of 2–8 kHz at the Target and Reverberation Experiment site. IEEE J. Ocean. Eng. 2017, 42, 1102–1109. [Google Scholar] [CrossRef]
- Chotiros, N.P. Acoustics of the Seabed as a Poroelastic Medium; Springer: New York, NY, USA, 2017; pp. 7–24. [Google Scholar] [CrossRef]
- Wang, J.; Guo, C.; Hou, Z.; Fu, Y.; Yan, J. Distributions and vertical variation patterns of sound speed of surface sediments in South China Sea. J. Asian Earth Sci. 2014, 89, 46–53. [Google Scholar] [CrossRef]
- Tian, Y.; Chen, Z.; Hou, Z.; Luo, Y.; Xu, A.; Yan, W. Geoacoustic provinces of the northern South China Sea based on sound speed as predicted from sediment grain size. Mar. Geophy. Res. 2019, 40, 571–579. [Google Scholar] [CrossRef]
- Wang, J.; Li, G.; Kan, G.; Liu, B.; Meng, X. Experimental study on in situ measurement of acoustic characteristics of deep seabed sediments. Chin. J. Geophy. 2020, 63, 4463–4472, (In Chinese with English abstract). [Google Scholar]
- Liu, B.; Han, T.; Kan, G.; Li, G. Correlations between the in situ acoustic properties and geotechnical parameters of sediments in the Yellow Sea, China. J. Asian Earth Sci. 2013, 77, 83–90. [Google Scholar] [CrossRef]
- Wang, J.; Kan, G.; Li, G.; Meng, X.; Zhang, L.; Chen, M.; Liu, C.; Liu, B. Physical properties and in situ geoacoustic properties of seafloor surface sediments in the East China Sea. Front. Mar. Sci. 2023, 10, 1195651. [Google Scholar] [CrossRef]
- Li, G.; Wang, J.; Liu, B.; Meng, X.; Kan, G.; Han, G.; Hua, Q.; Pei, Y.; Sun, L. In situ acoustic properties of fine-grained sediments on the northern continental slope of the South China Sea. Ocean Eng. 2020, 218, 108244. [Google Scholar] [CrossRef]
- Li, K.Z.; Yin, J.Q.; Huang, L.M.; Lian, S.M.; Zhang, J.L.; Liu, C.G. Monsoon forced distribution and assemblages of appendicularians in the northwestern coastal waters of South China Sea. Estuar. Coast. Shelf Sci. 2010, 89, 145–153. [Google Scholar] [CrossRef]
- Zheng, H.B.; Yan, P. Deep-water bottom current research in the Northern South China Sea. Mar. Georesour. Geotechnol. 2012, 30, 122–129. [Google Scholar]
- Liu, Z.; Tuo, S.; Colin, C.; Liu, J.T.; Huang, C.-Y.; Selvaraj, K.; Chen, C.-T.A.; Zhao, Y.; Siringan, F.P.; Boulay, S.; et al. Detrital fine-grained sediment contribution from Taiwan to the northern South China Sea and its relation to regional ocean circulation. Mar. Geol. 2008, 255, 149–155. [Google Scholar] [CrossRef]
- Liu, J.; Clift, P.D.; Yan, W.; Chen, Z.; Chen, H.; Xiang, R.; Wang, D. Modern transport and deposition of settling particles in the northern South China Sea: Sediment trap evidence adjacent to Xisha Trough. Deep Sea Res. Part I 2014, 93, 145–155. [Google Scholar] [CrossRef]
- Xu, F.J.; Hu, B.Q.; Dou, Y.G.; Liu, X.T.; Wan, S.M.; Xu, Z.K.; Tian, X.; Liu, Z.Q.; Yin, X.B.; Li, A.C. Sediment provenance and paleoenvironmental changes in the northwestern shelf mud area of the South China Sea since the mid-Holocene. Cont. Shelf Res. 2017, 144, 21–30. [Google Scholar] [CrossRef]
- Shi, X.F. China Marine Offshore-Seabed Sediment; China Ocean Press: Beijing, China, 2012; pp. 1–561. (In Chinese) [Google Scholar]
- Liu, Z.; Colin, C.; Li, X.; Zhao, Y.; Tuo, S.; Chen, Z.; Siringan, F.P.; Liu, J.T.; Huang, C.-Y.; You, C.-F.; et al. Clay mineral distribution in surface sediments of the northeastern South China Sea and surrounding fluvial drainage basins: Source and transport. Mar. Geol. 2010, 277, 48–60. [Google Scholar] [CrossRef]
- Zhao, R.; Chen, S.; Olariu, C.; Steel, R.; Zhang, J.; Wang, H. A model for oblique accretion on the South China Sea margin; Red River (Song Hong) sediment transport into Qiongdongnan Basin since Upper Miocene. Mar. Geol. 2019, 416, 106001. [Google Scholar] [CrossRef]
- GEBCO Compilation Group. GEBCO 2023 Grid. Available online: https://doi.org/10.5285/f98b053b-0cbc-6c23-e053-6c86abc0af7b (accessed on 1 August 2023).
- Wang, J.; Li, G.; Liu, B.; Kan, G.; Sun, Z.; Meng, X. Experimental study of the ballast in situ sediment acoustic measurement system in South China sea. Mar. Georesour. Geotechnol. 2018, 36, 515–521. [Google Scholar] [CrossRef]
- Hamilton, E.L. Prediction of in situ acoustic and elastic properties of seafloor sediments. Geophysics 1971, 36, 266–284. [Google Scholar] [CrossRef]
- Zou, D.P.; Williams, K.L.; Thorsos, E.I. Infuence of temperature on acoustic sound speed and attenuation of seafloor sand sediment. IEEE J. Oceanic Eng. 2015, 40, 969–980. [Google Scholar] [CrossRef]
- Kan, G.; Zou, D.; Liu, B.; Wang, J.; Meng, X.; Li, G.; Pei, Y. Correction for effects of temperature and pressure on sound speed in shallow seafloor sediments. Mar. Georesources Geotechnol. 2019, 37, 1217–1226. [Google Scholar] [CrossRef]
- Wang, J.; Li, G.; Kan, G.; Hou, Z.; Meng, X.; Liu, B.; Liu, C.; Sun, L. High frequency dependence of sound speed and attenuation in coral sand sediments. Ocean Eng. 2021, 234, 109215. [Google Scholar] [CrossRef]
- Hou, Z.; Chen, Z.; Wang, J.; Zheng, X.; Yan, W.; Tian, Y.; Luo, Y. Acoustic characteristics of seafloor sediments in the abyssal areas of the South China Sea. Ocean Eng. 2018, 156, 93–100. [Google Scholar] [CrossRef]
- GB/T 12763.8-2007 (National Standards of People’s Republic of China); Specifications for Oceanographic Survey—Part 8: Marine Geology and Geophysics Survey. General Administration of Quality Supervision, Inspection and Quarantine of the People’s Republic of China and National Standardization Management Committee of China: Beijing, China, 13 August 2007.
- GB/T 50123-1999 (National Standards of People’s Republic of China); Standard for Soil Test Method. General Administration of Quality Supervision and Inspection and Quarantine of the People’s Republic of China: Beijing, China, 10 June 1999.
- Shepard, F.P. Nomenclature based on sand-silt-clay ratios. J. Sediment. Res. 1954, 24, 151–158. [Google Scholar]
- Richardson, M.D.; Briggs, K.B. In situ and laboratory geoacoustic measurements in soft mud and hard-packed sand sediments: Implications for high-frequency acoustic propagation and scattering. Geo-Mar. Lett. 1996, 16, 196–203. [Google Scholar] [CrossRef]
- Gorgas, T.J.; Wilkens, R.H.; Fu, S.S.; Frazer, L.N.; Richardson, M.D.; Briggs, K.B.; Lee, H. In situ acoustic and laboratory ultrasonic sound speed and attenuation measured in heterogeneous soft seabed sediments: Eel river shelf, California. Mar. Geol. 2002, 182, 103–119. [Google Scholar] [CrossRef]
- Buckingham, M.J. On pore-fluid viscosity and the wave properties of saturated granular materials including marine sediments. J. Acoust. Soc. Am. 2007, 122, 1486–1501. [Google Scholar] [CrossRef]
- Buckingham, M.J. Wave speed and attenuation profiles in a stratified marine sediment: Geo-acoustic modeling of seabed layering using the viscous grain shearing theory. J. Acoust. Soc. Am. 2020, 148, 962–974. [Google Scholar] [CrossRef] [PubMed]
- Chotiros, N.P.; Isakson, M.J. Comments on “Pore fluid viscosity and the wave properties of saturated granular materials including marine sediments” [J. Acoust. Soc. Am. 122, 1486–1501 2007]”. J. Acoust. Soc. Am. 2010, 127, 2095–2098. [Google Scholar] [CrossRef] [PubMed]
- Li, G.; Kan, G.; Meng, X. Effect of the condition changes on the laboratory acoustic velocity measurements of seafloor sediments. Adv. Mar. Sci. 2013, 31, 360–366, (In Chinese with English abstract). [Google Scholar]
- Hamilton, E.L.; Bachman, R.T. Sound velocity and related properties of marine sediments. J. Acoust. Soc. Am. 1982, 72, 1891–1904. [Google Scholar] [CrossRef]
- Li, G.B.; Hou, Z.Y.; Wang, J.Q.; Kan, G.M.; Liu, B.H. Empirical equations of p-wave velocity in the shallow and semi-deep sea sediments from the South China Sea. J. Ocean Univ. China 2021, 20, 532–538. [Google Scholar] [CrossRef]
- Buckingham, M.J. Theory of acoustic attenuation, dispersion, and pulse propagation in unconsolidated granular materials including marine sediments. J. Acoust. Soc. Am. 1997, 102, 2579–2596. [Google Scholar] [CrossRef]
- Liu, Z.F.; Zhao, Y.L.; Colin, C.; Stattegger, K.; Wiesner, M.G.; Huh, C.A. Source-to-sink transport processes of fluvial sediments in the South China Sea. Earth Sci. Rev. 2016, 153, 238–273. [Google Scholar] [CrossRef]
- Liu, J.P.; Xue, Z.; Ross, K.; Wang, H.J.; Yang, Z.S.; Li, A.C.; Gao, S. Fate of sediments delivered to the sea by Asian large rivers: Long-distance transport and formation of remote along shore clinothems. SEPM Sediment. Rec. 2009, 7, 4–9. [Google Scholar] [CrossRef]
- Fang, G.H.; Fang, W.D.; Fang, Y.; Wang, K. A survey of studies on the South China Sea upper ocean circulation. Acta Oceanogr. Taiwan 1998, 37, 1–16. [Google Scholar]
- Caruso, M.J.; Gawarkiewicz, G.G.; Beardsley, R.C. Interannual variability of the Kuroshio intrusion in the South China Sea. J. Oceanogr. 2006, 62, 559–575. [Google Scholar] [CrossRef]
- Qu, T.D.; Girton, J.B.; Whitehead, J.A. Deepwater overflow through Luzon Strait. J. Geophys. Res. 2006, 111, C01002. [Google Scholar] [CrossRef]
- Zhao, W.; Zhou, C.; Tian, J.W.; Yang, Q.X.; Wang, B.; Xie, L.L.; Qu, T.D. Deep water circulation in the Luzon Strait. J. Geophys. Res. Oceans 2014, 119, 790–804. [Google Scholar] [CrossRef]
- Liu, J.G.; Clift, P.D.; Yan, W.; Chen, Z.; Chen, H.; Xiang, R. Temporal and spatial patterns of sediment deposition in the northern South China Sea over the last 50,000 years. Palaeogeogr. Palaeoclimatol. Palaeoecol. 2017, 465, 212–224. [Google Scholar] [CrossRef]


| Station | Sediment Type | Sand Content (%) | Silt Content (%) | Clay Content (%) | Density (kg/m3) | Porosity (%) | Mean Grain Size (ϕ) |
|---|---|---|---|---|---|---|---|
| A1 | Silty sand | 63.8 | 29.7 | 6.5 | 1876 | 48.6 | 3.994 |
| A2 | Silt | 5.2 | 81.3 | 13.5 | 1574 | 66.4 | 6.018 |
| A3 | Sandy silt | 18.0 | 71.2 | 10.8 | 1634 | 63.3 | 5.494 |
| A4 | Clayey silt | 5.7 | 60.9 | 33.4 | 1406 | 76.7 | 7.231 |
| D1 | Clayey silt | 1.7 | 56.0 | 42.3 | 1602 | 66.6 | 7.820 |
| D2 | Silty clay | 2.8 | 48.0 | 49.2 | 1584 | 64.9 | 7.953 |
| D3 | Silty clay | 5.9 | 39.9 | 54.2 | 1521 | 69.9 | 8.064 |
| D4 | Clayey silt | 2.4 | 60.8 | 36.8 | 1599 | 64.9 | 7.108 |
| D5 | Clayey silt | 1.4 | 65.7 | 32.9 | 1713 | 59.2 | 7.139 |
| Station | Depth (m) | Vinsitu (m/s) | SSRinsitu | αinsitu (dB/m) | kinsitu (dB/m/kHz) | Vlab (m/s) | SSRlab | αlab (dB/m) | klab (dB/m/kHz) |
|---|---|---|---|---|---|---|---|---|---|
| A1 | 92 | 1594 | 1.038 | 7.63 | 0.254 | 1613 | 1.072 | 47.28 | 0.426 |
| A2 | 143 | 1499 | 0.986 | 0.89 | 0.030 | 1486 | 0.988 | 18.84 | 0.170 |
| A3 | 244 | 1499 | 0.994 | 1.48 | 0.049 | 1504 | 0.998 | 14.91 | 0.134 |
| A4 | 1865 | 1446 | 0.970 | 3.96 | 0.132 | 1473 | 0.979 | 17.17 | 0.155 |
| D1 | 385 | — | — | — | — | 1462 | 0.976 | 38.81 | 0.343 |
| D2 | 379 | — | — | — | — | 1480 | 0.987 | 21.51 | 0.190 |
| D3 | 356 | — | — | — | — | 1465 | 0.981 | 41.17 | 0.364 |
| D4 | 298 | — | — | — | — | 1479 | 0.986 | 30.37 | 0.269 |
| D5 | 376 | — | — | — | — | 1499 | 0.995 | 20.38 | 0.180 |
Disclaimer/Publisher’s Note: The statements, opinions and data contained in all publications are solely those of the individual author(s) and contributor(s) and not of MDPI and/or the editor(s). MDPI and/or the editor(s) disclaim responsibility for any injury to people or property resulting from any ideas, methods, instructions or products referred to in the content. |
© 2024 by the authors. Licensee MDPI, Basel, Switzerland. This article is an open access article distributed under the terms and conditions of the Creative Commons Attribution (CC BY) license (https://creativecommons.org/licenses/by/4.0/).
Share and Cite
Li, G.; Wang, J.; Meng, X.; Hua, Q.; Kan, G.; Liu, C. Seafloor Sediment Acoustic Properties on the Continental Slope in the Northwestern South China Sea. J. Mar. Sci. Eng. 2024, 12, 545. https://doi.org/10.3390/jmse12040545
Li G, Wang J, Meng X, Hua Q, Kan G, Liu C. Seafloor Sediment Acoustic Properties on the Continental Slope in the Northwestern South China Sea. Journal of Marine Science and Engineering. 2024; 12(4):545. https://doi.org/10.3390/jmse12040545
Chicago/Turabian StyleLi, Guanbao, Jingqiang Wang, Xiangmei Meng, Qingfeng Hua, Guangming Kan, and Chenguang Liu. 2024. "Seafloor Sediment Acoustic Properties on the Continental Slope in the Northwestern South China Sea" Journal of Marine Science and Engineering 12, no. 4: 545. https://doi.org/10.3390/jmse12040545
APA StyleLi, G., Wang, J., Meng, X., Hua, Q., Kan, G., & Liu, C. (2024). Seafloor Sediment Acoustic Properties on the Continental Slope in the Northwestern South China Sea. Journal of Marine Science and Engineering, 12(4), 545. https://doi.org/10.3390/jmse12040545