Article

Installation Disturbance of Helical Anchor in Dense Sand and the Effect on Uplift Capacity Based on Discrete Element Method

1
School of Civil Engineering and Architecture, Northeast Electric Power University, Jilin 132012, China
2
China Energy Engineering Group Heilongjiang Electric Design Co., Ltd., Harbin 150090, China
3
College of Architecture and Civil Engineering, Beijing University of Technology, Beijing 110124, China
*
Author to whom correspondence should be addressed.
J. Mar. Sci. Eng. 2024, 12(3), 422; https://doi.org/10.3390/jmse12030422
Submission received: 1 February 2024 / Revised: 20 February 2024 / Accepted: 26 February 2024 / Published: 27 February 2024
(This article belongs to the Special Issue New Challenges in Offshore Geotechnical Engineering Developments)

Abstract

:
Helical anchors have been extensively employed as foundation systems for carrying tension loads due to their installation efficiency and large uplift capacity. However, the installation influences of helical anchors are still not well understood, especially for multi-helical anchors. The matrix discrete element method was used to model the process of helical anchor penetration and pull-out in dense sand to investigate the effects of the anchor geometry and advancement ratio (AR, the relative vertical movement per rotation) on soil disturbance, the particle flow mechanism, and the uplift capacity. For shallow helical anchors, the overall disturbance zone is the shape of an inverted cone after installation, while for deep helical anchors, it is funnel-shaped. The advancement ratio has significant effects on the soil particle movement and uplift capacity of helical anchors. The soil particle flow mechanism around helical plates has been identified for single-helix anchors at various advancement ratios, and for double-helix anchors, the influence of the top plate on particle movement during installation was investigated. The uplift capacities of both single- and double-helix anchors increase with the decrease in the AR (AR = 0.5~1), and the influence decreases with the anchor embedment ratio. The efficiency of double-helix anchors induced by installation is close to 1 at pitch-matched installation (AR = 1), indicating that the impact of the top plate during installation is minimal in this case.

1. Introduction

A helical anchor, consisting of one or more helical plates welded to a steel shaft, is a deep foundation system used to support or resist any load or application. It has been extensively employed in many engineering systems, such as offshore platforms, pipelines, transmission towers, slopes and embankments, due to its rapid installation and immediate service, relatively large load-bearing capacity, and no associated environmental damage [1,2,3,4]. It is a form of displacement pile or anchor, screwed into the ground by applying a torque at the top of the anchor together with a crowd force [5,6,7]. There exists a coupling effect of compression and shear on the surrounding soil during the installation process. The installation effects cannot be ignored in practical engineering.
In recent years, research on the installation effect and required load of helical anchors has been increasing, including studies on the disturbed zone, density change, soil parameters after disturbance [8,9,10], lateral earth pressure and uplift or compressive performance after disturbance [11,12,13,14], installation requirements, particle motion during screwing and the torque correlation factor [15,16,17,18]. Some studies have investigated the impact of the installation advancement ratio (AR) on the load-bearing performance of single-helix anchors, where the AR is defined as the ratio of vertical displacement per one rotation Δz to helix pitch ph [16,19,20]. Cerfontine et al. [16,20] found that a lower vertical displacement per rotation can significantly reduce the necessary crowd force during installation or even generate some pull-in, and the uplift stiffness and capacity of the pile were enhanced by this installation process, but the torque remained relatively unchanged. In addition, the pile capacity in tension generally increases as the AR is reduced and reaches a maximum for AR = 0.5, while the compressive capacity reduces.
Extensive experiments [8,13,21,22,23,24,25,26,27,28,29,30], numerical analyses [12,31,32,33,34,35,36,37], and theoretical analyses [38,39,40] have been conducted on the load-bearing performance of helix anchors. Tsuha et al. [28] performed centrifuge uplift loading tests on 12 different types of piles installed in two sands with different densities to examine the effect of the number of helices on the performance of helical anchors in sand. This investigation indicated that in double- and triple-helix anchors, the contributions of the second and third plate to the total anchor uplift capacity decreased with the increase in the sand relative density and plate diameter because the upper soil layers were penetrated more times. Lutenegger et al. [13] conducted field load tests on the compression and tension of helical anchors and measured the degree of installation disturbance using the ratio of uplift and compression-bearing capacity. Wang et al. [29] conducted a series of model tests in dense saturated sand and found the installation speed and helix diameter have a significant influence on the uplift capacity of the helical piles. Nagai et al. [30] studied the effect of the installation method on the performance of helix piles through calibration chamber tests and found that the load–displacement relationship strongly depended on the installation method, but that the second-limit uplift resistance was almost unaffected. Cerfontine et al. [41] used the finite element method to predict the full tensile load–displacement response of shallow helix anchors installed in sand for practical use, incorporating the effects of a pitch-matched installation, and found the compression (crowd) load applied during the anchor installation phase modified the stress field around the anchor, which in turn affected the anchor uplift stiffness. The DEM has also been used to investigate the installation effects of helical anchors [31,32,33]. Cerfontine et al. [31] found that when a single-helix pile is installed at AR < 1, the soil particles below the helical plate show an upward movement trend. Sharif et al. [32,33] investigated the effects of the base geometry, shaft diameter, and helix pitch of single-helix anchors by simulating the full installation process prior to conducting axial compression and tension tests and proposed the possible optimization of the geometry of the screw pile to reduce installation requirements.
Among these methods, the DEM can visually observe the movement of particles during installation and its impact on bearing capacity. The discrete element method (DEM) is based on molecular dynamics and was first developed in the fields of physics and fluid dynamics. In this method, the granular assemblies are made up of a series of soft particles, which obey Newton’s equations of motion. The behavior of granular material can be simulated by investigating the movement of the discrete assemblies [41,42,43,44]. However, existing research on pile installation effects based on the DEM has focused on complex screw piles (augers) [18] and single-helical piles at a certain depth [31,32,33]. The installation effects of multi-helix anchors and single-helix anchors at different embedment depths on particle displacement and uplift capacity are still unclear.
Therefore, this investigation used the discrete element method (MatDEM software version 3.4) to simulate the installation and pull-out process of single- and double-helix anchors to analyze the installation disturbance caused by different advancement ratios and the influence on the subsequent uplift performance. Firstly, the discrete element method and procedures, and the particle contact parameter calibration and simulation scheme are described (Section 2). Then, the disturbance zones, the soil particle motion, around single- and double-helix anchors during anchor installation were analyzed and the particle flow mechanism at different advancement ratios were discerned (Section 3). Finally, the effects of installation on the uplift capacity were investigated by comparing the results of wish-in-place and installed single-helix anchors, and the results of anchors with different advancement ratios are presented. Moreover, the efficiency of double-helix anchors at different advancement ratios is compared (Section 4).

2. Method and Models

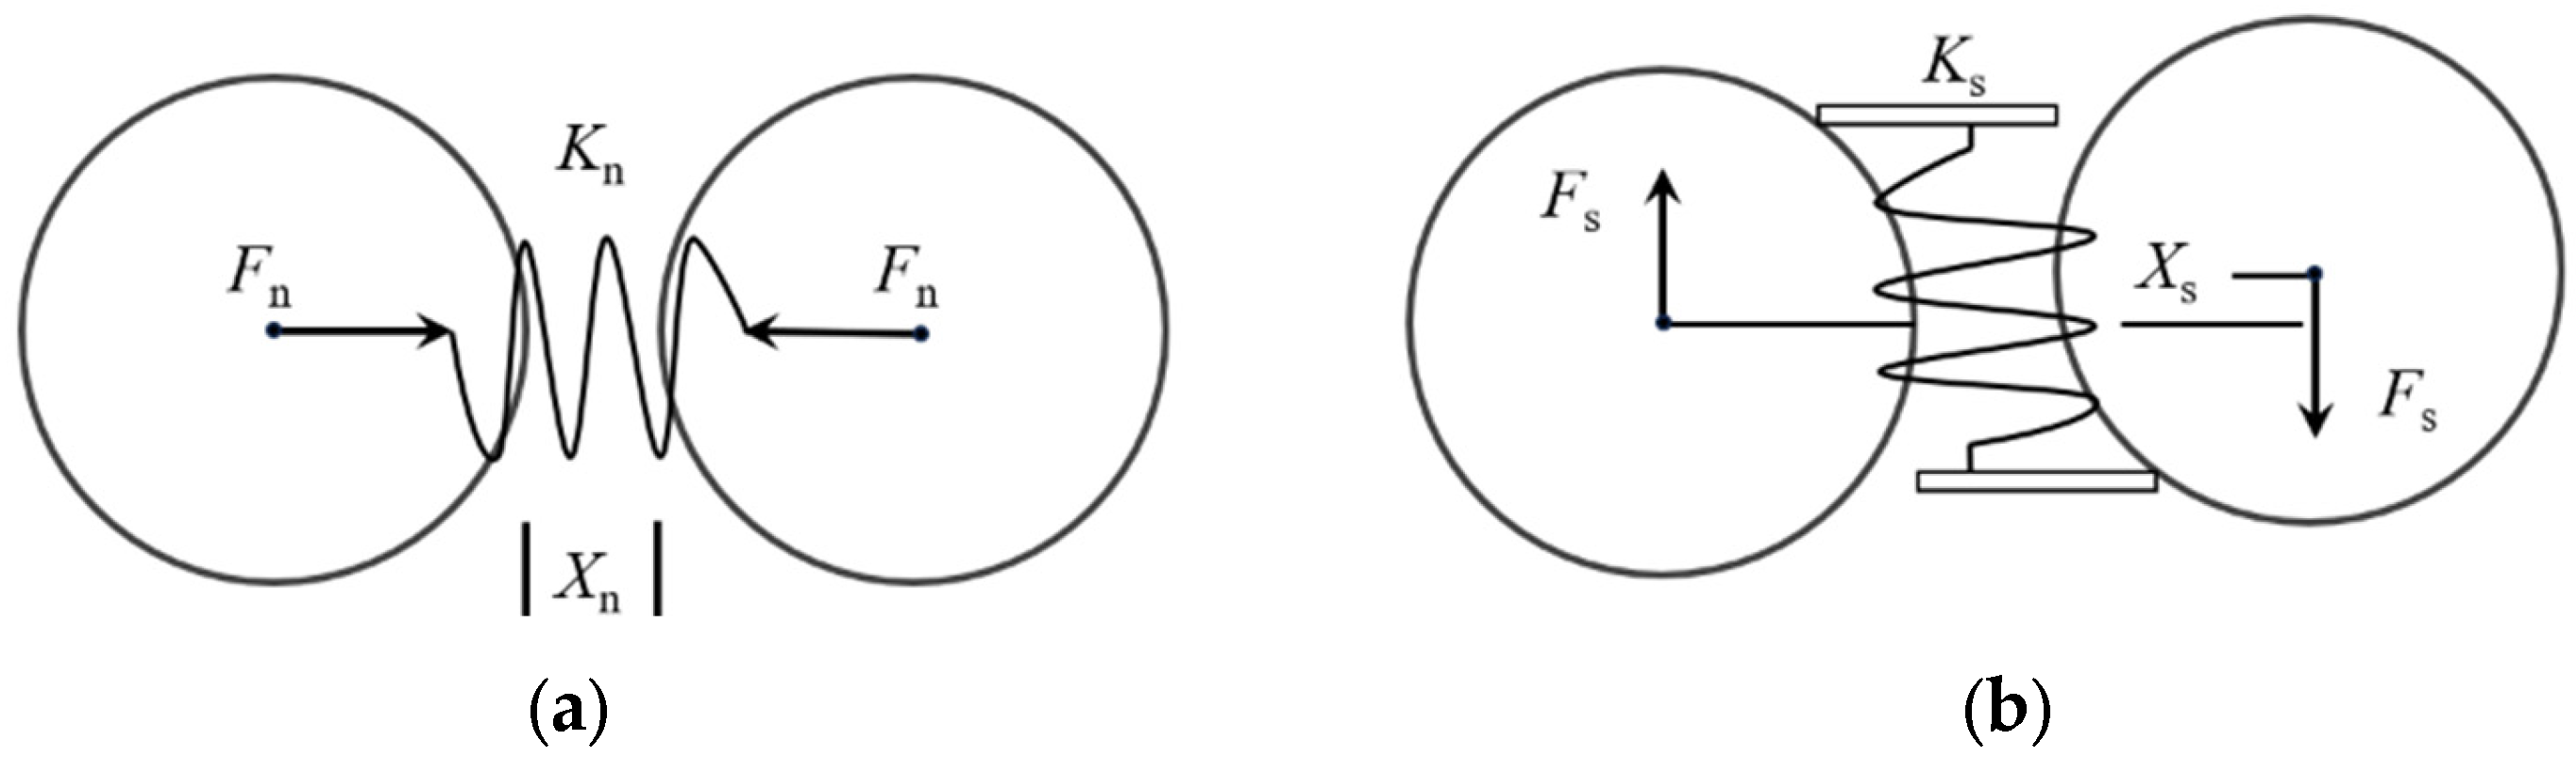
2.1. Introduction to MatDEM and Contact Model

The discrete element method (DEM) starts with analyzing the inter-block contact of discrete elements to identify their constitutive relationship, establishing a physical and mechanical model of the contact, and simulating discontinuous and discrete elements according to Newton’s second law. This study employed the MatDEM software, developed by Nanjing University. It runs in the Matlab environment, with data stored in matrix form in objects. All operations are converted into pure matrix operations, which can be analyzed in real time. It supports mixed CPU and GPU computing, and can switch between the two in real time during program operation, greatly improving the computational speed of particle simulation [45].
In the most basic linear elastic model, it is assumed that particles interact with each other and generate forces through springs. The normal force Fn and normal deformation Xn between particles can be simulated through the normal spring between particles, as shown in Figure 1a. The particles are initially connected to each other and interact with each other through tension (positive tension) or compression. When the relative displacement between the two particles exceeds the fracture displacement Xb, springs are broken, the tension disappears and only compression exists.
Similarly, the simulation of the shear force and shear deformation between particles through tangential springs is shown in Figure 1b. When two particle surfaces contact with each other and slide in the shear direction, the tangential force generated is opposite to the relative movement direction. This tangential force can be considered the action of tangential springs between particles. The interaction force between particles is determined by Equations (1)–(4) [41].
F n = K n X n , X n < X b Complete   connection 0 , Connection   broken
F s = K s X s
For a complete connection of particles, the maximum tangential force allowed by the Coulomb criterion is
F smax = F s 0 μ p F n Complete   connection
F smax = μ p F n Connection   broken
In the formulas, Fn is the normal force; Kn is the normal stiffness; Xn is the normal relative displacement; Xb is the fracture displacement; Fs is the tangential force; Ks is the tangential stiffness; Xs is the tangential relative displacement; Fs0 is the inter-granular shear resistance; μp is the inter-particle friction coefficient. Fsmax is the maximum shear force; Fs0 is the shear resistance between particles.
When the tangential force exceeds the maximum allowable tangential force, the tangential connection between the two particles is broken, the shear resistance (Fs0) is zero, and only sliding friction force (−μpFn) exists [41].
In the case of equal particle size, the microscopic mechanical parameters Kn, Ks, Xb, Fs0, μp between particles can be calculated through five macroscopic mechanical parameters, including Young’s modulus E, Poisson’s ratio v, compressive strength Cu, tensile strength Tu, and internal friction coefficient μi, as well as particle diameter d. Equations (5)–(9) represent analytical solutions between macroscopic and microscopic mechanical parameters under the same particle size.
X b = 3 K n + K s T u d 2 6 2 K n K n + K s
K n = 2 4 1 2 υ E d
K s = 2 1 5 υ 4 1 + υ 1 2 υ E d
F s 0 = 1 2 μ p 6 C u d 2
μ p = 2 2 + 2 I 2 + 2 I , I = 1 + μ i 2 1 / 2 + μ i 2

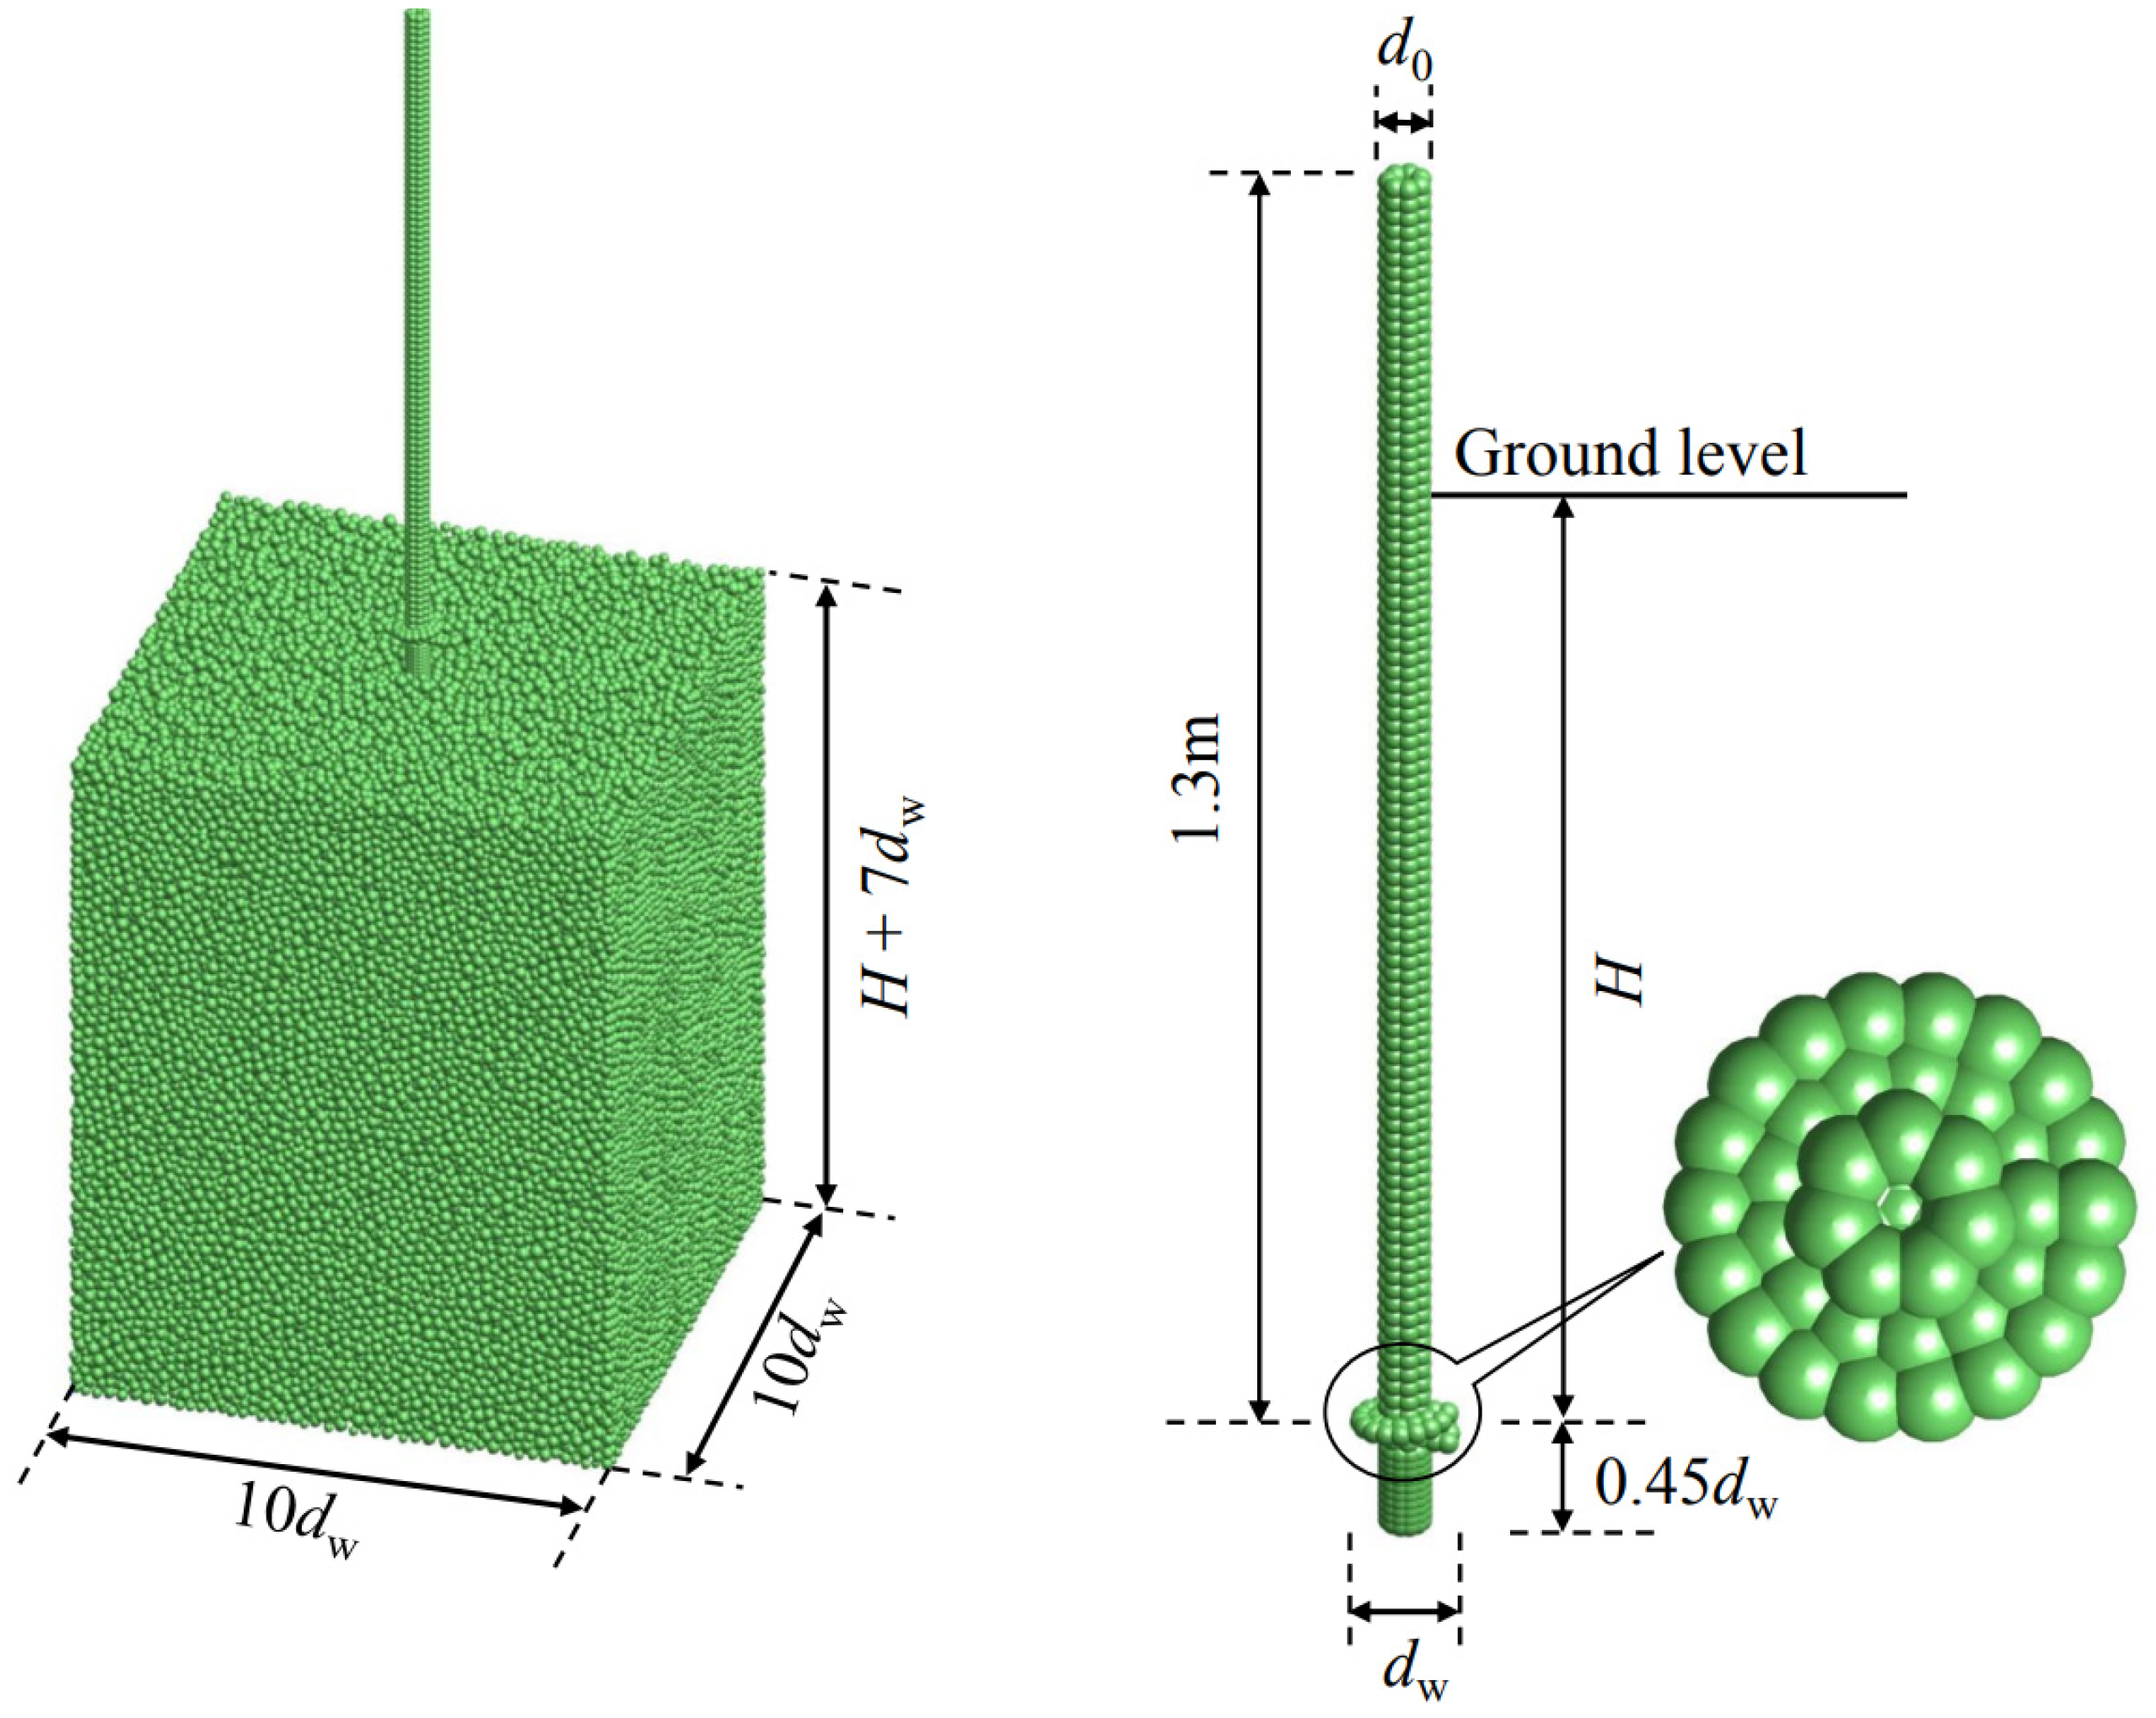
2.2. Model Establishment Steps and Model Parameter Calibration

To calibrate the micro-mechanical parameters in the DEM numerical calculation model, a model test of a single-helix anchor in reference [30] (test numbers De-A, Lo-A) was first simulated, where the anchor was installed continuously in homogeneous dense sand and then pulled out. The size of the calibration chamber is 1 m × 1 m × 1.2 m, in which a uniformly distributed load of 100 kPa was applied on the soil surface. The single-helix anchor rod diameter d0 and plate diameter dw are 48.6 mm and 97.2 mm, respectively, and the embedment ratio H/dw equals 5.
The installation and pull-out process of a helical anchor in MatDEM can be achieved in four steps by establishing four sub-files for analysis: (1) Establish an initial accumulation model, namely the soil model; (2) establish an anchor model and assemble it with the soil, then assign material parameters; (3) set the installation load for iterative calculation of helical anchor installation. The installation is controlled by vertical displacement and angular displacement, both of which satisfy the relationship of penetrating into the soil at one pitch after one rotation (1ph/r), that is, the advancement ratio AR = 1; (4) set up the uplift displacement for iterative calculation of helical anchor pull-out.
When establishing the initial soil layer, to reduce the run time of the simulation, a particle distribution scaling value of 56 was used in the whole sand layer, which was selected based on the minimum recommended ratio of the diameter of the pile core to the median particle size d50 of 2.69 [46]. Then, the median particle size d50 was set as 18 mm, 1/2.7 times the rod diameter d0 of 48.6 mm. The dispersion coefficient was 0.25, and the ratio of maximum to minimum particle size (d100/d0) is (1 + 0.25)2. And to ensure the soil particles passing through the helix pitch opening do so smoothly, helix pitch ph was set as 50 mm. In order to balance the boundary effect and calculation time, the sand layer width is set to 10 times the helix diameter (dw). The computational domain size (10 dw) can cause negligible effects because the sand displacement at the boundary during the installation and pulling out of the anchor is less than 1 mm (0.056 d50), which is close to the results (13 times pile diameter) for pile installation [32]. The length of the simulated sand layer is set to 1.2 m, that is, anchor embedment depth H plus 7 dw, which is large enough to avoid boundary effects. It is judged from this simulation of the calibration model that the distance of 1 dw from anchor bottom to bottom boundary will not produce boundary effects. Therefore, in subsequent simulation models in Section 3 and 4, the length of the sand layer is set to 1.33 m (more than embedment depth plus 1 dw). The number of soil particles in calculation domain is 150,000~160,000. Pressure plates above the soil was installed to achieve gravity accumulation. Due to the setting of an overburden pressure of 100 kPa above the soil in the calibration chamber, an overburden pressure of 100 kPa was also set in the validation model simulation, but it was not set in the subsequent analysis of the influence of the installation advancement ratio. The helical anchor size was set according to the actual size of the model test. The simulation model is shown in Figure 2.
When simulating the installation, the displacement loading conditions for the anchor are set as follows: vertical displacement is the embedment depth H, and angular displacement is 2πH/ph. After installation, apply an upward displacement of 0.01 m (10% dw) to the top of the anchor to pull the anchor. In order to control the calculation time, 50 incremental steps were set during the installation and pulling out phases, with each incremental step corresponding to 20 sub-incremental steps, totally including 2000 iterative calculations with 400,000 iterations.

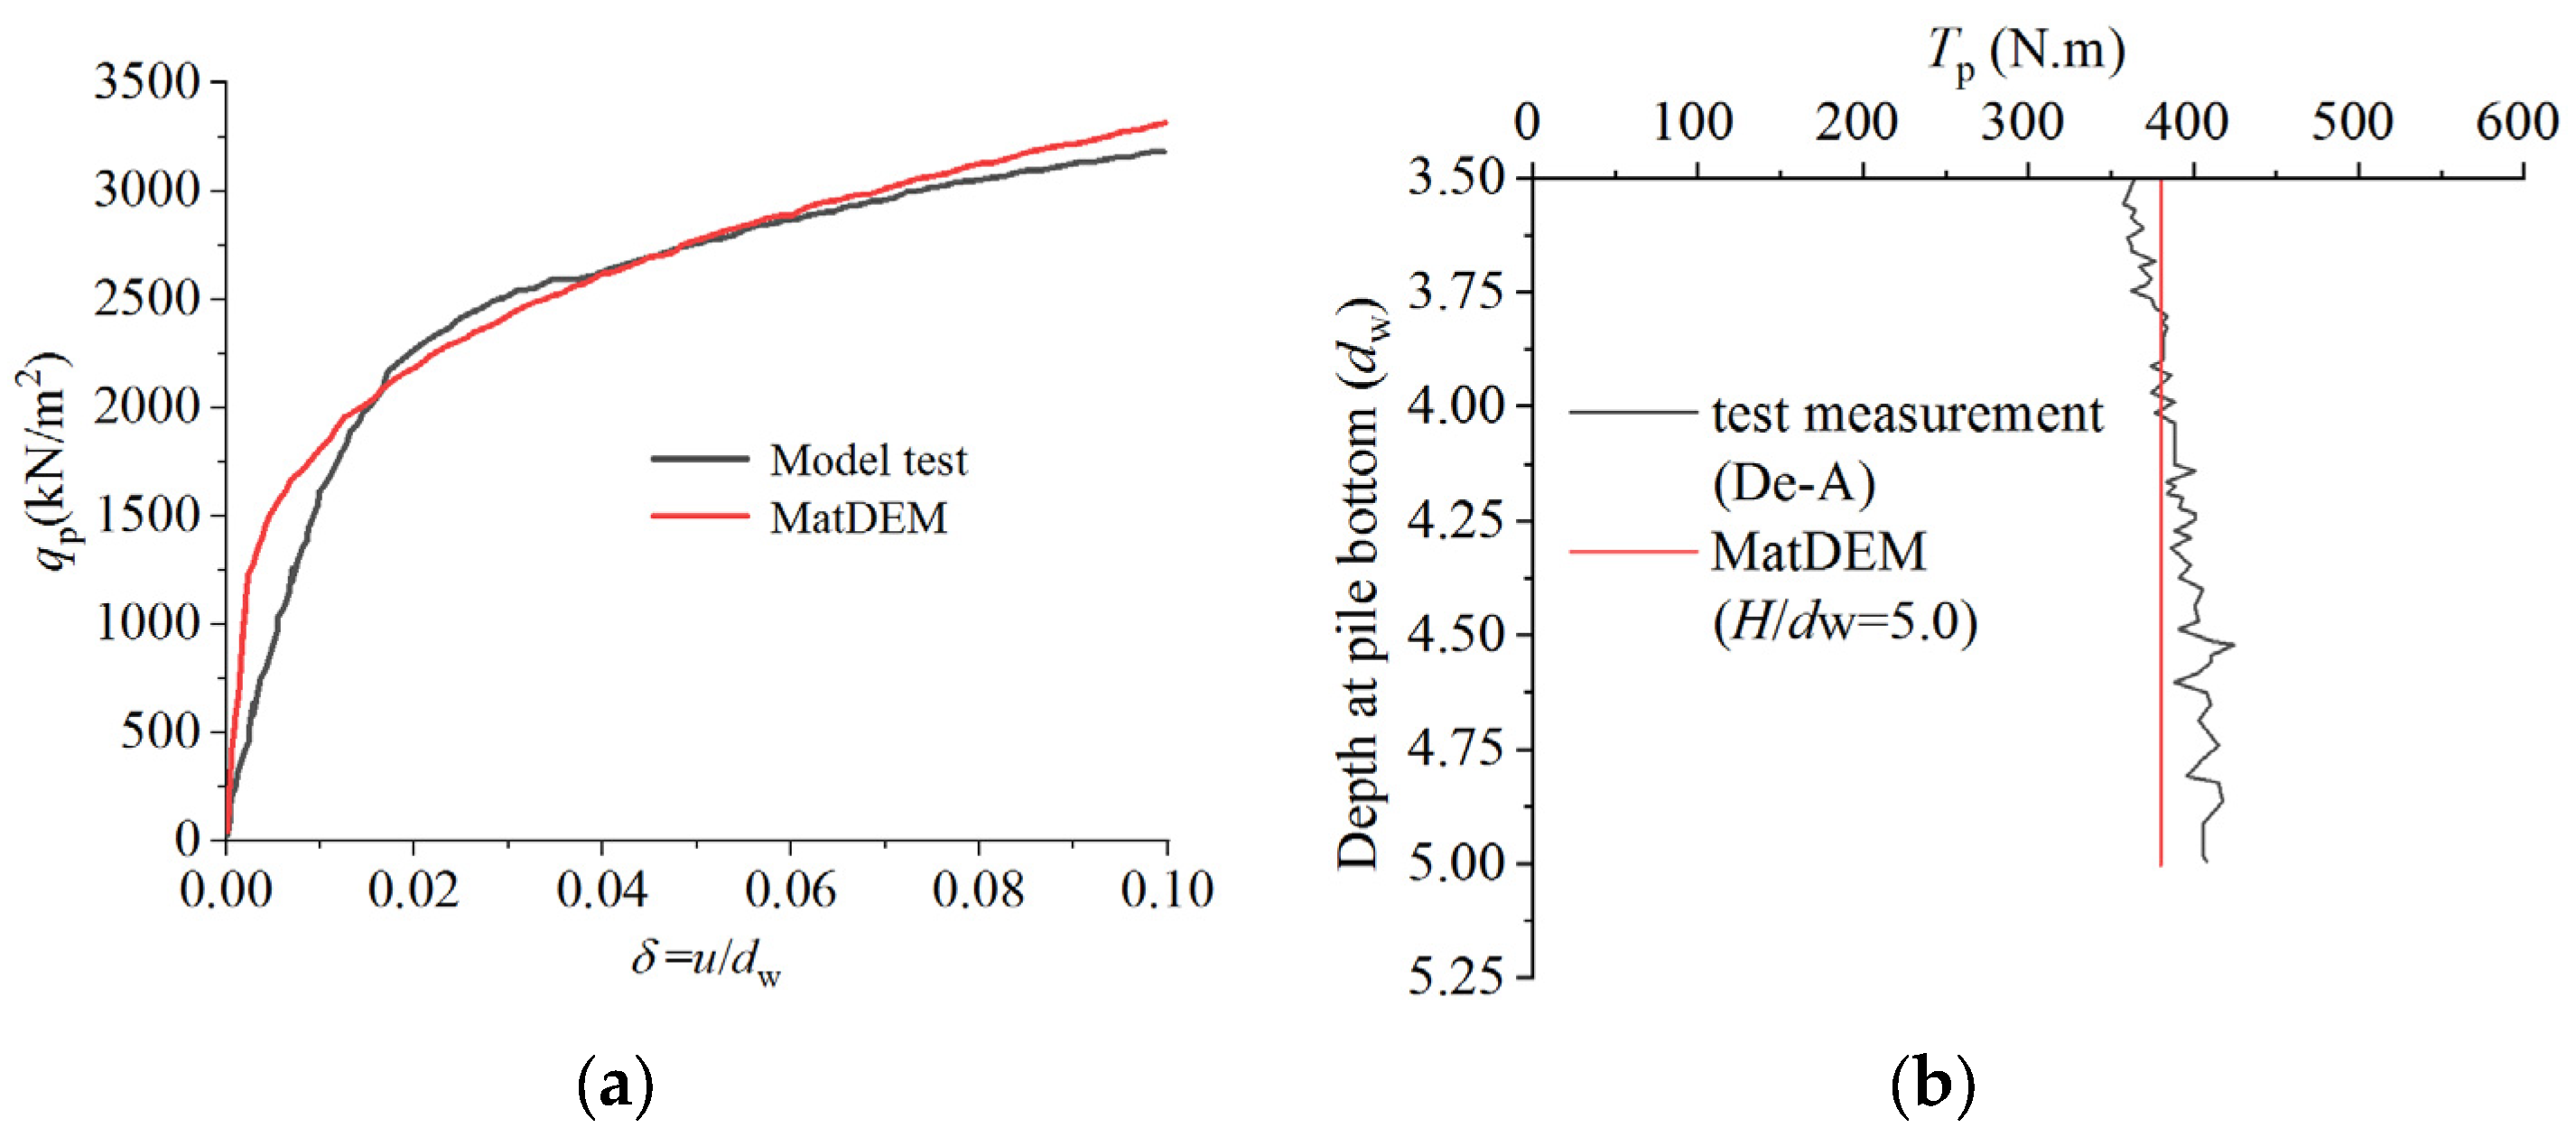
2.3. Particle Contact Parameter Calibration

The macro-parameters input in MatDEM need to be determined first based on the original parameter values, multiplying the “rate” matrix that was trained by the “material training” module. The default rate matrix for five macro-mechanical parameters E, v, Tu, Cu, μi, and ρ is [2.7, 0.8, 6.0, 6.5, 1, 1.19]. And then, the micro-mechanical parameters were determined in terms of macro-mechanical parameters, as the analytical Formula (5)~(9). The original macro-parameters μi and ρ originate from the literature [30], and other parameters are determined by several attempts based on empirical parameters of sand. The final particle contact parameters were calibrated by comparing the results obtained from the pull-out model test with the numerical simulation results of variable parameters.
The numerical results used to determine the particle contact parameters were plotted against model test results, as shown in Figure 3, in which u is upward displacement, dw is helix diameter, δ is the ratio of displacement to helix diameter, qp represents the average pressure on the entire cross-section of the anchor plate. And the calculated torque value in terms of the torque–uplift capacity relationship formula [7] was compared to the value obtained in the test, as shown in Figure 4.
As the upward displacement increases, the anchor plate pressure increases, and it does not reach a stable stage within the displacement loading. The curve exhibits three stages of straight, curved, and straight characteristics. The initial slope of the straight line segment in the numerical result is significantly higher than the experimental result, but the final straight line stage of the two curves basically coincides and the starting displacement point of the straight line is similar. This study takes the uplift capacity corresponding to 10% dw displacement as the ultimate uplift capacity [47]. Then, the ultimate uplift capacity only differs by 4.2%, and the torque at a position of 5 dw differs by only 7.2%. Overall, the ultimate capacity and trend of the load–displacement curve obtained from the numerical simulation are in good agreement with the model test results, and these input parameters are used as subsequent calculation parameters, as shown in Table 1.

2.4. Simulation Scheme

Based on the calibration of micro-mechanical parameters, the numerical simulations varying the anchor geometry and installing advancement ratio were conducted to investigate the installation disturbance and its effects on uplift capacity. The simulation program is listed in Table 2. The first group is used to examine the effects of the embedment ratio and advancement ratio on installation effects for single-helix anchors, including the comparisons of pre-embedment (wish-in-place) and installation at AR = 1. The second group is used to examine the effects of helix number and their relative spacing for double-helix anchors. The helix pitch and shaft diameter d0 are 50 mm and 0.5 dw.

3. Particle Motion Induced by Installation

3.1. Single-Helix Anchor Installed at AR = 1 (Surcharge p = 100 kPa)

An arbitrary face through vertical axis z can be cut to examine the particle motion characteristics due to the axial symmetry of the geometry and the installation. The Y-axis middle section was selected to exhibit the displacement nephogram of the soil particles during the drilling process, as shown as Figure 4.
Figure 4 shows the results of a single-helix anchor with H/dw =12 (ground surcharge p = 100 kPa) during installation at AR = 1. It can be seen that the displacement of particles around the anchor is significantly greater than that of the outer surrounding particles, and the particles near the ground surface around the shaft are uplifted. The white dashed line is the contour with a particle displacement of half a particle’s radius (approximate 5 mm). It is shown that at the drilling depth L, which is shallow and less than 6 dw, the particles within the zone of 1.4 dw around the plate move. The disturbed zone from the helical plate to the ground surface presents as an inverted cone shape. The radius of the disturbed zone on the ground surface is about 5.6 times the radius of the helical plate.
As the anchor drilling proceeds, the overlying pressure on the anchor plate increases, and the lateral movement of particles around the anchor plate is gradually limited. The particle movement area below 6 dw ground level does not expand; the radial compression around the plate is more obvious. The range of soil particle movement around the anchor gradually transforms from an approximately inverted cone (L = 3~6 dw) to a funnel shape (white line) (L = 9~12 dw), approaching a shape that is a combination of an inverted cone and a cylinder. The diameter of the cylinder below remains, basically, non-varied, at 1.5 dw, and the influence radius on the ground surface slowly increases with the drilling depth. For the single-helix anchor, the overall disturbance zone is funnel-shaped after installation.
The horizontal displacement of the soil particles ux were extracted at the axial radius rdw/2 along the ground surface to the bottom of the soil layer at different drilling depths, and the scatter points are plotted in Figure 5, with solid lines representing the envelopes of ux. As the drilling depth increases, the particle motion becomes more intense and the maximum horizontal displacement value gradually increases. However, when the drilling depth L = 9 dw and 12 dw, the maximum horizontal displacement is basically the same, with a value of about the radius of the helical plate, and occurs about 2 dw above the plate. From the maximum displacement position to the depth of the anchor plate, the horizontal displacement gradually decreases until its value approaches zero; the soil particles mainly move vertically within this range.
The upper portion of the envelopes at different drilling depths are basically overlapped, which indicates that the displacement of the upper soil particles has inheritance and is no longer affected by the lower helix continuous penetration.

3.2. Single-Helix Anchors Installed at Different Advancement Ratios (ARs)

Figure 6 shows the comparisons of the particle displacement during the installation for AR = 0.5 and 1. The particle displacements are greater in the case of the smaller advancement ratio. When the anchor drills into the soil for less than 6 dw, the influence zone caused by the installation are basically the same. When the anchor drills greater than 9 dw, the difference in the particle motion zone for the different AR is obvious; the influence zone increases as the AR decreases.
In order to observe the particle displacement more clearly, the vertical and horizontal particle displacements after the installation of the anchor with an embedment ratio of 12 at different ARs are shown in Figure 7. The white dashed boxes is the periphery of helix diameter and the red boxes represent the area of significant particle movement.
It can be observed from the displacement nephogram for AR = 1 that the particles around the anchor shaft are primarily displaced downwards and laterally and soil particles outside the diameter of the anchor plate display an upward displacement to different extents. The downwards flow-around mechanism may cause the sand around the shaft and above the plate to loosen, which is the reason for the decrease in the uplift capacity [18,26].
It can be seen from the nephogram of AR = 0.5 that the particles around the anchor shaft are primarily displaced upwards and laterally. Within the white dashed area, the cylindrical zone of the plate diameter, the particle lateral displacements for AR = 0.5 are larger than those for AR = 1. But the range value of the particle lateral displacements in the outer zone, represented by the red dashed area, are basically the same. The radial motion of particles within the cylindrical zone along the helical plate will not change the sand density. This indicates that the installation with AR = 0.5 (over-flighted) makes particles denser than the installation with AR = 1.0 (pitch-matched).

3.3. Double-Helix Anchors Installed at Different Advancement Ratios

Figure 8 shows the soil particle displacement nephogram of the double-helix anchors with different relative helix spacing at AR = 0.5. Blue and red circles roughly indicate the particle motion zones above the top helix and between the two helices in Figure 8a. And the boxes in Figure 8b roughly represent the area where particles exhibit lateral motion. For the double-helix anchors, the soil above the upper helical plate is disturbed more obviously than for the single-helix anchor because it has been penetrated twice. The particles above the upper helical plate move upwards and laterally more intensely during drilling. The obvious heave of the ground surface occurs. The displacement of soil particles between the two plates also changes significantly compared to that of a single-helix anchor, although the soil between the plates is only penetrated once, which indicates that the installation of the top plate will affect the movement of soil particles between the plates.
When the relative helix spacing is from 4.5 to 3, the vertical displacement nephograms show the red color of the particles between the two plates gradually decreases compared with the color of the single-helix anchor at the same depth, which indicates the amount of particles below the top plate rolling to the above of the top plate probably decreases. Compared to the single-helix anchor, the lateral displacement of the soil particles on the top helix increases significantly, which probably decreases the friction resistance around the shaft.
To further explore the impact of the top helix on the movement of soil particles between two helical plates, the particle displacement with an absolute vertical displacement and lateral displacement greater than 9 mm (0.5 d50) are extracted and plotted in Figure 9 and Figure 10, with dashed lines representing envelope lines. Black, red and blue dashed lines corresponds to the cases of single-helix, double-helix with S/dw = 3 and double-helix with S/dw = 4.5 respectively.
The lateral displacement of soil particles between the two helical plates is significantly reduced by the constraint of the two plates, especially for the anchor with a relative spacing of 3. There is a significant mutation in the lateral displacement of soil particles above and below the top helix for S/dw = 3.
In the case of AR = 0.5, vertical displacements of soil particles along the depth of the single-helix and double-helix anchors are basically upwards. The vertical displacement of the particles above the top plate are greater than that of the single-helix anchor. Combined with the lateral displacement rule mentioned before, this will make the sand above the top plate looser than that of the single-helix anchor. The vertical displacement of the soil particles between the two plates is less than that of the singe-helix anchor, which indicates that the top plate also has a limitation for the upwards movement of particles. And the limitation of the top plate is greater in the case of smaller helix spacing. Then, the soil particles between the two plates for a relative spacing of 3 is probably denser than those for a relative spacing of 4.5.
Figure 11 shows the particle displacement nephograms of double-helix anchors at AR = 1. The downward movement of soil particles in the columnar area (white dashed line) of the double-helix anchor is more severe than that of the single-helix anchor. This phenomenon above the top plate is because the upper soil zone is penetrated twice. And this phenomenon between the two plates is due to the effects of the downwards flow-around mechanism. The bottom plate is a lead plate, and the downward flow of particles above the bottom plate might cause the soil to become loose, which can make the particles above the top plate flow downwards easier. At the periphery of the white dashed columnar area with a depth of less than 6 times the helix diameter (red ellipse), there is a significant upward displacement of soil particles. And the lateral displacement of the double-helix anchor in the peripheral area is more pronounced than that of a single-helix anchor.
Similarly, particle displacement with absolute vertical displacement and lateral displacement greater than 0.5d50 were extracted and are plotted in Figure 12 and Figure 13. The red and blue dashed lines in Figure 12 indicate envelope lines of lateral displacement between two helices of double-helix anchors with S/dw = 3.0 and 4.5 respectively, and black one is the envelope line of single-helix anchor corresponding to the same position. Same as with the case of AR = 0.5, the lateral displacement of the soil particles between the plates is significantly reduced by the constraint of the two plates compared to that for the single-helix anchor, but the difference in the lateral displacements for the different relative spacing is not obvious. Unlike AR = 0.5, there is no obvious difference in the lateral displacement of the soil particles above the top plate for the case of the double-helix and single-helix anchors when AR = 1. This might not result in an obvious change in the shaft friction.
It can be seen from Figure 13 that there is a difference in the vertical displacement of the soil particles between the two plates compared to a single-helix anchor at the same depth, although the change in the particle displacement between the plates is not as significant as in the case of AR = 0.5. Combined with the lateral and vertical displacement of particles between the two plates, it can be inferred that the soil between the two plates may become loose or dense. And more soil particles are encouraged to move downwards around the top plate compared to the case of a single-helix anchor.
In order to summarize the particle motion mechanisms during the installation of the single-helix and double-helix anchors, a schematic diagram of the particle motion for different ARs is plotted in Figure 14.
For the single-helix anchor, when AR = 0.5, the particles above the plate move upwards, which is known as the upward flow-around mechanism, and when AR = 1, the particles above the plate move downwards, which is known as the downward flow-around mechanism. For the double-helix anchor, the lateral displacements of the particles between the two plates are smaller than those for the single-helix anchor regardless of the AR value. When the AR = 0.5, the upward motions of the particles below the top plate are limited and the upward displacement is smaller than that of the single-helix anchor, while when the AR = 1, the downward motion of the particles above the top plate is accelerated slightly and the downwards displacement is slightly greater than that of the single-helix anchor. Therefore, it is concluded that the density change in the sand between the two plates will be also affected by the top plate although the sand in this area is only penetrated once by the bottom plate. And the effects are greater with the decrease in the relative helix spacing. As a result, it will affect the uplift capacities.

4. Effects of Installation on Uplift Capacity

4.1. Single-Helix Anchors Pre-Embedded and Installed at AR = 1 (Surcharge p = 100 kPa)

Figure 15 shows the load–displacement curves of the single-helix anchor for installation at AR = 1 and wish-in-place conditions with a surcharge p of 100 kPa. The trends of these curves are similar, and the slope of the initial straight section of the wish-in-place curve is slightly higher than that of the installation curve, which indicates that the soil has been disturbed and has become loose at AR = 1. As the uplift displacement increases, the difference in the uplift resistance between the two placement methods becomes more obvious. Taking a displacement of 10% dw as a control criterion of the ultimate uplift capacity, the ultimate uplift capacity for the torsional installation, Qu,1.0, is 12~18% lower than the value for the pre-embedded condition Qup.
To better compare the ultimate uplift capacities of the two placement methods, Qup, Qu,1.0, and Qu,1.0/Qup are plotted in Figure 16. When embedment ratio is no more than 10, the uplift capacity loss caused by installation disturbance gradually increases as the embedment ratio increases. However, when embedment ratio is more than 10, the impact of installation disturbance on the uplift capacity becomes less with the embedment depth. This may be related to the failure mode. For small and medium-sized helical anchors in dense sand, when H/dw > 10, it may be in the deep mode. The failure area for a deep anchor does not increase with the increase in the embedment depth, so the reduction in the uplift capacity caused by installation slows down with the increase in the embedment depth.

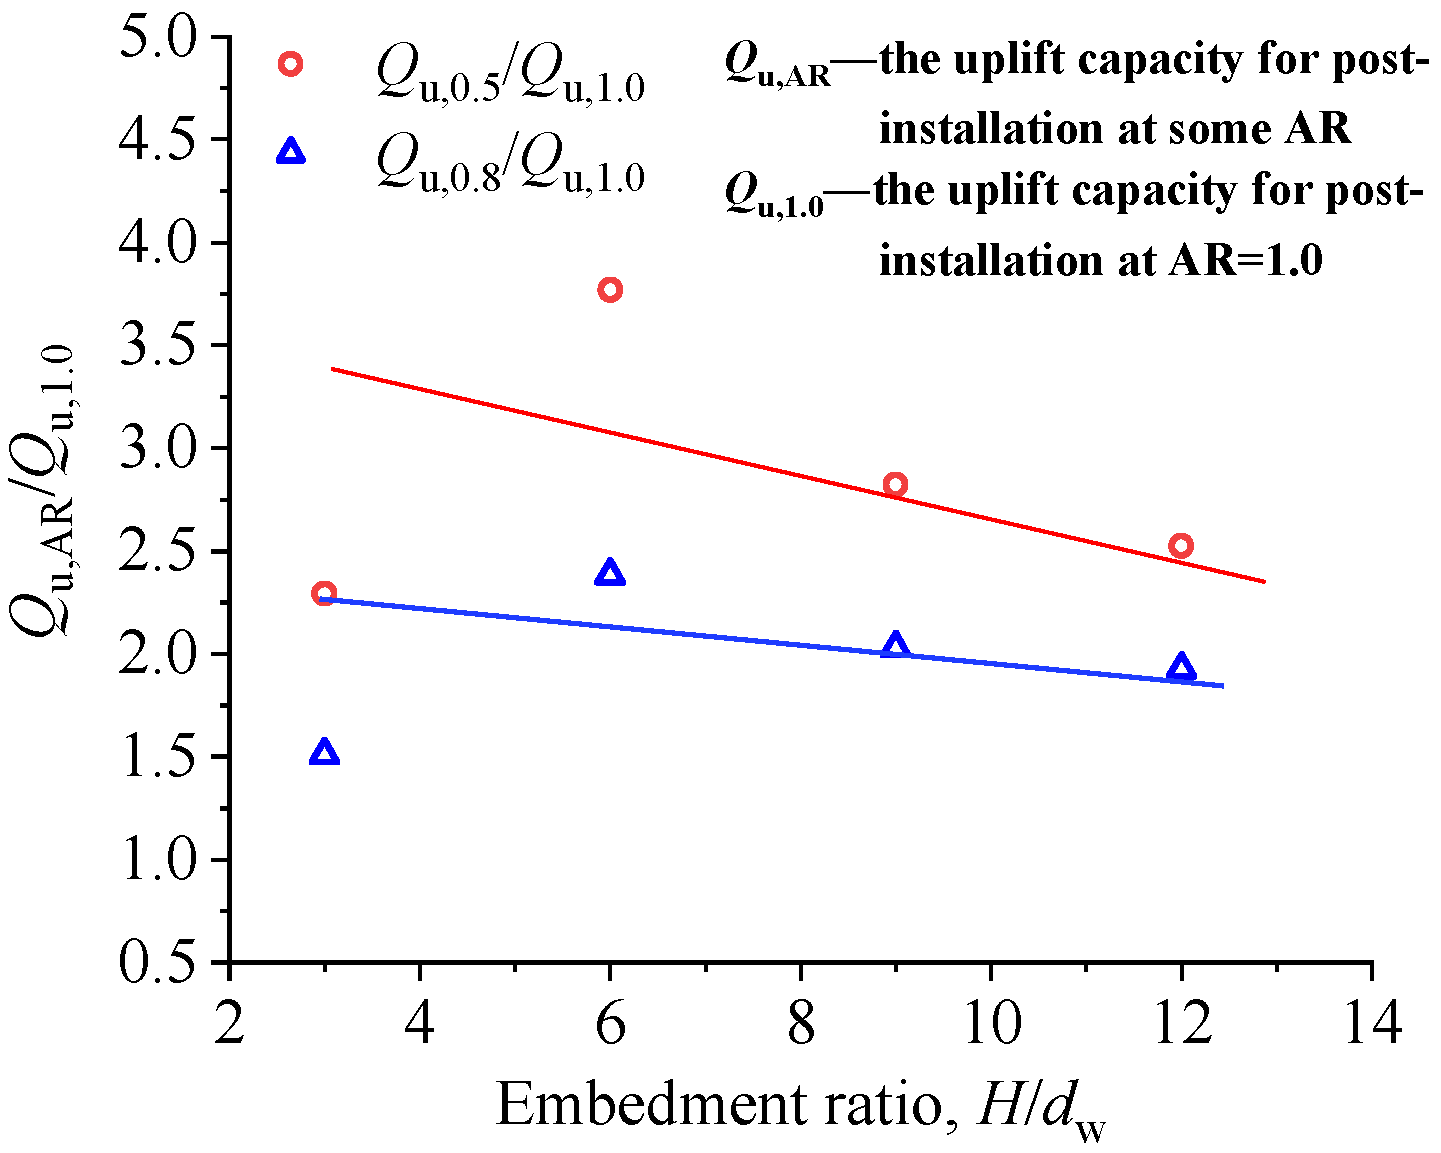
4.2. Single-Helix Anchors Installed at Different Advancement Ratios

Figure 17 shows the relationships of the uplift resistance and displacement for various ARs and embedment ratios. To analyze the impact of the installation advancement ratio on the uplift capacity at different embedment ratios, the uplift capacity for post-installation at AR = 0.5 and 0.8 were compared with the uplift capacity at AR = 1, as shown in Figure 18.
The advancement ratio has significant effects on the uplift capacity of helical anchors. The uplift resistance of helix anchors increases with the decrease in the AR, which is closely related to the soil particle motion caused by installation. As mentioned before, the soil particles below the plate move upwards, and the lateral displacements of the soil in severely disturbed areas around anchors decrease when anchors are installed at a low AR, which makes the soil around the anchor more compact than that at a high AR. And when the AR reaches 1, the pitch-matched installation will make the sand above the plate loose.
As shown in Figure 18, the overall trend is that for the cases of over-flight installations (AR < 1), the increment in the uplift capacity compared with the cases of pitch-matched installations (AR = 1) decreases as the embedment ratio increases. This change is related to the pressure acted on the moving particle during the installation process. As the embedment ratio increases, the confinement pressure around the helical plate increases, and the downward or upward movement mechanisms of the particles are restricted, resulting in a decrease in the change in the uplift capacity caused by installation at various advancement ratios.
The comparisons between the results of this study and other results were made, as shown in Figure 19. The solid symbols are the results of the centrifuge tests from Cerfontaine et al. [16], the hollow symbols are the results of the DEM from Sharif et al. [32], the star and multiplication symbols are the results of this study. Figure 19 includes the centrifuge test ID 1~11 of a flat-base pile P1 (prototype embedment depth H ≈ 8 m, shaft and helix diameter ratio Ds/Dh = 0.52) in dense sand and medium dense sand and the ID 12~17 of an asymmetric-base pile P2 (Ds/Dh = 0.52, H = 8.65 m), P5 (Ds/Dh = 0.66, H = 9.05 m), P4 (Ds/Dh = 0.38, H = 8.45 m) in dense sand. All the piles have the same prototype helix diameter Dh of 1.06 m and a helix pitch ph of 0.35 m.
It can be seen that all of these studies present the same trend of the impact of the AR on the uplift capacity. The uplift capacity increases with the decrease in the AR, and at AR = 0.8, the calculation results of this study are similar to the results of loose sand in Sharif et al. [26], while the remaining results are higher than the other research results. This may be due to the smaller diameter of the helical plate in this numerical model, where the constraint pressure around the plate is small, and the upward flow-around mechanism for the particles is formed easily, which makes the soil above the plate become denser.

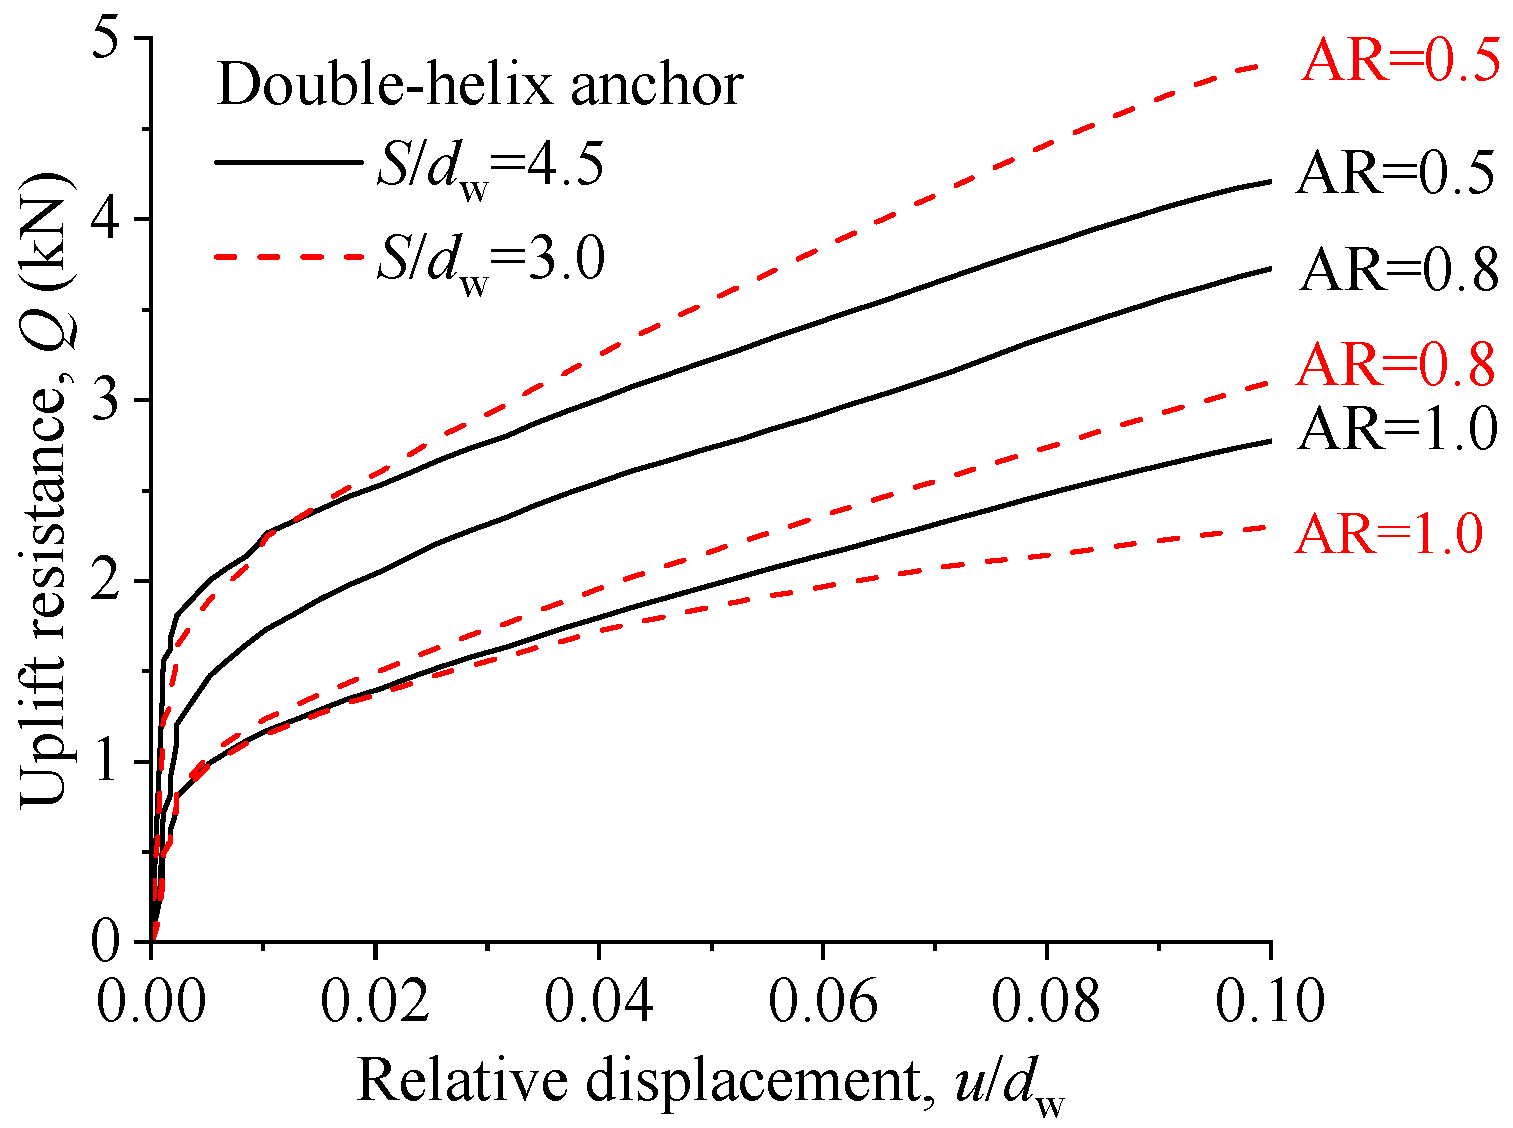
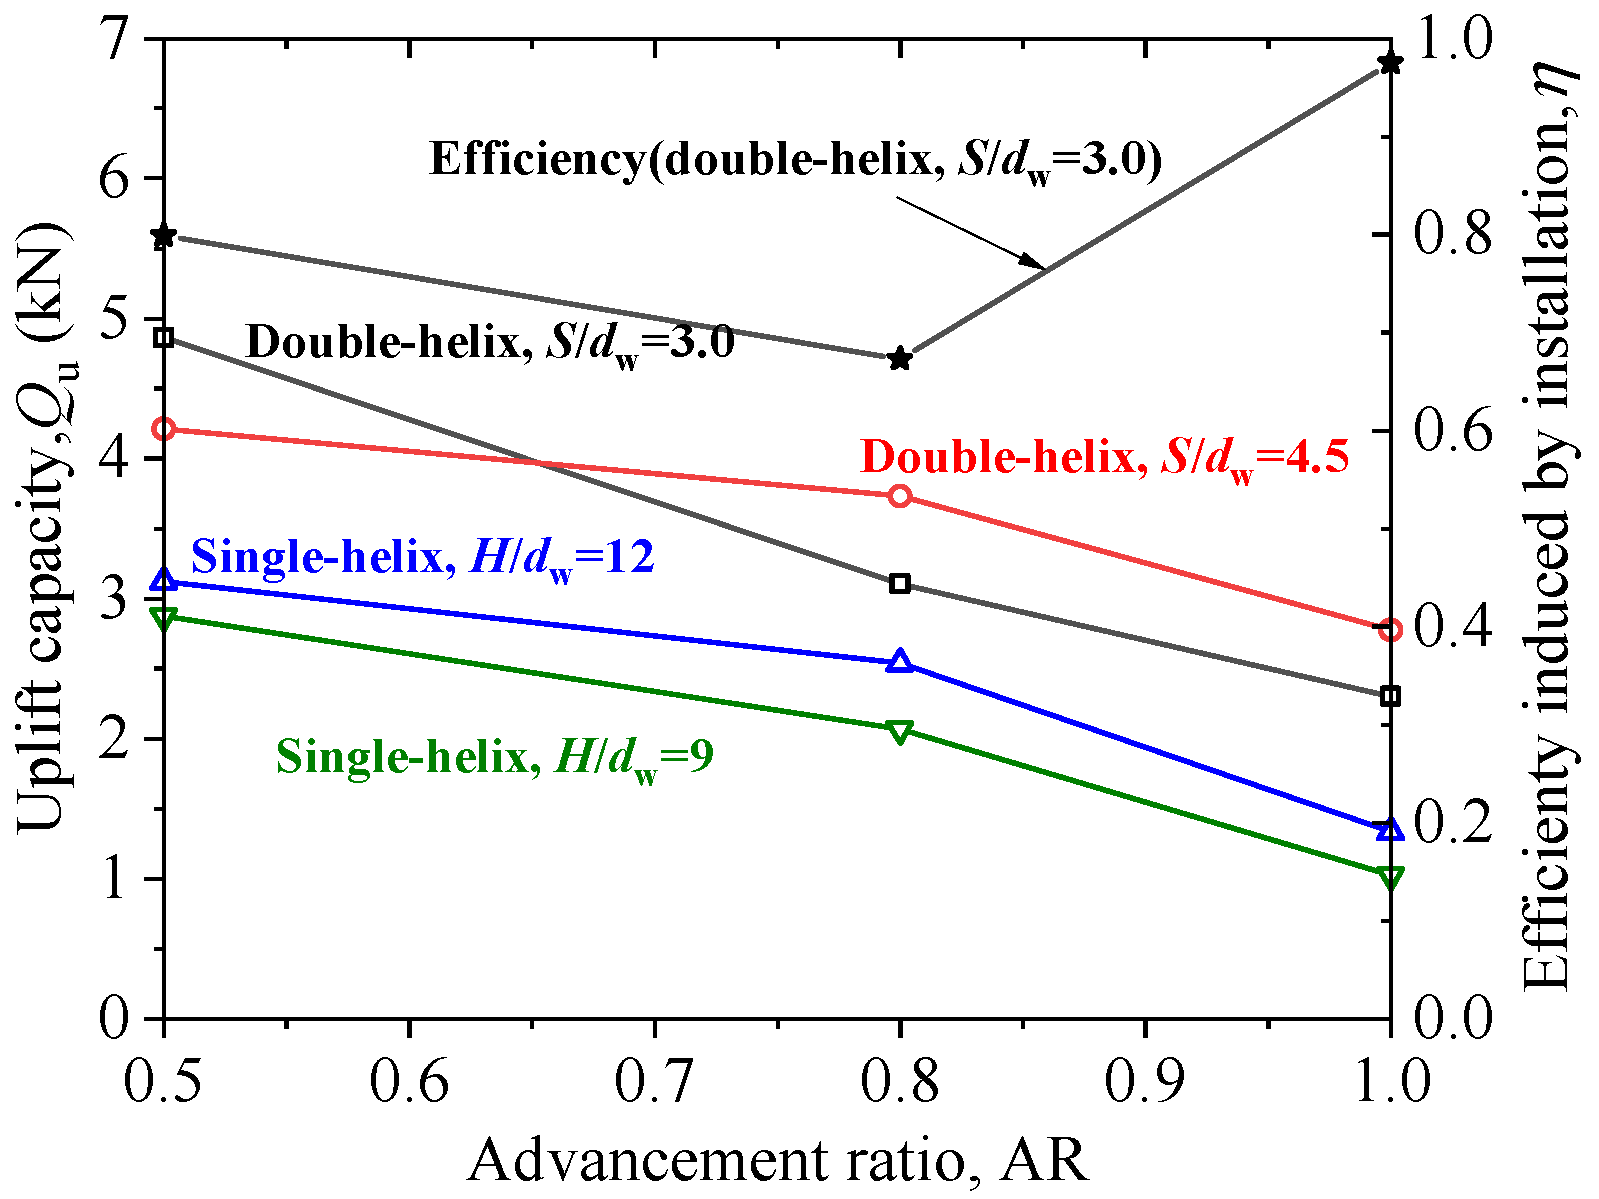
4.3. Double-Helix Anchors Installed at Different Advancement Ratio

The uplift capacities of the double-helix anchors were plotted in Figure 20. Meanwhile, the efficiency of the uplift capacity of the double-helix anchor was defined as Formula (10) to reflect the interaction of the two plates [3,21]. For wish-in-place anchors, the efficiency is only affected by helix spacing [21]. In comparison with pre-embedded conditions, the efficiency varies with both the helix spacing and installation disturbance.
η = Q u / Q u i
where η is the ratio of the uplift capacity of the double-helix anchor to the sum of the uplift capacities of each single-helix anchor.
In order to analyze the impact of the advancement ratio on the uplift capacity and efficiency of double-helix anchors, the uplift capacities of double-helix anchors with different spacing and efficiency of double-helix anchors with a relative spacing of 3 were plotted in Figure 21. It can be seen from Figure 21 that the uplift capacities of the double-helix anchors also increase with the decrease in the AR. When the AR = 1.0 and 0.8, the uplift capacity of the double-helix anchors with a relative spacing of 4.5 is higher than that of the anchor with a relative spacing of 3, while the relationship is opposite for the case of AR = 0.5. This change is related to particle movements induced by installation. When AR = 0.5, the top plate has restrictions both on the vertical upward and lateral displacement of the soil between the plates during installation. The smaller spacing between the plates will produce more obvious restrictions, and thus make the soil between the plates denser. Therefore, at AR = 0.5, the double-helical anchor with a small spacing has a higher uplift capacity.
Figure 22 shows the displacement nephogram at the uplift failure of a double-helix anchor with a relative spacing of 4.5. The yellow dotted lines indicate the particle motion zone at uplift failure. It can be seen that the height of the particle motion area above the bottom plate does not exceed 3 dw at failure regardless of AR = 1 or 0.5, which indicates for installation situations, a relative spacing of 3 can ensure the two plates do not interact each other during the pulling process. Then, the efficiency change is only caused by the installation. It can be seen from the relationship of the AR and efficiency (in Figure 21) that although the uplift capacity of the double-helix anchor increases for the cases of AR <1.0 compared to that of AR = 1, the efficiency coefficient is close to 1 only for the case of AR = 1, indicating that the impact of the top plate during installation is minimal when AR = 1. This is consistent with the particle movement rule during installation. The twice disturbance of the top plate in the case of AR = 1 are not obvious, but are significant for AR = 0.5.

5. Conclusions

This study investigated the effects of the helical anchor geometry and installation advancement ratio on the soil disturbance zone, particle movement mechanism, and the uplift capacity by simulating the installation and pull-out process of single- and double-helix anchors in dense sand based on matrix discrete element software. The main investigations and conclusions are as follows:
(1)
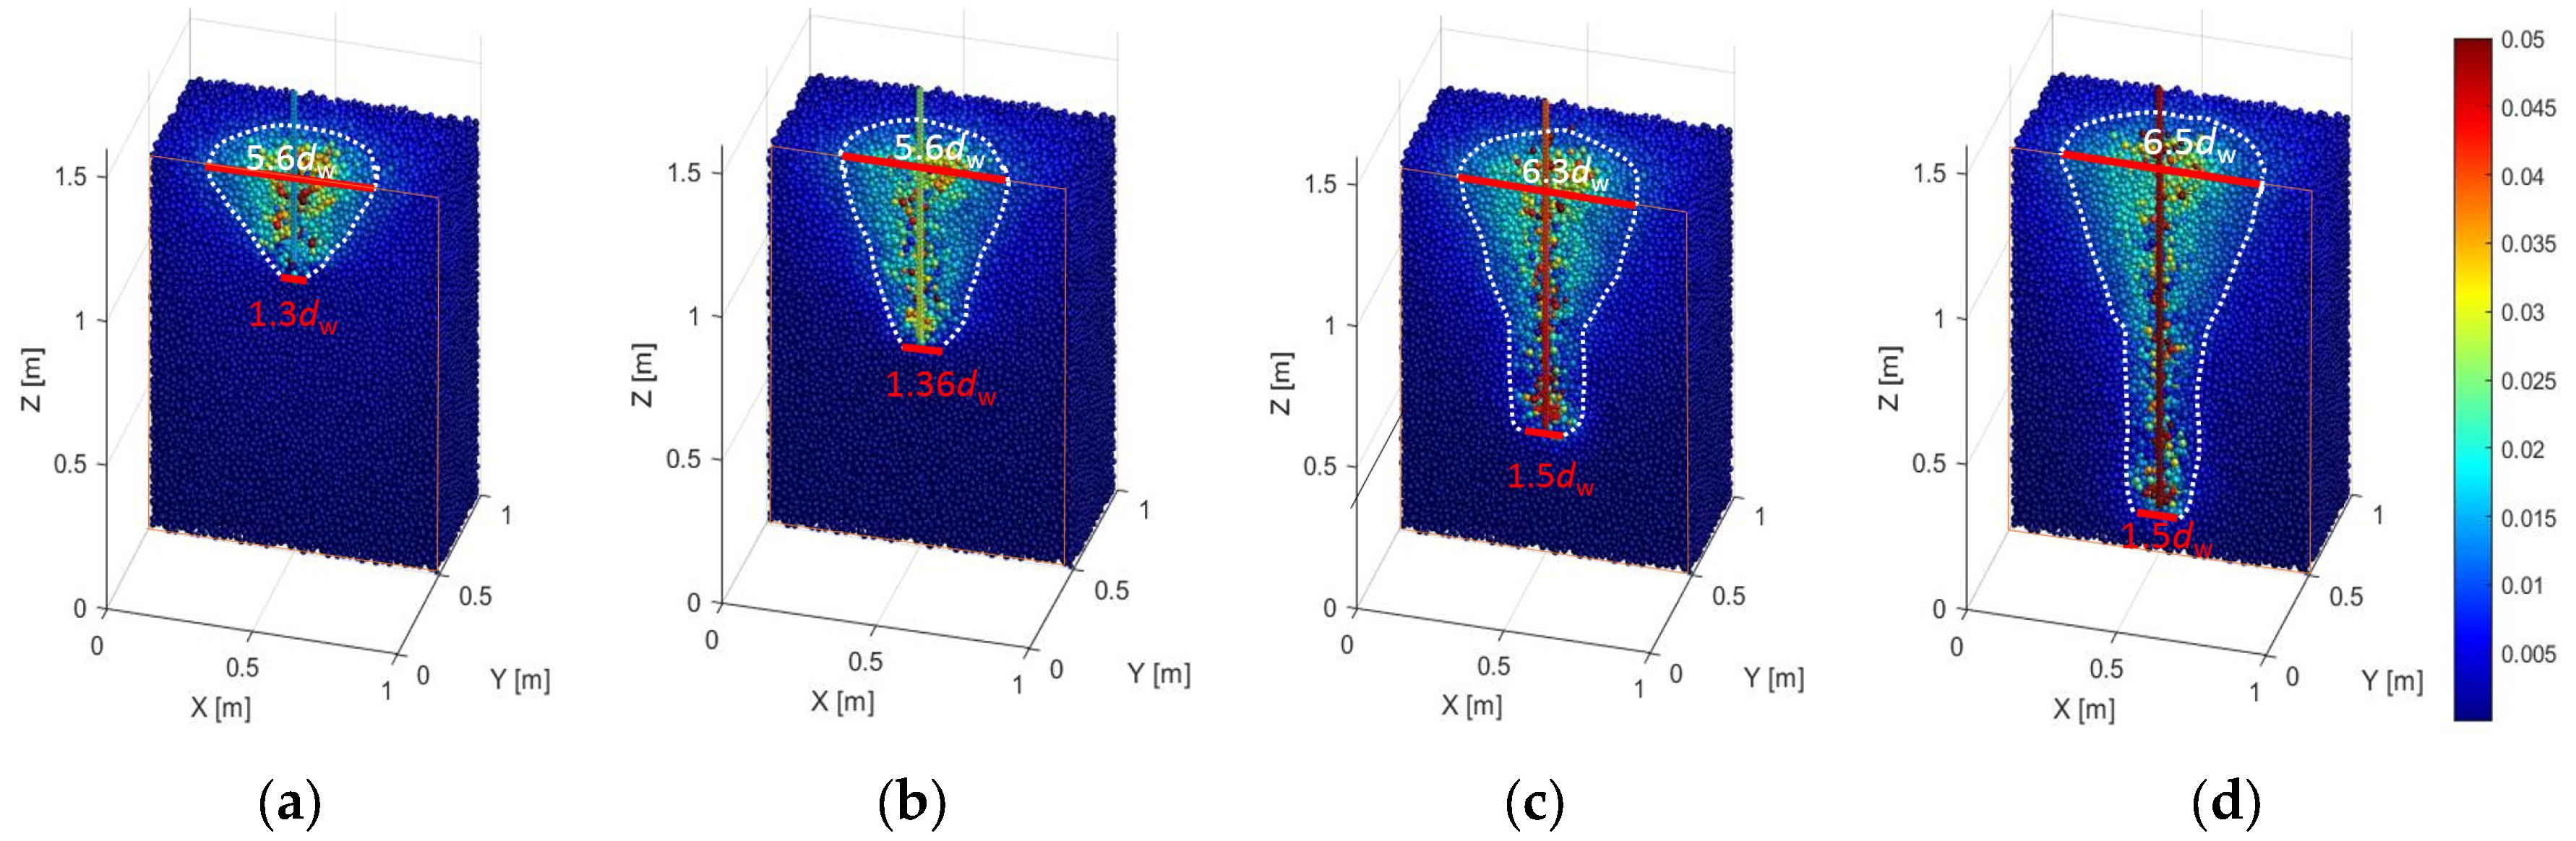
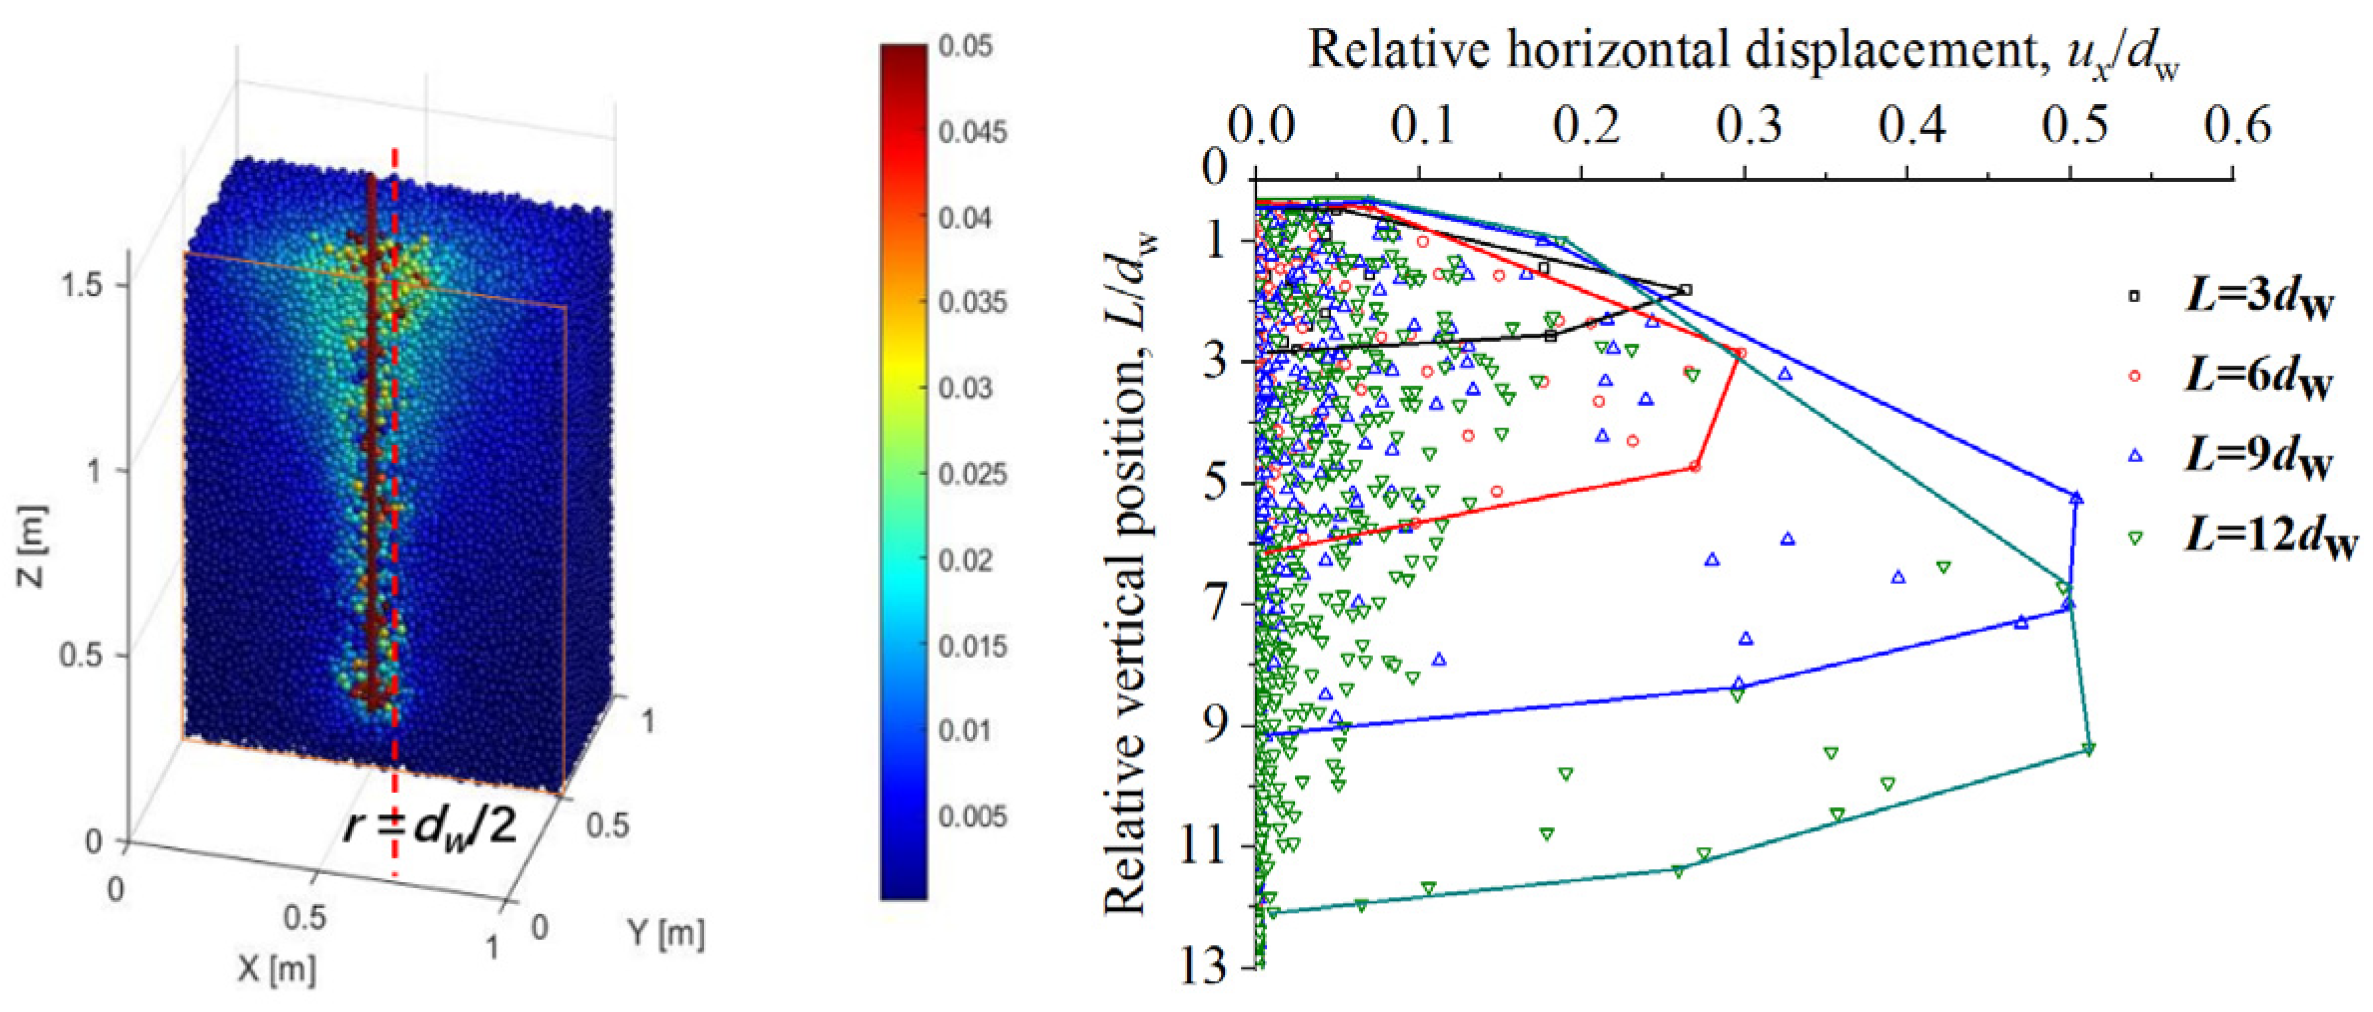
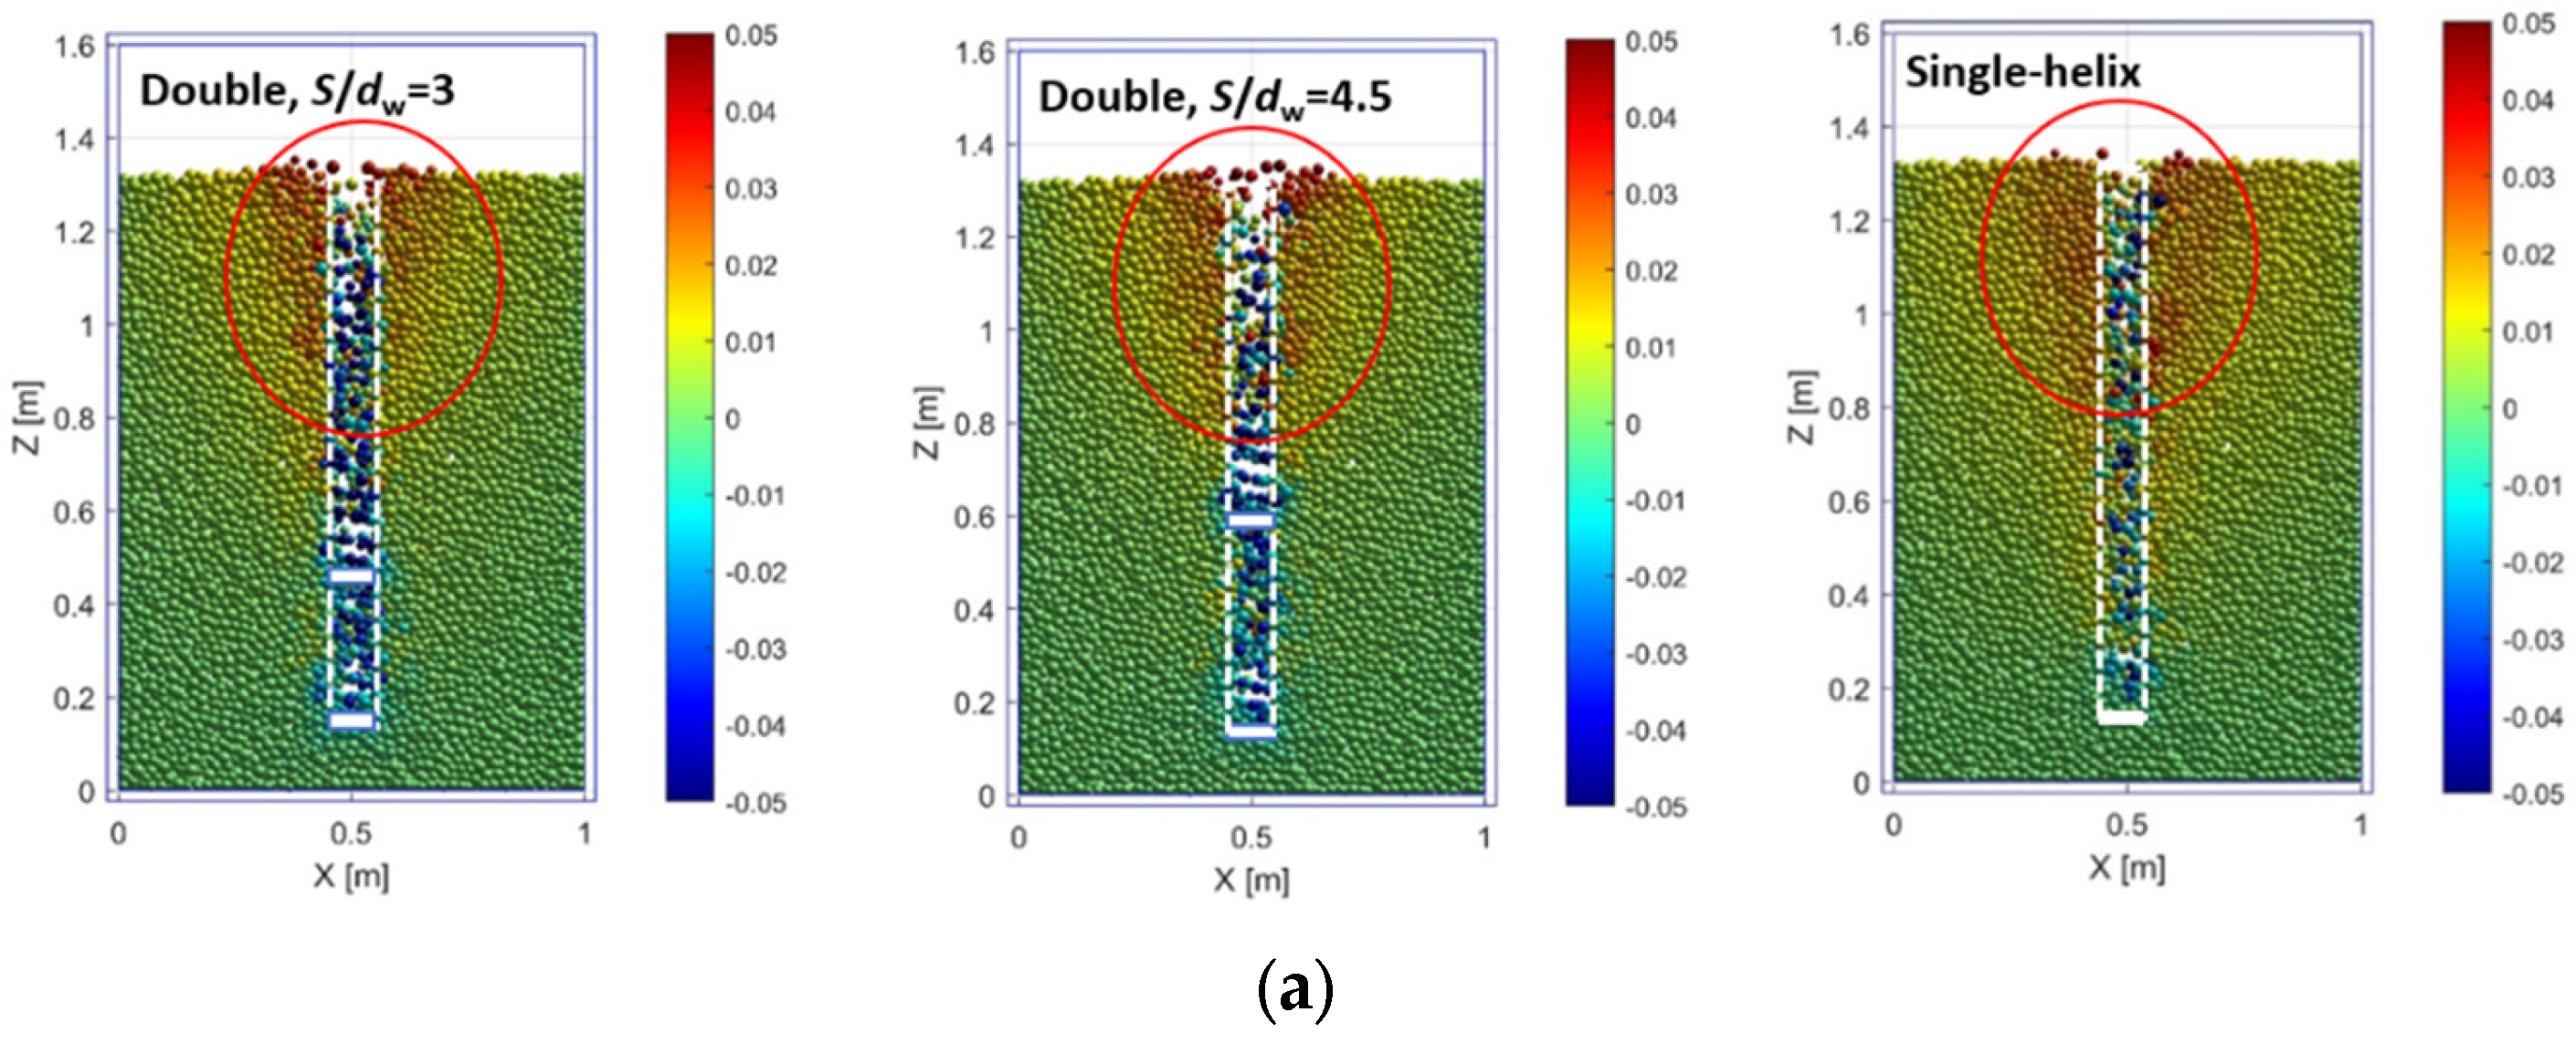
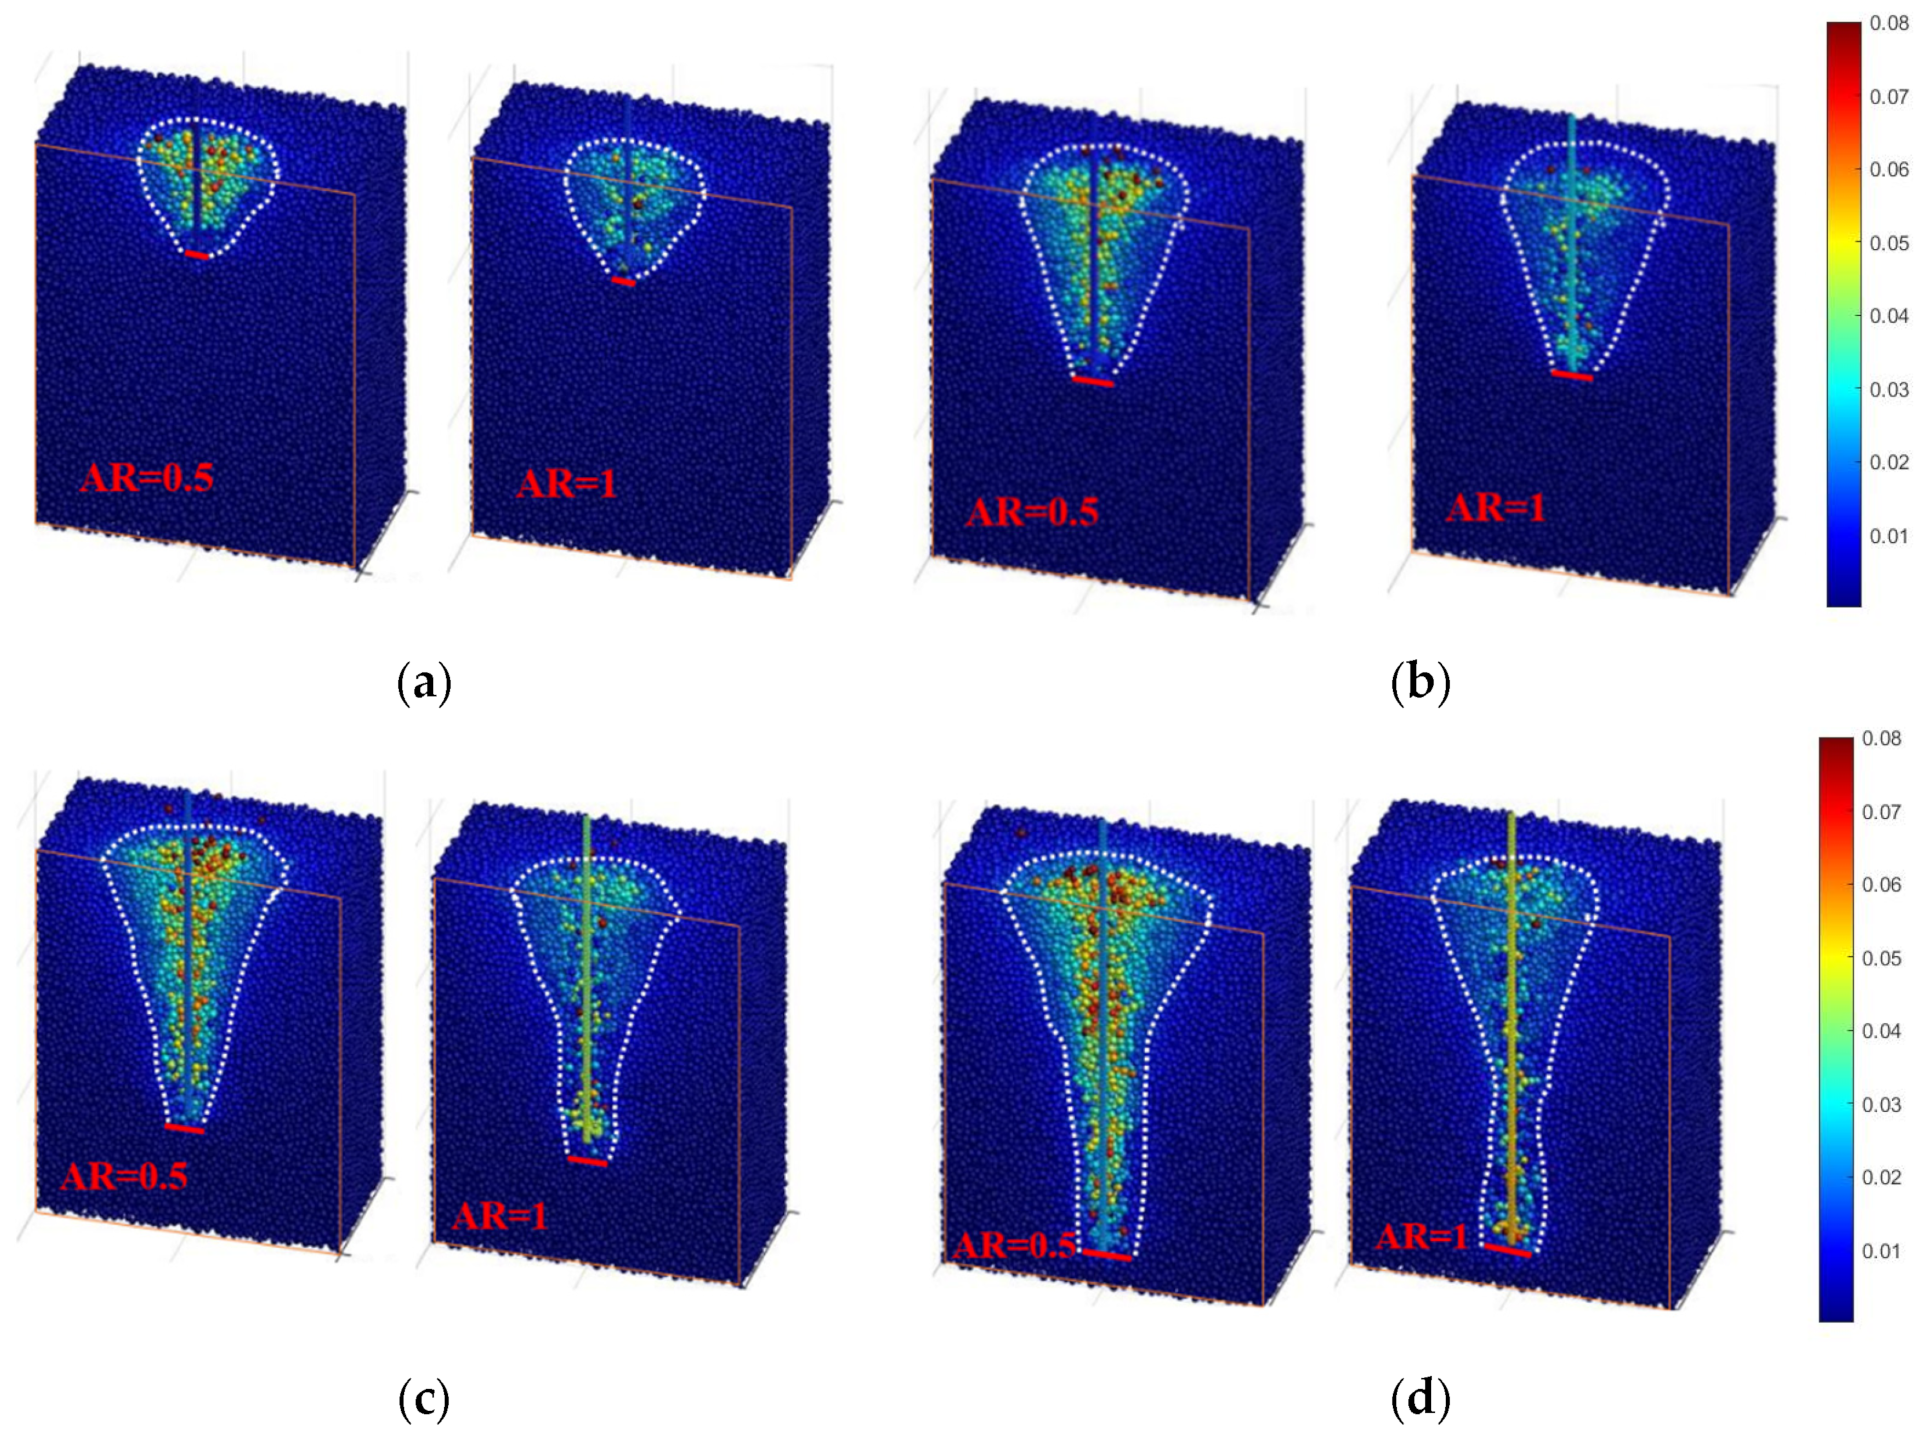
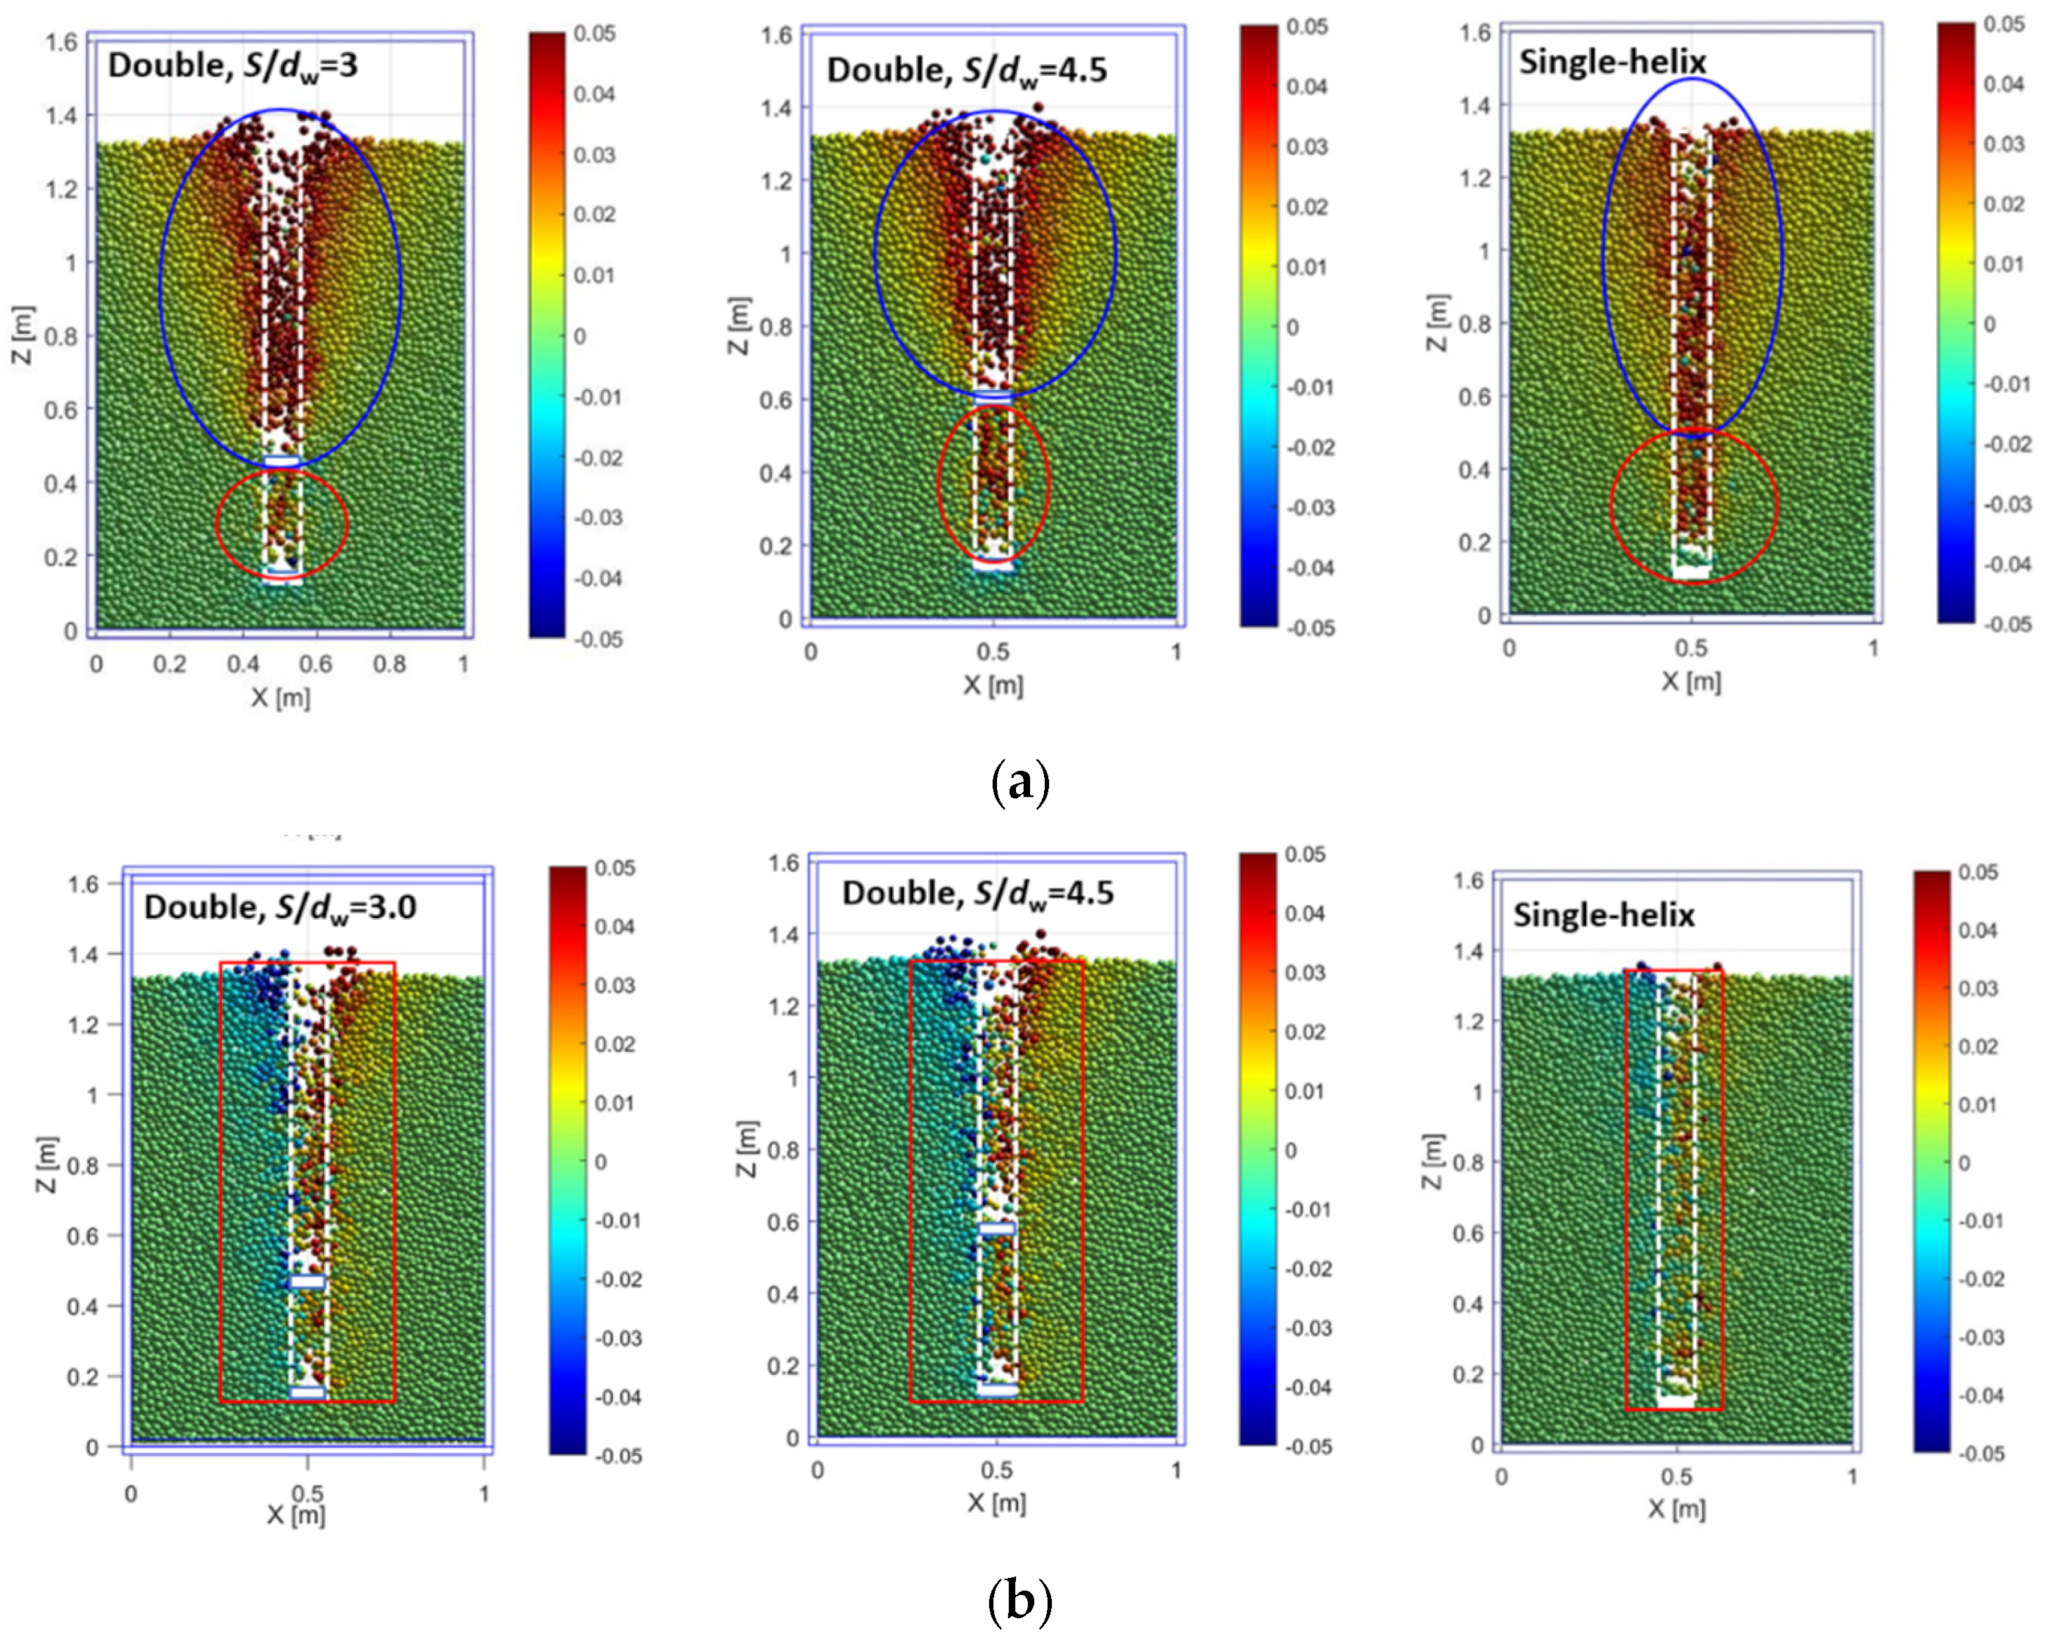
When the helical anchor is drilled into a shallow depth, the particle motion zone is the shape of an inverted cone, and when drilled into a deep depth (L > 9 dw), the overall disturbed zone is funnel-shaped. For the double-helix anchor, the soil above the upper helical plate is disturbed more obviously than with the single-helix anchor because it has been penetrated twice.
(2)
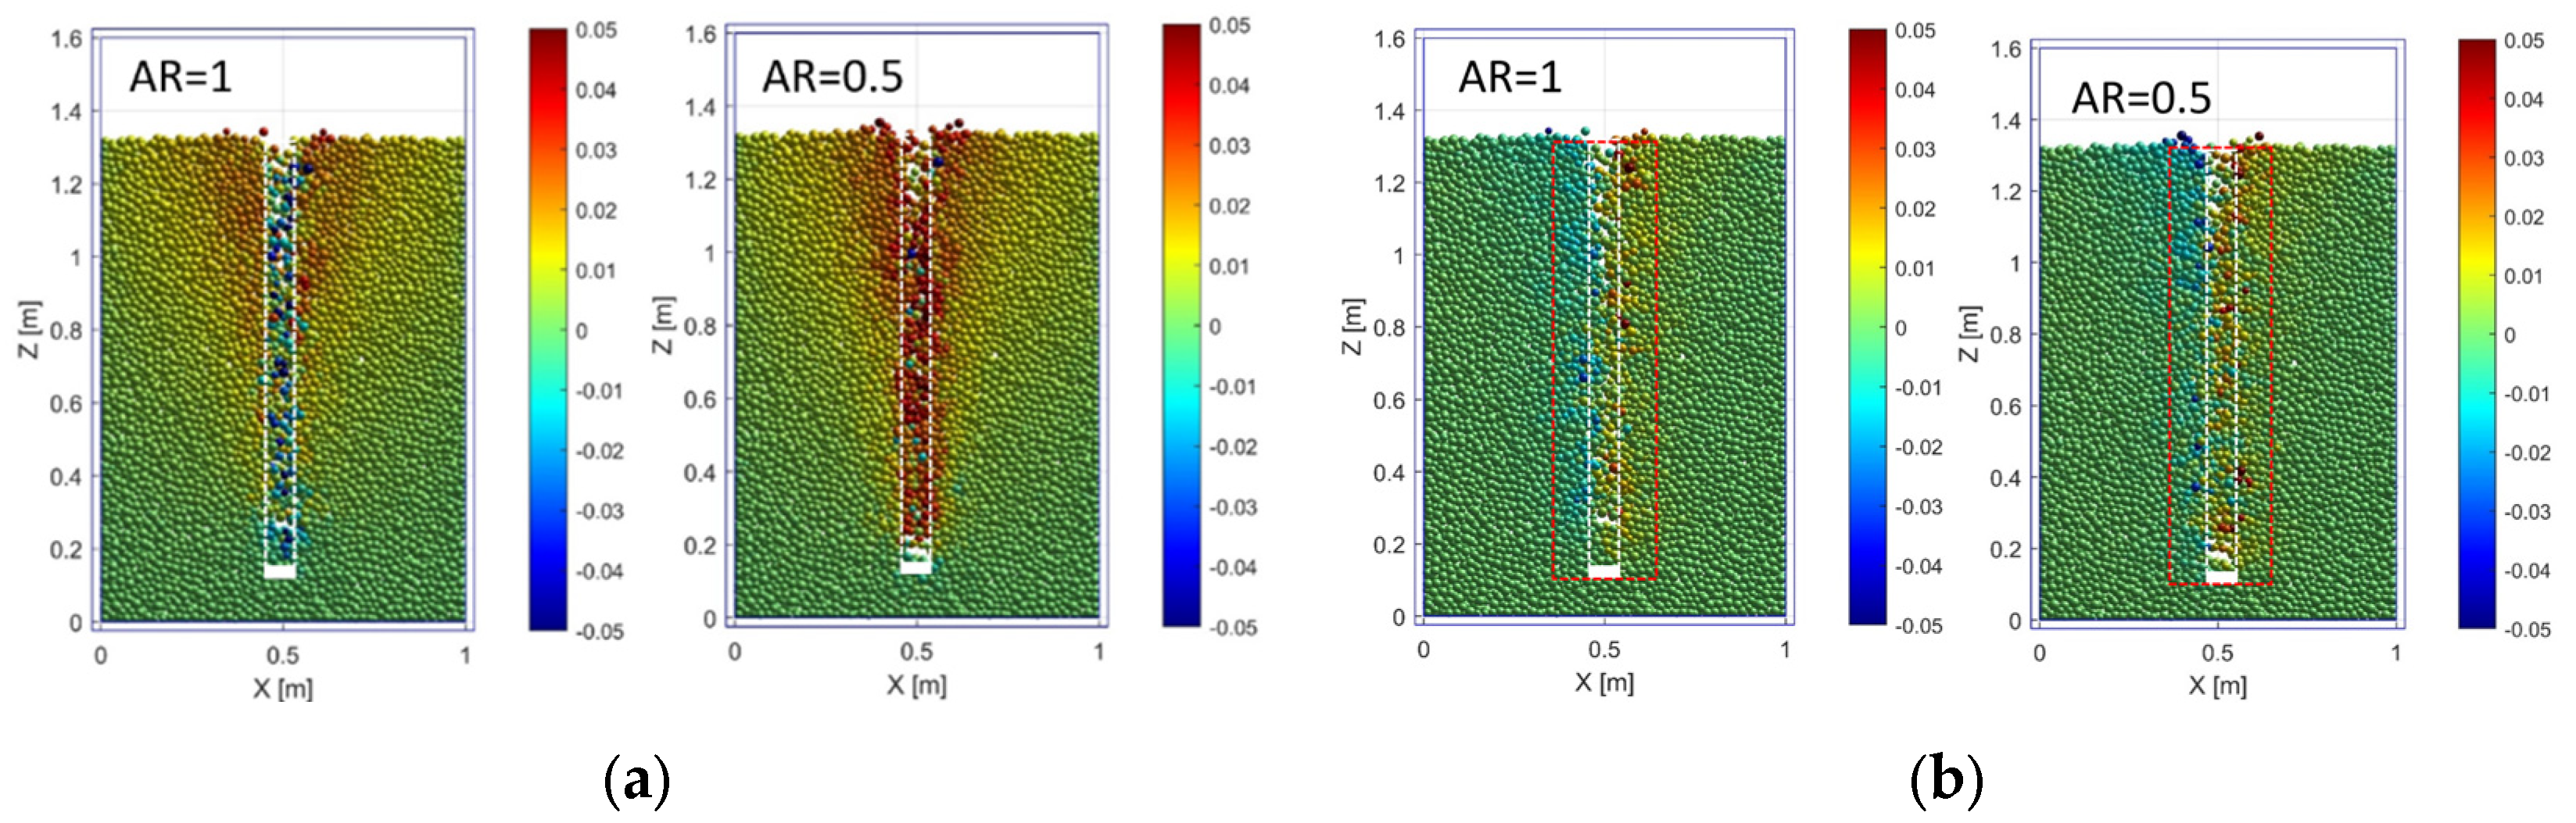
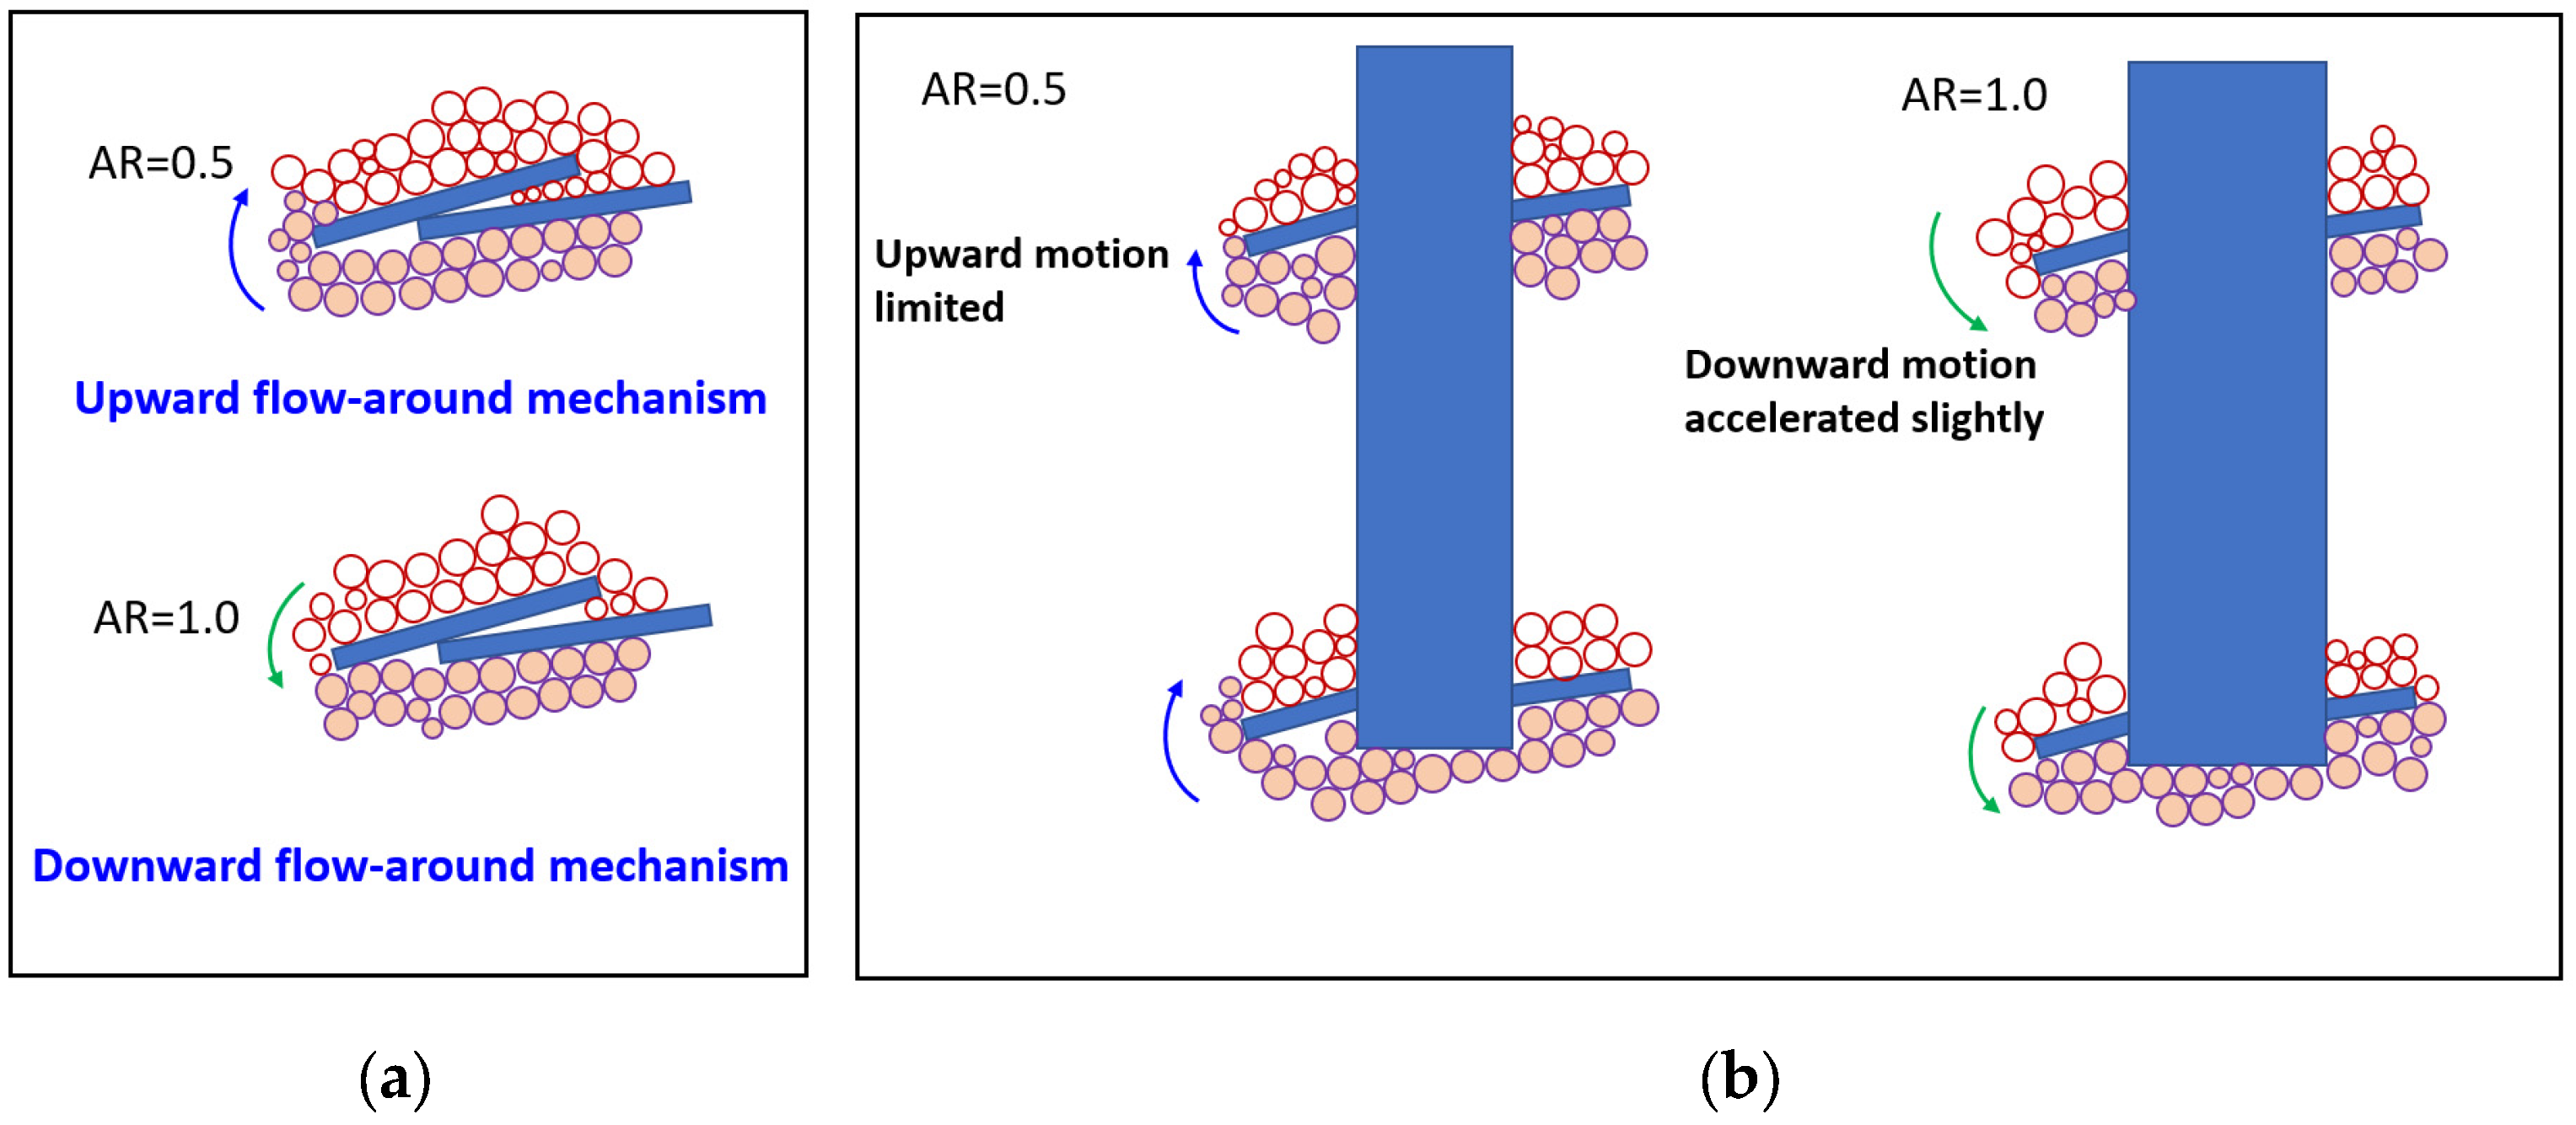
When a single-helix anchor is installed at an AR of less than 1, the particles around the plate are encouraged to move upwards, and the back flow-around mechanism occurs. And when installed at AR = 1, the flow-around mechanism occurs.
(3)
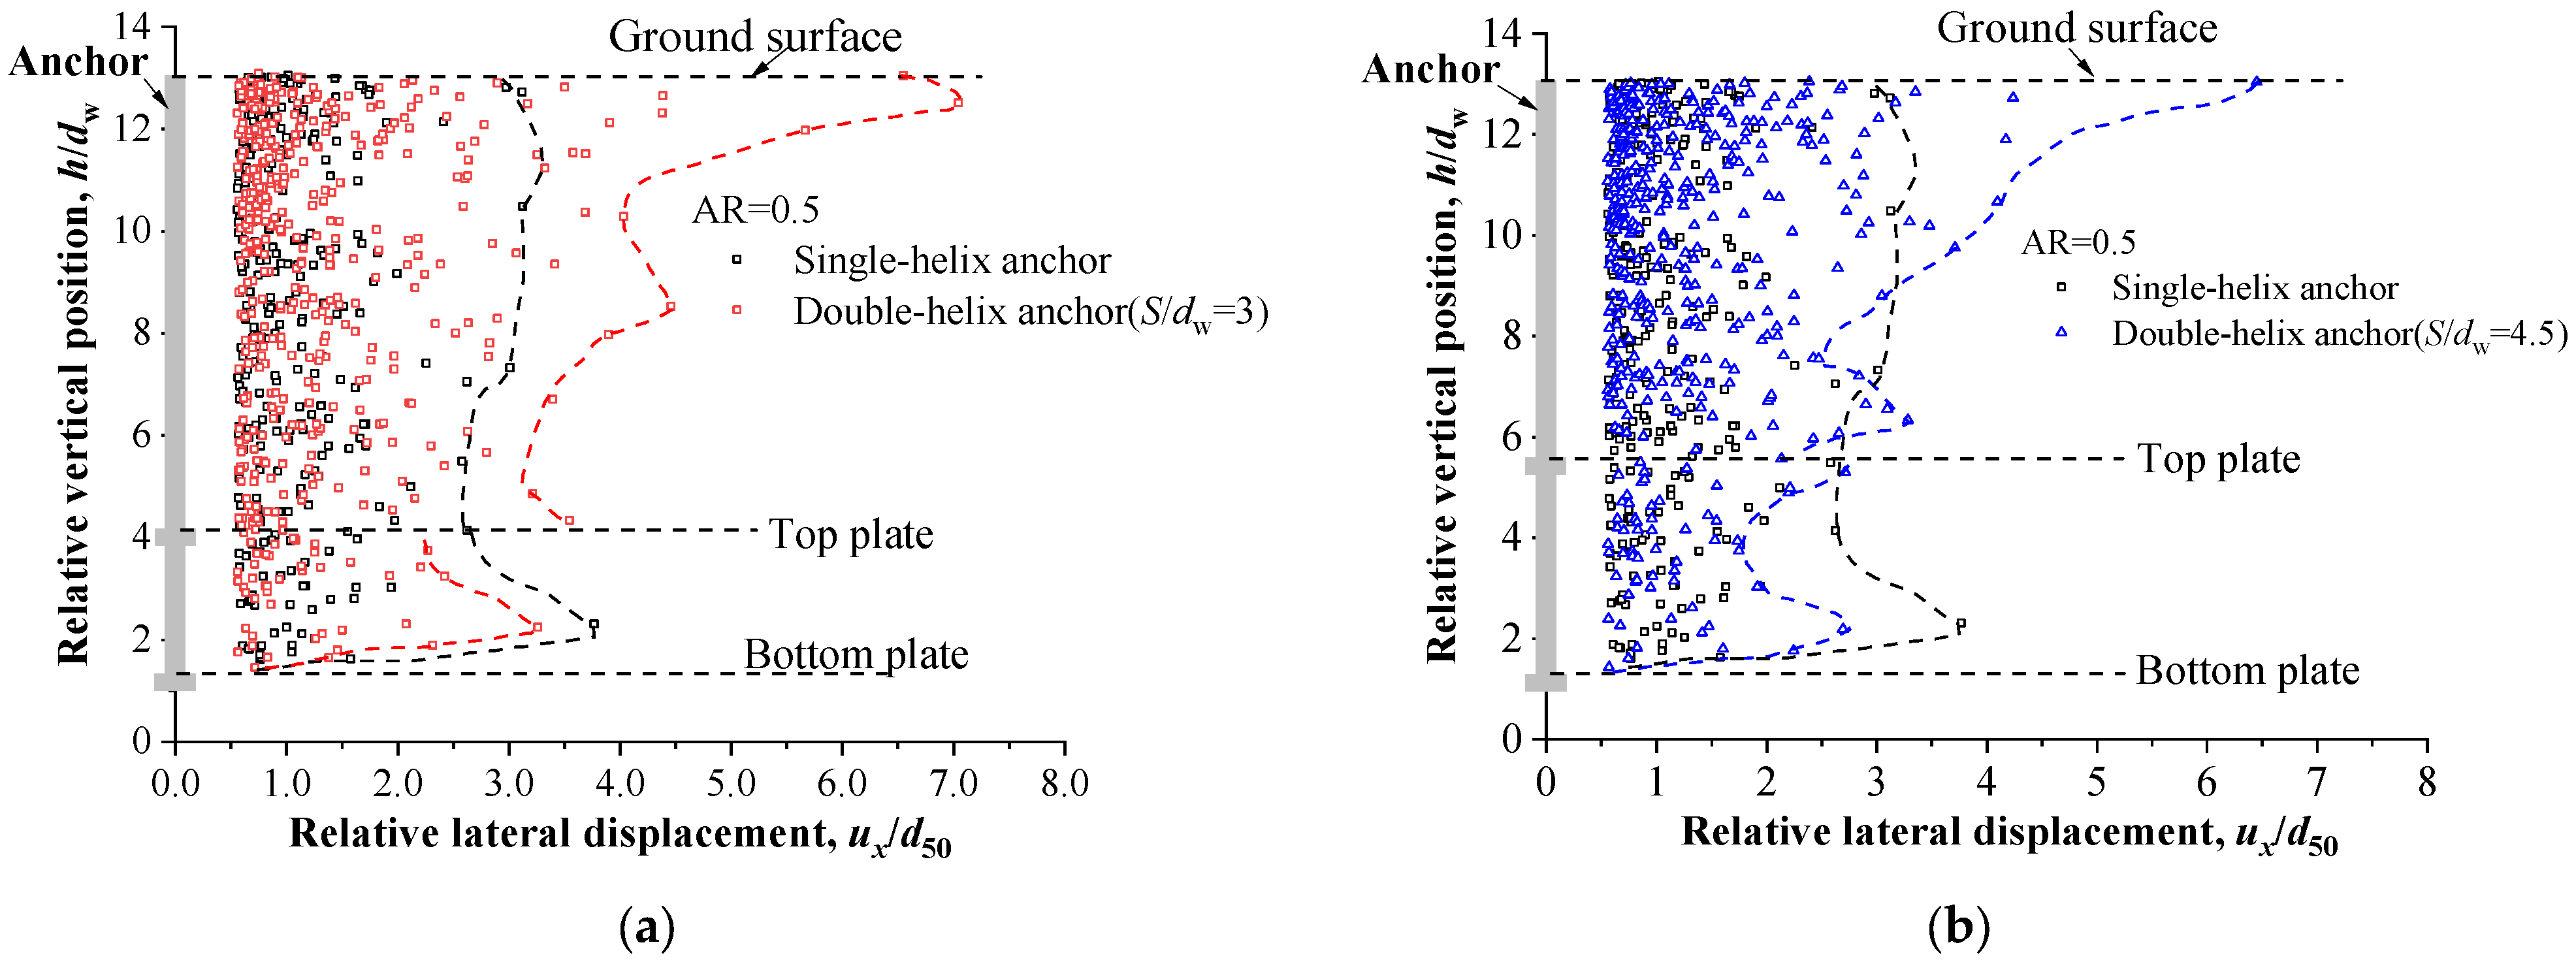
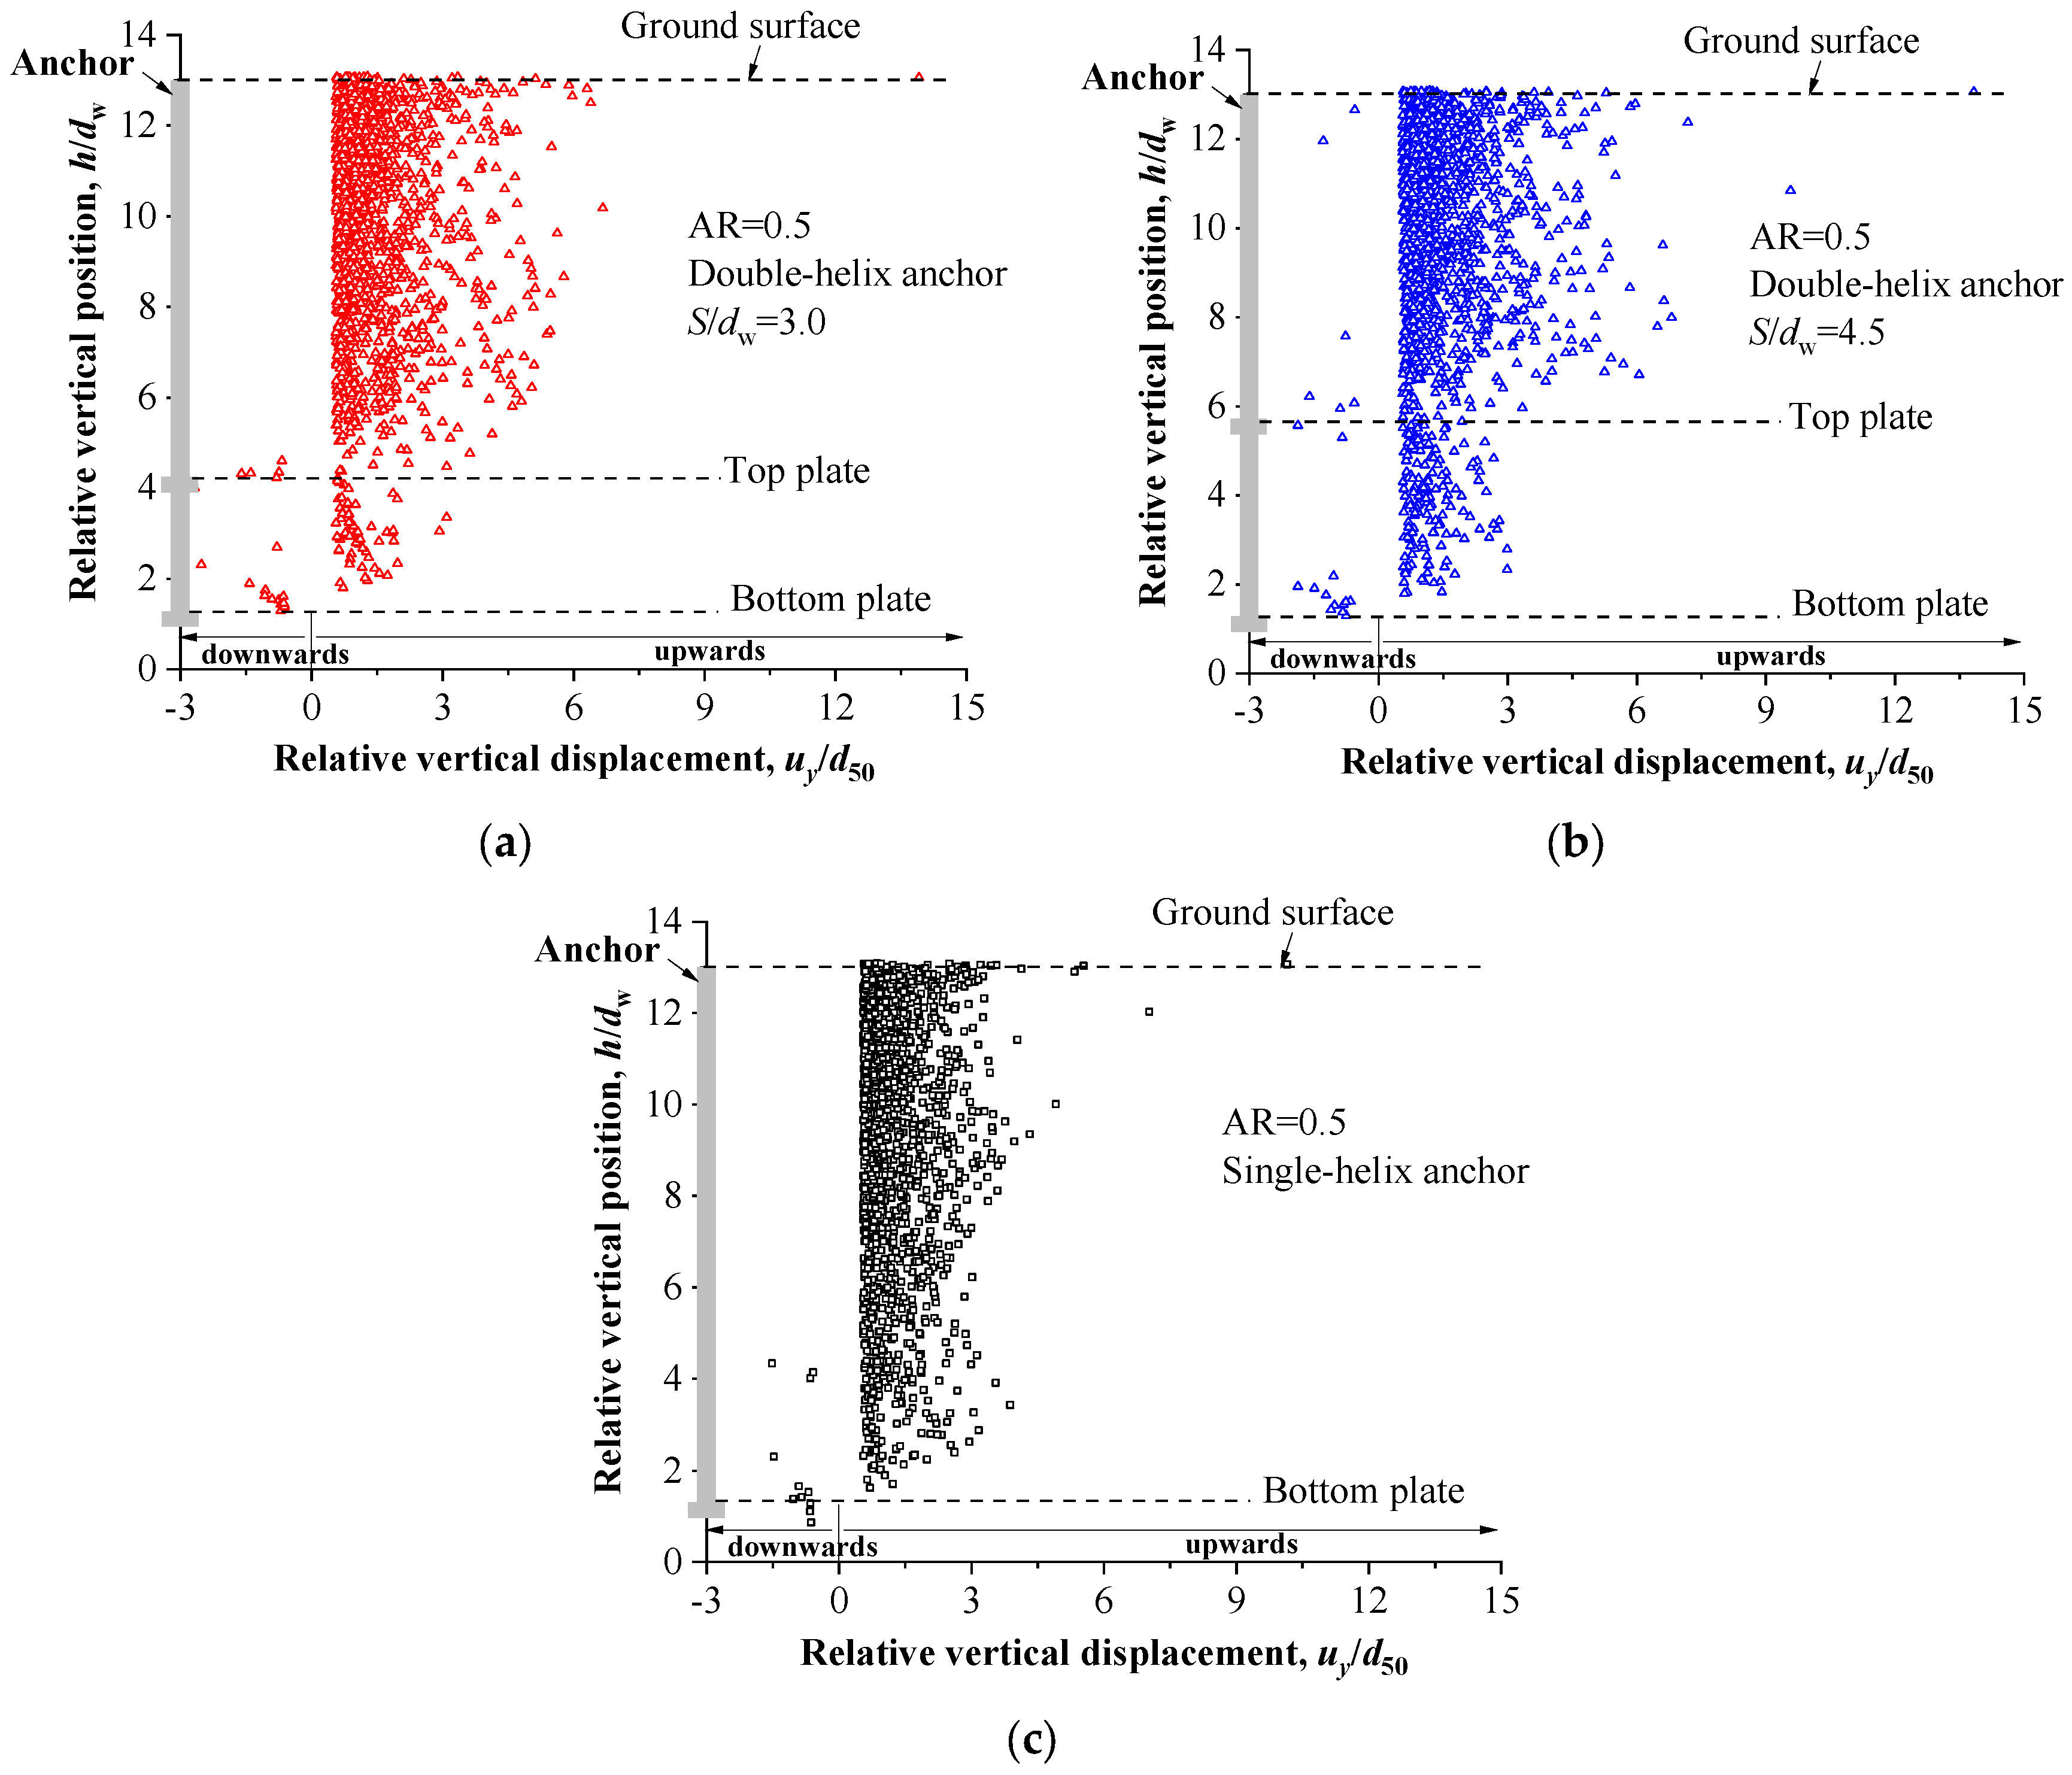
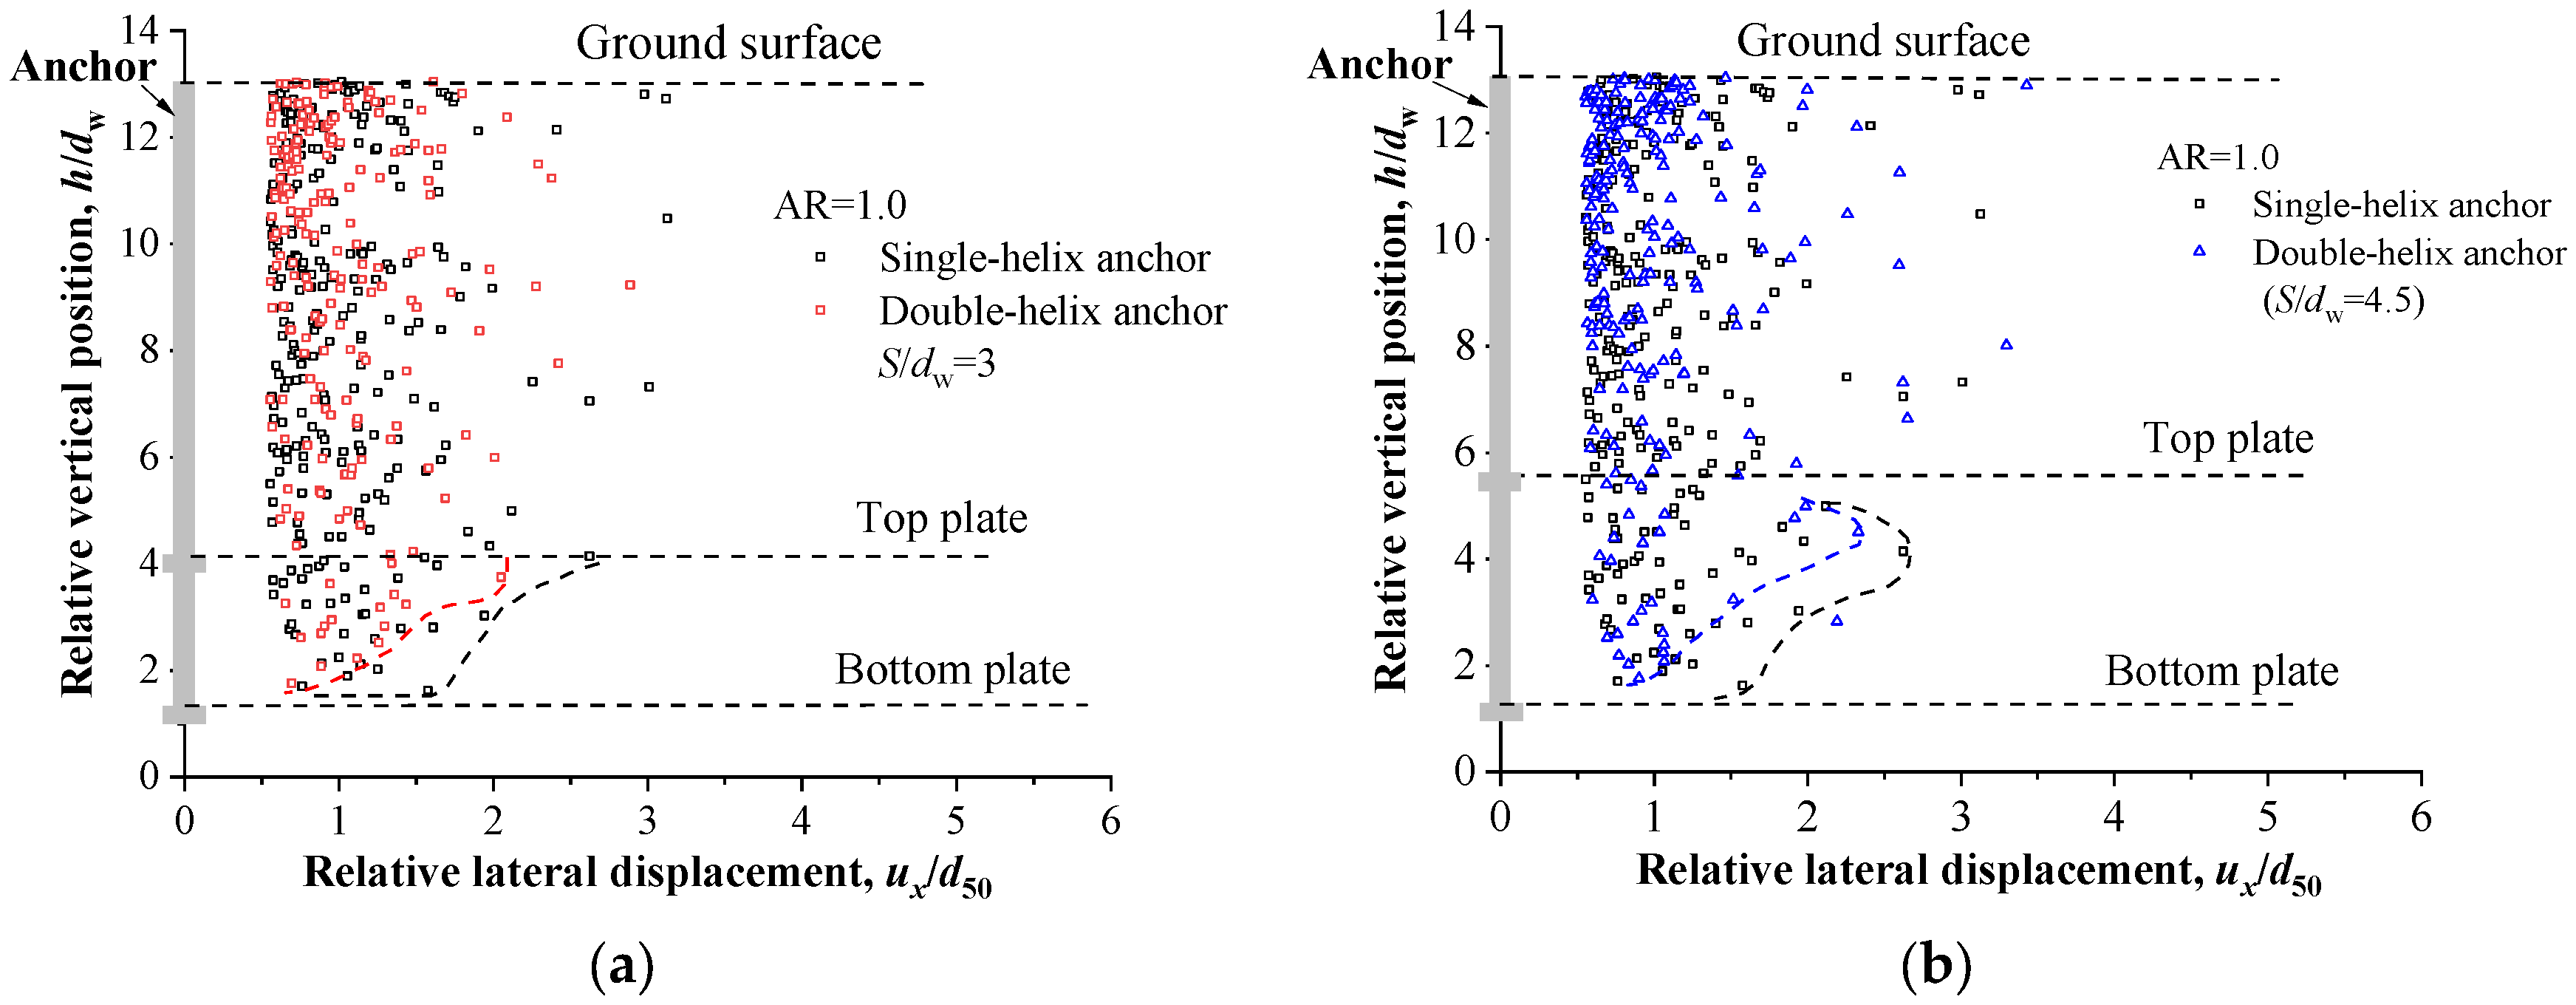
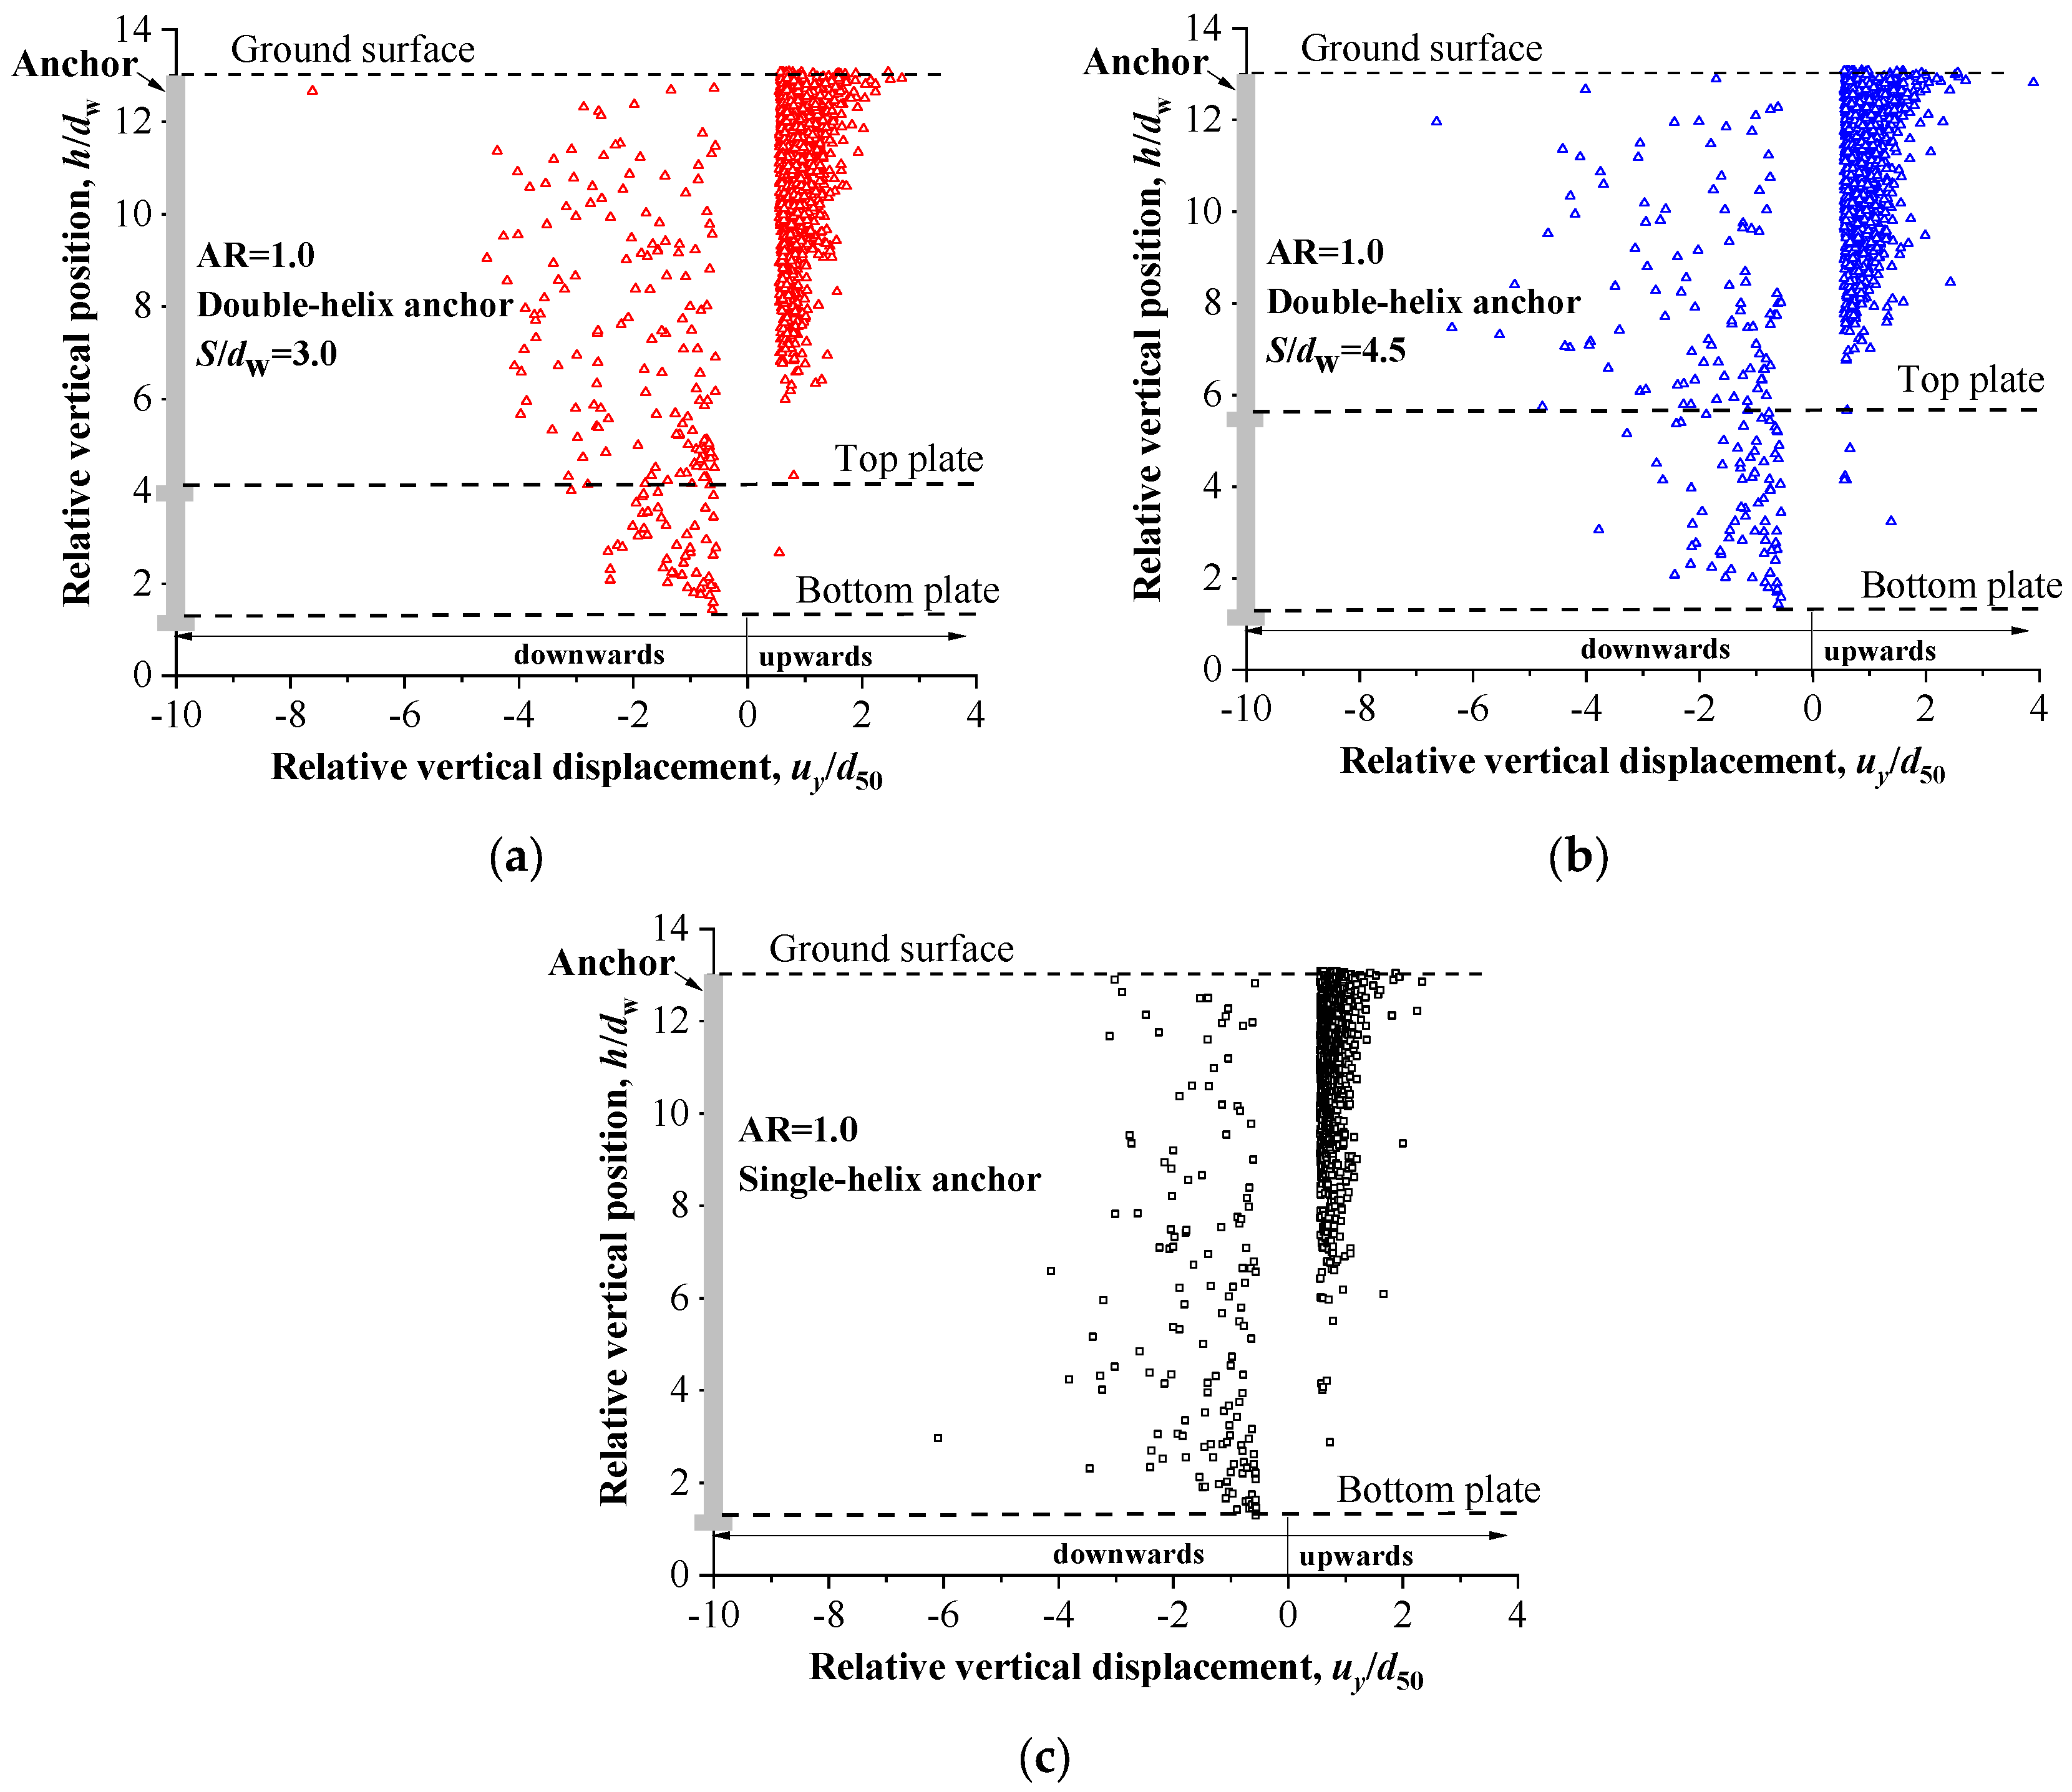
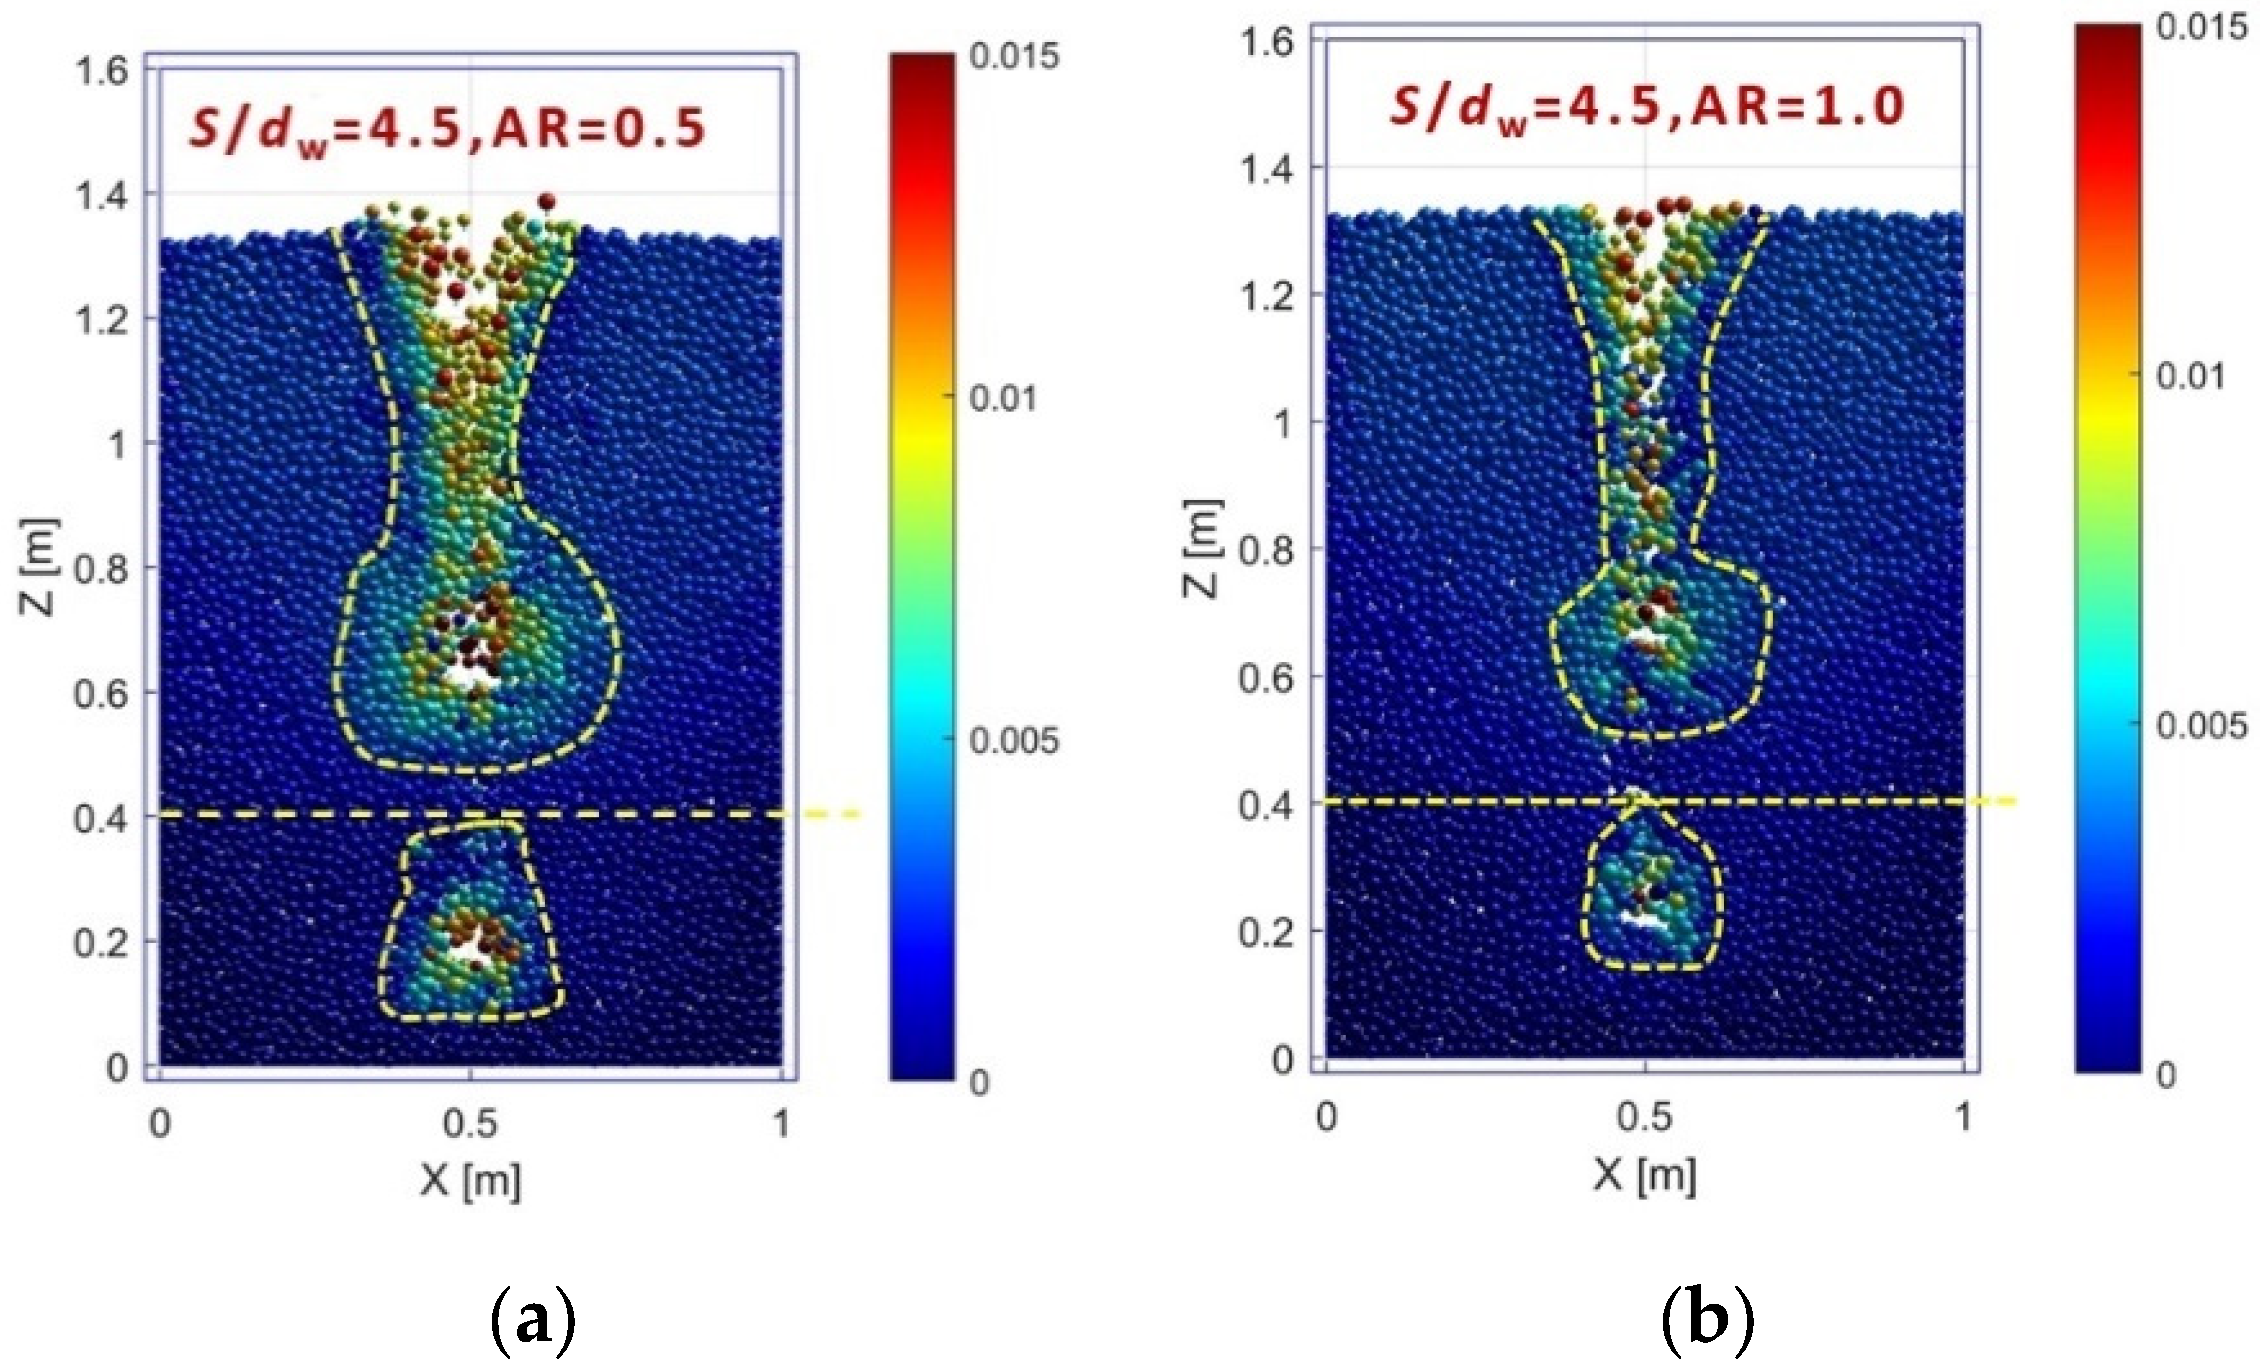
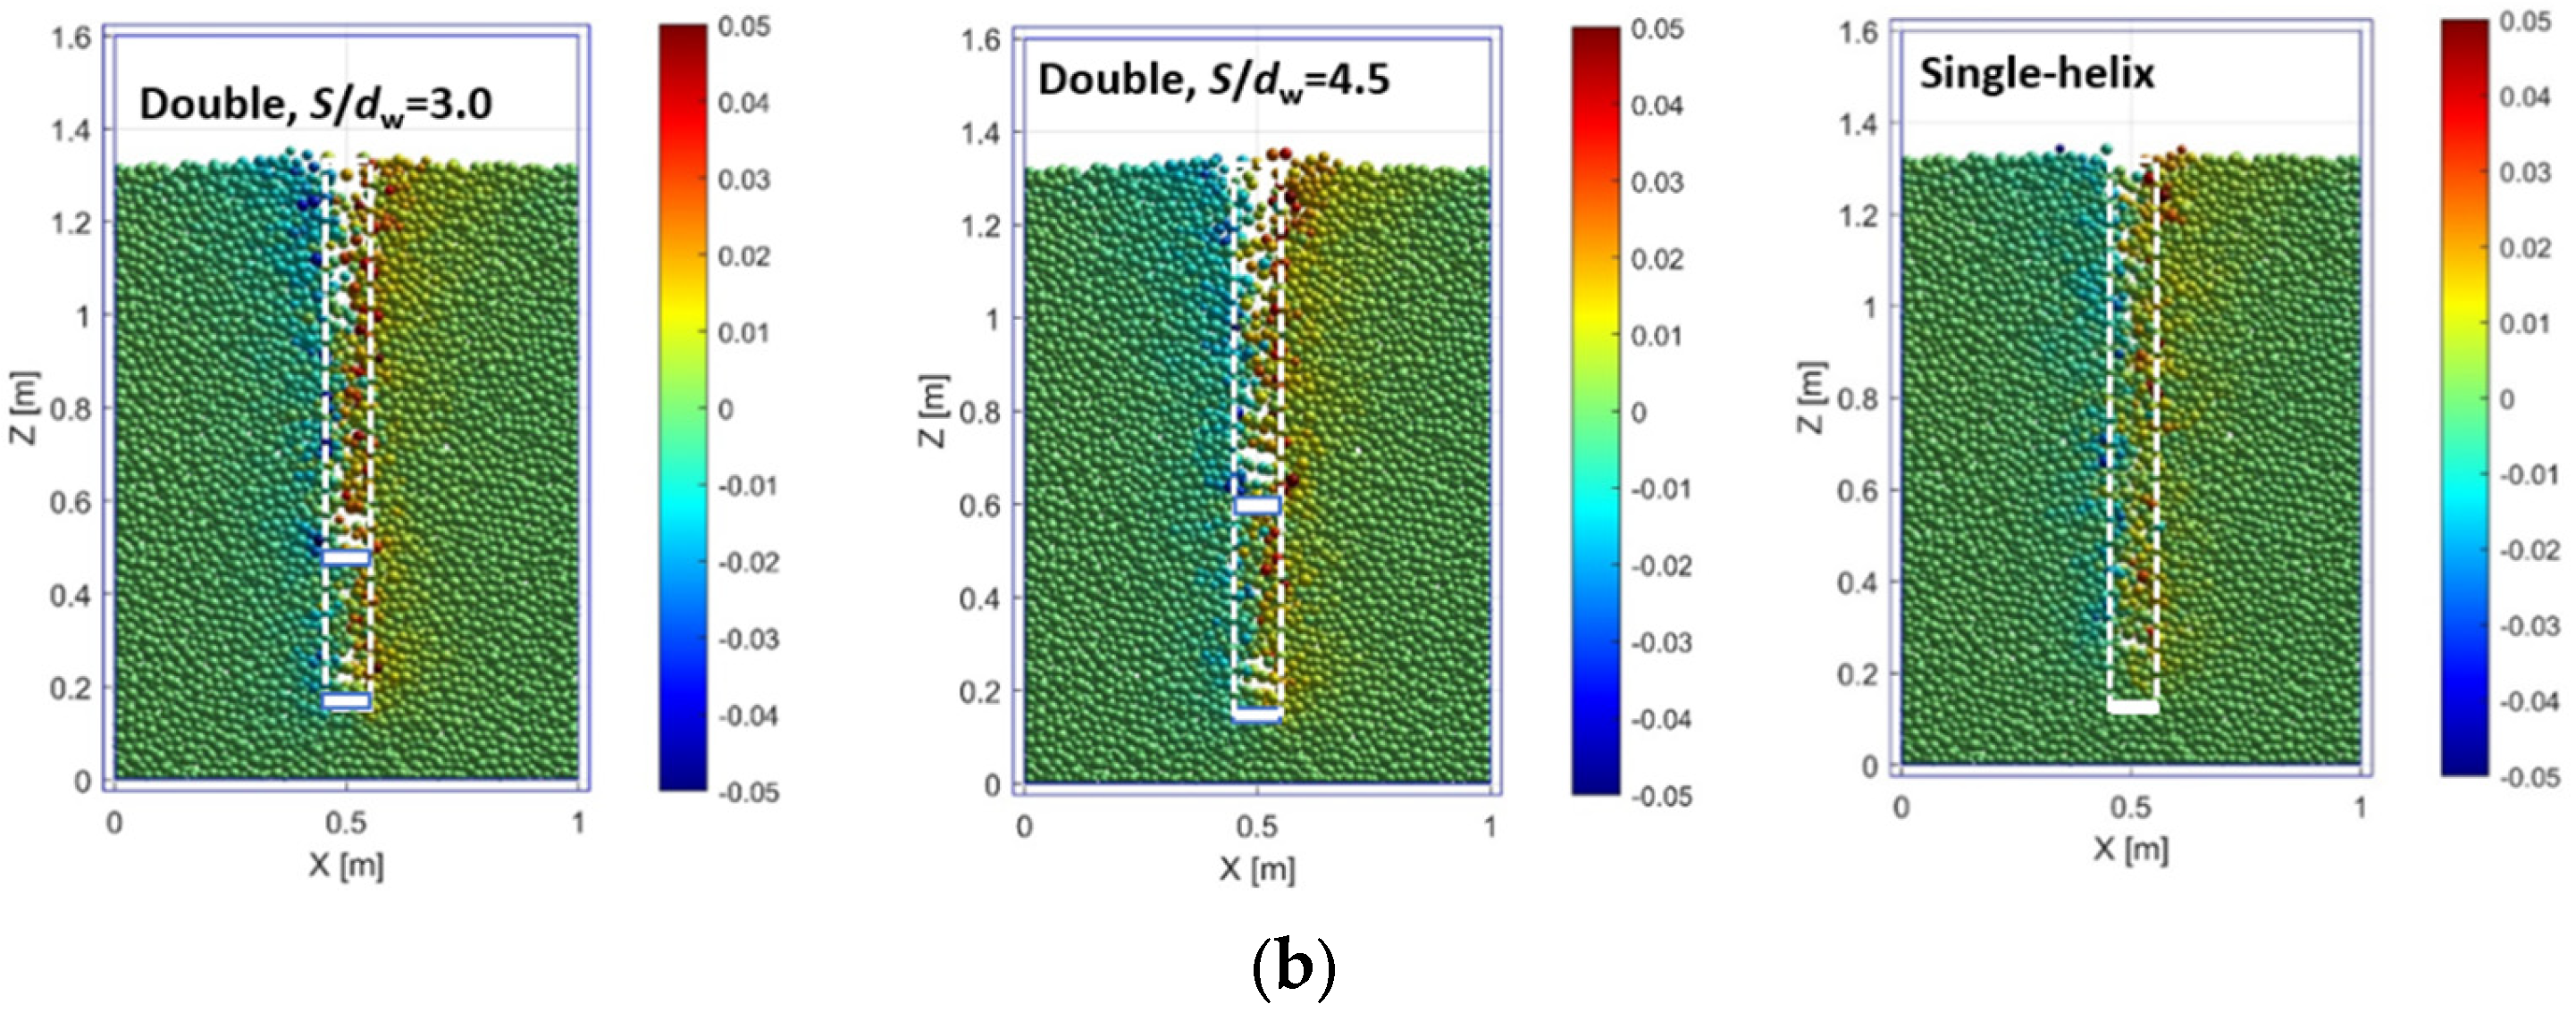
For a double-helix anchor, the lateral displacements of the particles between the two plates are smaller than those for a single-helix anchor regardless of the AR value. When AR = 0.5, the upward motions of the particles below the top plate are limited and the upward displacement is smaller than that of a single-helix anchor, while when AR = 1, the downward motion of the particles above the top plate is accelerated slightly and the downward displacement is slightly greater than that of a single-helix anchor.
(4)
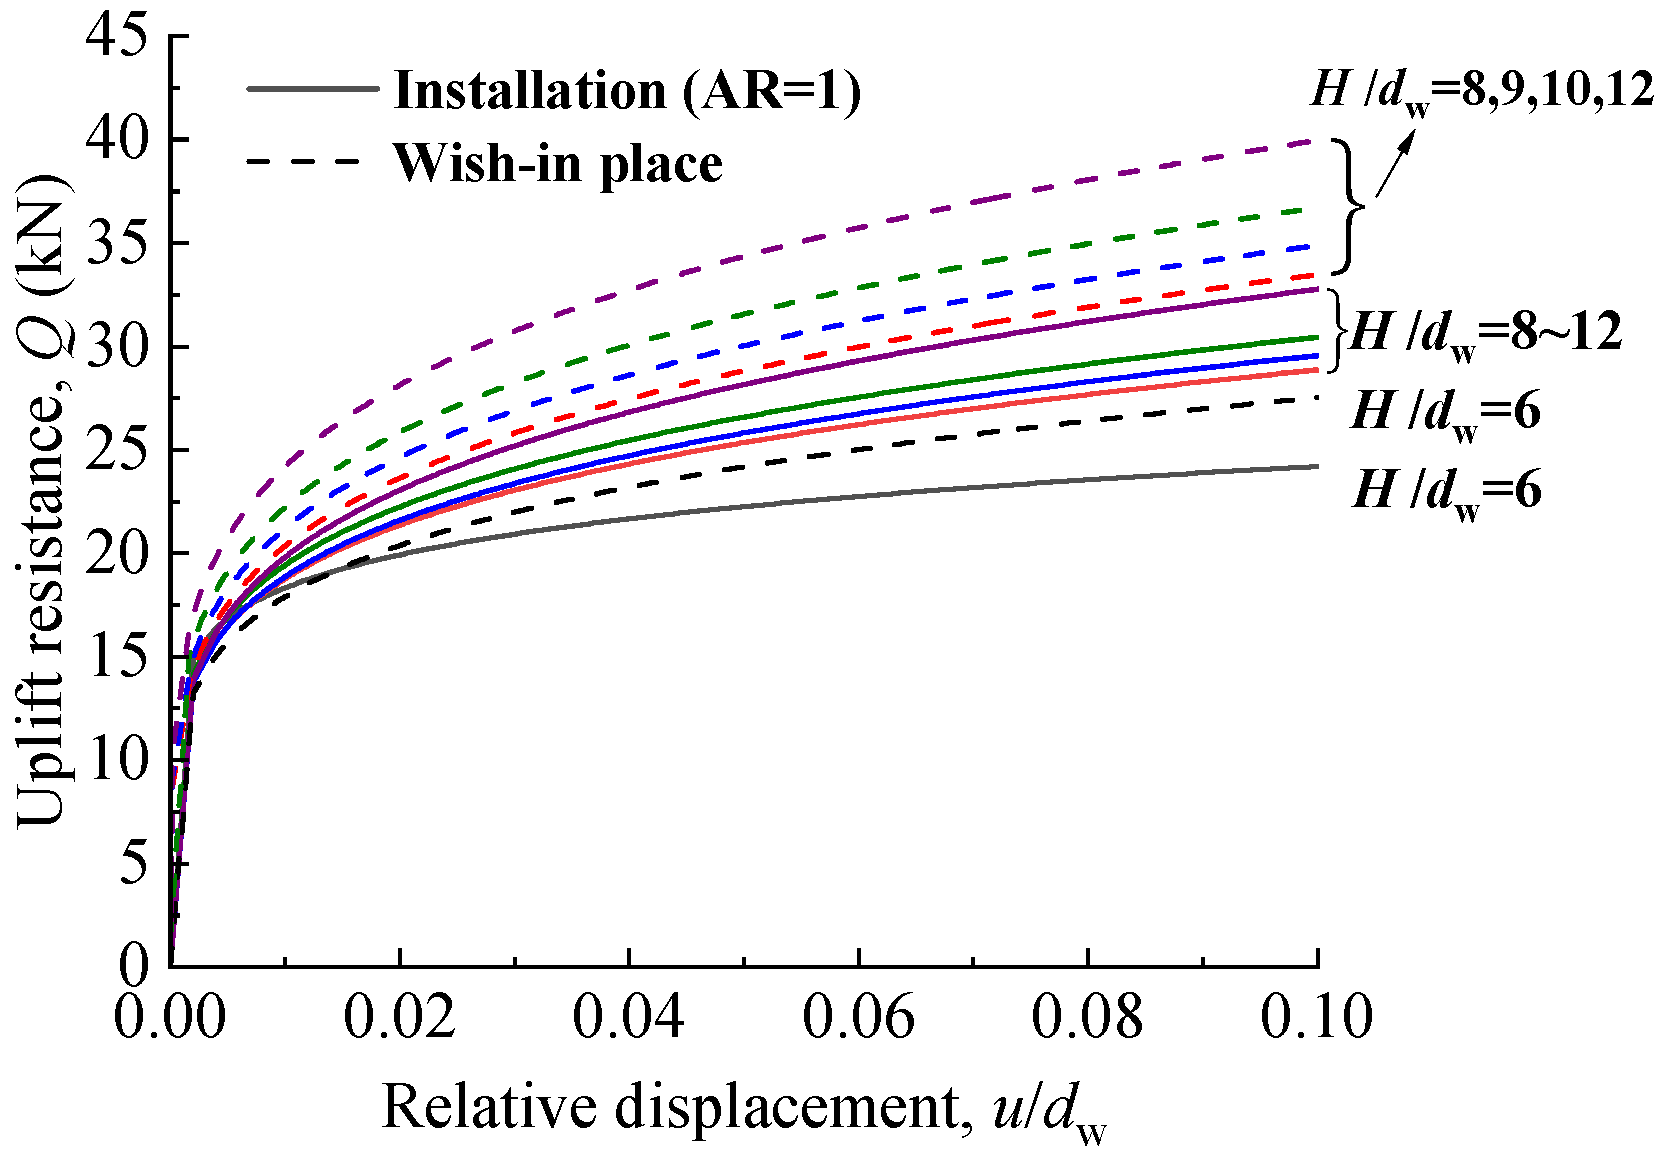
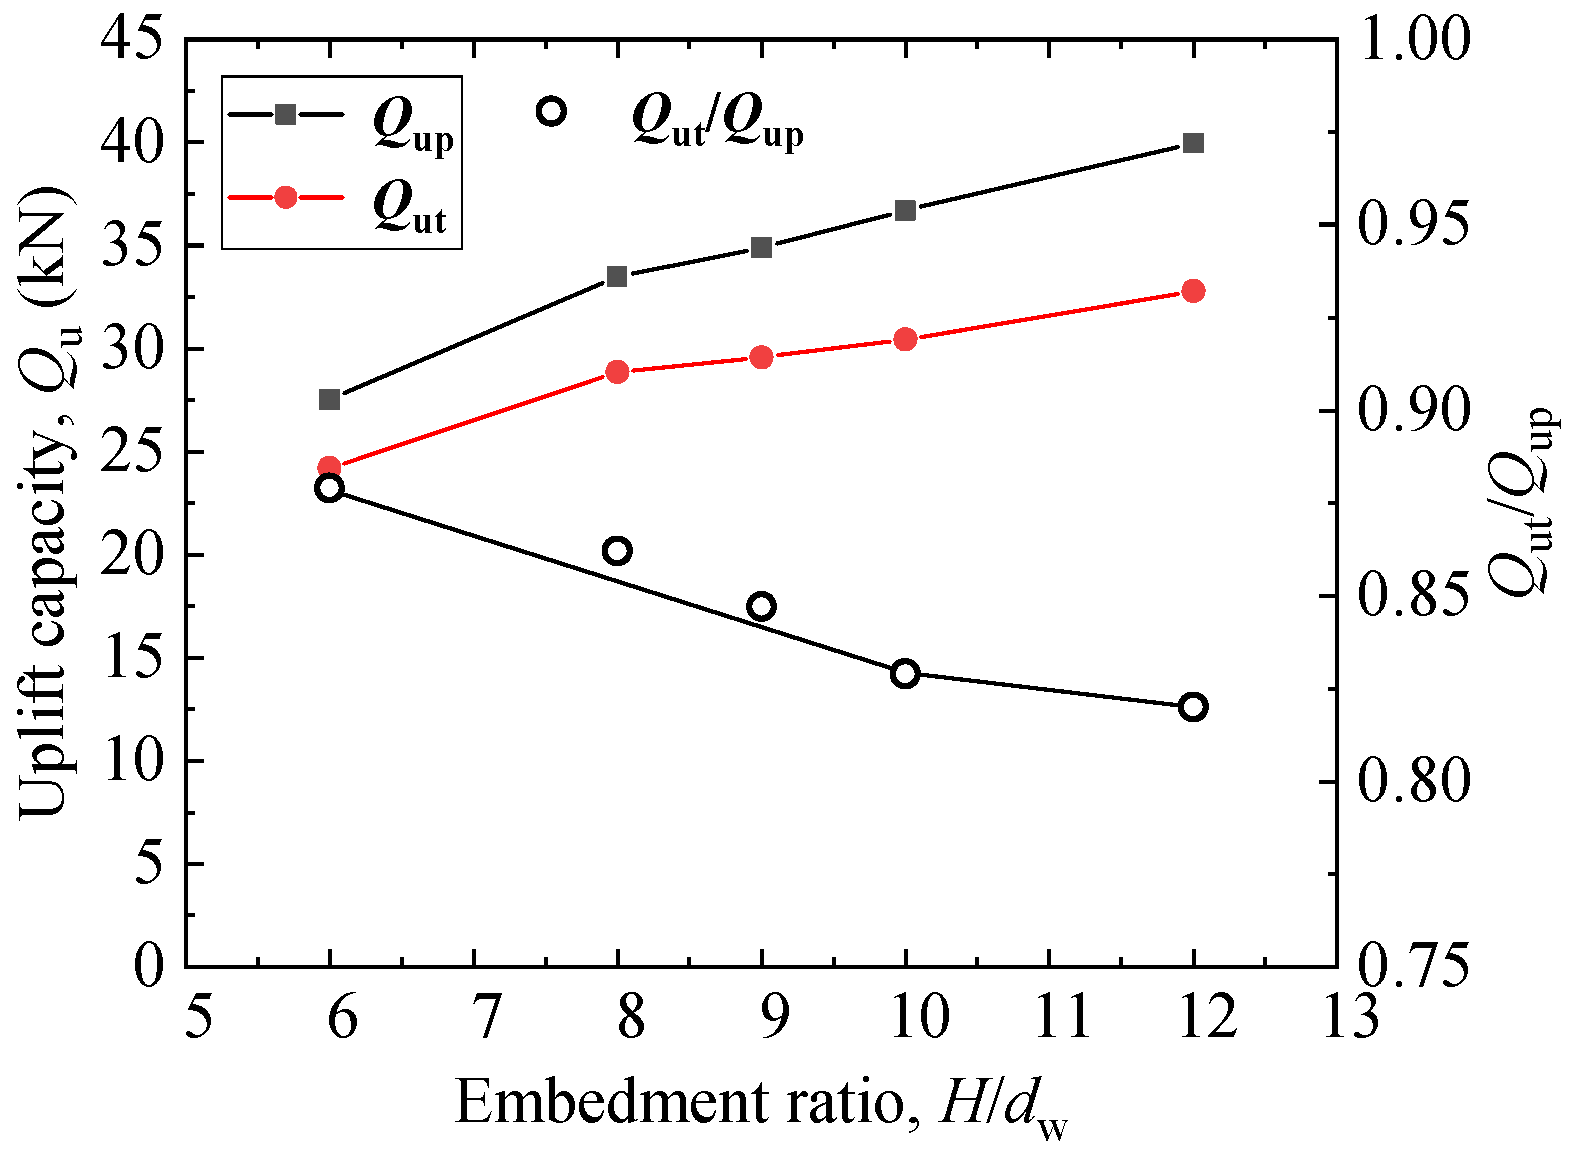
The pitch-matched installation (AR = 1) of a single-helix anchor will make the uplift capacity decrease compared with the cases of wish-in-place conditions (undisturbed conditions). As the embedment ratio increases, the uplift capacity loss caused by installation disturbance (AR = 1) gradually increases. However, when the embedment depth can make deep failure mode occur, the impact rate of the installation disturbance on the uplift capacity becomes slow with the increase of embedment depth.
(5)
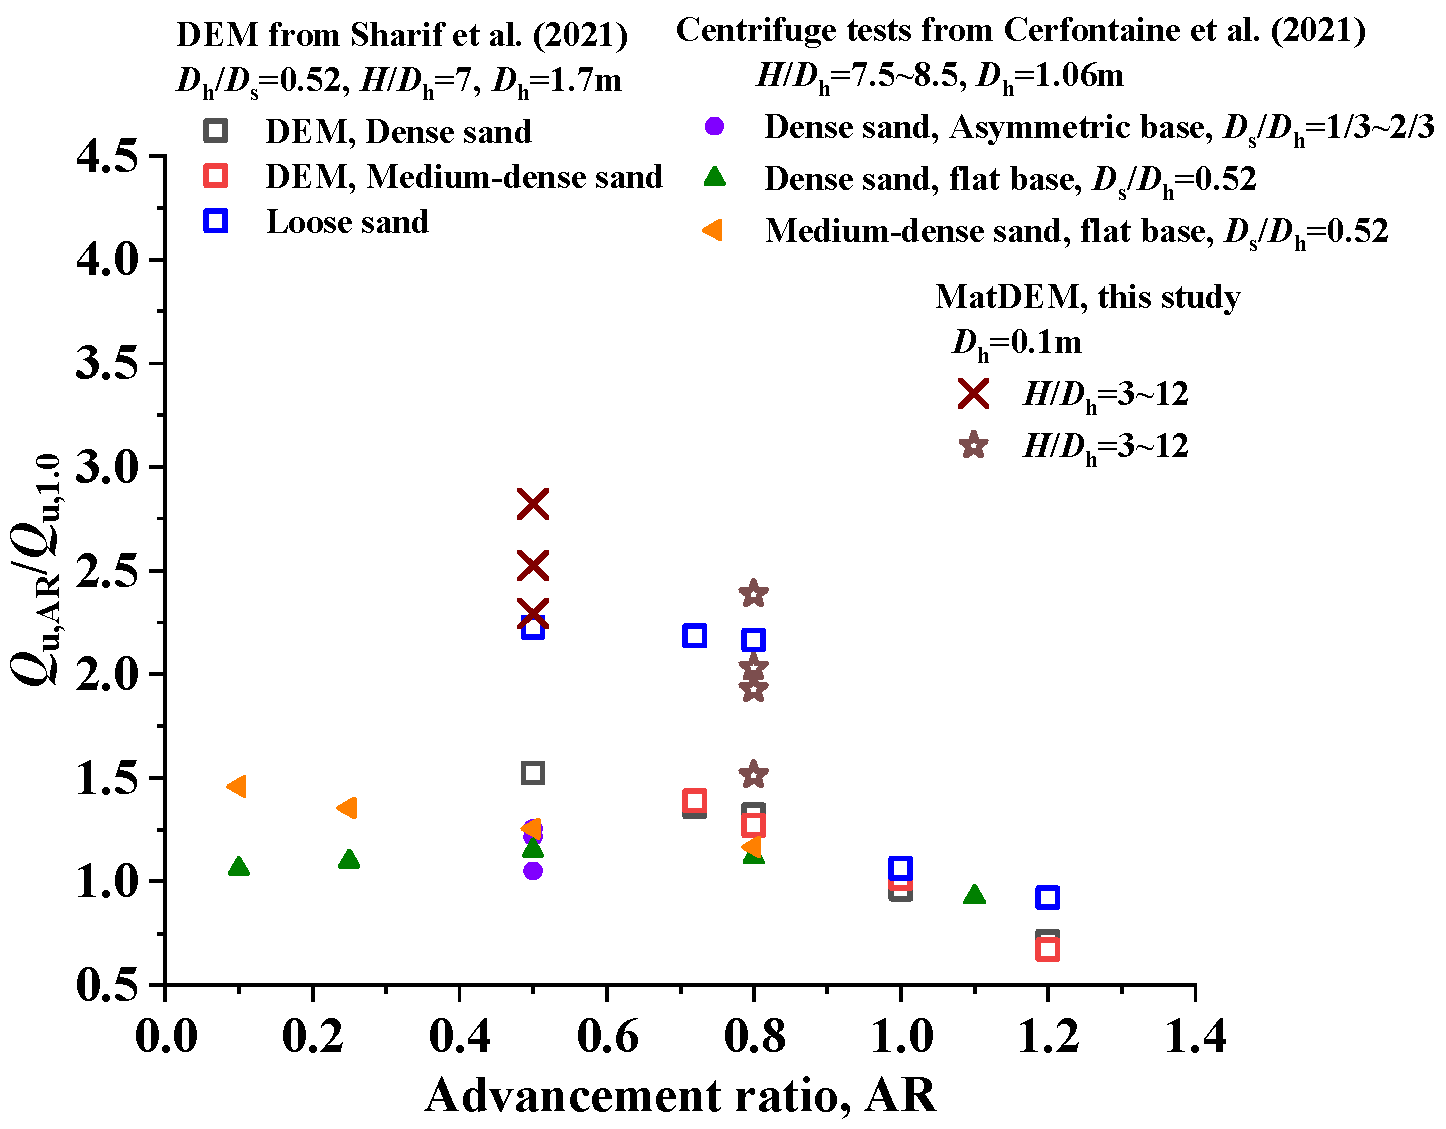
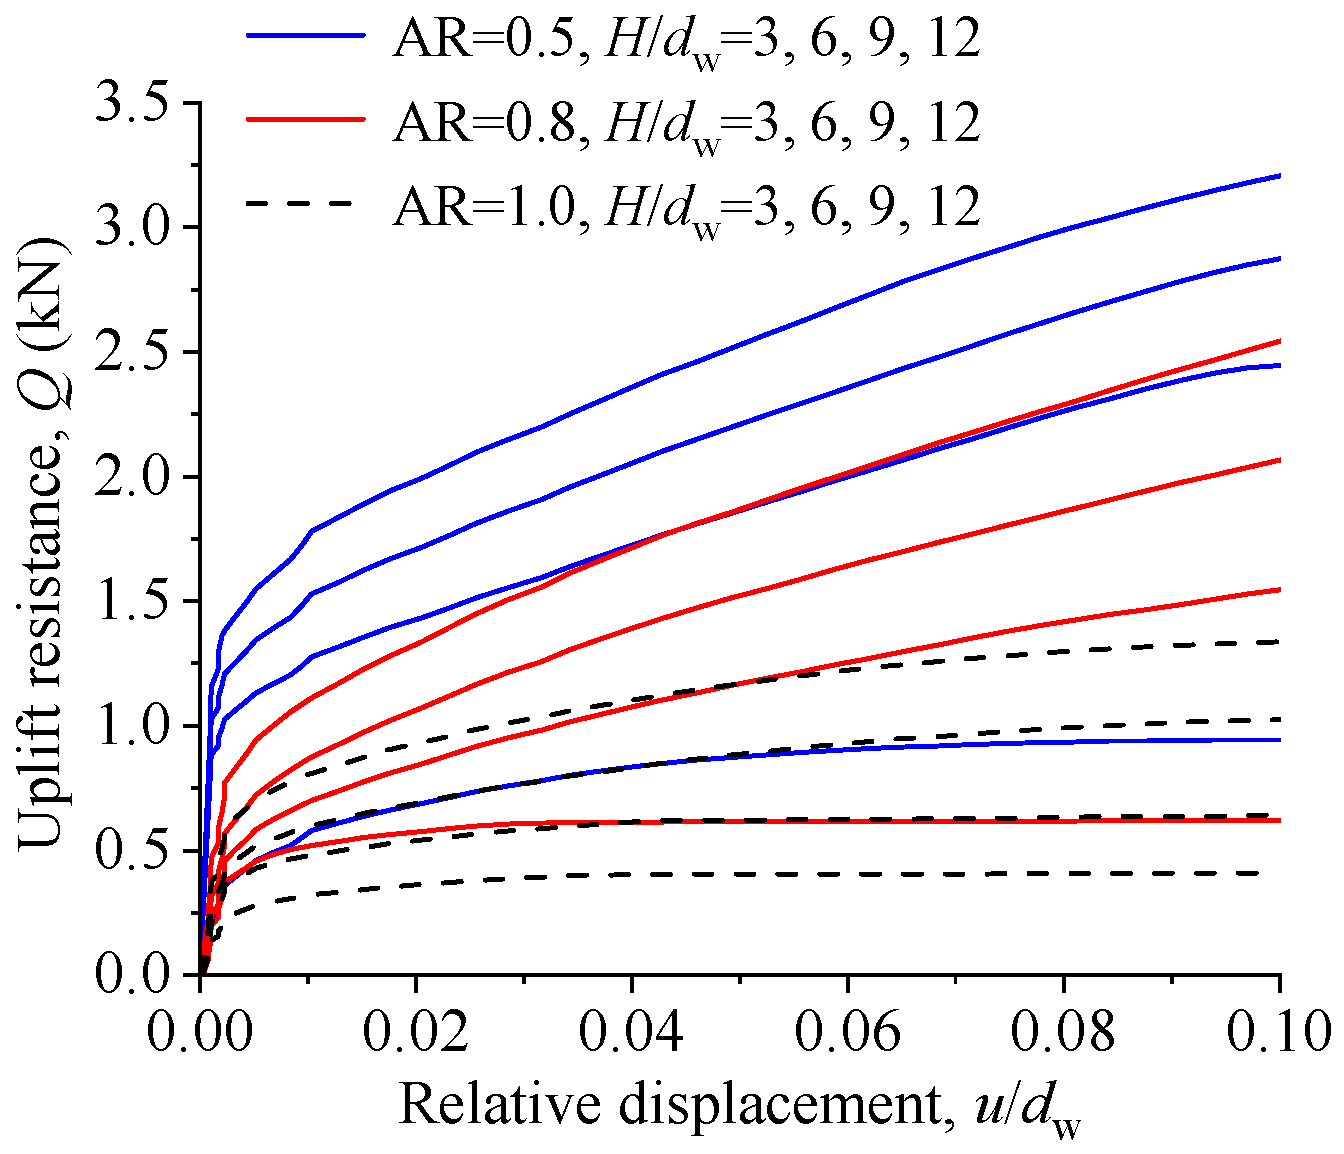
The uplift capacities of both single-helix and double-helix anchors increase with the decrease in the AR (AR = 0.5~1). The efficiency induced by installation is close to 1 for the case of AR = 1, indicating that the impact of the top plate during installation is minimal when AR = 1.
The investigation of the observed disturbance zone and the comparison of the uplift capacity under pitch-matched installation and wish-in-place conditions can provide a beneficial reference for analyzing the considered installation effects. The influence of the installation advancement ratio (AR) on the uplift capacity of double-helical anchors is the same as that of single-helix anchors. But it is also affected by helix spacing and diameter. Further experimental evidence is still required to demonstrate the impact of installation on the uplift capacity of multi-helical anchors with various embedment ratios and anchor geometries in sands with different levels of compactness.

Author Contributions

Conceptualization, formal analysis, and writing—review and editing: R.C. and D.H.; investigation and writing—original draft preparation: H.L. and Z.L.; and investigation and data curation: C.Y. All authors have read and agreed to the published version of the manuscript.

Funding

This research was funded by the National Natural Science Foundation of China (grant number 52078108); Jilin Province Youth Science and Technology Innovation Leader, Team Project of Provincial Department of Science and Technology (grant number 20210509058RQ); and the Scientific Research Project of Jilin Provincial Department of Education (grant number JJKH20210103KJ).

Institutional Review Board Statement

Not applicable.

Informed Consent Statement

Not applicable.

Data Availability Statement

Data are contained within the article.

Conflicts of Interest

Zhaoguo Liu was employed by China Energy Engineering Group Heilongjiang Electric Design Co., Ltd. The remaining authors declare that the research was conducted in the absence of any commercial or financial relationships that could be construed as a potential conflict of interest.

References

  1. Hao, D.; Che, J.; Chen, R.; Zhang, X.; Yuan, C.; Chen, X. Experimental investigation on behavior of single-helix anchor in sand subjected to uplift cyclic loading. J. Mar. Sci. Eng. 2022, 10, 1338. [Google Scholar] [CrossRef]
  2. Lin, Y.; Xiao, J.; Le, C.; Zhang, P.; Chen, Q.; Ding, H. Bearing characteristics of helical pile foundations for offshore wind turbines in sandy Soil. J. Mar. Sci. Eng. 2022, 10, 889. [Google Scholar] [CrossRef]
  3. Lutenegger, A.J. Historical development of iron screw-pile foundations: 1836–1900. Int. J. Hist. Eng. Technol. 2011, 81, 108–128. [Google Scholar] [CrossRef]
  4. Meng, Z.; Chen, J.; Zhang, L.; Wang, J.; Yao, J. Field tests to investigate the installation effects of drilled displacement piles with screw-shaped shaft in clay. J. Geotech. Geoenviron. Eng. 2015, 141, 06015010. [Google Scholar] [CrossRef]
  5. Huang, Z.M. Construction and development of EHV transmission line in China. China Electr. Power 1996, 29, 9–12. (In Chinese) [Google Scholar]
  6. Cerato, A.B.; Victor, R. Effects of helical anchor geometry on long-term performance of small wind tower foundations subject to dynamic loads. J. Deep Found. Inst. 2008, 2, 30–41. [Google Scholar] [CrossRef]
  7. Tsuha, C.H.C.; Aoki, N. Relationship between installation torque and uplift capacity of deep helical piles in sand. Can. Geotech. J. 2010, 47, 635–647. [Google Scholar] [CrossRef]
  8. Kulhawy, F.H. Uplift behavior of shallow soil anchors—An overview: Uplift behavior of anchor foundations in soil. In Uplift Behavior of Anchor Foundations in Soil; ASCE: Reston, VA, USA, 1985; pp. 1–25. [Google Scholar]
  9. Dijkstra, J.; Broere, W.; Bezuijen, A.; Bezuijen, A.; Van Tol, A.F. Density changes near an advancing displacement pile in sand. In Proceedings of the Second BGA International Conference on Foundations, Dundee, UK, 24–27 June 2008; pp. 545–554. [Google Scholar]
  10. Perez, Z.A.; Schiavon, J.A.; Tsuha, C.H.C.; Dias, D.; Thorel, L. Numerical and experimental study on influence of installation effects on behaviour of helical anchors in very dense sand. Can. Geotech. J. 2018, 55, 1067–1080. [Google Scholar] [CrossRef]
  11. Clemence, S.P.; Pepe, F.D. Measurement of lateral stress around multihelix anchors in sand. Geotech. Test. J. 1984, 7, 145–152. [Google Scholar] [CrossRef]
  12. George, B.E.; Banerjee, S.; Gandhi, S.R. Helical piles installed in cohesionless soil by displacement method. Int. J. Geomech. 2019, 19, 0401907. [Google Scholar] [CrossRef]
  13. Lutenegger, A.J.; Tsuha, C.H.C. Evaluating installation disturbance from helical piles and anchors using compression and tension tests. In Proceedings of the Pan-American Conference on Soil Mechanics and Geotechnical Engineering, Buenos Aires, Argentina, 15–19 November 2015; pp. 373–381. [Google Scholar]
  14. Saleem, M.A.; Malik, A.A.; Kuwano, J. Model study of screw pile installation impact on ground disturbance and vertical bearing behaviour in dense sand. Earth Environ. Sci. 2021, 710, 012056. [Google Scholar] [CrossRef]
  15. Davidson, C.; Brown, M.J.; Cerfontaine, B.; Al-Baghdadi, T.; Knappett, J.; Brennan, A.; Augarde, C.; Coombs, W.; Wang, L.; Blake, A.; et al. Physical modelling to demonstrate the feasibility of screw piles for offshore jacket-supported wind energy structures. Géotechnique 2020, 72, 108–126. [Google Scholar] [CrossRef]
  16. Cerfontaine, B.; Brown, M.J.; Knappett, J.A.; Davidson, C.; Sharif, Y.; Huisman, M.; Ottolini, M.; Ball, J.D. Control of screw pile installation to optimise performance for offshore energy applications. Géotechnique 2023, 73, 234–249. [Google Scholar] [CrossRef]
  17. Sakr, M. Relationship between installation torque and axial capacities of helical piles in cohesionless soils. Can. Geotech. J. 2015, 52, 747–759. [Google Scholar] [CrossRef]
  18. Shi, D.; Yang, Y.; Deng, Y.; Xue, J. DEM modelling of screw pile penetration in loose granular assemblies considering the effect of drilling velocity ratio. Granul. Matter 2019, 21, 74. [Google Scholar] [CrossRef]
  19. Bradshaw, A.S.; Zuelke, R.; Hildebrandt, L.; Robertson, T.; Mandujano, R. Physical modelling of a helical pile installed in sand under constant crowd. In Proceedings of the 1st International Symposium on Screw Piles for Energy Applications (ISSPEA), Dundee, UK, 27–28 May 2019; pp. 109–115. [Google Scholar]
  20. Cerfontaine, B.; Brown, M.J.; Davidson, C.; Sharif, Y.U.; Huisman, M.; Ottolini, M. Optimised screw pile design for offshore jacket foundations in medium–dense sand. Geotech. Lett. 2022, 12, 114–119. [Google Scholar] [CrossRef]
  21. Hao, D.X.; Chen, R.; Fu, S.N. Experimental study on uplift capacity of multi-helix anchors in sand. Chin. J. Geotech. Eng. 2015, 37, 126–132. (In Chinese) [Google Scholar]
  22. Jeffrey, J.; Brown, M.J.; Knappett, J.A.; Ball, J.D.; Caucis, K. CHD pile performance: Part I-physical modelling. Proc. ICE Geotech. Eng. 2016, 169, 43–54. [Google Scholar] [CrossRef]
  23. Komatsu, A. Development on battered pile with screw pile method (NS-ECO pile). In Proceedings of the International Workshop on Recent Advances of Deep Foundations, Yokosuka, Japan, 1–2 February 2007; pp. 253–257. [Google Scholar]
  24. Clemence, S.P.; Smithling, A.P. Dynamic uplift capacity of helical anchors in sand. In Proceedings of the 4th Australia-New Zealand Conference on Geomechanics, Perth, Australia, 14–18 May 1984; Volume 1, pp. 88–93. [Google Scholar]
  25. Ilamparuthi, K.; Dickin, E.A.; Muthukrisnaiah, K. Experimental investigation of the uplift behaviour of circular plate anchors embedded in sand. Can. Geotech. J. 2002, 39, 648–664. [Google Scholar] [CrossRef]
  26. Cerato, A.B.; Victor, R. Effects of long-term dynamic loading and fluctuating water table on helical anchor performance for small wind tower foundations. J. Perform. Constr. Facil. ASCE 2009, 23, 251–261. [Google Scholar] [CrossRef]
  27. Hao, D.; Wang, D.; O’Loughlin, C.D.; Gaudin, C. Tensile monotonic capacity of helical anchors in sand: Interaction between helices. Can. Geotech. J. 2019, 56, 1534–1543. [Google Scholar] [CrossRef]
  28. Tsuha, C.H.C.; Aoki, N.; Rault, G.; Thorel, L.; Garnier, J. Evaluation of the efficiencies of helical anchor plates in sand by centrifuge model tests. Can. Geotech. J. 2012, 49, 1102–1114. [Google Scholar] [CrossRef]
  29. Wang, L.; Zhang, P.; Ding, H.; Tian, Y.; Qi, X. The uplift capacity of single-plate helical pile in shallow dense sand including the influence of installation. Mar. Struct. 2020, 71, 102697. [Google Scholar] [CrossRef]
  30. Nagai, H.; Tsuchiya, T.; Shimada, M. Influence of installation method on performance of screwed pile and evaluation of pulling resistance. Soils Found. 2018, 58, 355–369. [Google Scholar] [CrossRef]
  31. Cerfontaine, B.; Ciantia, M.; Brown, M.J.; Sharif, Y.U. DEM study of particle scale and penetration rate on the installation mechanisms of screw piles in sand. Comput. Geotech. 2021, 139, 104380. [Google Scholar] [CrossRef]
  32. Sharif, Y.U.; Brown, M.J.; Cerfontaine, B.; Davidson, C.; Ciantia, M.O.; Knappett, J.A.; Brennan, A.; Ball, J.D.; Augarde, C.; Coombs, W.M.; et al. Effects of screw pile installation on installation requirements and in-service performance using the discrete element method. Can. Geotech. J. 2021, 58, 1334–1350. [Google Scholar] [CrossRef]
  33. Sharif, Y.U.; Brown, M.J.; Ciantia, M.O.; Cerfontaine, B.; Davidson, C.; Knappett, J.A.; Ball, J.D. Assessing single-helix screw pile geometry on offshore installation and axial capacity. Proc. Inst. Civ. Eng. Geotech. Eng. 2021, 174, 512–529. [Google Scholar] [CrossRef]
  34. Kurian, N.P.; Shah, S.J. Studies on the behavior of screw piles by the finite element method. Can. Geotech. J. 2009, 46, 627–638. [Google Scholar] [CrossRef]
  35. Rawat, S.; Gupta, A.K. Numerical modelling of pullout of helical soil nail. J. Rock Mech. Geotech. Eng. 2017, 9, 648–658. [Google Scholar] [CrossRef]
  36. Chen, R.; Fu, S.N.; Hao, D.X.; Shi, D.D. Scale effects of uplift capacity of circular anchors in dense sand. Chin. J. Geotech. Eng. 2019, 41, 78–85. (In Chinese) [Google Scholar]
  37. Cerfontaine, B.; Knappett, J.A.; Brown, M.J.; Davidson, C.S.; AI-Baghdadi, T.; Sharif, Y.U.; Brennan, A.; Augarde, C.; Coombs, W.M.; Wang, L. A finite element approach for determining the full load–displacement relationship of axially loaded shallow screw anchors, incorporating installation effects. Can. Geotech. J. 2021, 58, 565–582. [Google Scholar] [CrossRef]
  38. Shao, K.; Su, Q.; Liu, J.; Liu, K.; Xiong, Z.; Wang, T. Optimization of inter-helix spacing for helical piles in sand. J. Rock Mech. Geotech. Eng. 2022, 14, 936–952. [Google Scholar] [CrossRef]
  39. Yuan, C.; Hao, D.; Chen, R.; Zhang, N. Numerical investigation of uplift failure mode and capacity estimation for deep helical anchors in sand. J. Mar. Sci. Eng. 2023, 11, 1547. [Google Scholar] [CrossRef]
  40. Hao, D.X.; Fu, S.N.; Chen, R.; Zhang, Y.J.; Hou, L.Q. Experimental investigation of uplift behavior of anchors and estimation of uplift capacity in sands. Chin. J. Geotech. Eng. 2015, 37, 2101–2106. (In Chinese) [Google Scholar]
  41. Liu, C.; Pollard, D.D.; Shi, B. Analytical solutions and numerical tests of elastic and failure behaviors of close-packed lattice for brittle rocks and crystals. J. Geophys. Res. Solid Earth 2013, 118, 71–82. [Google Scholar] [CrossRef]
  42. Morgan, J.K.; Boettcher, M.S. Numerical simulations of granular shear zones using the distinct element method. Shear zone kinematics and the micromechanics of localization. J. Geophys. Res. Solid Earth 1999, 104, 2703–2719. [Google Scholar] [CrossRef]
  43. Kuhn, M.R.; Bagi, K. Contact rolling and deformation in granular media. Int. J. Solids Struct. 2004, 41, 5793–5820. [Google Scholar] [CrossRef]
  44. Ergenzinger, C.; Seifried, R.; Eberhard, P. A discrete element model to describe failure of strong rock in uniaxial compression. Granul. Matter 2011, 13, 341–364. [Google Scholar] [CrossRef]
  45. Liu, C.; Shi, B.; Gu, K.; Sun, Y.J. Development and application of large-scale discrete element simulation system for rock and soil. J. Eng. Geol. 2014, 22, 551–557. (In Chinese) [Google Scholar]
  46. Arroyo, M.; Butlanska, J.; Gens, A.; Calvetti, F.; Jamiolkowski, M. Cone penetration tests in a virtual calibration chamber. Géotechnique 2011, 61, 525–531. [Google Scholar] [CrossRef]
  47. Bradshaw, A.S.; Cullen, L.; Miller, Z. Field study of group effects on the pullout capacity of “deep” helical piles in sand. Can. Geotech. J. 2022, 59, 538–545. [Google Scholar] [CrossRef]
Figure 1. Particle contact: (a) normal spring contact, (b) tangential spring contact.
Jmse 12 00422 g001
Figure 2. Soil and anchor model diagram.
Jmse 12 00422 g002
Figure 3. Comparisons of numerical and test results: (a) uplift resistance–displacement relationship, (b) installation torque.
Jmse 12 00422 g003
Figure 4. Displacement nephogram of single-helix anchor with H/dw = 12 during installation (surcharge p = 100 kPa) (a) L = 3 dw (b) L = 6 dw (c) L = 9 dw (d) L = 12 dw (unit: m).
Jmse 12 00422 g004
Figure 5. Horizontal displacement of particles at the vertical line of rdw/2 at various penetration depths.
Jmse 12 00422 g005
Figure 6. Displacement nephogram during installation for different AR: (a) L = 3 dw, (b) L = 6 dw, (c) L = 9 dw, (d) L = 12 dw (unit: m).
Jmse 12 00422 g006
Figure 7. Comparison of particle displacement after installation for single-helix anchor with H/dw = 12 at AR = 0.5 and 1.0. (a) Vertical displacement, (b) lateral displacement (unit: m).
Jmse 12 00422 g007
Figure 8. Soil particle displacement nephogram of double-helix anchors with different relative helix spacing at AR = 0.5. (a) Vertical displacement, (b) lateral displacement (unit: m).
Jmse 12 00422 g008
Figure 9. Comparisons of particle lateral displacement of double-helix anchor with single-helix anchor at AR = 0.5. (a) S/dw = 3, (b) S/dw = 4.5.
Jmse 12 00422 g009
Figure 10. Comparisons of particle vertical displacement of double-helix anchor with single-helix anchor at AR = 0.5. (a) Double-helix anchor with S/dw =3. (b) Double-helix anchor with S/dw =4.5. (c) Single-helix anchor.
Jmse 12 00422 g010
Figure 11. Soil particle displacement nephogram of double-helix anchors with different relative helix spacing at AR = 1. (a) Vertical displacement, (b) lateral displacement.
Jmse 12 00422 g011aJmse 12 00422 g011b
Figure 12. Soil particle lateral displacement of double-helix anchors with different relative helix spacing at AR = 1. (a) S/dw = 3, (b) S/dw = 4.5.
Jmse 12 00422 g012
Figure 13. Soil particle vertical displacement diagram of double-helix anchors with different relative helix spacing at AR = 1. (a) Double-helix anchor with S/dw = 3. (b) Double-helix anchor with S/dw = 4.5. (c) Single-helix anchor.
Jmse 12 00422 g013
Figure 14. Schematic diagram of particle motion for different ARs. (a) Single-helix anchor. (b) Double-helix anchor.
Jmse 12 00422 g014
Figure 15. Q-u/dw curves for single-helix anchors with various embedment ratios under different installation methods (surcharge p = 100 kPa).
Jmse 12 00422 g015
Figure 16. Comparisons of Qu between the wish-in-place and installation with various embedment ratios (surcharge p = 100 kPa).
Jmse 12 00422 g016
Figure 17. Q-u/dw curves for various ARs and embedment ratios.
Jmse 12 00422 g017
Figure 18. The comparisons of uplift capacity for different ARs.
Jmse 12 00422 g018
Figure 19. Comparisons of the effects of AR on uplift capacity [16,32].
Jmse 12 00422 g019
Figure 20. Relationships of uplift resistance and relative displacement for various ARs and embedment ratios.
Jmse 12 00422 g020
Figure 21. The uplift capacities and efficiency of double-helix anchors for different ARs.
Jmse 12 00422 g021
Figure 22. Displacement nephogram of double-helix anchor with S/dw = 4.5, (a) AR = 0.5, (b) AR = 1.
Jmse 12 00422 g022
Table 1. Calibration values of macroscopic and microscopic mechanical parameters.
Macro-ParametersMicro-Parameters
Dense SandAnchor Dense SandAnchor
Modulus, (E/GPa)0.1625.4Normal stiffness Kn/(MN/m)3.0322112.31
Poisson’s ratio, v0.160.24Shear stiffness Ks (MN/m)0.522819.363
Tensile strength (Tu/kPa)0.061.2 × 104Breaking displacement Xb (m)2.04 × 10−91.363 × 10−5
Compression strength (Cu/kPa)1.31.3 × 104Friction coefficient, μp0.28280
Internal friction coefficient, μi0.750.3Shear resistance Tf (N)0.0421866.67
Density ρ/(kg·m−3)20119341
Table 2. Modeling program.
GroupInfluence FactorInstallation ModeHelix Diameter, dw(mm)Embedment Ratio, H/dwRelative Spacing S/dwSurcharge Pressure (kPa)
Single-helix anchorEmbedment depth,
installation mode
Wish-in-place
AR = 1
1006, 8, 9, 10, 12-100
AR = 0.5, 0.8, 11003, 6, 9, 12--
Double-helix anchorHelix number,
relative spacing
AR = 0.5, 0.8, 11003, 6, 9, 123, 4.5-
AR = Δz/ph, Δz—the vertical displacement per rotation, ph—the geometric pitch of helical plate.
Disclaimer/Publisher’s Note: The statements, opinions and data contained in all publications are solely those of the individual author(s) and contributor(s) and not of MDPI and/or the editor(s). MDPI and/or the editor(s) disclaim responsibility for any injury to people or property resulting from any ideas, methods, instructions or products referred to in the content.

