1. Introduction
The formation and subsequent collapse of vapor bubbles in a fluid can have detrimental effects on various engineering systems, including propellers, rudders, pumps, impeller, and hydraulic turbines. Over the years, multiple numerical and experimental investigations have been conducted to unveil the mechanisms of cavitation around cylinders, including the previous works by [
1,
2]. The phenomenon of cavitation can lead to significant damage and erosion on solid boundaries, a reduction in hydrodynamic efficiency, and an increase in noise and vibration on immersible bodies [
3,
4]. The geometry of circular cylinders is usually employed in different industrial applications such as marine engineering and ship technology. Previous studies have examined cavitating flows around circular cylinders under various cavitation conditions. Matsudaira et al. [
5] investigated the cavitation dynamics and bubble-collapse pressures in a Karman–vortex cavity. They found that the shedding frequency of the vortex cavities have a close relationship with the frequency of the pressure pulsations induced by the vortex cavity collapses.
Saito and Sato [
6] studied the Karman vortices behind a circular cylinder, analyzing the cavity fluctuations and the cavity-induced erosion on the test section’s wall behind the cylinder. Their results revealed that the collapse of the cavity structures on the wall surface was one of the main reasons for the generated erosion. Kumar et al. [
7] conducted experimental research to study the cavitation dynamics and vortex cavitation formed behind a circular cylinder at a middle Reynolds number of 64,000. They indicated that the frequency of the cavitation shedding may be mitigated when the cavitation number is reduced in the cavitating flows behind the cylinder. In addition, they found that high pressure pulsations can be observed behind the cylinder in cavitating flows with lower cavitation numbers. Gnanaskandan and Mahesh [
8] numerically studied the near-wake characteristics of cavitating flow over a circular cylinder. Their results revealed that the significant impact of cavitation on pressure distribution was formed due to the collapse of cavitation behind the circular cylinder.
Dobroselsky [
9] experimentally studied the cavitation streamlining of a circular cylinder in the critical range. His results showed that a periodic cavity shedding behavior behind the cylinder can be observed at the critical Reynolds number. In addition, He indicated that the cavitation inception formed on the cylinder can depend on the effects of the Reynolds number. Gu et al. [
10] numerically studied the cavitation dynamics and multiscale vortices formed behind a circular cylinder using the large eddy simulation (LES) method at a middle Reynolds number of about 9500. Brandao et al. [
11] investigated the cavitation behavior behind a circular cylinder at different cavitating regimes. Their results revealed that the propagation of the condensation front can induce significant fluctuations in the cavity structures and Karman vortices behind the cylinder. Sadri and Kadivar [
12] numerically studied the vortex cavitation dynamics behind one and two circular cylinders and the effects of the gap between the cylinders on the cavitation dynamics at an unsteady cavitating regime. In addition, they analyzed the cavitation-induced noise due to the collapse of the cavity behind the cylinders. They found that a quasi-singular vortex structure can be observed by reducing the gap between the two cylinders. In other words, much larger cavitation-induced pressure fluctuations can be formed behind the neighboring cylinders by enhancing the distance between the cylinders.
To mitigate these undesirable effects, engineers have been exploring various methods to control and suppress the cavitation and its destructive effects. In order to understand the internal structures of cavities and control their detrimental effects, studies have been conducted to quantitatively identify the internal phenomena in multiphase flows [
13,
14]. There have been several proposed methods for controlling the cavitation dynamics on immersible bodies, which can be classified as either active or passive control methods. Active control methods involve introducing an additional force or momentum to the low-energy boundary layer, such as through the use of air injection or synthetic jets [
15,
16]. They employed synthetic jet actuators to effectively mitigate the cavitation occurring on hydrofoils. Their results showed that the active control method can reduce the adverse effects of cavitation during the operation of the hydrofoils. By generating controlled air or fluid jets through synthetic jet actuators, cavitation dynamics and pressure pulsations around the hydrofoil can be manipulated in cavitating regimes.
Timoshevskiy et al. [
16] found that the tangential injection of liquid from the middle of a hydrofoil surface can effectively suppress cavitation. They asserted that their technique is a promising way to suppress both the partial unsteady cavity and cavitation cloud. In addition, the pressure fluctuations in the cloud cavitation regime were mitigated using fluid injection. Despite the considerable advantages that active flow control methods offer, they need external energy sources and the implementation of air/water injection systems, adding complexity to the manufacturing process and limiting their applicability in long-distance navigation scenarios. It is worth noting that passive control methods for cavitation manipulation have attracted more attention due to their practicality and effectiveness compared to active approaches [
17,
18,
19,
20,
21]. Kadivar et al. [
22] studied the control of unsteady cloud and cavitation surge by employing various types of vortex generators mounted on the surface of hydrofoils. They used wedge-type and hemispherical-type vortex generators to control pressure pulsations resulting from cavitation on the hydrofoils.
Modifying the surface properties, such as applying porous coatings to the body’s surface, has proven to be an effective and promising strategy for controlling cavitation. Specifically, by introducing a porous layer, the efficiency and robustness of fluid machinery can be augmented without the need for any modifications to the machinery design. In the study by Bilus and Predin [
23], a porous layer is employed around the impeller blades to mitigate cavitating flow within the pump. This approach involves altering the physical characteristics of the surface, introducing porous structures that can disrupt the formation and collapse of vapor bubbles in the cavitating flow [
19]. The porous layer allows the fluid to penetrate into its structure, effectively reducing the pressure fluctuations and preventing the formation of large-scale cavity structures. By introducing a porous layer, the cavitating flow is forced to pass through the interconnected pores, dissipating the energy of the flow and suppressing cavitation. Yu et al. [
19] experimentally and numerically studied the dynamics of an unsteady cavitation around a hemisphere cylinder with and without a porous layer. They concluded that a porous layer can suppress the cavitation inception and vortex structures around the cylinder. They indicated that different characteristics of the porous layer, such as material properties, pore size, pore distribution, and porosity can influence the effectiveness of porous layers in controlling cavitation. Additionally, the thickness and surface roughness of the porous layer play a crucial role in determining flow characteristics [
20]. The ability to handle complexities in the geometry of porous layers accurately and efficiently is a primary concern in computational fluid dynamics. To address these complexities, the immersed boundary method (IBM) has emerged as an effective approach [
24,
25,
26,
27,
28].
Within this methodological framework, the volume penalization technique, which is categorized as an immersed boundary method, plays the main role in simulating flow around complex geometries [
26]. The volume penalization technique is particularly useful when dealing with flow problems that involve solid obstacles or porous media, where grid generation or meshing can be challenging. In this technique, the flow domain is divided into two regions: the fluid region and the obstacle region. The flow equations, typically the Navier–Stokes equations, are solved over the entire domain; however, a penalization term is introduced in the governing equations within the obstacle region [
26]. This penalization term enforces the no-slip boundary condition and simulates the presence of the solid obstacle or porous medium. This term essentially acts as a forcing term to mimic the presence of the solid structure, ensuring that the flow behaves as if the porous medium is present [
27].
While extensive research has been conducted on controlling cavitation on hydrofoils through passive flow control methods, the potential of using a porous layer as a cavitation control mechanism in a typical test case, such as a circular cylinder, has not been extensively explored in previous studies. Overall, the study and control of cavitation around circular cylinders play a crucial role as foundational elements in understanding more complex flow phenomena and in optimizing the design and performance of engineering systems, such as ship propellers and hydraulic turbines. Consequently, there is a significant gap in the existing literature regarding a comprehensive numerical investigation of this particular cavitation control strategy. For this research topic, the integration of fluid dynamics, materials science, and computational modeling allows for the simulation and quantification of the effect of porous surfaces on cavitation control around blunt bodies. In the scope of our present research, one of the primary objectives was to conduct a comprehensive investigation of the influence of the permeability of a porous layer with a certain thickness on the control of cavitation around a circular cylinder. To achieve this aim, we employed numerical simulation techniques, allowing us to explore and understand the dynamics of the cavitation phenomenon around a circular cylinder with and without porous layers.
2. Methodology
In this research, the penalized Navier–Stokes equations for porous media were utilized, as proposed by [
28], to simulate the two-phase flow in the presence of porosity. Furthermore, our study incorporates the homogeneous mixture model [
29], which assumes that the phase mixture behaves as a single compressible fluid. Within this model, a linear combination of liquid and vapor densities was considered, while assuming isothermal conditions and local kinematic equilibrium between the phases:
The last term on the right side of the continuity equation (Equation (1)) and the last two terms on the right side of the momentum equations (Equation (2)) represent a volume penalization of the flow inside the body. Here,
is the porosity and
is the mixture viscosity. The permeability, denoted as
, is determined by the structure of porous materials. The permeability signifies the material’s capacity to allow the flow of fluids or gases through its porous structure. Following the homogenous equilibrium model for compressible two-phase gas-liquid systems [
24], the mixture density
is expressed as a linear combination of gas density
and liquid density
in the following manner:
The relationship between the void fraction
and the gas mass fraction
can be described as follows:
In the case of a pure liquid phase, the equation of state is described as follows [
30]:
For the vapor phase, the ideal gas equation of state is assumed:
where
,
,
and
are the pressure, temperature, liquid, and gas constants, respectively. The mixture viscosity is expressed by [
30]:
In the penalization technique, the mask function
is defined as follows:
When , the ordinary Navier–Stokes equations are regenerated.
Two-phase flows, marked by significant sound-speed variations due to the varying compressibility of the liquid and the two-phase mixture, pose a challenge in simulation. Demonstrating a solution, a preconditioned technique is established. The governing Equations (1)–(3), with preconditioning, are rewritten in the vector form as:
where,
t is the physical time,
τ is a pseudo-time,
and
are the primitive variable vector and the Jacobian matrix, respectively.
is the conservative vector,
is the flux vector, and
is the penalized term. For the two-dimensional flows, the vectors and matrix are defined as:
Here,
, which represents the inverse of the square of the isothermal speed of sound. Additionally,
. To ensure reliable accuracy,
in
is replaced by
, and the preconditioning matrix
is introduced as follows [
31]:
The second-order backward differencing for the physical-time derivative and explicit Euler for the pseudo-time derivative [
31] are applied.
In this paper, n denotes the index for physical time, while m represents the index for pseudo-time (see [
32] for more details).
For the spatial derivatives, the fourth-order compact finite-difference method [
33] is applied, and, to avoid the oscillatory solutions, the high-order low-pass spatial filter [
34] has been applied to the solution. The compact scheme, owing to its reasonable spatial resolution and small computational stencil size, proves suitable for the ongoing simulations. In the x-direction, the derivative of any function
in the interior points can be obtained by the following expression [
33]:
and at the boundary points, the third-order one-sided formulas are applied. The non-reflective boundary conditions to reduce artificial waves reflections from the boundaries presented by Tam and Dong [
35] are imposed for all the free boundaries. The boundary condition is given by solving the following equation:
where
and
are the polar coordinates, and
is the acoustic group velocity. To remove the possible reflections from the boundaries, the sponge layer with the grid stretching is added to the right-hand side of the governing equations.
3. Results and Discussion
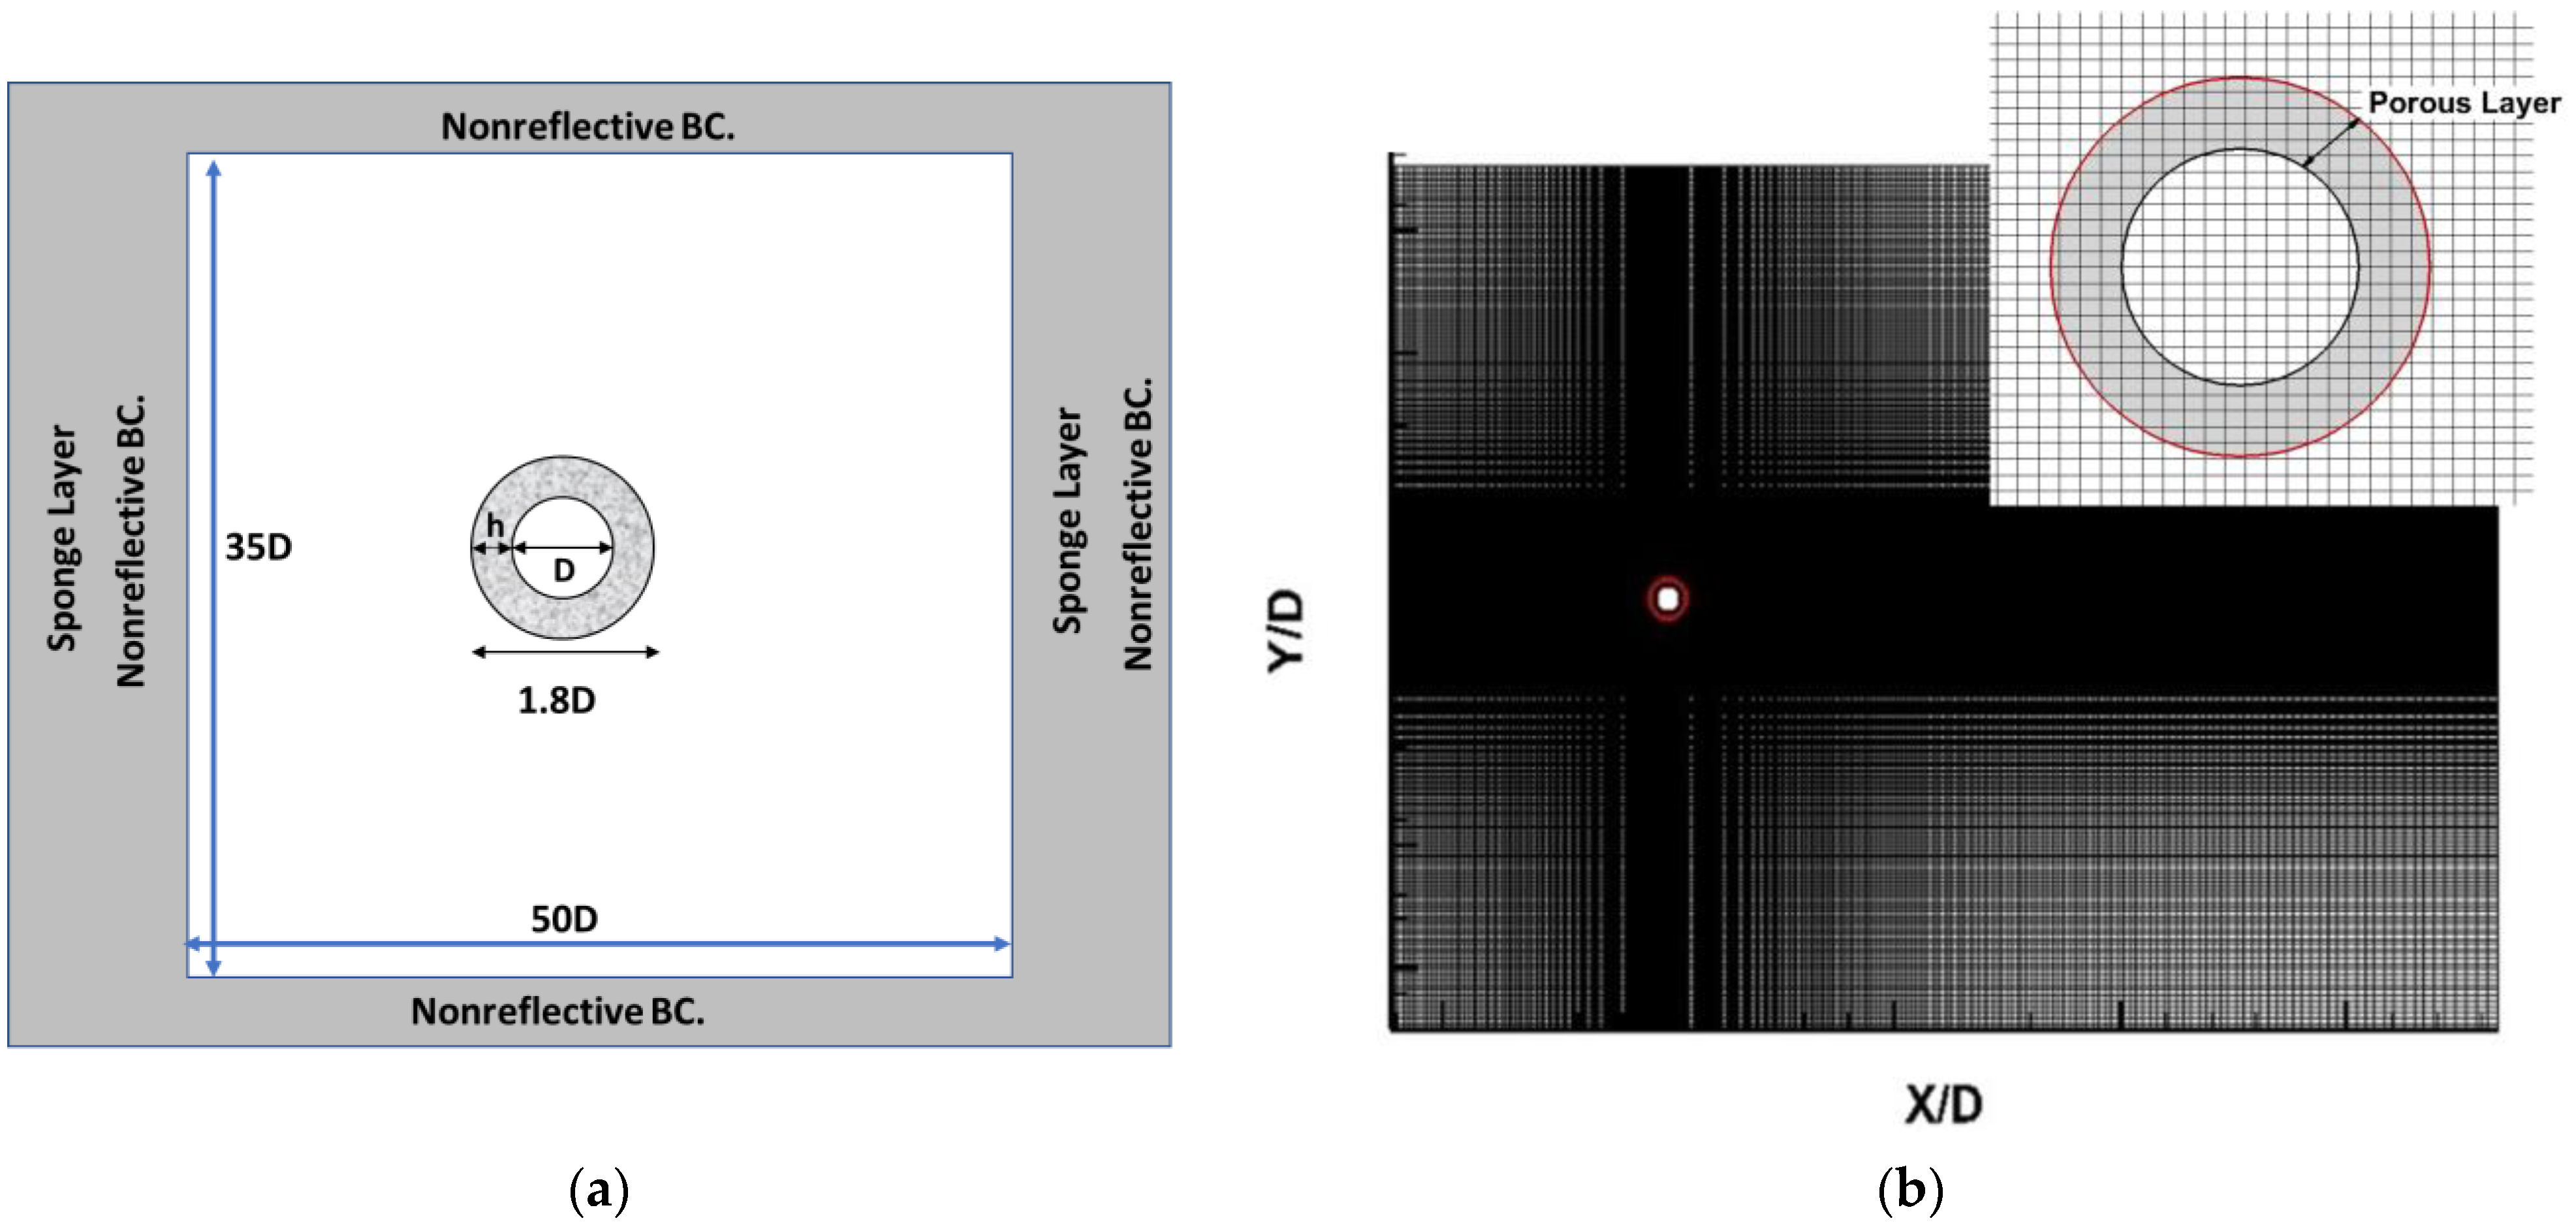
In this section, the flow field over an isolated circular cylinder at the Reynolds number of Re = 200 and cavitation number
was studied, with a porous layer thickness
and porosity φ = 0.98. The cavitation number
and Reynolds number Re were given by
and
. A small void fraction of
= 0.01 was used to start the cavitation. Considering that the cell diameter of the porous material is in the micrometer orders, the permeability
typically spans from
to
[
36]. Indeed, as
decreases, the fluid permeability to the porous layer diminishes, and it assumes a more solid-like behavior. A rectangular grid system with non-uniform spacing was applied for the mesh type. The grid points are densely concentrated close to the cylinder surface and within the wake region, especially surrounding the porous treatment area, ensuring a minimum of 10–12 grid points within the porous layer. The computational domain is presented schematically in
Figure 1.
3.1. Validation
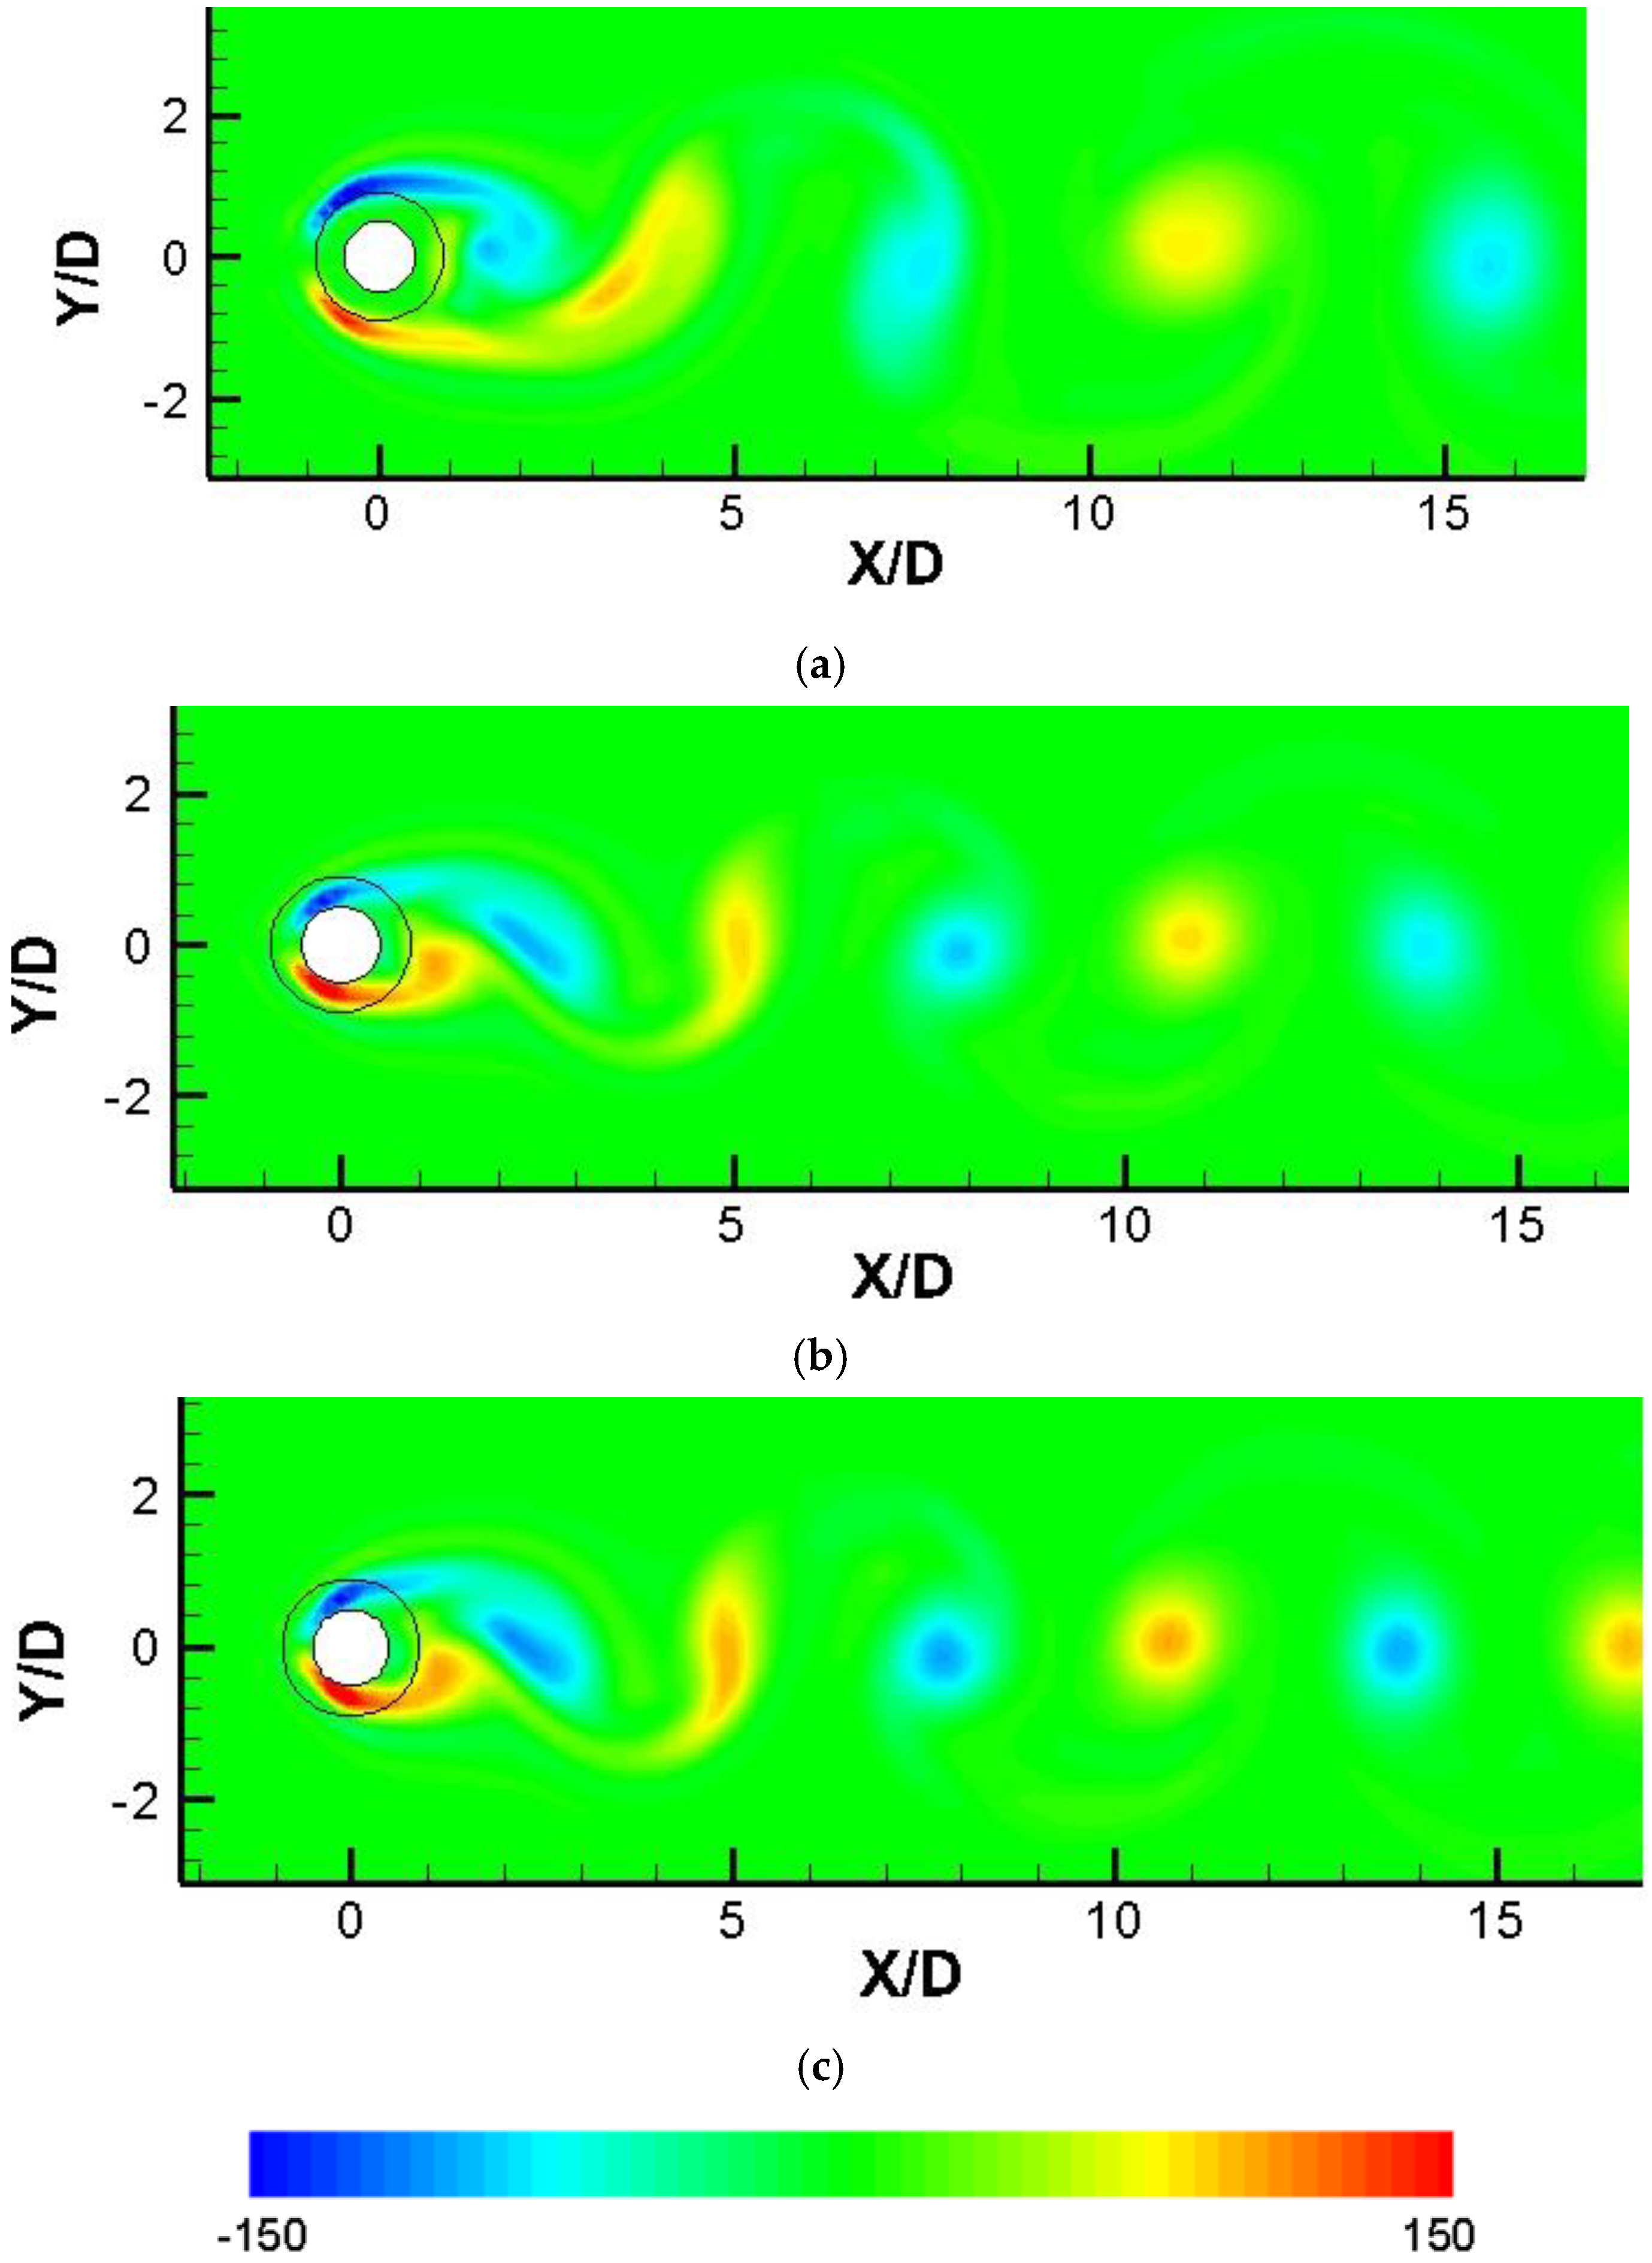
In order to examine the accuracy and efficiency of the methodology, we firstly considered single phase flow around the circular cylinder with Re = 150. The Mach number of uniform flow was set to 0.2. The cylinder was wrapped with a porous layer with a thickness
. In order to compare the results with the available data, we assumed
in Equation (2) is constant. Three values of
η, namely
10, and
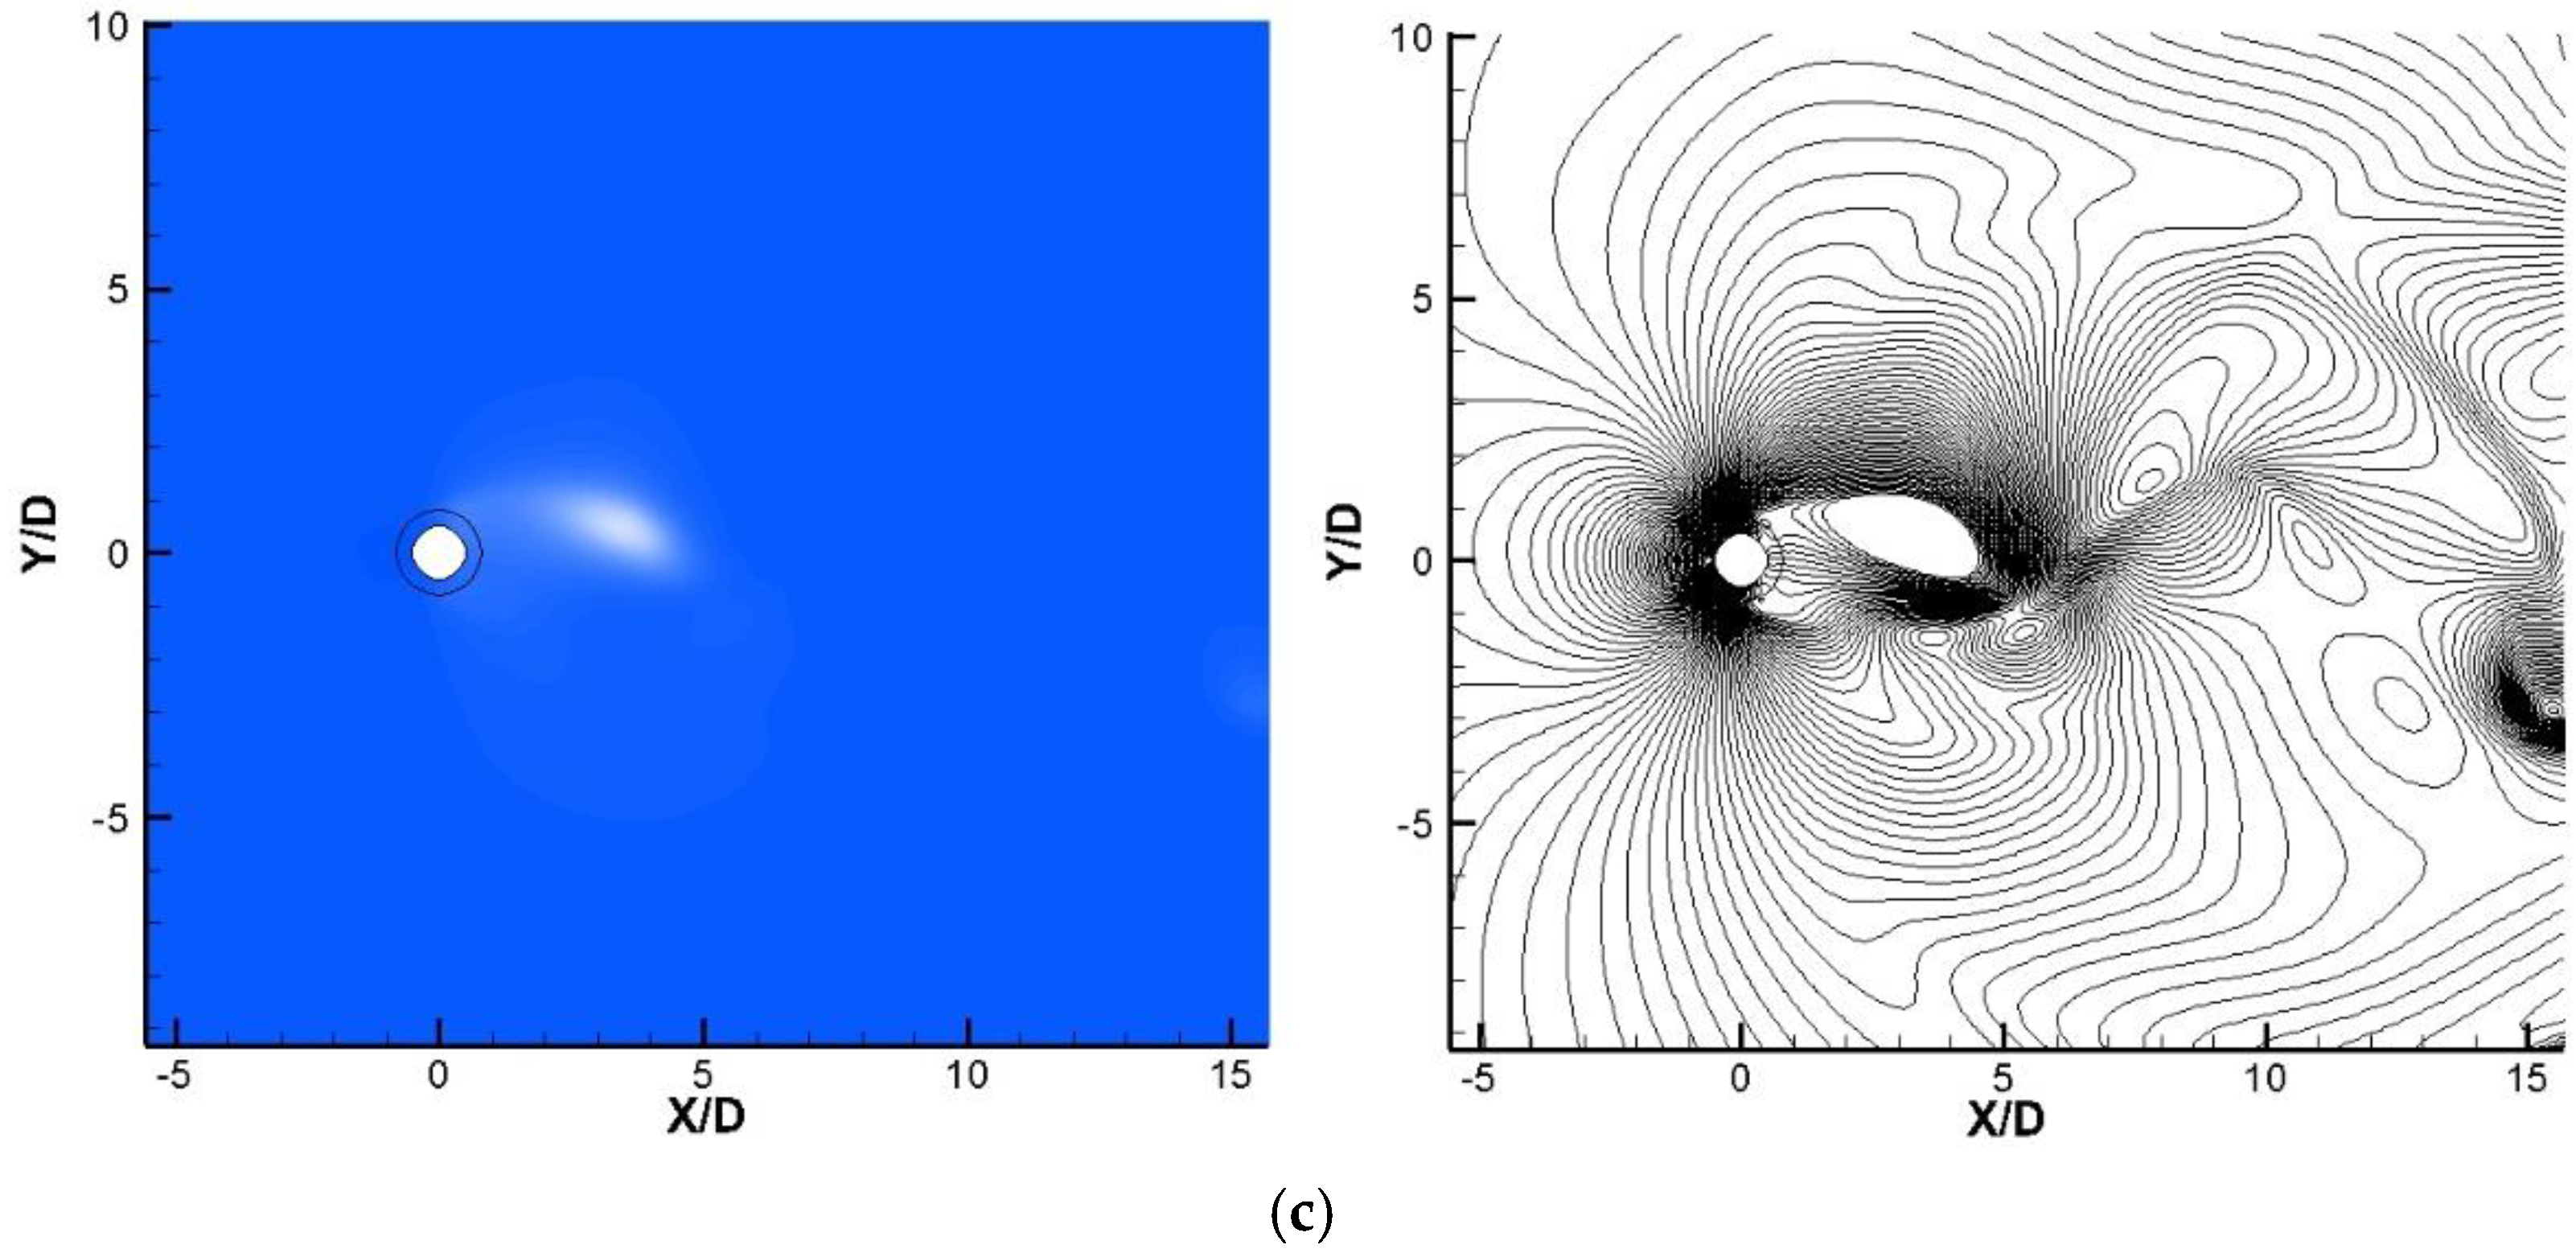
with a porosity of φ = 0.98 are studied for the corresponding simulation. To better understand the effect of permeability on the aerodynamic results, the instantaneous spanwise vorticity fields of cylinders covered by the porous layer of different
are shown in
Figure 2. The outer solid line represents the porous layer. It can be observed that, when permeability is very low (
), the porous materials act like solids, and the vortex shedding happens from the surface of the porous coating. In contrast, when permeability is quite high,
, the porous materials act like pure fluids and the vortex shedding occurs around the inner solid cylinder. At
, the shear flow around the body is slightly deviated towards the outer layer, resulting in an attenuation of the vortex strength.
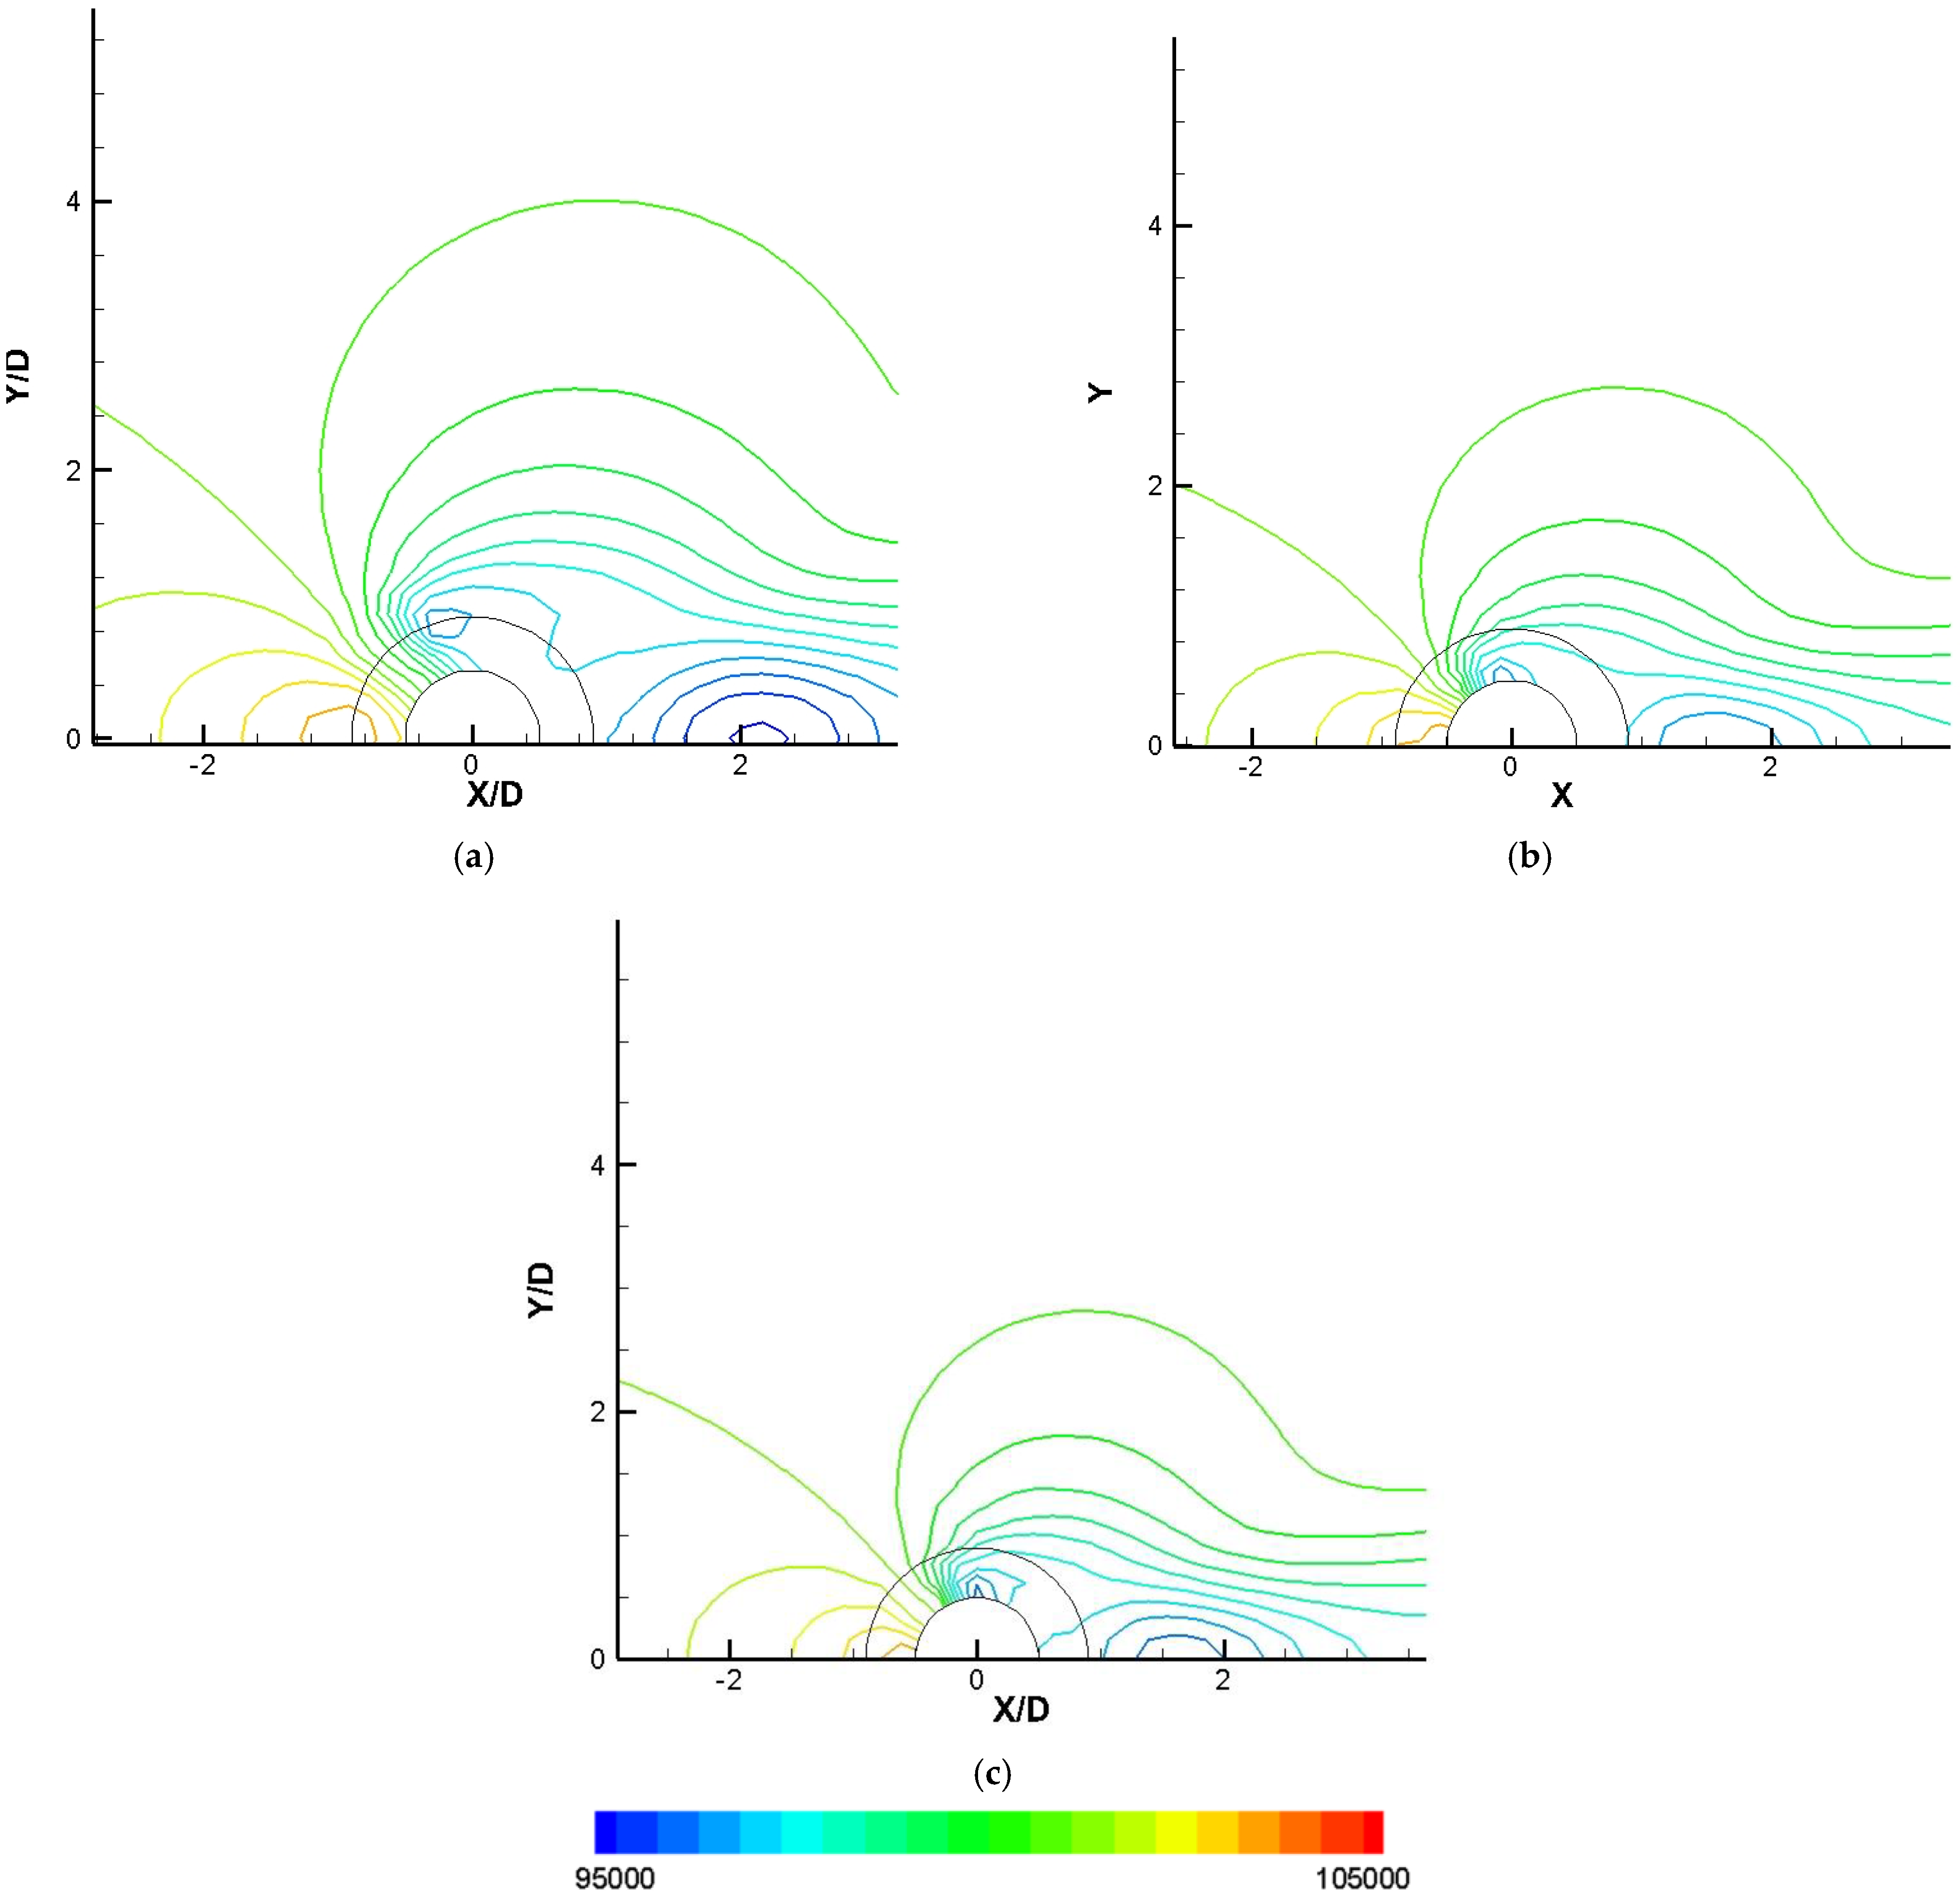
In
Figure 3, the time-averaged pressure contours for the smooth cylinder (
), the porous cylinder (
), and the larger cylinder (
) are displayed. It is evident that the presence of the porous layer results in a weakening of the low-pressure zones. In the cylinder with extremely low permeability, the low-pressure zone shifts towards the outer layer of the porous material.
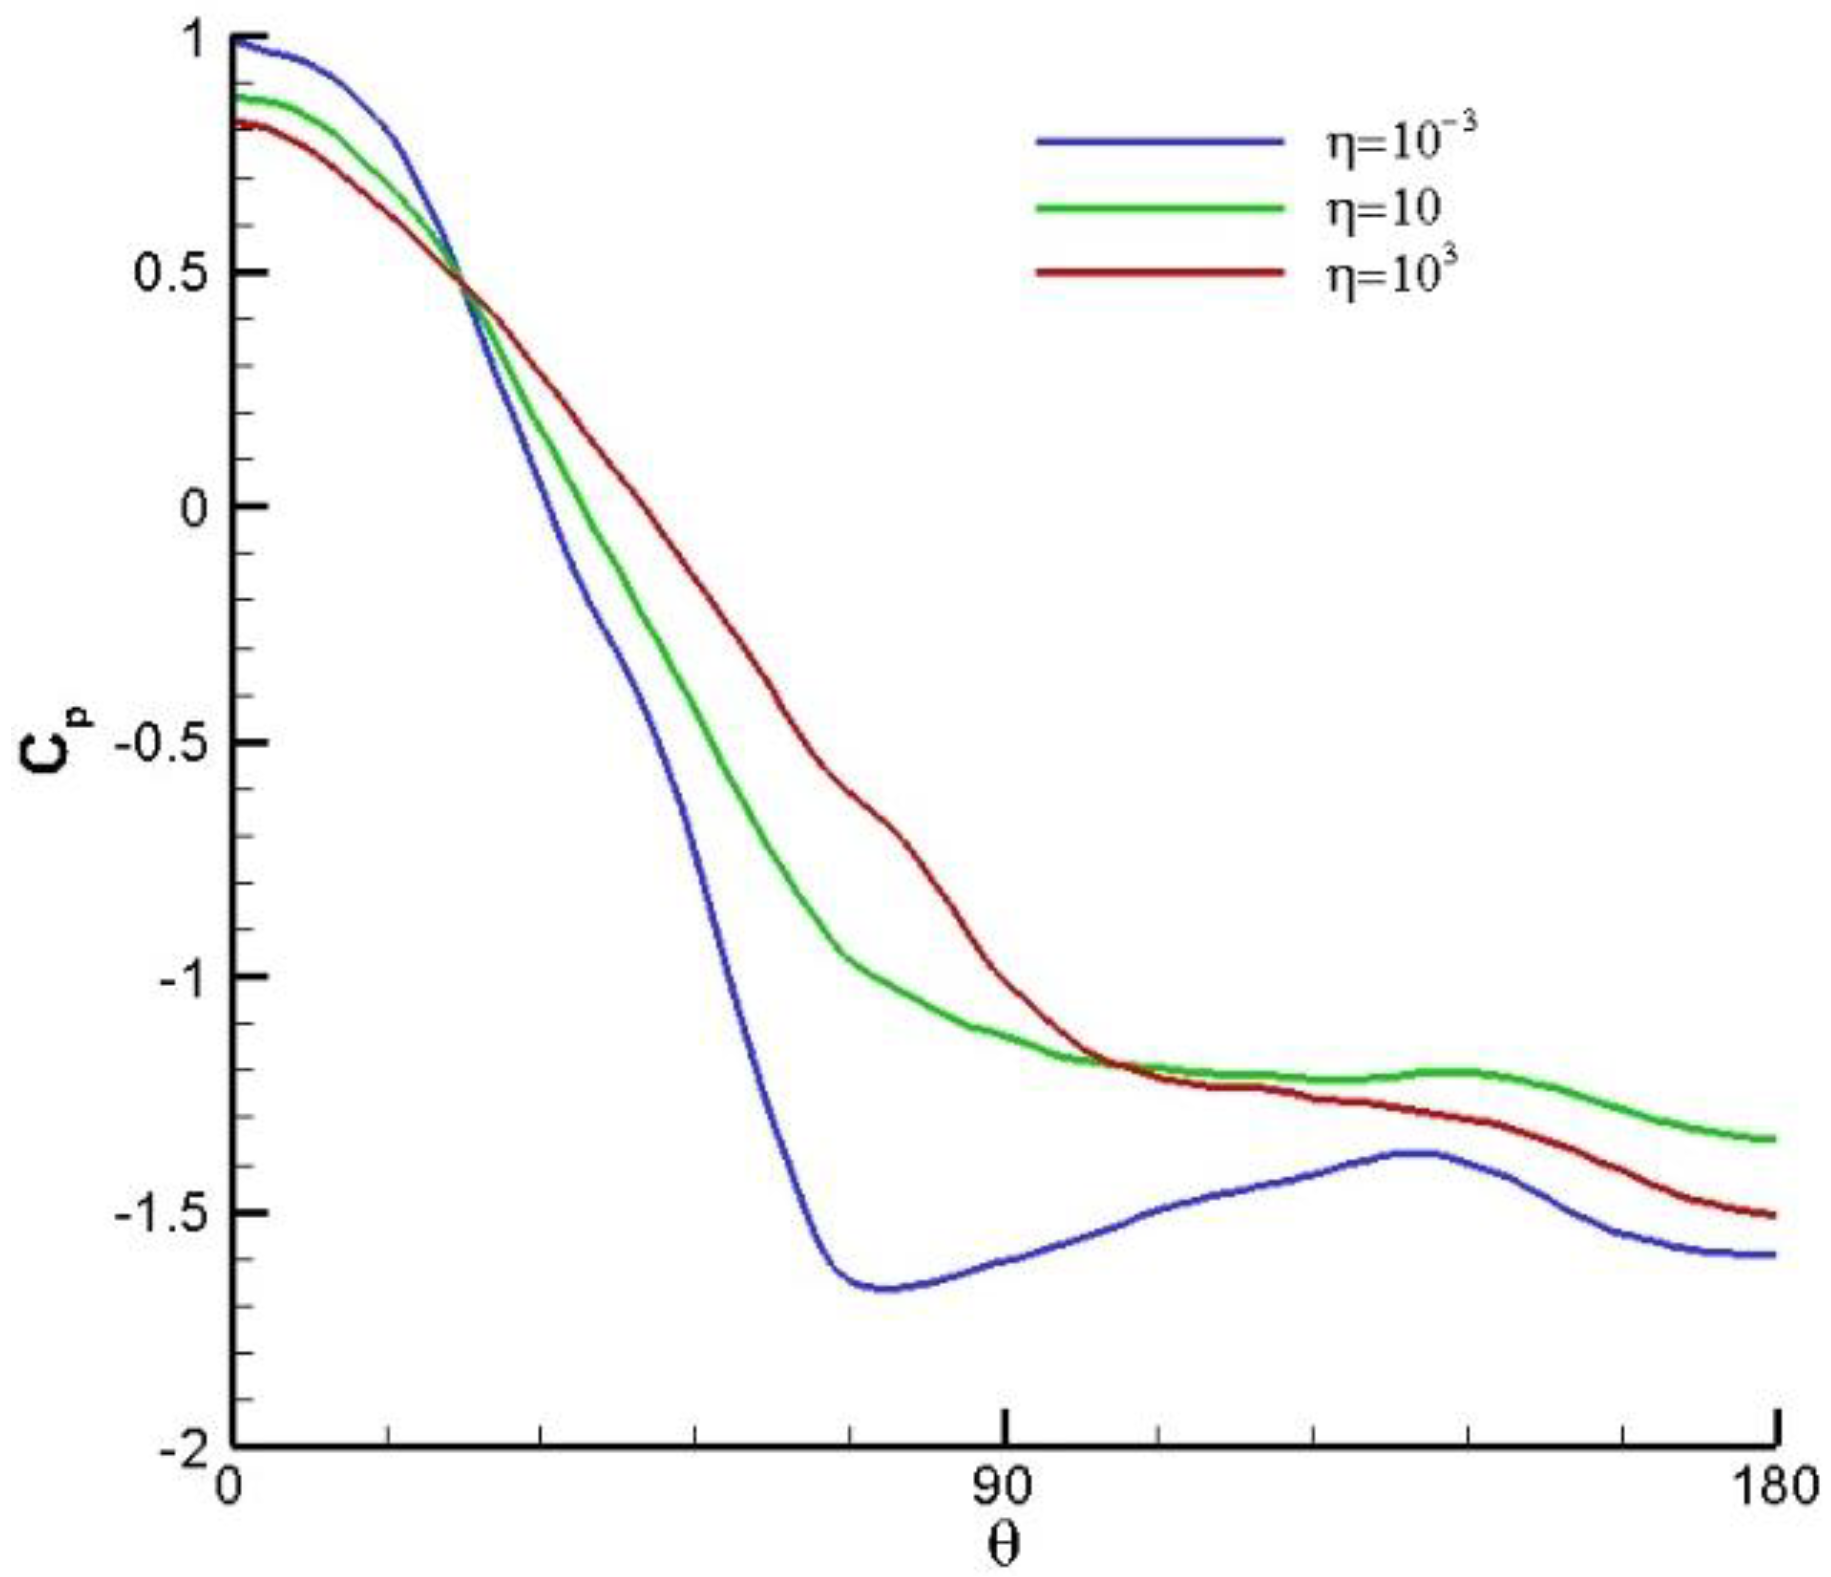
Figure 4 displays the mean pressure coefficient
around the cylinder at the porous layer. Despite the increased windward pressure at
η = 10, when compared to the smooth cylinder, the presence of porosity leads to a recovery in the pressure coefficient on the leeward side of the cylinder.
Table 1 shows the drag coefficient,
, which matches well with the previous works [
37] in the single-phase flow around the circular cylinder.
3.2. Grid-Independence Study
To ensure grid independence, three different mesh types were created, with varying grid resolutions: coarse, medium, and fine meshes. These meshes were designed for comparison purposes. The grid numbers for each mesh type in the context of a smooth cylinder case are outlined in
Table 2. Grid-size dependency is represented by the drag coefficient (
) and the Strouhal number (St), reflecting the sensitivity of the hydrodynamic characteristics to variations of the grid resolution. The comparison between the results obtained from the medium mesh and the fine mesh indicated only a minor discrepancy. Therefore, the medium mesh was selected for subsequent numerical simulations and proved to be adequate. This decision was made to optimize computational resources and reduce costs while still maintaining an acceptable level of accuracy in capturing the essential flow dynamics.
3.3. Results
In this section, the hydrodynamics and the results of the cavitating flow over an isolated circular cylinder are presented. Unlike the previous section,
is not constant here because the viscosity of the mixture varies within the field. Therefore, the permeability changes are considered for values of
.
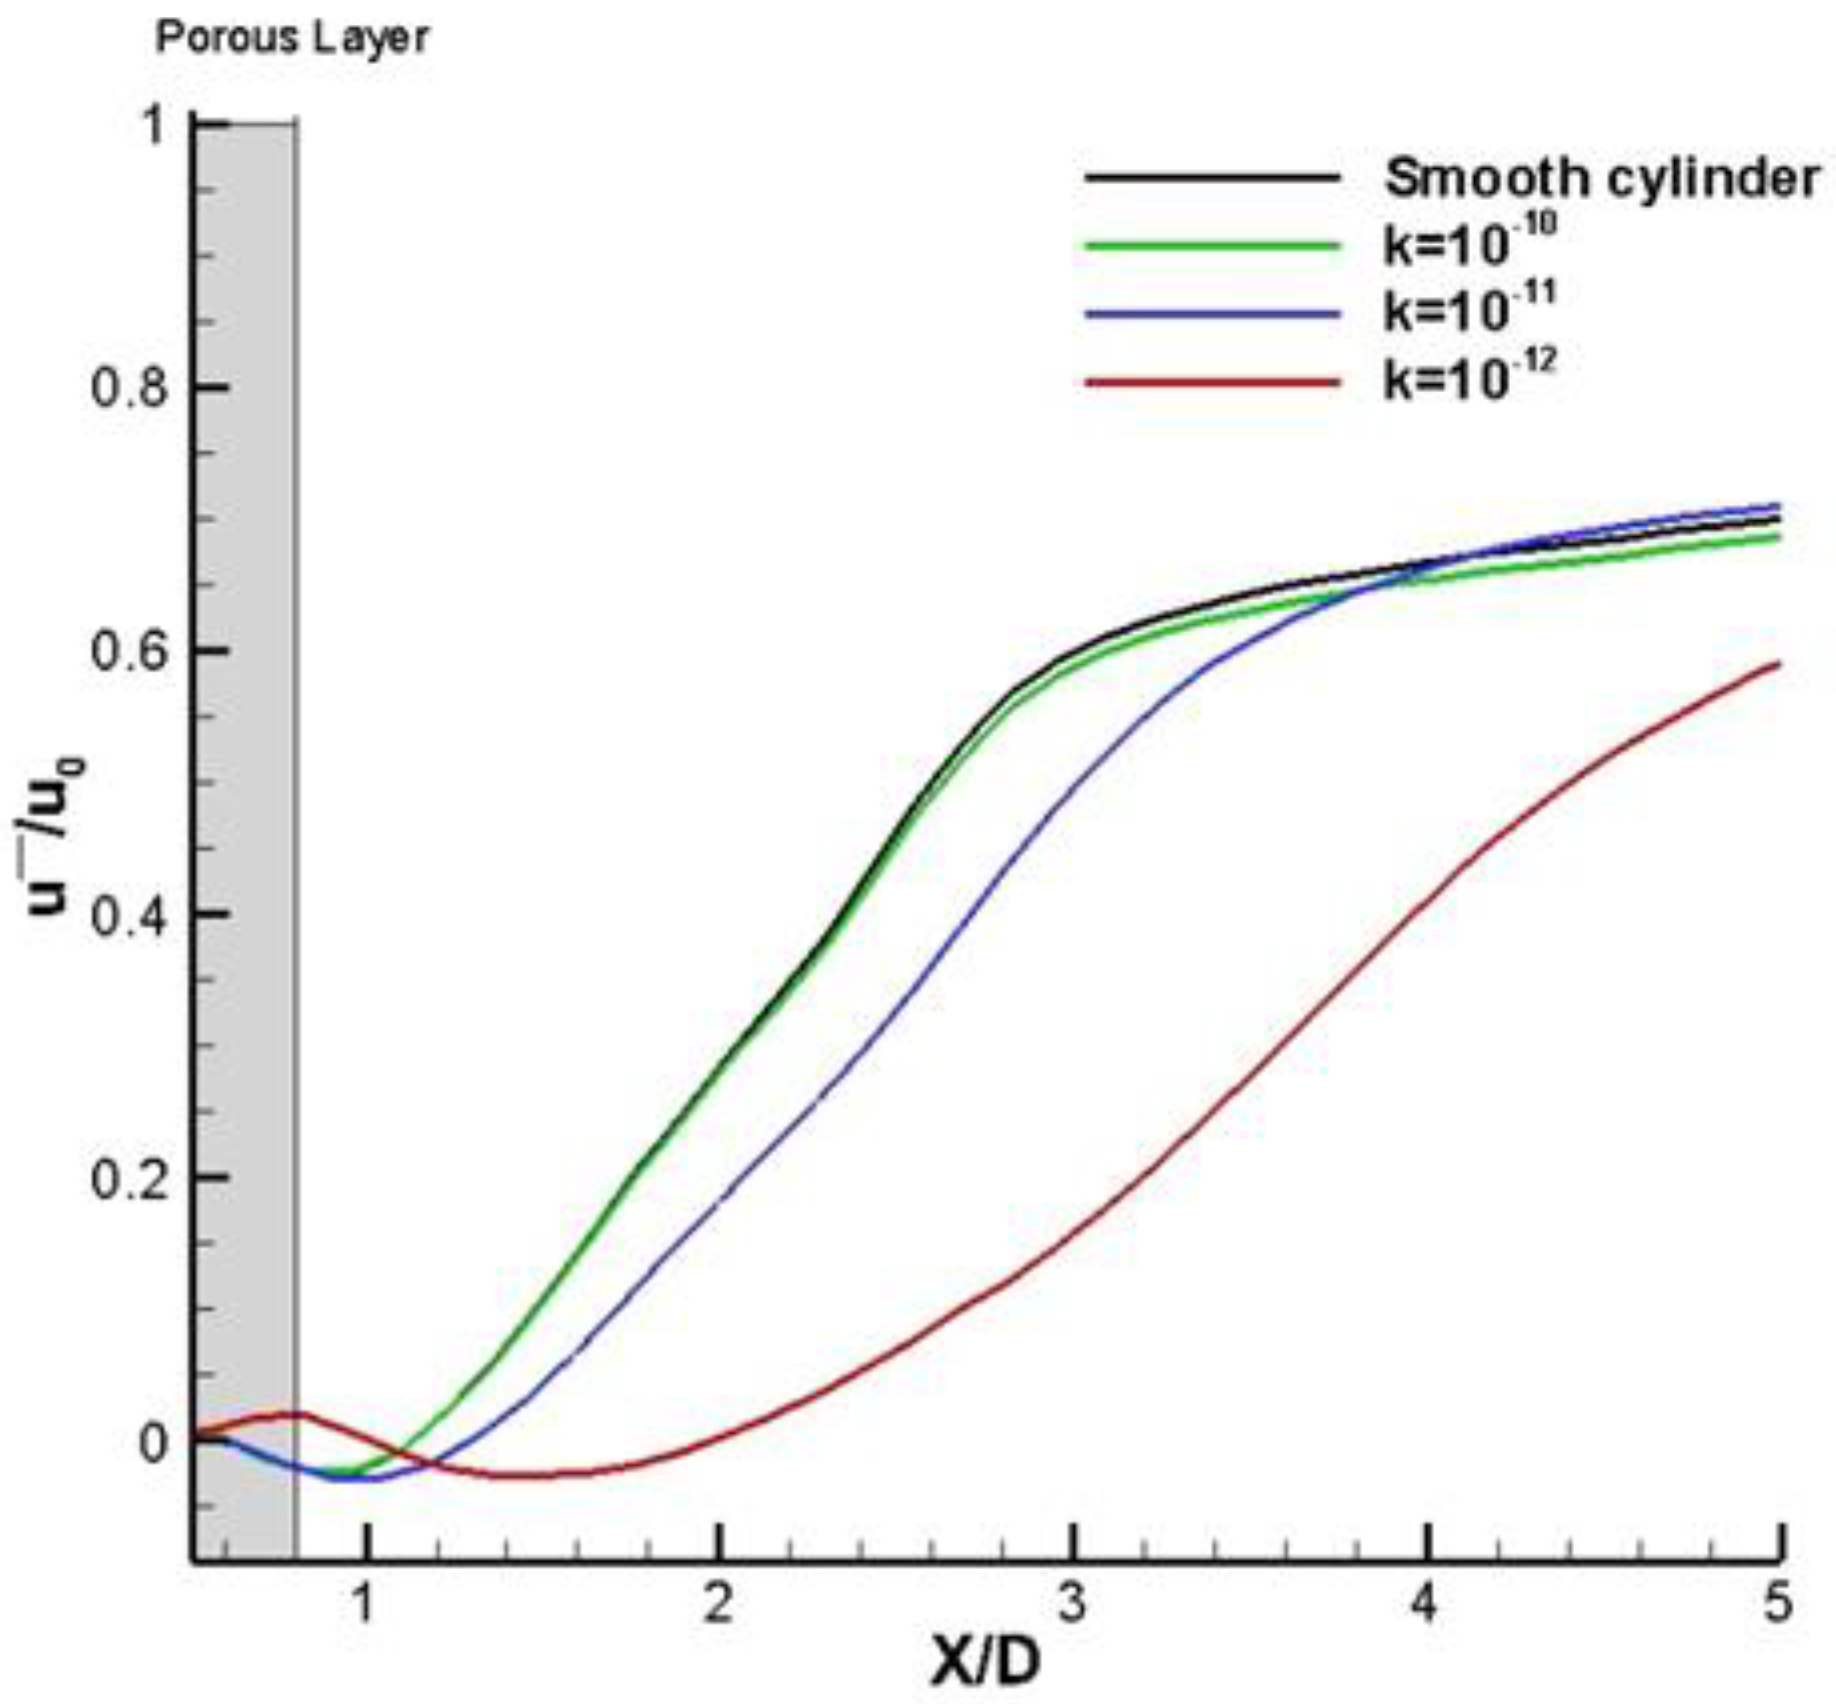
Figure 5 displays the time-averaged streamwise velocity along the centerline. There is a negative velocity region downstream of the cylinder, which is actually a distinct recirculation zone. For the smooth cylinder, the velocity reaches its minimum value around
. Beyond this point, the flow velocity gradually begins to recover and increase along the downstream range at
. As observed in the streamwise velocity profile, the porous covering with low permeability exhibits a shift in the minimum flow velocity from the cylinder surface compared to the smooth cylinder. At
, the minimum velocity shifts to
, while at
, it shifts to
.
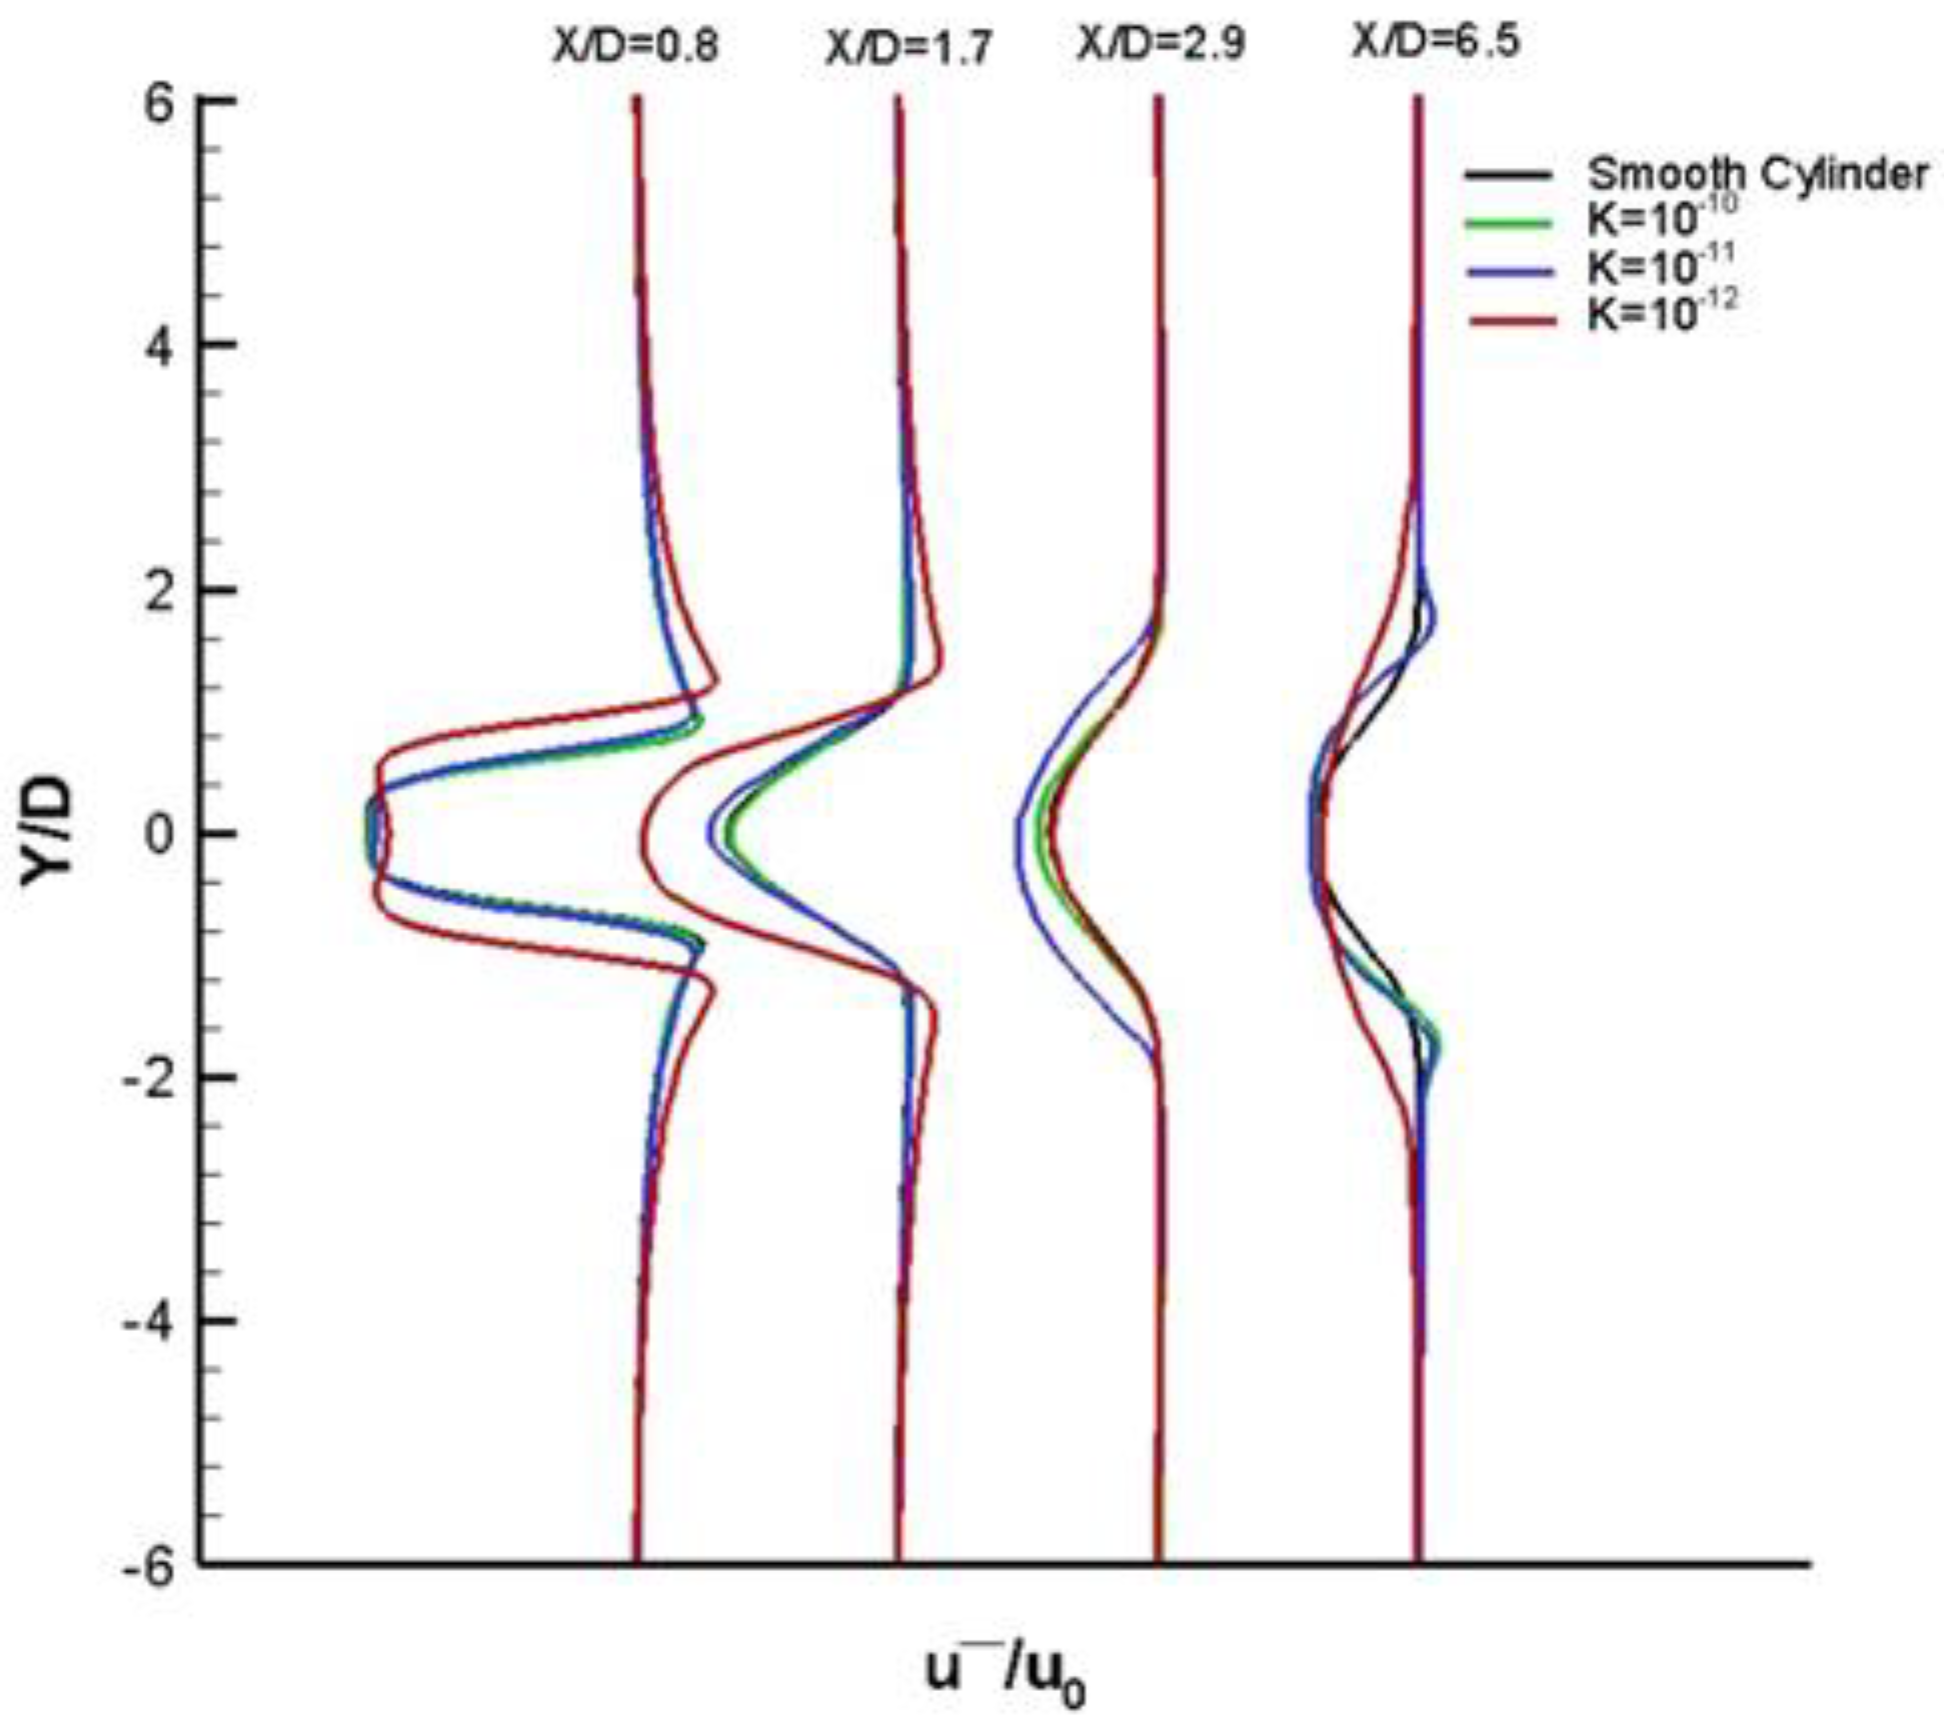
Figure 6 shows the streamwise velocity profiles along the vertical centerline at different
locations. Due to the blockage of the porous matrix, the streamwise velocity decreases. Once the porous media is applied around the cylinder, the wake region surrounding the cylinder widens. Specifically, the velocity within the wake, particularly near the central area (at
), initially experiences a reduction, followed by an enhancement, compared to the velocity observed around a smooth cylinder. Based on the results presented in
Figure 5 and
Figure 6, the porous layer with a permeability of
does not significantly affect the mean velocity profiles. Therefore, two other cases are further investigated below.
The time histories of the lift and drag coefficients are shown in
Figure 7 for the cylinder coated with porous layers of different permeability,
and thickness. Here, a reduction around 15% for
and 39% for
in the amplitudes of the lift fluctuation are evident across the cylinder coated with porous materials compared to the uncoated smooth cylinder. The drag coefficient is also depicted in
Figure 7. In the figure, it can be deduced that the drag coefficient decreased to around 2% with the application of the porous layer at
. However, as permeability diminishes further, the drag coefficient begins to increase more than 13%. The reason for this behavior is the formation of a blockage against the flow due to the reduction in permeability. As the permeability of the porous layer decreases excessively, it behaves like a solid body, resulting in a significantly less flow passing through the porous layer. In addition,
Table 3 shows the comparison of the lift coefficient and Strouhal number with various permeability values. The results reveal that the porous layer leads to a reduction in the frequency of the dominant vortex behind the cylinders. Specifically, it is observed that the vortex shedding frequency diminishes by 9.65% when the permeability is set to
and by a notable 31% when the permeability is reduced further to
.
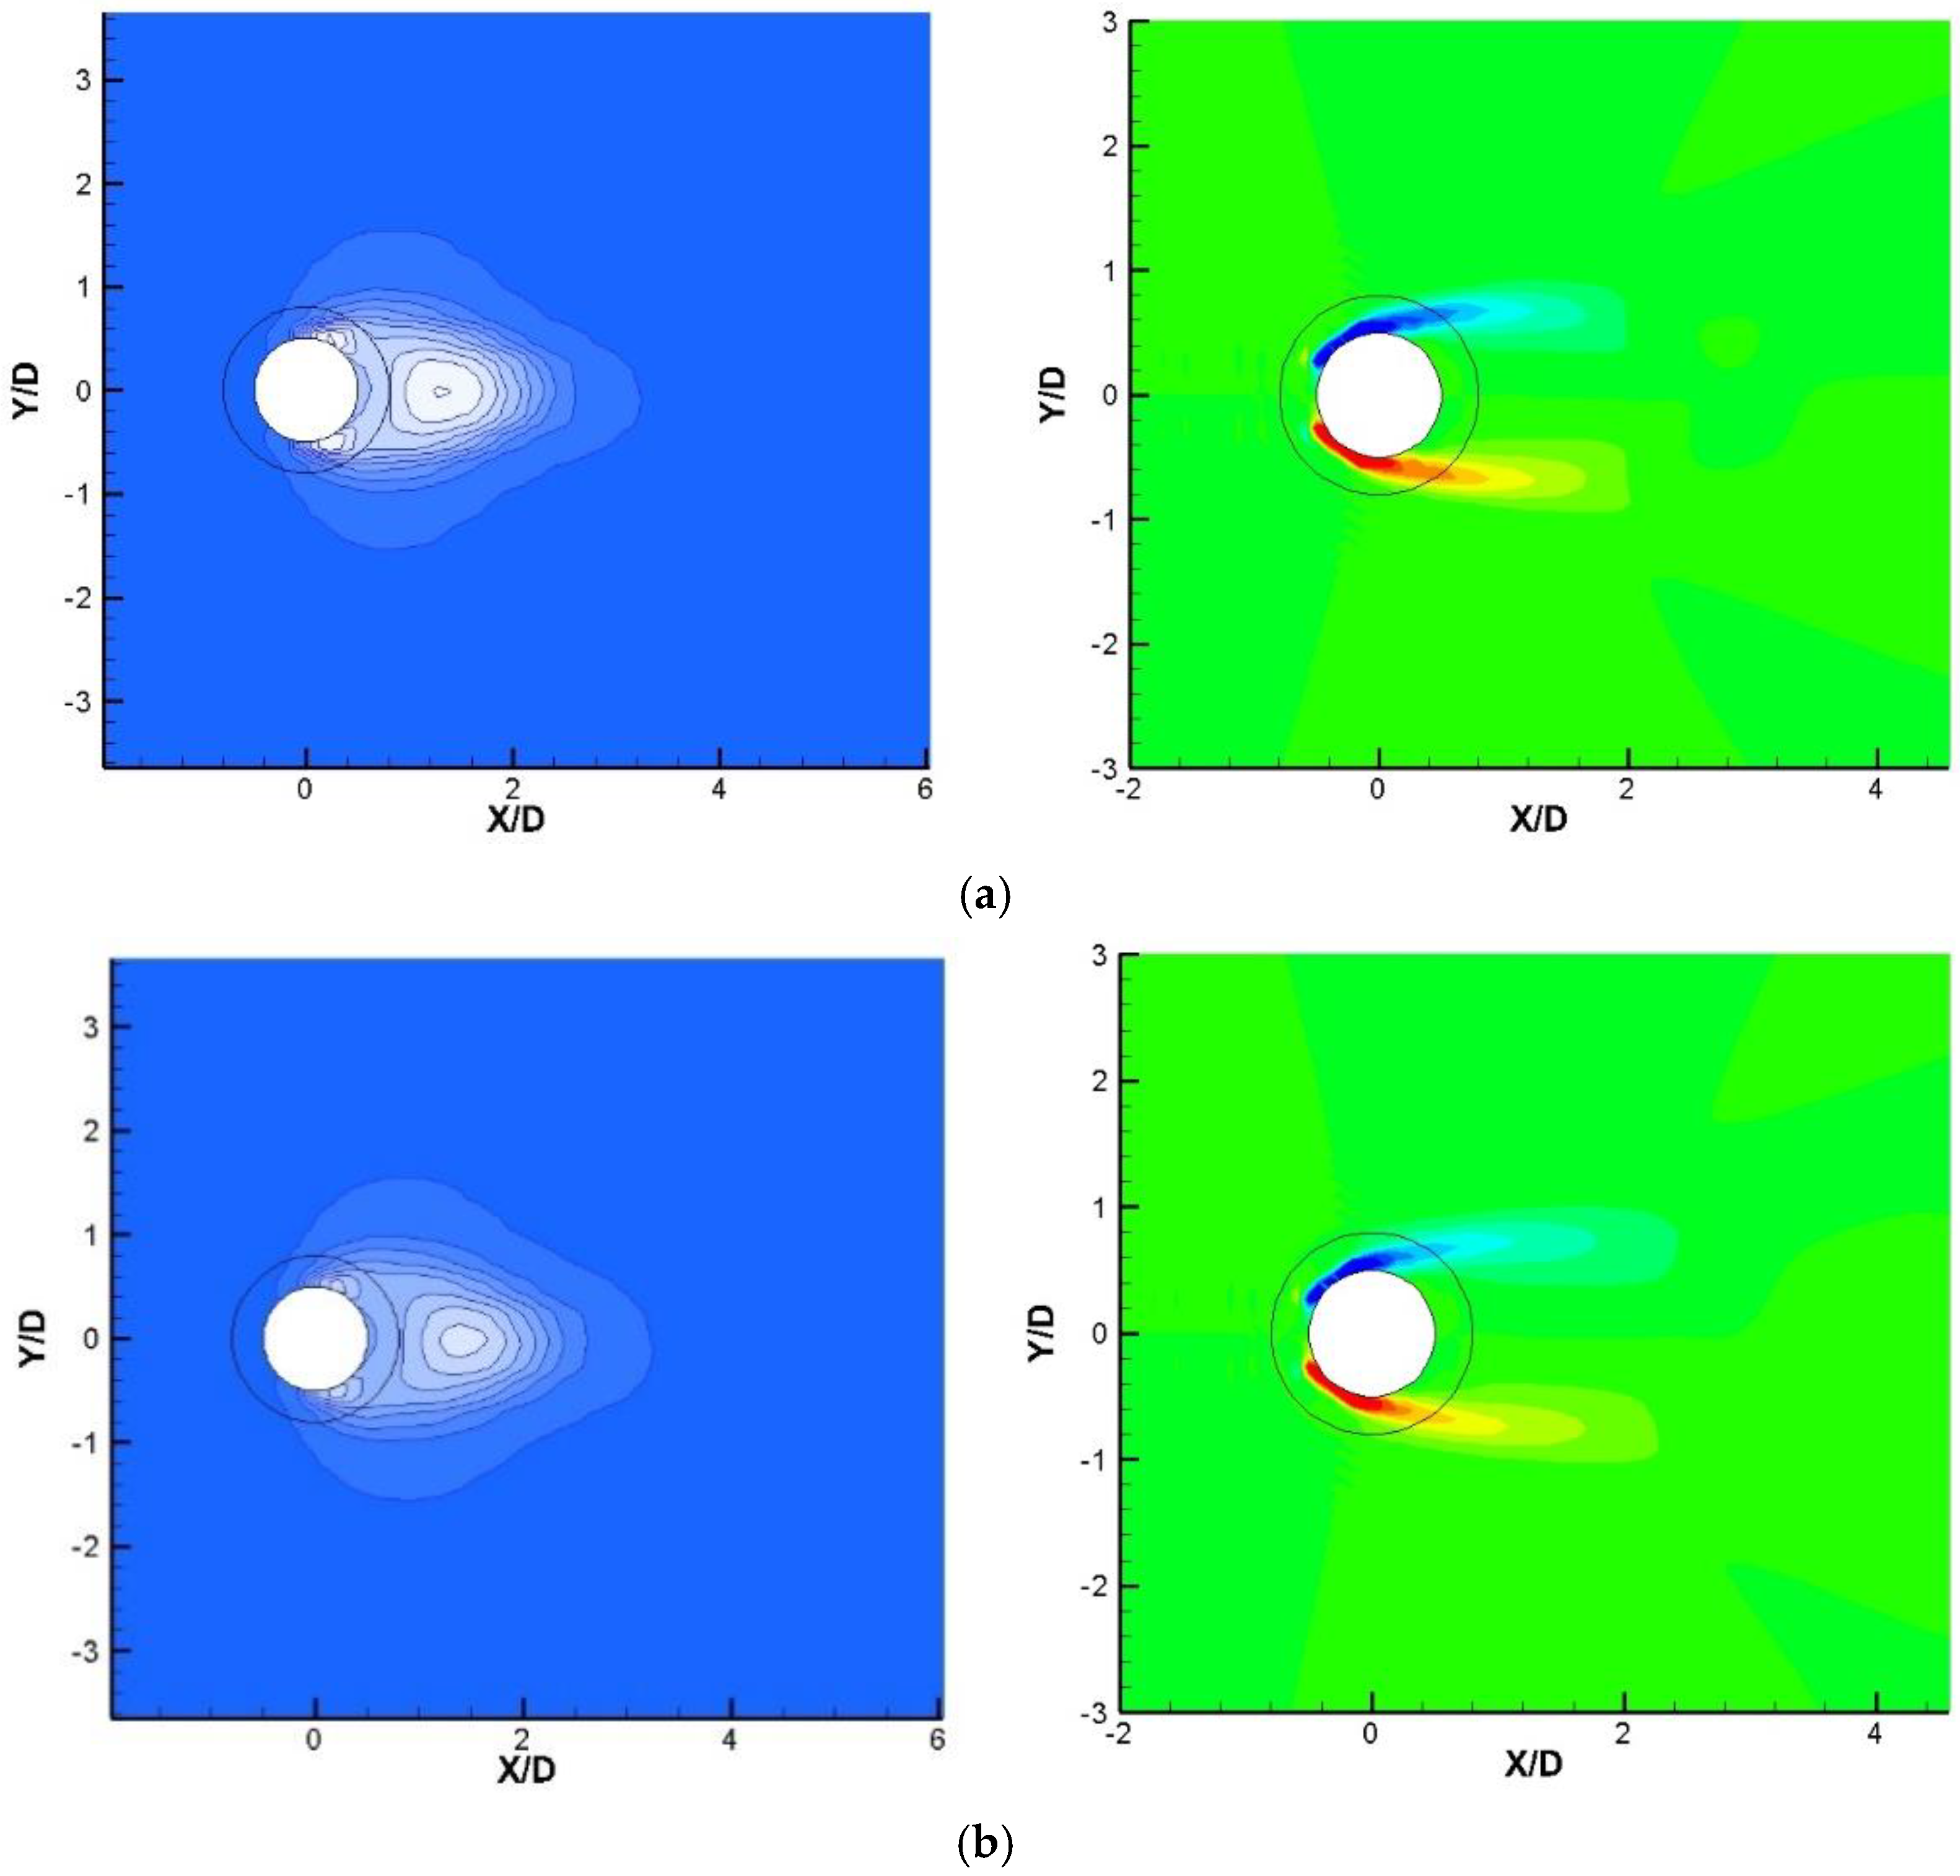
With the addition of a porous layer on the cylinder surface, the strength of the separated shear layers tends to decrease. In the smooth cylinder, vorticity primarily spreads from the surface into the surrounding external flow.
However, with the porous layer, vorticity diffusion not only occurs in the external flow field but also penetrates into the internal flow field within the porous layer itself. The right column of
Figure 8 shows the mean vorticity contours around the smooth cylinder and porous-coated cylinders. The solid line encircling the cylinder represents the boundary between the porous material and the fluid. By applying the porous layer, the results reveal that the vortex range within the wake region of the cylinder becomes weaker and more elongated. A secondary shedding vortex developed along the solid wall of the cylinder at
, but it was swiftly dissipated by the effects of the porous layer on the leeward side.
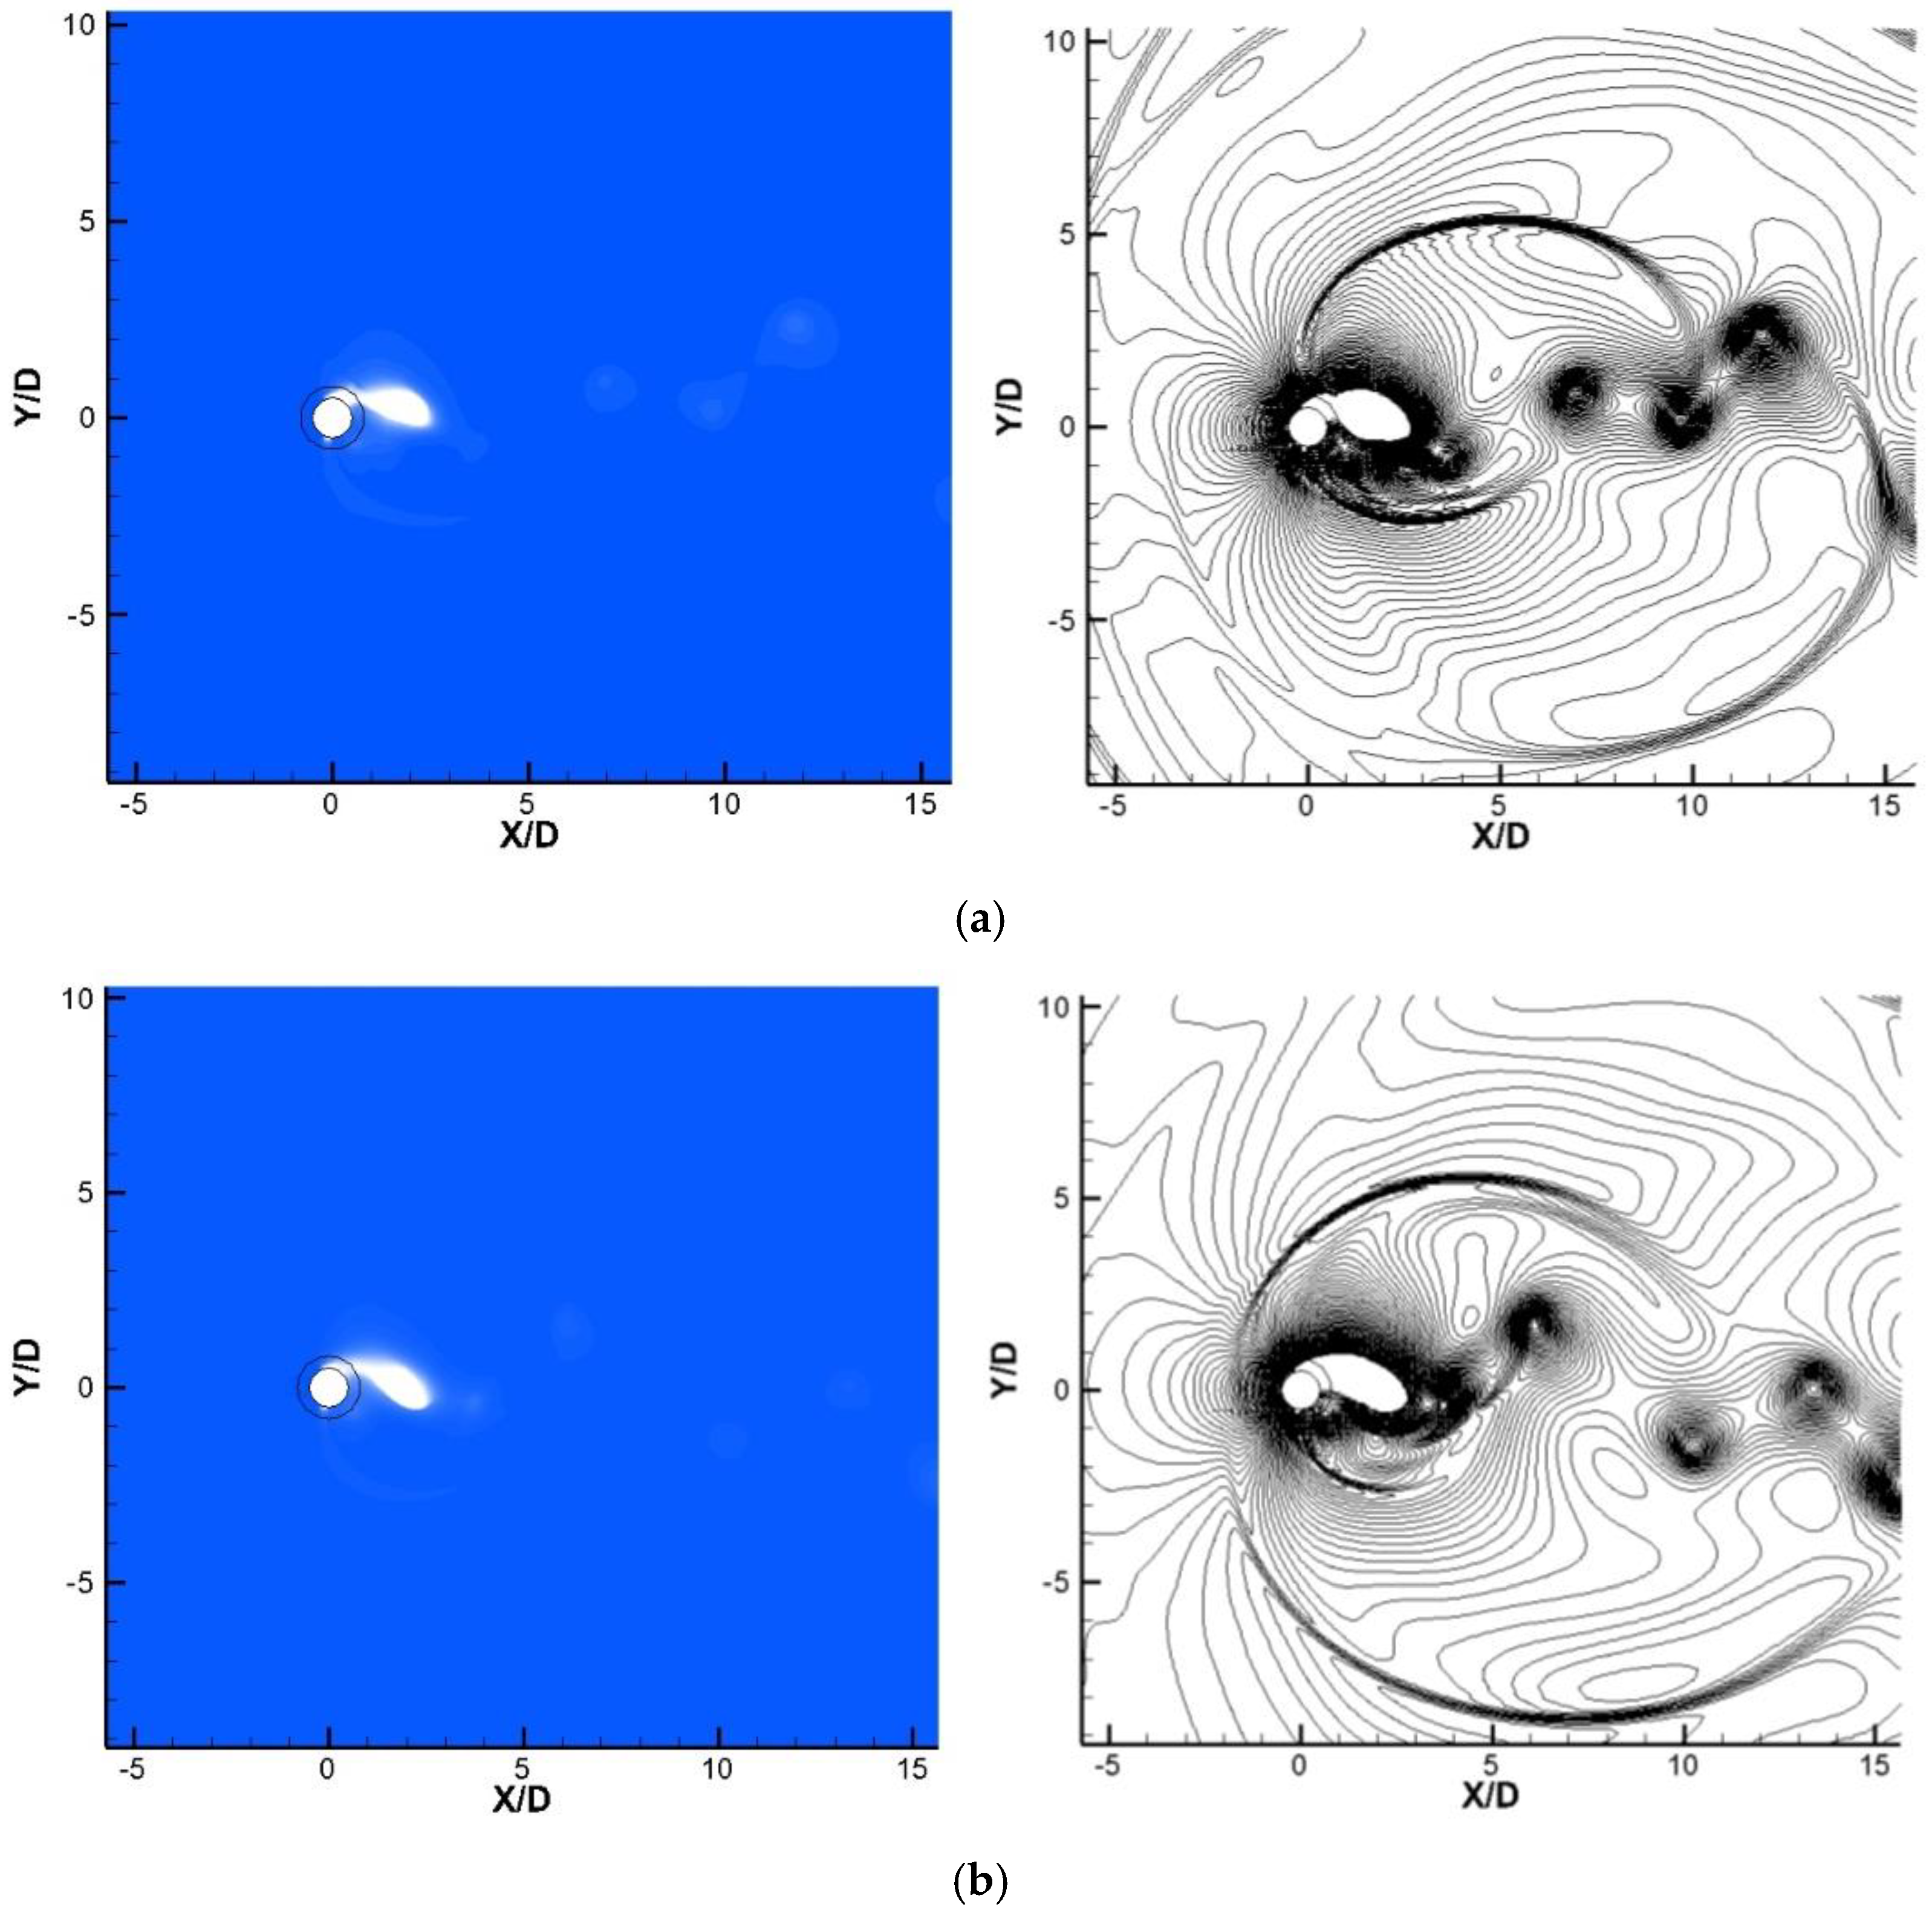
Figure 9 provides evidence that the existence of the porous layer leads to a noticeable reduction in the strength of cavitation regions. The presence of the porous layer weakens, particularly with the low permeability
the attached cavitation zones on the cylinder’s wall. The porous materials altered the local pressure distribution around the surface of the cylinder. They act as pressure manipulators, smoothing out the pressure gradients that might otherwise lead to cavitation inception. This pressure redistribution is often linked to the ability of porous media to diffuse and absorb gas or vapor, reducing the low-pressure zones. Particularly for the case
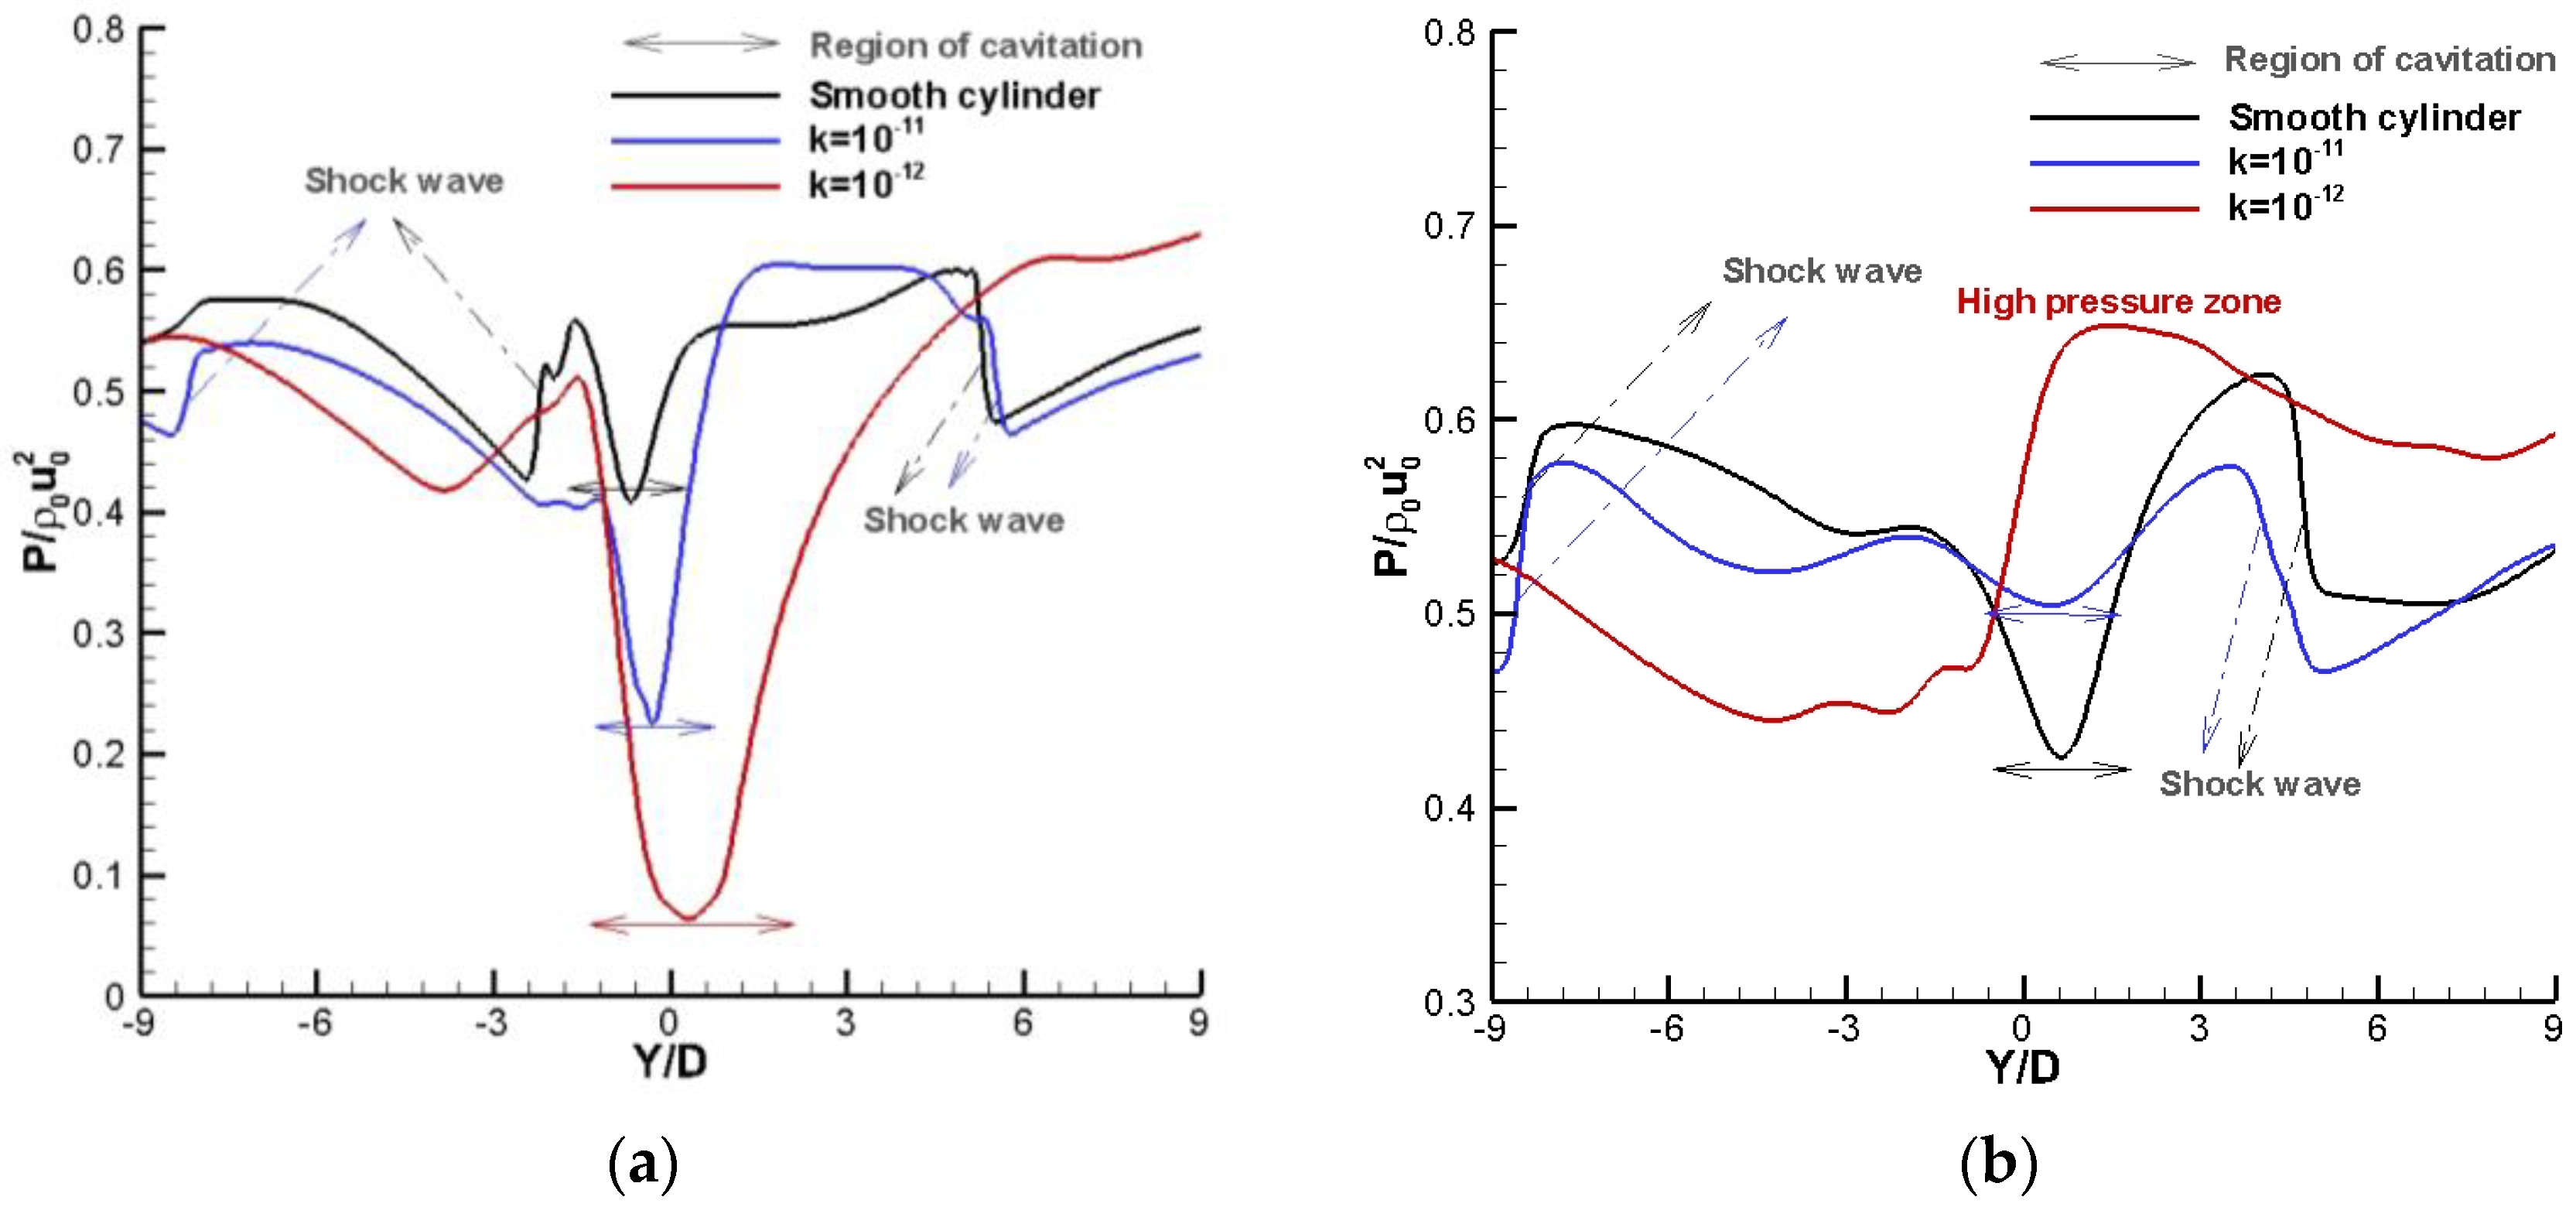
, no strong shock waves due to the collapse of cavitation structures behind the cylinder were observed. For the quantitative comparison, the pressure profiles of
Figure 9 are extracted along
and
to show the pressure discontinuities, and the results are presented in
Figure 10 for various permeability levels. In both figures, shock waves have been well identified based on the pressure jumps. At
there is no discontinuity caused by the presence of shock; rather, there are only pressure waves that generate high-pressure regions. Cavitation regions, which are low-pressure areas, are also identified in the pressure profile. However, it should be noted that due to the presence of a porous layer, the location of these regions varies from each other.
It can be deduced that the application of the porous layer plays an important role in weakening or mitigating the destructive effects of unsteady cavitation, such as strong pressure waves behind the circular cylinder. Therefore, the porous layer can be suggested as a passive control method to control unsteady cavitation in different applications.
4. Conclusions
This study presents a passive approach to control cavitation around a circular cylinder by employing a porous layer. The investigation focused on the study of different permeabilities of this porous layer to understand their effects on controlling cavitation. Initially, we validated our numerical approach by simulating a single-phase flow around the cylinder with and without the porous layers, utilizing the Navier–Stokes equation, through the volume penalized method. Our findings showed that the appropriate thickness and permeability for the porous layer can have a notable reduction in the high-pressure amplitudes on the cylinder’s wall surface and in the associated vortex structures.
The results revealed that the appropriate porous coating on the cylinder can elongate the wake region, suppress vortex shedding, and stabilize the flow behind the cylinder. Furthermore, our results demonstrated the potential disappearance of the attached cavities on the cylinder and the weakening of the cavitation zone in the wake region of the cylinder as a result of using a porous layer. In addition, the shedding frequency was observed to be lower in the presence of the porous layer compared to the smooth cylinder. The mean value of the lift and drag fluctuations was decreased for the cylinder with the optimal porous layer. In general, the use of a porous layer is effective in stabilizing the flow and controlling the cavitation behind the cylinders. However, the key lies in selecting the optimal permeability parameter. Selecting a material with a high permeability may diminish its effectiveness, as evident at . Conversely, a very low permeability, as seen at , can lead to an undesirable increase in drag. In our study, focusing on the permeability of the porous layer, we investigated three different values of permeability at specific thicknesses and Reynolds numbers. However, it is important to note that this limited investigation may not fully capture the broader range of potential variations in porous layer performance. Moreover, the exploration of Reynolds number and porous layer thickness effects indicates that our comprehension of the porous layer’s behavior is still partial, underscoring the need for further investigation into these factors and their interdependencies.


