


Influence of Penetration Rate on Full-Flow Penetrometer Resistance in Underconsolidated Clay


Abstract
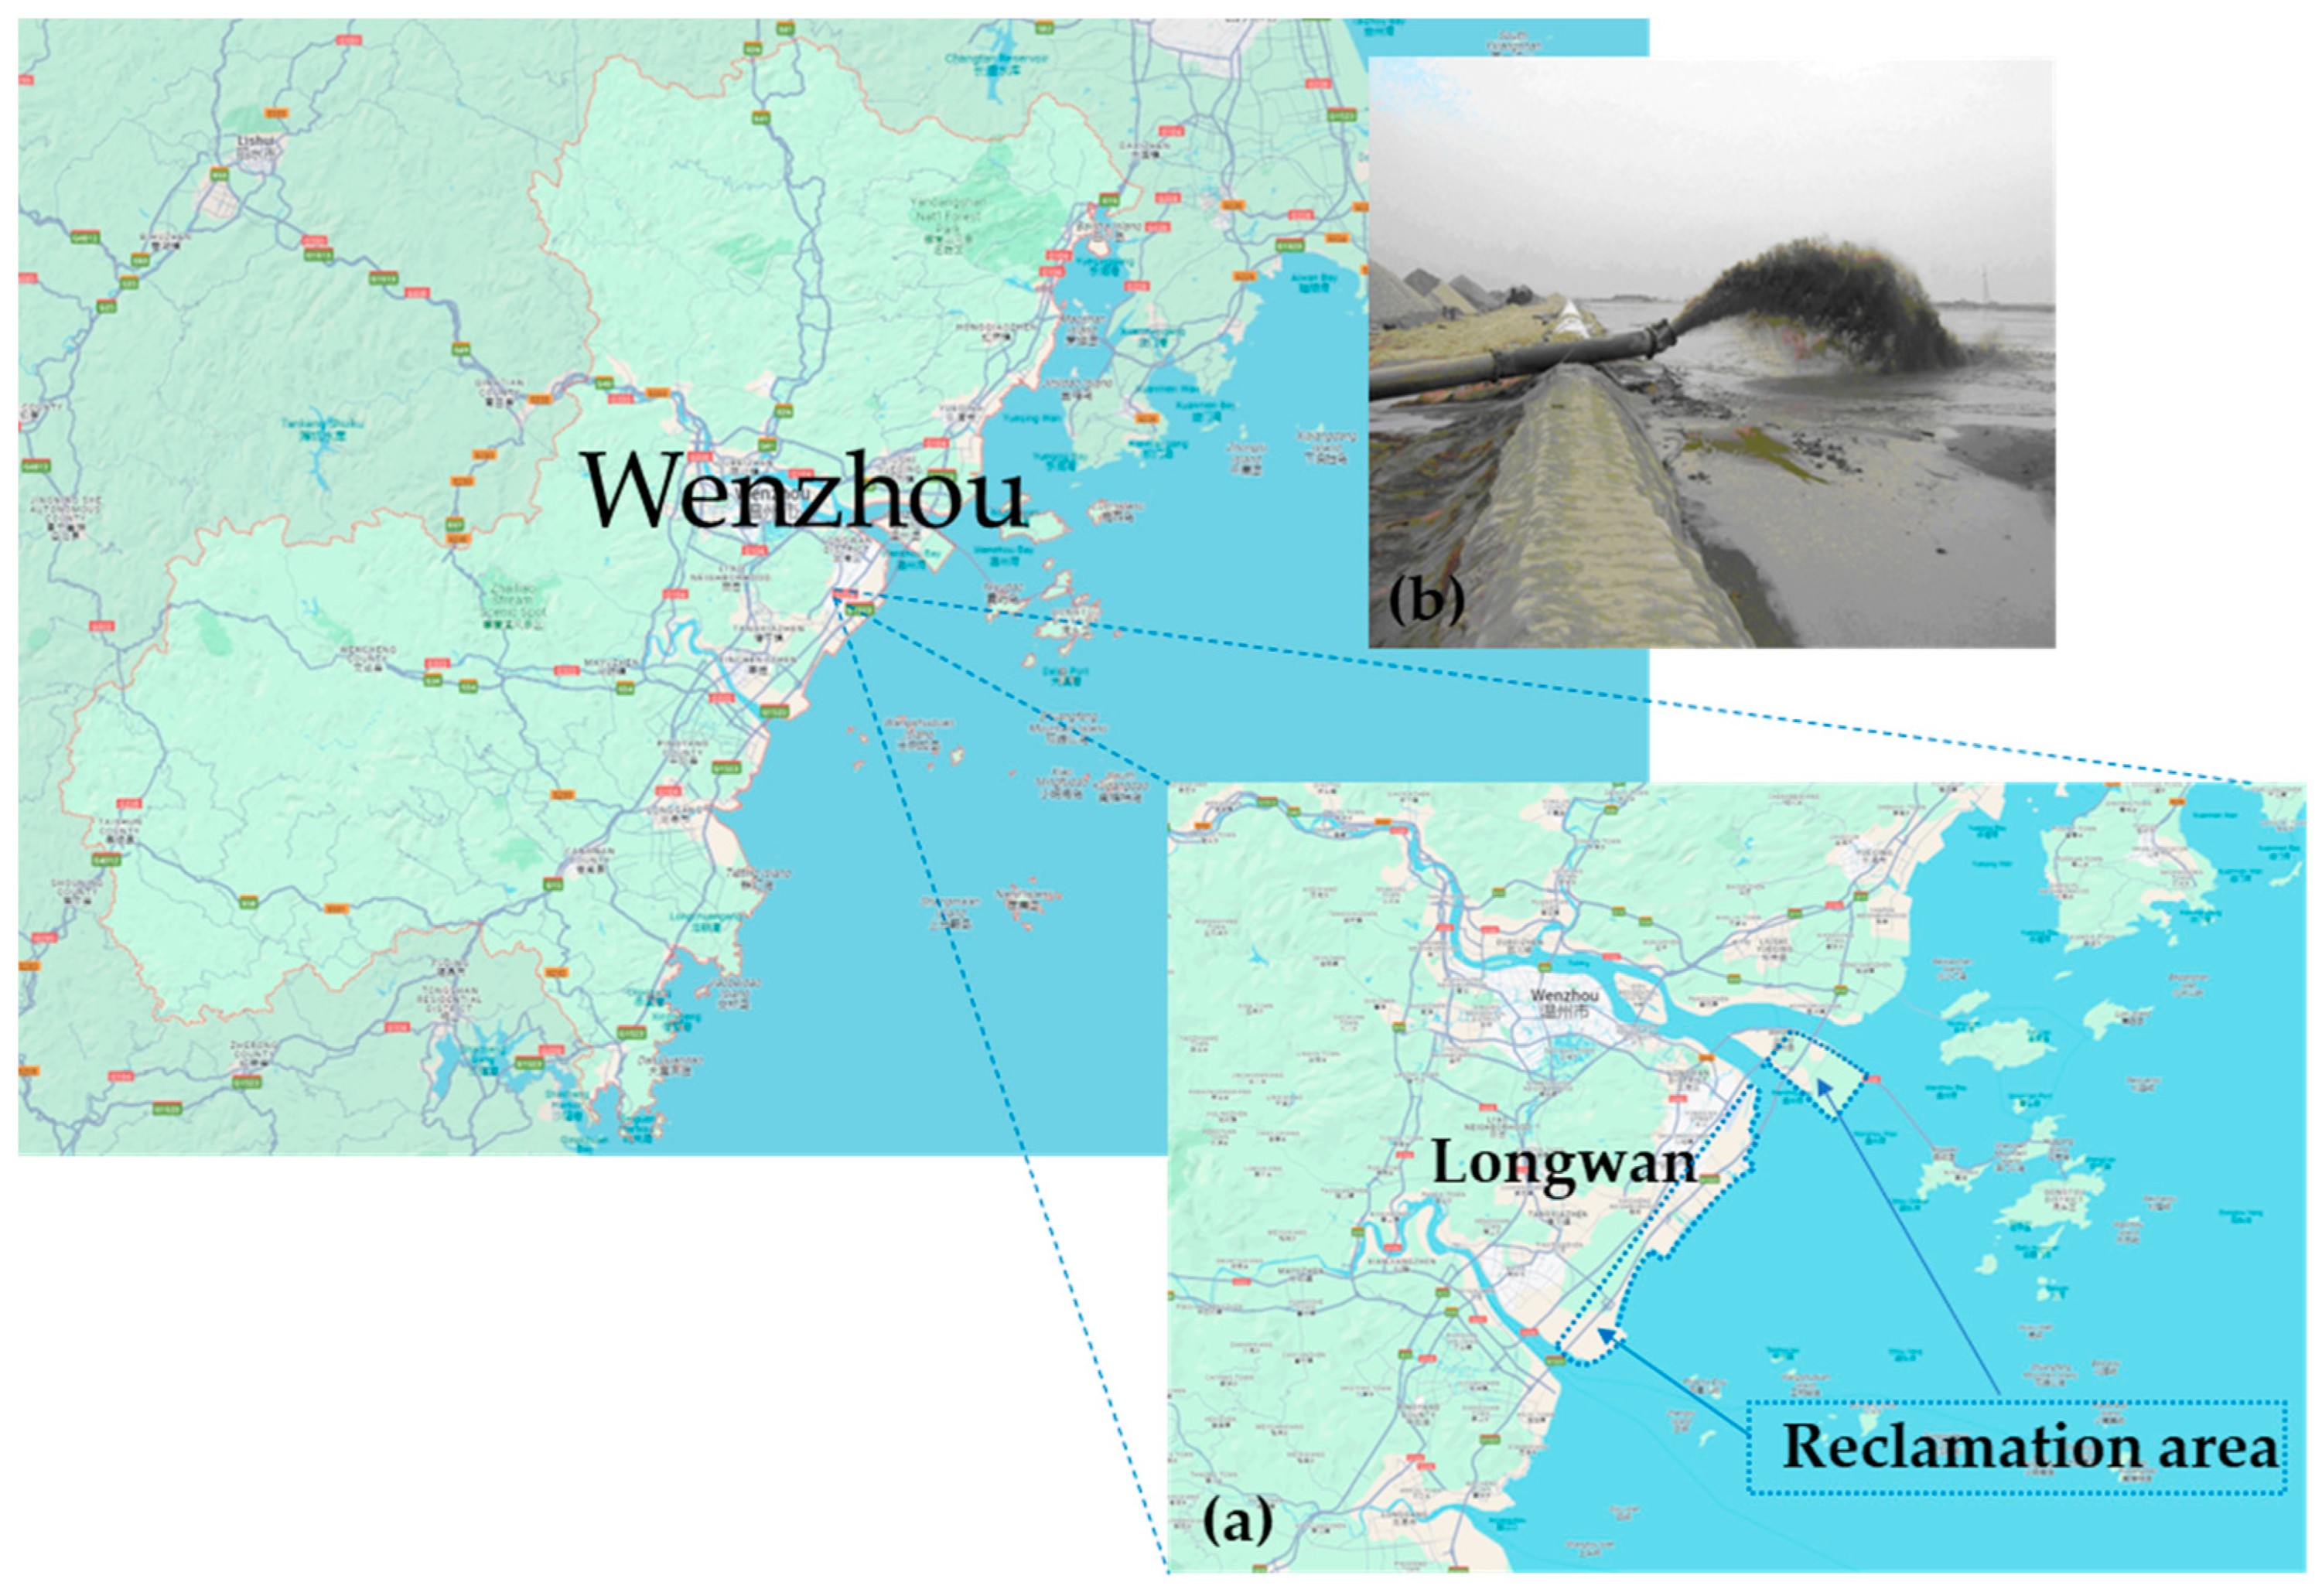
1. Introduction
2. Model Box Testing System
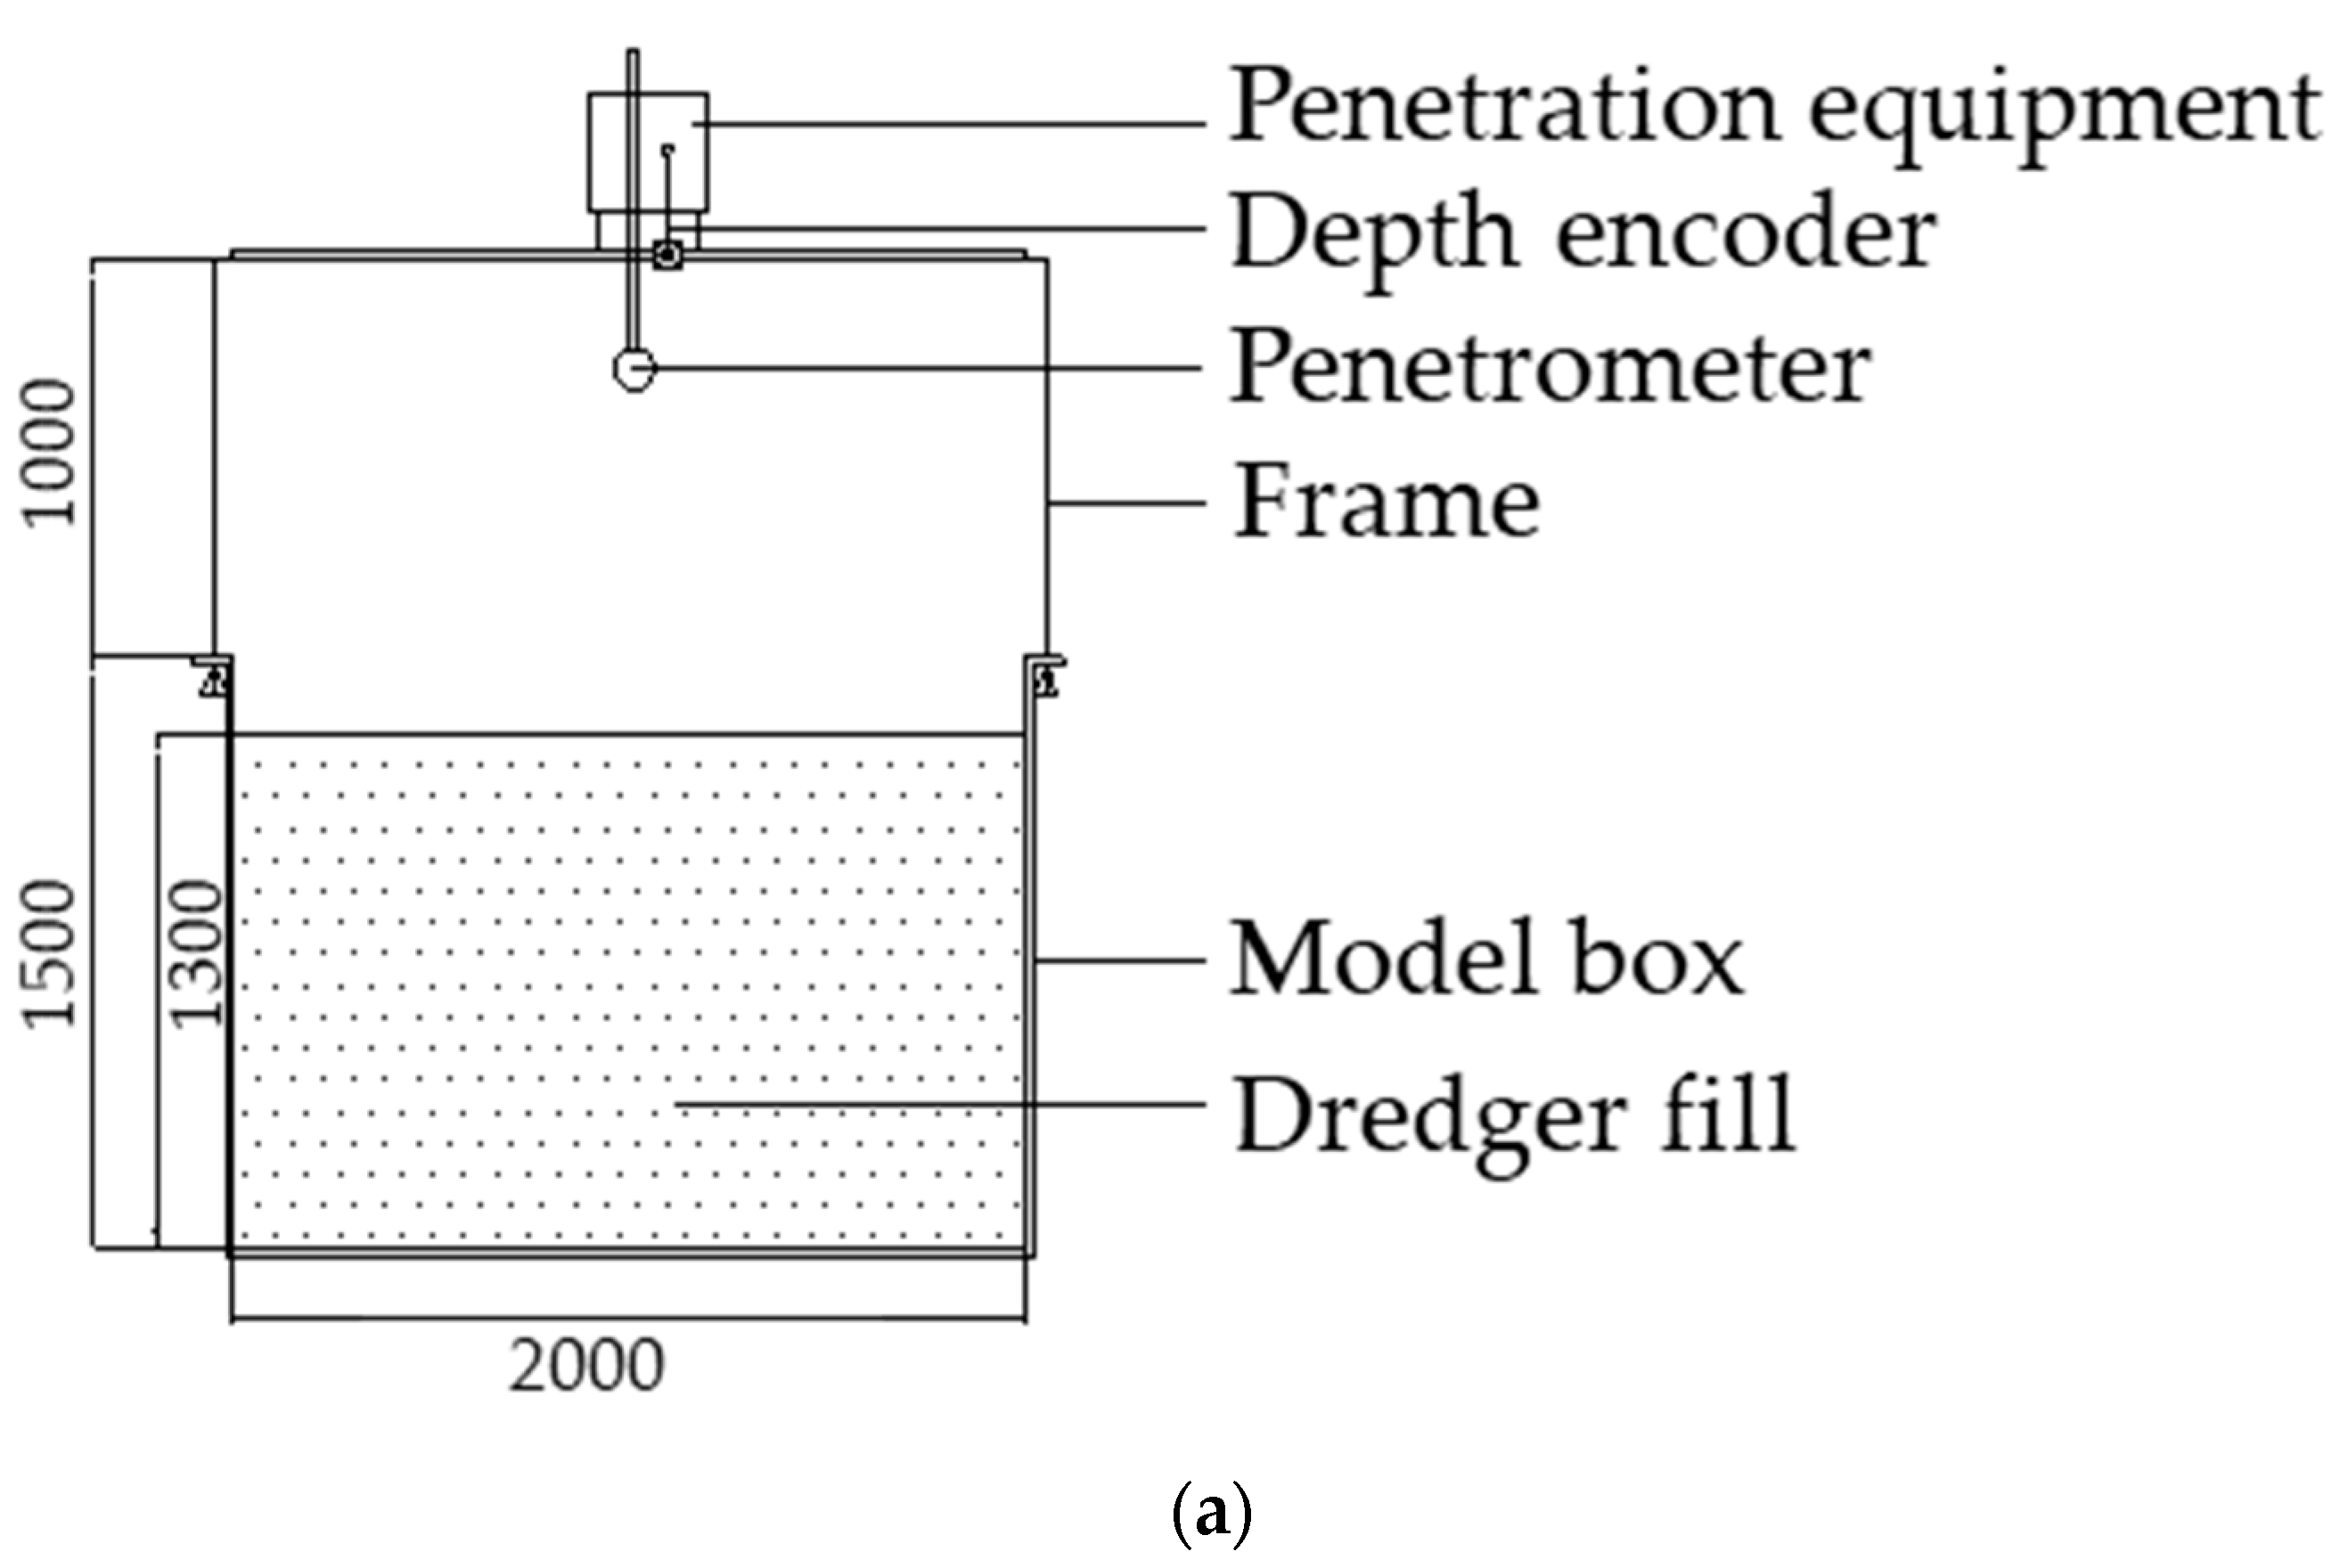
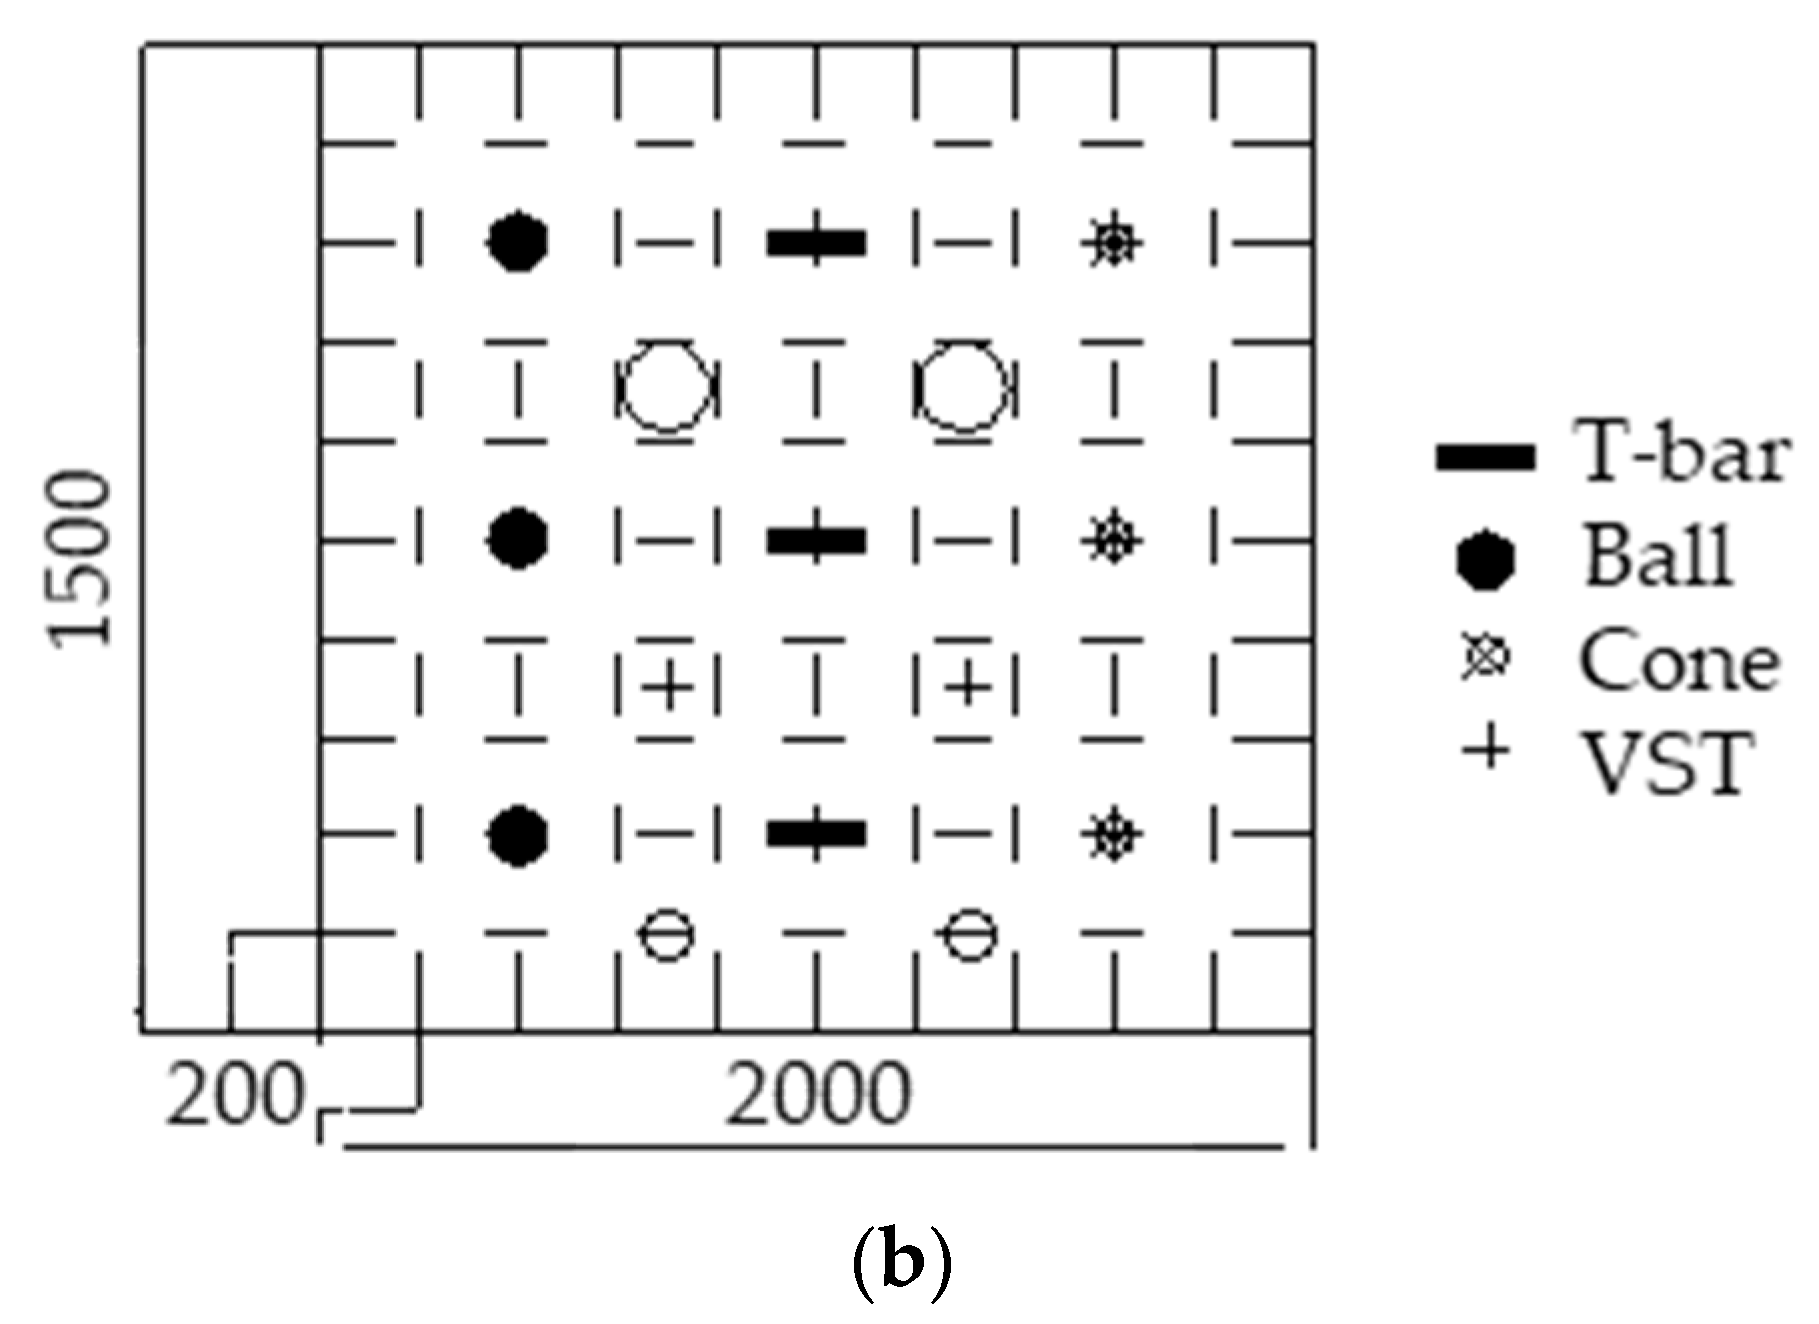
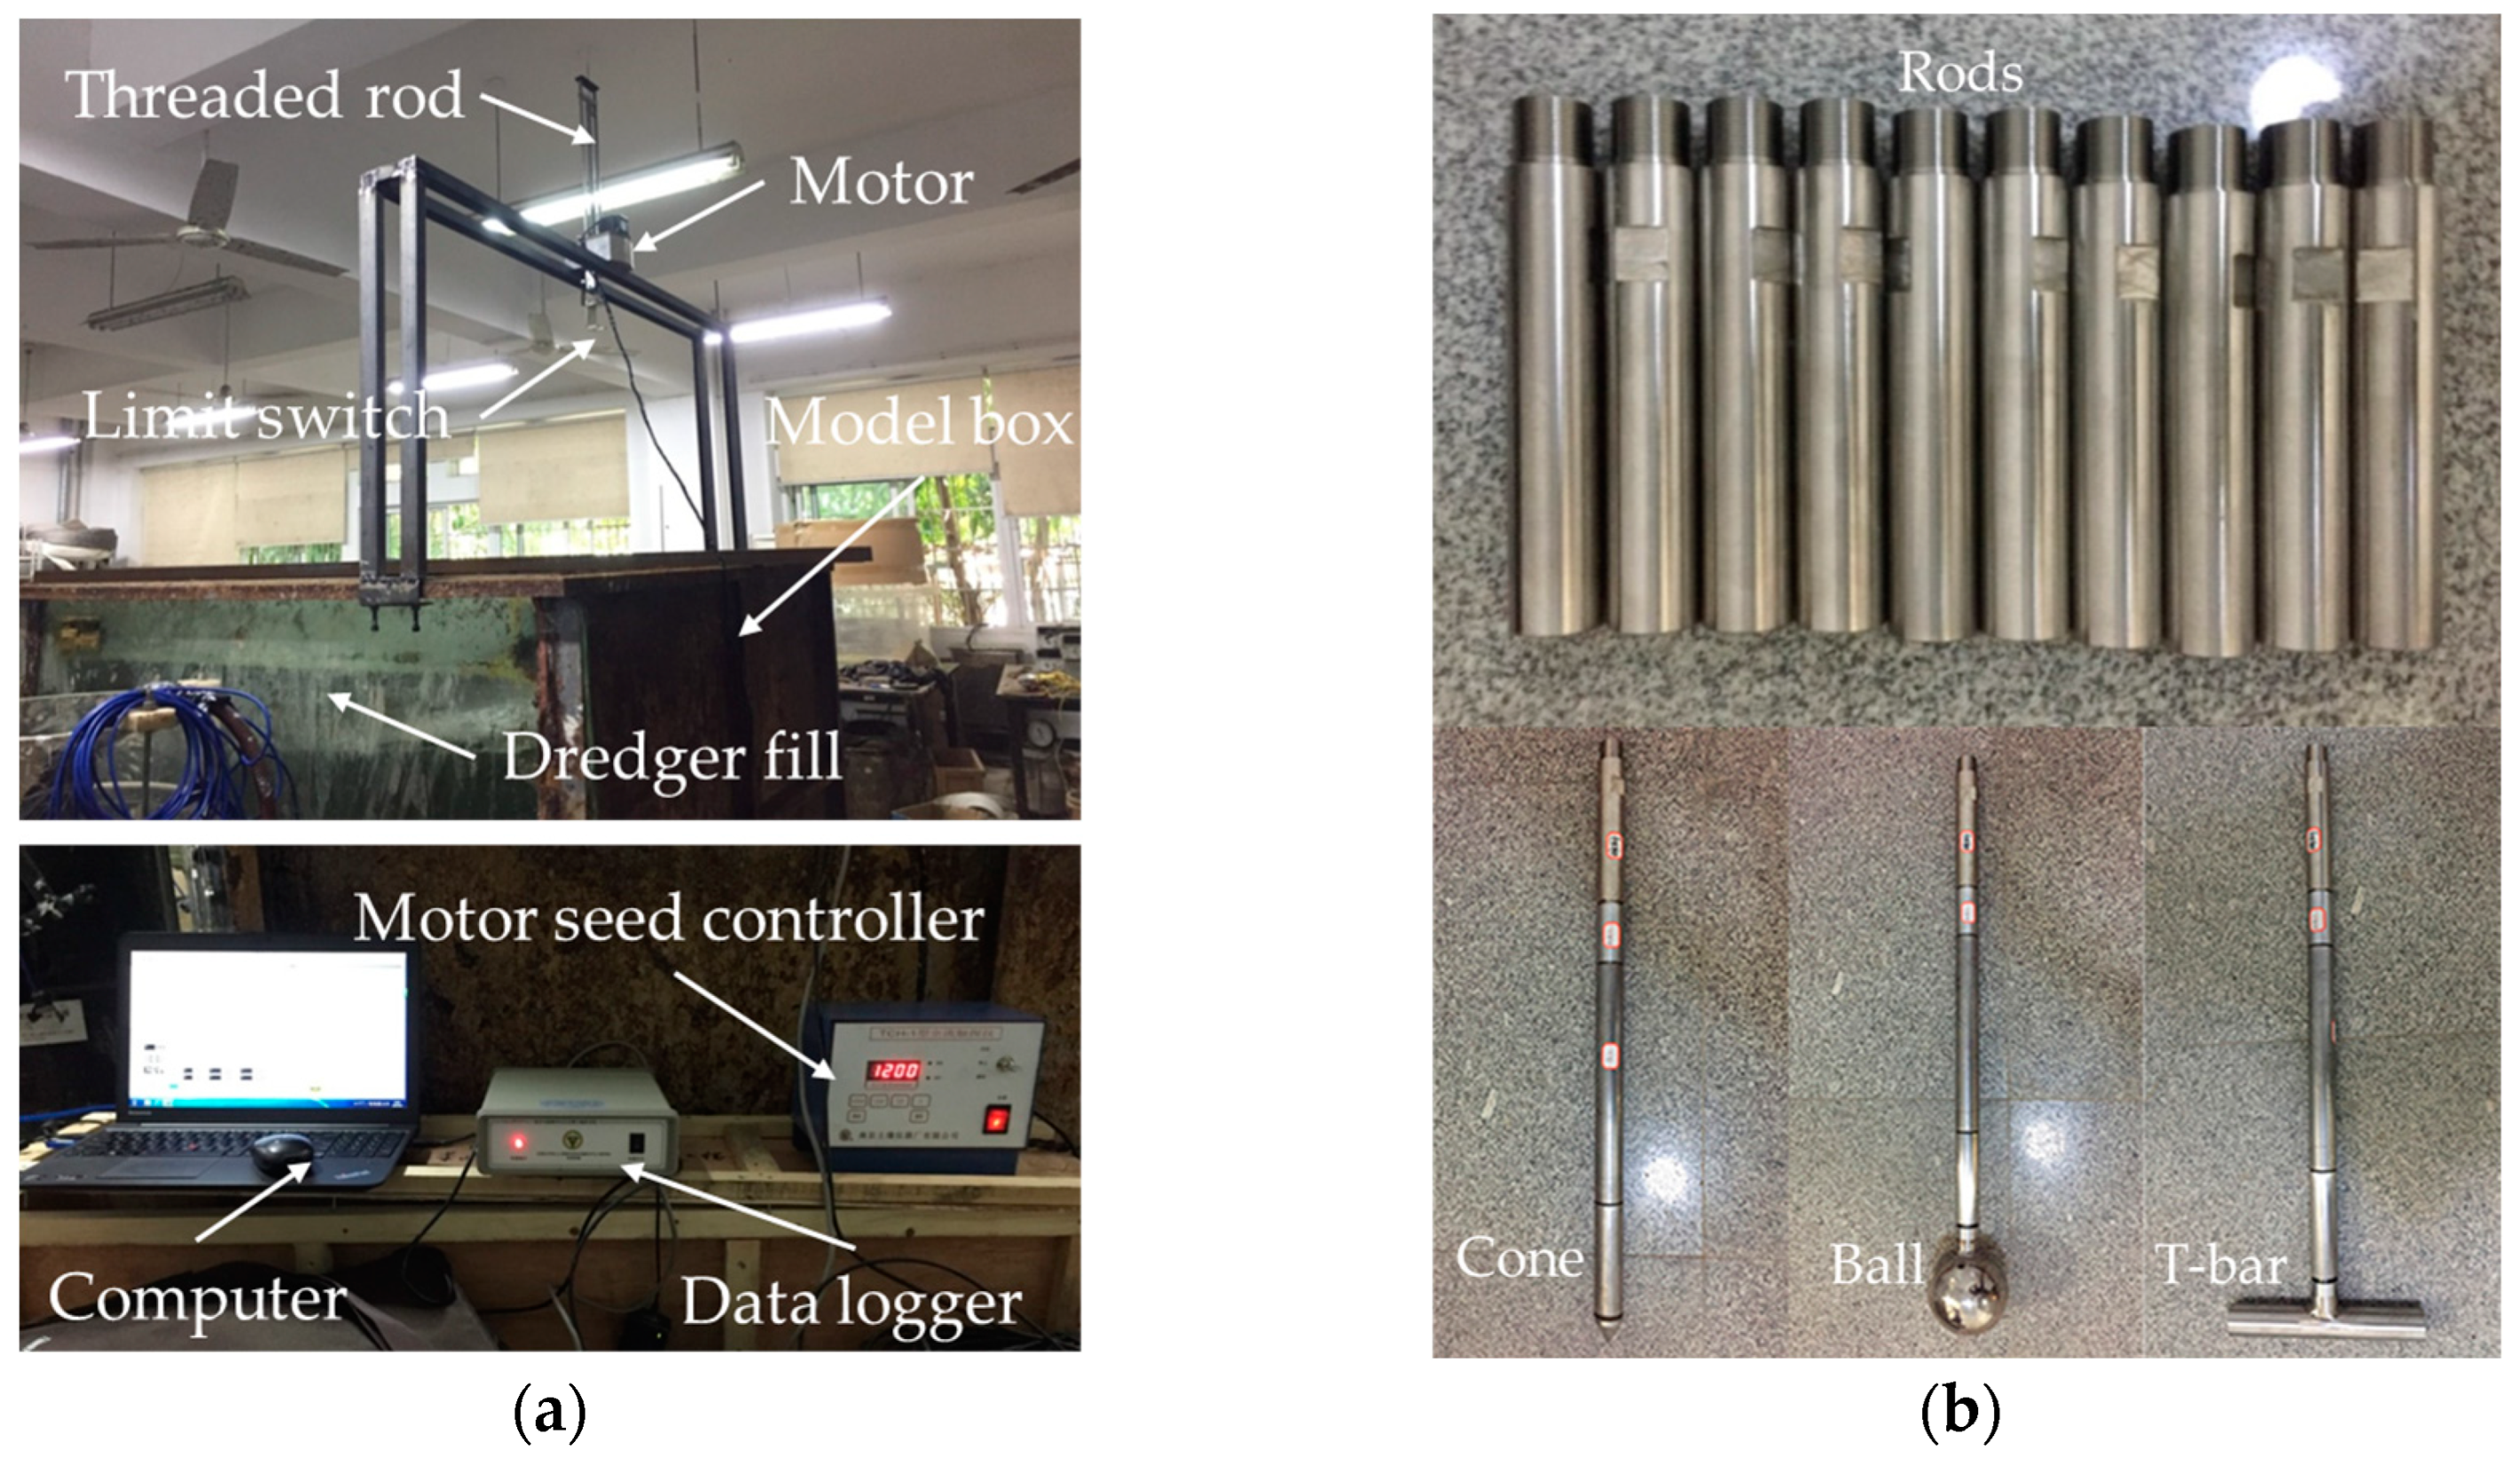
2.1. Model Box and Penetration Equipment
2.2. Penetrometers and Rods
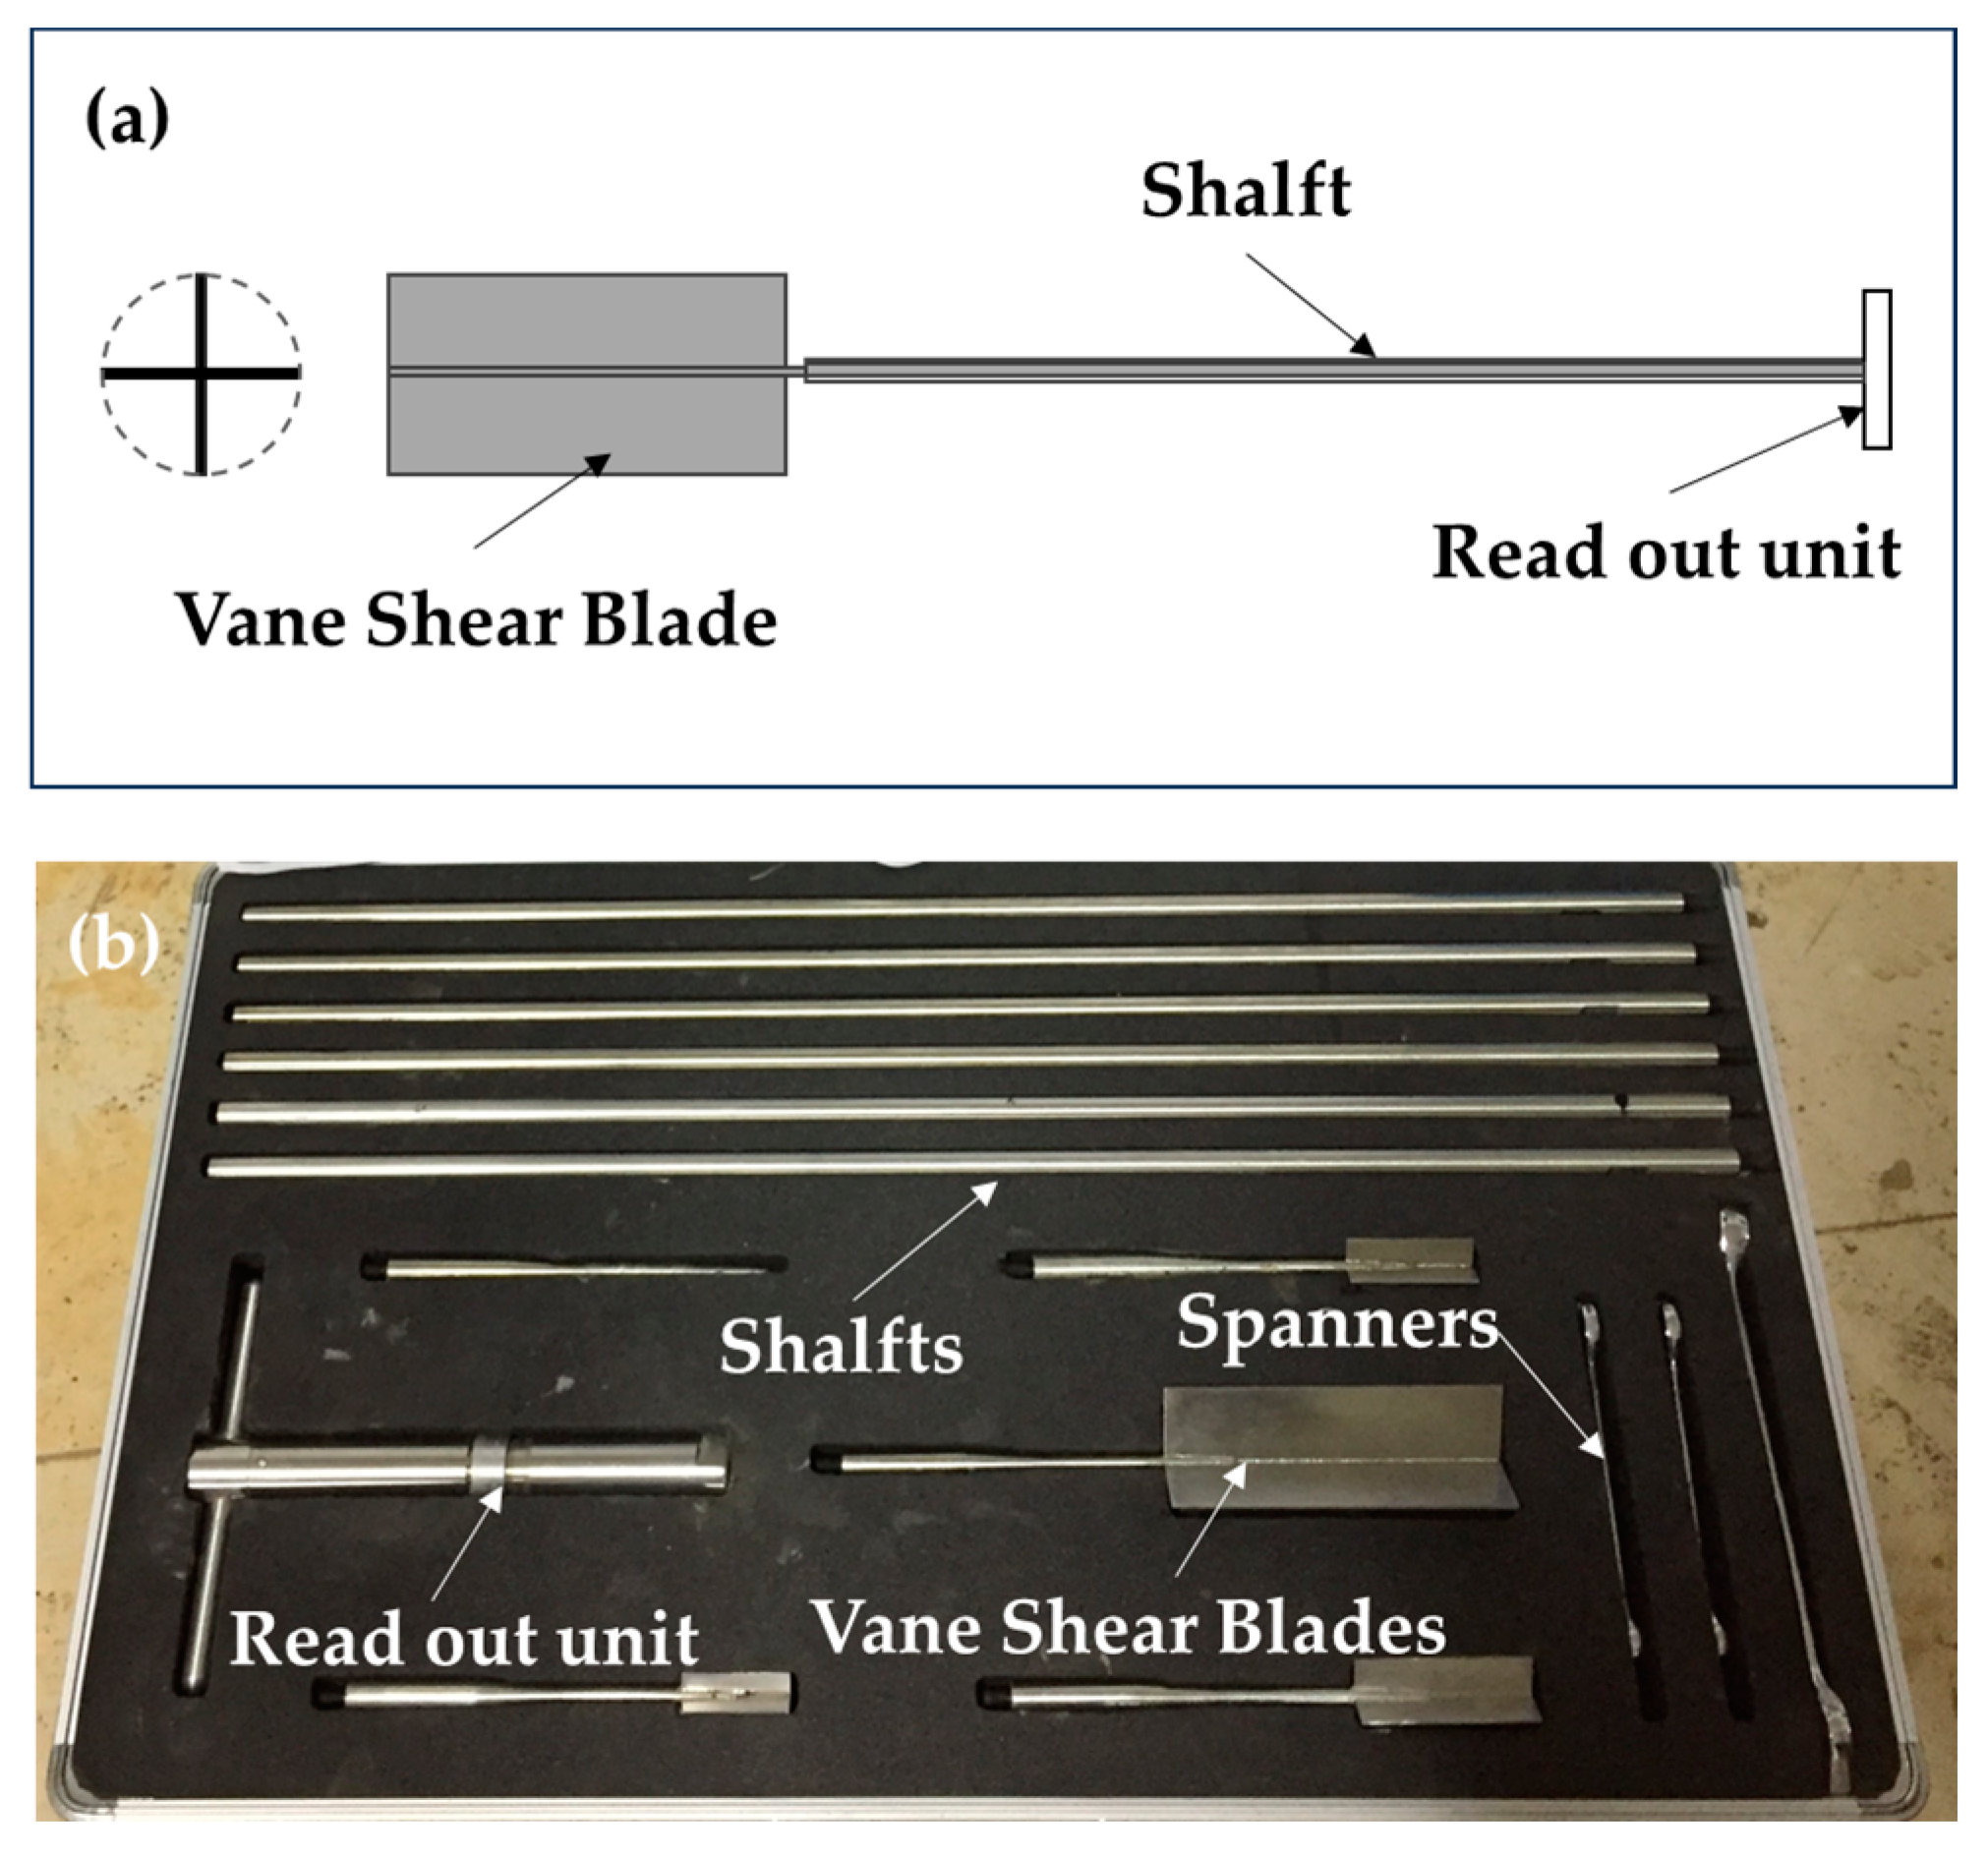
2.3. Vane
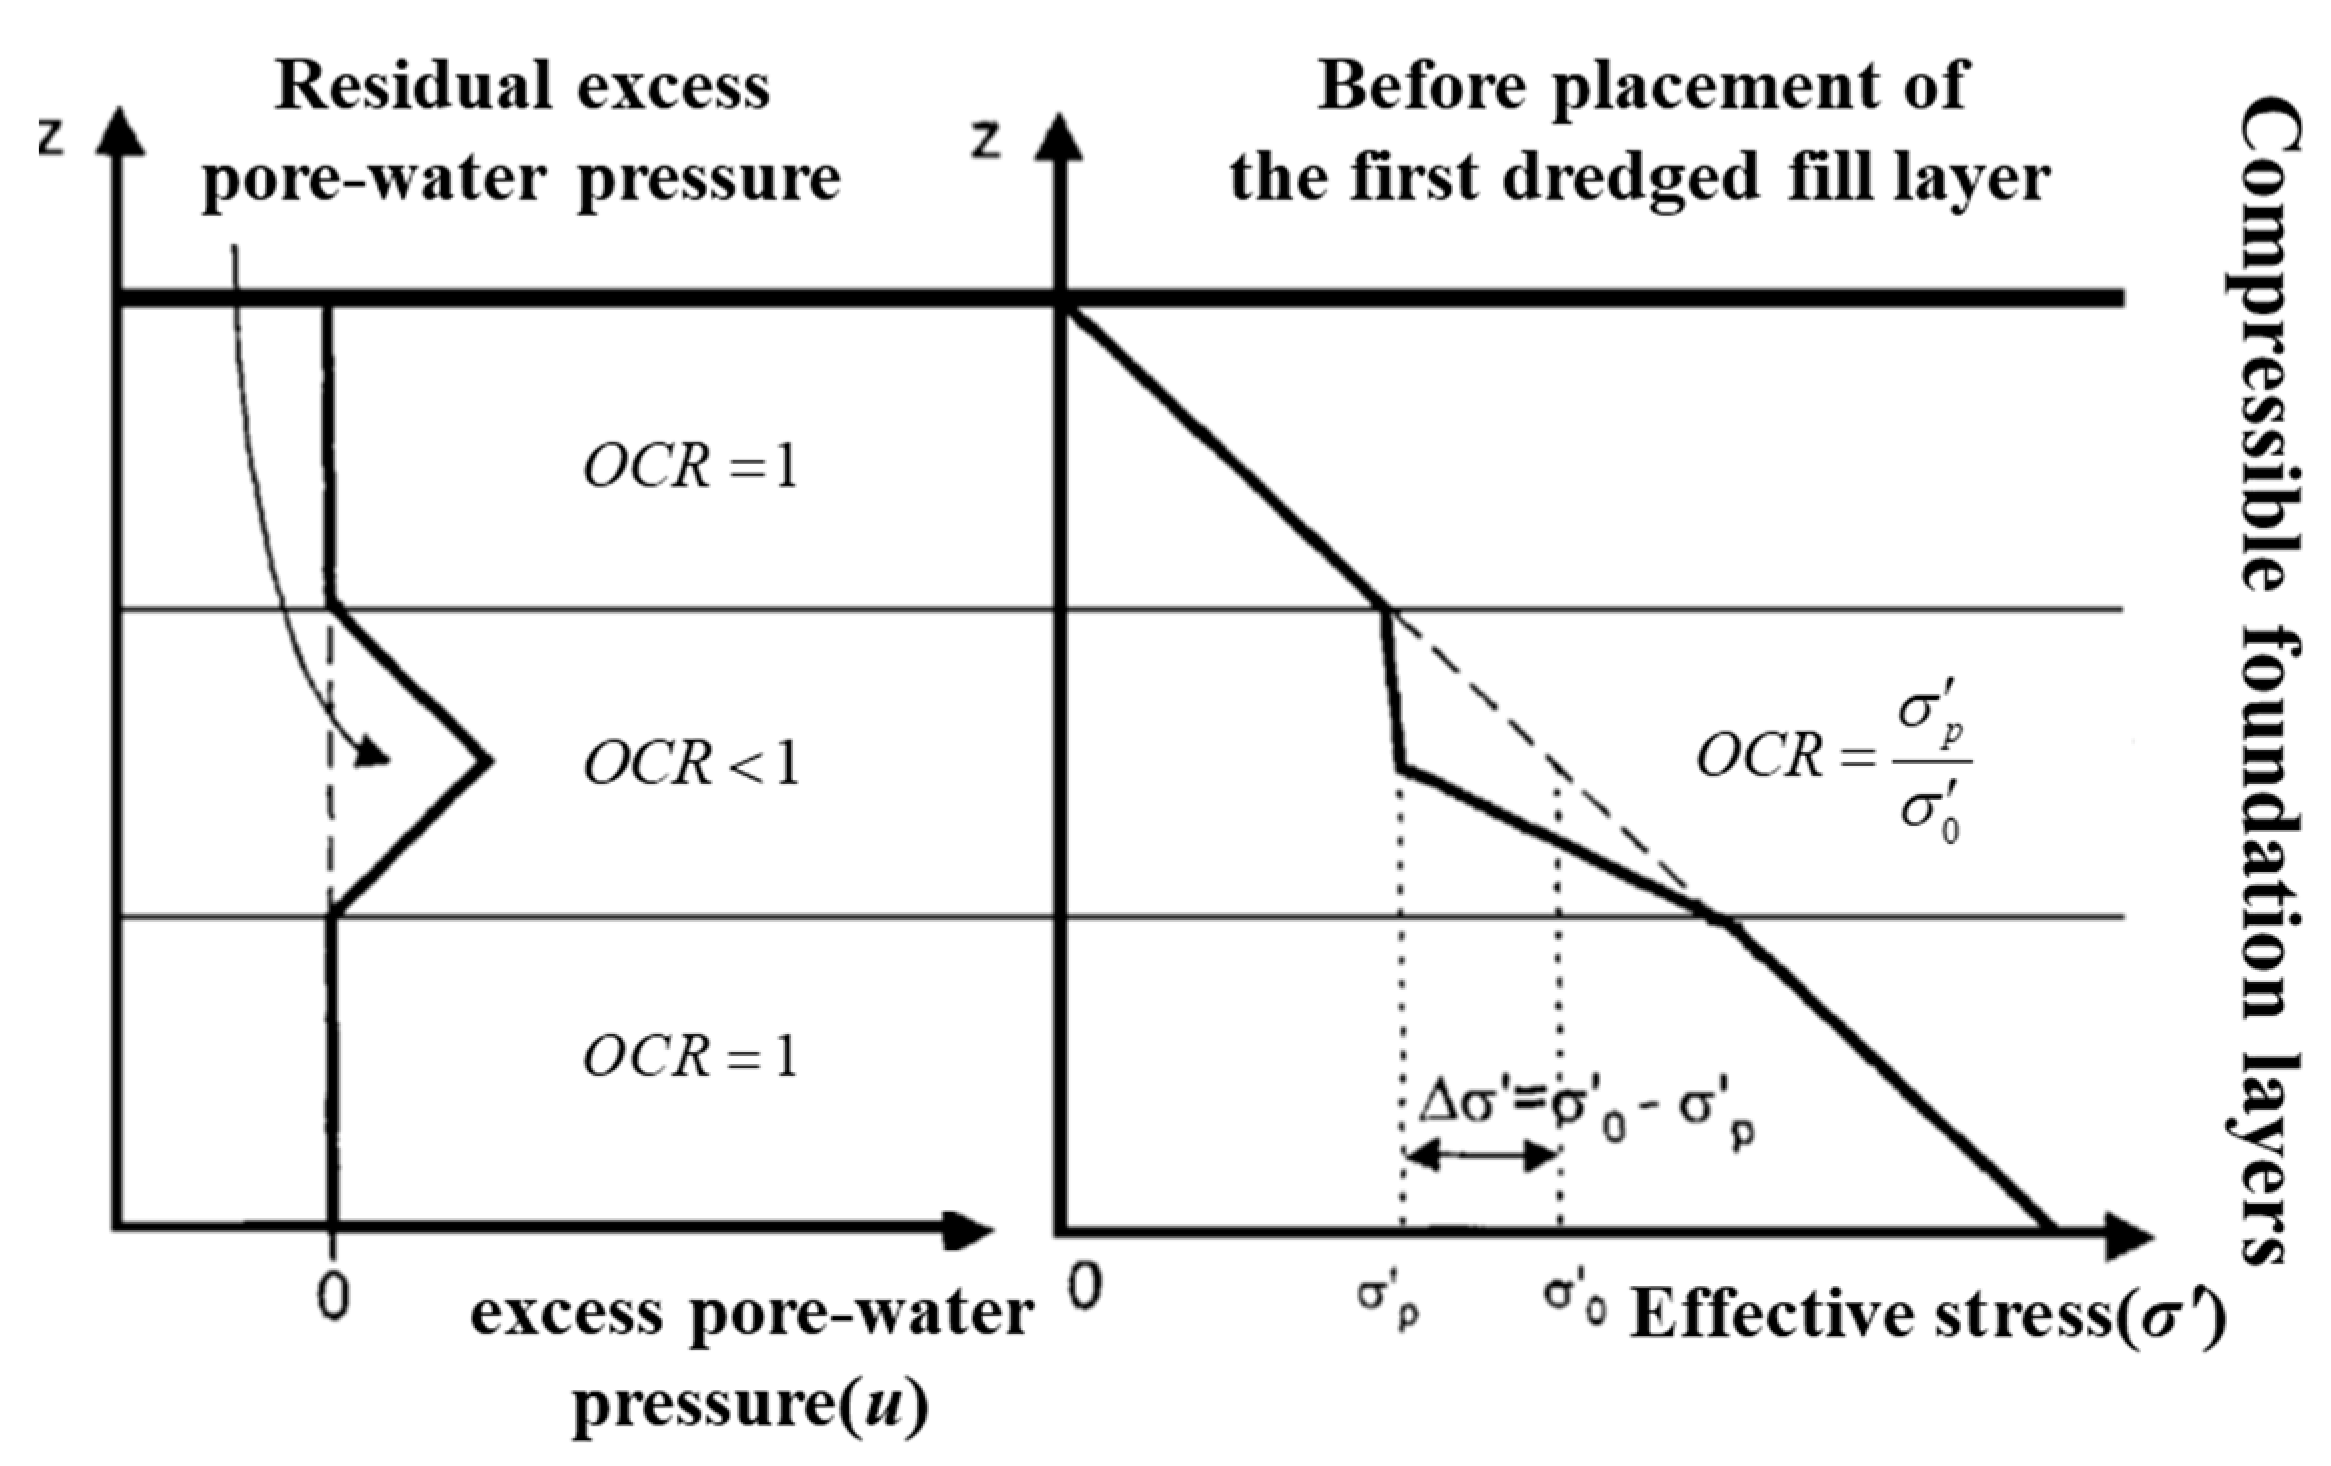
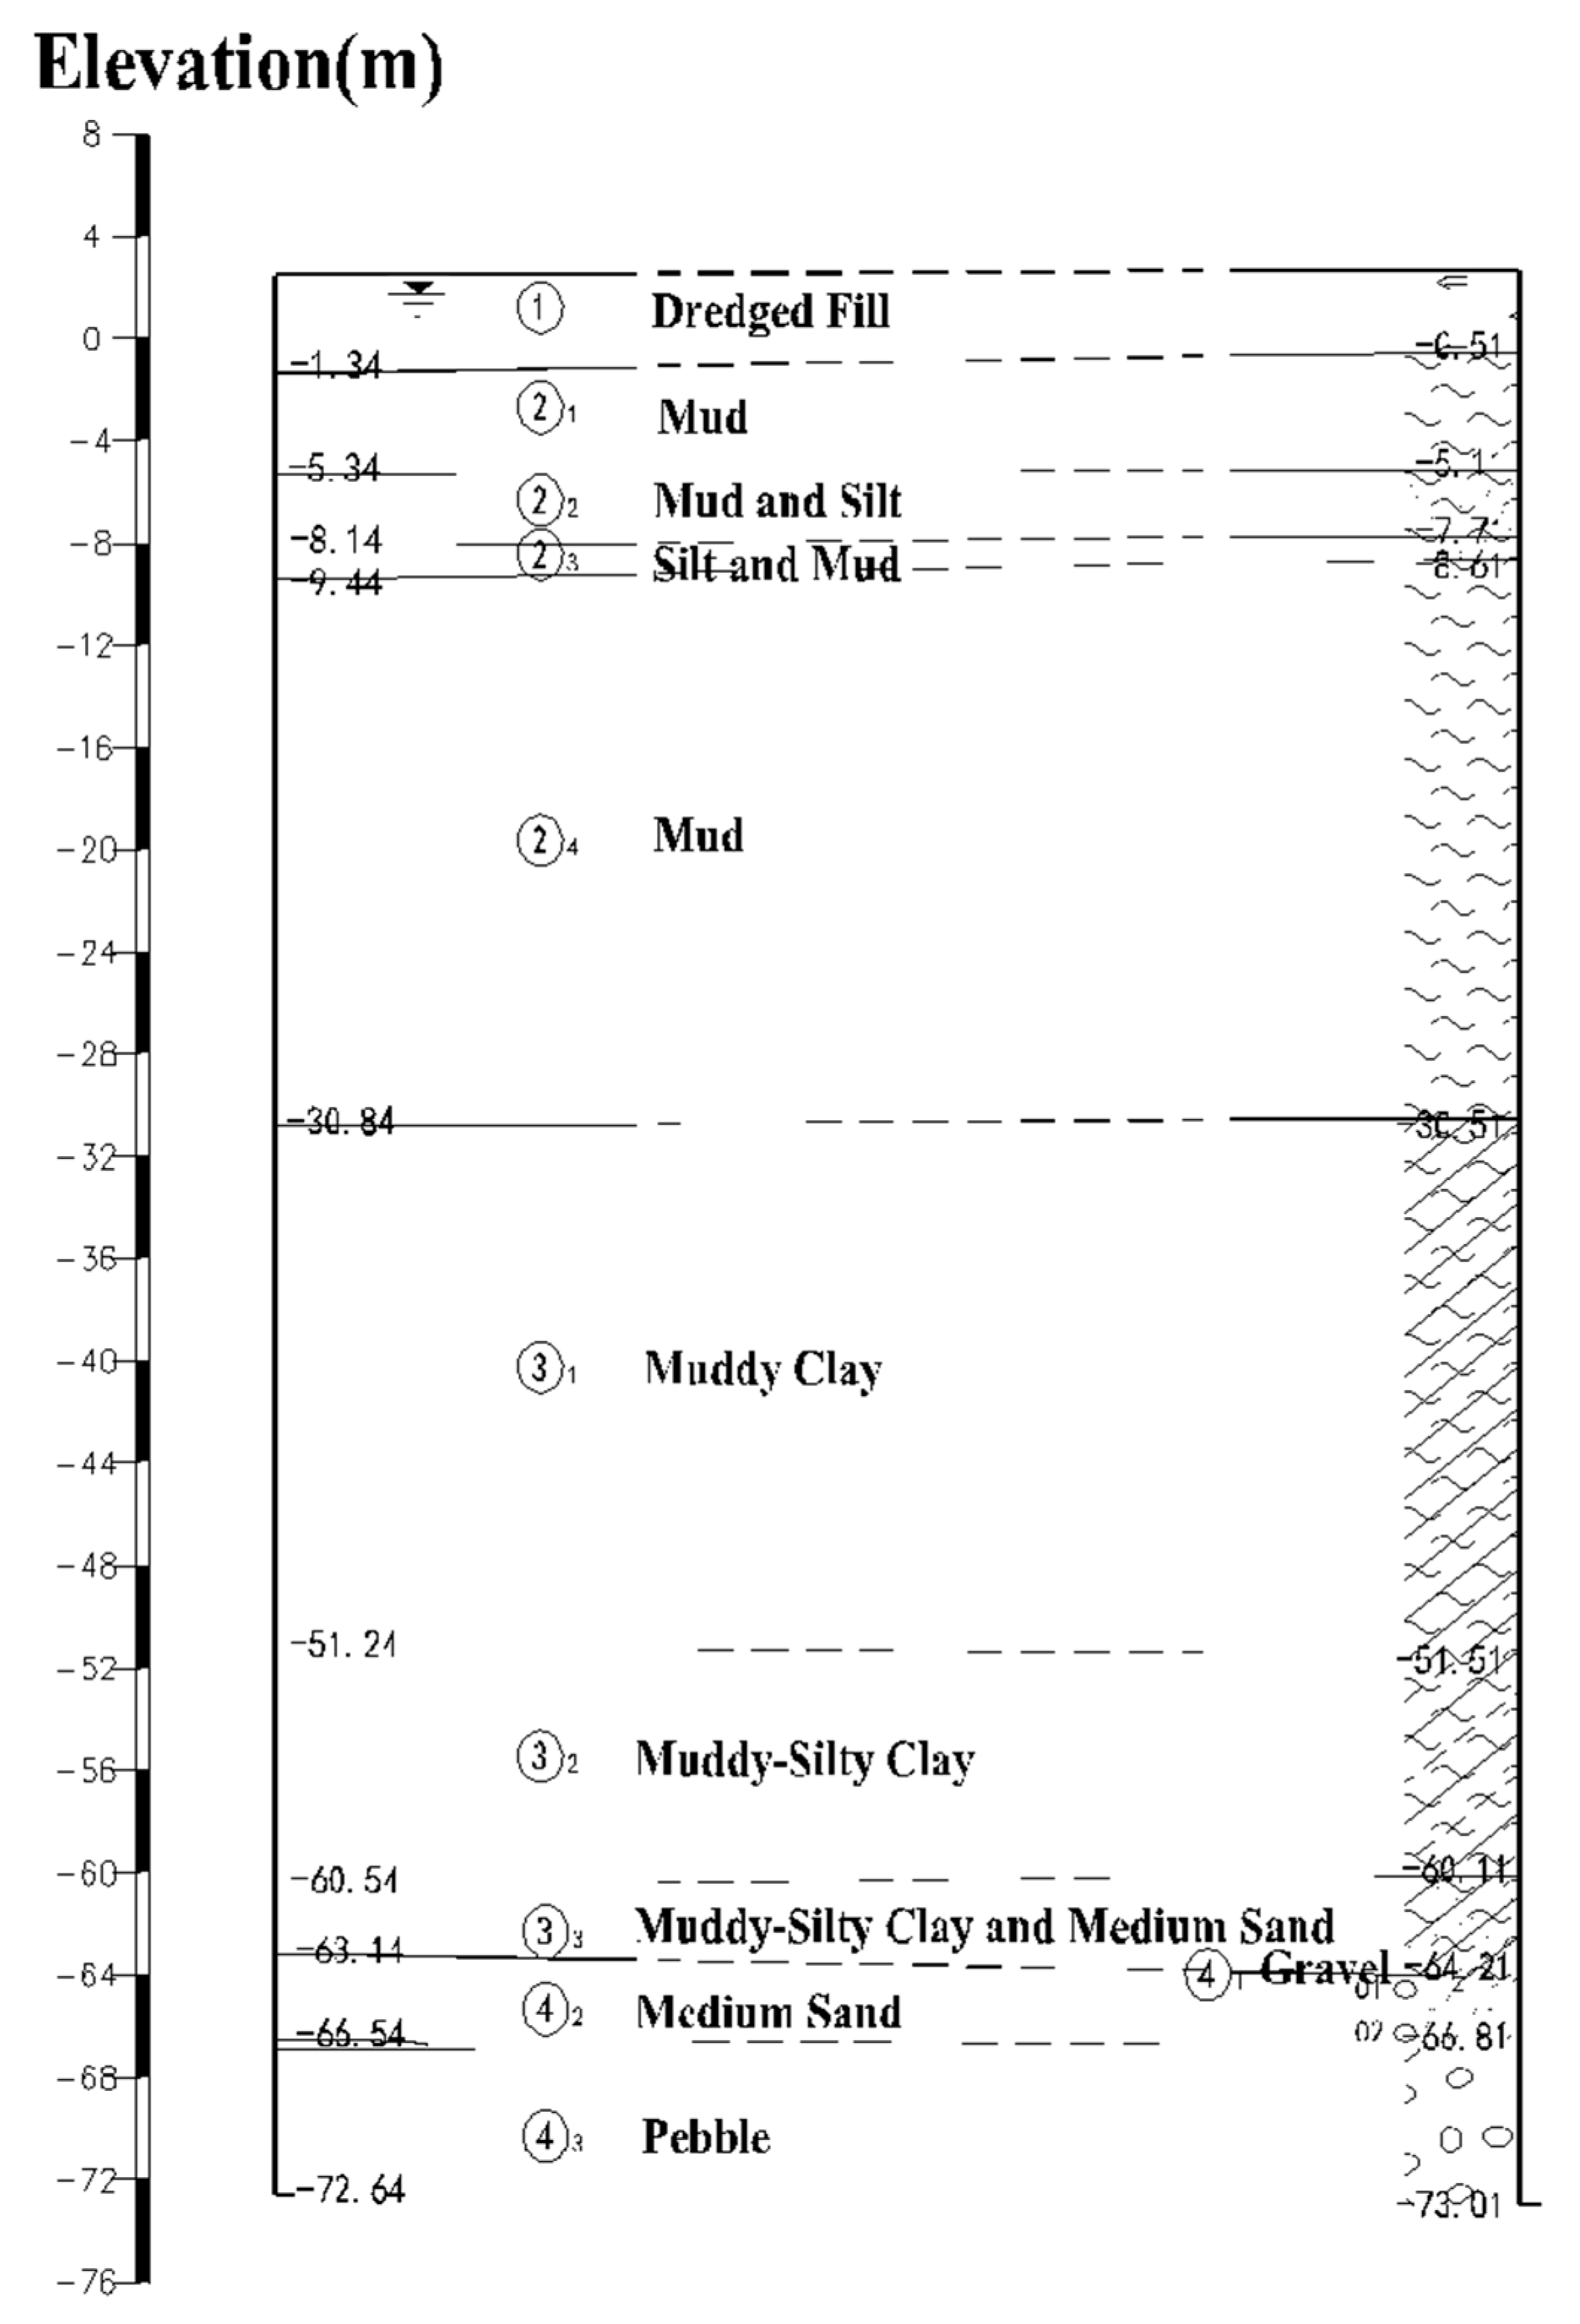
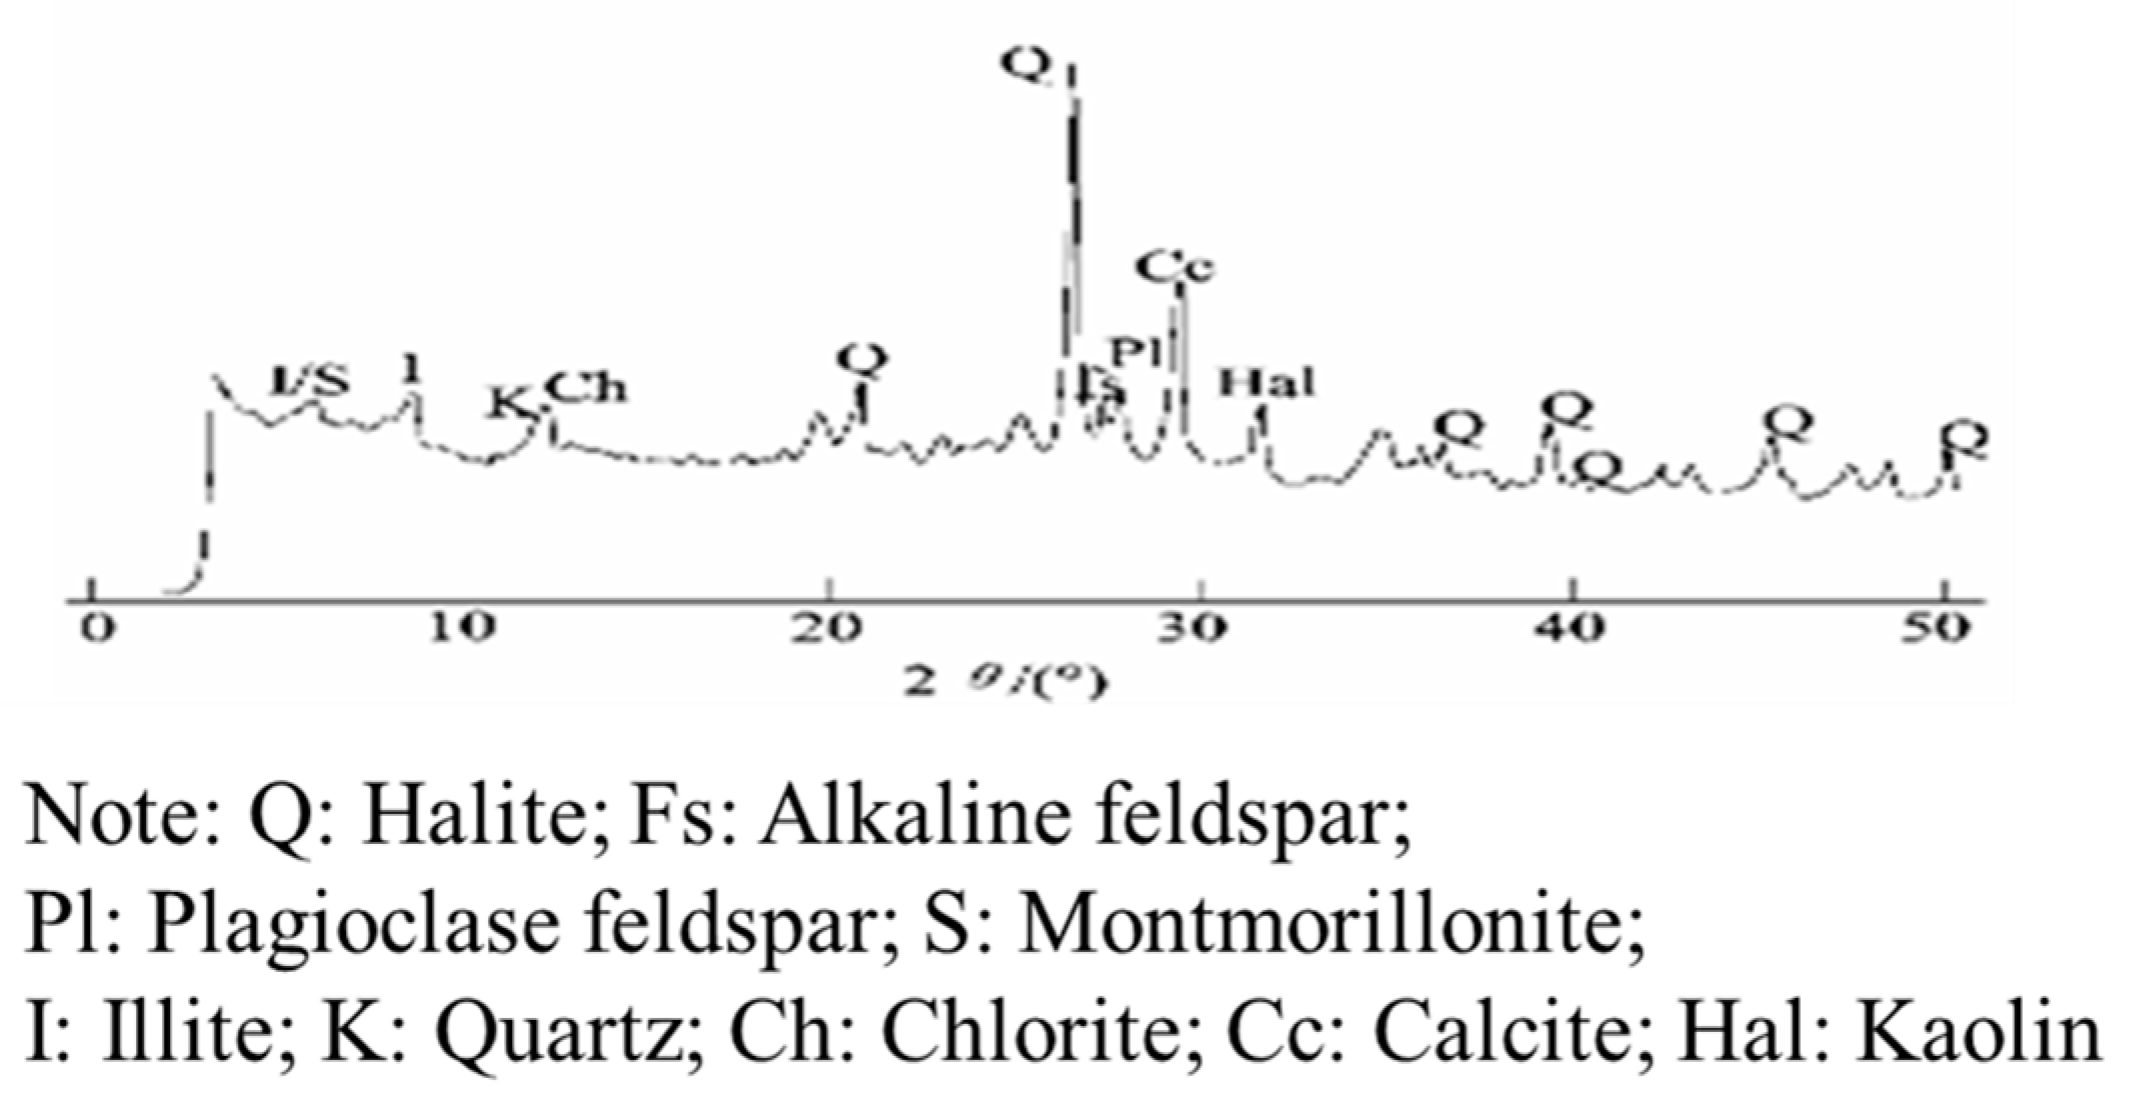
2.4. Sample Preparation
3. Test Methodology
3.1. Vane Shear Test (VST)
3.2. Piezocone Penetration Test (CPTu)
- Correction of measured cone tip resistance
- 2.
- Calculation of undrained shear strength from CPTu
3.3. Full-Flow Penetrometer Tests
- Correction of measured penetration resistance
- 2.
- Evaluation of undrained shear strength by the full-flow penetrometer test
- 3.
- Influence of penetration rate
4. Results and Discussion
4.1. Vane Shear Test (VST)
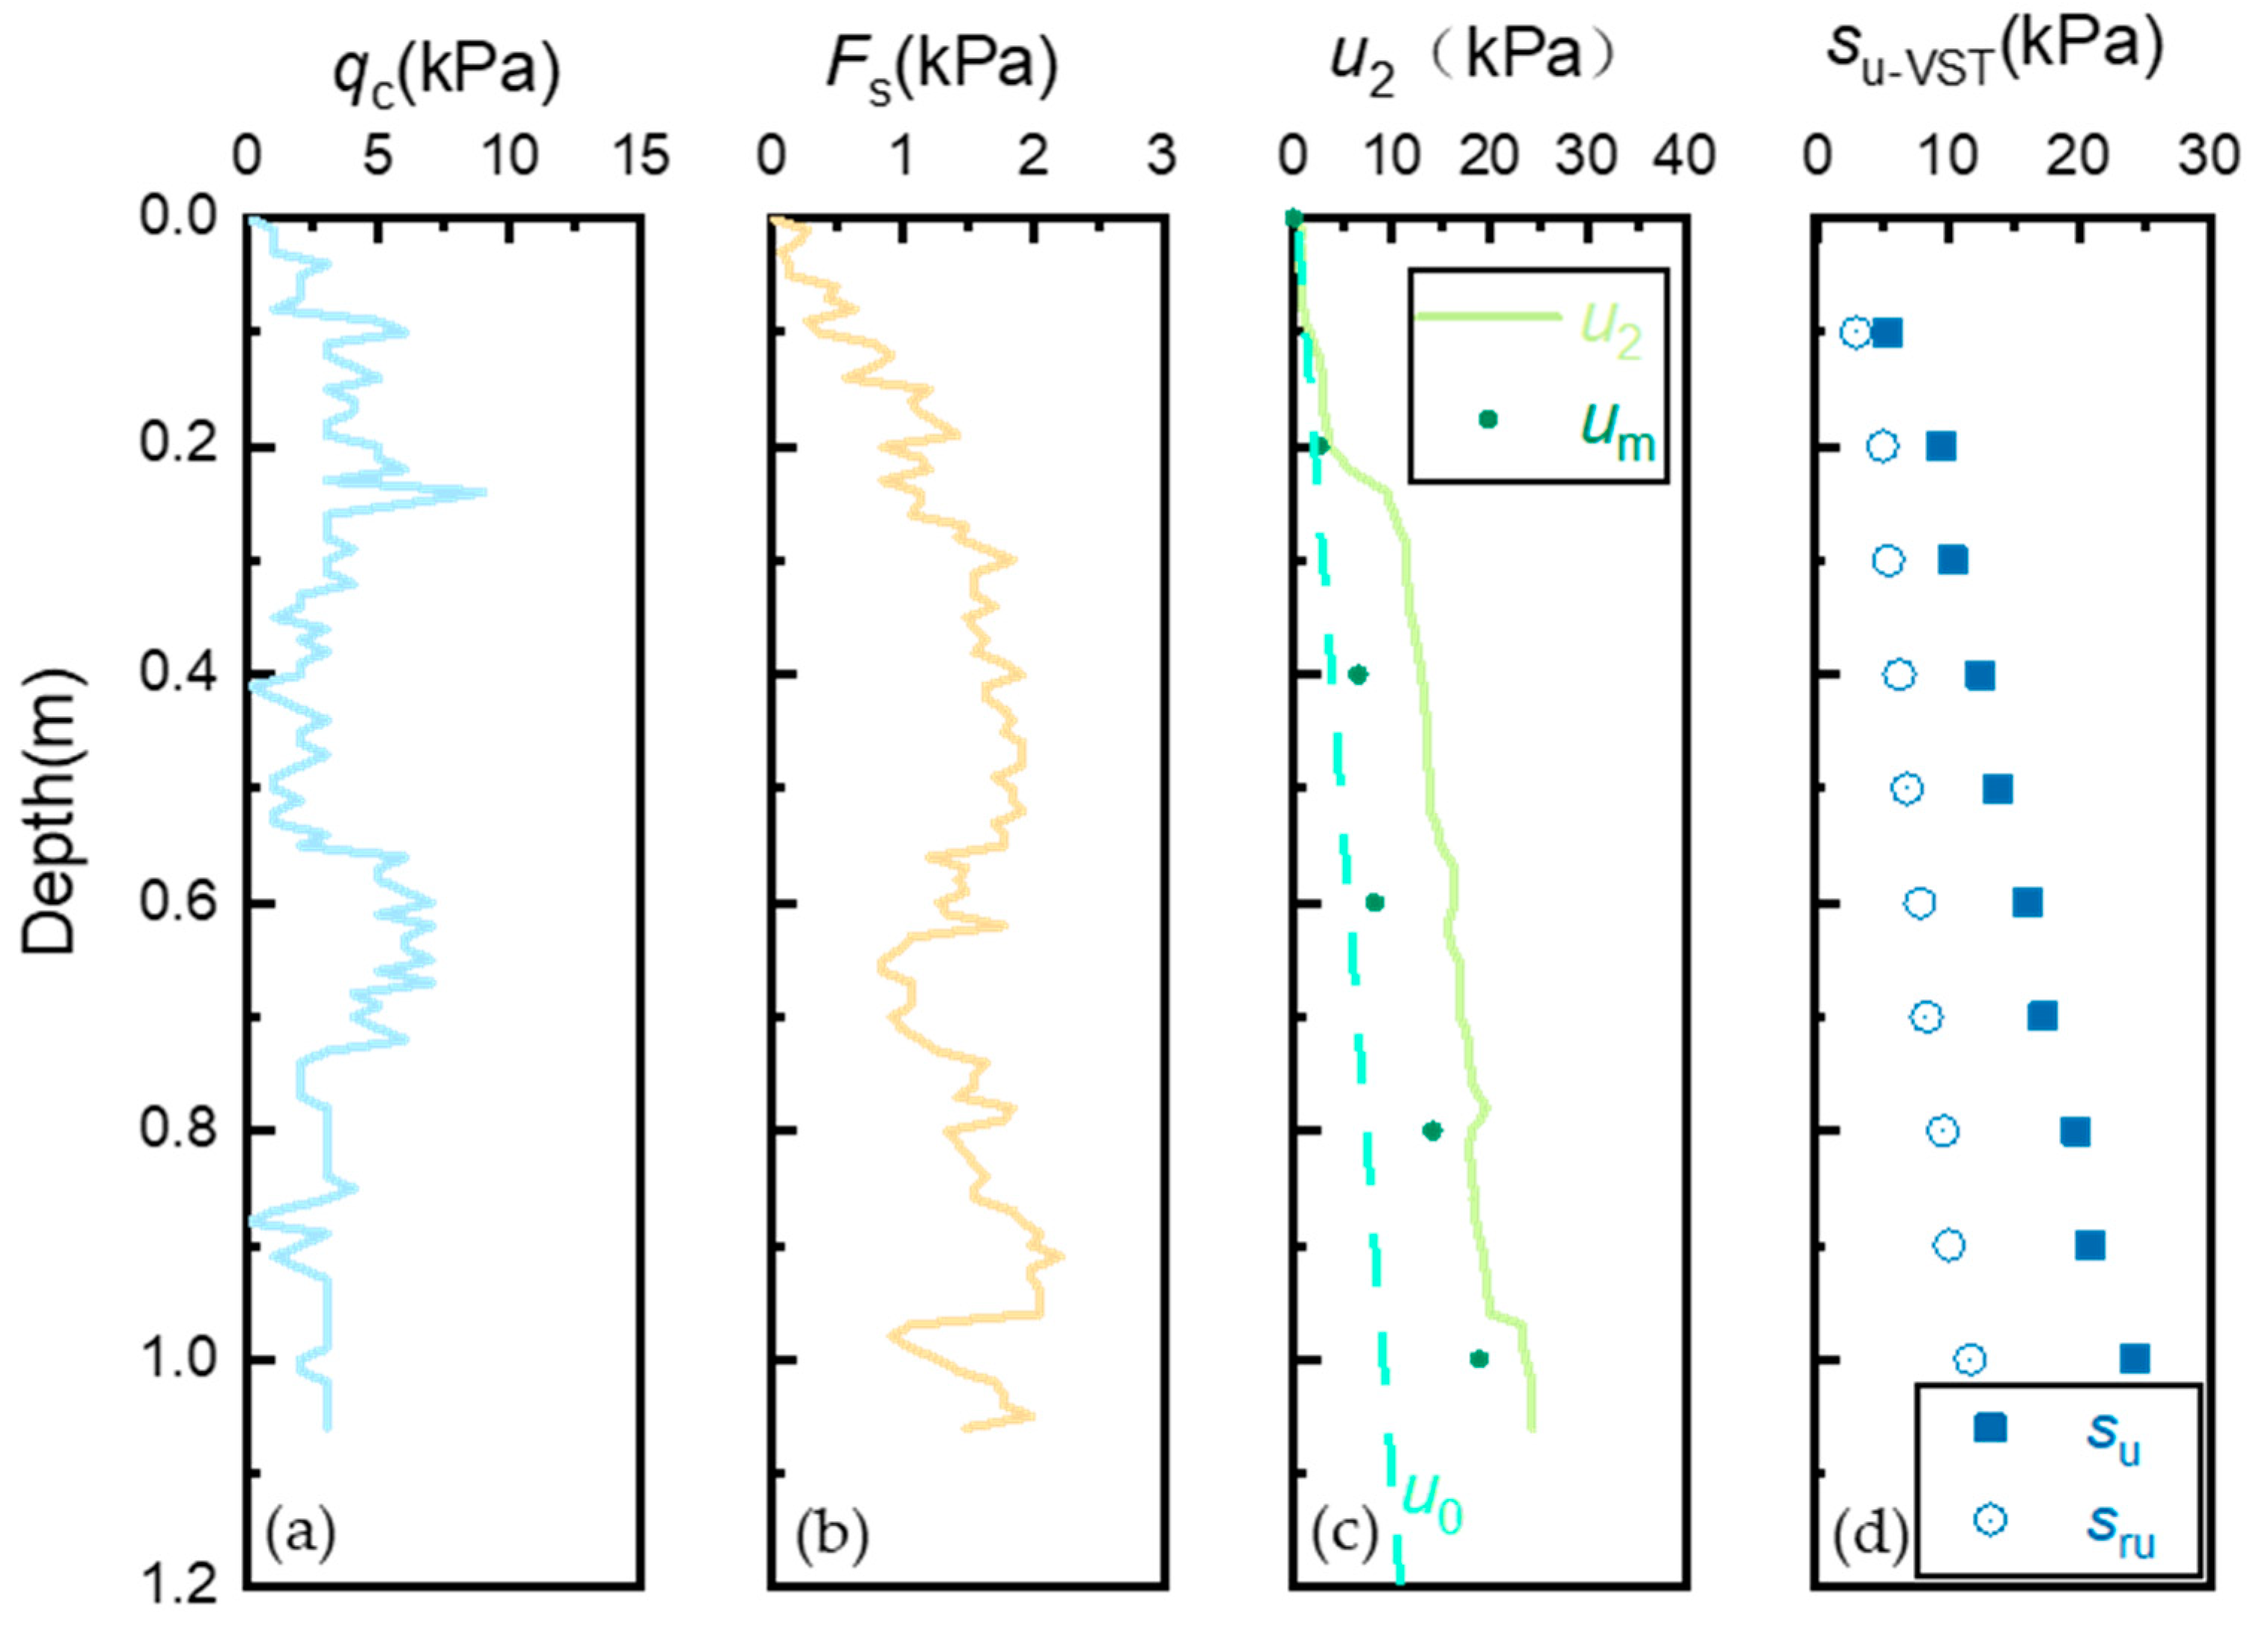
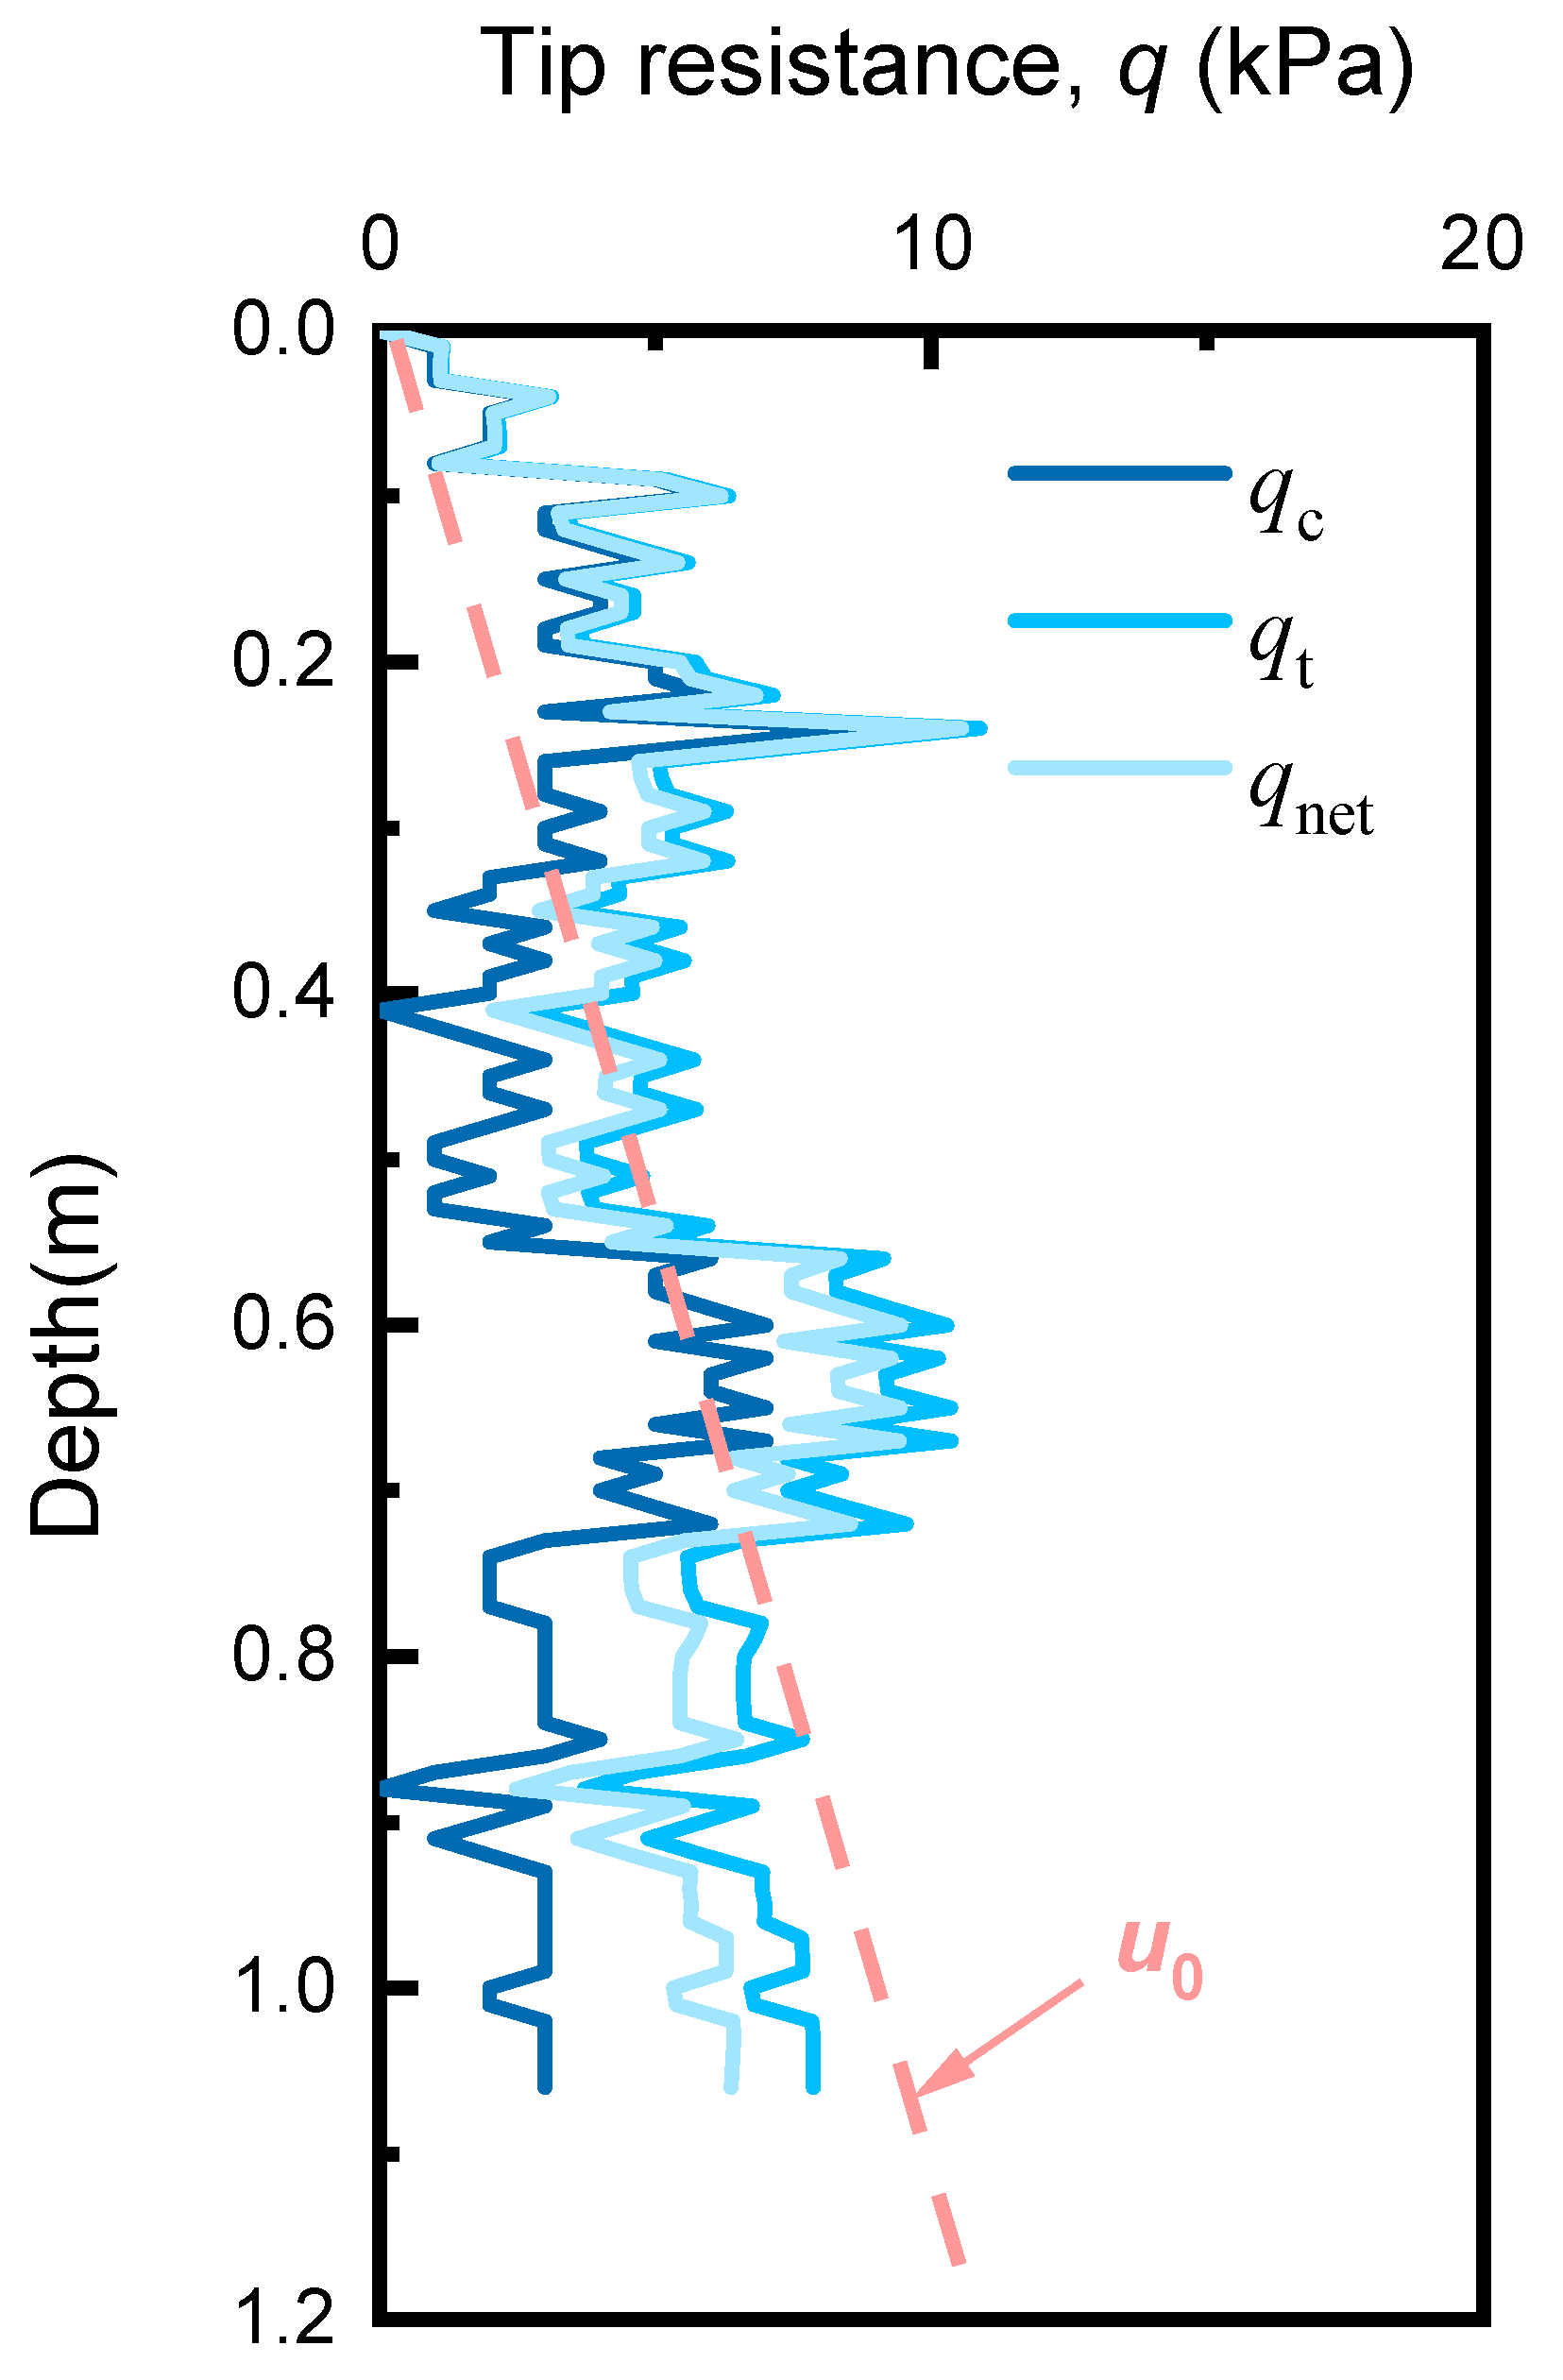
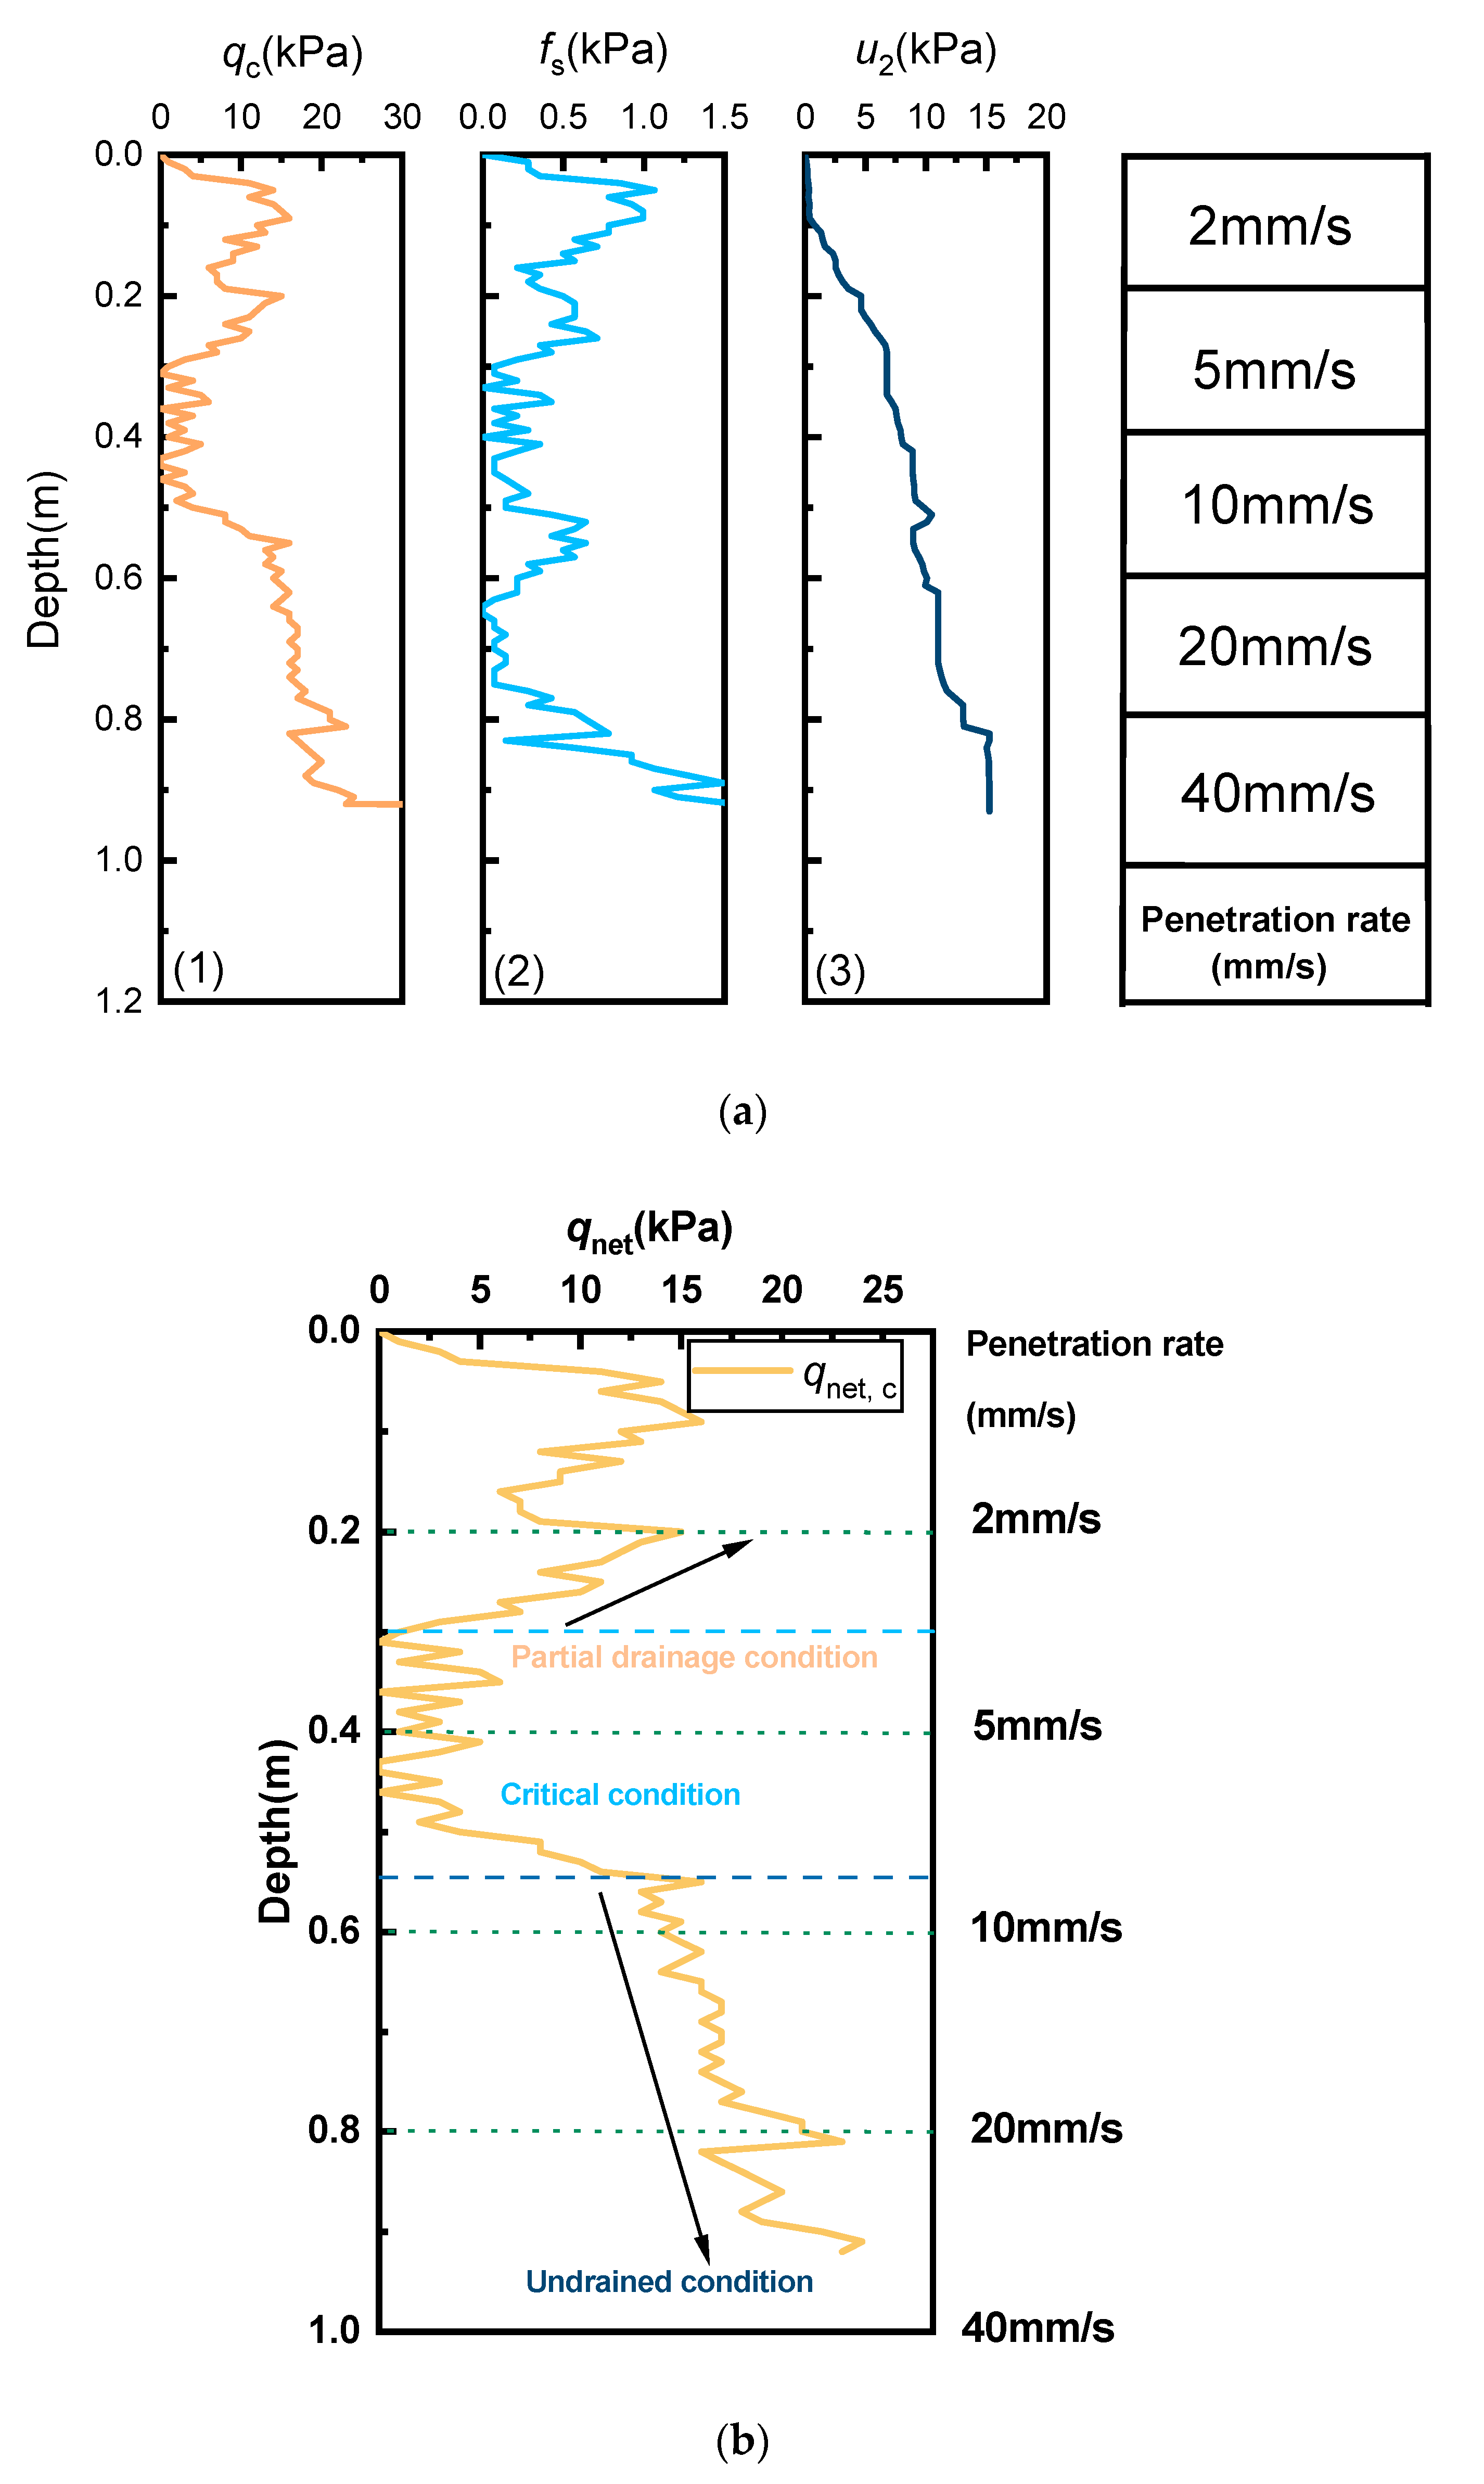
4.2. Piezocone Penetration Test (CPTu) in Underconsolidated Clay
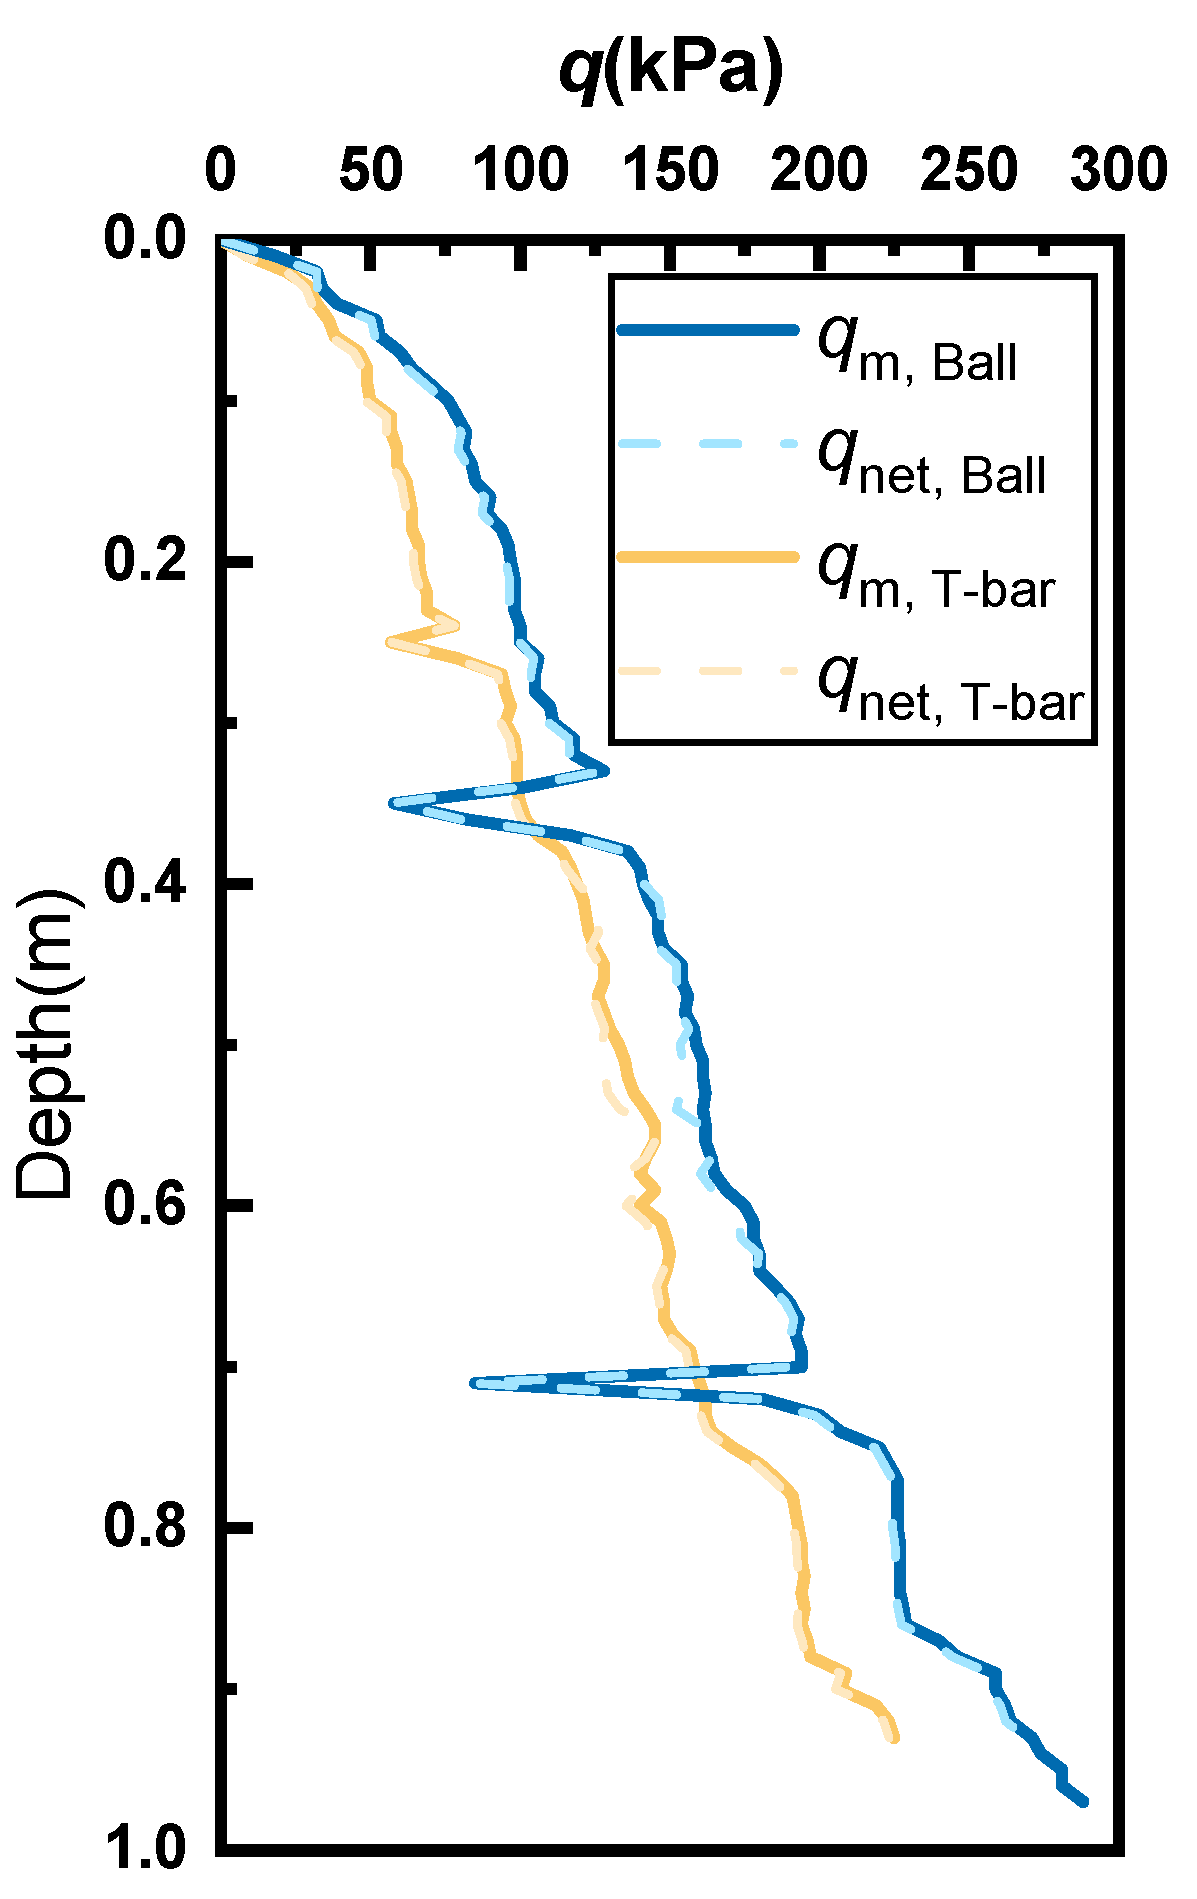
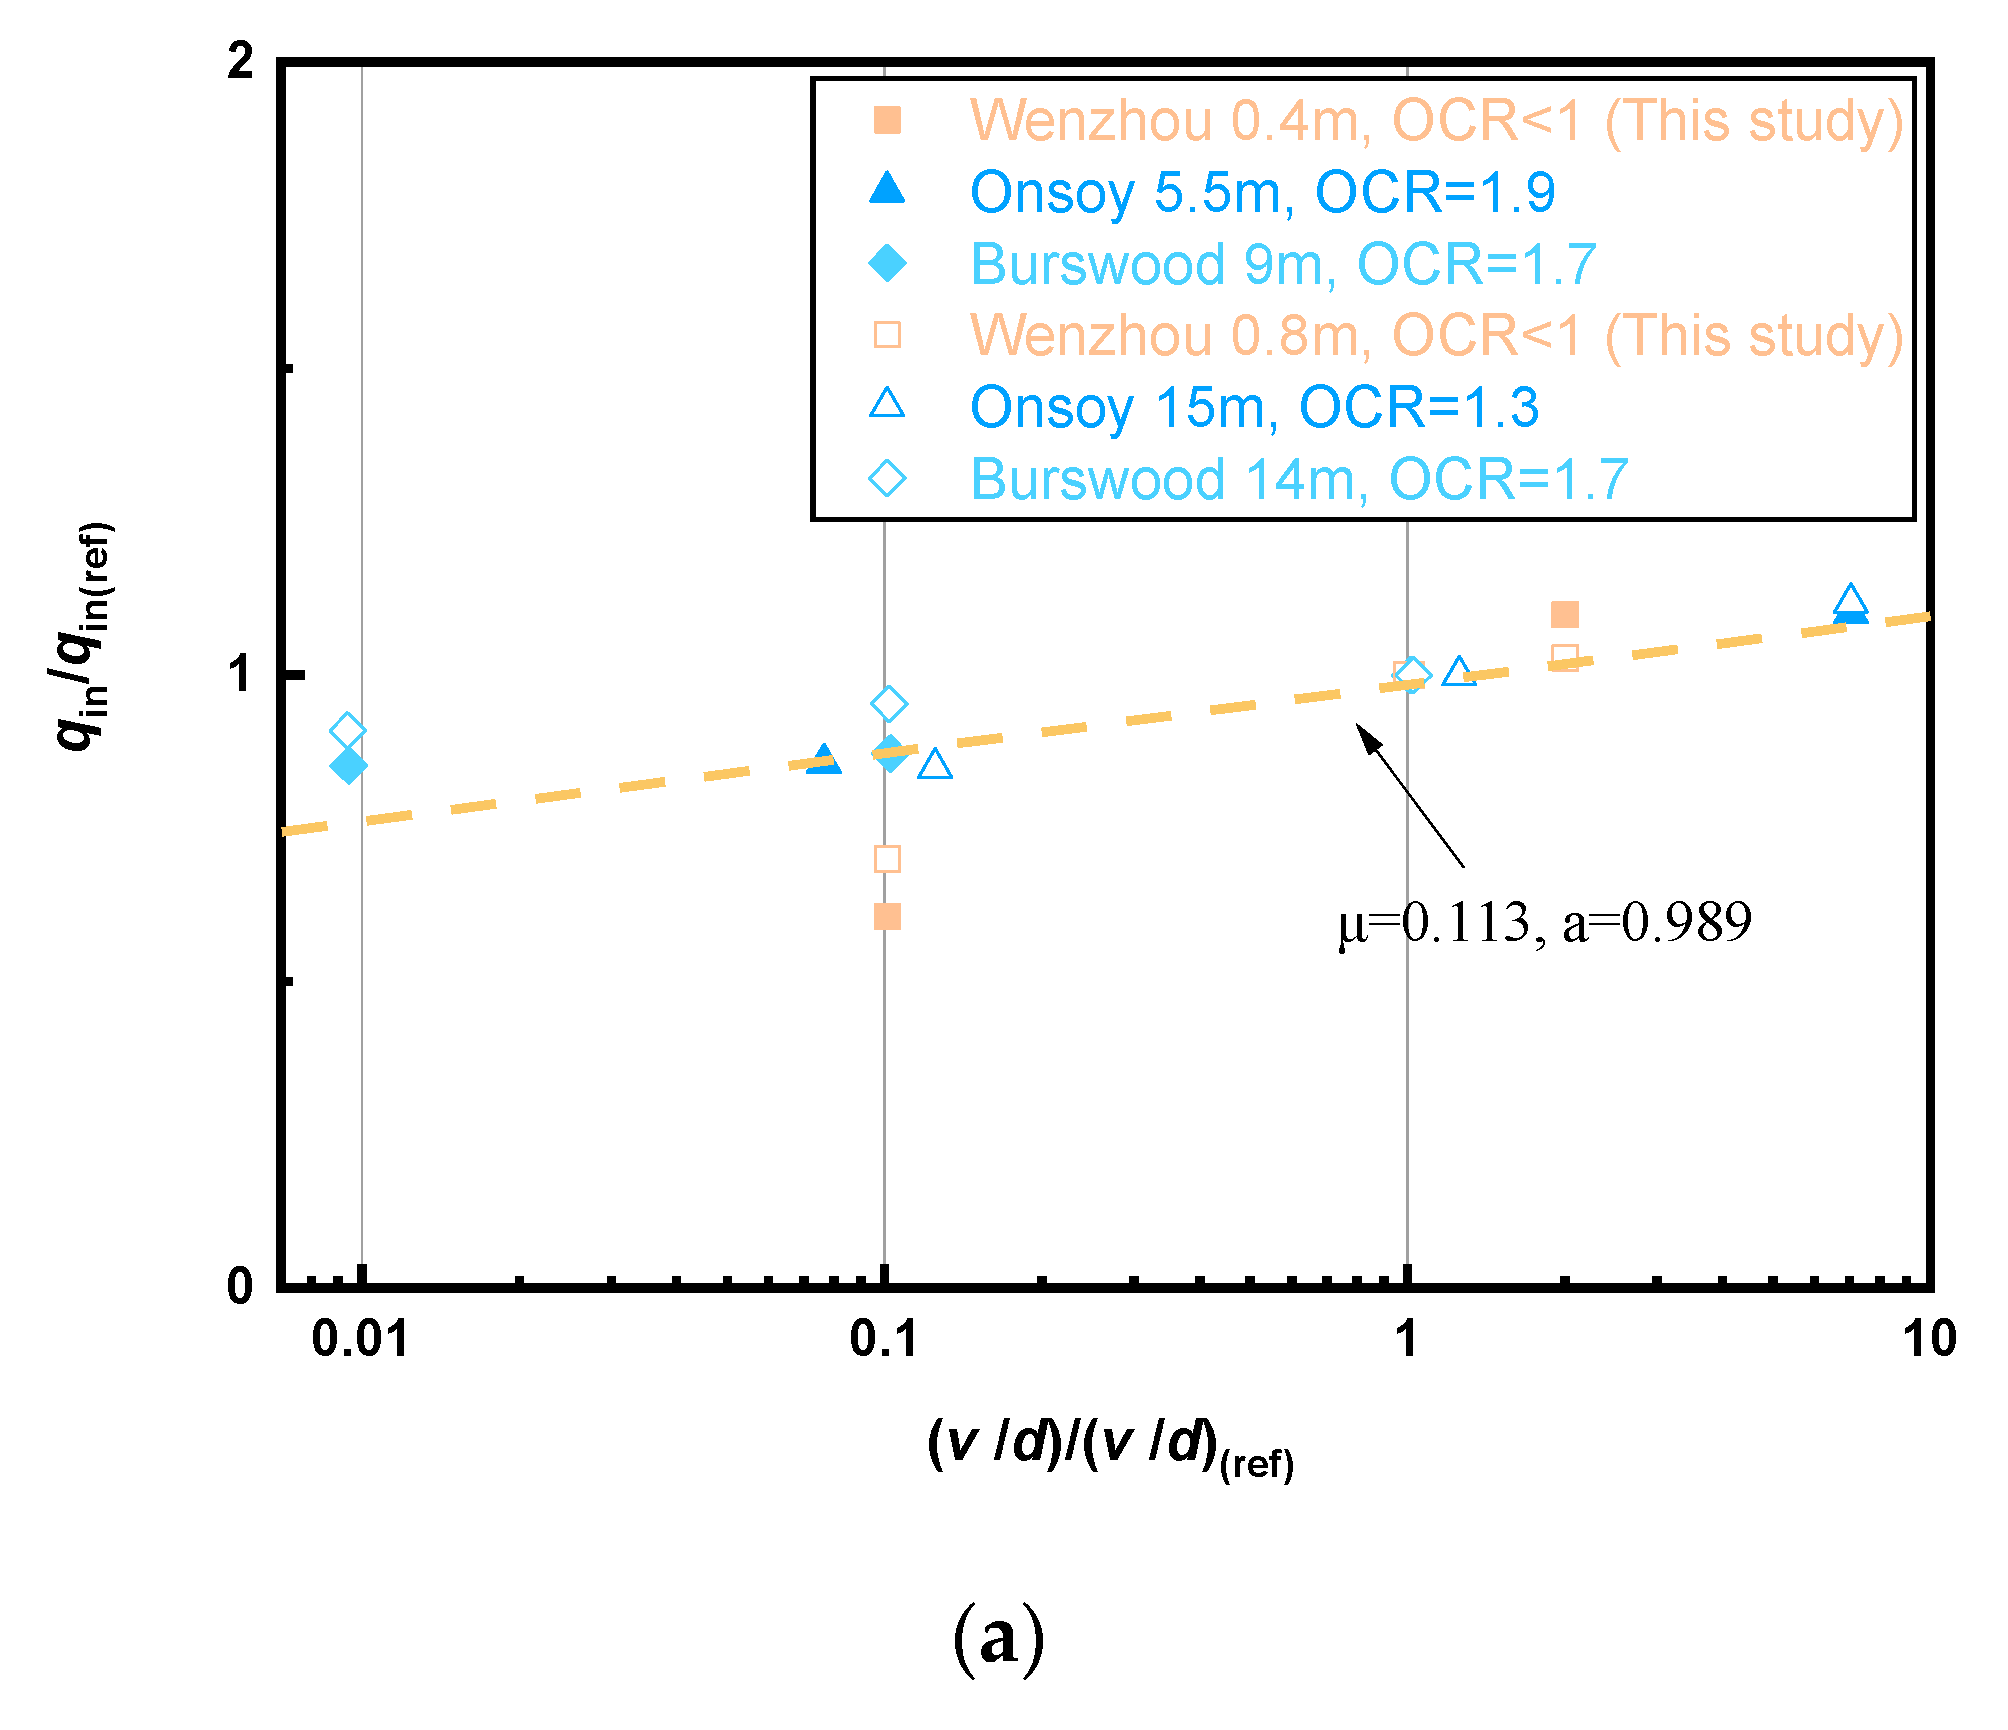
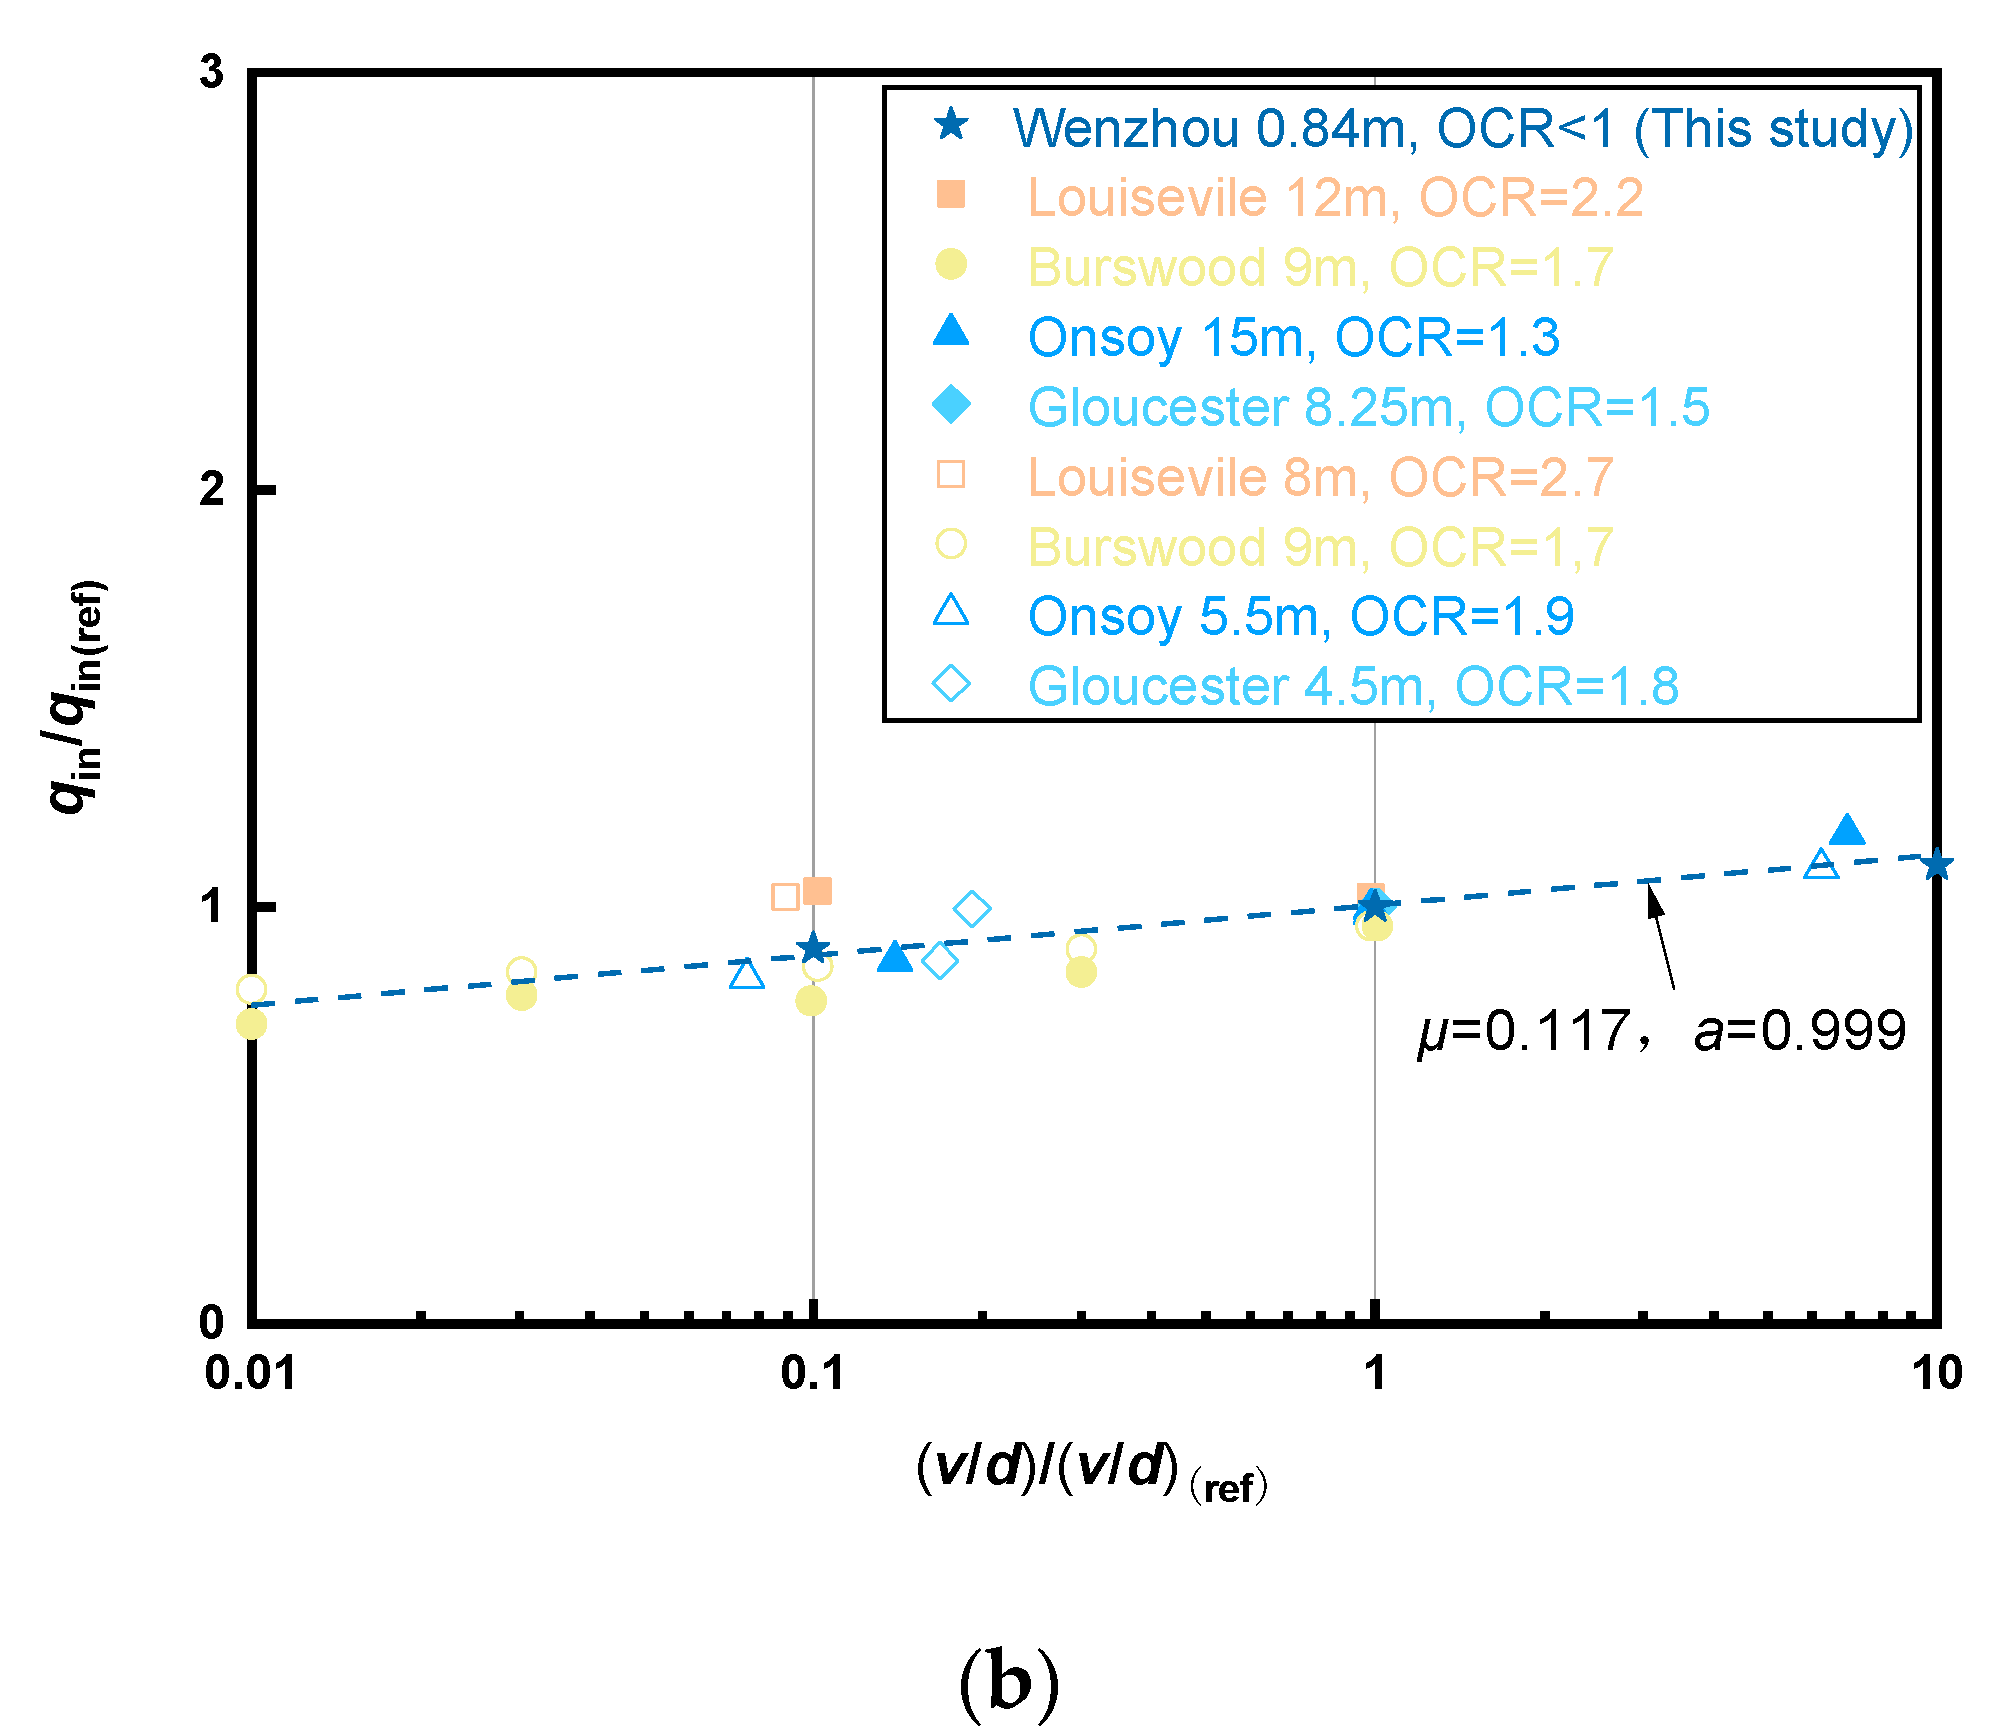
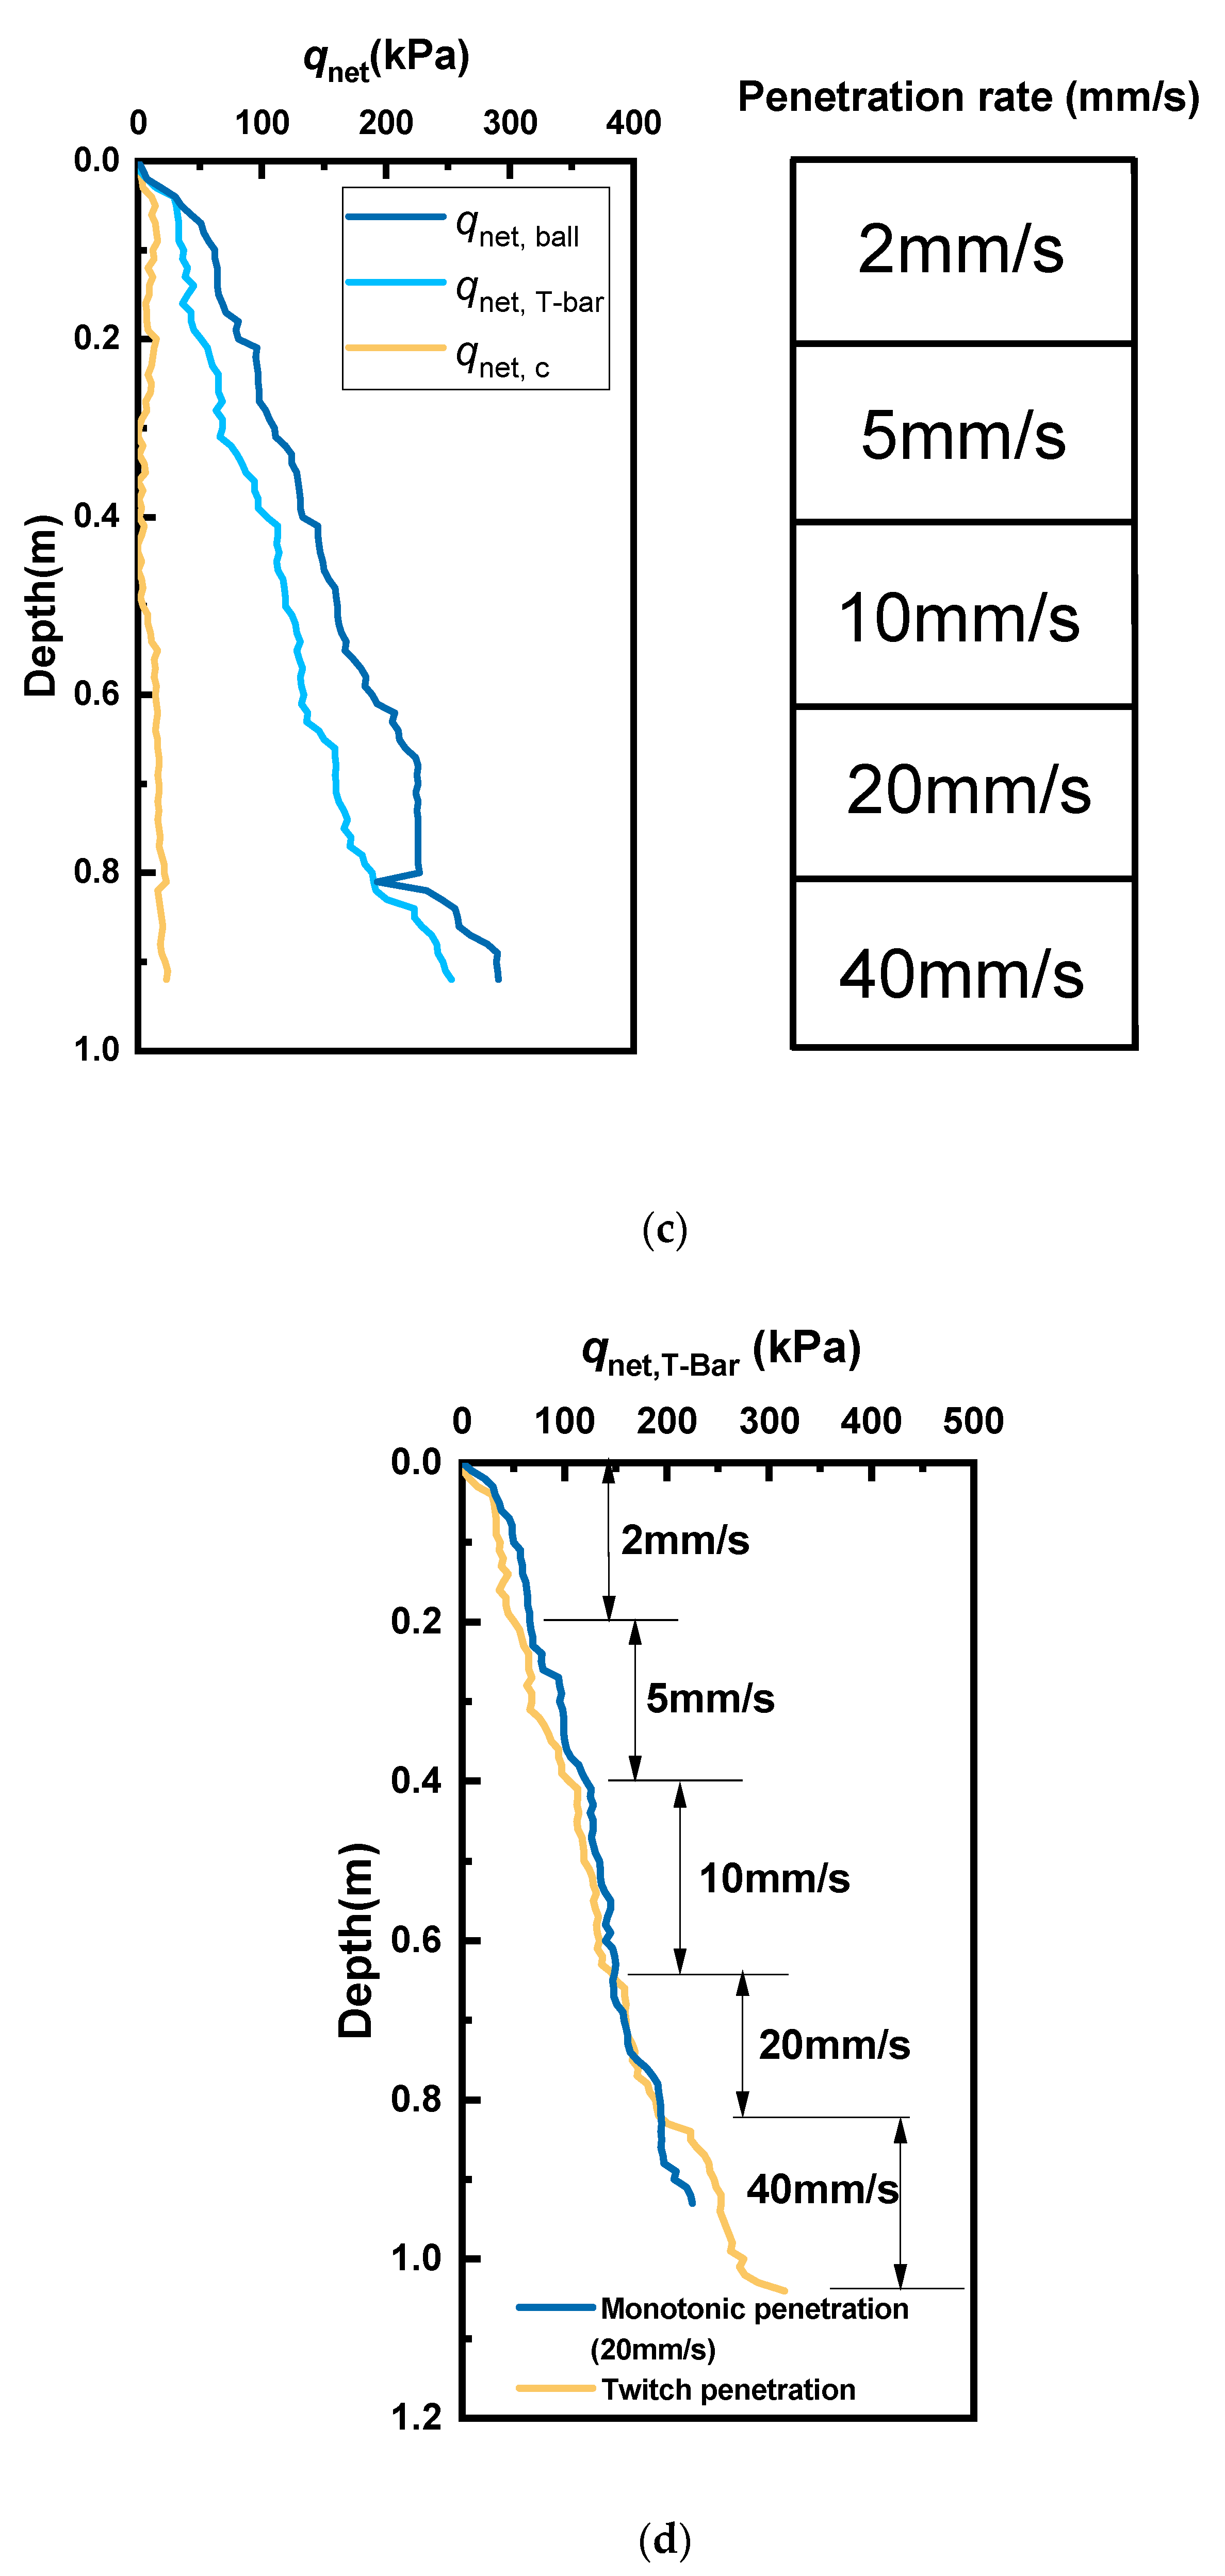
4.3. Full-Flow Penetrometer Tests in Underconsolidated Clay
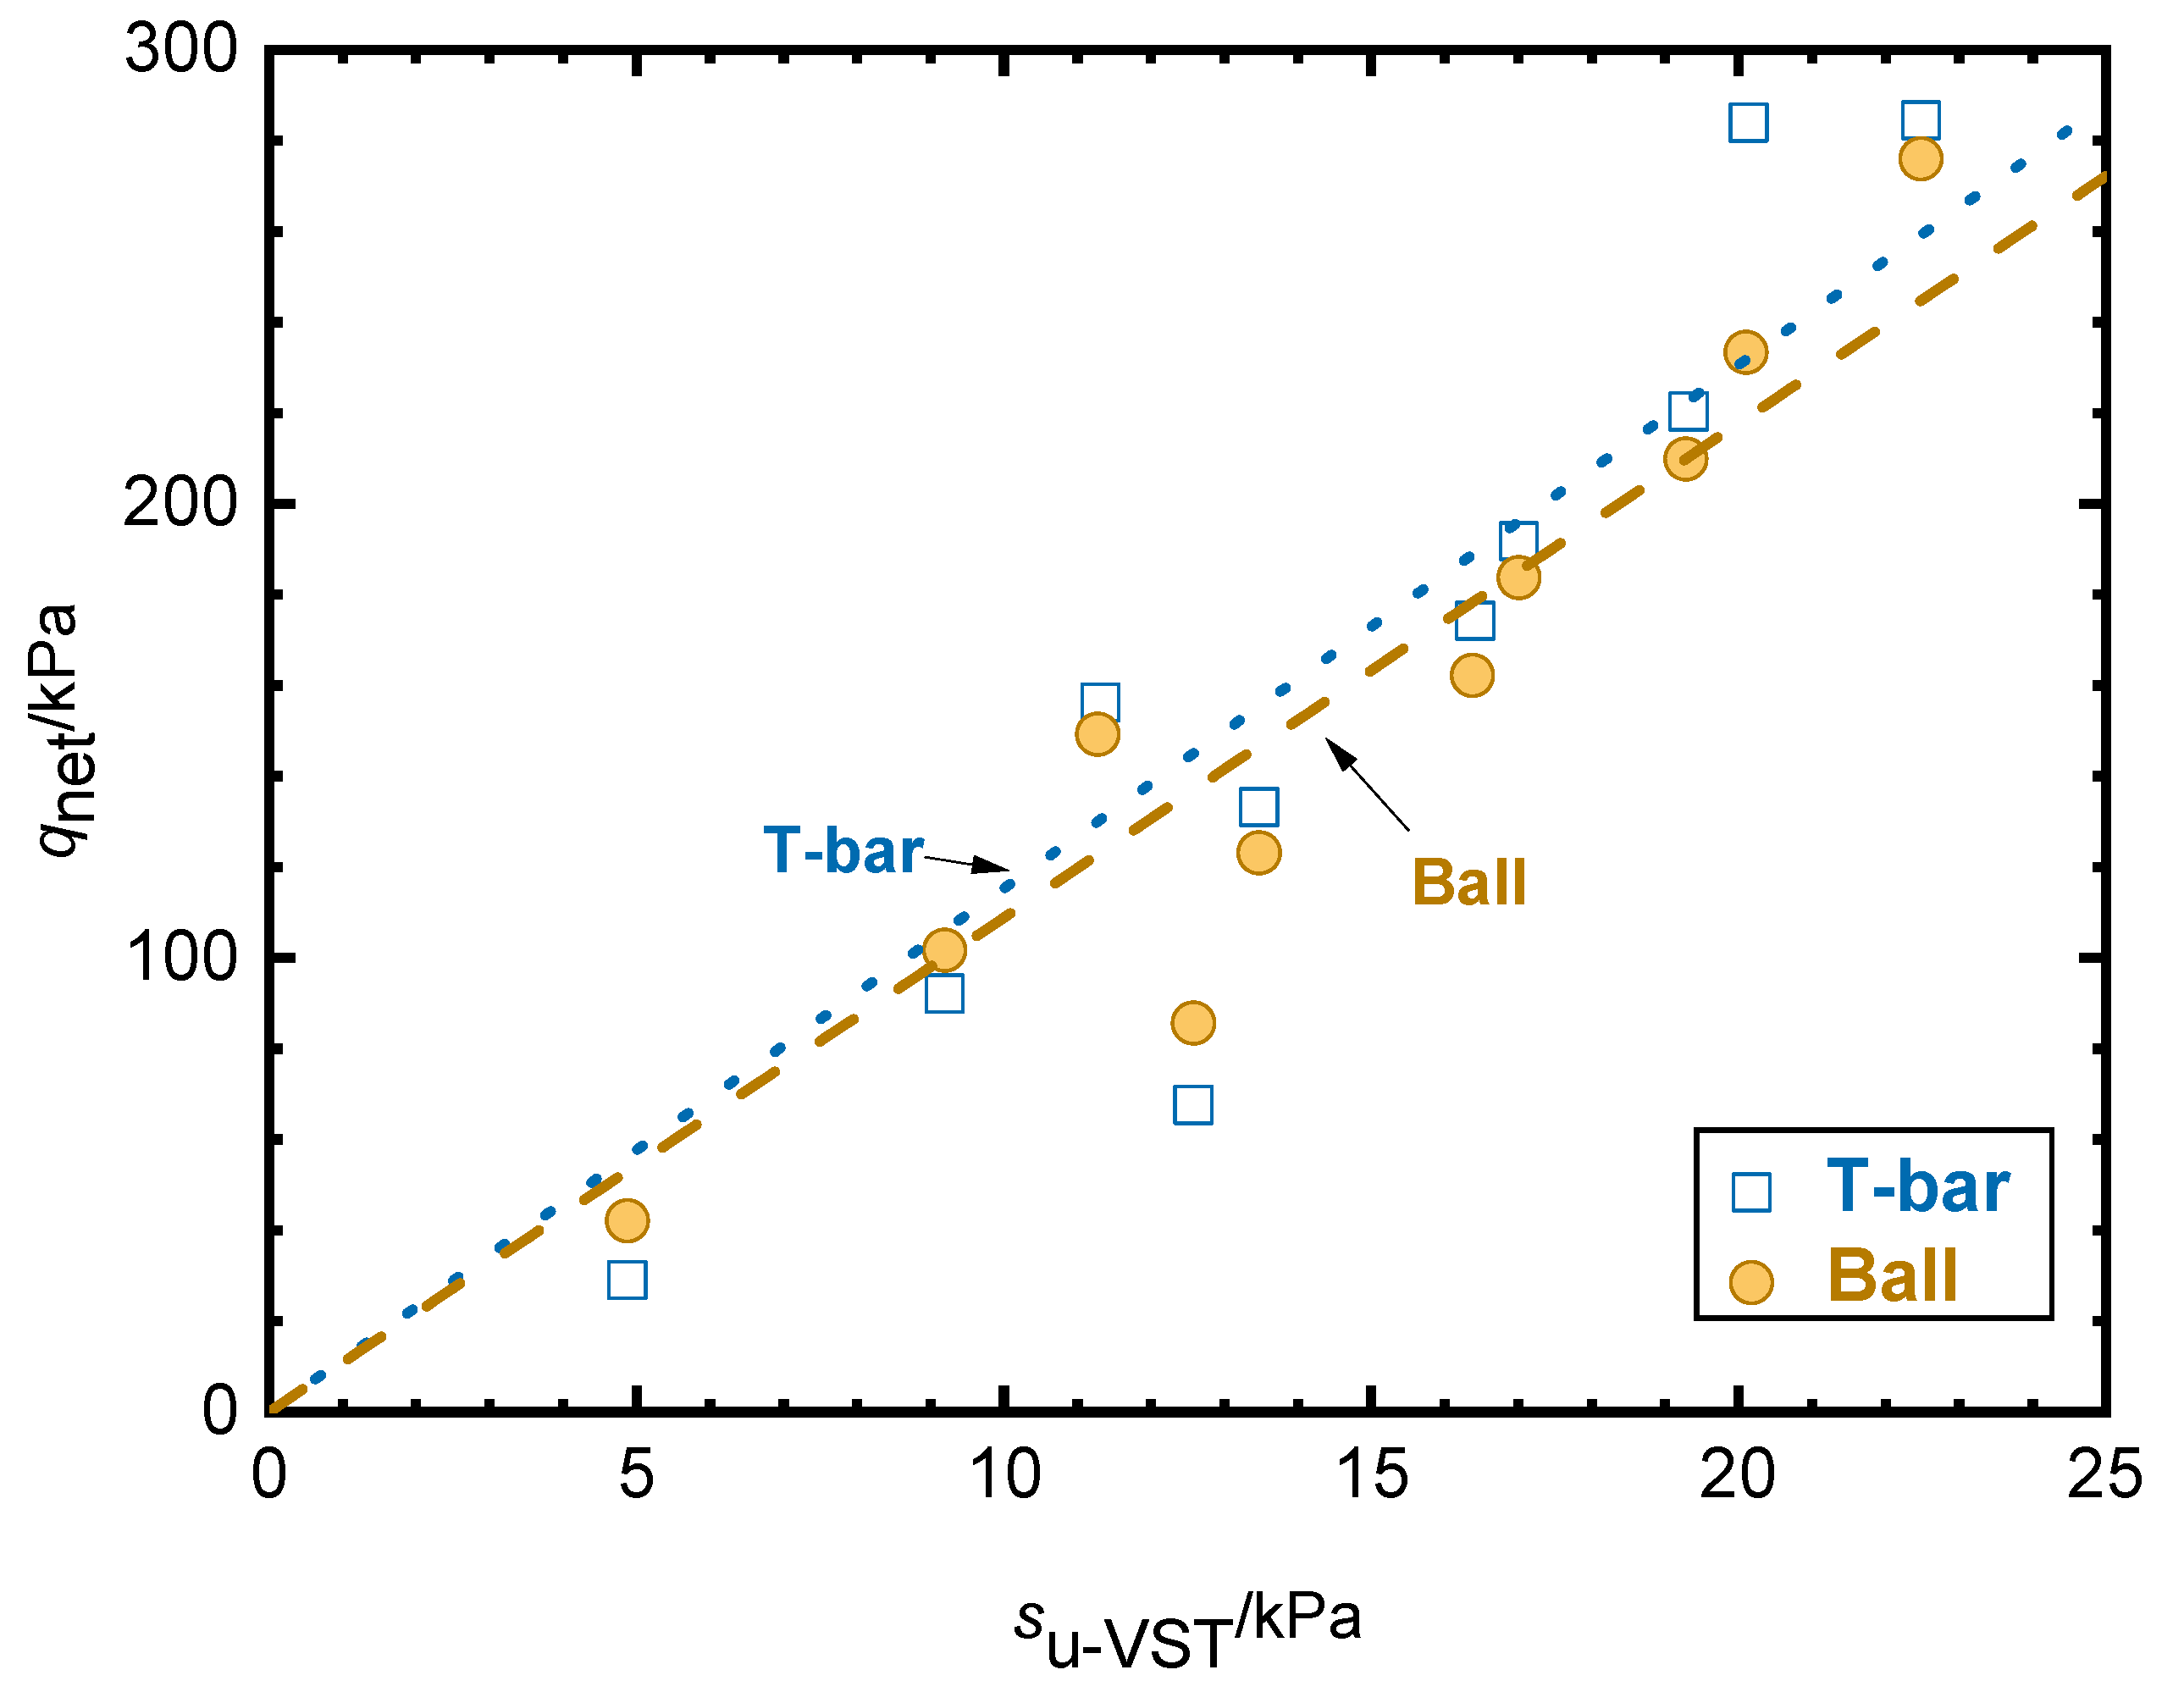
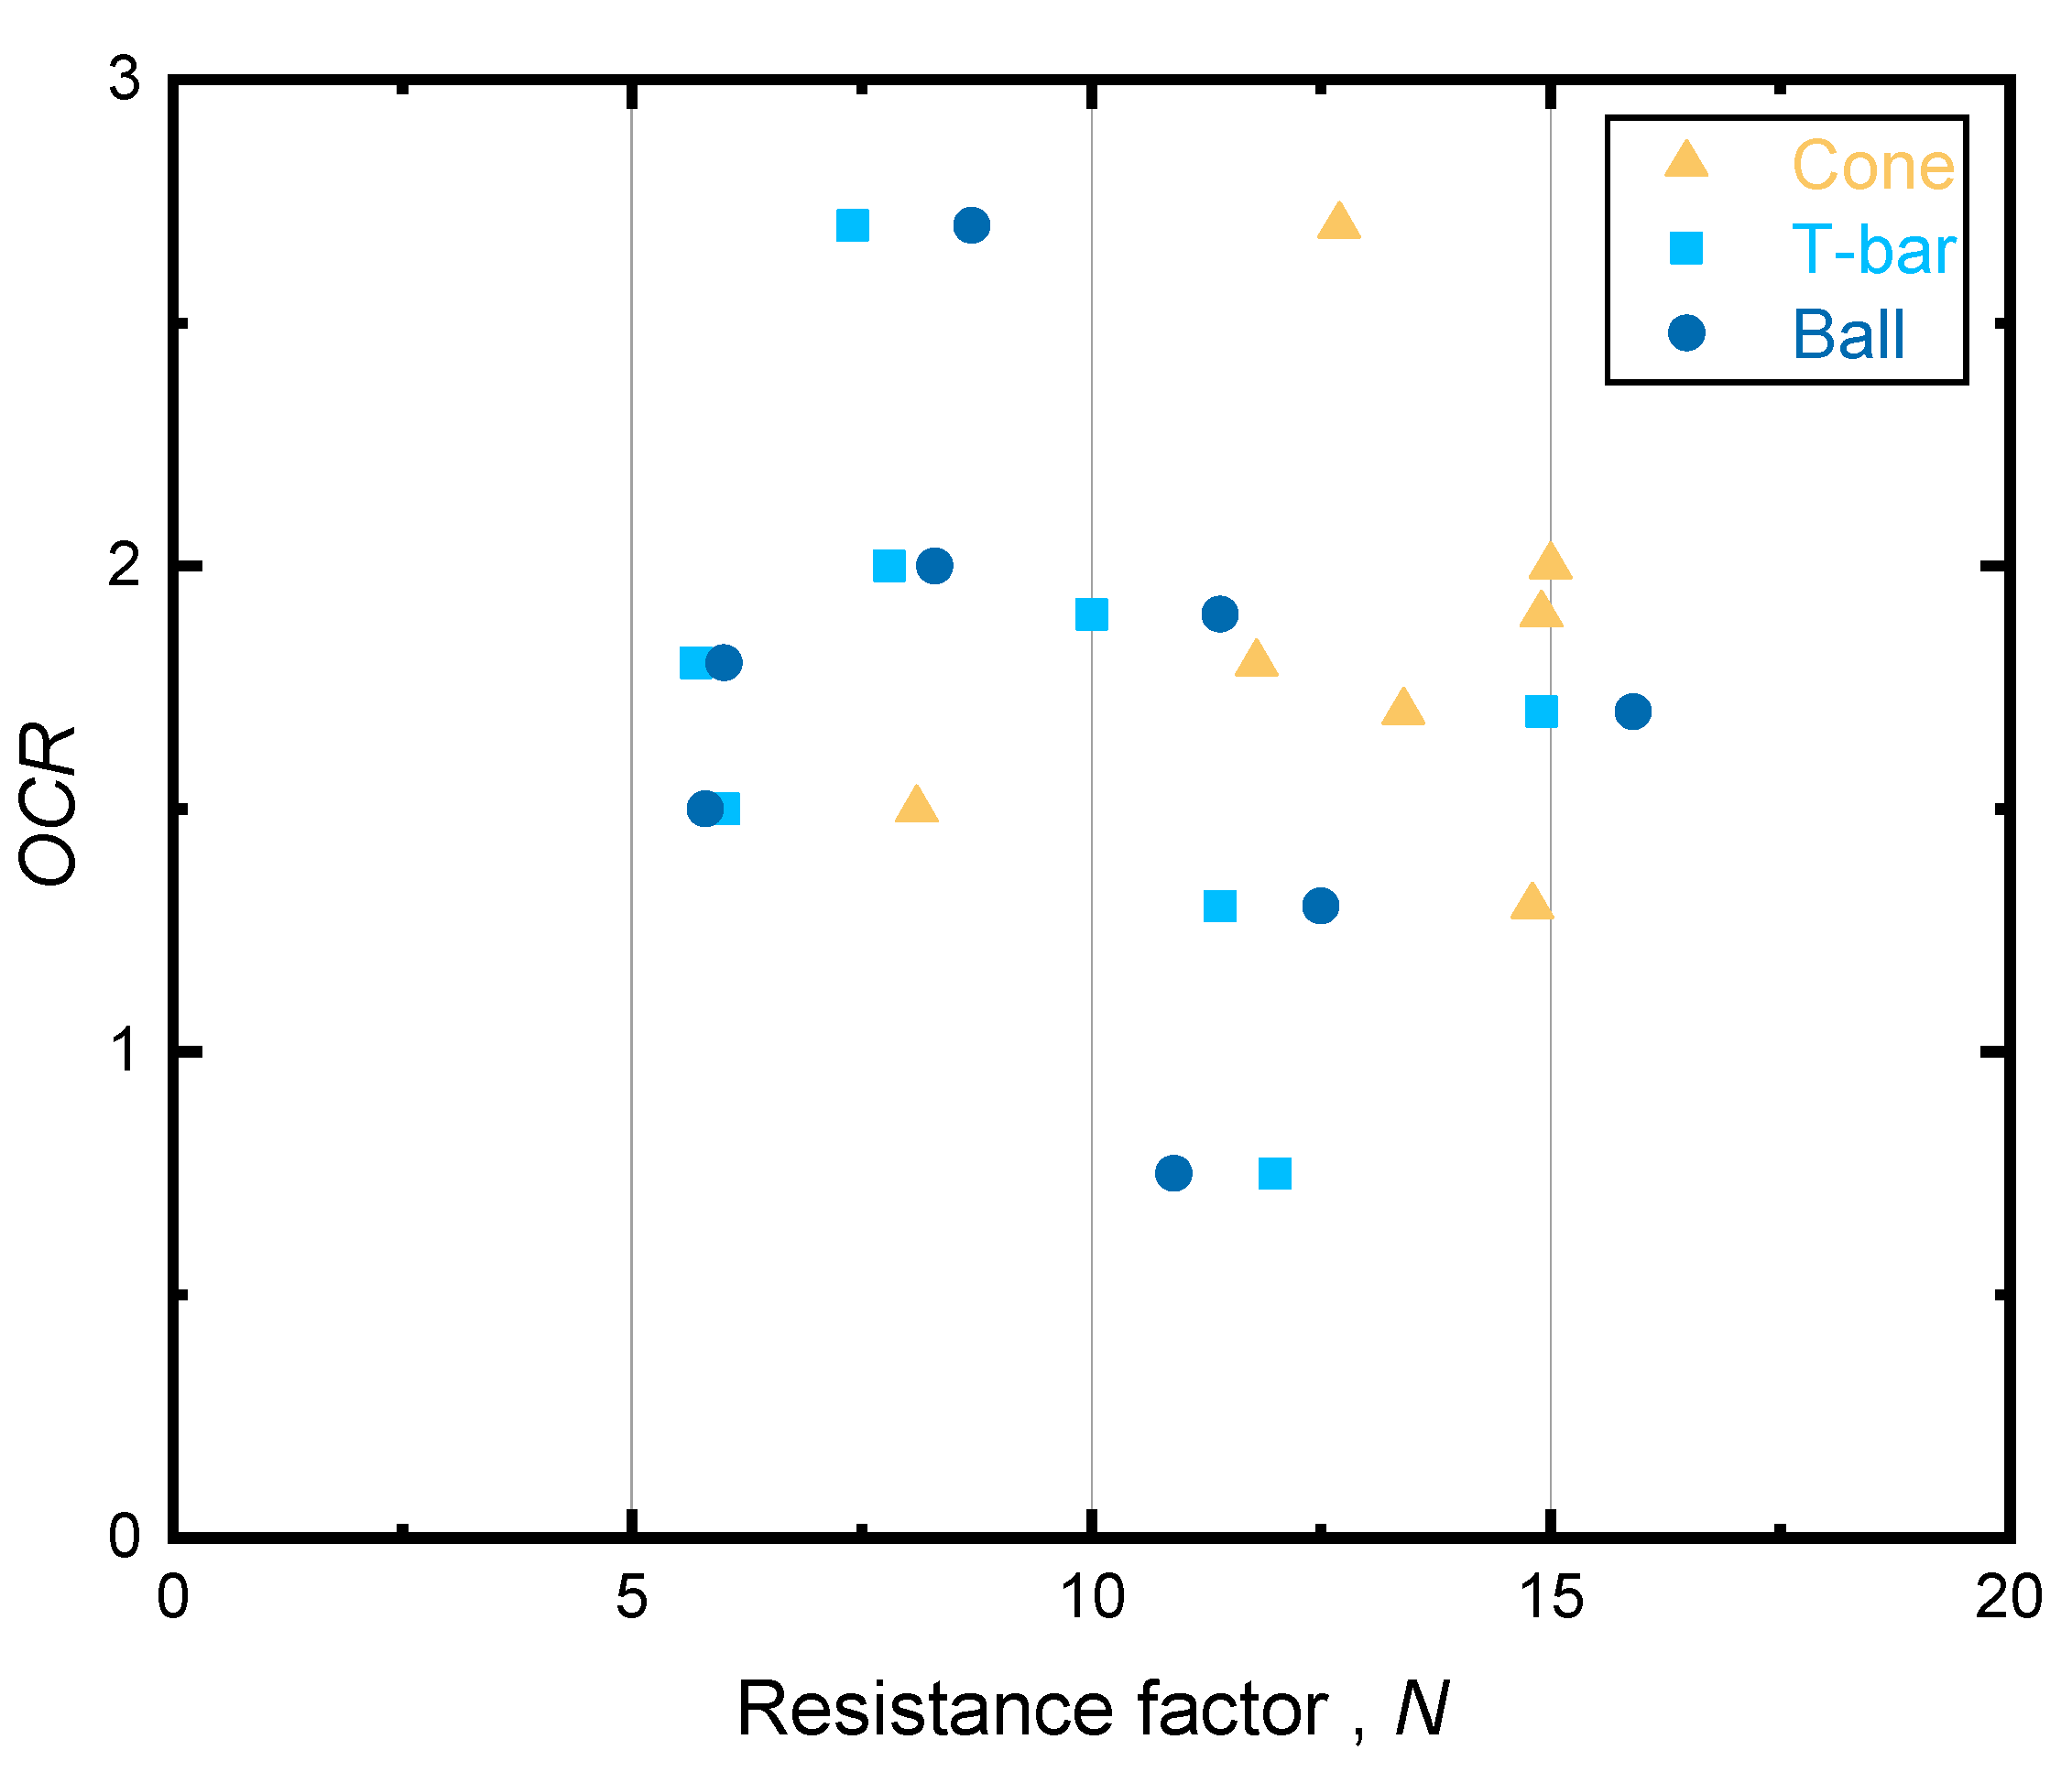
- Determination of resistance factors N of full-flow penetrometers in underconsolidated clay using strength data of VST
- 2.
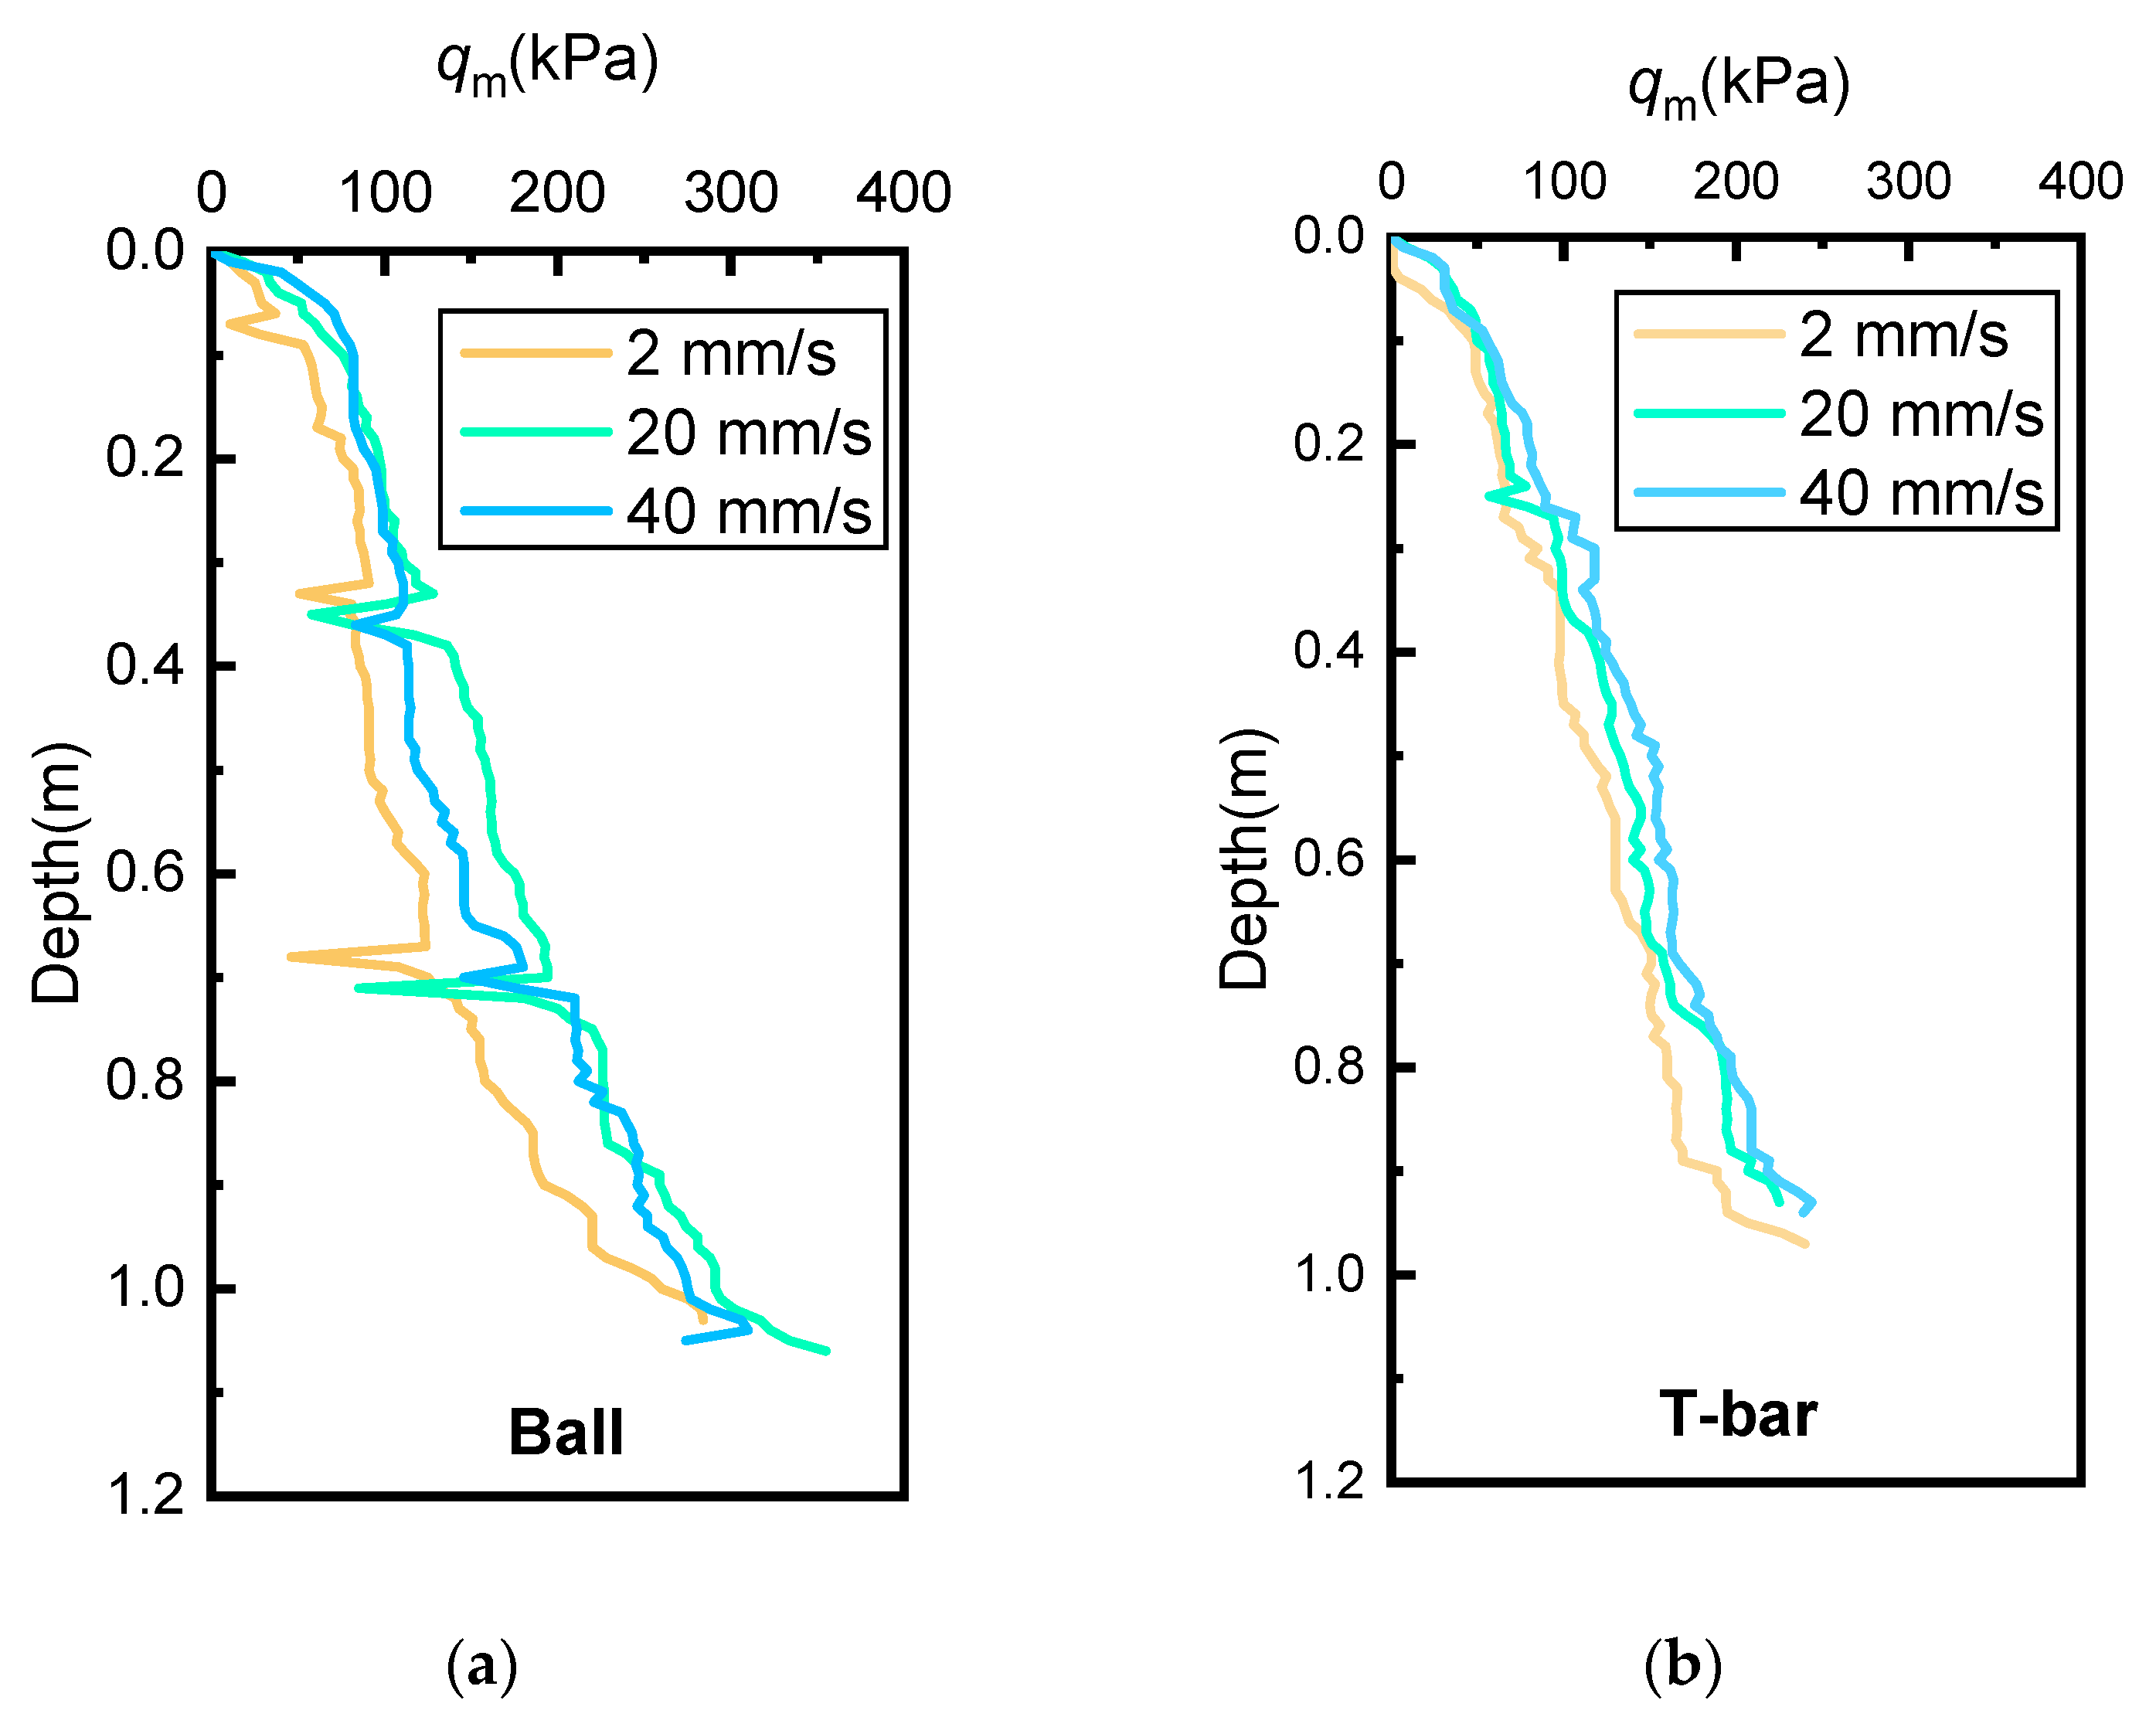
- Variable rate monotonic penetration testing
- 3.
- Twitch penetration testing
5. Conclusions
- The strength of underconsolidated clay is too low to be measured accurately by conventional piezocone. The Ball penetrometer produces slightly greater penetration resistance (10–20%) than that of the T-bar penetrometer in the underconsolidated clay, and the correction for the Ball and T-bar both are far less significant than that for the cone, which is similar to that in normally consolidated clay.
- Using VST data as the reference strength, the values of the penetration resistance factors, N, for full-flow penetrometer in underconsolidated clay, are recommended as values of 10.9, and 12.0, respectively, for Ball and T-bar penetrometer, which both are within the recommended value range of normally consolidated clay;
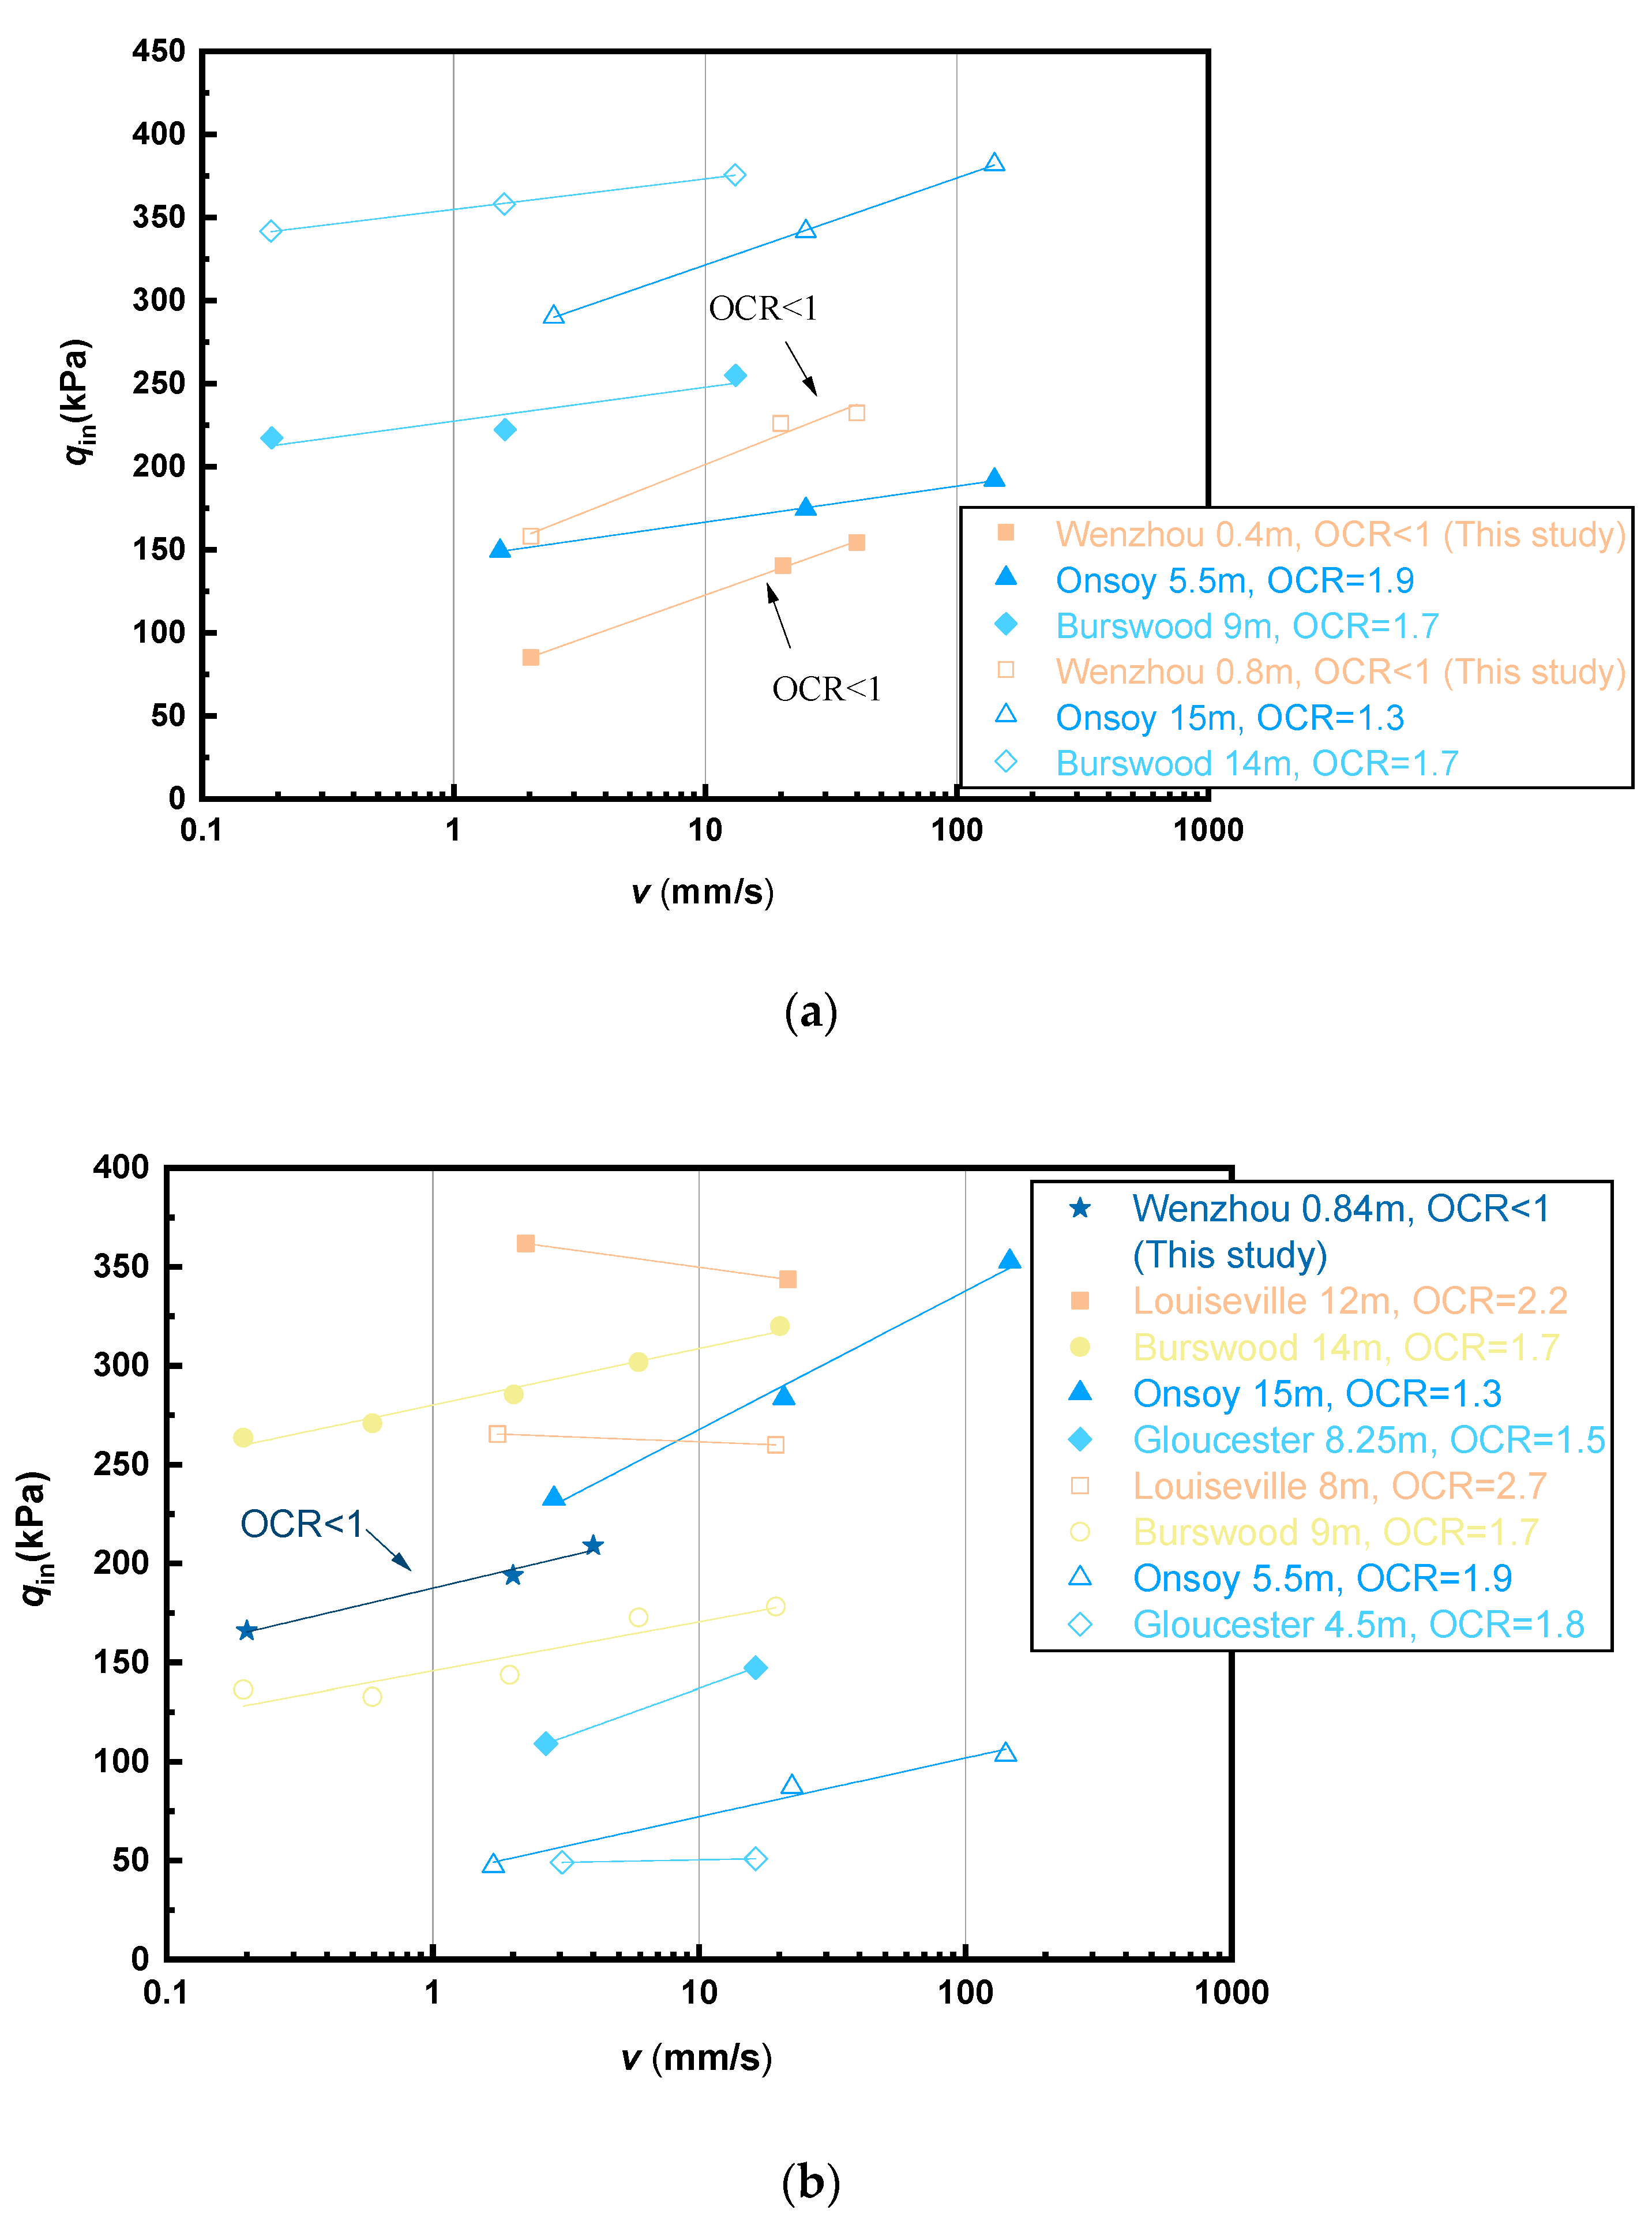
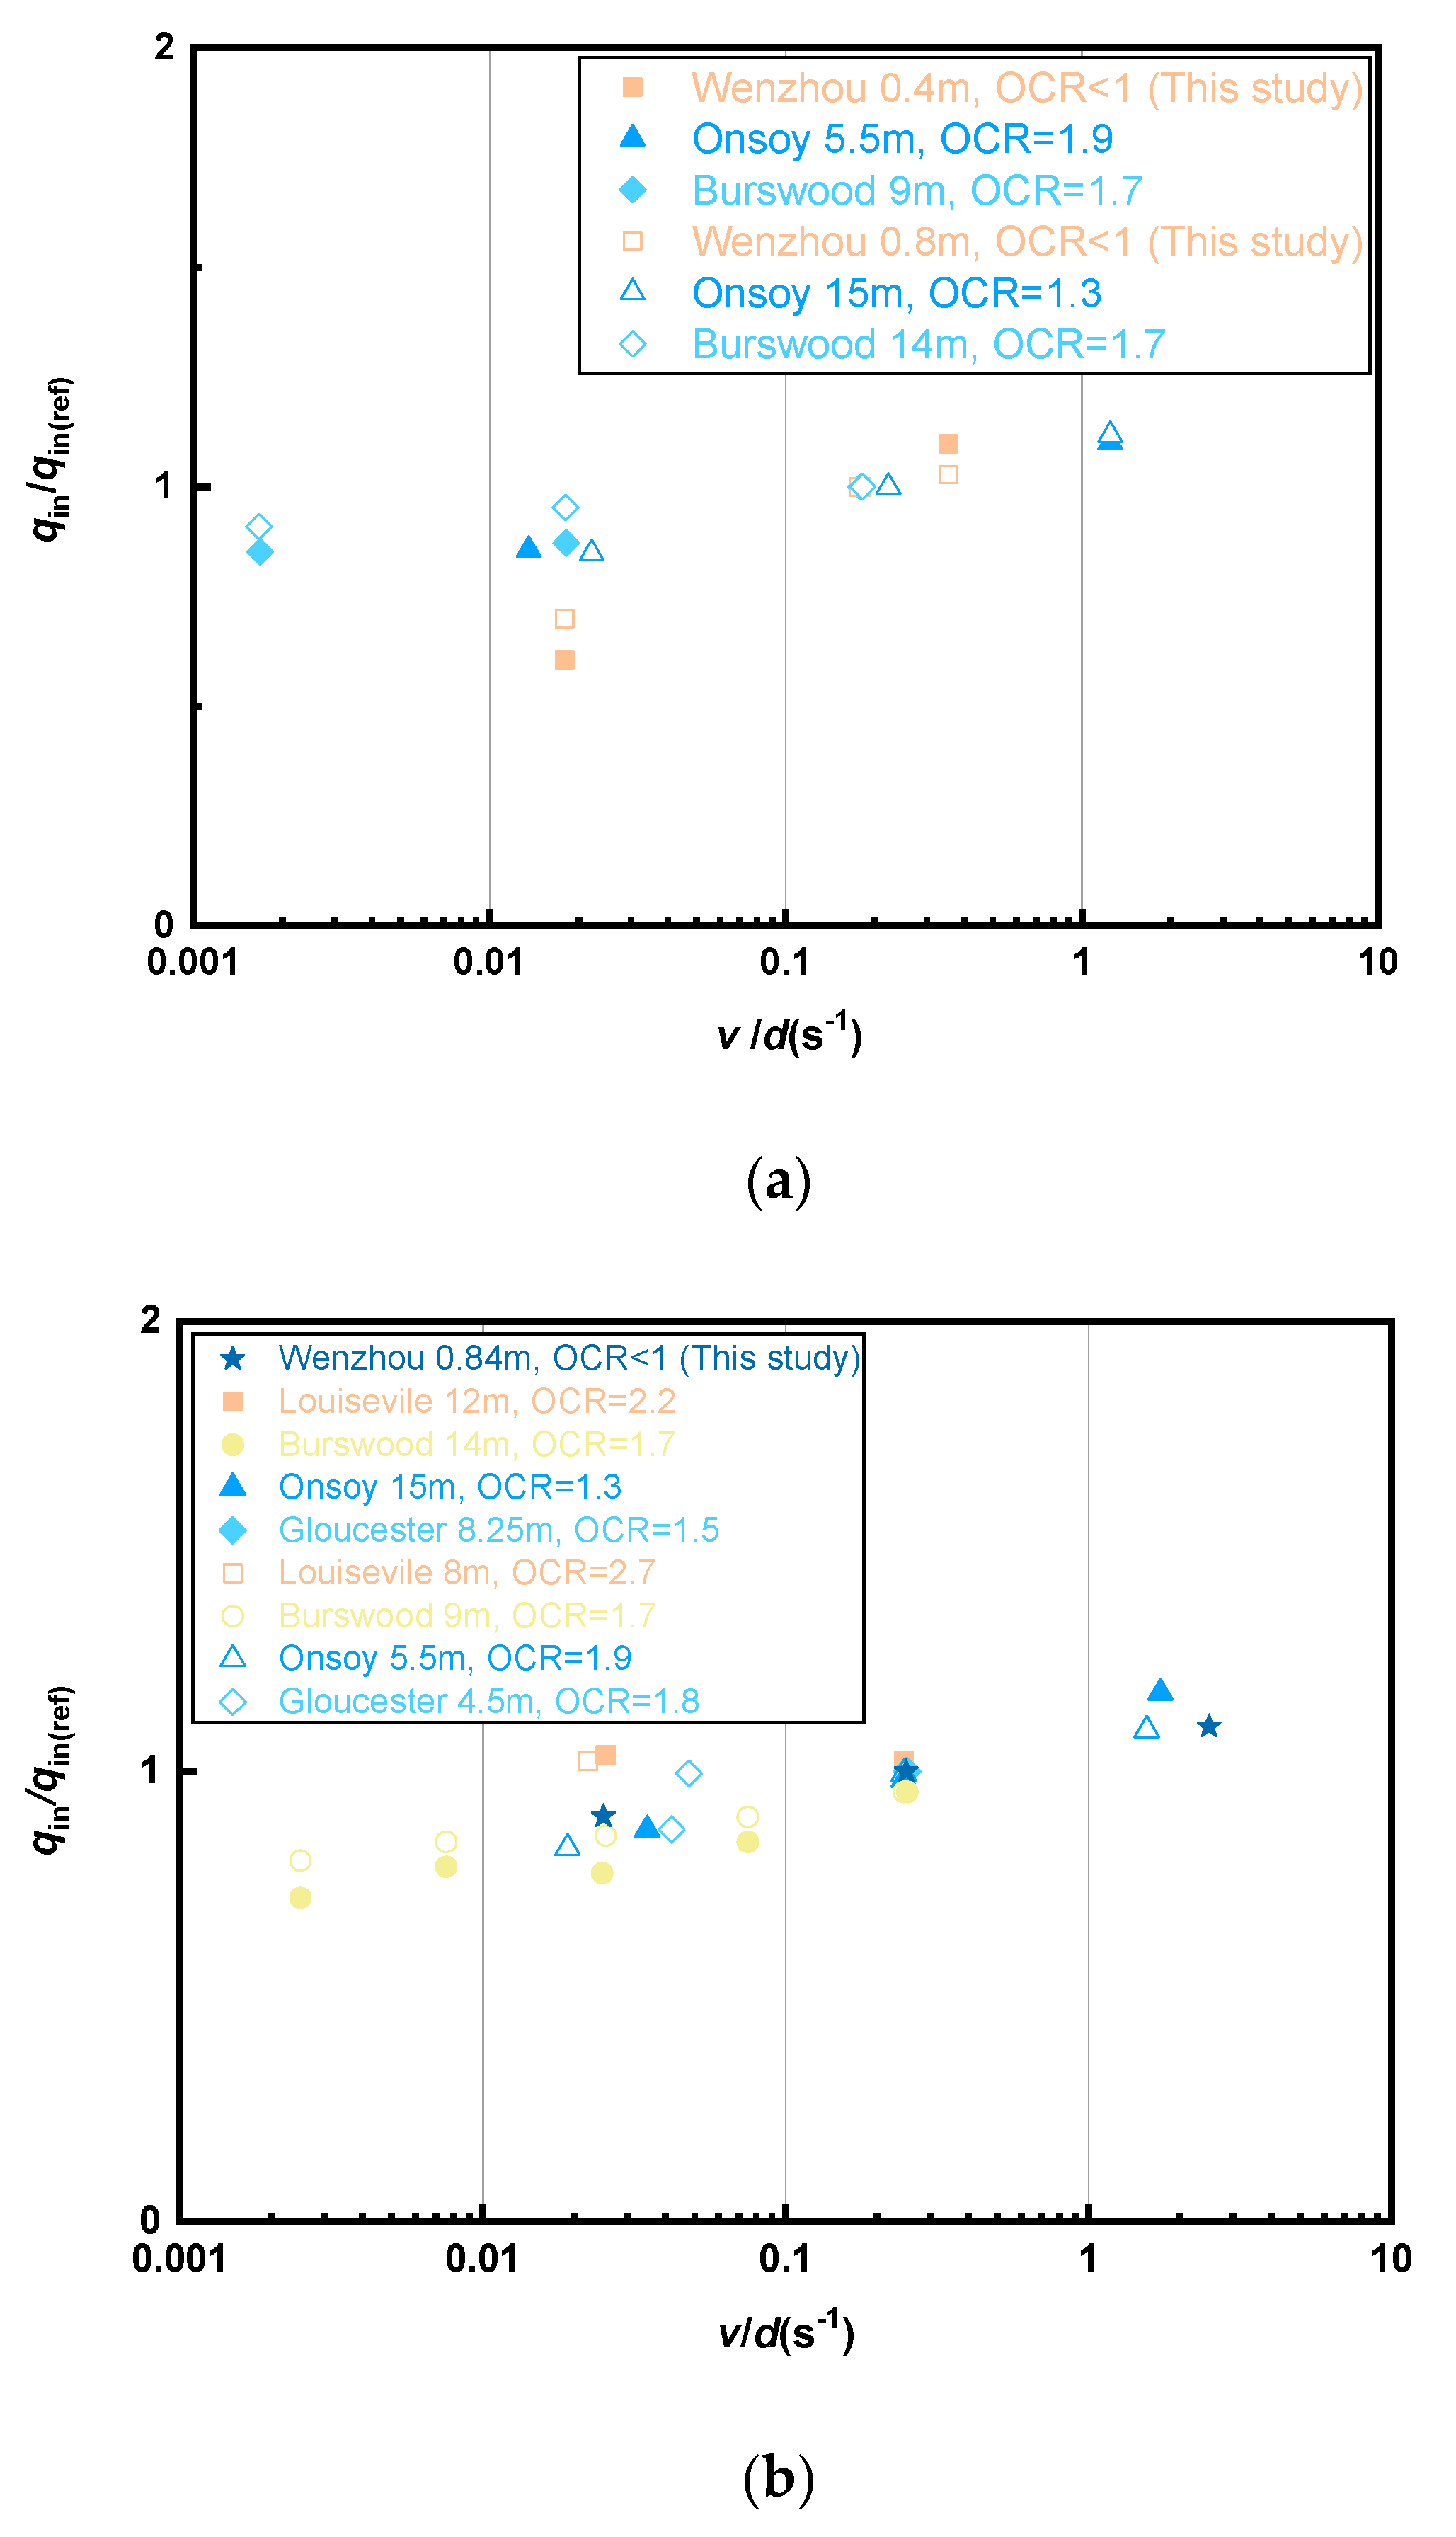
- Under undrained conditions, like in normally consolidated and overconsolidated clay, there was a general trend of increasing penetration resistance with increasing penetration rate in underconsolidated clay. Considering the influence of the consolidation state of the soil, one modified semi-logarithmic equation relating the penetration rate to the resistance penetration is applied, and the rate factor, μ, for Ball and T-bar penetrometer with this test condition is 0.113 and 0.117, respectively, with the relatively minor influence of rate-dependency behavior;
- The rate effect on penetration resistance for full-flow penetrometer in underconsolidated clay is lower than that in overconsolidated clay, which has implications for the penetration of the full-flow penetrometer in newly dredger fill. Therefore, caution should be exercised when extrapolating the penetration resistance of the full-flow penetrometer in underconsolidated clays for direct application in design.
Author Contributions
Funding
Institutional Review Board Statement
Informed Consent Statement
Data Availability Statement
Conflicts of Interest
References
- Liang, F.; Zhao, M.; Qin, C.; Jia, Y.; Wang, Z.; Yue, G. Centrifugal test of a road embankment built after new dredger fill on thick marine clay. Mar. Georesources Geotechnol. 2020, 38, 114–121. [Google Scholar] [CrossRef]
- Wang, W.; Liu, H.; Li, Y.; Su, J. Development and management of land reclamation in China. Ocean Coast. Manag. 2014, 102, 415–425. [Google Scholar] [CrossRef]
- Cai, Y.; Qiao, H.; Wang, J.; Geng, X.; Wang, P. Experimental tests on effect of deformed prefabricated vertical drains in dredged soil on consolidation via vacuum preloading. Eng. Geol. 2017, 222, 10–19. [Google Scholar] [CrossRef]
- Wang, J.; Fang, Z.; Cai, Y.; Chai, J.; Wang, P.; Geng, X. Preloading using fill surcharge and prefabricated vertical drains for an airport. Geotext. Geomembr. 2018, 46, 575–585. [Google Scholar] [CrossRef]
- Wang, J.; Gao, Z.; Fu, H.; Ding, G.; Cai, Y.; Geng, X.; Shi, C. Effect of surcharge loading rate and mobilized load ratio on the performance of vacuum–surcharge preloading with PVDs. Geotext. Geomembr. 2019, 47, 121–127. [Google Scholar] [CrossRef]
- Zheng, J.; Hu, X.; Gao, S.; Wu, L.; Yao, S.; Dai, M.; Liu, Z.; Wang, J. Undrained cyclic behavior of under-consolidated soft marine clay with different degrees of consolidation. Mar. Georesources Geotechnol. 2022, 42, 176–183. [Google Scholar] [CrossRef]
- Zhu, W.; Wang, J.; Zhuang, H. Influence of cyclic deviator stress and consolidation degree on permanent strain of “under-consolidated” marine sediment. Mar. Georesources Geotechnol. 2023, 41, 764–773. [Google Scholar] [CrossRef]
- Park, H.; Lee, S.-R.; Jee, S.-H. Cover Placement on Dredged Marine Clay Reclaimed Deposit. Mar. Georesources Geotechnol. 2014, 32, 38–61. [Google Scholar] [CrossRef]
- Stark, T.D.; Choi, H.; Schroeder, P.R. Settlement of dredged and contaminated material placement areas. I: Theory and use of primary consolidation, secondary compression, and desiccation of dredged fill. J. Waterw. Port Coast. Ocean Eng. 2005, 131, 43–51. [Google Scholar] [CrossRef]
- Stark, T.D.; Choi, H.; Schroeder, P.R. Settlement of dredged and contaminated material placement areas. II: Primary consolidation, secondary compression, and desiccation of dredged fill input parameters. J. Waterw. Port Coast. Ocean Eng. 2005, 131, 52–61. [Google Scholar] [CrossRef]
- Gu, C.; Wang, J.; Cai, Y.; Sun, L.; Wang, P.; Dong, Q.Y. Deformation characteristics of overconsolidated clay sheared under constant and variable confining pressure. Soils Found. 2016, 56, 427–439. [Google Scholar] [CrossRef]
- Rotte, V.M.; Sutar, A.A.; Patel, A.; Patel, A. Effect of various parameters on electrokinetic dewatering of saturated clay. In Proceedings of the Indian Geotechnical Conference 2019: IGC-2019, Surat, Gujarat, 19–21 December 2019; Volume III, pp. 183–194. [Google Scholar]
- Flora, A.; Gargano, S.; Lirer, S.; Mele, L. Effect of electro-kinetic consolidation on fine grained dredged sediments. Procedia Eng. 2016, 158, 3–8. [Google Scholar] [CrossRef]
- Cavallaro, A. The use of Cone Penetration Tests (CPT) for the study of the dynamic characteristics of the soils. In Proceedings of the IMEKO TC4 International Conference on Metrology for Archaeology a Cultural Heritage, Trento, Italy, 22–24 October 2020; pp. 242–247. [Google Scholar]
- Cavallaro, A. Dynamic characteristics of the soils by Cone Penetration Tests (CPT). In Proceedings of the 5th International Symposium on Cone Penetration Testing, CPT22, Bologna, Italy, 8–10 June 2022; pp. 311–316. [Google Scholar]
- Qiao, H.; Liu, L.; He, H.; Liu, X.; Liu, X.; Peng, P. The Practice and Development of T-Bar Penetrometer Tests in Offshore Engineering Investigation: A Comprehensive Review. J. Mar. Sci. Eng. Geol. 2023, 11, 1160. [Google Scholar] [CrossRef]
- Einav, I.; Randolph, M.F. Combining upper bound and strain path methods for evaluating penetration resistance. Int. J. Numer. Methods Eng. 2005, 63, 1991–2016. [Google Scholar] [CrossRef]
- Tanaka, Y.; Sakagami, T. Piezocone testing in underconsolidated clay. Can. Geotech. J. 1989, 26, 563–567. [Google Scholar] [CrossRef]
- Karakouzian, M.; Avar, B.B.; Hudyma, N.; Moss, J.A. Field measurements of shear strength of an underconsolidated marine clay. Eng. Geol. 2003, 67, 233–242. [Google Scholar] [CrossRef]
- Lunne, T.; Powell, J.J.; Robertson, P.K. Cone Penetration Testing in Geotechnical Practice; CRC Press: Boca Raton, FL, USA, 2002. [Google Scholar]
- Yafrate, N.J.; DeJong, J.T.; DeGroot, D.J. The influence of full-flow penetrometer area ratio on penetration resistance and undrained and remoulded shear strength. Proceedings of Offshore Site Investigation and Geotechnics: Confronting New Challenges and Sharing Knowledge, London, UK, 11–13 September 2007. [Google Scholar]
- Taukoor, V.; Rutherford, C. Displacement rate effects during T-bar cycling in remoulded Gulf of Mexico clay. Géotechnique 2017, 67, 553–557. [Google Scholar] [CrossRef]
- Mahmoodzadeh, H.; Boylan, N.; Randolph, M.; Cassidy, M. The Effect of Partial Drainage on Measurements by a Piezoball Penetrometer. Proceedings of 30th International Conference on Ocean, Offshore and Arctic Engineering, Rotterdam, The Netherlands, 19–24 June 2011; pp. 1007–1016. [Google Scholar]
- Ganesan, S.A.; Bolton, M.D. Characterisation of a high plasticity marine clay using a T-bar penetrometer. Underw. Technol. 2013, 31, 179–185. [Google Scholar] [CrossRef]
- Blight, G. A note on field vane testing of silty soils. Can. Geotech. J. 1968, 5, 142–149. [Google Scholar] [CrossRef]
- Matsui, T.; Abe, N. Shear mechanisms of vane test in soft clays. Soils Found. 1981, 21, 69–80. [Google Scholar] [CrossRef][Green Version]
- Flaate, K. Factors influencing the results of vane tests. Can. Geotech. J. 1966, 3, 18–31. [Google Scholar] [CrossRef]
- Schlue, B.F.; Moerz, T.; Kreiter, S. Influence of shear rate on undrained vane shear strength of organic harbor mud. J. Geotech. Geoenviron. Eng. 2010, 136, 1437–1447. [Google Scholar] [CrossRef]
- Chung, S.; Randolph, M. Penetration resistance in soft clay for different shaped penetrometers. In Proceedings of the 2nd International Conference on Site Characterization, Porto, Portugal, 19–22 September 2004; pp. 671–677. [Google Scholar]
- Nanda, S.; Sivakumar, V.; Hoyer, P.; Bradshaw, A.; Gavin, K.; Gerkus, H.; Jalilvand, S.; Gilbert, R.; Doherty, P.; Fanning, J. Effects of strain rates on the undrained shear strength of kaolin. Geotech. Test. J. 2017, 40, 951–962. [Google Scholar] [CrossRef]
- Sheahan, T.C.; Ladd, C.C.; Germaine, J.T. Rate-dependent undrained shear behavior of saturated clay. J. Geotech. Eng. 1996, 122, 99–108. [Google Scholar] [CrossRef]
- Lunne, T.; Andersen, K.H.; Low, H.E.; Randolph, M.F.; Sjursen, M. Guidelines for offshore in situ testing and interpretation in deepwater soft clays. Can. Geotech. J. 2011, 48, 543–556. [Google Scholar] [CrossRef]
- Lehane, B.; O’loughlin, C.; Gaudin, C.; Randolph, M. Rate effects on penetrometer resistance in kaolin. Géotechnique 2009, 59, 41–52. [Google Scholar] [CrossRef]
- Chung, S.F.; Randolph, M.F.; Schneider, J.A. Effect of penetration rate on penetrometer resistance in clay. J. Geotech. Geoenviron. Eng. 2006, 132, 1188–1196. [Google Scholar] [CrossRef]
- Guo, X.; Liu, X.; Zhang, H.; Shan, Z.; Sun, M. Improved predictive model for the strength of fluidized seabed sediments with rate effect characteristics by full-scale spherical penetrometer tests. Comput. Geotech. 2023, 161, 105535. [Google Scholar] [CrossRef]
- Sespeñe, S.M.; Choo, Y.W. Empirical factors for miniature cone and T-bar penetrometers for kaolin clay. KSCE J. Civ. Eng. 2019, 23, 4675–4686. [Google Scholar] [CrossRef]
- Mahmoodzadeh, H.; Randolph, M.F. Penetrometer testing: Effect of partial consolidation on subsequent dissipation response. J. Geotech. Geoenviron. Eng. 2014, 140, 04014022. [Google Scholar] [CrossRef]
- Zhu, B.; Dai, J.; Kong, D. Assess the effects of loading rate and interface roughness on T-bar penetration resistance. Soils Found. 2020, 60, 266–273. [Google Scholar] [CrossRef]
- Randolph, M.; Hope, S. Effect of cone velocity on cone resistance and excess pore pressures. In Proceedings of the Engineering Practice and Performance of Soft Deposits, Osaka, Japan, 1 January 2004; pp. 147–152. [Google Scholar]
- House, A.; Oliveira, J.; Randolph, M. Evaluating the coefficient of consolidation using penetration tests. Int. J. Phys. Model. Geotech. 2001, 1, 17–26. [Google Scholar] [CrossRef]
- Low, H.; Lunne, T.; Andersen, K.; Sjursen, M.; Li, X.; Randolph, M. Estimation of intact and remoulded undrained shear strengths from penetration tests in soft clays. Géotechnique 2010, 60, 843–859. [Google Scholar] [CrossRef]
- DeJong, J.T.; Yafrate, N.J.; DeGroot, D.J. Evaluation of undrained shear strength using full-flow penetrometers. J. Geotech. Geoenviron. Eng. 2011, 137, 14–26. [Google Scholar] [CrossRef]
- Cai, G.; Liu, S.; Tong, L.; Du, G. Field evaluation of undrained shear strength from piezocone penetration tests in soft marine clay. Mar. Georesources Geotechnol. 2010, 28, 143–153. [Google Scholar] [CrossRef]
- Low, H.; Randolph, M.; DeJong, J.; Yafrate, N. Variable rate full-flow penetration tests intact and remoulded soil. In Proceedings of the Geotechnical and Geophysical Site Characterization, London, UK, 1 January 2009; pp. 1087–1092. [Google Scholar]
- Bemben, S.; Myers, H. The influence of rate of penetration on static cone resistance in Connecticut river valley varved clay. In Proceedings of the European Symposium on Penetration Testing, Stockholm, Sweden, 5–7 June 1974; pp. 33–43. [Google Scholar]
- Davis, E.H.; Poulos, H. Rate of settlement under two-and three dimensional conditions. Geotechnique 1972, 22, 95–114. [Google Scholar] [CrossRef]


| Full-Flow Penetrometers (Full-Scale, Projected Area of 100 cm2) | Ball | T-Bar |
|---|---|---|
| Advantages |
|
|
| Disadvantages |
|
|
| System Design | Cone | Ball | T-Bar | |
|---|---|---|---|---|
| Specification | Dimensions | 35.7 mm diameter | 113 mm diameter | 250 mm × 40 mm (L × D) |
| Area ratio | 1:1 | 10:1 | 10:1 | |
| Pore water pressure measurement | Located at a connection between full-flow probe and push rods (conventional u2 filter measurement if CPTu mandrel is used); CPTu pore fluid and saturation procedures apply | |||
| Load cell calibration pore | Calibrated following CPT specifications | |||
| Load cell design | Calibrated for tension and compression following CPT specifications; report load cell sensitivity to temperature shift | |||
| Maximum sampling interval | ≤5 mm (2 Hz sampling frequency @ 2 cm/s penetration rate) | |||
| Halite | Illite | Chlorite | Illite–Smectite Mixed Layer | Quartz | Feldspar | Calcite | Kaolinite |
|---|---|---|---|---|---|---|---|
| 32% | 17% | 9% | 11% | 16% | 5% | 4% | 6% |
| Water content (%) | 109.4 |
| Relative density of particle | 2.73 |
| Unit weight (kN/m3) | 14.43 |
| Liquid limit (%) | 56 |
| Plastic limit (%) | 27 |
| Plasticity index (%) | 29 |
| Coefficient of consolidation, cv (cm2/s) | 3.09–7.37 × 10⁻³ |
| Void ratio | 2.37 |
| Saturation (%) | 99.6 |
| Test Method | Test Type | Test Sample Number | Penetrometer Type | Number of Tests |
|---|---|---|---|---|
| Vane shear test | Intact | VST1 | Vane | 4 |
| Remolded | VST2 | |||
| Penetrometer test | Variable rate monotonic penetration testing | CPT1 | Cone | 3 |
| CPT2 | ||||
| CPT3 | ||||
| BPT1 | Ball | 3 | ||
| BPT2 | ||||
| BPT3 | ||||
| TPT1 | T-bar | 3 | ||
| TPT2 | ||||
| TPT3 | ||||
| Twist penetration test | TCPT1 | Cone | 3 | |
| TBPT1 | Ball | |||
| TTPT1 | T-bar |
| Relationship | Type of Function | Drainage Condition | Consolidation State | Reference |
|---|---|---|---|---|
| Hyperbolic sine function | Undrained | Normally consolidated | Chung et al., 2006 [34] | |
| Semi-logarithmic function | Undrained | Normally consolidated and lightly overconsolidated | Yafrate et al., 2007 [21] | |
| Power law | Undrained | Normally consolidated and overconsolidated | Lehane et al., 2009 [33] |
| Depth (cm) | Undrained Shear Strength (kPa) | ||
|---|---|---|---|
| su | sur | st | |
| 0~10 | 4.9 | 3.2 | 1.53 |
| 10~20 | 12.6 | 5.1 | 2.47 |
| 20~30 | 9.2 | 4.8 | 1.92 |
| 30~40 | 13.5 | 5.5 | 2.45 |
| 40~50 | 11.3 | 6.9 | 1.64 |
| 50~60 | 16.4 | 7.4 | 2.22 |
| 60~70 | 17 | 8 | 2.13 |
| 70~80 | 19.3 | 10.1 | 1.91 |
| 80~90 | 20.1 | 10.2 | 1.97 |
| 90~100 | 22.5 | 12.1 | 1.86 |
| Test Sites, Country | Property | ||||
|---|---|---|---|---|---|
| Depth (m) | OCR | Nk, VST | NT-bar, VST | NBall, VST | |
| No. site 1: Burswood, Australia | 8.8 | 1.7 | 13.7 | 13.3 | 13.6 |
| 13.7 | 1.7 | 13.4 | 14.9 | 15.9 | |
| No. site 2: Onsoy, Norway | 5.4 | 1.9 | 14.9 | 10.0 | 11.4 |
| 15.2 | 1.3 | 14.8 | 11.4 | 12.5 | |
| No. site 3: Louiseville, Canada | 7.8 | 2.7 | 12.7 | 7.4 | 8.7 |
| 11.6 | 2 | 15.0 | 7.8 | 8.3 | |
| No. site 4: Gloucester, Canada | 4.4 | 1.8 | 11.8 | 5.7 | 6.0 |
| 8.3 | 1.5 | 8.1 | 6.0 | 5.8 | |
| No. site 5: Craney Island, USA | 10–30 | <1 | 15 | - | - |
| No. site 6: Wenzhou, China | 0.4 | <1 | - | 12.0 | 10.9 |
| (This study) | 0.8 | <1 | - | 12.0 | 10.9 |
| Penetrometer | Site, Country | Depth (m) | su, VST (kPa) | St | OCR |
|---|---|---|---|---|---|
| T-bar | Burswood, | 9.0 | 21 | 3 | 1.7 |
| Australia | 14.0 | 28 | 4 | 1.7 | |
| Gloucester, | 4.5 | 20 | 67 | 1.8 | |
| Canada | 8.5 | 34 | 85 | 1.5 | |
| Louiseville, | 8.0 | 40 | 18 | 2.7 | |
| Canada | 12.0 | 50 | 22 | 2.0 | |
| Onsoy, | 5.5 | 13 | 7 | 1.9 | |
| Norway | 15.5 | 27 | 6 | 1.3 | |
| Ball | Burswood, | 9.0 | 21 | 3 | 1.7 |
| Australia | 14.0 | 28 | 4 | 1.7 | |
| Onsoy, | 5.5 | 13 | 7 | 1.9 | |
| Norway | 15.5 | 27 | 6 | 1.3 |
| Parameter | Normally Consolidated and Overconsolidated Clay | Underconsolidated Clay (This Study) | ||
|---|---|---|---|---|
| Ball | T-Bar | Ball | T-Bar | |
| μ | 0.14 | 0.12 | 0.113 | 0.117 |
| a | 0.98 | 1.02 | 0.989 | 0.999 |
Disclaimer/Publisher’s Note: The statements, opinions and data contained in all publications are solely those of the individual author(s) and contributor(s) and not of MDPI and/or the editor(s). MDPI and/or the editor(s) disclaim responsibility for any injury to people or property resulting from any ideas, methods, instructions or products referred to in the content. |
© 2024 by the authors. Licensee MDPI, Basel, Switzerland. This article is an open access article distributed under the terms and conditions of the Creative Commons Attribution (CC BY) license (https://creativecommons.org/licenses/by/4.0/).
Share and Cite
Qiao, H.; Liu, X.; Zhou, R.; He, H.; Peng, P.; Jiang, Z. Influence of Penetration Rate on Full-Flow Penetrometer Resistance in Underconsolidated Clay. J. Mar. Sci. Eng. 2024, 12, 427. https://doi.org/10.3390/jmse12030427
Qiao H, Liu X, Zhou R, He H, Peng P, Jiang Z. Influence of Penetration Rate on Full-Flow Penetrometer Resistance in Underconsolidated Clay. Journal of Marine Science and Engineering. 2024; 12(3):427. https://doi.org/10.3390/jmse12030427
Chicago/Turabian StyleQiao, Huanhuan, Xuening Liu, Ruixian Zhou, Huan He, Peng Peng, and Zhen Jiang. 2024. "Influence of Penetration Rate on Full-Flow Penetrometer Resistance in Underconsolidated Clay" Journal of Marine Science and Engineering 12, no. 3: 427. https://doi.org/10.3390/jmse12030427
APA StyleQiao, H., Liu, X., Zhou, R., He, H., Peng, P., & Jiang, Z. (2024). Influence of Penetration Rate on Full-Flow Penetrometer Resistance in Underconsolidated Clay. Journal of Marine Science and Engineering, 12(3), 427. https://doi.org/10.3390/jmse12030427