1. Introduction
Global production of plastic materials has increased rapidly over the past 70 years, from less than 2 million metric tons (Mt) per year in 1950 to over 390 Mt in 2021, and that figure is projected to double by 2040 [
1,
2]. However, only an estimated 12% of the plastic waste produced has been incinerated, and around 9% has been recycled. The remaining 79% has either been disposed of in landfills or released into the natural environment, including the oceans [
3]. The plastic waste that enters the oceans, inadvertently or deliberately, makes up about 80% of marine litter and can now be found all over the world’s oceans [
4,
5,
6]; see also a long list of recent observational efforts in qualifying the plastic waste in the Pacific Ocean [
7], the Atlantic Ocean [
8,
9], the Indian Ocean [
10,
11], the Arctic Ocean [
12,
13,
14], and even in the previously thought to be pristine Southern Ocean and the water surrounding the Antarctic Peninsula [
15,
16,
17]. The increasing marine plastic litter has become a major global concern [
18], and the United Nations Environment Assembly (UNEA) has recognized the need to reduce environmental, economic, and human health impacts from marine litter as one of its top priorities through its four resolutions in 2014, 2016, 2017, and 2019, specifically calling for national, regional, and global actions to combat marine plastic litter.
The Wider Caribbean Region (WCR,
Figure 1), which comprises the insular and coastal states and territories with coasts on the Caribbean Sea and the Gulf of Mexico, as well as the waters of the North Atlantic Ocean adjacent to these states and territories, has one of the highest plastic concentrations in the world ocean [
19,
20]. According to the 2019 State of the Convention Area Report [
21], over 1 Mt of plastic waste was introduced to the coastal waters of the WCR in 2015, mainly from land-based sources. Plastic waste generation is expected to increase in the WCR region as human populations continue to grow and in the absence of more sustainable production, consumption patterns, and adequate solid waste management [
22]. Marine plastics are also transported to the coasts of the WCR by the large-scale North Atlantic Ocean circulation. Plastic pollution poses significant risks to public health and marine life, as well as to a variety of economic sectors, including tourism, fisheries, and shipping. Tourism in particular, as a major source of foreign exchange for many island states and territories, can be severely affected by plastic pollution [
21,
23]). Thus, there is an urgent need to strengthen our understanding of the oceanic and atmospheric circulations that move marine plastic litter, as well as the sources and movements of marine litter in this region [
24].
General features of the oceanic and atmospheric circulation in the WCR, or the driver for transporting marine plastic, are relatively well studied. The oceanic circulation in the Caribbean Sea (
Figure 2a) consists of the Caribbean Current that originates both in the subtropical gyre of the North Atlantic and in the upper limb of the thermohaline circulation from the tropical and South Atlantic [
25]; see also Johns et al. [
26] for a detailed observational estimate of the inflows through various gaps into the Caribbean Sea. Complicating this mean circulation of the Caribbean Sea, however, is a strong mesoscale eddy field that varies from intra-seasonal to interannual timescales [
25,
27,
28,
29]. The broad currents within the Caribbean Sea merge into a strong current through the Yucatán Channel, which then makes a loop (the Gulf of Mexico Loop Current) and occasionally sheds eddies before continuing its northward journey through the Florida Straits; see also an overview of the Loop Current and Loop Current eddies in the Gulf of Mexico [
30].
The atmospheric circulation over the WCR (
Figure 2b) is dominated by the descending branch of the Hadley cell, and the low-level flow is controlled by the trade winds (easterly) [
31]. The most striking feature of the near-surface wind is the Caribbean low-level jet (CLLJ), defined as an intensification of the easterly flow at 12–15° N and 75–70° W. The strength of the CLLJ has a marked seasonal cycle with a primary maximum in summer between July and August, a secondary peak between January and February, and a minimum in October, in relation to the position and intensity of the North Atlantic subtropical high. It also varies interannually in relation to the interannual variability of sea surface temperature [
32].
Most of our understanding of the motion of floating marine debris comes from numerical simulations [
33,
34,
35,
36,
37]. Given the scarcity of observational measurements, numerical models can be used to simulate the motions of debris and test scenarios. Chassignet et al. [
36] used a global model of marine plastic litter to quantitatively evaluate (1) where the marine litter released into the ocean by a given country goes and (2) where the marine litter found on the coastline of a given country comes from, on a global scale. The overall distribution of the modeled marine litter, found to be in good agreement with the limited observations at their disposal, illustrated how countries that are far apart are connected via a complex web of ocean pathways.
In this paper, we extend the global particle tracking simulation of Chassignet et al. [
36] to the WCR. Our overarching goals are to (a) track the movement of marine plastics in the WCR, (b) identify the hotspots where marine plastic litter accumulates, and (c) evaluate how these hotspots vary over different time scales in response to changes in the oceanic as well as atmospheric circulation. The paper is organized as follows. In
Section 2, we provide a summary of the method we use to simulate the movement of marine plastic. The key results are presented in
Section 3, i.e., identification of the hot spots of the marine plastic accumulations, impact of the seasonal variability, and quantification of the uncertainty associated with the seeding strategies. In
Section 4, we examine the impact of the beaching criterion on the distribution of mismanaged plastic waste (MPW) in the WCR, and finally, the findings are summarized in
Section 5.
2. Methods
In this section, we describe the numerical model framework, including (a) the Lagrangian tracking tool and the input fields for the surface ocean circulation and the wind, as well as (b) the MPW sources, (c) decaying MPW mass, and (d) the setup of the experiments used to address the above goals.
- (a)
Model description
The global and regional framework to track marine plastic waste in this study follows Chassignet et al. [
36]. OceanParcels (Probably a Really Computationally Efficient Lagrangian Simulator) v2.3.2 [
38], a state-of-the-art Lagrangian analysis tool, along with ocean surface current and near-surface wind, are used to simulate/track the two-dimensional (2D) movement of particles that represent the marine plastic wastes in the ocean near-surface layer. The trajectories of these particles are evaluated by integrating the Fokker–Planck equation:
where
is the position (longitude, latitude) of a particle,
is the 2D advecting velocity field (a combination of ocean current and wind-wave effects),
K is the horizontal diffusion coefficient, and
W is a Wiener increment with a zero mean (random walk). The latter two terms of Equation (1) are added to represent unresolved turbulent motions, with a spatially uniform diffusion coefficient
K of 1 m
2/s, similarly to Chassignet et al. [
36]. Equation (1) is integrated using a 4th-order Runge–Kutta scheme in OceanParcels.
The ocean surface velocity fields are obtained from version 3.1 of the global ocean forecasting system (GOFS3.1), a global ocean reanalysis based on the HYbrid Coordinate Ocean Model (HYCOM) and the US Navy Coupled Ocean Data Assimilation (NCODA) [
39,
40]. The NCODA uses a three-dimensional variational scheme and assimilates available altimeter observations, satellite and in situ sea surface temperature, as well as in situ vertical temperature and salinity profiles from eXpendable BathyThermographs (XBTs), Argo floats, and moored buoys [
41]. The horizontal resolution of GOFS3.1 is 1/12° (which is ~8 km in the WCR) and the output frequency is 3 h; see Metzger et al. [
42] for more details on the validation of the ocean circulation model and Chi et al. [
43] for a quantification of its performance.
The movement of marine plastic waste is also impacted by the near-surface wind through multiple processes: Ekman motion, Stokes drift, and windage. The Ekman transport (resulting from surface wind stress under the influence of the Coriolis force) is already included in the ocean surface velocity fields of GOFS3.1. The Stokes drift induced by surface gravity waves in the direction of wave propagation, however, is assumed to act in the same direction as the wind and can be combined with the windage. A drag coefficient of 1% (of the wind speed) is adopted to represent the joint effect of windage and Stokes drift on transporting marine plastic waste near the surface. While this is clearly an overly simplified approach, existing studies are consistent with each other, and the magnitude of the combined wind/Stokes drift coefficient does not differ much: 0.5–1.2% in Pereiro et al. [
44] and 0.6–1.3% in Ardhuin et al. [
45]. The surface wind is from the 3-hourly US NAVY Global Environmental Model (NAVGEM [
46]) of the Fleet Numerical Meteorology and Oceanography Center, the same atmospheric product that is used to force the GOFS3.1 reanalysis.
- (b)
Sources of mismanaged plastic waste
Marine litter enters the ocean from land-based sources, either directly from the coastal environment [
47,
48] or through rivers [
49,
50,
51,
52,
53], and from different types of sea-based sources such as aquaculture, shipping, and fishing activities [
54,
55,
56]. There are a lot of uncertainties about the spatial/temporal distributions and magnitude of sea-based marine plastic waste. In this study, we prescribe only land-based marine macro-plastic waste and do not take into account sea-based sources.
Jambeck et al. [
47] estimated the annual direct input of plastic waste from coastal environments into the ocean by considering the mass of waste generation per capita, the percentage of plastic waste, and the percentage of the waste that is mismanaged. From the 2010 World Bank dataset, they estimated that 4.8–12.7 Mt of mismanaged plastic waste made it to the ocean in 2010. Using the framework of Jambeck et al. [
47], Lebreton and Andrady [
48] generated a fine-resolution global distribution of mismanaged plastic waste and estimated an annual global input into the ocean from the coasts to be 3.1–8.2 Mt. In both these studies, the coastal region is defined as within 50 km from the coastline. The results of Lebreton and Andrady [
48] were used by Chassignet et al. [
36] and are used in this paper to estimate the direct input from the coastal region in the regional simulations.
Figure 3a displays the sources of plastic waste in the WCR from Lebreton and Andrady [
48]. A total of 0.312 Mt of plastic waste from the coastal regions enters the ocean annually in the WCR (note that there are no data available for Cuba).
The other major source of land-based marine plastic waste enters the ocean via rivers, and several studies have tried to quantify this input on a global scale. Lebreton et al. [
49], Schmidt et al. [
50], and Meijer et al. [
51] estimated a global annual input of 1.15–2.41 Mt, 0.41–4.0 Mt, and 0.8–2.7 Mt, respectively. Although these three estimates of total plastic river input are on the same order, the distribution among the rivers differs quite significantly. Lebreton et al. [
49] estimated that 20 top-ranked rivers account for about 67% of the total, Schmidt et al. [
50] estimated that 10 top-ranked rivers transport 88–95% of the global load, and Meijer et al. [
51] estimated that 1000 rivers account for 80% of the total. It is worth noting that there are large uncertainties associated with these estimates. Mai et al. [
52] estimated a global riverine input of 57–265 thousand tons, while Weiss et al. [
53] estimated an input of only a few thousand tons (see their
Table 1), which is 2–3 orders of magnitude lower than the values by Lebreton et al. [
49], Schmidt et al. [
50], and Meijer et al. [
51]. In the WCR, according to Lebreton et al. [
49], there are a total of 148 rivers that release more than 1 ton of plastic annually (total 0.027 Mts) (
Figure 3b). The top four rivers that release more than 1000 tons (i.e., Magdalena, Motagua, Orinoco, and Rio Colorado) account for near 80% of the riverine MPW inputs into the WCR, and the top 14 rivers that release more than 100 tons annually (listed in
Table 1) account for 96% of the total riverine MPW into the WCR. Both Chassignet et al. [
36] and this study are based on the estimates provided by Lebreton et al. [
49].
- (c)
Decay of MPW
When subjected to the combined impact of wave action and sunlight exposure, macroplastics tend to degrade into smaller parts. These tiny plastic pieces (on the order of nanometers to micrometers) can be suspended within the water column [
57], settle to the ocean floor [
58,
59,
60], be consumed by marine creatures [
61], or break down further [
62]. To incorporate these intricate processes, which decrease the magnitude of MPW at the sea surface, we utilize a simple exponential decay function to estimate the mass of plastic after an extended period at sea. From an initial estimated MPW at the initial time
, the decayed MPW is given by
where
is the time at sea, and τ is the e-folding timescale. Through testing and contrasting with recorded data [
36], τ is set to five years. This suggests that 36.8% of the MPW’s weight persists on the surface after five years, reducing to 13.5% after a decade.
- (d)
Lagrangian experiments
We integrate three Lagrangian experiments to address the goals outlined in the introduction. These experiments differ only in the MPW seeding strategy from every other setting, as in the global experiment of Chassignet et al. [
36]. The global experiment (the first of our three experiments and referred to as the GLB experiment hereafter) generated trajectories of marine litter from 32,300 particles (28,713 from the coast and 3587 from rivers) released globally every month for the time period between 2010 and 2021. As discussed in the previous section, those trajectories were initialized globally as a function of the magnitude of MPW at the coastlines [
48] and rivers’ outlets [
49]. To keep the number of particles manageable, the MPW inputs with less than 10 tons/year were neglected. In the WCR, there are 2006 MPW particles released each month from 2010 to 2021, representing an annual MPW mass of 0.305 Mt into the ocean from the 26 WCR countries.
Subsequent regional experiments were designed to obtain a more accurate representation of the plastic distribution in the WCR and to explore seasonal effects on plastic dispersion. In the first regional experiment (referred to as UNIFORM hereafter), 20,740 MPW particles are released each month from 2010 to 2021 (factor 10 in the number of MPW particles in the WCR when compared to GLB). The initial distribution of these particles is uniformly distributed (less than 2 km between particles) along the coastlines of 24 countries and 16 territories in the region. This uniform seeding allows us to determine hotspots that can be explained by the variability of the ocean and wind forcing alone and are independent of the geographical distribution of MPW associated with population density.
Of course, the human population and associated MPW in the WCR are not uniformly distributed along the coastlines, and this will impact the overall dispersion of trajectories in the region. In the second regional experiment (referred to as REALISTIC hereafter), particles of different weights are initialized in the WCR as a function of the MPW magnitude along the coastlines and at rivers’ outlets, similar to that in the global model but with a refined distribution. All sources of plastic (coastlines and rivers) larger than 1 ton/year are included in this regional model (compared to the 10 tons/year threshold in the GLB experiment).
The realistic MPW sources in the regional model are prescribed as follows. For the land-based plastic inputs, the MPW dataset from Lebreton and Andrady [
48] is binned to the 1/12° ocean model grid, and plastic at less than 50 km from the coastlines are considered coastal inputs. Then, as in Jambeck et al. [
47], we assume that 25% of the coastal MPW enters the ocean and is associated with the closest ocean grid cell, about 50 km from the coastline. For each ocean grid cell containing more than 1 tons/year of plastic, the number of particles injected each month is obtained as a discrete function of the magnitude of MPW as follows: 1 (4
0) particle is added for cells with MPW of 1–10 tons/year, 4 (4
1) particles are injected for cells with MPW of 10–100 tons/year, 16 (4
2) particles for cells with MPW of 100–1000 tons/year, 64 (4
3) particles for cells with MPW of 1000–10,000 tons/year, and 256 (4
4) particles for cells with MPW of 10,000–100,000 tons/year. In the WCR, the number of grid cells for each category is, respectively, 298 (0.39% of total mass), 465 (5.71% of total mass), 259 (26.83% of total mass), 54 (50.04% of total mass), and 3 (17.01% of total mass) for each of the previous categories, representing a total of 10,526 particles injected monthly. Similarly, the river-based MPW dataset is also binned to the 1/12° ocean model grid, and all grid cells with more than 1 ton/year are accounted for. The number of particles injected is based on the same discrete function used for the land-based plastic. In the WCR, 789 particles are injected monthly, accounting for more than 350 locations, where the top rivers are listed in
Table 1. The combined total number of MPW particles (11,315) in the WCR is more than 5 times that in GLB, representing an annual MPW mass of 0.339 Mt into the ocean from 26 WCR countries.
In addition to those released from the WCR countries, MPW particles also enter the WCR from countries outside of the region in the REALISTIC experiment. These MPW particles are based on GLB, and they enter the WCR from the north at 31° N and from the east at 51° W. During the 12 years of simulation, a total of 2,769,360 particles were injected at the boundaries. Thus, MPW particles from land-based sources, riverine sources, and the WCR boundaries are all advected over the same 2010–2021 period in the REALISTIC experiment.
3. Key Results
In this section, we describe the key results of the MPW simulations, with a focus on the characteristics of the MPW trajectories in the WCR, comparison between global and regional models regarding where the MPW goes and where it originates from, the major hotspots of MPW accumulations, and seasonal variability associated with the changes in ocean and atmospheric circulation.
- (a)
Characteristics of the simulated MPW trajectories in the WCR
To obtain a qualitative, visual account of how the MPW moves within the WCR,
Figure 4 displays a snapshot of the modeled trajectories on 2013-02-20 for the MPW particles that were released on 2013-01-01 in the WCR from the three experiments. The pattern of the particle trajectories is similar, which comes as no surprise since all three experiments are driven by the same ocean/atmospheric circulation data. In all three experiments, the 10-day trajectories shown in
Figure 4 depict the swift surface current in the Caribbean Sea, through the Yucatán Channel, and through the Florida Straits after a loop at the southeast open of the Gulf of Mexico (see
Figure 2a for the time averaged surface current). The larger number of released MPW particles in the two regional experiments (by a factor of 5 in REALISTIC and 10 in UNIFORM when compared to GLB,
Figure 4b,c, respectively) does, however, provide more details on the circulation pattern than the global counterpart (
Figure 4a).
Another feature of the simulated MPW trajectories visible in
Figure 4 is that many particles beach quickly after being released from the coast. Here, we define a particle as beached if it is spatially stationary on the coast (the sensitivity of the model results to the beaching criteria is discussed in
Section 4). The number of MPW particles that are beached as a function of time after they are released into the ocean is shown in
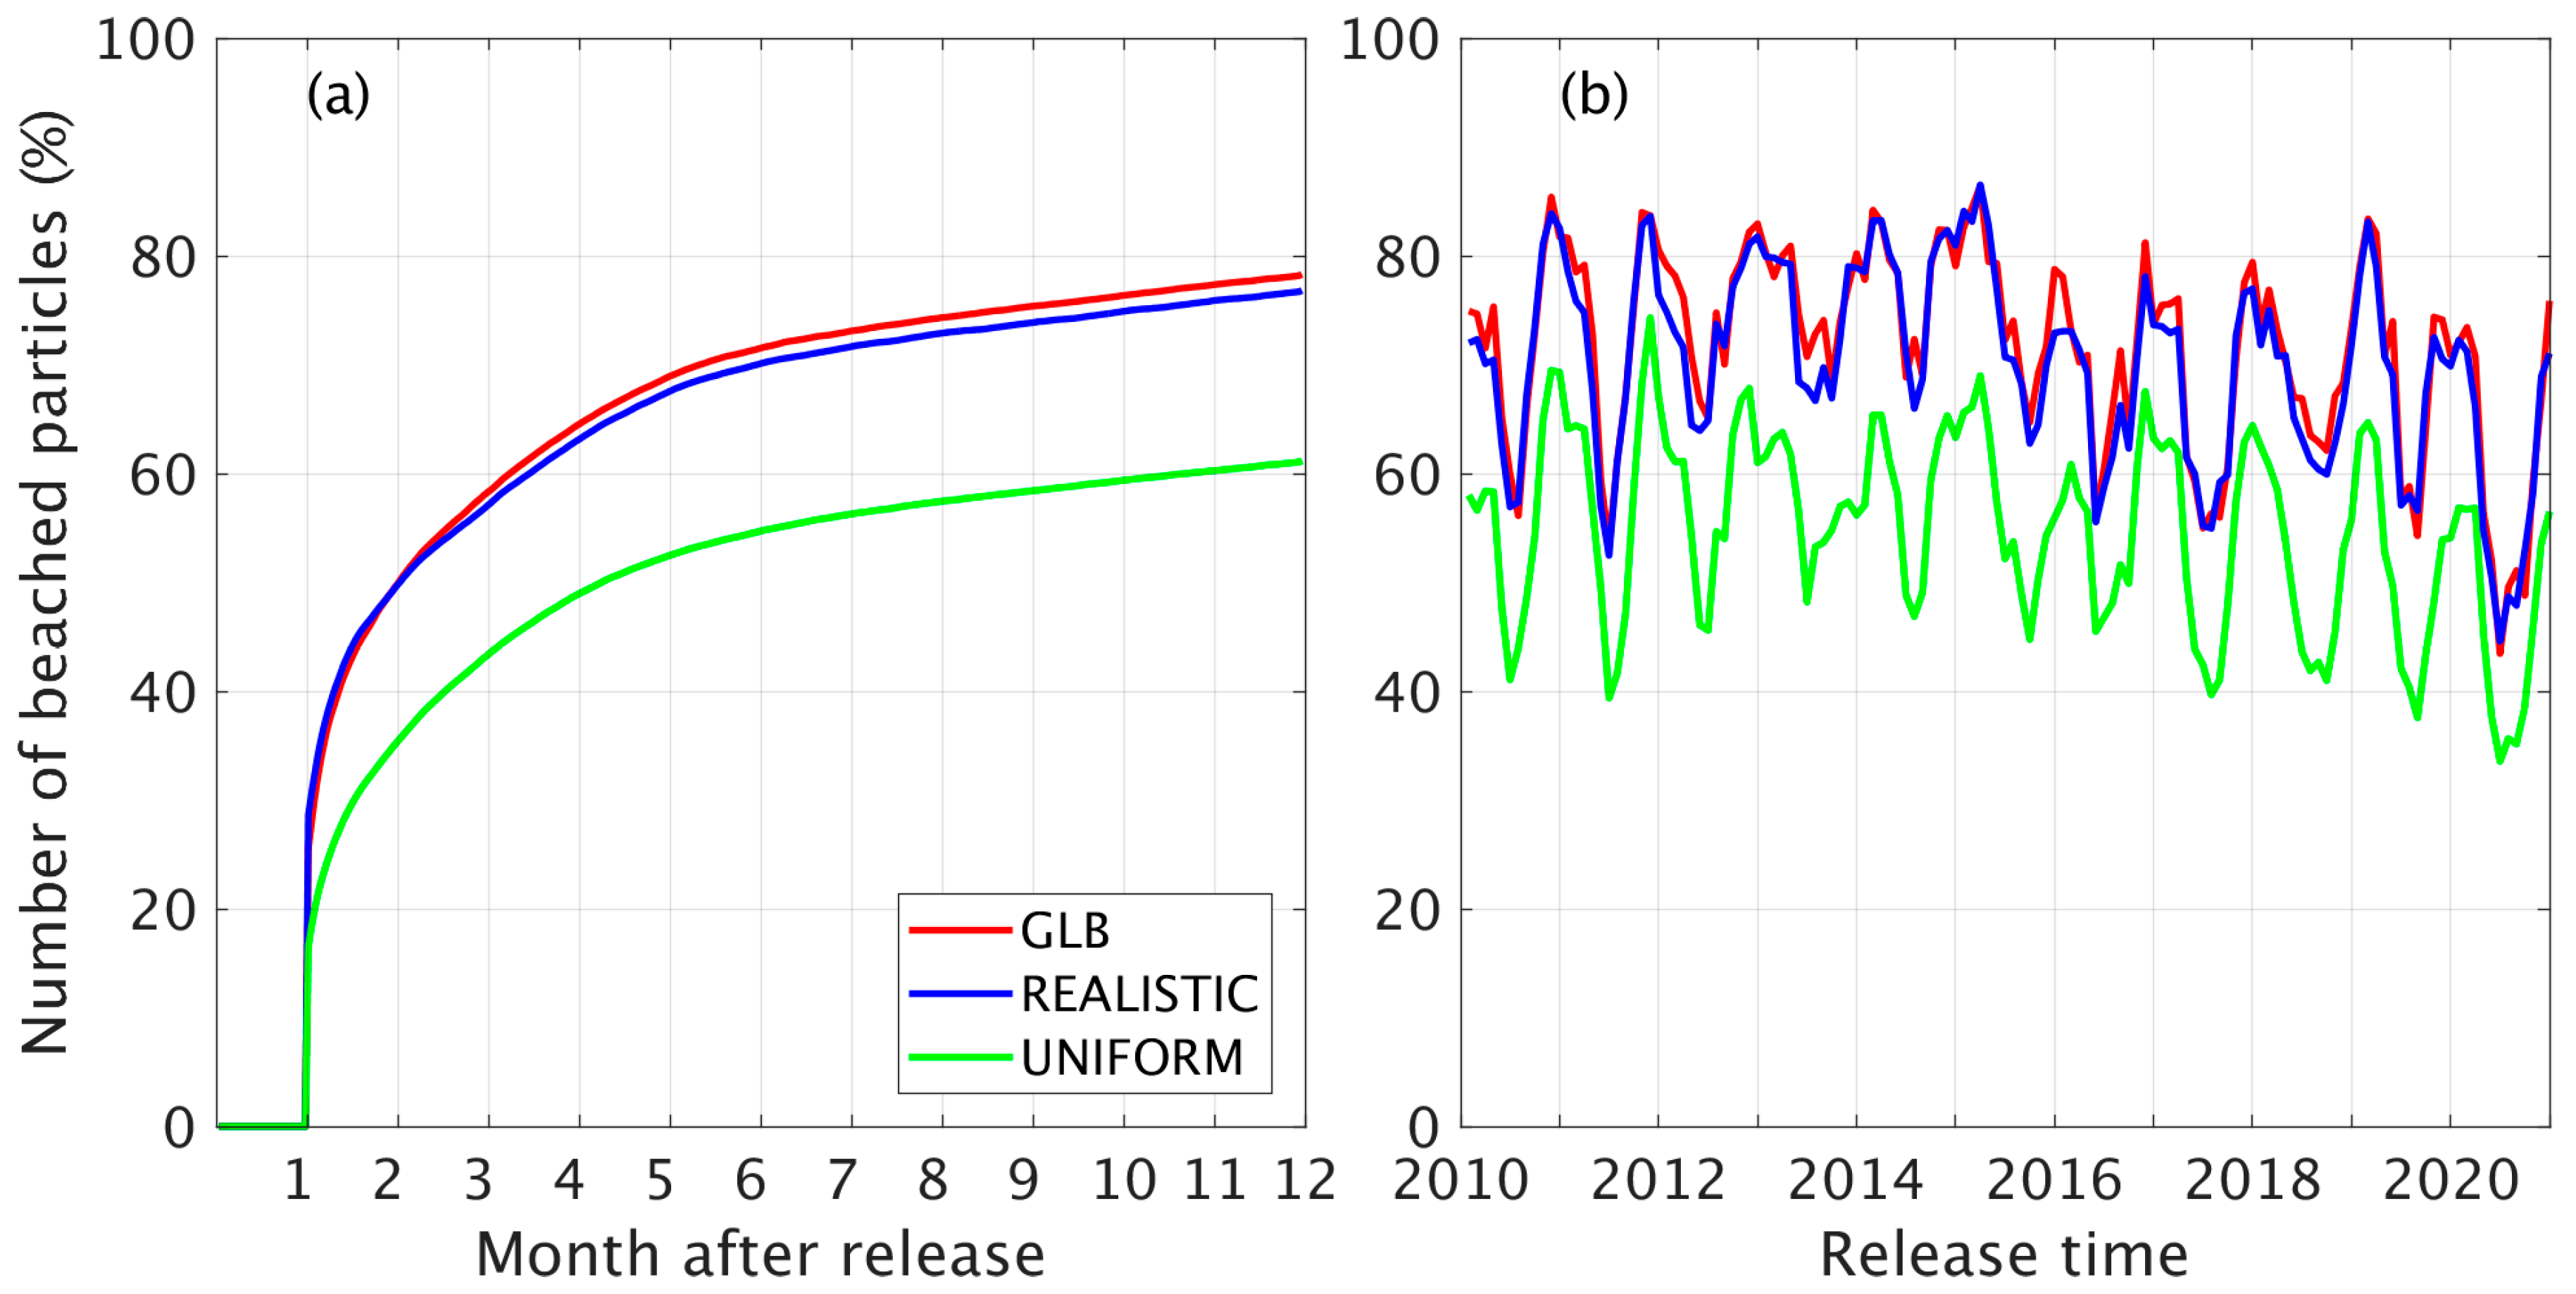
Figure 5a. On average, about half of the particles in the GLB and REALISTIC experiments are beached approximately 2 months after their release into the WCR, and that number increases to ~70% at 6 months and close to 80% at 1 year. The number of beached particles increases at a significantly slower pace after 6 months, presumably because many of the unbeached particles have been transported out of the WCR domain. Also, while the GLB and REALISTIC experiments show a similar percentage of beached particles, the percentage value of beached particles is significantly lower in the UNIFORM experiment, suggesting that the initial distribution of particles impacts where the particles end up.
The number of beached particles can be examined in further detail by looking at their dependence on the specific time of release.
Figure 5b displays the percentage of beached particles 6 months after their release from 2010 to 2020. Notably, there is a significant seasonal variability in the percentage of beached particles for all three experiments. Furthermore, although the uniform distribution of the particles (in UNIFORM) leads to a lower percentage of beached particles, the temporal variability of the percentage is similar to the other two experiments. This implies that the variability is due to the ocean/atmospheric circulation, which is not surprising because there is no time variability in the MPW sources. Finally, there is little difference between the GLB and REALISTIC, implying that the results are not very sensitive to the number of released particles.
Overall, the results in
Figure 4 and
Figure 5 show that the MPW particles either move quickly out of the WCR or are beached (the majority). The latter is consistent with the fact that the WCR is one of the highest beached MPW concentration regions of the world ocean [
20]. The main goal of this paper is to identify where the beached MPWs accumulate (hotspots) and whether/how the accumulation varies over time.
- (b)
Comparison of the regional REALISTIC experiment with the global model simulation
The main objective of the REALISTIC regional experiment is to increase the number of particles in the WCR when compared to the global configuration (by a factor of 5) in order to better capture the MPW ocean distribution, as well as to lower the 10 tons/year threshold of GLB to 1 ton/year. In REALISTIC, 99.97% of the plastic sources in the WCR are taken into account versus 99.6% in GLB. In this subsection, we briefly describe how they compare with respect to statistics indicating where a country’s MPW goes or where the MPW found on a given country’s coast originates from [
36].
To quantify the comparison,
Table 2 lists the origin of the MPW found on the coasts of Venezuela, the USA, and Mexico, the three countries that received the most MPW in the WCR. Not surprisingly, these three countries also have the longest coastlines. The total amounts of MPW received in these three countries are quite similar between the two experiments, as is the further breakdown of origins by countries (
Table 3). For Venezuela, most (>90%) MPW comes from Venezuela itself, while for the USA and Mexico, the contributions are more widespread. This is likely associated with the fact that these two countries are located further “downstream” of the major currents in the WCR when compared to Venezuela, and, thus, most of the upstream WCR countries can potentially be a source.
It is a little more difficult to interpret the key destinations of MPW released from a specific country because, in the REALISTIC regional experiment, we do not have information on where particles that exit the WCR end up. If we focus on Venezuela, the top country generating MPW in the WCR, refining the MPW sources does not significantly impact the amount of MPW released from Venezuela or where it ends up. However, for the second and third most prolific generators of MPW, Haiti and the Dominican Republic, the small inputs below 10 tons/year almost double the amount of released MPW when compared to GLB, and these small inputs significantly modify the percentage of beached MPW. Although there are significant differences in the amount of MPW generated for some of the Caribbean countries between the GLB and REALISTIC experiments, the amount of MPW deposited on the beaches of the top 5 destination countries is comparable (
Table 3). This is consistent with the fact that there is very little difference in the percentage of beached particles between GLB and REALISTIC (
Section 3a).
- (c)
MPW hotspots in the WCR
As shown in
Section 3a, particles released in the WCR tend to either beach or exit the domain within 6 months after their release. In this subsection, we focus on long-term accumulations of the beached MPW, defined as MPW hotspots, along coastlines in both the UNIFORM and REALISTIC experiments. Comparison between these two experiments allows us to separate the impacts of the ocean/atmospheric circulation and coastline orientation from the heterogeneity of the MPW source distribution.
We first look at the UNIFORM experiment in which the MPW particles were uniformly distributed along coastlines, released monthly, and advected for the full 2010–2021 period. Since the particles were uniformly distributed, a simple measure of MPW hotspots is the number of beached MPW particles on the model’s coastline (
Figure 6). Accumulations of more than 1000 MPW particles (yellow and red circles in
Figure 6) are defined as hotspot areas. The most obvious MPW hotspots are along the western coast of the WCR, especially along Costa Rica/Nicaragua, Guatemala/Belize/Mexico, and Texas, USA. These coastlines are oriented mostly in the north–south direction and typically have a concave shape, making them ideal for collecting MPW particles in a region where easterly winds are dominant (see
Figure 2b). MPW hotspots are also found in areas along the southeast Florida coast, the Bahamas, and northern Cuba. There are some relatively localized hotspots on the southern part of Cuba, Isla de la Juventud, and the southern tip of the Dominican Republic. The accumulation of MPW in these hotspots can be explained by the orientation of the coastline relative to the easterly winds and, to some extent, the ocean circulation (
Figure 2a,b).
By the same token, one can expect a smaller MPW accumulation in areas where the coastline is oriented more in the east–west direction and/or along the western side of a peninsula or island. Examples are the north and west sides of the Yucatán Peninsula, the northern and western coasts of Florida, and most of the southern side of Cuba. Coastal recirculation along the western Florida coast and in Campeche Bay [
63] may also play an additional role in carrying MPW away from the coast. Because of strong currents, the leeward and windward Caribbean islands, as well as most of the coastlines of South America from Venezuela to French Guiana, also have relatively few MPW hotspots (except for Venezuela, where the coastline is more oriented north–south).
Analysis of the UNIFORM experiment allows us to document the impact of the main ocean/atmospheric circulation patterns as well as the orientation of the coastline on plastic distribution in the WCR. However, by design, the initial particle density in this experiment is uniform and not representative of the WCR MPW distribution (
Figure 3). We now present a similar analysis of the long-term hotspots (
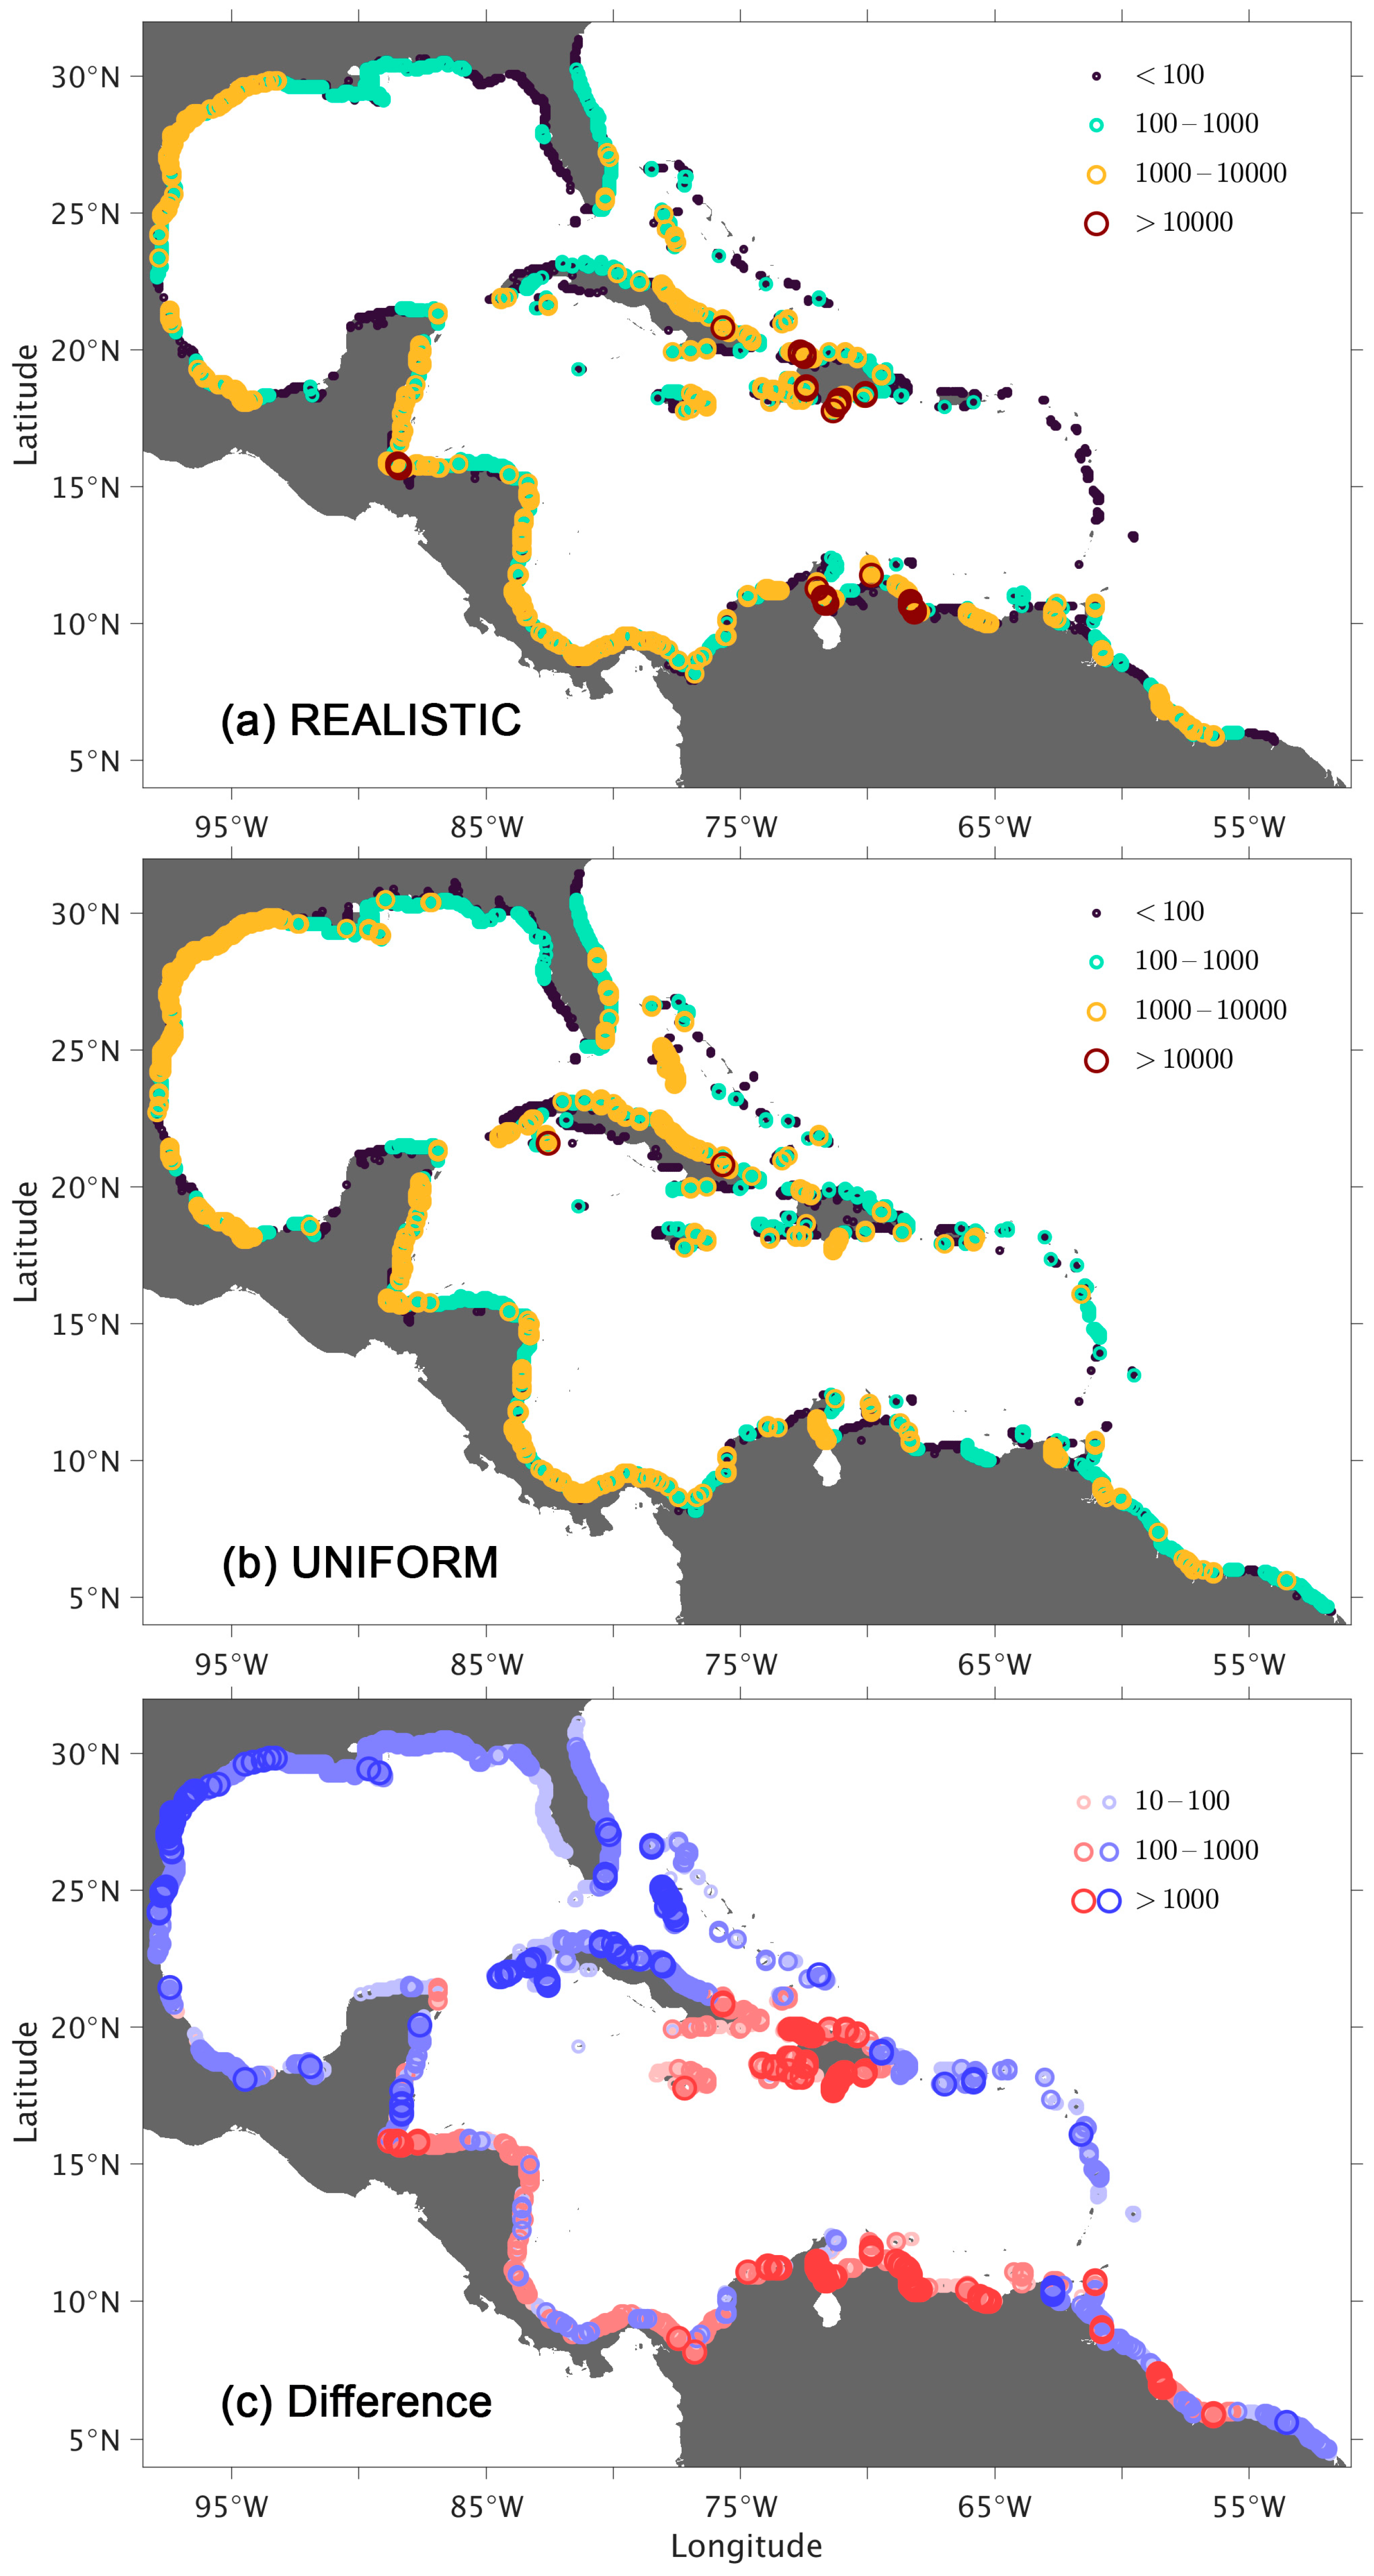
Figure 7a), but this time for the REALISTIC experiment. Note that the MPW plotted in
Figure 7a are the MPW particles being released from the WCR countries, and not MPWs advected in the WCRs (to be discussed later in the section). Because the particles are initialized according to the estimated MPW distribution (
Figure 3), the hotspots in
Figure 7a are presented in tons of accumulated MPW. For a comparison of the REALISTIC and UNIFORM experiments,
Figure 7b shows the beached MPW of the UNIFORM experiment in tons, by prescribing a weight to each particle such that the total amount of released MPW is the same as in the REALISTIC experiment.
There are quite a few similarities between the UNIFORM and REALISTIC experiments with regard to where MPW accumulates. For example, MPW hotspots are shown along the western coastlines of the WCR, especially along Costa Rica/Nicaragua, Guatemala/Belize/Mexico, and Texas. The lack of MPW accumulation along the northern and western sides of the Yucatán Peninsula, the northern and western coasts of Florida, and the leeward and windward Caribbean islands is also similar, suggesting that these MPW hotspots or the lack of MPW accumulation are not heavily impacted by the initial distribution of MPW sources.
There are, however, clear differences between the UNIFORM and REALISTIC experiments, which are highlighted in
Figure 7c, that reflect the impact of the heterogeneity of MPW source distribution. In REALISTIC, MPW hotspots are significantly larger along the coasts of Haiti–Dominican Republic, Guatemala–Honduras, and Venezuela. These three regions have high MPW sources (see
Figure 3). On the other hand, the MPW accumulation is smaller in REALISTIC for the rest of the WCR domain. This includes most of the Gulf of Mexico, the leeward and windward Caribbean islands, and most noticeably the area between southeast Florida, the Bahamas, and northern Cuba. This is due to the lower MPW sources in this region because (a) there is no MPW from Cuba due to lack of data, and (b) the MPW from the Bahamas islands is relatively low.
An additional objective of the REALISTIC experiment is also to quantify the relative contribution to the beached MPW between those released locally from the WCR countries (
Figure 7a) and those transported into the WCR domain through eastern and northern boundaries (
Figure 8). The mass of beached MPW from the particles entering the WCR is much lower than the mass from particles released within the WCR, by a factor of 27. As in
Figure 7a for the WCR particles, the spatial distribution shown in
Figure 8 exhibits a relatively high MPW concentration along the western WCR coastlines (i.e., Texas/Louisiana, Guatemala/Belize/Mexico) and a relatively low concentration in the western Yucatán Peninsula and western Florida. One striking feature in
Figure 8 (which is not present in
Figure 7a) is the relatively high MPW concentration along the eastern side of the Caribbean islands, from eastern Florida to South America, a consequence of particles advected from outside the WCR. Another striking feature in
Figure 8 is the low MPW concentration along the northern coastline of Venezuela and Columbia. Thus, the MPW found in these areas is essentially all locally generated (see Venezuela in
Table 2).
- (d)
Seasonal variability of the MPW hotspots
Section 3c described the MPW accumulation hotspots along the WCR coastline over a 12-year period. As illustrated in
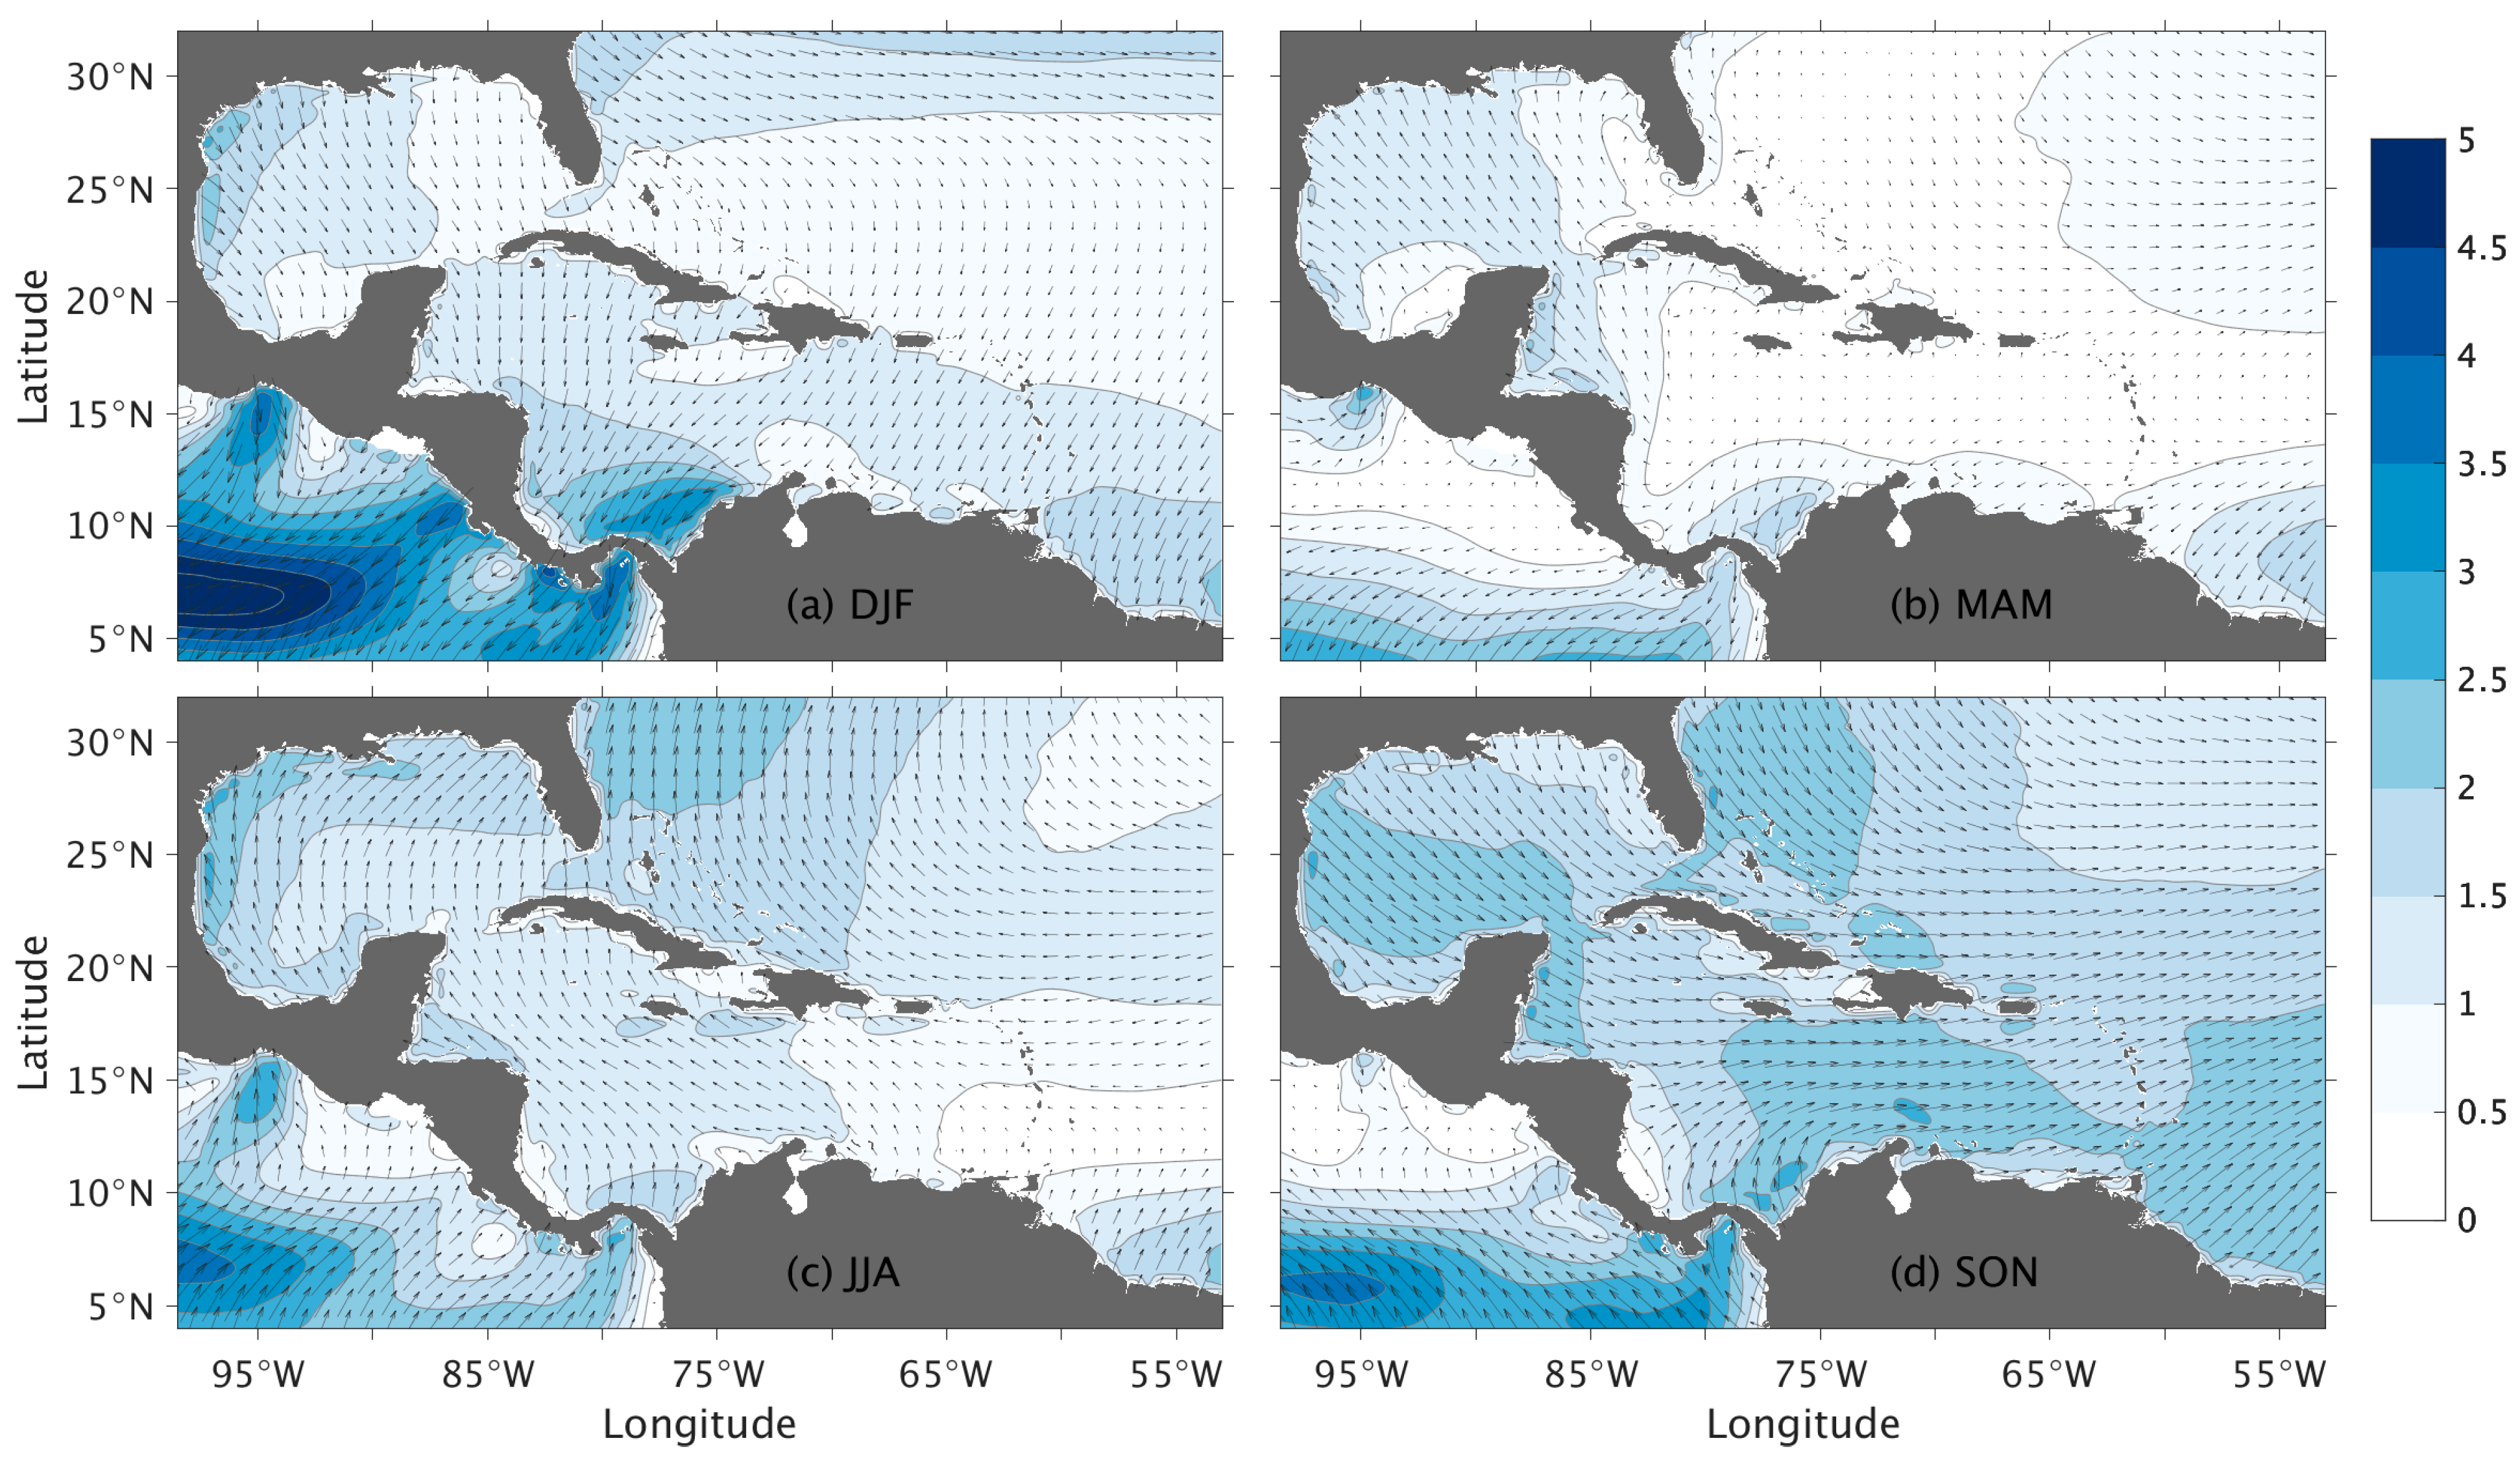
Figure 4b, the number of beached MPW particles exhibits significant temporal variability, especially on seasonal timescales. Thus, a question arises as to whether the distribution of MPW hotspots also varies seasonally and, if so, whether such variability can be explained by seasonal changes in wind patterns or ocean circulation. It is important to note that while there is clear seasonal variability in the wind over the WCR (due to the position shift and intensity change of the North Atlantic subtropical high, NASH), as shown in
Figure 9, there are only small changes in the WCR ocean circulation on seasonal time scales. Most of the variability is induced by mesoscale eddies and occurs on shorter intra-seasonal timescales [
27]. Here, we focus on the connection between the changes in MPW hotspots and in the wind patterns.
In
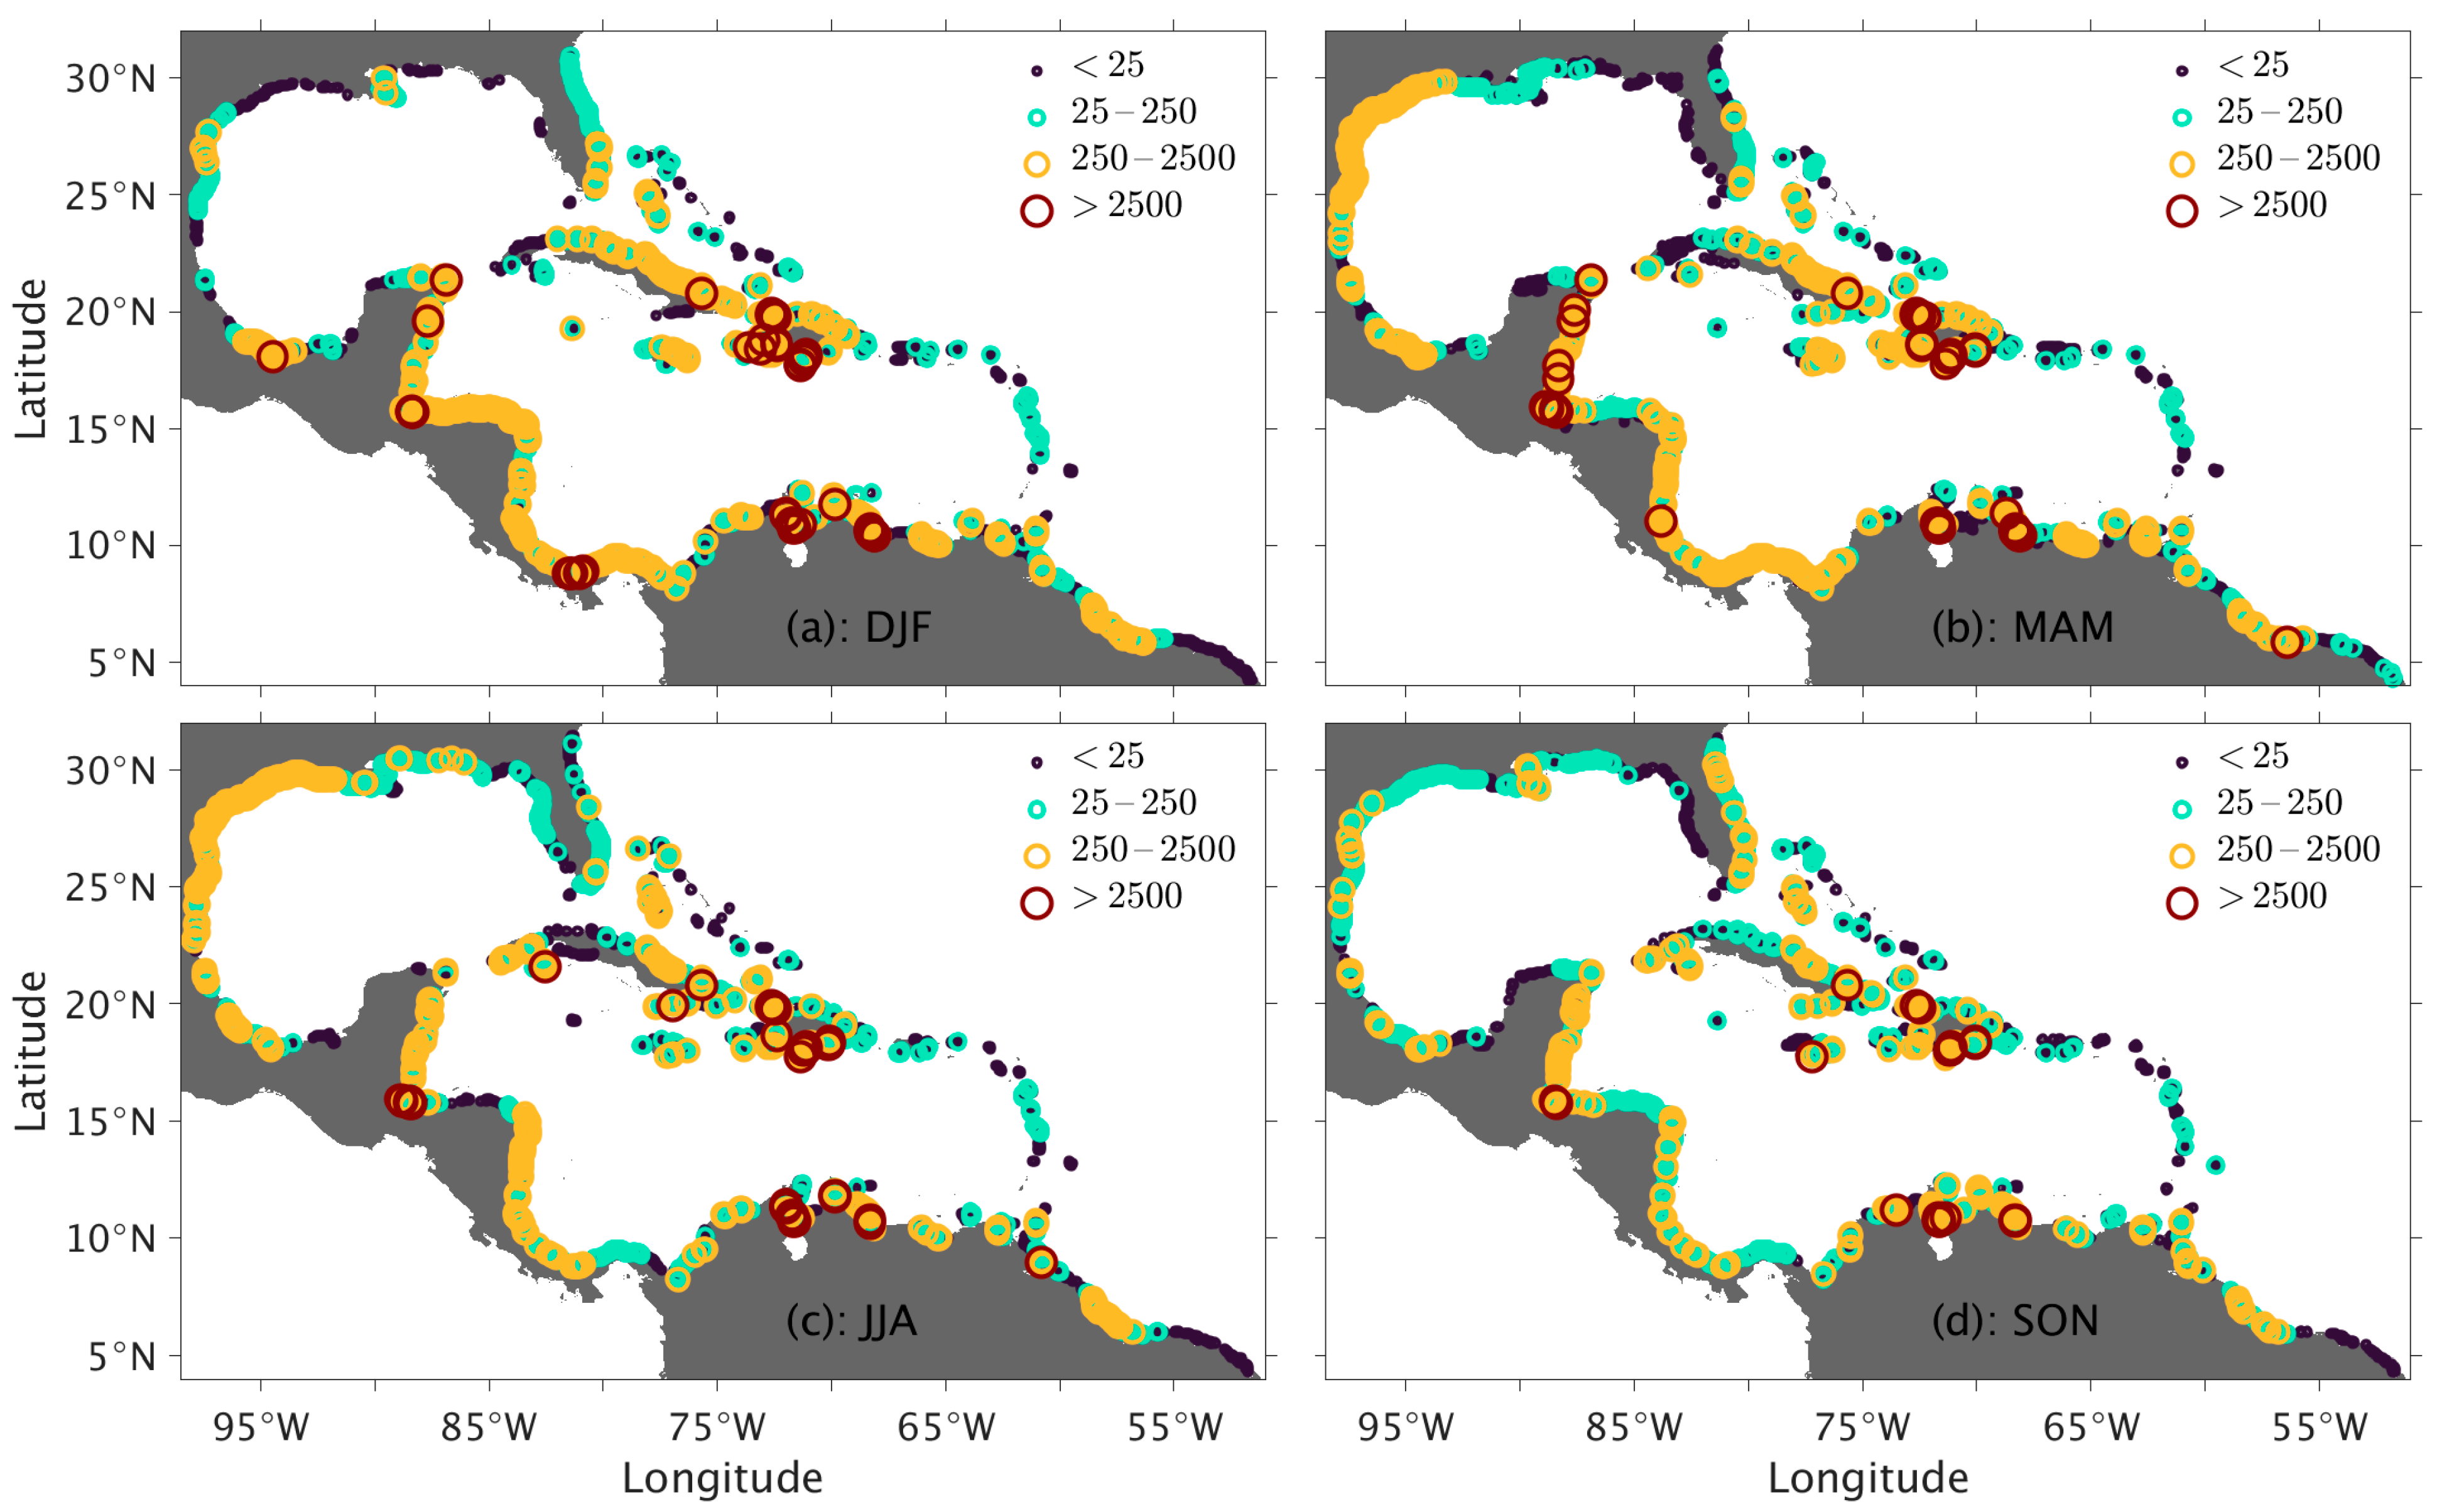
Figure 10, we show the distribution of beached MPW (in tons) for each of the four seasons, i.e., winter from December to February (DJF), spring from March to May (MAM), summer from June to August (JJA), and fall from September to November (SON), integrated from 2010 to 2021. In order to compare these values to the long-term full-year accumulation in
Figure 7a, the MPW values shown in
Figure 10 need to be multiplied by a factor of 4. The distribution of MPW hotspots exhibits significant seasonal variability. The amount of beached MPW along the WCR coastlines is, on average, significantly lower during fall and winter (
Figure 10a,d) when compared to spring and summer. In the fall, the magnitude of hotspots is lower along the entire western coastline and, to a lesser degree, the northern coastline of South America (
Figure 10d). The hotspots are also much smaller during the winter along the western/northwestern Gulf of Mexico (
Figure 10a). The distribution of the hotspots during spring and summer (
Figure 10b,c) is similar to that of the full-year accumulation (
Figure 7a). Furthermore, in summer, MPW hotspots in the western Gulf of Mexico spread further eastward, and moderately elevated MPW accumulation can even be seen along the western coast of Florida, where the MPW accumulation is low for the other three seasons. Finally, in contrast to those along the western coastlines of the WCR, the MPW hotspots around Haiti–Dominican Republic and, to a lesser degree, along the northern coast of Venezuela do not show much seasonal variability. Similarly, the leeward and windward Caribbean islands consistently show low MPW accumulation in all four seasons.
To explain the impact of the seasonal variability in wind pattern on the distribution of MPW hotspots, we now discuss the seasonal wind anomaly (relative to the annual means) averaged over the 2010–2021 period shown in
Figure 9. The seasonal changes in wind magnitude are quite significant when compared to the mean shown in
Figure 2b (up to 25%). During the fall (
Figure 9d), there is a strong southeast to eastward wind anomaly over much of the WCR domain, in the opposite direction to the long-term average (
Figure 2b), that leads to less MPW beaching along the western WCR coastlines (
Figure 10d). During winter (
Figure 9a), the wind anomaly is similar to that of fall in the Gulf of Mexico, but southward instead of eastward over the western Caribbean Sea. This explains the similarity between fall and winter in MPW hotspots’ distribution along the coastline of the northwestern Gulf of Mexico and the differences along the coastline of the western Caribbean Sea (
Figure 10a,d). The correlation between coastline orientation and wind direction is illustrated by comparing the MPW accumulation along the coast of Honduras in the different seasons. The coastline is oriented in the east-to-west direction, with low accumulation of MPW during most seasons when strong easterlies are present, but higher MPW accumulation in winter when the wind anomalies are perpendicular to the coastline.
The wind anomaly during spring is relatively weak (
Figure 9b), and, not surprisingly, the distribution of MPW hotspots in this period (
Figure 10b) is therefore very similar to that of the annual mean (
Figure 7a). In summer, the wind anomaly (
Figure 9c) is mostly northward, and this leads to an even lower MPW accumulation along the coastlines of Honduras and the northern Yucatán Peninsula (opposite to that of the winter season,
Figure 10a) and higher MPW accumulation along the northeast and eastern sides of the Gulf of Mexico (where MPW accumulation is low in the other three seasons). Overall, the distribution of MPW hotspots in summer (
Figure 10c) is very similar to the annual mean.
4. Uncertainties Associated with the Beaching Criterion
There are many uncertainties associated with the numerical results presented in the previous section, such as the MPW source distributions, the modeled ocean/atmospheric circulation, and various parameterizations on Stokes drift, windage, diffusion, and/or random walks, as well as the decaying of MPW over time. Because we are focusing on MPW hotspots, there is one additional uncertainty that needs to be taken into account, which is the definition of a beached particle. Beaching of plastic is a complex process [
35,
37,
64,
65] that is strongly influenced by small-scale ocean dynamics [
66] and by the local morphology of the coastline [
67]. Neither of these is well represented in the ocean circulation model, and it is important to define a beaching criterion for the particle-tracking simulation.
One intuitive definition of “beaching” is that the particle is stranded or barely moves. Due to the random walk prescribed to each particle (
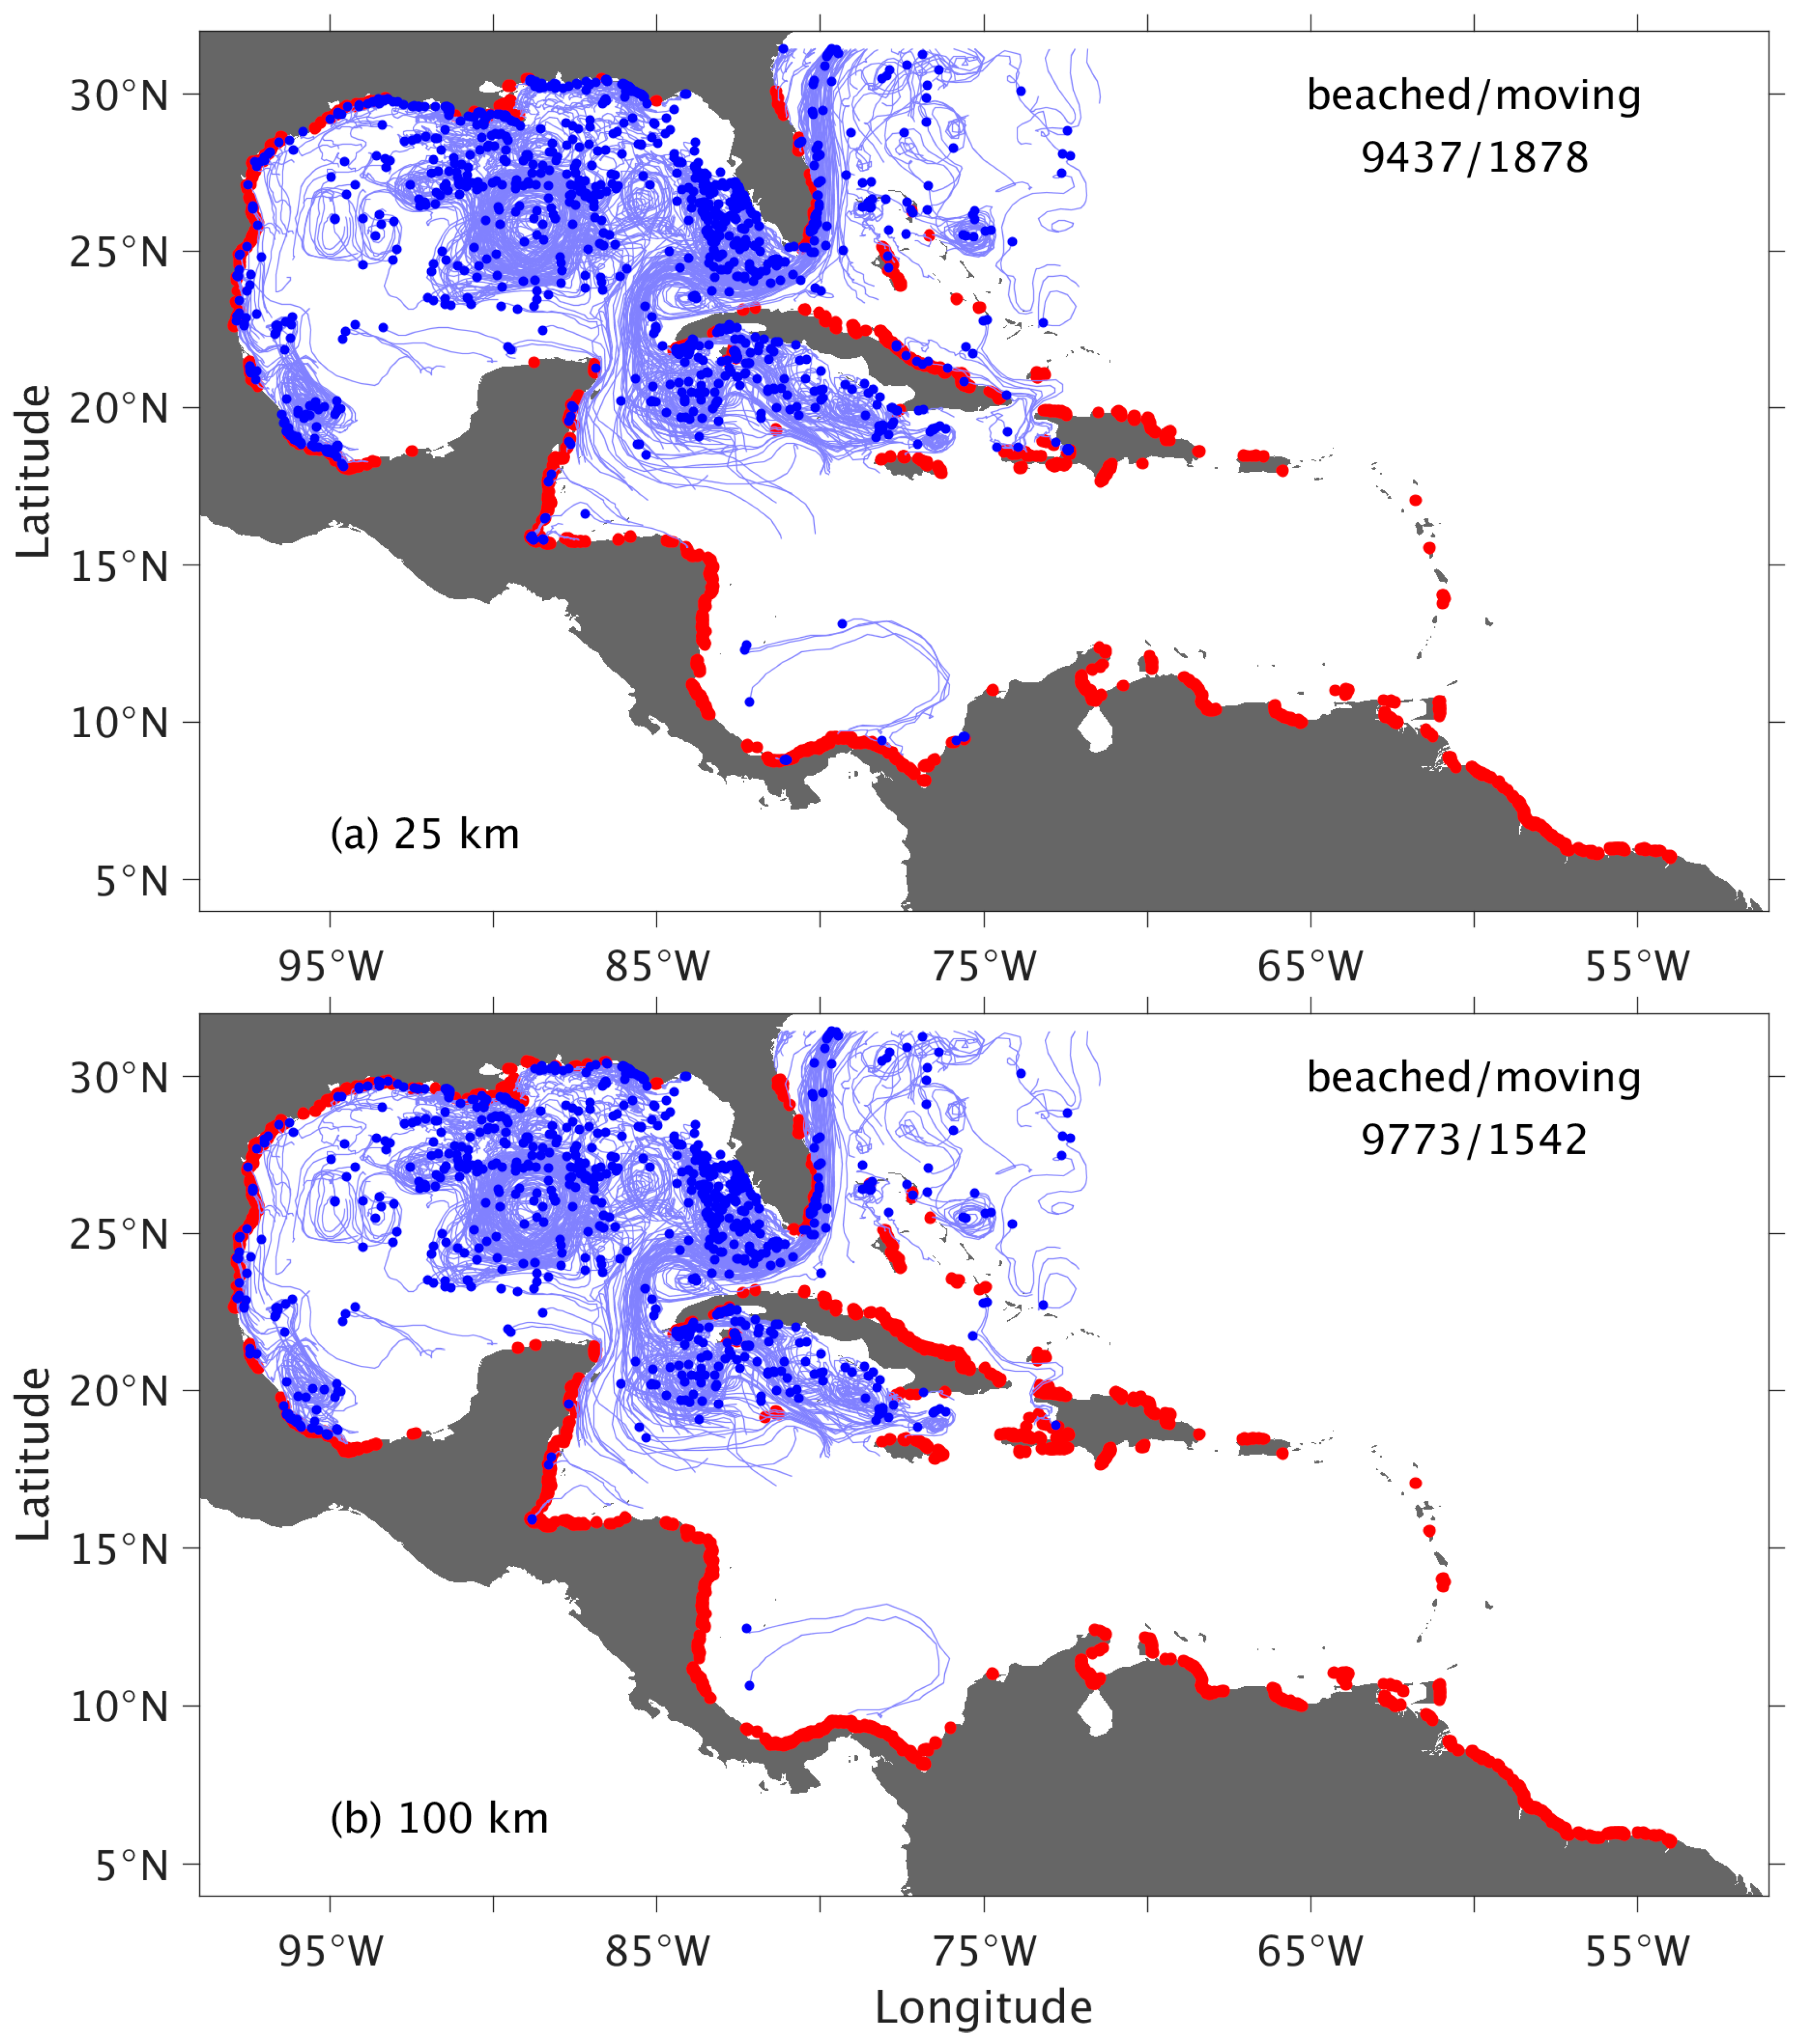
Section 2), the simulated particles will never fully stop moving (averaged 0.54 km daily in our simulation), even when their advection velocity is zero. Thus, in our simulations, we use a movement threshold (total distance a particle traveled over 30 days) to determine if a particle is stranded or not.
Figure 11 displays the separation between beached and moving particles for threshold values of 25 km and 100 km, respectively. The separation is quite effective (in that all beached particles are over the land/along the coastline, whereas most moving particles are in the interior) and is not very sensitive to the threshold value. Averaged over all releases, 9784 (86.5%) and 10,005 (88.5%) of the 11,315 particles released from the WCR countries are beached at the end of integration, for 25 km and 100 km, respectively. In this study, we used a threshold of 25 km to stay true to the definition of “being stranded”.
There are other approaches to defining “beaching”. Dobler et al. [
65,
68], for example, considered a particle stranded when it drifts within 9 m (10
−3 of model grid resolution) of the model coastline. A stochastic approach was implemented in some recent Lagrangian studies [
64,
69,
70], in which they consider that particles located within a proximity distance
of a coastline (and model land cells) have a probability
p of beaching. It is therefore of interest to quantify to what extent a different beaching definition would impact our results, and in the remainder of this section, we examine how the beached MPW statistics differ from using a probability criterion. In a similar fashion to van der Mheen et al. [
70], we use the model resolution (8 km) as the proximity distance and set the probability of beaching as
, meaning that a particle evaluated daily has a 13% chance of beaching when the distance to the coastline falls under 8 km. This beaching criterion is equivalent to what was qualified as a medium beaching probability (50% chance of beaching when evaluated every 5 days) in van der Mheen et al. [
70].
To illustrate the impact of the beaching criterion, we examine the number of beached particles and the distribution of MPW. For the particles that are released from the WCR countries (thick lines in
Figure 12) and those that enter the WCR domain through the domain boundaries (thin lines in
Figure 12), the percentage of beached particles is higher with the probability method (93.2% versus 86.2% and 11.6% versus 7.2%, respectively). Thus, the probability method leads to a higher chance of beaching. The distribution of the beached MPW from WCR and boundary particles using the probability method is displayed in
Figure 13, together with the difference with the 25 km movement threshold (i.e.,
Figure 7a and
Figure 8). For the beached MPW from the WCR countries (
Figure 13a), the hotspots around Haiti–Dominican Republic, Guatemala–Belize, and Venezuela (near high MPW sources) are consistent between the two methods. When looking at the differences (
Figure 13b), the movement threshold method leads to a higher MPW accumulation for the hotspots along the western WCR coastline, especially along Texas, whereas the probability method favors MPW accumulation along the path of major currents, including the islands in the Caribbean Seas, the Gulf of Mexico, and the Bahamas.
For the boundary particles (
Figure 13c), the hotspot distribution is also quite similar between the two methods in that significant MPW accumulates along the western margin from eastern Florida to the northern Caribbean islands and to South America (close to the boundary MPW source) and that there is a low MPW concentration along the northern coastline of Venezuela and Columbia. The difference plot (
Figure 13d) shows that the probability methods lead to more accumulation along the Caribbean chain of islands and, as in the case of WCR particles (
Figure 13b), lower accumulation along the western WCR coastline.
5. Conclusions and Discussion
The persistent increase in marine plastic litter has become a major global concern and one of the highest plastic concentrations in the world ocean is the Wider Caribbean Region (WCR). In this study, we used three marine plastic litter tracking simulations (one global and two regional) to investigate where marine plastic accumulates, i.e., hotspots, in the WCR and how the accumulation varies on seasonal timescales. The two regional experiments were designed to allow us to separate the impact due to the spatial variability of MPW sources and/or to separate the MPW contributed locally from WCR countries versus remotely from out of WCR domain. Our results show the following:
First, most of the MPW converges on the coastline shortly after being released because of the strong surface current and the predominant easterly winds. Most of the accumulated MPW is generated locally from the WCR countries, with the MPW from outside of the domain is at least one order of magnitude lower than the WCR contributions.
Second, major plastic accumulations take place along (i) the western coastline of the WCR, especially the north–south oriented coast of Costa Rica/Nicaragua, Guatemala/Belize/Mexico, and Texas, and (ii) the coastlines of Haiti–Dominican Republic and Venezuela. Relatively low plastic accumulation is found along western Florida, the western Yucatán Peninsula, and the leeward and windward Caribbean islands. The accumulation along the western WCR coastlines is modulated primarily by ocean current and exhibits significant seasonal variabilities due to changes in wind patterns. The accumulation observed on the Haiti–Dominican Republic and Venezuela coastlines is primarily due to the proximity of large, mismanaged plastic waste sources.
Third, the criterion used to define the plastic beaching in the model can have a significant impact on the number and the distribution of the beached MPW. We compare two approaches: One that uses a simple movement threshold and another that uses a probability function whenever a particle is close enough to the coastline. We find that the probability approach commonly used in the literature leads to a higher beaching percentage and favors beaching on the coast along the major currents.
This study on the spatial distributions of marine litter hotspots and their seasonality in the wider Caribbean Region provides valuable information regarding plastic accumulation in this ecologically sensitive area [
71]. The short-lived trajectories of marine litter in the WCR Ocean and its rapid convergence towards coastlines underscore the importance of focusing efforts on large hotspots, especially those in proximity to large magnitudes of MPW (land- and riverine-based). Initiatives like “The Ocean Cleanup’s Interceptor
1”, designed to intercept debris at river outflows before they reach the ocean, exemplify the practical application of this knowledge in mitigating plastic pollution at the source. Our results also highlight the complexity of the marine litter problem, necessitating collaboration among all stakeholders. Plastic is ubiquitous along the coastlines of the Caribbean region, making clear the importance of sensibilizing local communities and encouraging them to be part of the solution. Finally, it is important to stress that there are significant uncertainties in many aspects of our marine litter simulations. There are some recent works using surface drifters along with high-resolution modeling to study the near-surface circulation and the associated particle movements in lakes and near-shore coastal waters [
72,
73,
74]. Targeted observations in this region may help us to evaluate the model results and improve the simulation, which, in turn, will help advance more effective strategies for mitigating plastic pollution in this critical ecosystem.


