1. Introduction
As the frequency of space launch missions continues to rise, the deployment of rocket deflector troughs is increasing correspondingly, introducing inherent structural fatigue challenges. According to the statistics, more than 70% of the damage to marine engineering structures during their service life is caused by fatigue [
1]. Consequently, the initiation and propagation of cracks due to structural fatigue have emerged as the primary causes of marine engineering structure failures. In the context of the challenging maintenance conditions of offshore rocket launch platforms, it is imperative to comprehend the trajectory from crack initiation to structural failure within the direct impact zone of rocket plumes on deflectors. This understanding holds significant importance for evaluating the remaining structural life of these platforms, particularly in light of stringent damage tolerance requirements.
The Extended Finite Element Method (XFEM), as an emerging numerical approach for simulating fatigue crack propagation, retains the advantages of traditional finite element methods. It utilises specialised crack tip enrichment functions to model the stress singularity at the crack tip, allowing the crack interface to be independent of the mesh, reducing mesh dependence, and simplifying the treatment of the crack tip refinement [
2]. This makes the XFEM an effective and efficient tool for addressing crack growth problems [
3,
4,
5]. Numerous scholars have conducted in-depth research and experimental extensions on this method. Patzak et al. [
6] conducted an in-depth study on the analytical process of the XFEM. Zhang et al. [
7] used the Extended Finite Element Method to study the impact of compressive stress on crack propagation under tension-compression loading, revealing a relationship between crack initiation at the crack tip and compressive stress. Menouillard et al. [
8] simulated dynamic crack propagation using the XFEM based on explicit time integration techniques. Fries et al. [
9] introduced three horizontally integrated functions explicitly computed to enhance the three-dimensional applicability of the XFEM, proposing a new approach that combines explicit and implicit methods for simulating crack propagation. Daux et al. [
10] applied the Extended Finite Element Method to simulate crack branching. Himanshu Pathak et al. [
11] used the XFEM to simulate fatigue crack propagation under cyclic thermal loads for three-dimensional linear elastic cracks with different geometries, revealing the robustness and versatility of the XFEM. Loehnert et al. [
12] discussed a series of computational issues related to the three-dimensional XFEM, studying the impact of finite deformation theory on crack simulation through numerical examples. Danas et al. [
13] used the XFEM to study energy minimisation in the multiple crack propagation of linear elastic solids under quasi-static conditions, proposing an alternative strategy to supplement the implementation and application of gradient descent methods within the XFEM framework.
While conducting in-depth research on the XFEM, many scholars have also applied this method to address practical problems. Through experiments applying compressive stress on notched plates, Fleck et al. [
14] found that cracks originated in the residual tensile stress region near the notch root and extended, indicating that fatigue cracks are more prone to propagate under tensile stress conditions. Sahouryeh et al. [
15], through experiments, observed the crack propagation behaviour under biaxial compressive stress and found that the size of crack growth was limited, with the propagation direction parallel to the loading direction. Nikfam et al. [
16] simulated high-cycle fatigue tests on welded T-joints using the XFEM, validating that the XFEM predictions of crack propagation rate, life, and shape were within a reasonable range of the experimental results, with the fracture morphology of the numerical model consistent with experimental observations. Teng et al. [
17] utilised the XFEM to investigate the influence of different micro-defects on macro-crack propagation. The study results not only demonstrated the XFEM’s ability to accurately capture the stress intensity factors at the macro-crack and micro-defect crack tips but also revealed that the impact of micro-defects on the macro-crack propagation path changed with their position and size.
Based on simulated rocket plume parameters, this study employed numerical simulation to investigate the influence of the rocket plume on the launch platform, especially the deflector, during rocket launch. The simulation incorporated both high-temperature and exhaust plume impact load coupling, considering the effects of temperature loads on the mechanical properties of the deflector’s metallic material. The force conditions on the deflector during the rocket’s takeoff phase were realistically simulated. Finally, the XFEM was applied to analyse the fatigue crack propagation on the lower surface of the rocket deflector with pre-existing initial cracks. This study primarily focuses on the direction, initiation length, and fatigue propagation rate of cracks in rocket deflectors with initial cracks caused by fatigue damage or material defects during their subsequent operational service. The obtained results will serve as a reference for the safety performance design of maritime rocket deflectors.
3. Simulation Calculation Equations
3.1. XFEM
The fundamental idea of the XFEM [
22] is the method of unit decomposition, which introduces enriched functions into the displacement modes of FEM to characterise strong discontinuities in the displacement field:
where
is the discontinuous displacement field; standard finite elements apply the shape function;
represents the degrees of freedom of regular nodes; and
represents the enriched approximation functions associated with the method of unit decomposition.
When applying the XFEM to solve crack propagation, the software divides the material elements into three categories: standard elements, penetrating elements, and crack tip elements. For the elements experiencing crack propagation, discontinuous shape functions can be introduced to control the displacement:
In the equation above, represents the approximate displacement field of the extended finite element; represents the approximate displacement field of the standard finite element; represents the approximate displacement field of the penetrating element crack; represents the approximate displacement field of the crack in the crack tip element; is the set of all nodes in the solution domain; is the set of nodes penetrated by the crack; is the set of nodes affected by the crack tip region; is the step function for the penetrating element; is the enrichment function for the crack tip element; represents the degrees of freedom associated with enriched nodes related to the jump discontinuity; and represents the degrees of freedom associated with enriched nodes related to the crack tip approximation function.
3.2. Crack Propagation Criteria
The Paris equation can represent the initiation and propagation of fatigue cracks [
23]:
In the equation above, represents material-related constants.
The Paris law in the simulation associates the crack propagation rate with the energy release rate () at the crack tip. , represents the strain energy release rate corresponding to the maximum load on the structure and the strain energy release rate corresponding to the minimum load on the structure.
The Paris law operates within the bounds of and , where fatigue cracks do not propagate below the former and rapidly propagate until failure above the latter. The intermediate region between the two represents a stable crack propagation zone for fatigue cracks.
3.3. Damage Initiation Criteria and Evolution Criteria in ABAQUS
- (1)
Damage Initiation Criterion: Maximum Principal Stress Criterion (Maxps Damage)
When
within the tolerance range, damage initiates. Here,
is the tolerance, typically set to 0.05;
is the critical maximum principal stress value; and
signifies
The above expression implies that no damage initiation occurs in the element with a penetrating crack under pure compressive loading conditions.
- (2)
Damage Evolution Criterion: Energy-Based Damage Evolution Criterion
In ABAQUS, the overall damage of a structure is represented by
D, with an initial value of 0. If a damage evolution model is defined, the value of
D increases after the model undergoes further loading, gradually evolving towards 1. ABAQUS’s damage evolution law describes the degradation rate of material stiffness in each cycle once the corresponding initiation criteria are met. For ductile materials, ABAQUS assumes that stiffness degradation can be modelled using a scalar damage variable
D. Within any given analysis cycle, the stress tensor in the material is determined by the scalar damage equation:
The equation
represents the effective (undamaged) stress tensor present in the material during the current incremental calculation when no damage has occurred. When
D equals 1, it indicates that the material has lost its load-bearing capacity, and damage has occurred [
24].
- (1)
Linear Evolution Damage Criterion:
In the equation above, , F is the effective traction measured in MPa, and is the energy released upon damage measured in J.
- (2)
Exponential Evolution Damage Criterion:
In the equation above, is the energy release at the onset of damage measured in J, and is the effective displacement measured in mm.
5. Numerical Results and Discussion
5.1. XFEM Simulation Approach for Fatigue Crack Growth
This paper employed the XFEM to simulate the numerical growth process of cracks. The XFEM, by introducing additional shape functions into the finite element mesh, can handle the extension of cracks more naturally. In the calculation of crack propagation, the XFEM employs the concept of unit decomposition to introduce specific functions relevant to the problem into the approximation space, ensuring the convergence of results [
26]. The level set method is a numerical technique within the XFEM used to determine the position of the internal interface of cracks and to track the growth of cracks. Any internal interface can be represented using its zero-level set function [
27,
28].
In the simulation, the release of nodes at the crack tip was based on ABAQUS damage initiation and evolution criteria. The fracture energy in the crack tip region accumulated as the load cycled continuously. When the cumulative fracture energy at the crack tip nodes reached a specific threshold, the XFEM released the fracture energy at the tip, and this released energy was used to initiate a new crack, simulating the extension of the crack. ABAQUS abandons the coupling issues introduced by two shape functions, making it unable to simulate branching cracks. However, the XFEM, utilising the unit decomposition and level set methods, can accurately simulate the extension of a single crack. Therefore, in this paper, crack propagation refers to the growth and elongation of cracks caused by cyclic loading and does not include an increase in the number of cracks.
The growth of the crack in each numerical step was determined by monitoring the stress intensity factor range at the crack tip [
29]. Using empirical relationships like the Paris law, the crack growth rate was associated with changes in the stress intensity factor, allowing for the crack growth calculation in each step. This ensured that the XFEM can simulate the actual growth behaviour of cracks under fatigue loading.
5.2. Crack Area Configuration
The crack locations were chosen based on the stress–strain calculation results of the deflector’s lower surface. Two positions were selected, one corresponding to the maximum stress and the other to the maximum strain.
Figure 8 indicates the specific locations of the cracks along with the results of stress/strain calculations. Position A corresponds to the location with the maximum stress, as shown in part (a). Position B corresponds to the location with the maximum strain, as indicated in part (b). The region circled in yellow represents the area designated for pre-inserted cracks. The width of the lower surface of the deflector plate was 20 m. According to the design requirements for the launch platform, the crack size could not exceed 5‰ of the deflector plate width. This paper conducted simulations under the worst-case-scenario assumption; hence, the initial crack length was set to 100 mm.
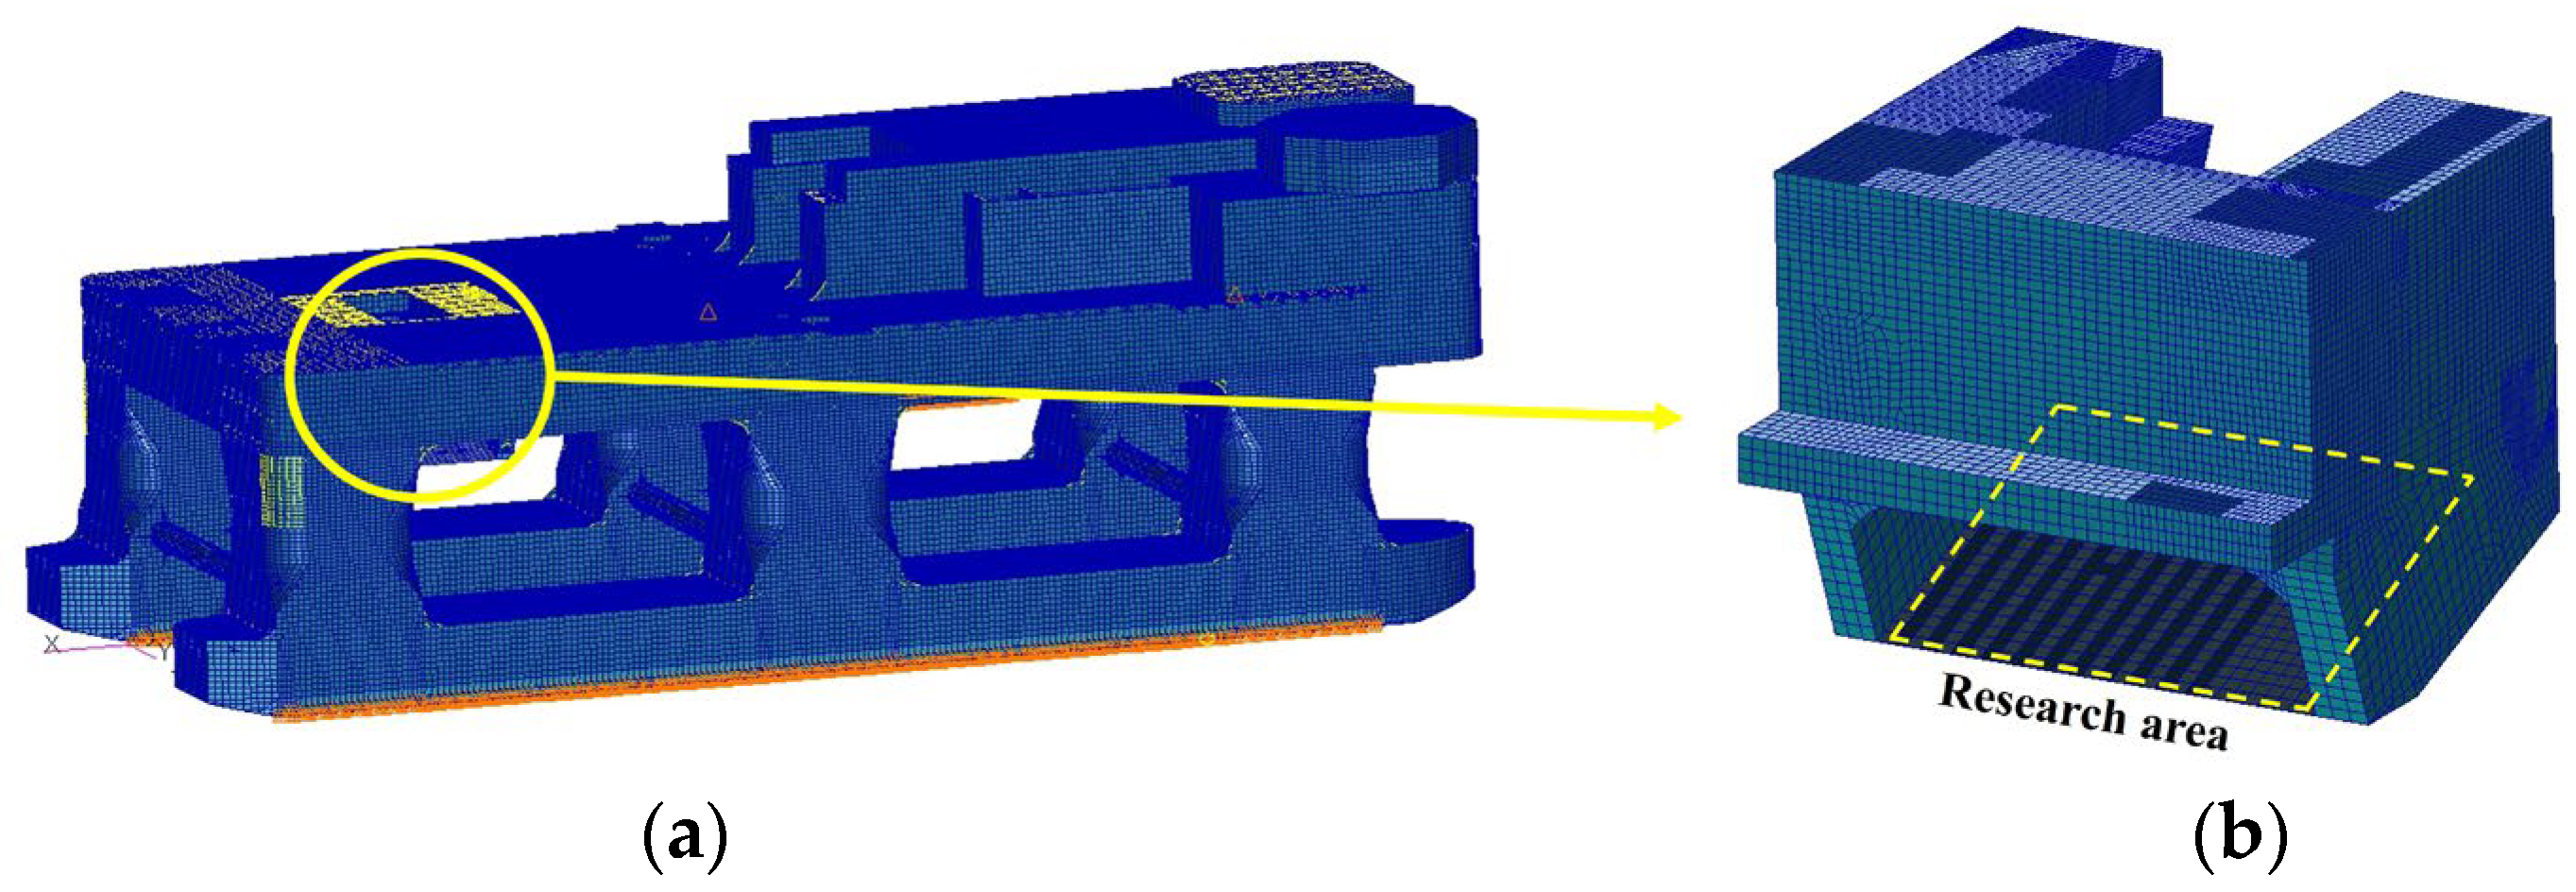
Considering that the crack propagation on the lower surface of the deflector occurred only in localised regions, a “shell-to-solid” coupling theory based on ABAQUS [
30] was adopted.
Figure 9 illustrates the shell–solid coupling principle. In this approach, the localised regions where cracks must pre-exist are configured as three-dimensional solids. In contrast, the overall model region is kept as a two-dimensional shell. This configuration was implemented to simplify the computational process. The form of the crack was characterised as a penetrating crack.
The cracks studied in this paper were penetrating cracks that vertically traversed the lower plate of the deflector groove. The plane coordinate system selected for measuring the initial crack’s inclination angle was located on the plane in the region where the crack was present.
Figure 9b,c illustrates the configuration of penetrating cracks and the establishment of the coordinate system referenced by the inclination angle of the crack.
5.3. Crack Propagation Direction
The pre-inserted cracks on the lower surface of the rocket deflector experienced various types of stress, including tensile stress, compressive stress, torsional stress, and shear stress. Due to the non-uniformity in the motion of the rocket plume flow field, there were variations in the temperature and exhaust plume impact loads, both in terms of direction and magnitude, across different regions of the lower surface of the deflector trough. As a result, cracks at different positions and inclinations experienced differences in the magnitude and direction of the principal stress.
Figure 10 and
Figure 11 depict schematic diagrams illustrating the inclination and propagation of pre-inserted cracks under the propagation scenario for two operational conditions, both occurring within the same number of load cycles. In the figures, the X-axis direction corresponds to 0°, and the Y-axis direction to 90°. The counterclockwise direction represents an increase in inclination. For clarity, the crack represented by the thick line in the figure is the initially pre-set crack in the deflector groove. In contrast, the crack represented by the thin line is the newly formed portion resulting from the fatigue-induced crack propagation of the pre-set initial crack.
The deformation coefficients in the resulting figures were set to 0 for ease of observing the crack extension. According to the crack propagation results of the pre-inserted cracks on the lower surface of the deflector trough under the two operating conditions, it was evident that with the continuous increase in the pre-set inclination angle, the crack propagation length exhibited a trend of initially increasing and then decreasing. The maximum crack propagation length was attained when the inclination angle approached 70°. Comparing the crack propagation lengths in the two operating conditions, it was observed that under the same inclination angle and number of stress cycles, the crack propagation length in the region of maximum deformation was generally greater than in the region of maximum stress.
Figure 12 illustrates the relationship between the crack propagation direction and the location of the maximum principal stress at the crack tip. The black line represents the initially pre-set crack, while the thin blue line represents the newly formed portion due to fatigue crack extension. The green arrow indicates the direction of crack propagation, and the numbers above the arrows represent the element numbers penetrated by the crack. For example, “➀“ represents the number of the first unit cell penetrated by the crack. The red dots represent the positions of the maximum principal stress due to stress concentration when the crack penetrates each element, and the yellow dots represent the positions of the secondary stress (stress values just below the maximum principal stress) due to stress concentration when the crack penetrates each element. The numbers before the stress values correspond to the element numbers. For example, “1) 418 Mpa” corresponds to a red value, and the digit “1” before the numerical value indicates the maximum stress value at the crack tip and its location when the crack penetrates the first unit cell. The adjacent pairs of points arranged side by side in the figure indicate that both the maximum principal stress and secondary stress occurred at that point before and after the crack penetration.
Figure 12 shows that as the crack propagated within an element, stress concentrations occurred at the nodes along its advancement direction. The node’s position with the maximum stress determined the deviation direction of the crack tip within that element. Simultaneously, the position and stress magnitude of secondary stress nodes influenced the deflection angle of the crack propagation.
The combined analysis of crack propagation trends under both operating conditions revealed that, under certain pre-set inclination angles (50°, 60°), crack propagation was not solely oriented towards increasing the length of the crack. After a certain distance of cracking, the crack trajectories at the upper and lower ends, or one of them, tended to extend into the region where the fracture had already occurred. This indicates a tendency to detach the surrounding structure from the lower surface of the deflector. If this trend of crack propagation continued, it would compromise the integrity of the deflector trough structure, reducing the strength of the lower surface structure. Simultaneously, detached fragments of the overall structure would be ejected with high kinetic energy, accompanying the plume flow field within the deflector trough. This could result in secondary damage to the deflector trough and other structures, posing a potential threat to the rocket engine. Therefore, particular attention should be given to the 50° and 60° inclination cracks originating from fatigue damage on the lower surface of the rocket deflector trough.
5.4. Minimum Initial Crack Length for Crack Propagation
Table 5 shows that the number of load cycles required for the initiation and propagation of pre-inserted cracks at different inclinations exhibited an overall trend of initially decreasing and then increasing with the increase in the inclination angle. For condition A, the minimum initiation and propagation angle was 50°, while for condition B, the minimum initiation and propagation angle was 60°. In this section, the minimum initiation and propagation angles obtained from
Table 5 for the two operating conditions were taken as pre-set angles to investigate the minimum initiation and propagation lengths of cracks at these two angles under their respective conditions.
This section explores the minimum initial length required for the continued expansion of the initial crack on the lower surface of the deflector groove. In this section, the variable being changed was the length of the initially pre-set crack on the rocket deflector groove. Regarding the practical scenario, within the service life cycle of a rocket launch platform, no more than 60,000 rocket launch missions and experiments will be undertaken. Therefore, with 60,000 load cycles as the upper limit, if no fatigue propagation occurs in the initial crack after 60,000 load cycles, it is considered that a crack of that length will not continue to propagate. This section also uses this criterion to determine whether the crack is propagating.
With the increase in the initial length of pre-existing cracks, the rate of fracture energy accumulation at the crack tip accelerates, reducing the number of stress cycle repetitions required for crack initiation.
Figure 13 illustrates that, under condition A, the minimum crack initiation length was approximately 40 mm, whereas under condition B, it was around 20 mm. In the region of maximum stress, the number of cycles required for crack initiation is highly sensitive to changes in the initial crack length. As the initial crack length increases, the initiation cycles for cracks located at the point of maximum stress sharply decrease. In the region of maximum deformation, the increase in the initial crack length has a relatively weak impact on reducing the crack initiation cycles. The overall decrease remains relatively stable. From the figure, it can be observed that when the initial crack length exceeded 85 mm, cracks pre-existing in the region of maximum stress exhibited a faster crack initiation rate, whereas, for lengths below 85 mm, cracks situated in the region of maximum deformation demonstrated a faster initiation rate.
5.5. Crack Propagation Rate
Figure 14 shows that in both conditions, the crack propagation rate exhibited significant fluctuations and abrupt changes during the early stages of fatigue crack propagation. These fluctuations are attributed to variations in the crack propagation mechanism and changes in stress amplitude. Additionally, since ABAQUS cannot simulate stress concentration within the interior of elements, every crack propagation was bound to penetrate one or more element bodies completely, leading to fluctuations in the calculated crack propagation rates. However, with an increase in the number of stress cycles, both the crack propagation rate and fluctuations eventually stabilised.
By comparing the two operating conditions, it can be observed that the fluctuation amplitude of the crack propagation rate under condition A was approximately 0.0063, which is smaller than the fluctuation amplitude under condition B (0.022).
Figure 14 shows that the crack propagation rate in the region of maximum deformation was higher than that in the region of maximum stress. Simultaneously, the crack in the region of maximum deformation reached the stable propagation stage faster compared to the region of maximum stress. This is because the region of maximum stress undergoes larger stress gradient changes during the loading process, leading to significant differences in stress gradients at the ends of the crack. This results in a smaller stress ratio, exacerbating the amplitude variations in cyclic stress, and thereby prolonging the time for the crack propagation rate to stabilise.
5.6. Analysis of the Influence of High-Temperature Environment on Fatigue Life
To investigate the impact of temperature on the fatigue crack propagation of the lower surface of the deflector trough, it was necessary first to study the influence of temperature loads on the stress distribution of the lower surface.
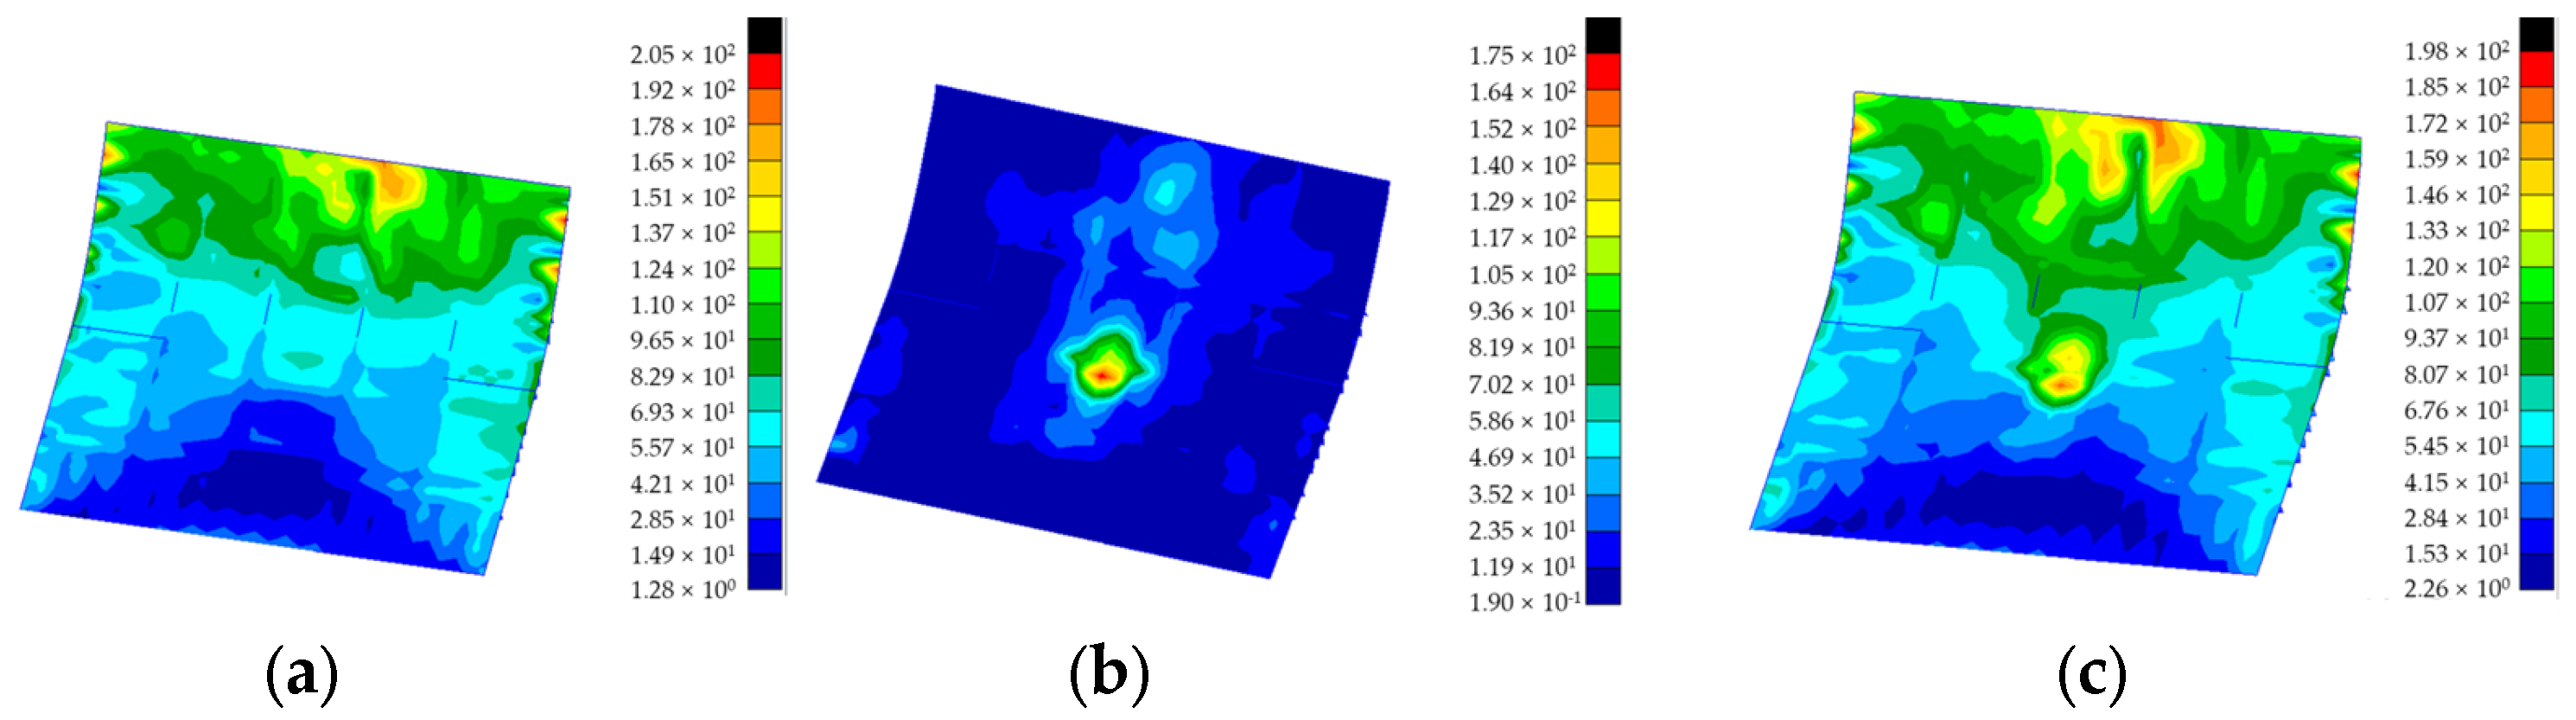
Figure 15 presents the stress contour map of the lower surface of the rocket deflector at a specific moment under the influence of temperature loads or without them. As shown in the diagram, under the action of a single impact force, the maximum stress on the lower surface of the deflector was located in the middle region directly impacted by the tail flame, with a peak value of 175 MPa. However, when coupled with temperature loads, the concentration of stress on the lower surface increased, and it was distributed more in the upper-middle region. The maximum stress value rose to 198 MPa, representing an increase of approximately 13%.
According to
Table 6, it can be observed that in the early stages of rocket launch, as the launch time progressed, the impact of coupled temperature load on the increase in stress on the lower surface of the deflector trough exhibited a gradually decreasing trend. When the rocket tail flame jet’s distribution state stabilised on the deflector trough’s lower surface, the temperature load increased the maximum stress value on the lower surface of the deflector trough, which was subjected only to a single impact force, by approximately 10%. Through
Figure 15, it can be observed that temperature load altered the stress distribution on the lower surface of the deflector under the action of a single exhaust plume impact load, causing the concentration of stress to shift from the central region directly impacted by the rocket’s tail flame to the upper-middle region. The maximum stress value induced by the temperature load (205 MPa) was greater than the maximum stress values under the exhaust plume impact load alone (175 MPa) and the coupled load (198 MPa). This indicates that the coupling of temperature and exhaust plume impact loads decreases the maximum stress on the lower surface, thereby enhancing the fatigue life of the deflector’s lower surface.
Applying the S-N curve method for calculating the crack initiation life on the lower surface of the deflector revealed that cyclic loading from a single impact force alone did not lead to structural fatigue failure on the lower surface. Consequently, there was no initiation or propagation of cracks on the lower surface of the deflector under the influence of an exhaust plume impact load alone.


