Article

Experimental and Numerical Analysis of Supporting Forces and Lashing Forces in a Ship Cargo Securing Scheme

1
School of Naval Architecture and Ocean Engineering, Jiangsu University of Science and Technology, Zhenjiang 212003, China
2
Marine Design and Research Institute of China, Shanghai 200011, China
*
Author to whom correspondence should be addressed.
These authors contributed equally to this work.
J. Mar. Sci. Eng. 2024, 12(1), 158; https://doi.org/10.3390/jmse12010158
Submission received: 28 December 2023 / Revised: 9 January 2024 / Accepted: 10 January 2024 / Published: 12 January 2024
(This article belongs to the Special Issue Advanced Analysis of Marine Structures—Edition II)

Abstract

:
The safety assessment of ship cargo securing systems is of significant importance in preventing casualties, vessel instability, and economic losses resulting from the failure of securing systems during transportation in adverse sea conditions. In this study, an independently designed cylindrical cargo securing scheme with supporting structures was adopted for investigation. Utilizing a sway device, three-degree-of-freedom coupled motion encountered during ship transportation was obtained, and data regarding changes in the support forces at the foundations and tension forces in the lashing ropes were collected. Subsequently, numerical simulations were conducted using the multibody dynamics software ADAMS 2020. The results obtained from the simulations were compared with the experimental data. The overall tendencies were accurately predicted in the numerical analysis. It was observed that the difference of the peak support forces between the numerical simulation results and the experimental data were within a 10% margin. In terms of the lashing ropes, the difference was limited, within 9%. These findings demonstrate that numerical simulation techniques can provide valuable insights for verifying the safety of practical cargo securing systems.

1. Introduction

During transportation, the securement of cargo and equipment has consistently been recognized as a significant influencing factor affecting vessel navigation and cargo safety. If the cargo securing method is not appropriate, the cargo may move to one side, increasing the risk of capsizing when the ship ‘s course changes rapidly [1]. When encountering adverse sea conditions, the violent motion of the vessel can lead to the failure of container securing systems, resulting in significant losses, such as container collapse, ship instability and capsizing, and casualties [2]. Vehicles and cargo, whether on the ship’s deck or in the cargo hold, require the implementation of securement measures to prevent cargo displacement and tipping during transport due to unexpected adverse weather conditions such as sudden waves and strong winds. However, there are limited stipulations within the relevant securing documentation concerning stowage techniques for non-standard cargo. In practical operational procedures, cargo securing is often executed based on the crew’s own experiences, lacking clear corresponding securing standard verification requirements. This results in inefficient securing practices, leading to occurrences of either excessive or insufficient restraints [3,4]. With the development of maritime transportation, the demand for enhanced safety in cargo securing methods has become increasingly urgent, prompting scholarly focus on the safety assessment of securing cargo on ship decks.
Some scholars employ experimental research to measure the forces acting on shipborne cargo during actual transportation processes. Mikael Sternsso and Bjorkenstam [5] utilized vehicles equipped for long-term measurement of lashing forces and deck’s reaction forces on the Ro-Ro vessel’s deck. Their findings revealed limitations in traditional vehicle securing methods, with lateral displacement primarily governed by friction forces between tires and the deck. Junbo Jia [6] conducted experimental research on the frictional forces experienced by automobile tires on Ro-Ro vessels, emphasizing the safety concerns related to lateral displacement and sliding. In subsequent research, Junbo Jia [7] proposed that the safety of vehicle transportation is primarily influenced by the oscillatory motion of ships, and the motion of the ship’s hull is highly correlated with wave height and loading conditions. Under specific weather conditions and on certain routes with favorable sea conditions, vehicles can be securely positioned in most areas of the ship without being fastened. Matusiak [8] also conducted simulations of unfastened cargo in irregular wave conditions at an earlier stage, recognizing the indispensability of securing schemes due to motion-induced sliding forces exceeding available friction. The Swedish Transport Administration, in collaboration with the Swedish company MariTerm AB, conducted extensive tensile rupture tests on chains and lashing straps. It was observed that the strength of lashing straps significantly decreases with prolonged usage, whereas the strength of chains remains relatively unchanged. However, when utilizing chains for securing, there is a higher probability of rupture occurring at the chain tensioner location. Therefore, special attention should be given to the strength of chains at the chain tensioner location [9].
Experimental research provides relatively accurate and realistic feedback on cargo securing conditions under actual ship navigation motions. However, experimental research typically involves lengthy cycles and requires a significant investment of manpower and resources, so the verification of securing schemes for shipping companies can be cost-intensive. The rapid development of finite element simulation technology and multibody dynamics simulation technology has facilitated the study of cargo securing on ships. Turnbull [10] simplified the suspension, tires, and supports of semi-trailers and established a numerical model for securing semi-trailers on the deck of Ro-Ro vessels. They conducted a detailed analysis of the forces experienced by the lashing ropes of vehicles during the overall roll and pitch motions of the Ro-Ro vessel. Surendran [11] established a numerical model of ship motion to ensure safety during navigation. The research extensively investigated the swaying issues of Ro-Ro vessels in waves and explored strategies to enhance ship stability when encountering resonance conditions with waves. Kawamura [12] utilized GPU to conduct Smoothed Particle Hydrodynamics (SPH) simulations of the six degrees of freedom (6DoF) ship motion under maritime transport conditions. Subsequently, a comparative analysis was performed by comparing the SPH simulation results with actual test data to investigate the predictive accuracy of the SPH method. Jiaqi Liu, Chuntong Li, Deyu Wang [13,14,15,16] utilized numerical simulation software to simulate container lashing bridges. They conducted comparative analysis by performing scaled-down model tests and found a high degree of concordance between the calculated results and the experimental outcomes. This indicates that existing numerical simulation techniques can effectively enhance design efficiency and precision, possessing a degree of generality. Fangzhen Song [17] utilized ADAMS software to construct a dynamic model and employed spring forces to connect the ship’s hull model, simulating buoyancy on the water surface. This was done to verify the role of ballast water in maintaining the stability of the ship’s hull. Edwin Kreuzer [18] has developed a software that utilizes the principles of multibody dynamics to compute the lashing forces of cargo securing systems on Ro-Ro ships. This software permits the verification of the safety of the lashing system by inputting the vessel’s motion, offering a convenient tool for shipping companies. This software serves as a convenient tool for shipyards and suppliers to perform efficient checks on lashing securing systems. Nam Woongshik [19] employed ABAQUS finite element analysis to predict the feasibility of using D-ring devices in lashing securing systems. Zhu Hong-jun [20] established a dynamic model of a ship-loading and unloading device using ADAMS software, proposing structural optimization design schemes based on forces acting on wheels and lashing straps.
For the securement of non-standard goods, Code of Safe Practice for Cargo Stowage and Securing (CSS Code) provides provisions on securing schemes, equipment, and strength. On this basis, Jerzy Kabacinski [3] proved that simplification in the standard calculation affects the safety margin of non-standard goods and proposed a more reliable calculation method without simplification. Ling De-chao [21] also started from the specification and improved the horizontal and vertical balance checking methods of non-standardized cargo units, considering meteorological conditions. The specification calculation can provide a reference for the safety verification of cargo securing. However, the focus of the specification is on the strength of the securing rigging, and there are few studies on the influence of the load on the cargo itself. At the same time, the calculation method of the specification simplifies the actual situation, affecting the reliability of the calculation results.
Utilizing numerical simulation techniques can effectively enhance safety assessments for securing solutions, offering valuable insights for their design and optimization. However, the reliability of simulation calculations requires further research. Previous studies have primarily focused on investigating whether the lashing forces on the securing system during transportation exceed the allowable loads for lashing. However, with the differentiation of transported goods, the impact of the lashing system on the load of the secured cargo should also be taken into consideration.
This study presents a proprietary securing scheme that utilizes pedestal supports and lashing ropes to secure a cylindrical cargo, with the aim of investigating the characteristics of lashing rope forces and pedestal support forces in the securing scheme. A three-degree-of-freedom coupled motion swing experiment was conducted using a dedicated three-degree-of-freedom sway test rig. Subsequently, numerical simulations of the experimental conditions were performed using the multibody dynamics software ADAMS. A comparison between the tension data of the lashing ropes and the pedestal support forces obtained from both methods indicated a favorable agreement. These findings suggest that the simulation results can serve as a reliable reference for future numerical assessments of the safety of cargo securing schemes.

2. Experimental Investigations

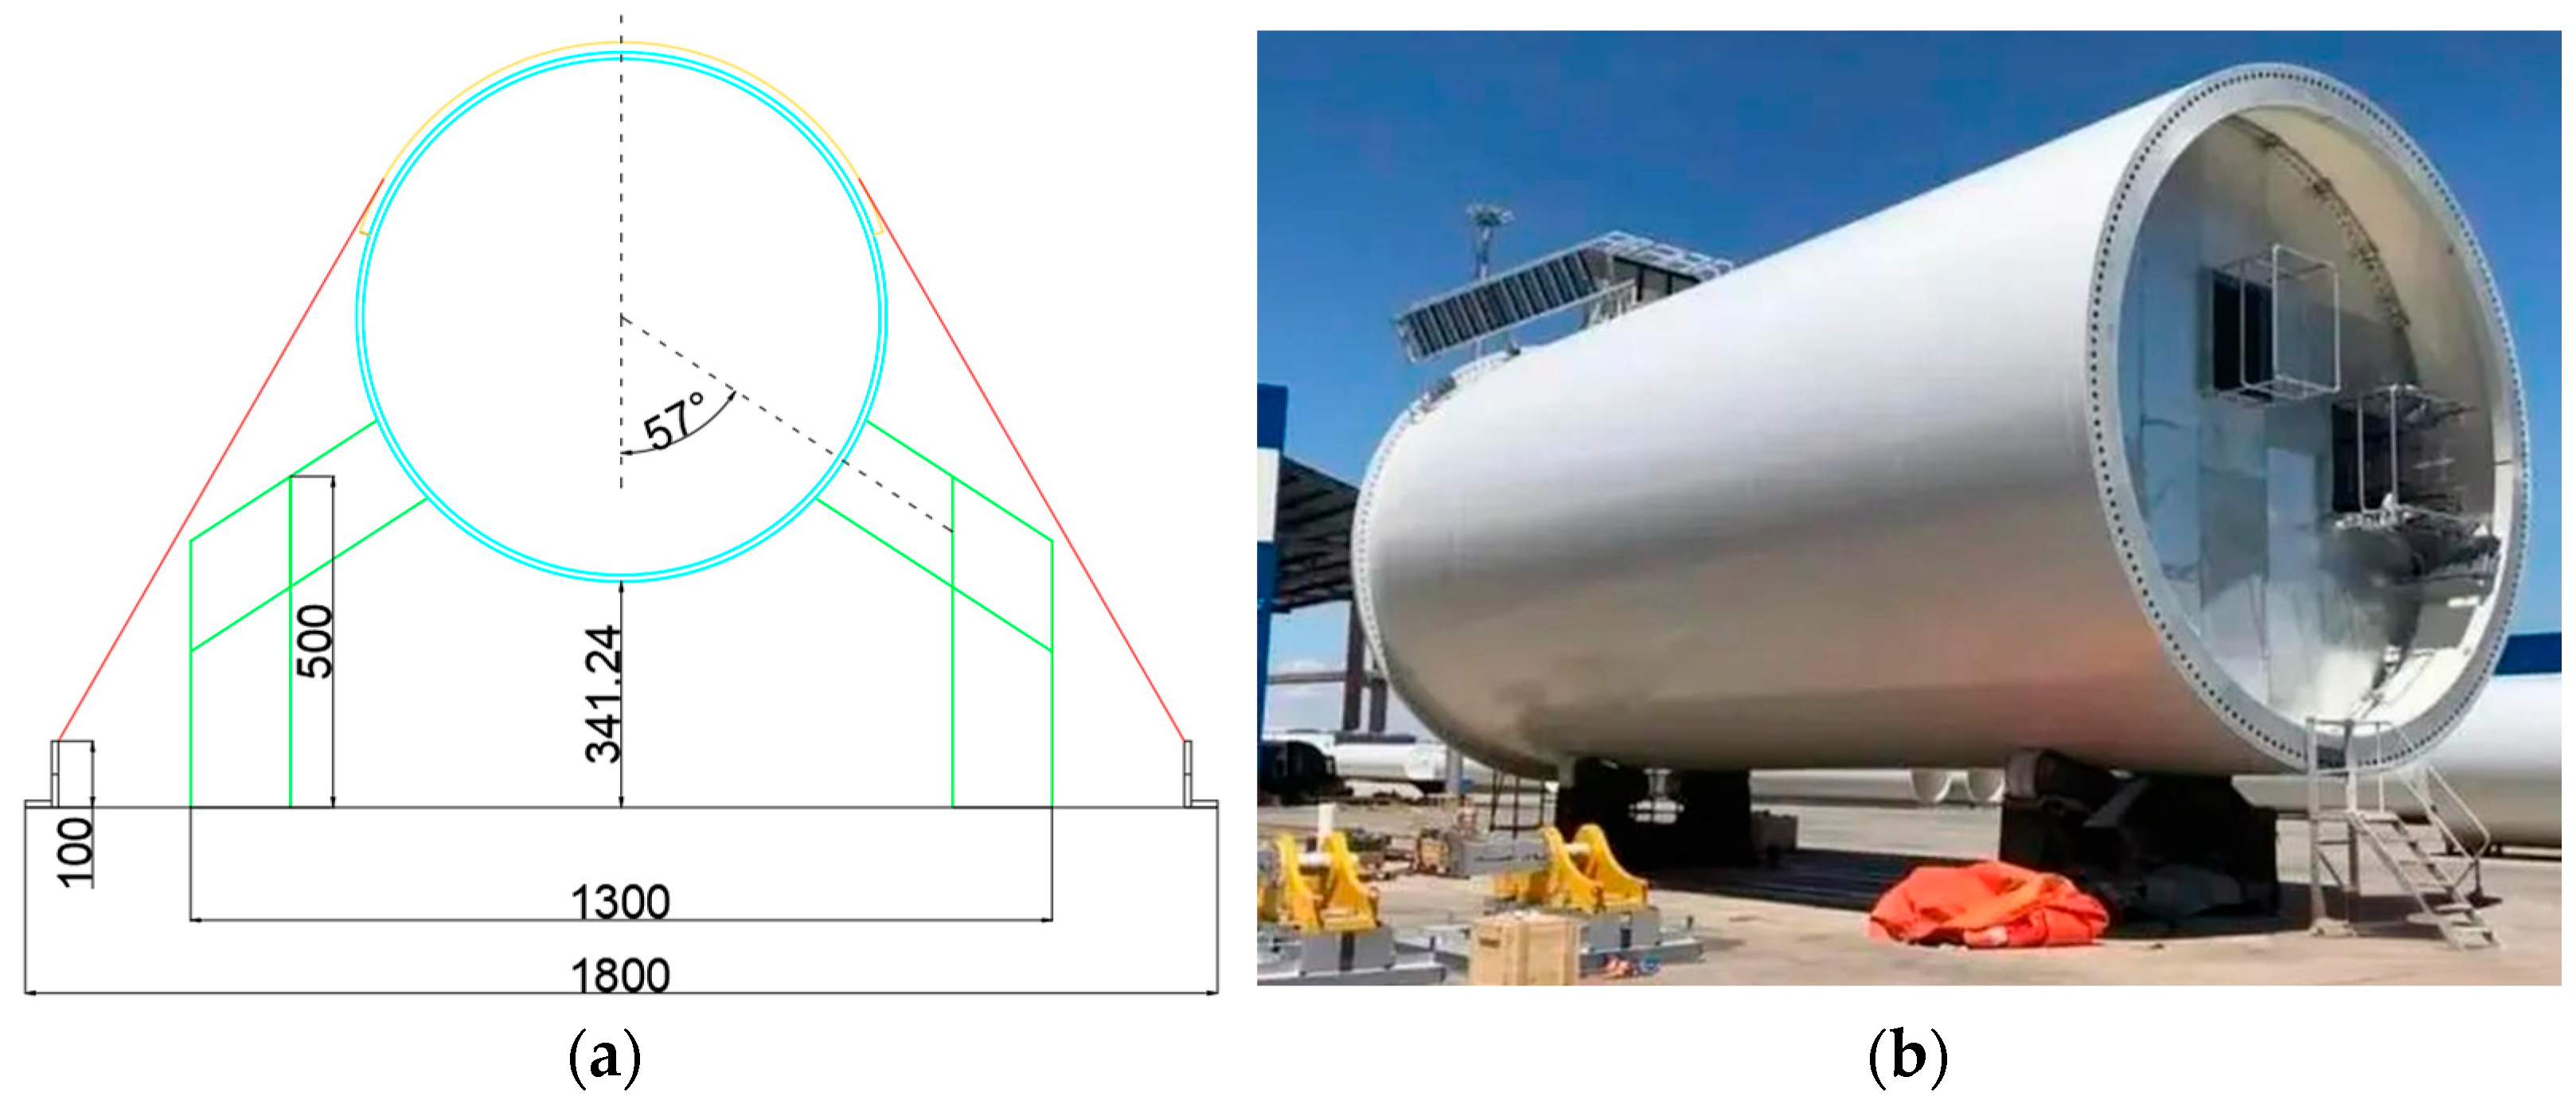
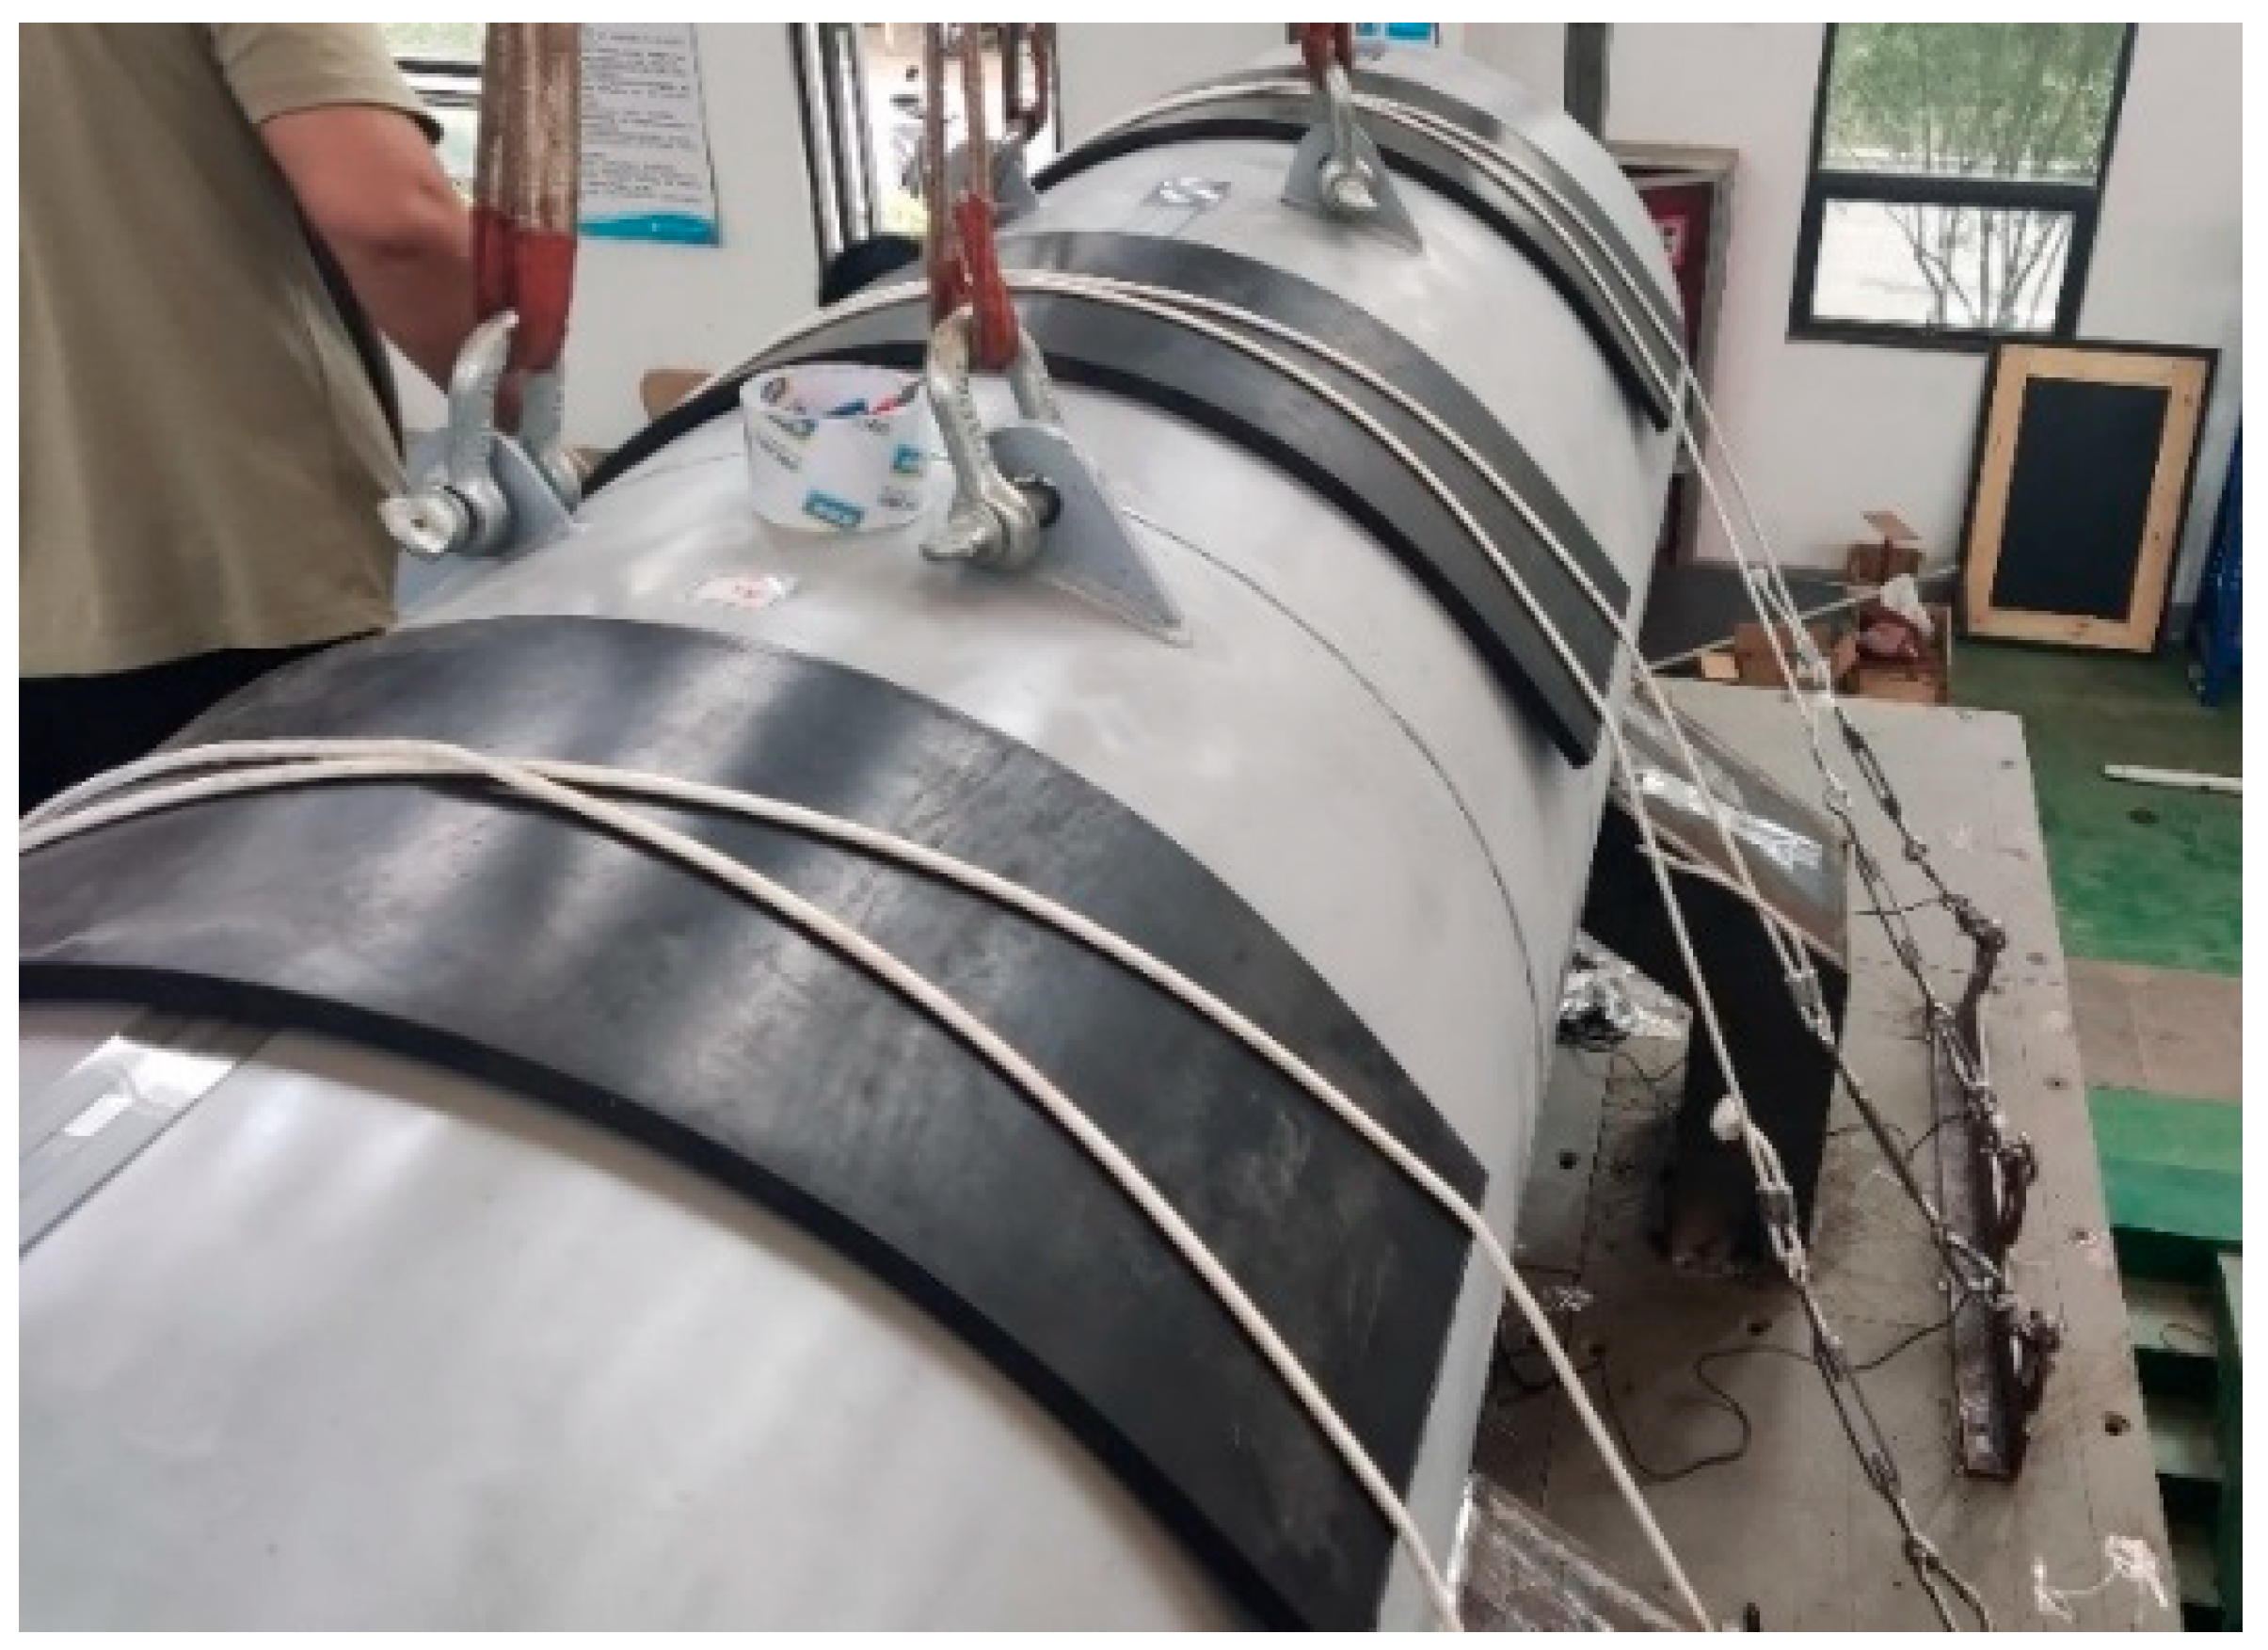
2.1. Test Model and Arrangement

In this study, the sway test was conducted using a three-degree-of-freedom swing test apparatus, as depicted in Figure 1. The overall structure of the device consists of three main components: the sway table base, the motion device, and the securing and lashing platform. The carrying platform of this test rig measures 2 m × 4 m, with a maximum load capacity of 3 t. It is capable of simulating multi-degree-of-freedom coupled motion with angular ranges of ±30° in roll, ±15° in pitch, and vertical displacement of ±0.35 m, thereby replicating the roll, pitch, and heave motions of the securing system during a ship’s motion.
In this study, a similar securing scheme was designed with reference to the placement of the wind turbine tower. It is assumed that the fixed object is a cylindrical structure supported by four pedestals. In order to prevent the cylinder from falling off the pedestals, the lateral spacing of the pedestals is increased. The bracing part of the pedestal points toward the center of the cross section of the cylinder, forming a 57° angle with the vertical direction. Use the rope to reload the upper side of the cylinder to complete the overall securing. See Figure 2.
The primary model used in the experiment is a thin-walled cylindrical structure with a length of 2400 mm, an outer radius of 400 mm, and a wall thickness of 10 mm. The overall mass of the model is 465 kg, and lifting lugs are welded on the top for hoisting, relocation, and safety purposes. See Figure 3.
The cylindrical model is placed on four symmetrically arranged L-shaped support pedestals, constructed using 20 mm-thick steel plates. The supporting surfaces of the pedestals are inclined at an angle of 57° with respect to the vertical axis. The steel plates on the supporting surfaces are curved to facilitate a better fit with the test model. The bottom of the support pedestals is welded to the surface of the sway table at predetermined positions. The dimensions and actual installation of the support pedestals are depicted in Figure 4.
After placement, rubber pads are positioned above the cylindrical model, and lashing ropes are arranged in a cross pattern on top of the rubber pads for preload fixation, as shown in Figure 5.
In this experiment, the center of the sway table securing platform plane is considered as the origin point, with the x-axis defined along the longitudinal direction of the sway table, the y-axis along the transverse direction, and the z-axis representing the vertical direction.
As shown in Figure 6, the blue wireframe represents the test model, the green wireframe represents the support pedestals, the yellow wireframe represents the rubber pads, and the red lines represent the lashing ropes used for cross preload fixation. In this experiment, two lashing configurations were selected: the middle condition and the offset condition. In the middle condition, the cylindrical model is positioned at the center of the platform. The four pedestals are divided into two groups and symmetrically arranged about the y-axis in the XY plane. The distance between the two groups of pedestals in the x-axis direction is 1100 mm. Above the cylindrical model, three rubber pads of dimensions 1000 mm × 300 mm × 10 mm are symmetrically placed, with a spacing of 450 mm between each pad. Two nylon ropes are symmetrically crossed and fixed on each rubber pad, with their intersection at the center of the rubber pad. The two ends of the ropes are secured to lashing components on the platform, which are symmetrically arranged about the x-axis, with a spacing of 1800 mm. The distance between the lashing points on the same side of the rubber pad is 500 mm, and the lashing points are positioned 140 mm above the platform surface. The pedestal placement location shifts towards the negative x-axis direction by 450 mm compared to the centered placement, while all other component placement positions remain the same.
The x-axis positive direction is defined from left to right, while the y-axis positive direction is on the left side and the y-axis negative direction is on the right side. The positions of the rubber pads along the negative x-axis direction are ordered and coded as X1, X2, X3. The lashing rope securing points are encoded with reference to the rubber pad coding and follow the format ‘Rubber Pad Code—Securing Point Position Information’. The securing points on the left side of the respective rubber pads on the negative x-axis direction are sequentially labeled as z1, z2, while those on the right side are labeled as y1, y2. For example, ‘X2-y2’ represents the second securing point on the right side of the second rubber pad when viewed from the negative x-axis direction. The support pedestal coding uses ‘DZ’ to denote the pedestal, ‘y’ for the right side of the test model, and ‘z’ for the left side of the test model. They are sequentially numbered as 1 and 2 on the negative x-axis direction. For instance, ‘DZ-z2’ indicates the second pedestal on the left side of the test model when viewed from the negative x-axis direction.

2.2. Selection of Test Conditions

In order to assess the influence of different motion parameters on various lashing methods and to conduct an in-depth analysis of the load variations in lashing components, the following experimental scenarios have been established in conjunction with the test conditions, as summarized in Table 1.
According to the test conditions, M/O represents the middle and offset conditions, respectively, and 1/2/3 represents different preset motion parameter groups. The motion parameters are shown in Table 2.

2.3. Test Data Acquisition

Figure 7 illustrates the arrangement of membrane pressure sensors and tension sensors used in the experiment. The cylindrical model simulates cargo that is supported.
Each support pedestal is equipped with rubber blocks and membrane pressure sensors on the support surface. The rubber blocks are slightly smaller than the sensing area of the membrane pressure sensors to ensure that the contact area is within the sensing region. The sensors measure all the pressures on the contact surface, and the numerical values of the support forces are directly recorded through dynamic signal acquisition, documenting the load changes of each support pedestal under different motion postures during the experiment. The lashing forces during the experiment are collected using tension sensors. Tension sensors are positioned on both sides of each lashing rope, near the lashing point locations. The sensors are connected to the basket screws through loops, and the lashing ropes are secured to the other end of the basket screw. Prior to the start of the experiment, the tension in each lashing rope is adjusted to 200 N by adjusting the basket screws. After the arrangement is completed, the dynamic signal acquisition allows for the direct recording of the changes in lashing forces. The two overall arrangements for the experiment are shown in Figure 8.

2.4. Partial Test Data

Figure 9 and Figure 10 show the time-history curves of support forces and lashing rope loads for motion conditions M3 and O3 during the experiment. In the centered condition, due to the symmetric arrangement of components, the support forces of each pedestal oscillate within a relatively concentrated range. However, in the offset condition, as the pedestals are biased toward the rear, there are significant differences in the support forces between the front and rear groups of pedestals. The front pedestals, being closer to the center of gravity of the cylinder, experience much higher support forces compared to the rear pedestals. Additionally, in the offset condition, the first group of lashing ropes is subjected to a larger relative displacement due to the cylinder’s overhang position, resulting in greater variations in tension in this group compared to the other two. When comparing the two conditions, although there are significant differences in the distribution of support forces due to the varying positions, the resultant forces are relatively similar since the model’s motion posture remains consistent under the same motion parameters. Due to the differences in the periods of motion across different degrees of freedom, variations in phase differences occur during motion, leading to periodic changes in peak loads for various components in the whole movement.

3. Numerical Simulation

In this section, based on the model test conditions described above, a simulation analysis of the swinging motion of the model under lashing states was conducted using thedynamics software ADAMS. This analysis resulted in time–history curves for the loads on each support pedestal and lashing ropes during the motion. These simulated results were compared with the experimental results to validate the numerical simulation technique.

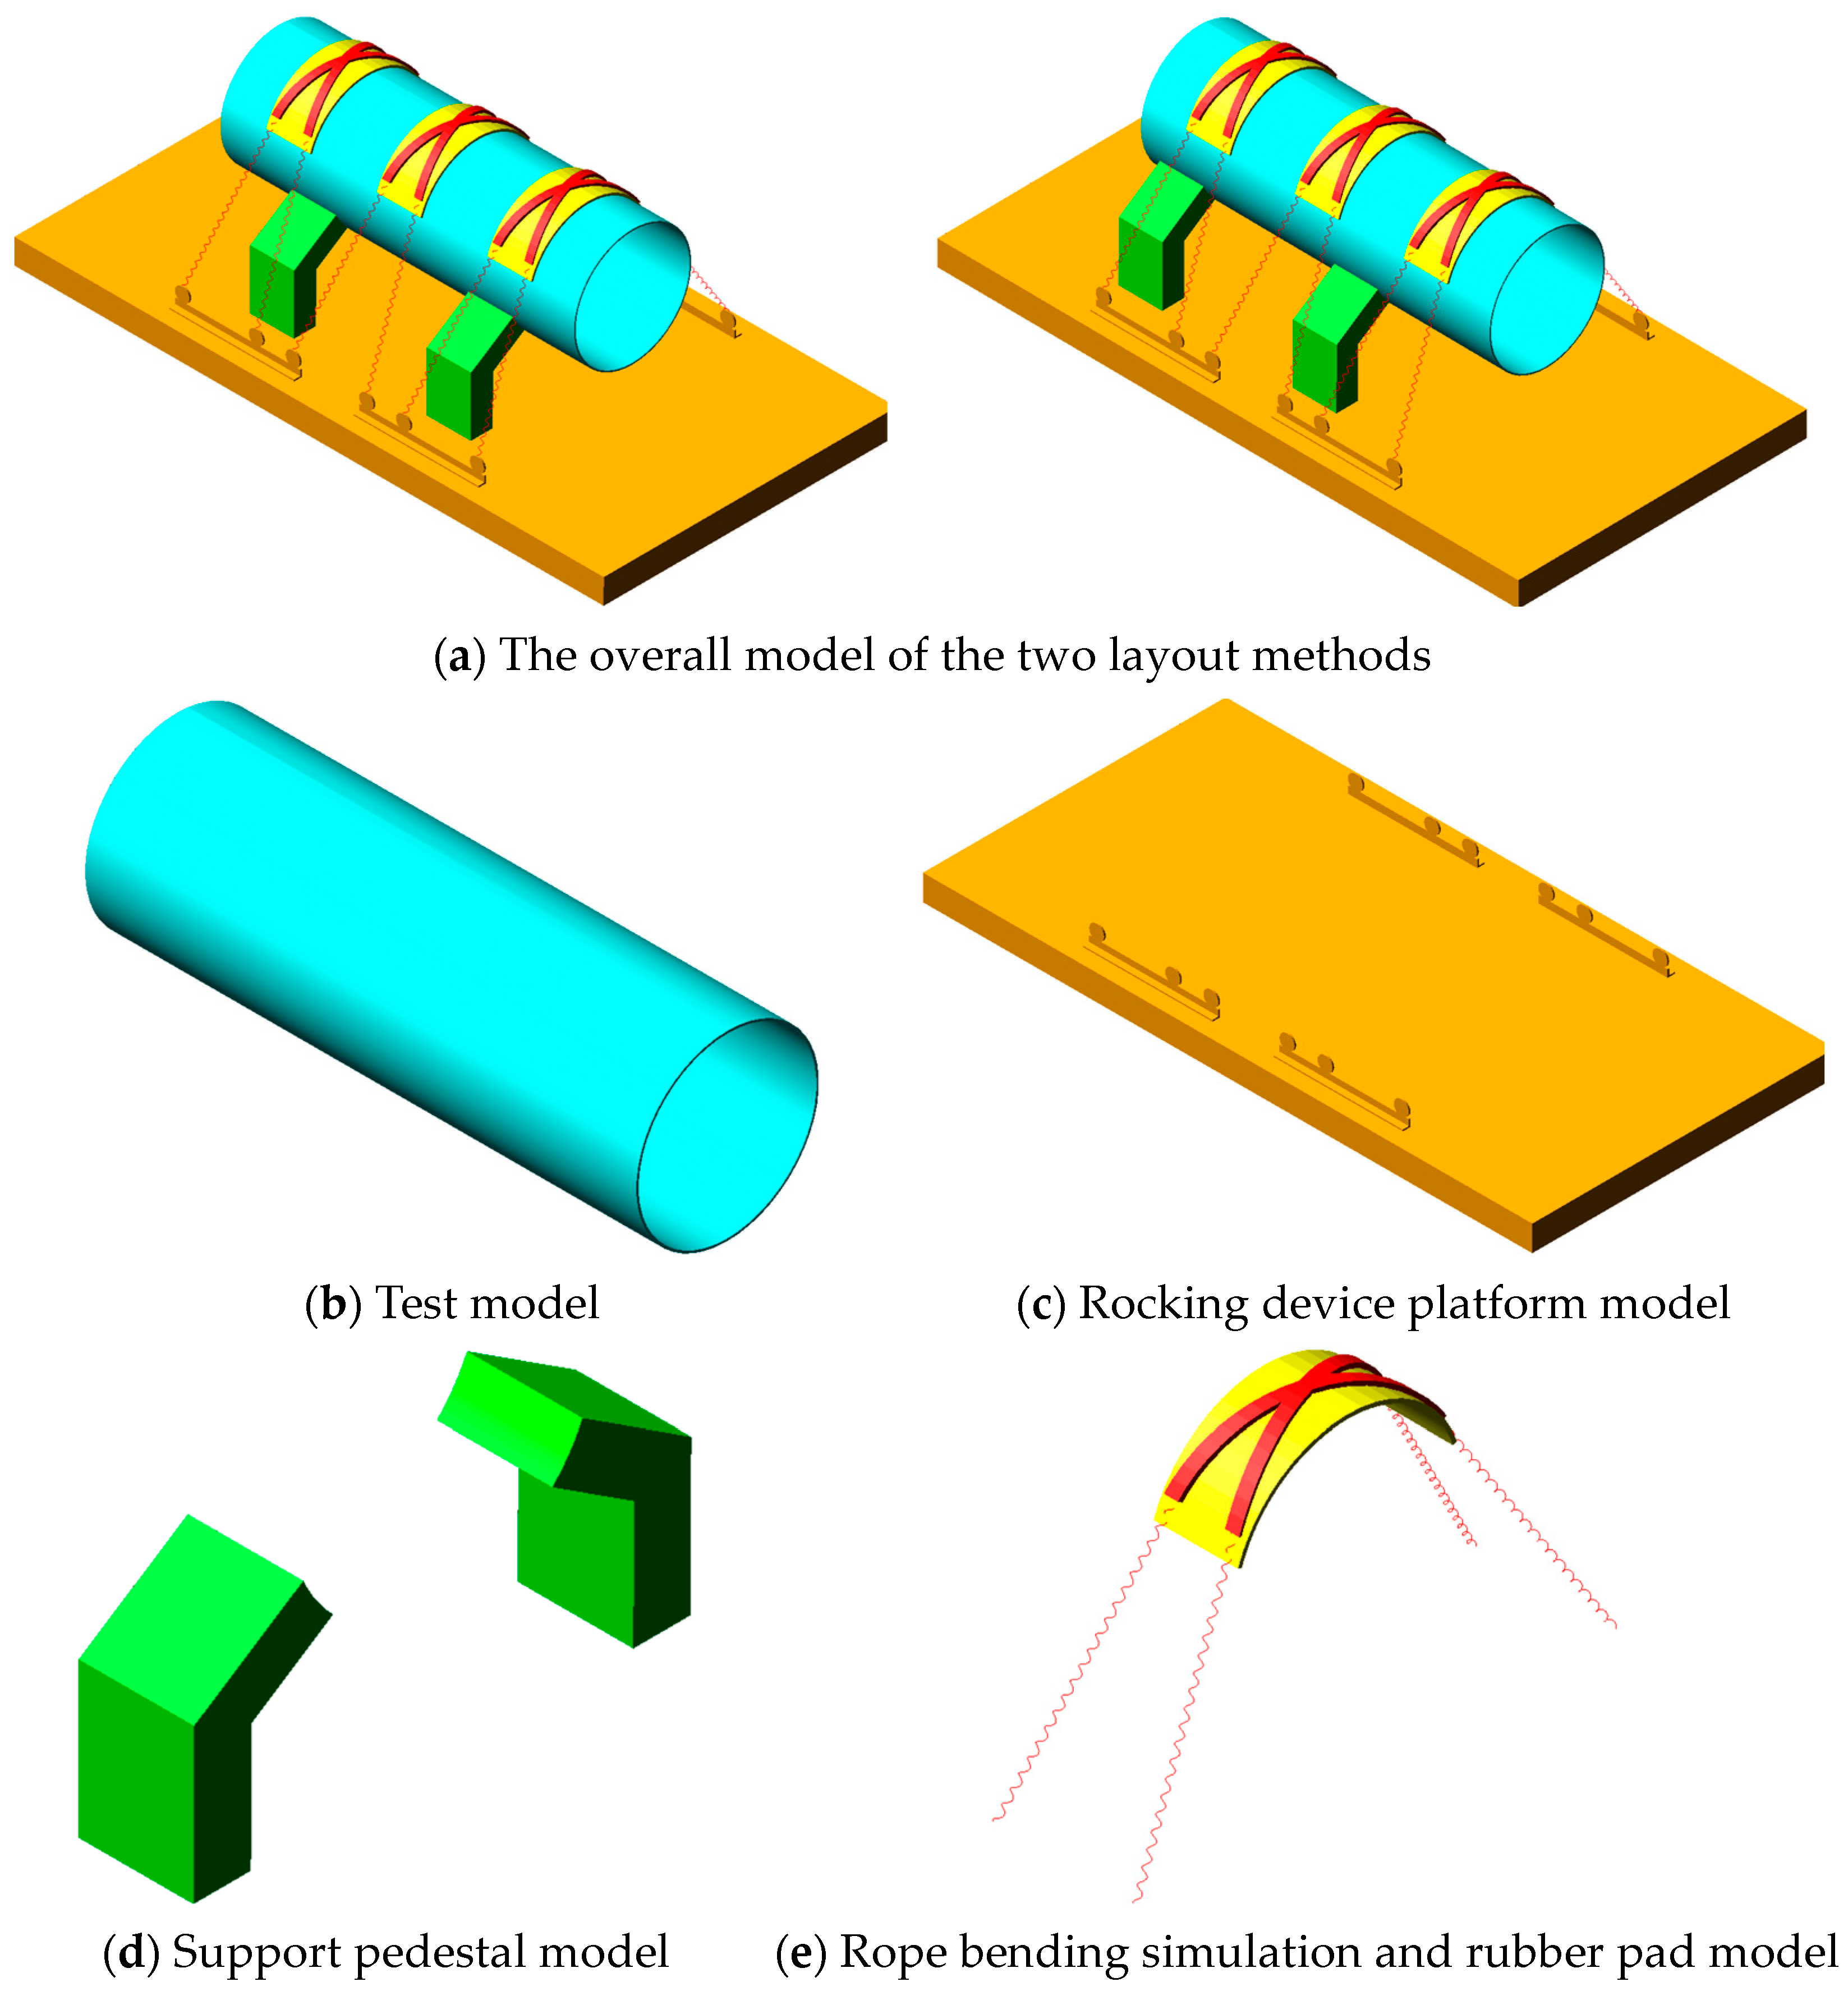
3.1. Numerical Simulation Model

Figure 11a represents the overall computational models for both lashing configurations. When conducting simulation analyses of the model’s lashing experiment, the focus was on the variation of support pedestal forces and lashing rope loads during the overall motion. The overall motion can be achieved by applying driving functions to the platform model. Therefore, the motion device below the platform is omitted in the modeling, and models are only established for the platform and all components above it. Figure 11b illustrates the simulation model for the test model, which is consistent with the experimental model and made of ordinary steel. Figure 11c shows the numerical simulation model for the swinging device platform, where a driving function was applied to simulate relative swinging motion with respect to the ground, replicating the actual test platform’s motion. Figure 11d represents the numerical simulation model for the support pedestals, with each pedestal individually modeled and fixed relative to the swinging device platform to simulate the pedestals welded to the platform surface. Figure 11e shows the simulation model for the lashing ropes’ compression loading method. Due to the limitation of ADAMS in modeling spring forces as point-to-point linear connections, it cannot directly simulate the bending compression state of the lashing ropes. Therefore, a cross-shaped block was created above the rubber pad to represent the lashing rope positions, and these blocks were connected at both ends to the corresponding lashing points to simulate the lashing ropes’ compression loading.

3.2. Simulation Method

3.2.1. Contact Parameters

To individually output the support forces for each support pedestal in the modeling process, the models of the four support pedestals were connected to the platform using fixed joints. Contact settings in the Forces module were used to set the Coulomb friction coefficients and contact parameters for the overall simulation model. Since rubber pads were placed on the contact surfaces of the support pedestals, the contact between the support pedestals and the test model was configured based on the interaction between rubber and steel. The parameters for contact forces were set based on classical theoretical calculations [22].
According to Hertz contact theory, the relationship between contact normal force P and the deformation δ can be derived from:
δ = a 2 R = 9 P 2 16 R E * 2 1 3
It can be deduced that:
P = K δ 3 2
In this Equation, K depends on the contact object material and structure shape.
K = 4 3 R 1 2 E *
where 1 R = 1 R 1 + 1 R 2 . R1, R2 are the contact radius of contact objects at the contact point. 1 E * = 1 μ 1 2 E 1 + 1 μ 2 2 E 2 . μ1, μ2 are Poisson’s ratio of two contact objects’ materials. E1 and E2 are modulus of elasticity of two contact objects’ materials.
According to the Mechanical Design Manual, the static friction coefficient of rubber to steel is 0.8, and the dynamic friction coefficient is 0.5.
These settings allowed for the simulation of contact interactions between the support pedestals and the test model, enabling the calculation and output of support forces for each individual pedestal during the simulation.

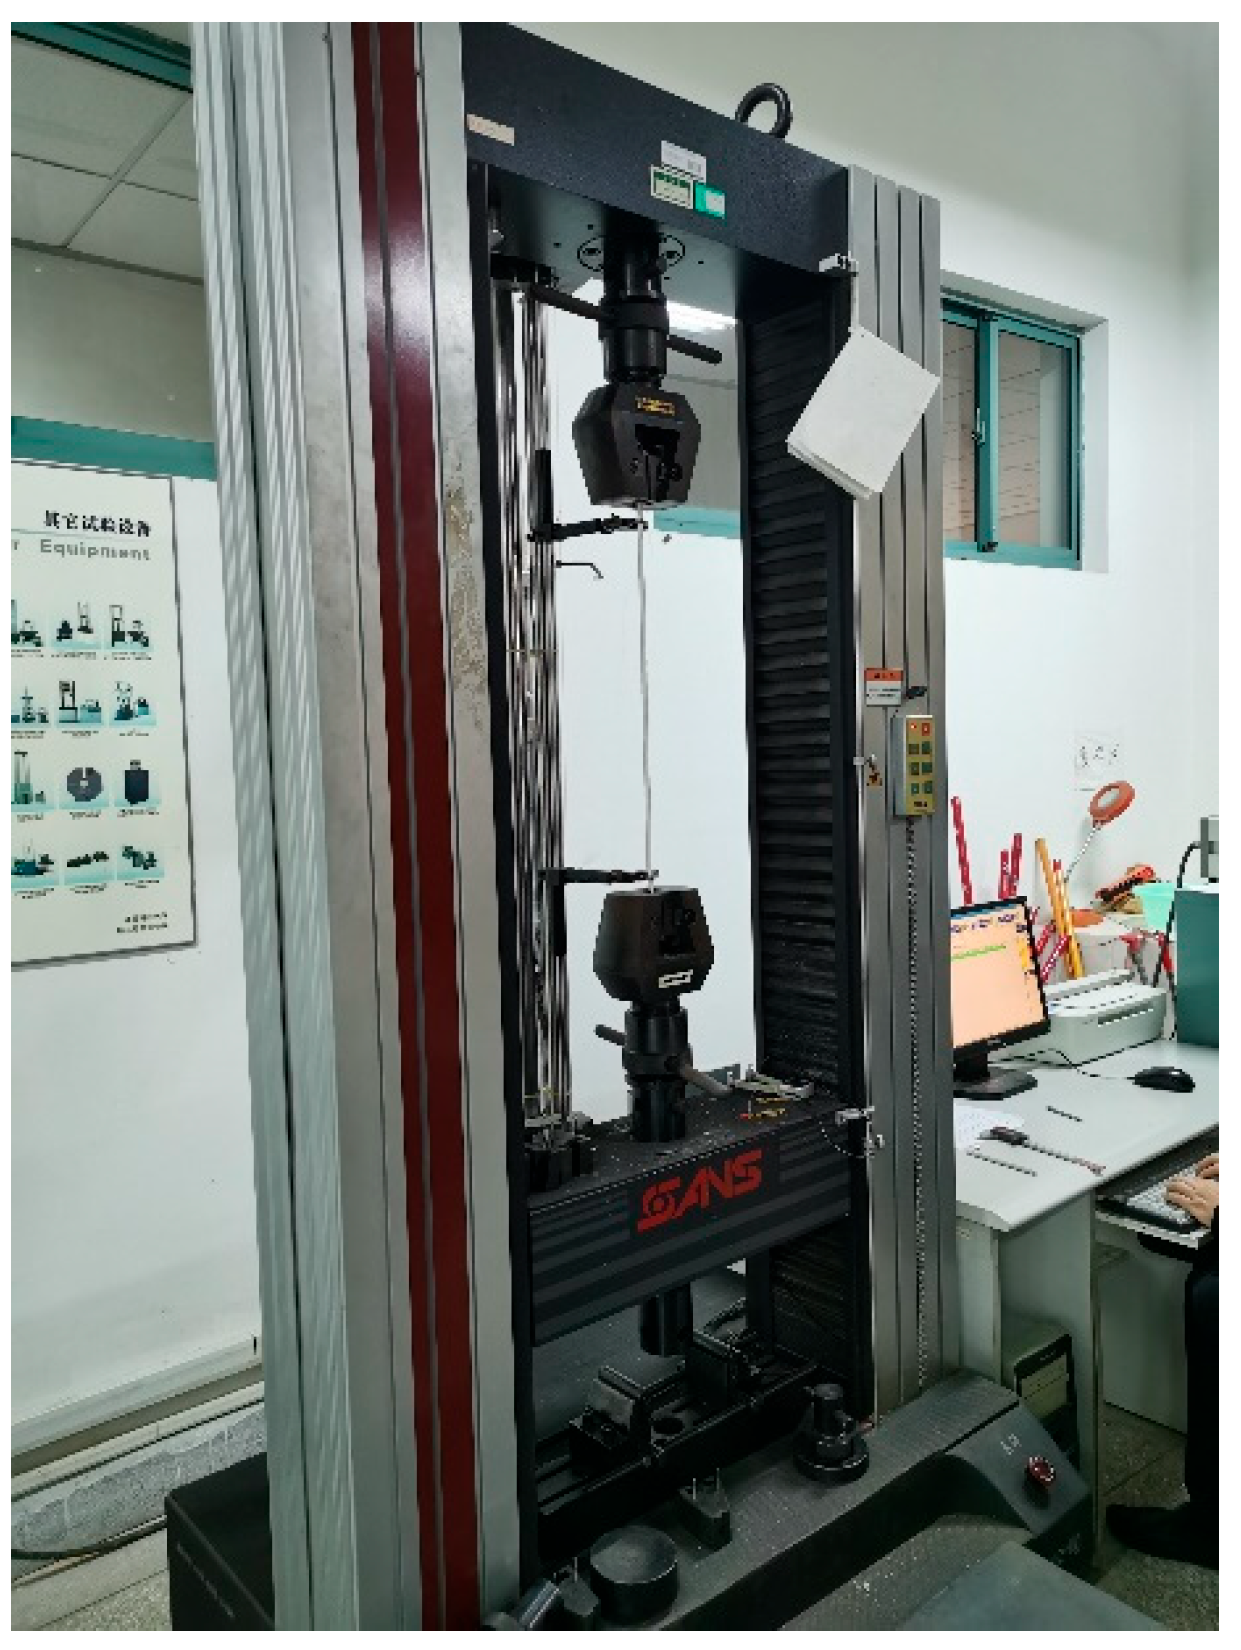
3.2.2. Lashing Stiffness

As the ropes only experience tension and not compression, the relationship between spring force and spring length variation was defined using spline parameters in the Forces module of the software. This was done in a way that ensures the spring force is zero when the rope length is less than the initial value. During the spring setup process, an initial spring length shorter than the securing rope spacing was set to apply the pre-tension force to the ropes.
The stiffness value of the ropes was determined through tensile testing. Tensile testing of the nylon ropes was conducted on a universal testing machine, as shown in Figure 12. The obtained stress-strain curve from the tensile test is illustrated in Figure 13. It was observed that the force-displacement curve of the 500 mm-long nylon rope exhibited linear behavior. Through linear fitting, it was determined that the stiffness value of the 500 mm nylon rope is 85.09 N/mm. Subsequently, the corresponding stiffness values were calculated for the actual lengths of nylon ropes used and defined in ADAMS for the spring forces.

3.2.3. Swing Device Platform Motion

The rotation of the swinging platform relative to the reference point (pivot) was defined using the Revolute joint connector within ADAMS software’s Connectors module. The motion of the swinging platform was defined using the Rotary Motion pair in the Motions module. In this experiment, the pivot point for the swinging platform’s motion was located 180 mm below the center of the platform’s surface.
The motion of the platform is a sinusoidal excitation motion with a fixed amplitude relative to the pivot point. The drive functions for each degree of freedom motion are defined as follows:
A × sin ( 2 π / T × t )
where A represents the motion amplitude, which, in the case of oscillatory motion, signifies the swing amplitude in radians, and in the case of pendulum motion, it represents the displacement amplitude; T is the motion period; t is the time variable.

3.2.4. Time Step Setting

In the simulation calculations, the time step size has a significant impact on the stability and accuracy of the results. A shorter time step results in higher accuracy. Figure 14 shows the support force curve of the pedestal calculated by setting the analysis steps at 10, 20, 50, 100, 500 and 800 steps per second under the M3 condition. When the analysis step is below 100 steps per second, there are a lot of unreasonable fluctuations in the curve. When the analysis step is greater than or equal to 100 steps per second, the resulting calculation curve remains smooth.
In order to take into account both calculation accuracy and calculation efficiency, in this simulation, the time step was set to 500 steps per second.

4. Results and Discussion

4.1. Support Force of Pedestal
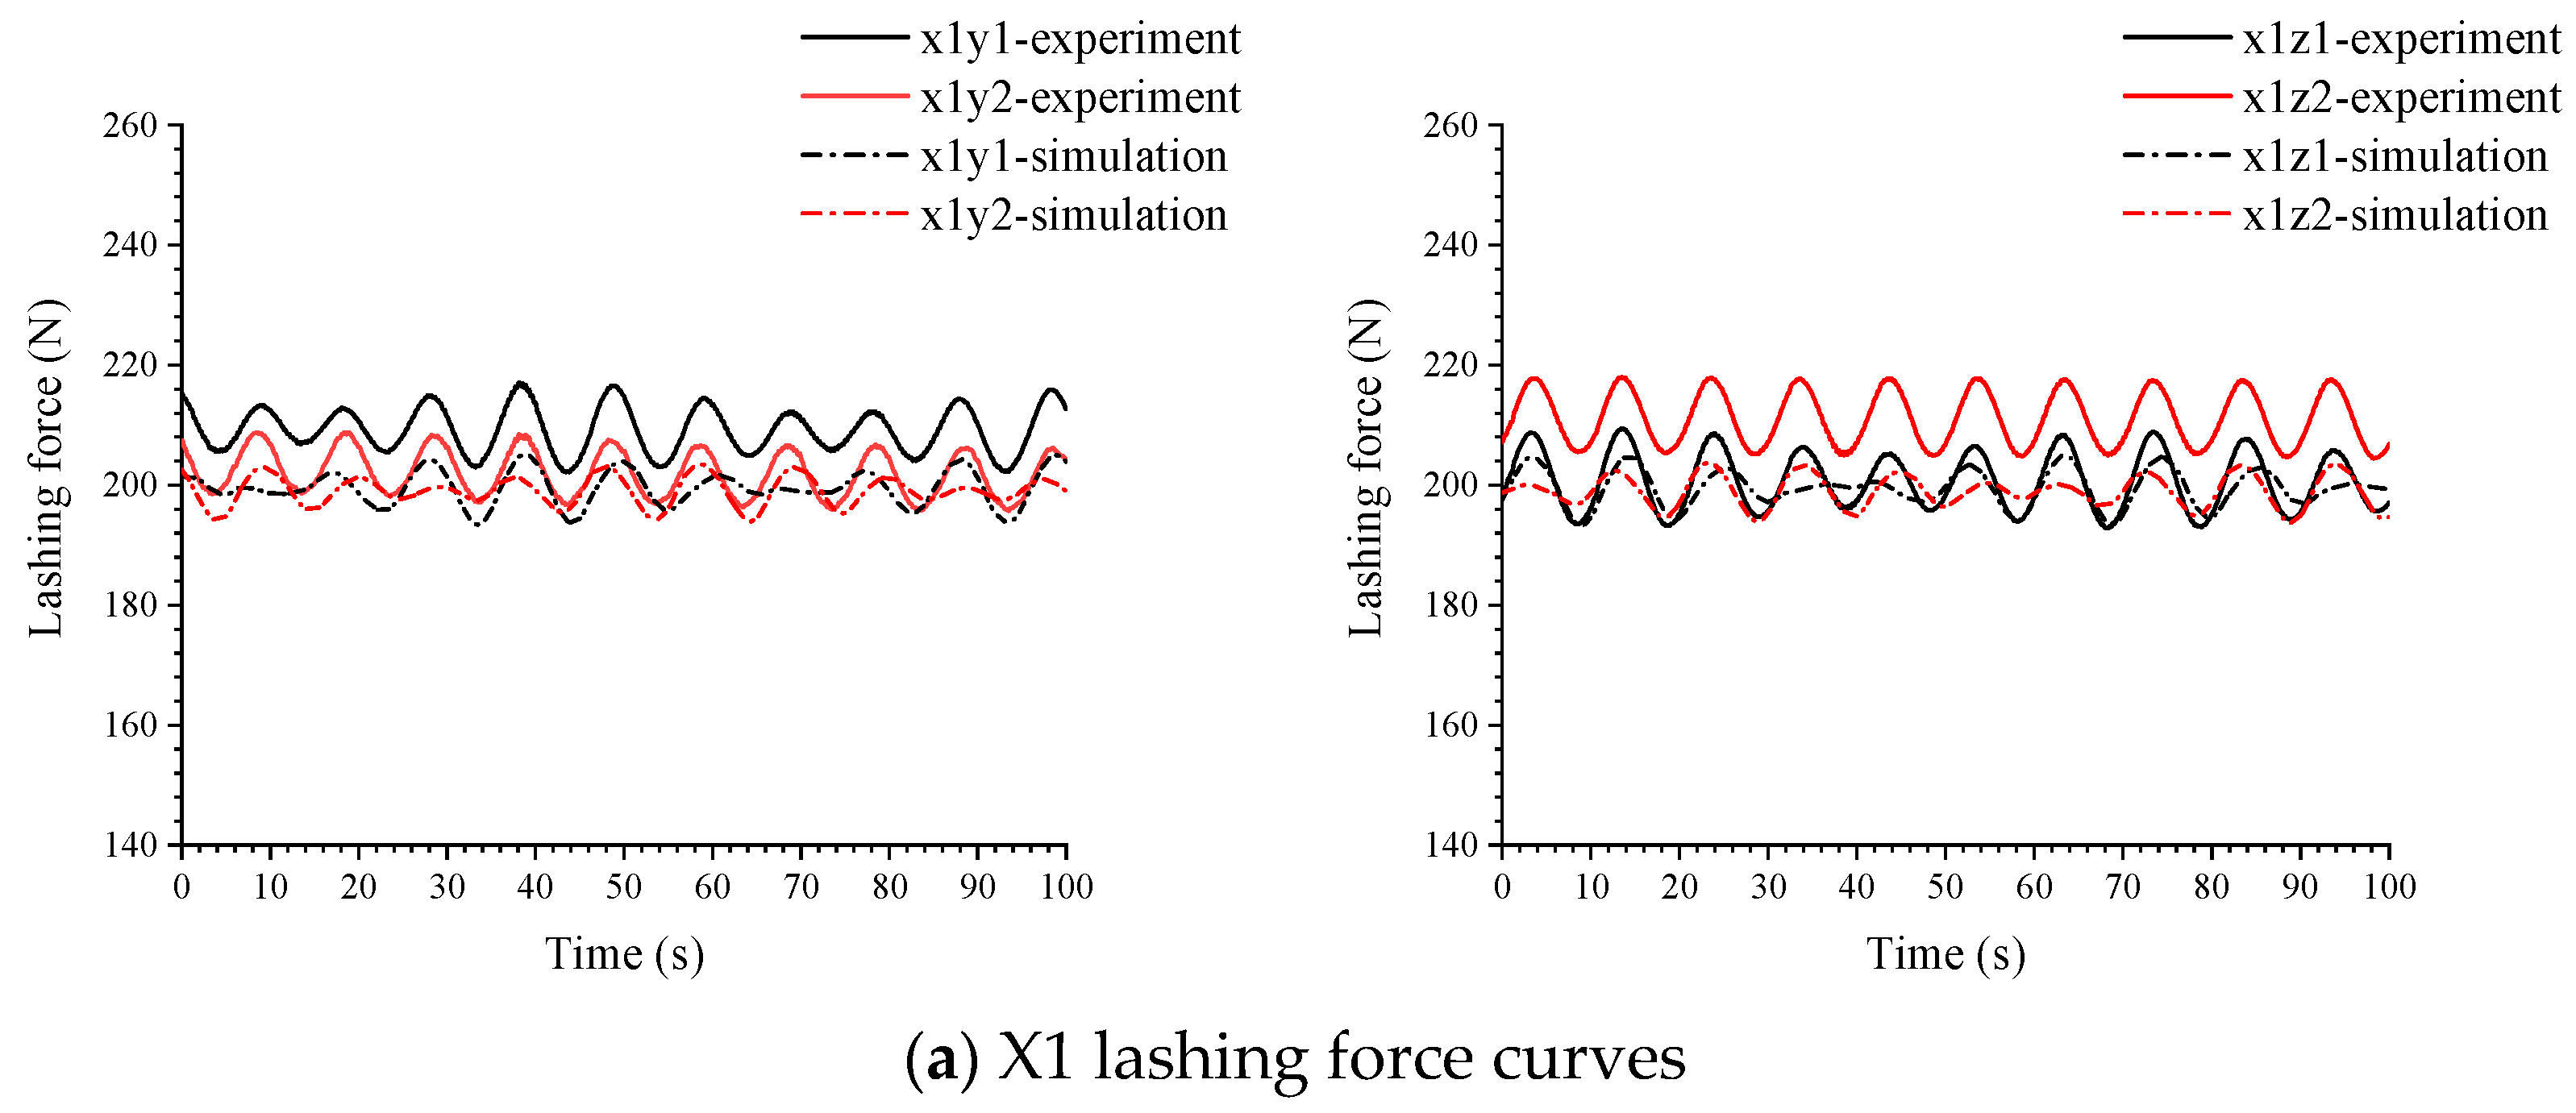
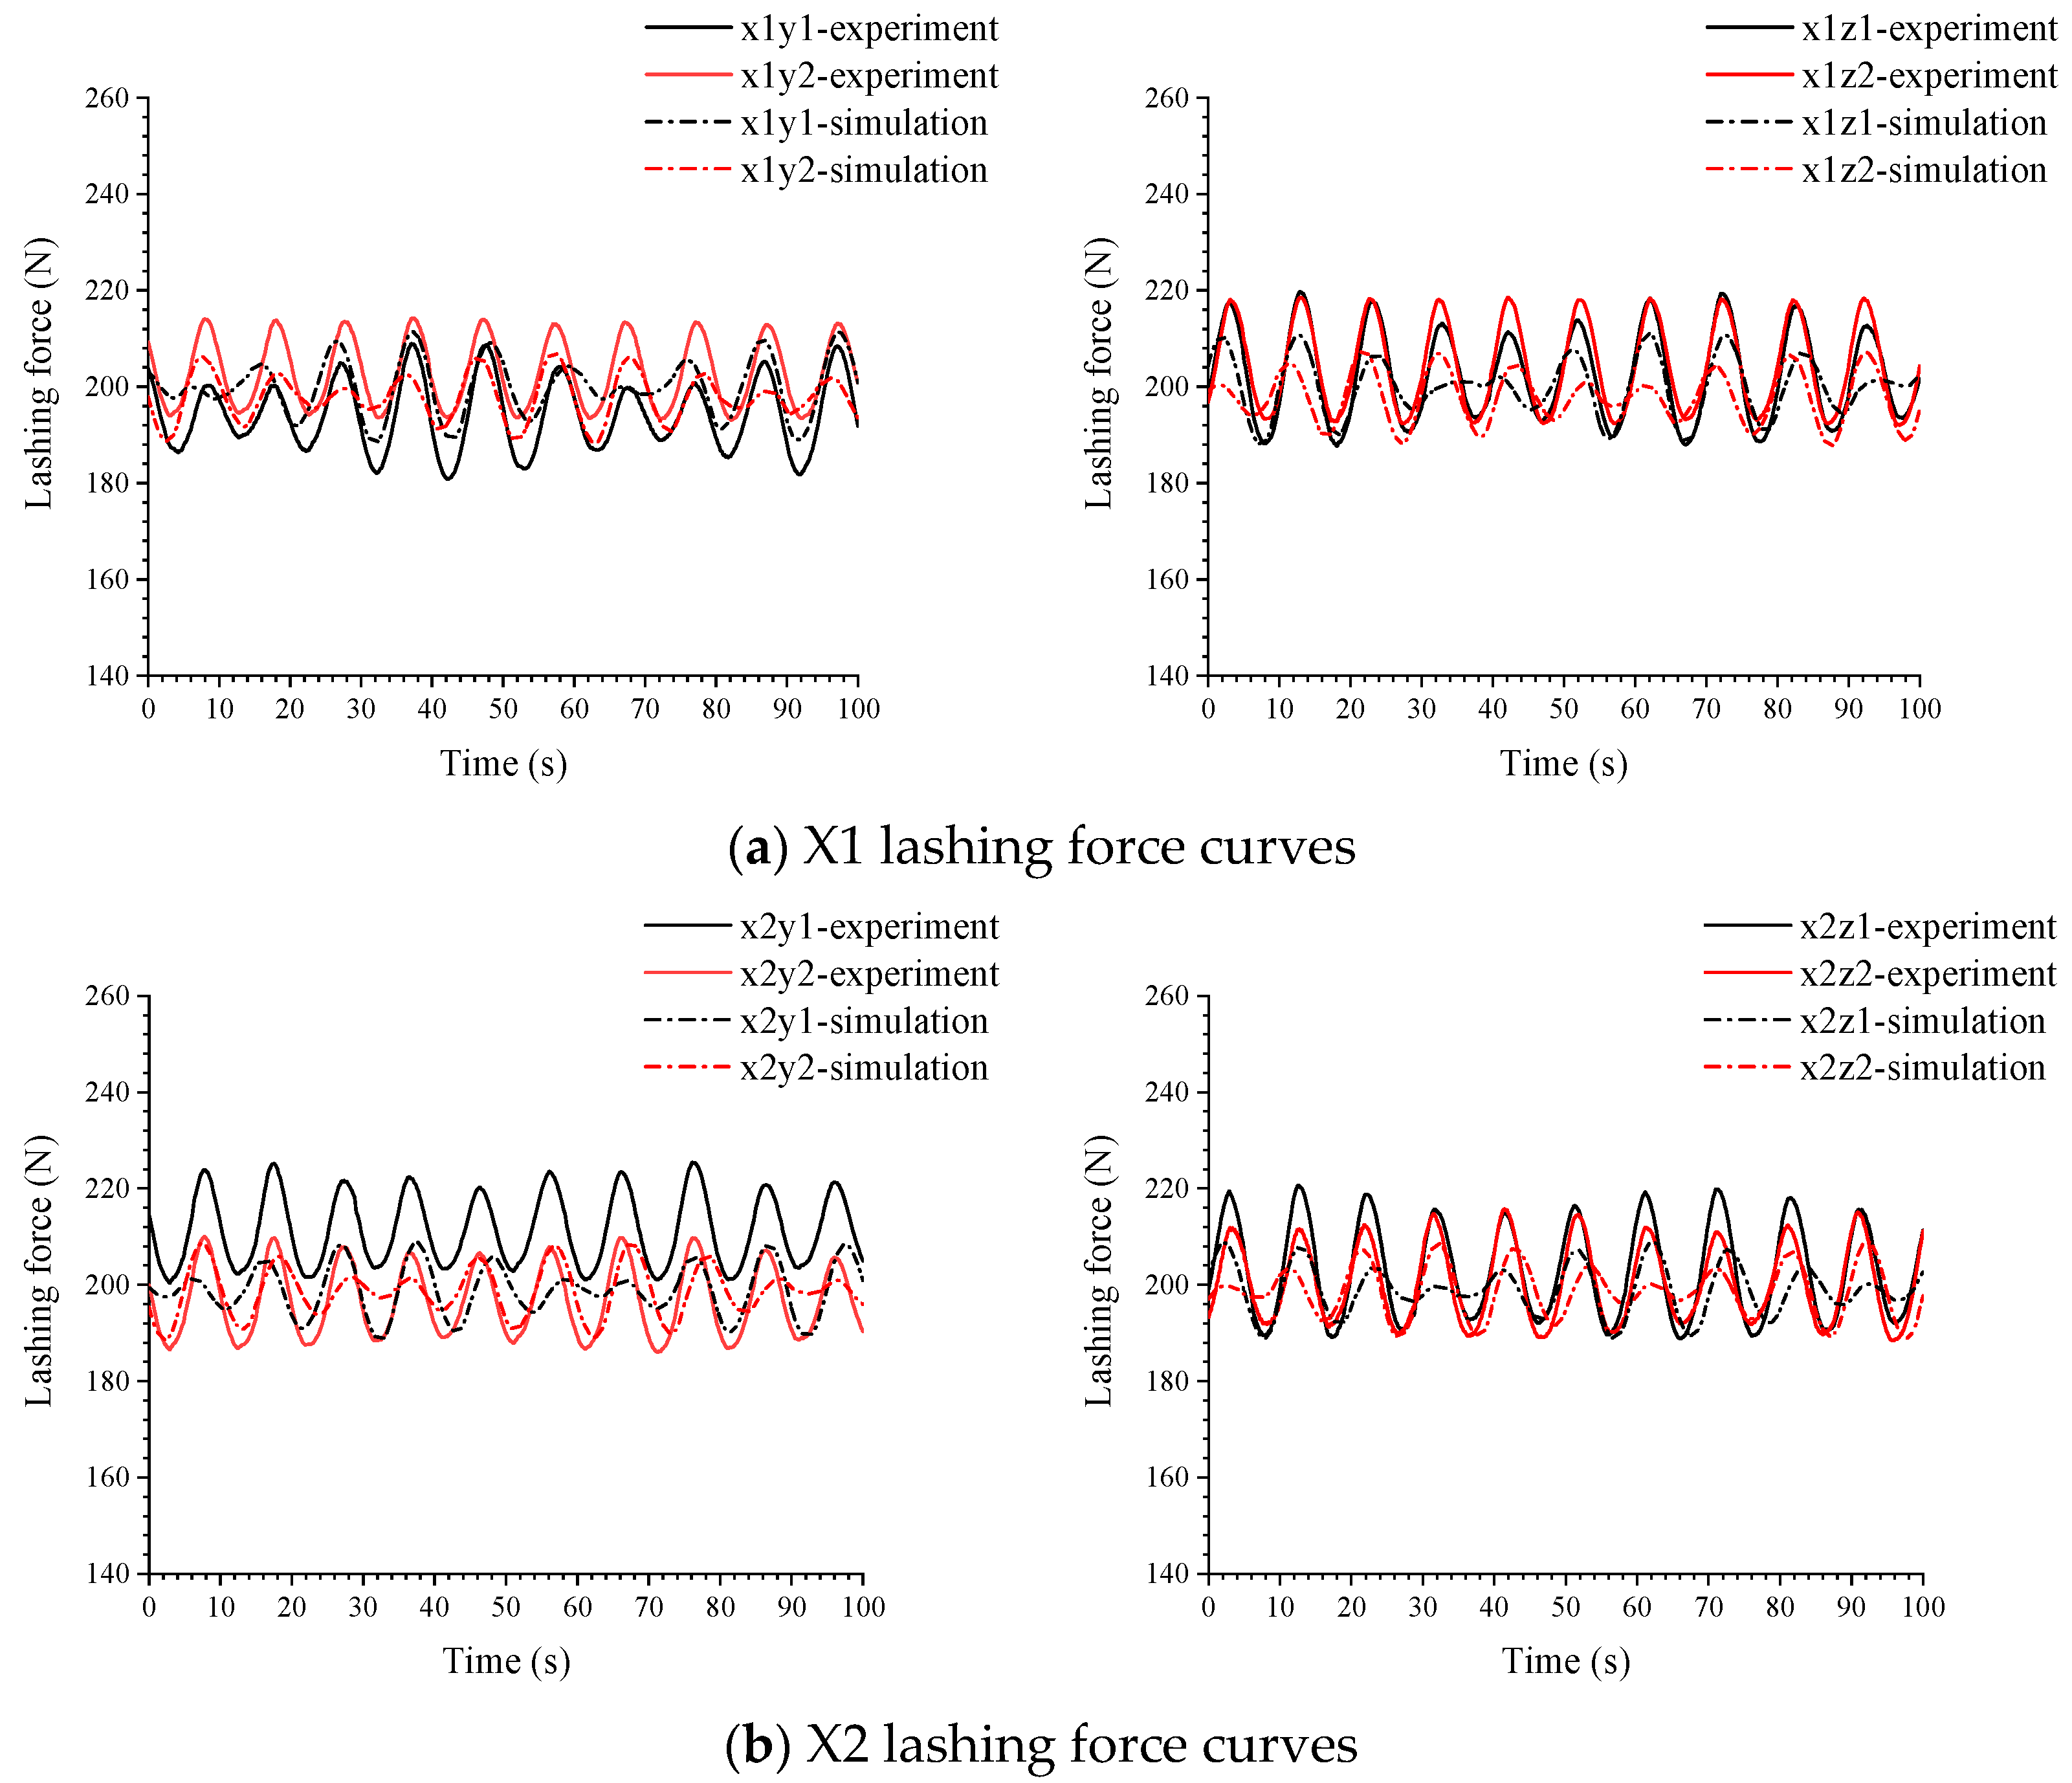
When comparing the pedestal support force curves for each working condition between the test and simulation, it can be observed that the overall trends are consistent, except for some differences in the peak load. Comparing the calculated conditions for different sets of motion parameters, it can be seen that, as the motion amplitude increases, the magnitude of the pedestal support force variation also increases accordingly. Furthermore, in the eccentric placement condition, where the pedestals are arranged toward the rear of the model, the front pedestals are closer to the model’s center of gravity, resulting in higher support forces compared to the rear pedestals and the pedestals in the centered condition. When designing similar securing schemes, it is advisable to avoid situations where support structures are biased toward one end to reduce the likelihood of load concentration on a specific support component. See Figure 15.

4.2. Lashing Force

The comparison between test and simulation for the rope loads is similar to that of the pedestal support forces. The overall trends are consistent, except for some differences in the peak load. As the motion amplitude increases, the magnitude of the rope load variation also increases accordingly. In the offset condition, the ropes that are under tension in the model’s suspended section experience larger load variations compared to the other ropes. This is attributed to the greater relative displacement of the suspended section during motion, resulting in substantial changes in rope lengths. In all working conditions, the rope loads exhibit periodic variations within each motion cycle. This periodicity is due to differences in the periods of motion for different degrees of freedom, resulting in various phase differences during the motion process. Therefore, when verifying the safety of securing schemes, it is essential to consider the motion states with different phase differences to ensure the accuracy of the verification results. There is sudden fluctuation in the partial load curve of some test conditions, but it does not appear in the corresponding simulation conditions. It is presumed to be caused by local vibration during the test. See Figure 16, Figure 17, Figure 18, Figure 19, Figure 20 and Figure 21.
The smaller amplitude of rope load variations compared to the 200 N pre-tension force is attributed to the support provided by the pedestal. The support structure of the pedestal directly restricts the model’s displacements in various directions other than the vertical upward direction during motion. In the test, the model’s motion does not generate sufficient acceleration to cause the model to detach from the pedestal. As a result, the relative displacements induced by the model’s motion are relatively small, leading to minimal deformation effects on the ropes.

4.3. Load Peak and Error Analysis

In previous studies, the safety of the securing scheme was mainly verified by checking whether the load of each component exceeded the allowable load. In this study, the error of the peak load of each component is used as the criterion for the accuracy of the simulation method. The peak load of each component and the error between the test and simulation results are summarized in Table 3.
Pedestal and rope loads:
For pedestal load peaks, the error is relatively large, particularly in the O3 condition, where the error is around 15%. However, in most cases, the error between test and simulation load peaks is within 10%. The errors in pedestal loads are generally acceptable. The O3 condition, with a slightly larger error, might indicate specific challenges or conditions not adequately captured by the simulation. The error in rope load peaks is generally within 9%.
The data from the simulation in ADAMS agrees reasonably with the experimental data, indicating that numerical simulations conducted using ADAMS can provide valuable reference for the verification and optimization of securing schemes.
Sources of error:
  • Numerical simplifications
In numerical simulations, simplifications were made for the test model, pedestal supports, and ropes by assuming that all components are rigid structures and neglecting the local deformation effects of the structures. Additionally, in the numerical model, springs were used to simulate the chain, leading to the introduction of some approximations.
  • Misalignments and experimental imperfections
The actual experimental setup is not as perfect as in the numerical simulations, and there is a lack of alignment between the support piers and the cylinder. These differences between the simplified numerical models and the actual experimental conditions can lead to discrepancies in the results.
  • Pre-tensioning forces
The application of pre-tensioning forces to the ropes is achieved by adjusting the basket bolts. In practical operations, the mutual influence between multiple pre-tensioning adjustments and manual operation can make it challenging to simultaneously achieve the predetermined pre-tensioning forces for all ropes. During the motion of the swing test platform, there may also be gradual relaxation of the pre-tensioning forces. These factors can introduce discrepancies compared to the numerical model, which assumes precise relative positions and accurate pre-tensioning forces.

5. Conclusions

Based on a self-designed securing scheme experiment, data for lashing loads and pedestal support forces in the test scheme were collected. Variations of various loads under different securing methods and platform movements were analyzed. By setting different motion parameters and equipment placement conditions, the study has analyzed the time–history curves of the support forces on the support pedestals and the rope loads under the influence of different factors. The patterns of load changes for various components are revealed when considering motion states and securing configurations. Based on these findings, a numerical simulation was conducted. By comparing the simulation results with the experimental results, the reliability of the simulation method was verified. The results show that the simulation method used in this study can be used as a reference for the safety check of the securing scheme. The main conclusions of this study are as follows:
  • When comparing the experimental data with the numerical simulation results for various operating conditions, the periodicity, and trends of the support forces on the pedestal supports and rope loads are consistent, with only minor discrepancies in peak load values. Notably, the support forces exhibit relatively larger discrepancies compared to the rope loads. For most cases, the peak load discrepancies between experiments and simulations are within 10%, except for a few specific conditions where they reach around 15%. The discrepancies in peak rope loads are generally within 9%. This demonstrates that the simulation method can be applied effectively for engineering analysis and prediction purposes.
  • With the increase in the amplitude of the designed motion parameters, the response amplitudes of various load components increase in all test conditions. The support forces on the pedestal exhibit more pronounced variations, while the rope loads show relatively smaller variations. This is primarily because the support configuration of the pedestal supports can directly restrict the model’s displacement in directions other than vertical during the motion. Consequently, in the test conditions, the model’s motion does not generate significant relative displacement, resulting in minimal deformation effects on the cables.
  • In the offset condition, the pedestal support force of the forward pedestal is significantly greater than that in the centered condition. This is due to the fact that, in the offset condition, the model’s center of gravity is biased toward the forward pedestal, resulting in a larger load being borne by the forward pedestal. In practical structural design of securing systems, it is advisable to avoid situations where the supporting structures are biased towards one end in order to reduce the likelihood of load concentration on a particular support component.
  • The discrepancies between numerical simulations and model experiments in the loads on structural components may arise from two main factors. Firstly, the simulation model assumes a rigid body model, neglecting local deformation effects. Secondly, during the experimental implementation, the arrangement of various components may not be as perfect as in numerical simulations. The pre-tension forces applied to the ropes at different locations can influence each other, and it is challenging to simultaneously achieve their predetermined values through manual adjustments.
The use of simulation technology can provide a more comprehensive reference for the safety check of the securing scheme. However, due to technical limitations, the simulation method of securing rigging in this study can be further improved. In addition, because the assembly method poses difficulty in achieving accuracy of the simulation setting, the error caused by the assembly method can also be further studied.

Author Contributions

Formal analysis, M.L.; methodology, M.L.; project administration, G.W. and K.L.; resources, K.L.; supervision, K.L. and J.W.; validation, M.L.; writing—original draft, M.L.; writing—review and editing, Y.L. All authors have read and agreed to the published version of the manuscript.

Funding

This research was funded by Project supported by the National Natural Science Foundation of China grant number 52171311, and Open Project of the National Key Laboratory of Waterway Traffic Control grant number W23CG090243.

Institutional Review Board Statement

Not applicable.

Informed Consent Statement

Not applicable.

Data Availability Statement

Data are contained within the article.

Conflicts of Interest

The authors declare no conflict of interest.

References

  1. Choung, J.; Jeong, S.-M. Vehicle Securing Safety Assessments of a Korean Coastal Car Ferry According to Acceleration Prediction Approaches. Brodogradnja 2019, 70, 115–131. [Google Scholar] [CrossRef]
  2. Acanfora, M.; Montewka, J.; Hinz, T.; Matusiak, J. On the Estimation of the Design Loads on Container Stacks Due to Excessive Acceleration in Adverse Weather Conditions. Mar. Struct. 2017, 53, 105–123. [Google Scholar] [CrossRef]
  3. Kabaciński, J.; Wiśnicki, B. Accuracy Analysis of Stowing Computations for Securing Non-Standard Cargoes on Ships According to IMO CSS Code. Pol. Marit. Res. 2009, 16, 67–71. [Google Scholar] [CrossRef]
  4. Pérez-Canosa, J.M.; Orosa, J.A.; de Osés, F.X.M.; Lama-Carballo, F.J. Optimization of Ship’s Navigational Parameters to Improve the Stowage and Securing Criteria of Non-Standardized Cargo in Ships. J. Mar. Sci. Eng. 2023, 11, 1782. [Google Scholar] [CrossRef]
  5. Sternsson, M.; Björkenstam, U. Statistical Study of Lashing Forces Measured On-Board a PCTC Vessel. Mar. Struct. 2003, 16, 345–354. [Google Scholar] [CrossRef]
  6. Jia, J.; Ulfvarson, A. Dynamic Analysis of Vehicle—Deck Interactions. Ocean Eng. 2006, 33, 1765–1795. [Google Scholar] [CrossRef]
  7. Jia, J. Investigations of Vehicle Securing without Lashings for Ro-Ro Ships. J. Mar. Sci. Technol. 2007, 12, 43–57. [Google Scholar] [CrossRef]
  8. Matusiak, J. Dynamics of Cargo Shift Onboard a Ship in Irregular Beam Waves. Int. Shipbuild. Prog. 2000, 47, 77–93. [Google Scholar]
  9. Andersson, P.; Jagelčák, J.; Lind, E.; Petersen, S.S. Report from Pulling Tests with Used Lashing Equipment; MariTerm AB: Höganäs, Sweden, 2009. [Google Scholar]
  10. Turnbull, S.R.; Dawson, D. The Securing of Rigid Semi-Trailers on Roll-on/Roll-off Ships. Int. J. Mech. Sci. 1997, 39, 1–14. [Google Scholar] [CrossRef]
  11. Surendran, S.; Lee, S.K.; Reddy, J.V.R.; Lee, G. Non-Linear Roll Dynamics of a Ro-Ro Ship in Waves. Ocean Eng. 2005, 32, 1818–1828. [Google Scholar] [CrossRef]
  12. Kawamura, K.; Hashimoto, H.; Matsuda, A.; Terada, D. SPH Simulation of Ship Behaviour in Severe Water-Shipping Situations. Ocean Eng. 2016, 120, 220–229. [Google Scholar] [CrossRef]
  13. Liu, J.; Li, C.; Wang, D.; Cai, Z. Investigations on the Dynamics of Container Stack and Securing System under Rolling Motion Using a Scaled Model Test. Ships Offshore Struct. 2022, 17, 92–104. [Google Scholar] [CrossRef]
  14. Li, C.; Wang, D. Multi-Objective Optimisation of a Container Ship Lashing Bridge Using Knowledge-Based Engineering. Ships Offshore Struct. 2019, 14, 35–52. [Google Scholar] [CrossRef]
  15. Li, C.; Wang, D.; Liu, J. Numerical Analysis and Experimental Study on the Scaled Model of a Container Ship Lashing Bridge. Ocean Eng. 2020, 201, 107095. [Google Scholar] [CrossRef]
  16. Li, C.; Wang, D.; Liu, J.; Cai, Z. Experimental and Numerical Investigation on Dynamic Response of a Four-Tier Container Stack and Lashing System Subject to Rolling and Pitching Excitation. Appl. Ocean Res. 2021, 109, 102553. [Google Scholar] [CrossRef]
  17. Song, F.; He, Y.; Liu, H. Research on Goods and the Ship Interaction Based on ADAMS. MATEC Web Conf. 2017, 95, 11002. [Google Scholar] [CrossRef]
  18. Kreuzer, E.; Schlegel, V.; Stache, F. Multibody Simulation Tool for the Calculation of Lashing Loads on RoRo Ships. Multibody Syst. Dyn. 2007, 18, 73–80. [Google Scholar] [CrossRef]
  19. Nam, W.; Park, S.-J.; Kim, K. Numerical Investigation of the Ultimate Strength of D-Ring Devices and Deck Structures. J. Mar. Sci. Eng. 2022, 10, 952. [Google Scholar] [CrossRef]
  20. Zhu, H.J.; Yao, H. Dynamic Simulation Analysis of a Ship-Borne Loading Device. Adv. Mater. Res. 2012, 487, 562–567. [Google Scholar] [CrossRef]
  21. E-Chao, L.; Bai-Jun, T.; Yang-Gui, L. Amendments to the Methods of Non-Standardized Cargo Unit Securing Assessing. In Proceedings of the 2020 IEEE 5th International Conference on Intelligent Transportation Engineering (ICITE), Beijing, China, 11–13 September 2020; IEEE: Piscataway, NJ, USA, 2020; pp. 371–375. [Google Scholar] [CrossRef]
  22. Adams, G.G.; Nosonovsky, M. Contact Modeling—Forces. Tribol. Int. 2000, 33, 431–442. [Google Scholar] [CrossRef]
Figure 1. Three-degree-of-freedom swing test apparatus.
Jmse 12 00158 g001
Figure 2. (a) Securing scheme side view. (b) Tower placement schematic diagram.
Jmse 12 00158 g002
Figure 3. Test model.
Jmse 12 00158 g003
Figure 4. (a) Support pedestal model dimensions. (b) Support pedestal site model installation.
Jmse 12 00158 g004
Figure 5. Tie rope ballast arrangement.
Jmse 12 00158 g005
Figure 6. (a) Middle condition. (b) Offset condition.
Jmse 12 00158 g006
Figure 7. The arrangement of membrane pressure sensor and tension sensor.
Jmse 12 00158 g007
Figure 8. Overall layout of (a) middle condition; (b) offset condition.
Jmse 12 00158 g008
Figure 9. M3 load curve of each component under test condition.
Jmse 12 00158 g009
Figure 10. O3 load curve of each component under test conditions.
Jmse 12 00158 g010aJmse 12 00158 g010b
Figure 11. Each component model in simulation calculation.
Jmse 12 00158 g011
Figure 12. Nylon rope tensile test.
Jmse 12 00158 g012
Figure 13. Tensile test results for nylon rope.
Jmse 12 00158 g013
Figure 14. Comparison of calculation results from different analysis steps.
Jmse 12 00158 g014aJmse 12 00158 g014b
Figure 15. Comparison of supporting force curves of pedestal under different conditions.
Jmse 12 00158 g015aJmse 12 00158 g015bJmse 12 00158 g015c
Figure 16. Comparison of lashing force curves of each rope in M1 condition.
Jmse 12 00158 g016aJmse 12 00158 g016b
Figure 17. Comparison of lashing force curves of each rope in M2 condition.
Jmse 12 00158 g017aJmse 12 00158 g017b
Figure 18. Comparison of lashing force curves of each rope in M3 condition.
Jmse 12 00158 g018
Figure 19. Comparison of lashing force curves of each rope in O1 condition.
Jmse 12 00158 g019
Figure 20. Comparison of lashing force curves of each rope in O2 condition.
Jmse 12 00158 g020
Figure 21. Comparison of lashing force curves of each rope in O3 condition.
Jmse 12 00158 g021aJmse 12 00158 g021b
Table 1. Summary of test conditions.
IDXCondition NumberDescription of Working Condition
1M1Middle condition, group 1 parameter
2M2Middle condition, group 2 parameter
3M3Middle condition, group 3 parameter
4O1Offset condition, group 1 parameter
5O2Offset condition, group 2 parameter
6O3Offset condition, group 3 parameter
Table 2. Parameter settings of motion parameter groups.
Group IDRoll AmplitudeRoll
Period
Pitch AmplitudePitch PeriodHeave AmplitudeHeave Period
110°10 s12 s100 mm8 s
220°10 s10°12 s200 mm8 s
325°10 s15°12 s300 mm8 s
Table 3. Summary of load peak values for each component under different conditions.
Condition IDSupport Force (N)Lashing Force (N)
TestSimulationErrorTestSimulationError
M137383380.39.57%221.7204.77.67%
M23661.13601.11.64%225.1211.16.22%
M33900.23744.63.99%228.2216.85.00%
O157655214.59.55%200.4212.25.89%
O26331.45815.28.15%219.4238.88.84%
O36865.15881.914.32%244.2250.532.59%
Disclaimer/Publisher’s Note: The statements, opinions and data contained in all publications are solely those of the individual author(s) and contributor(s) and not of MDPI and/or the editor(s). MDPI and/or the editor(s) disclaim responsibility for any injury to people or property resulting from any ideas, methods, instructions or products referred to in the content.

