Article

Numerical Simulation of Seismoacoustic Wave Transformation at Sea–Land Interface

1
V.I. Il’ichev Pacific Oceanological Institute FEB RAS, 690041 Vladivostok, Russia
2
Institute of Automation and Control Processes FEB RAS, 690041 Vladivostok, Russia
3
Schmidt Institute of Physics of the Earth RAS, 123242 Moscow, Russia
4
Department of Physics, Moscow State University, 119991 Moscow, Russia
*
Author to whom correspondence should be addressed.
J. Mar. Sci. Eng. 2024, 12(12), 2112; https://doi.org/10.3390/jmse12122112
Submission received: 30 October 2024 / Revised: 13 November 2024 / Accepted: 18 November 2024 / Published: 21 November 2024

Abstract

:
This study considers seismoacoustic wave propagation through the land–sea interface, i.e., in the presence of a coastal wedge, taking into account the real bottom bathymetry. It is of interest in the problems of coastal monitoring and environmental studies. An effective numerical model based on the finite element method is proposed and implemented. An approximate analytical solution in the fluid and an asymptotic analytical solution for the surface seismic wave on the shore are considered to validate the numerical model. It is shown that in field experiment conditions the hydroacoustic signal generated by an underwater source with a power of ~200 W is transformed into a seismic wave on the shore with an amplitude of units of nanometers at distances of several kilometers, which can be measured by a sensitive sensor. An extensive series of numerical simulations with different model parameters was performed, which allowed us to evaluate the most appropriate propagation medium parameters to match the observed and calculated data.

1. Introduction

The study of the transformation of elastic wave fields at the land–sea interface, i.e., in the presence of a coastal wedge, is an important task from the applied point of view with potential application in understanding recorded data. It can be separated into two contrary processes: the first one is related to the transmission of wave energy from solid land to water, and the second one is in the reverse direction from water to land. In the present work, we focus on the second task—the reception of a low-frequency signal radiated in water by a measurement complex located on the shore. The source of such seismoacoustic signals in the sea can be, for example, earthquakes, which under certain circumstances re-emit elastic energy into the water column, which then propagates as an acoustic pressure wave [1,2]. When captured by an underwater sound channel, this energy travels long distances and is recorded at shore or underwater seismic stations and hydrophones as a T-phase (tertiary) [3]. Since the speed of sound propagation in water is typically lower than the speed of longitudinal and transverse waves in solids, information on the arrival time of this wave can improve the accuracy of seismic event location. In addition, the data on the duration of the T-phase obtained near water areas are important for the classification of seismic signals of anthropogenic nature—underwater explosions [4]—including within the framework of the International Monitoring System (IMS) for nuclear test detection. These data are also useful for solving environmental issues related to the monitoring of intense underwater sound sources (such as seismic sources, helicopters, and hovercrafts) that have a harmful influence on marine life [5]. Other tasks that can be solved by modeling wave processes during energy transformation at the land–sea boundary include early tsunami warnings and the study of slow deformation waves [6]. In practice, in order to solve the above tasks, the need for special measuring equipment comes to the fore. In Russia, sensors that can register such unusual waves include new seismic stations on islands in the Arctic [7], as well as coastal laser strainmeters [8], the sensitivity of which is much higher than that of seismometers. Of separate interest is the issue related to the registration of seismoacoustic waves in the presence of ice cover, such as the use of temporary seismic groups [9].
At the same time, to date, the problem of elastic wave propagation in the presence of the land–sea interface has not been completely solved from the theoretical point of view. The reason for this is, first, the need to involve the approaches of two independently developing scientific disciplines—hydroacoustics and seismology—and, second, the large number of parameters that need to be taken into account in the mathematical description of the medium model, which complicates the formulation of a simple analytical solution. One of the classical problems of ocean acoustics is the problem of sound propagation in a coastal wedge, with the bottom usually considered to be fluid. Note that when considering a point source in a coastal wedge, the horizontal refraction of sound is important [10], which makes it necessary to consider a three-dimensional formulation of the problem. This fact requires additional computational power, especially in the study of high-frequency signals, and for this reason is an urgent problem of computational ocean acoustics and seismology [11,12]. In particular, an effective way to compute acoustic fields is the parabolic equation [13], on the basis of which new modifications of computational programs are created, a recent review of which is presented, for example, in [14]. In the present work, we focus on the elastic wave field in solid sea bottom and on the shore when a low-frequency point source is located in a coastal wedge; for this reason, the consideration of shear deformations is fundamental. It is of interest because in this case a leaky wave as well as a Scholte-type surface wave is generated in the coastal region of the wedge. For this problem formulation, we have not been able to find a complete analytical solution in the literature. For this reason, the effects arising in the elastic wedge model will be analyzed using numerical methods. At the same time, to verify the numerical model, we can use approximate analytical solutions for the sound field in a fluid medium and elastic displacements at large distances from the wedge edge. However, these known analytical solutions do not allow us to calculate the displacement field in the coastal region.
The purpose of this work is to develop and verify with experimental data a model to study the transformation of seismoacoustic signals when passing from the water to the shore, taking into account the real bottom bathymetry in one of the regions of the Russian Far East. The relevance of this study is explained by the fact that the transformation of the hydroacoustic signal into a seismic signal during its propagation from sea to land is inefficient in conditions of complex geological and topographical features and strong attenuation [15]. The closest work on the subject should be considered [16] where, however, shear deformations are not taken into account—that is, the foundation is considered to be fluid. The work [17] should also be noted, where shear waves were taken into account when analyzing the signal propagation through a land area, but no detailed study of the seismic waves generated in this case on land was carried out. In [15], sophisticated numerical calculations were performed using a set of programs, which showed that hydroacoustic waves in the ocean convert to seismic waves on land in a complicated manner, generating a mix of seismic phases that made automatic signal identification difficult. For this reason, the development of more straightforward computational models is important for the interpretation of the observed data.
The present paper is organized as follows: the Introduction gives the problem formulation and describes the relevance of the topic; Section 2 describes the field experiment and develops a numerical model (based on realistic bathymetry data) of the finite element method; Section 3 validates and verifies the numerical simulation by comparing it with known analytical results for a reference model of a coastal wedge and investigates the convergence of the numerical scheme; Section 4 presents the results of the numerical calculations of wave propagation in a realistic coastal wedge model and seismic effects; and Section 5 investigates seismic signal sensitivity to coastal wedge parameters based on measured full-scale experiment data.

2. Full-Scale Experiment and Realistic Model of the Environment

To investigate the conversion of the hydroacoustic signal into a seismic signal when it propagates from sea to land through the coastal wedge, we used the data obtained in the summer of 2024 in the Sea of Japan in a unique experiment. The study of the transformation of seismoacoustic signals in a coastal wedge in a controlled natural experiment is a rather difficult task. This is due to the fact that, firstly, a powerful low-frequency hydroacoustic source is required, and secondly, after landfall, the signal becomes very weak, which requires the use of highly sensitive shore sensors. For this reason, all such experiments are quite difficult and significant. To generate the seismoacoustic signal in the water column, a powerful source—a low-frequency GI-2 transmitter weighing 260 kg—was used [17]. The GI-2 hydroacoustic system is designed to generate harmonic and phase-shift keying (PSK) hydroacoustic signals in the frequency band of the order of 1 Hz. When the transmitter is submerged to a depth of 2 to 40 m, the frequency of the mechanical–acoustic resonance smoothly increases from 19 to 26 Hz, which is associated with changes in external pressure. The maximum change in the volume of the transmitter during wave generation can reach 0.0123 m3, which corresponds to a radiated acoustic power of 1000 W at a frequency of 20 Hz in a boundless water space. A battery of lead–acid accumulators connected in series was used as the primary electric current source. The experiment with this transmitter was performed in the Sea of Japan (Figure 1). Each series of emitted signals contained a set of harmonic and PSK signals. The transmitter operation was controlled by a hydrophone. The seismoacoustic signal formed as a result of the transformation of the radiated hydroacoustic signal at the water–bottom boundary. After propagation through the coastal wedge, it was recorded by a coastal receiver system including laser strainmeters.
The two-axis laser strainmeter is mainly used to study the nature of the occurrence and development of various processes of infrasound range [17]. It includes a north–south laser strainmeter with an arm length of 52.5 m. The laser strainmeter is based on an unequal-arm Michelson interferometer and a frequency-stabilized HeNe laser. The north–south laser strainmeter is located in an underground structure at a depth of 3–5 m; its working arm is oriented with respect to the north–south line at an angle of 198°. The applied interferometry methods allow us to register changes in the length of the working arm of each strainmeter with an accuracy of 0.01 nm, i.e., the accuracy of measuring the displacement of the strainmeter foundations is 0.01 nm. The sensitivity of the laser strainmeter with a working arm length of 52.5 m is equal to Δ L / L = 0.01   nm / 52.2   m = 0.19 10 12 .
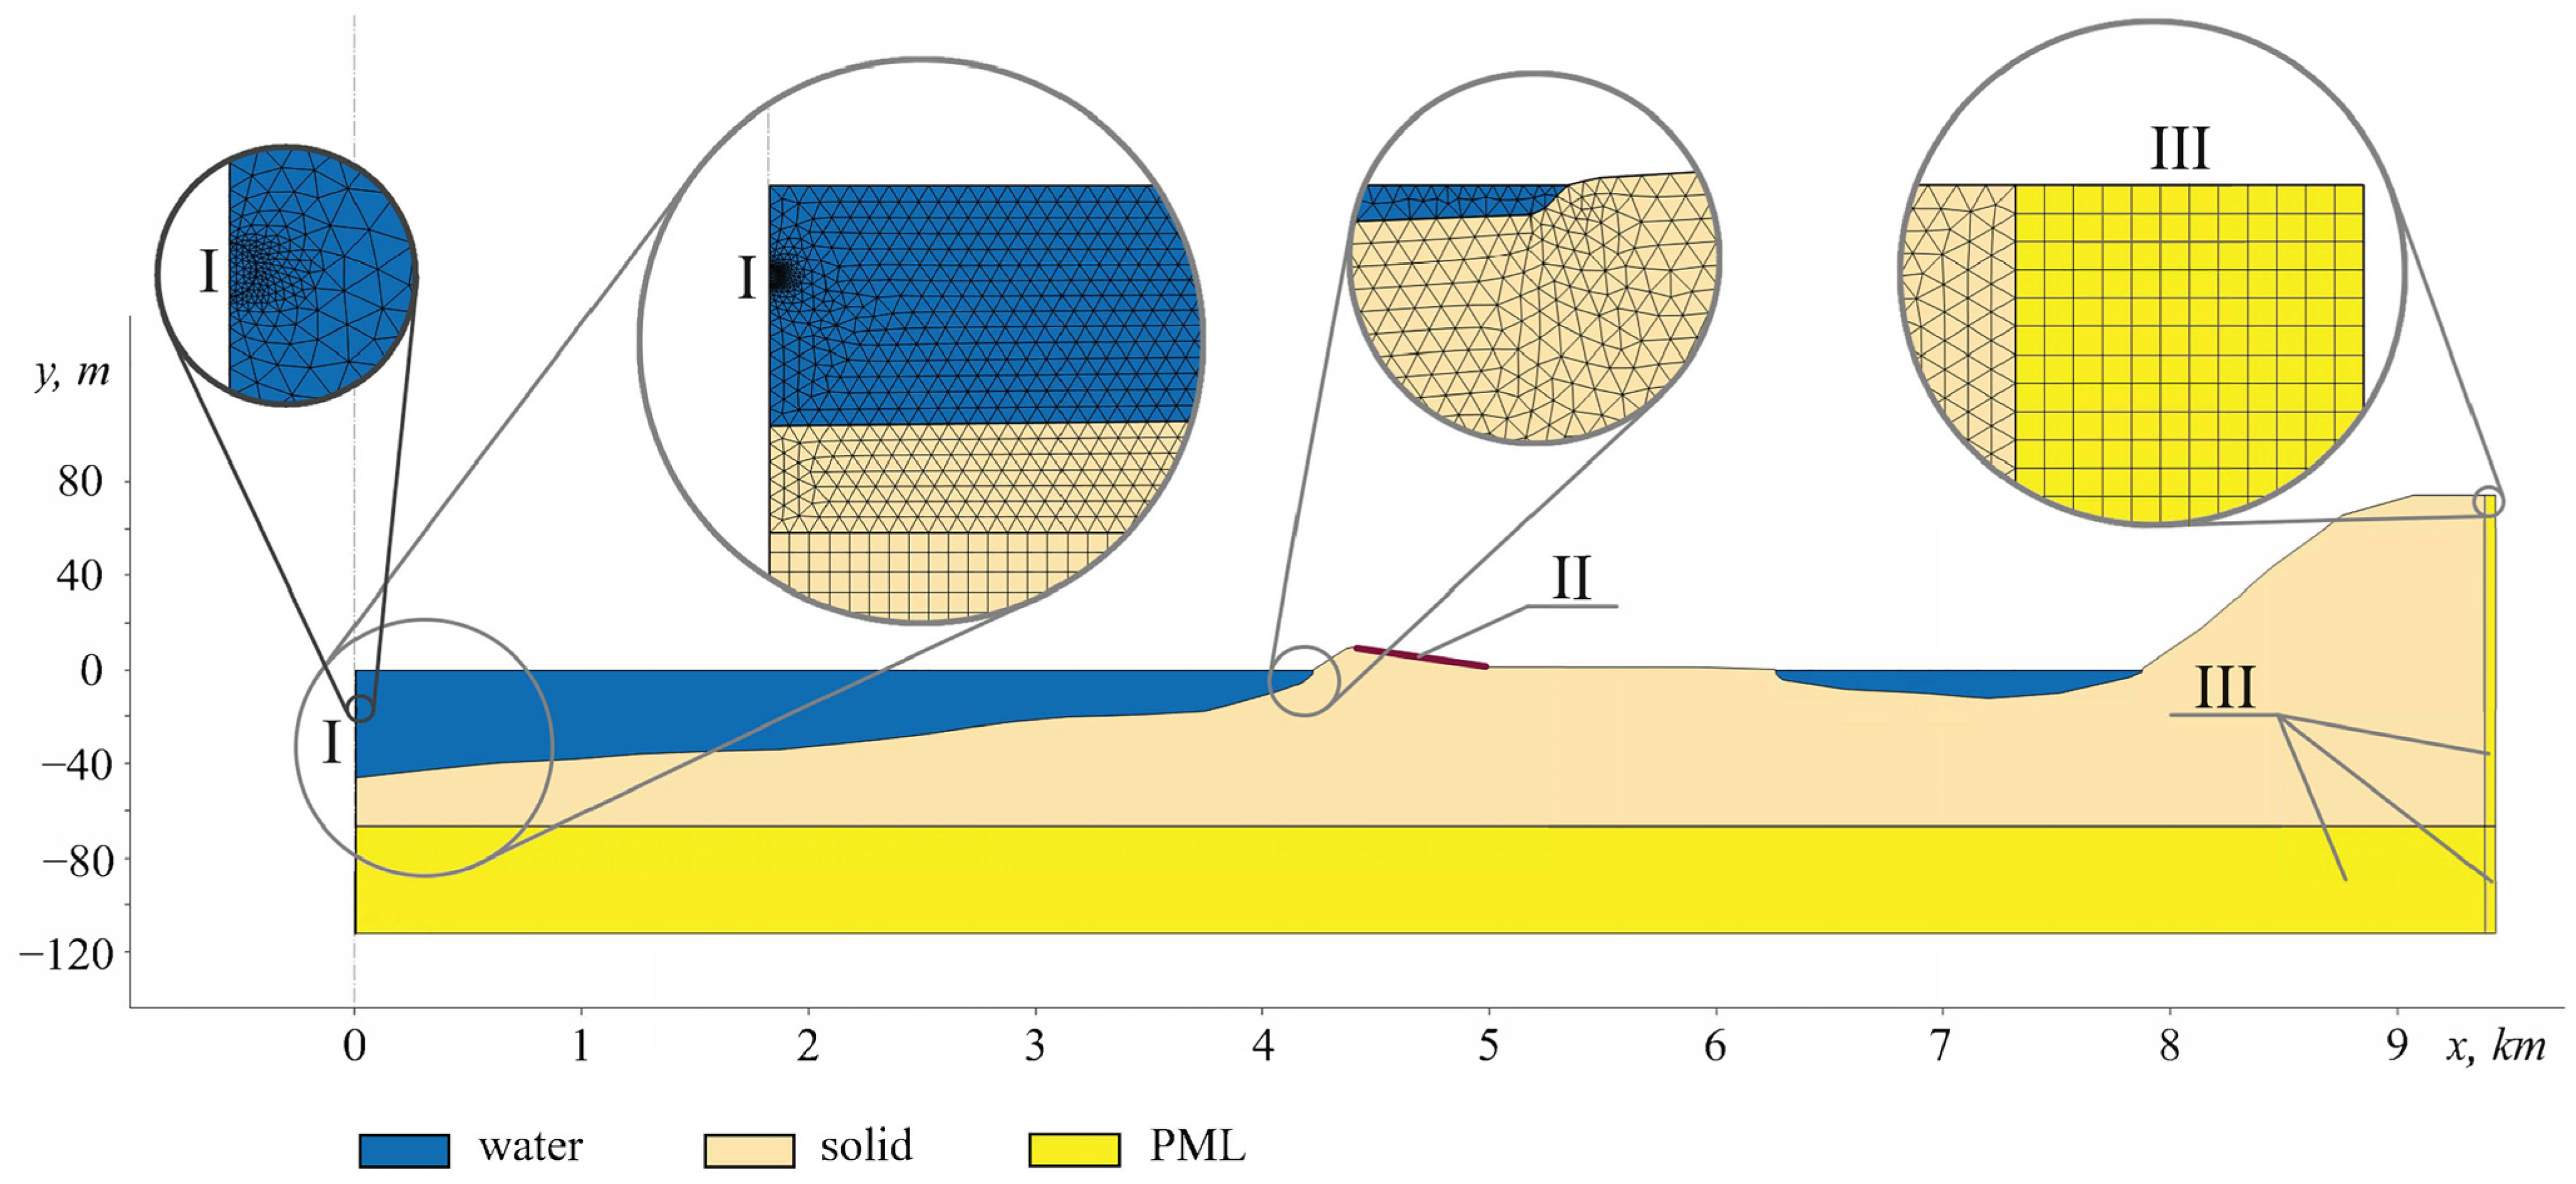
One of the most important parameters of the experiment is the complex bottom topography along the source–receiver path. To take it into account, we used the General Bathymetric Chart of the Oceans (GEBCO) 2023 on a grid with an interval of 15 angular seconds, constructed using gravimetric data from Earth remote sensing together with the results of local shipboard echolocation surveys. To justify this choice, we note that in comparison with Shuttle Radar Topography Mission plus (SRTM plus), in our case, we obtain higher resolution for underwater structures, and in comparison with Global Multi-Resolution Topography (GMRT), the data are smoother. In general, depth estimates from GEBCO data are satisfactory for direct sonar measurements at the source locations. The acoustic trace in the experiment includes different conditions: coastal area with depths of about 25 m; continental shelf—650 m; and sharp continental slope to depths exceeding 1 km with a large angle of wedge. Another important parameter of the model is the elastic properties of the geologic structures of bottom sediments [18]. Based on the analysis of the literature data for the region under consideration [16,17] as well as on the global data from Marine Geology (Word Data Service), the range of longitudinal and transverse wave velocities at the bottom was selected. At the current stage of this study, the bottom is considered homogeneous, and the variations in sound velocity with depth in the fluid medium are not taken into account. In the future, this can be taken into account using the global models of the Word Ocean Atlas, “Nucleus for European Modelling of the Ocean” (NEMO). The final realistic model is presented in Figure 2.
There are many computer programs available to investigate the laws of underwater sound propagation in the model of a coastal wedge with an elastic bottom, such as KRAKEN, RAM, and SAFARI, but they do not allow for the calculation of the elastic wave field at the bottom or on the shore, unlike programs using the finite element method SPECFEM2D, the finite difference method SOFI2D, and the pseudospectral method k-Wave. In the present work, the numerical modeling of seismoacoustic wave propagation is performed using the finite element method in the COMSOL Multiphysics© 5.3 [19] software package with the “Structural Mechanics” and “Acoustics” modules.

3. Numerical Model

This section describes the principles on which the finite element mesh in the COMSOL Multiphysics© software package is constructed for realistic bathymetry within the described experiment. And then, the verification of the numerical model is performed on a simpler reference model, for which approximate and asymptotic analytical solutions exist.

3.1. Finite Element Mesh for Realistic Model

Since the ratio of the distance between the source and receiver to the typical wavelength is large (100~1000 to 1), it was decided to consider the problem formulation symmetric with respect to the vertical axis passing through the signal source position at x = 0 (Figure 2) in order to save computational resources. Such a solution allows us to, on the one hand, limit the consideration of dependencies on two spatial coordinates, horizontal x and vertical y, thus significantly reducing the number of degrees of freedom of the numerical model compared to the three-dimensional problem formulation, and, on the other hand, take into account the geometric divergence of acoustic waves. Unfortunately, the price for such economy is the impossibility to take into account some effects, such as the horizontal refraction of acoustic waves in the coastal wedge [10] and horizontal bathymetry features of the modeled topography, but the legitimacy of using such symmetry is known [20] and will be shown further in the validation of the model used in this work.
The model under study represents the contact between two materials: water (density ρ 0 = 1000 kg/m3 and sound velocity c 0 = 1480 m/s) and a solid foundation (density ρ = 2000 kg/m3, longitudinal wave velocity varied in the range c l = 1500–2500 m/s, transverse wave velocity c t = c l / 3 ). The size of the whole computational model is determined by the distance between the source and receiver, and the parameters of the medium behind the strainmeter (region II in Figure 2) were also taken into account. The construction of the numerical model proposed in this paper, including partitioning into finite elements and setting the boundary conditions, is generally similar to that used in [21]. The geometry of the realistic model is shown in Figure 2. For clarity, the scale on the vertical axis is larger than on the horizontal axis by a factor of 10, and the thickness of the solid medium is reduced—in the calculations, it was chosen as 4λR⋅KQ, where λR is the length of the shortest expected wave, which is the Rayleigh wave propagating along the boundary of a free solid half-space, and KQ is the quality factor, which defines the number of grid elements that fit on one wavelength. Therefore, the larger this parameter is, the more accurate the numerical solution is (details in Section 3.2). The value of the quality factor in the main calculations was taken as 1.2. Note that the thickness of the solid medium is counted down from the maximum depth of the sea.
The boundary conditions are as follows: stress-free upper surface of water and solid foundation, weakly reflecting conditions at the bottom and right boundary of the model, axial symmetry at the left boundary, and equality of normal displacements and stresses at the contact boundary between the two phases. Also, to better absorb propagating waves at the model boundary and minimize their reflection back, i.e., to conditionally ensure the boundarylessness of the medium, perfectly matched layers of thickness λR were used in the bottom and right parts of the model. A detailed description of the boundary conditions can be found in [19].
The finite element mesh consisted of triangular and rectangular elements, with the latter conveniently used to reduce the total number of elements in regions with suitable geometry, such as perfectly matched layers. For such a class of problems, about 10 finite elements at one length of the shortest wavelength is considered acceptable. In our case, it is a Rayleigh wave, so the value λR/10/KQ was chosen as the characteristic finite element size, varying in the range from 3.3 to 4.6 m depending on the signal frequency. In the point source region, the grid was densified down to 0.6 m. In the perfectly matched layers, an additional condition on the finite element size was used, namely, the following: a perfectly matched layer should consist of at least 10KQ + 1 rows. Note that the optimization of the finite element mesh was not carried out because it was expected that in this case it would not lead to a significant acceleration of the calculations.
The elastic properties of the materials under study were described by standard linear equations for an ideally elastic isotropic homogeneous medium [19]. A point acoustic monopole located on the symmetry axis at a depth of h s , which varied during the numerical study in a range from −18 m to −15 m, was used as a signal source. The amplitude of the source was selected so that its power corresponded to the power of the transmitter used in the experiment. The main calculations were performed in the frequency space, i.e., for the harmonic mode of radiation. The output data of the numerical model were the pressure values at the depth h s at several distances from the source, the estimation of the acoustic power of the source as the integral of the radiation intensity over the sphere surrounding the source, and the vertical U x and horizontal U y displacement amplitudes at the point corresponding to the place of installation of the laser strainmeter, as well as the values of these amplitudes U ^ x and U ^ y , averaged over a 500 m long section of the medium surface (about 10 lengths of the strainmeter bases) near the point of installation of the laser strainmeter. The averaged values of the displacement amplitudes allow us to exclude the influence of spatial modulation and estimate their typical values.

3.2. Verification and Validation of the Numerical Model

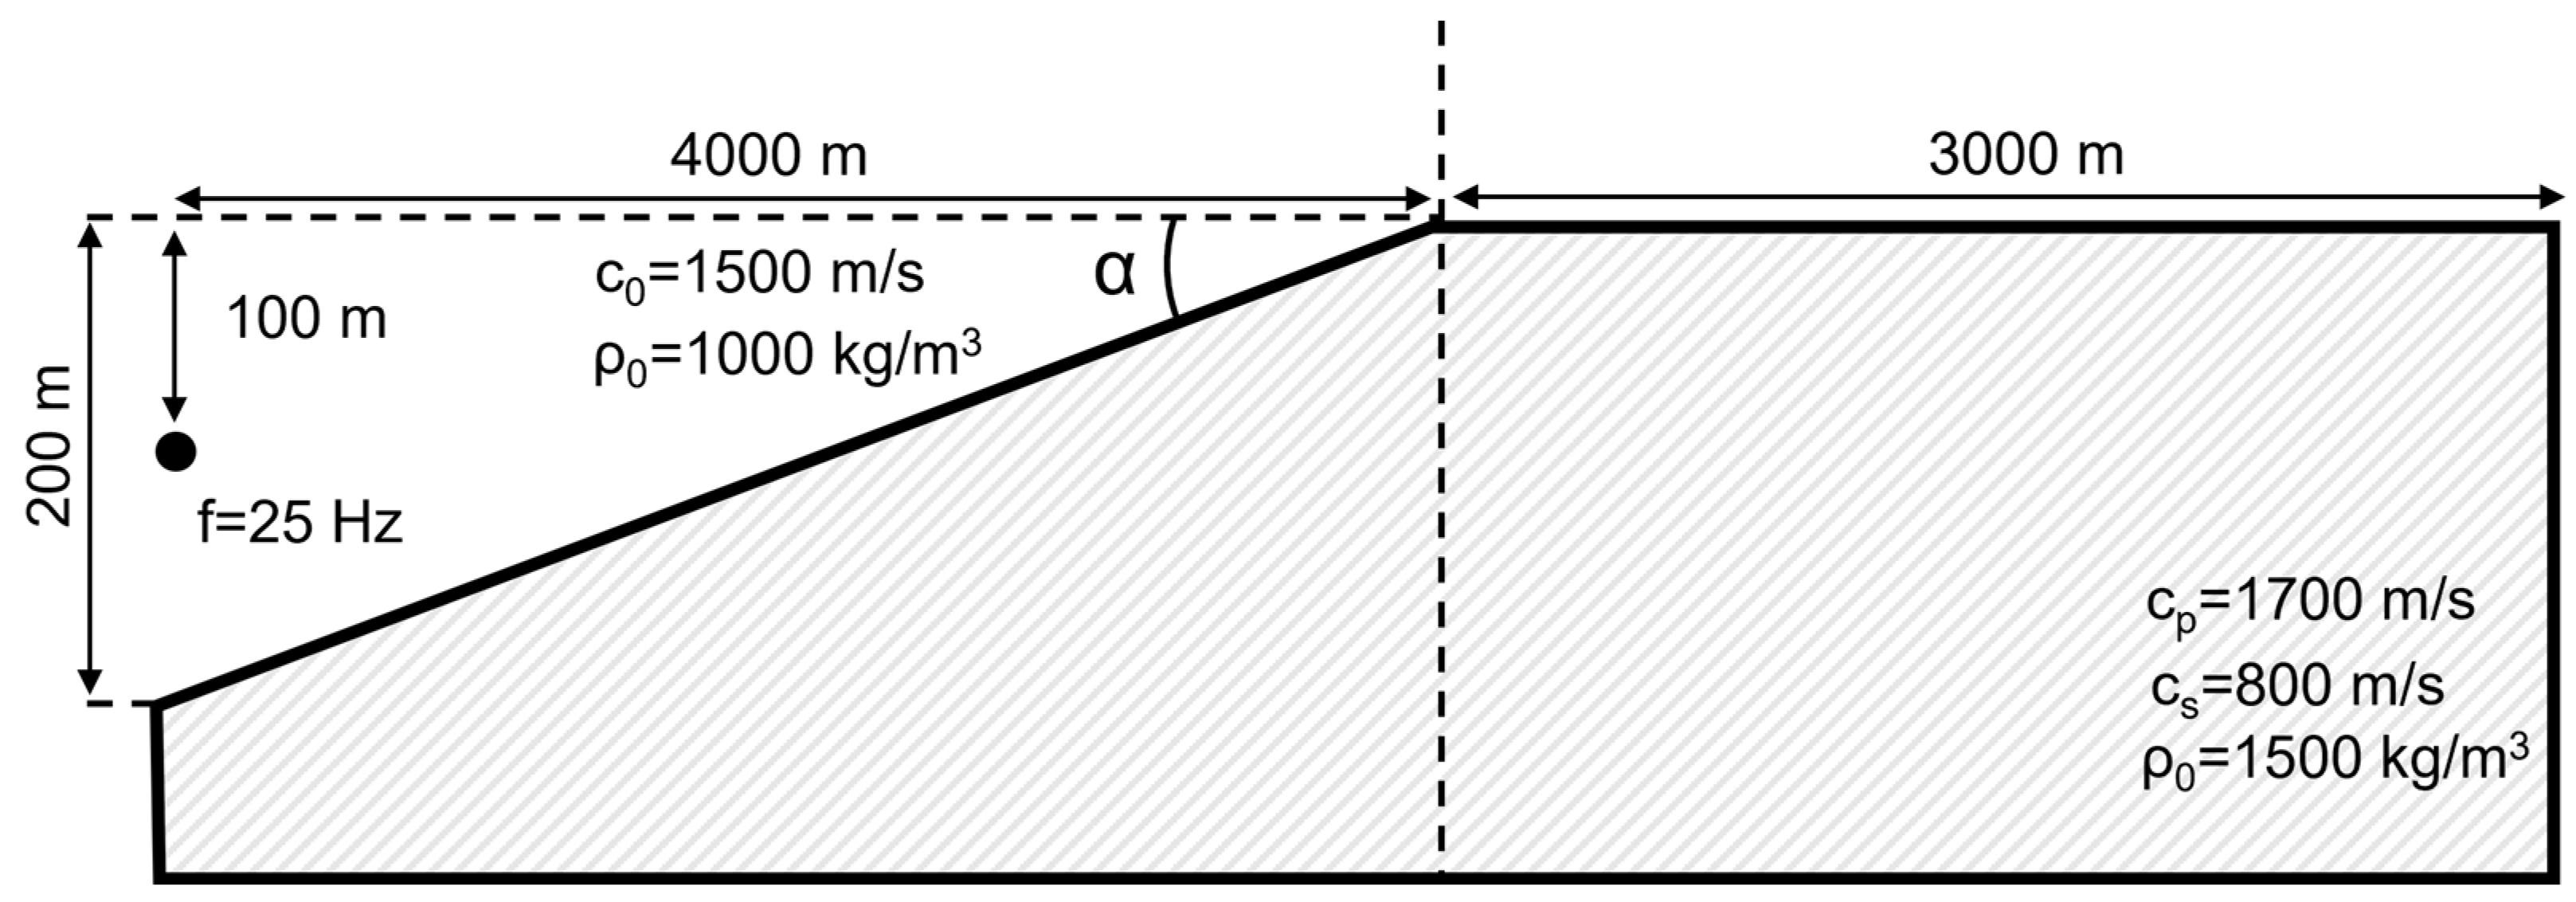
To verify the numerical model, we compare it with a known solution using a simplified formulation, such as the coastal wedge mathematical model with a flat boundary between the media (Figure 3). The coastal wedge is a developed problem in hydroacoustics and is particularly popular with Chinese colleagues [14,18,22]. The Acoustical Society of America (ASA) has proposed the use of a number of reference models and rules for presenting results to verify new solutions, including the coastal wedge mathematical model. Analytical representations for the field in a fluid in the idealized case of a wedge, with a perfectly soft or perfectly rigid bottom, have been derived [22]. In addition, the problems of signal propagation up and down the slope have been considered separately [23]. In the case of a penetrable bottom, based on the method of imaginary sources [24] and considering the reflection coefficients of a spherical wave field from a flat interface [25], an expression for the calculation of a three-dimensional sound field with a fluid and elastic foundation [20] is obtained. We are interested in the latter case as the closest to reality.
The geometry of the simplified formulation corresponding to the ASA reference coastal wedge model [24] is shown in Figure 3. The sea is modeled as a homogeneous fluid with sound velocity c 0 = 1500 m/s and density ρ 0 = 1000 kg/m3, enclosed in a wedge with an angle α = 2.86° lying on a homogeneous elastic foundation that is described by a longitudinal wave velocity c l = 1700 m/s, a transverse wave velocity c t = 800 m/s, and a density ρ 0 = 1500 kg/m3. A point harmonic source with frequency f = 25 Hz acts at a depth of h s = −100 m in the fluid, at a distance x s = 4000 m from the wedge edge. The attenuation of longitudinal and transverse waves in both media is not considered. Except for the geometry and elastic parameters of the medium, all other characteristics of the simplified model (type of perturbation source, boundary elements, principles of finite element mesh construction, perfectly matched layers) are similar to the realistic model (which corresponds to the mathematical model with wedge angle α ~1°) described in Section 2. Such a model allows us to perform the verification faster, as well as to compare the modeling results with the known solution. The verification consists of two steps—the verification of the numerical scheme and the validation of the mathematical model.
In order to verify the numerical scheme of the solution of the problem, it is necessary to fulfill the condition of approximation of the solution, i.e., the solution of the problem should tend to be accurate when the discretization step decreases. Note that the accuracy of the solution in addition to the spatial step and the number of rows of finite elements in a perfectly matched layer can also be affected by the geometry of the model, namely, the vertical size of the modeling area, so these parameters depend on KQ, an increase in which usually leads to an increase in the accuracy of the solution and vice versa. As a marked solution, we will consider the value of pressure in the water medium at the point x = 2000 m, y = −30 m. The dependences of these values on the quality factor show that at KQ = 1 there is already a stabilization of the solution at the level with a deviation from the assumed accurate value not exceeding 0.1% (Figure 4). In further calculations, a quality factor equal to 1.2 was used.
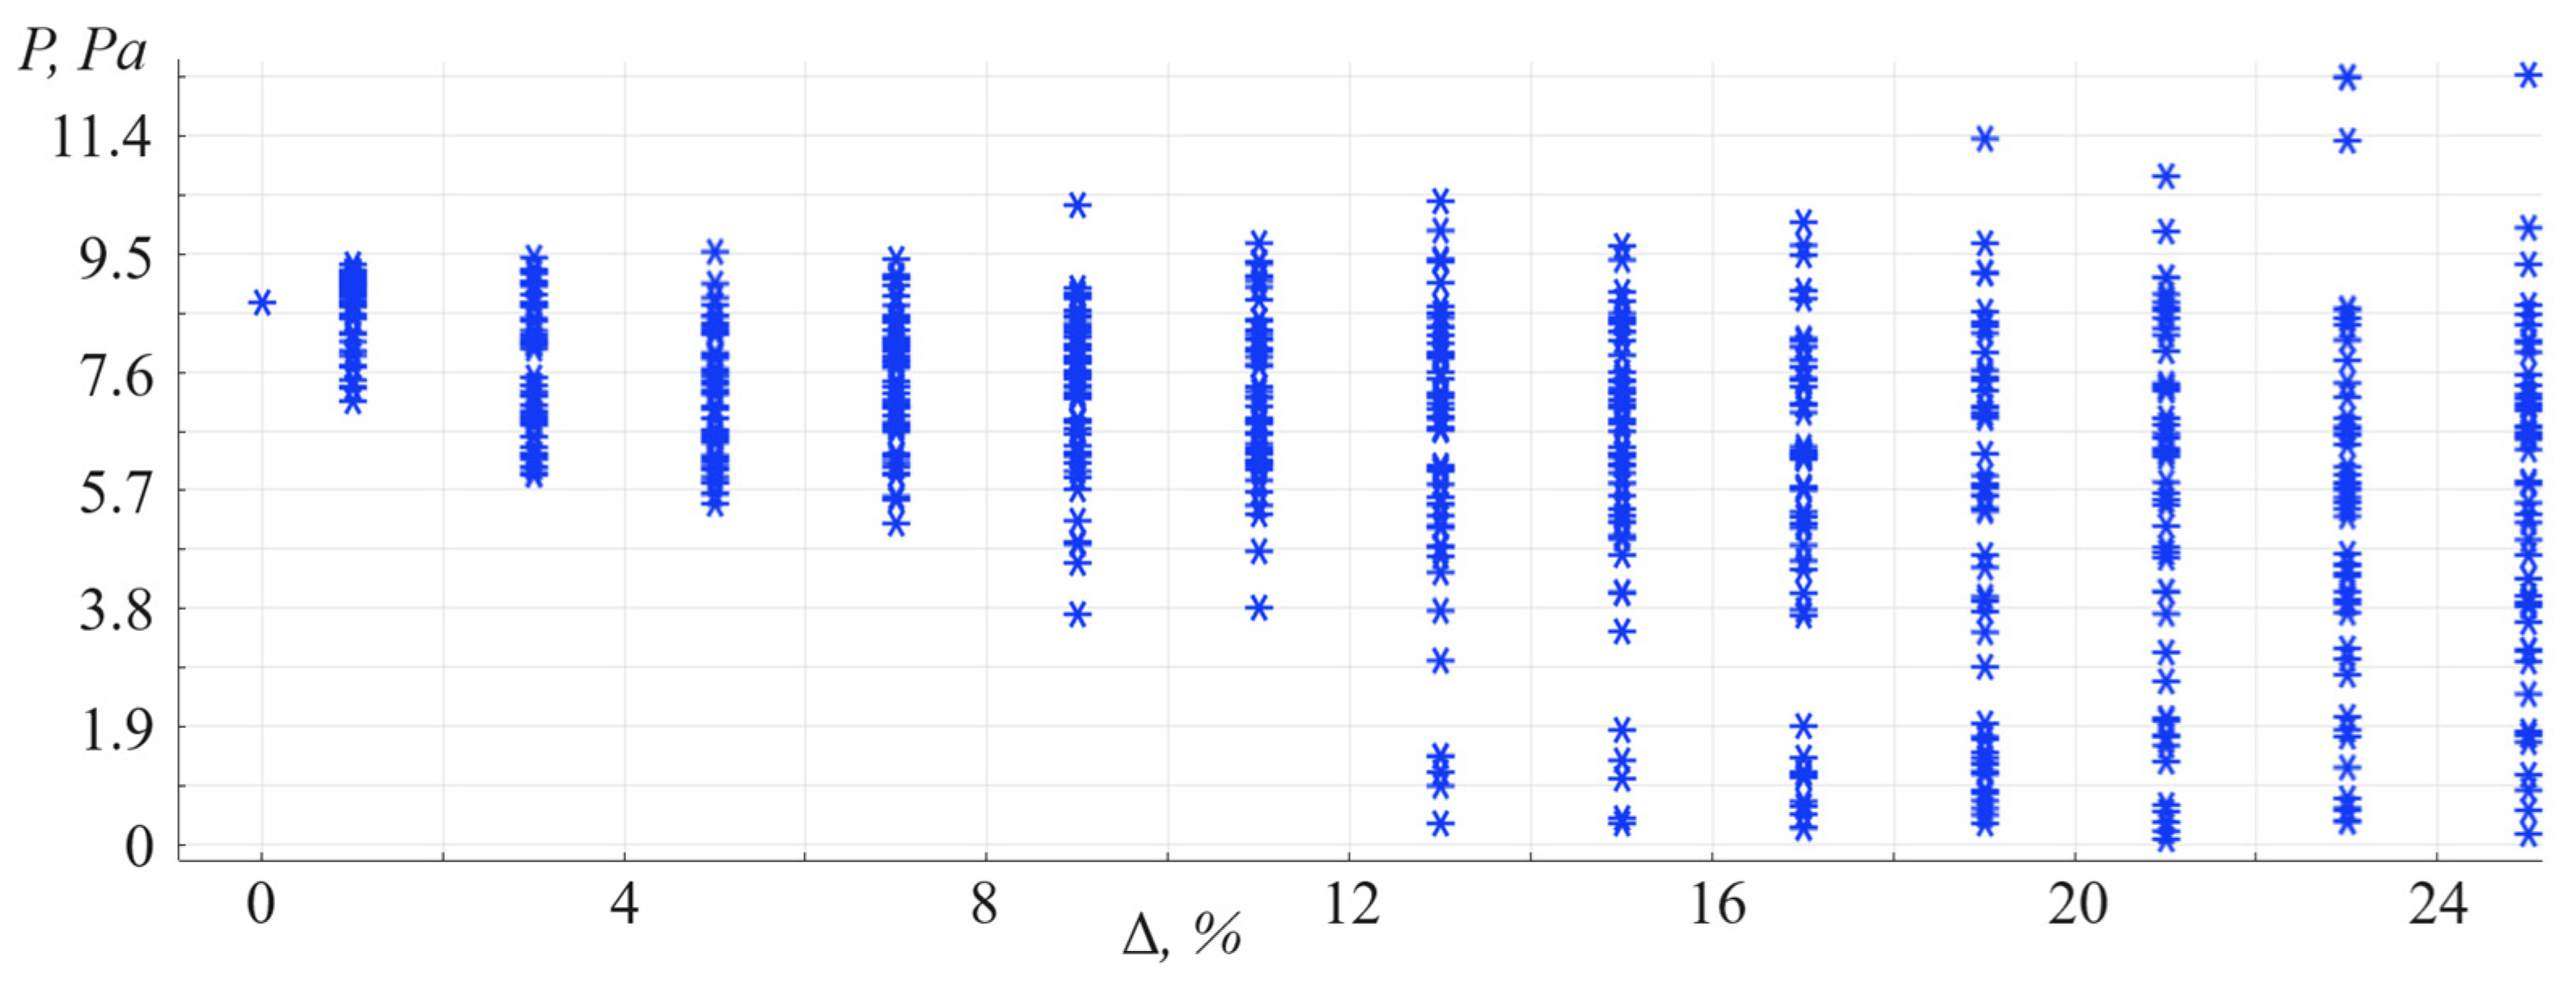
For the convergence of the solution, in addition to approximation, it is important that the solution be stable. To check this condition, 13 series of 50 realizations were carried out in which the input parameters of the problem were changed: frequency, elastic parameters of water and solid medium, depth of the source position, angle of the bank wedge solution, and vertical size of the modeling area (thickness of the solid medium section). The mentioned parameters were randomly varied in the range of ±Δ percent (for each series of realizations, a different value of Δ was used—from 0.01% to 25%). Hence, Δ—relative changes in the input parameters. Figure 5 illustrates that as the range of variation in input parameters (Δ) decreases, the range of variation in output values also reduces, converging to a consistent value as Δ approaches zero. Since the verification shows that both the approximation and stability conditions are satisfied, it is acceptable to state that the numerical scheme has convergence of the solution.
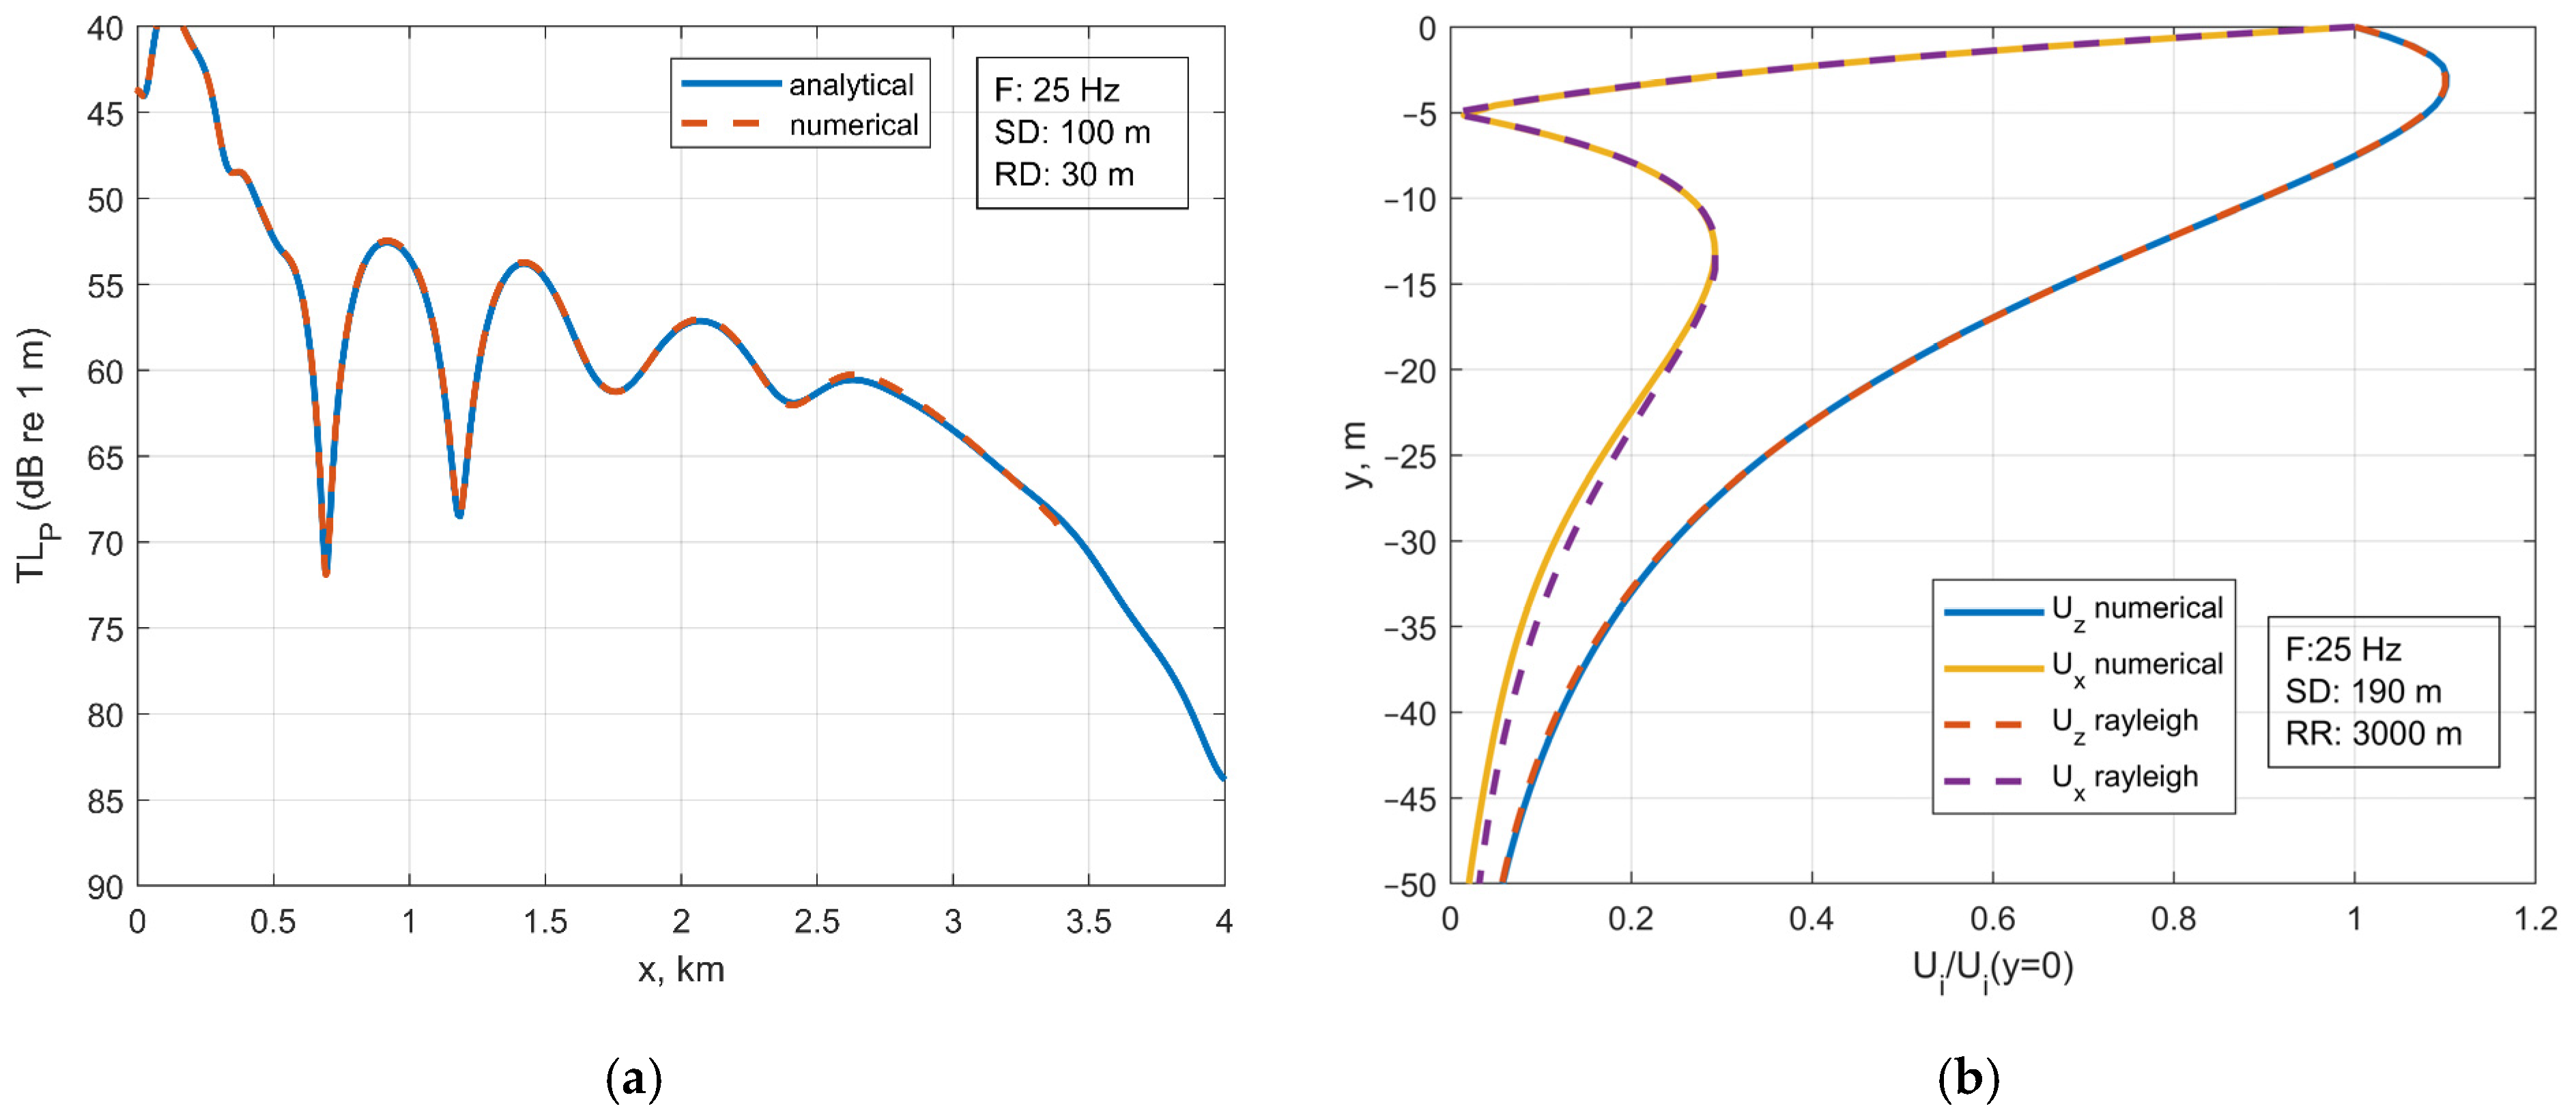
To validate the mathematical model underlying the calculations, we compared the results of numerical modeling with the known approximate analytical solution [20]. Note that the analytical solution considered is valid only for a fluid medium and, moreover, is obtained in the ray approximation, which does not allow us to extend it to the problem of studying the transformation of surface-type wave. For the reproducibility of the results, we will consider the reference model of the ASA coastal wedge (Figure 3). Following the conventional approach, the modeling results will be presented in the form of a graph of transmission loss along the horizon at a depth of h r = −30 m.
TL P x = 20 lg P ( x , y = 30   m ) P 0 r = 1   m ,
where P 0 = e i k 0 r / r is the reduced acoustic pressure generated by a point source in a boundless medium, r = x 2 + y 2 is the wave number, and ω = 2 π f is the circular frequency. The results of the comparison between calculations using the analytical expression for the hydroacoustic wave field in the coastal wedge and numerical simulation data using the developed model are presented in Figure 6a, which demonstrates a satisfactory match. It should be noted that the analytical solution is constructed for a three-dimensional formulation of the problem, whereas a two-dimensional axisymmetric version is used in numerical modeling. The coincidence of the results means that our approximation of axial symmetry is acceptable for solving this problem.
To investigate the seismoacoustic waves arising from an underwater source, we extended the modeling domain in the reference coastal wedge model—the right side of Figure 3 beyond the vertical dashed line—and considered land displacements. To validate the numerical modeling of displacements in the solid medium, we use the known analytical relations for the vertical profile of the amplitude of horizontal U x and vertical U y displacements in a Rayleigh surface wave [26]. The results of the comparison of analytical calculations with numerical simulation data for the extended reference model of the coastal wedge including land elements (Figure 3) when the source is located at a depth of h s = −190 m and the receivers are located at a large distance from the source at a distance of x r = 3000 m from the wedge edge are shown in Figure 6b.
The validation process confirms that the developed numerical model accurately represents the wave field generated by an underwater source, both in offshore and onshore. The satisfactory agreement between the analytical and numerical results demonstrates the validity of using axial symmetry in the model for this particular problem. This strengthens the confidence in the numerical model for more complex scenarios, including those involving seismoacoustic waves and various topographical features.

4. Numerical Results of Wave Propagation and Seismic Effects

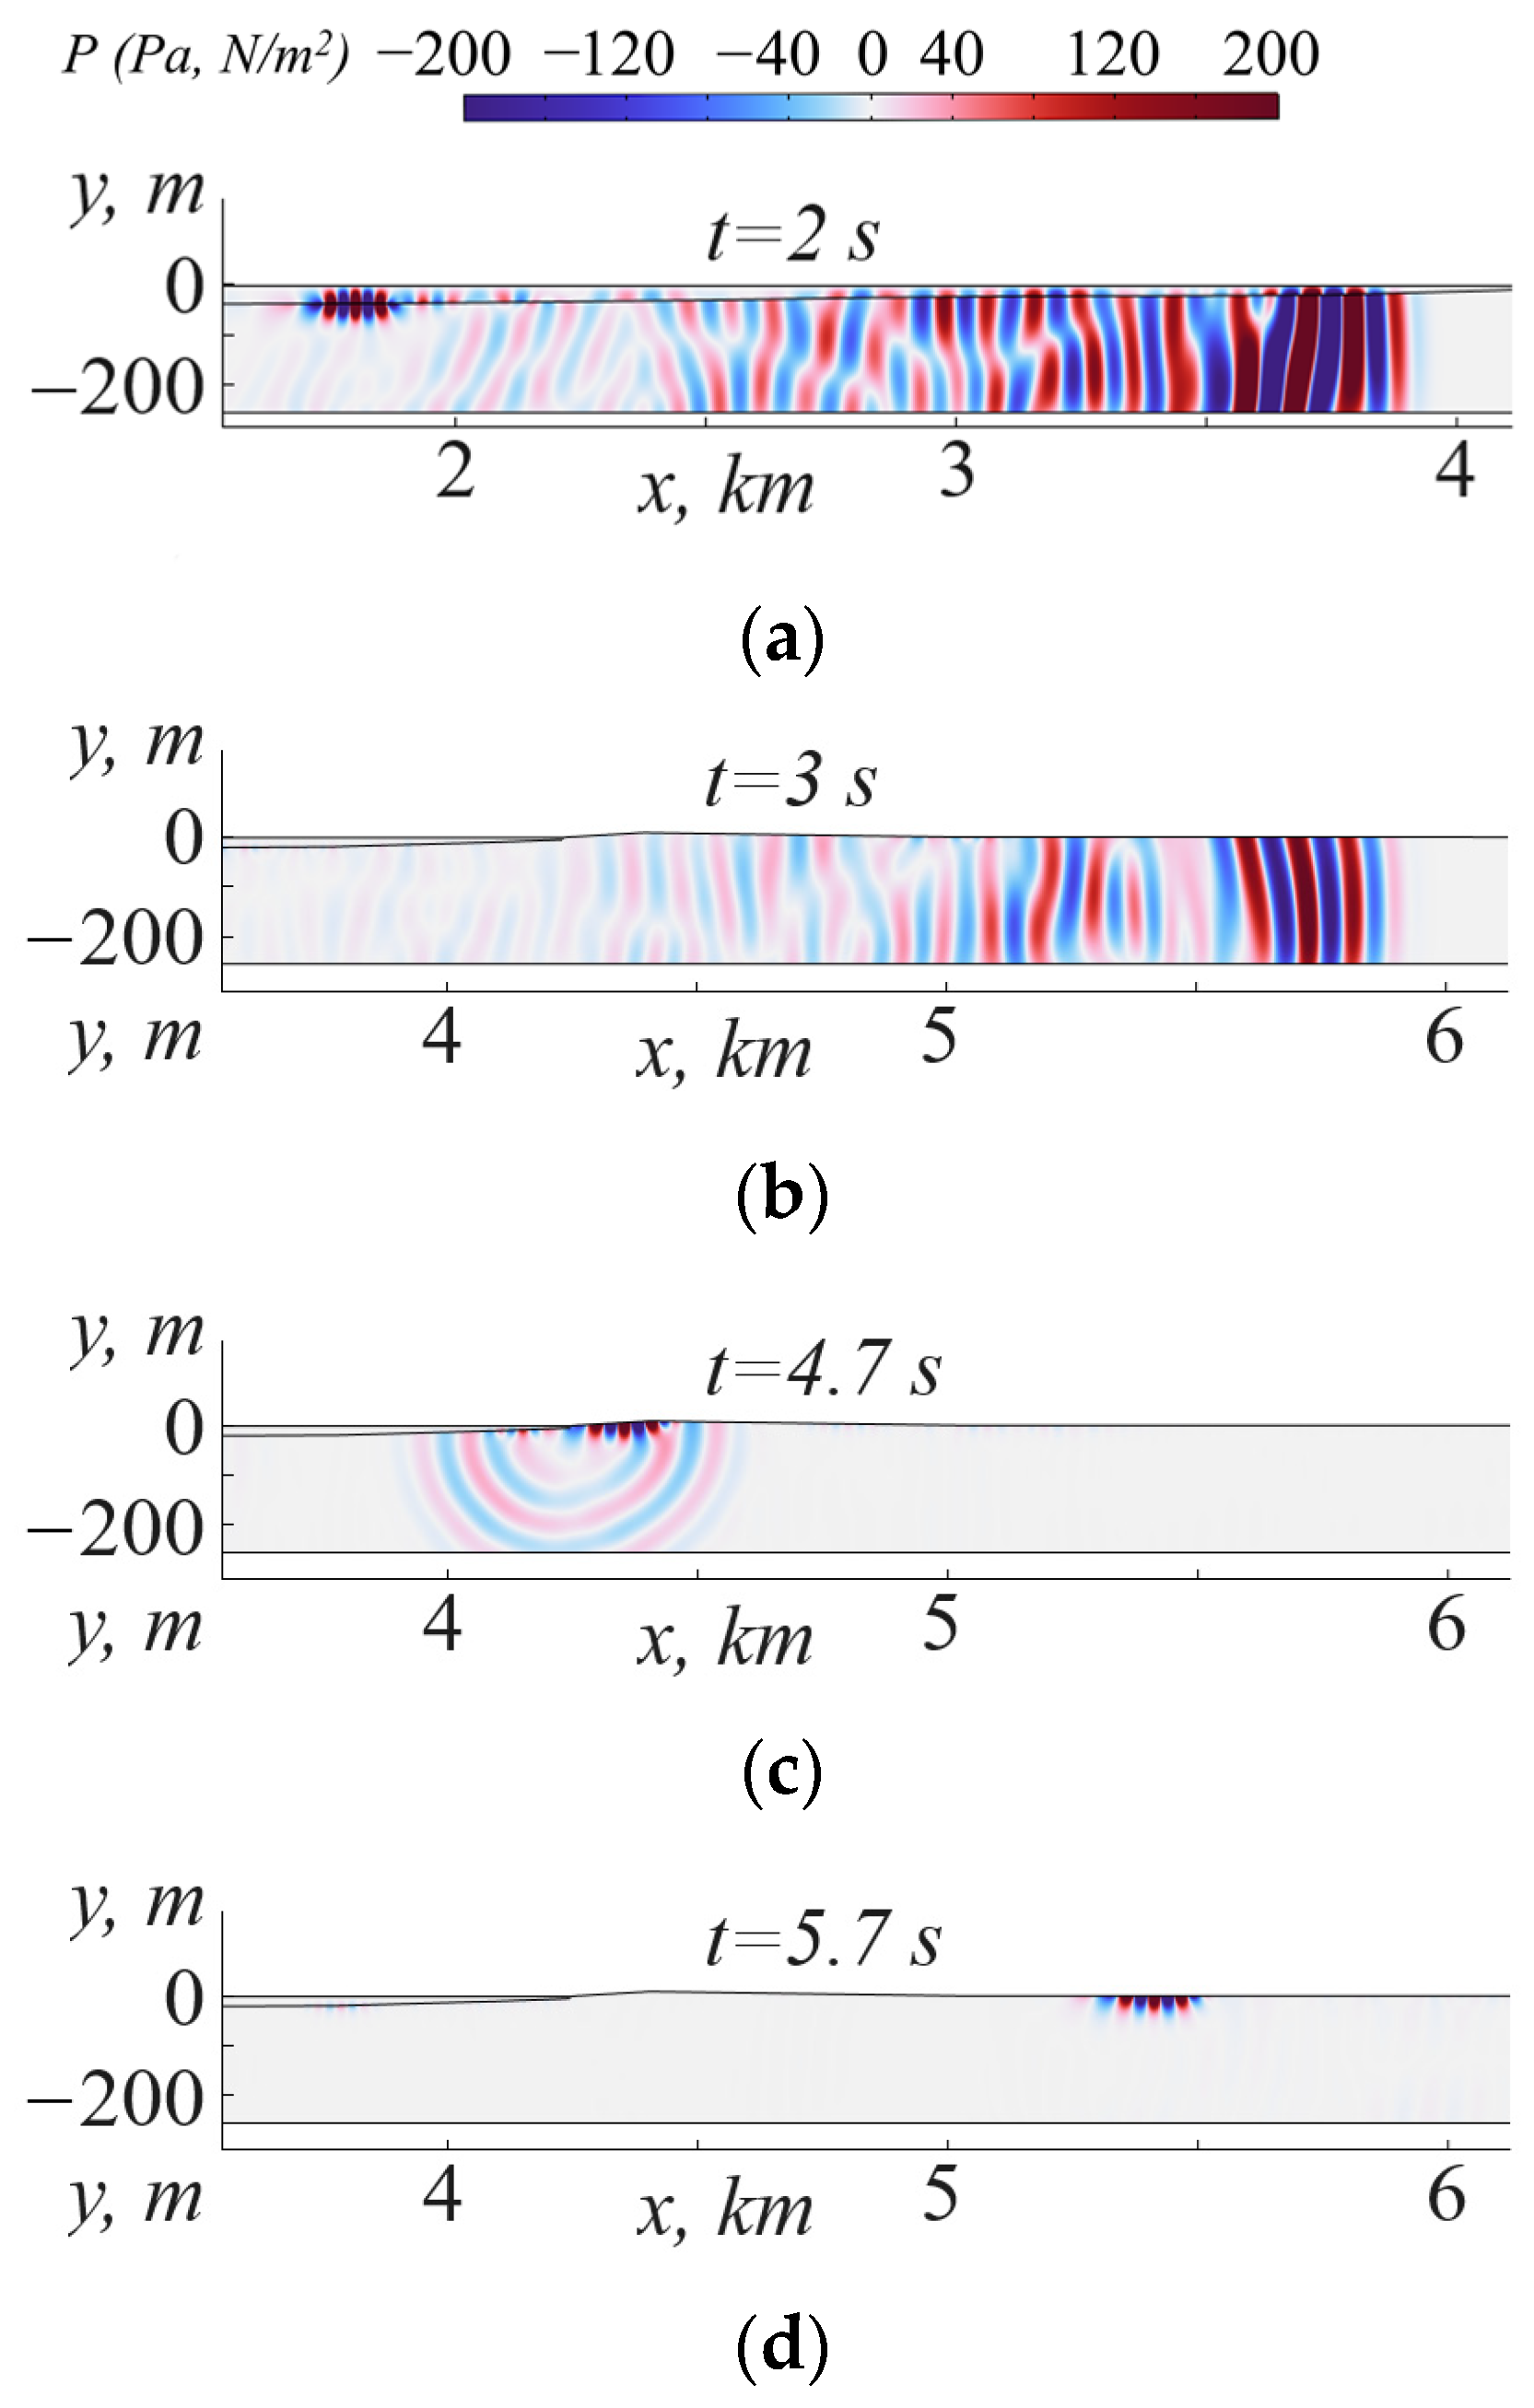
In the first stage, numerical calculations were performed in the time domain for a pulse signal consisting of two pulses with a central frequency of 22 Hz, corresponding to a characteristic period of 0.045 s (Figure 7). Here, we consider a model with a realistic bottom relief and source № 1 (Figure 2).
The source at a shallow depth of location generates both body waves in fluid and solid media and a surface wave of Scholte type at the boundary of the water and bottom structures (Figure 7a). Due to geometric features and physical inhomogeneities of parameters in the medium, over-reflections and transients, including leaky wave radiation, are observed. No Rayleigh wave generation is observed when a bulk wave goes on land (Figure 7b), while at the same time, when a Scholte surface wave originating in the sea goes on land, it undergoes an intense transformation into bulk waves (Figure 7c), which quickly decays due to geometric divergence (Figure 7d). Apparently, in the case of the effective generation of a surface wave at sea, the process of its transformation into body waves, depending on the physical parameters and the angle of the wedge, has a crucial importance for the displacement field on the shore.
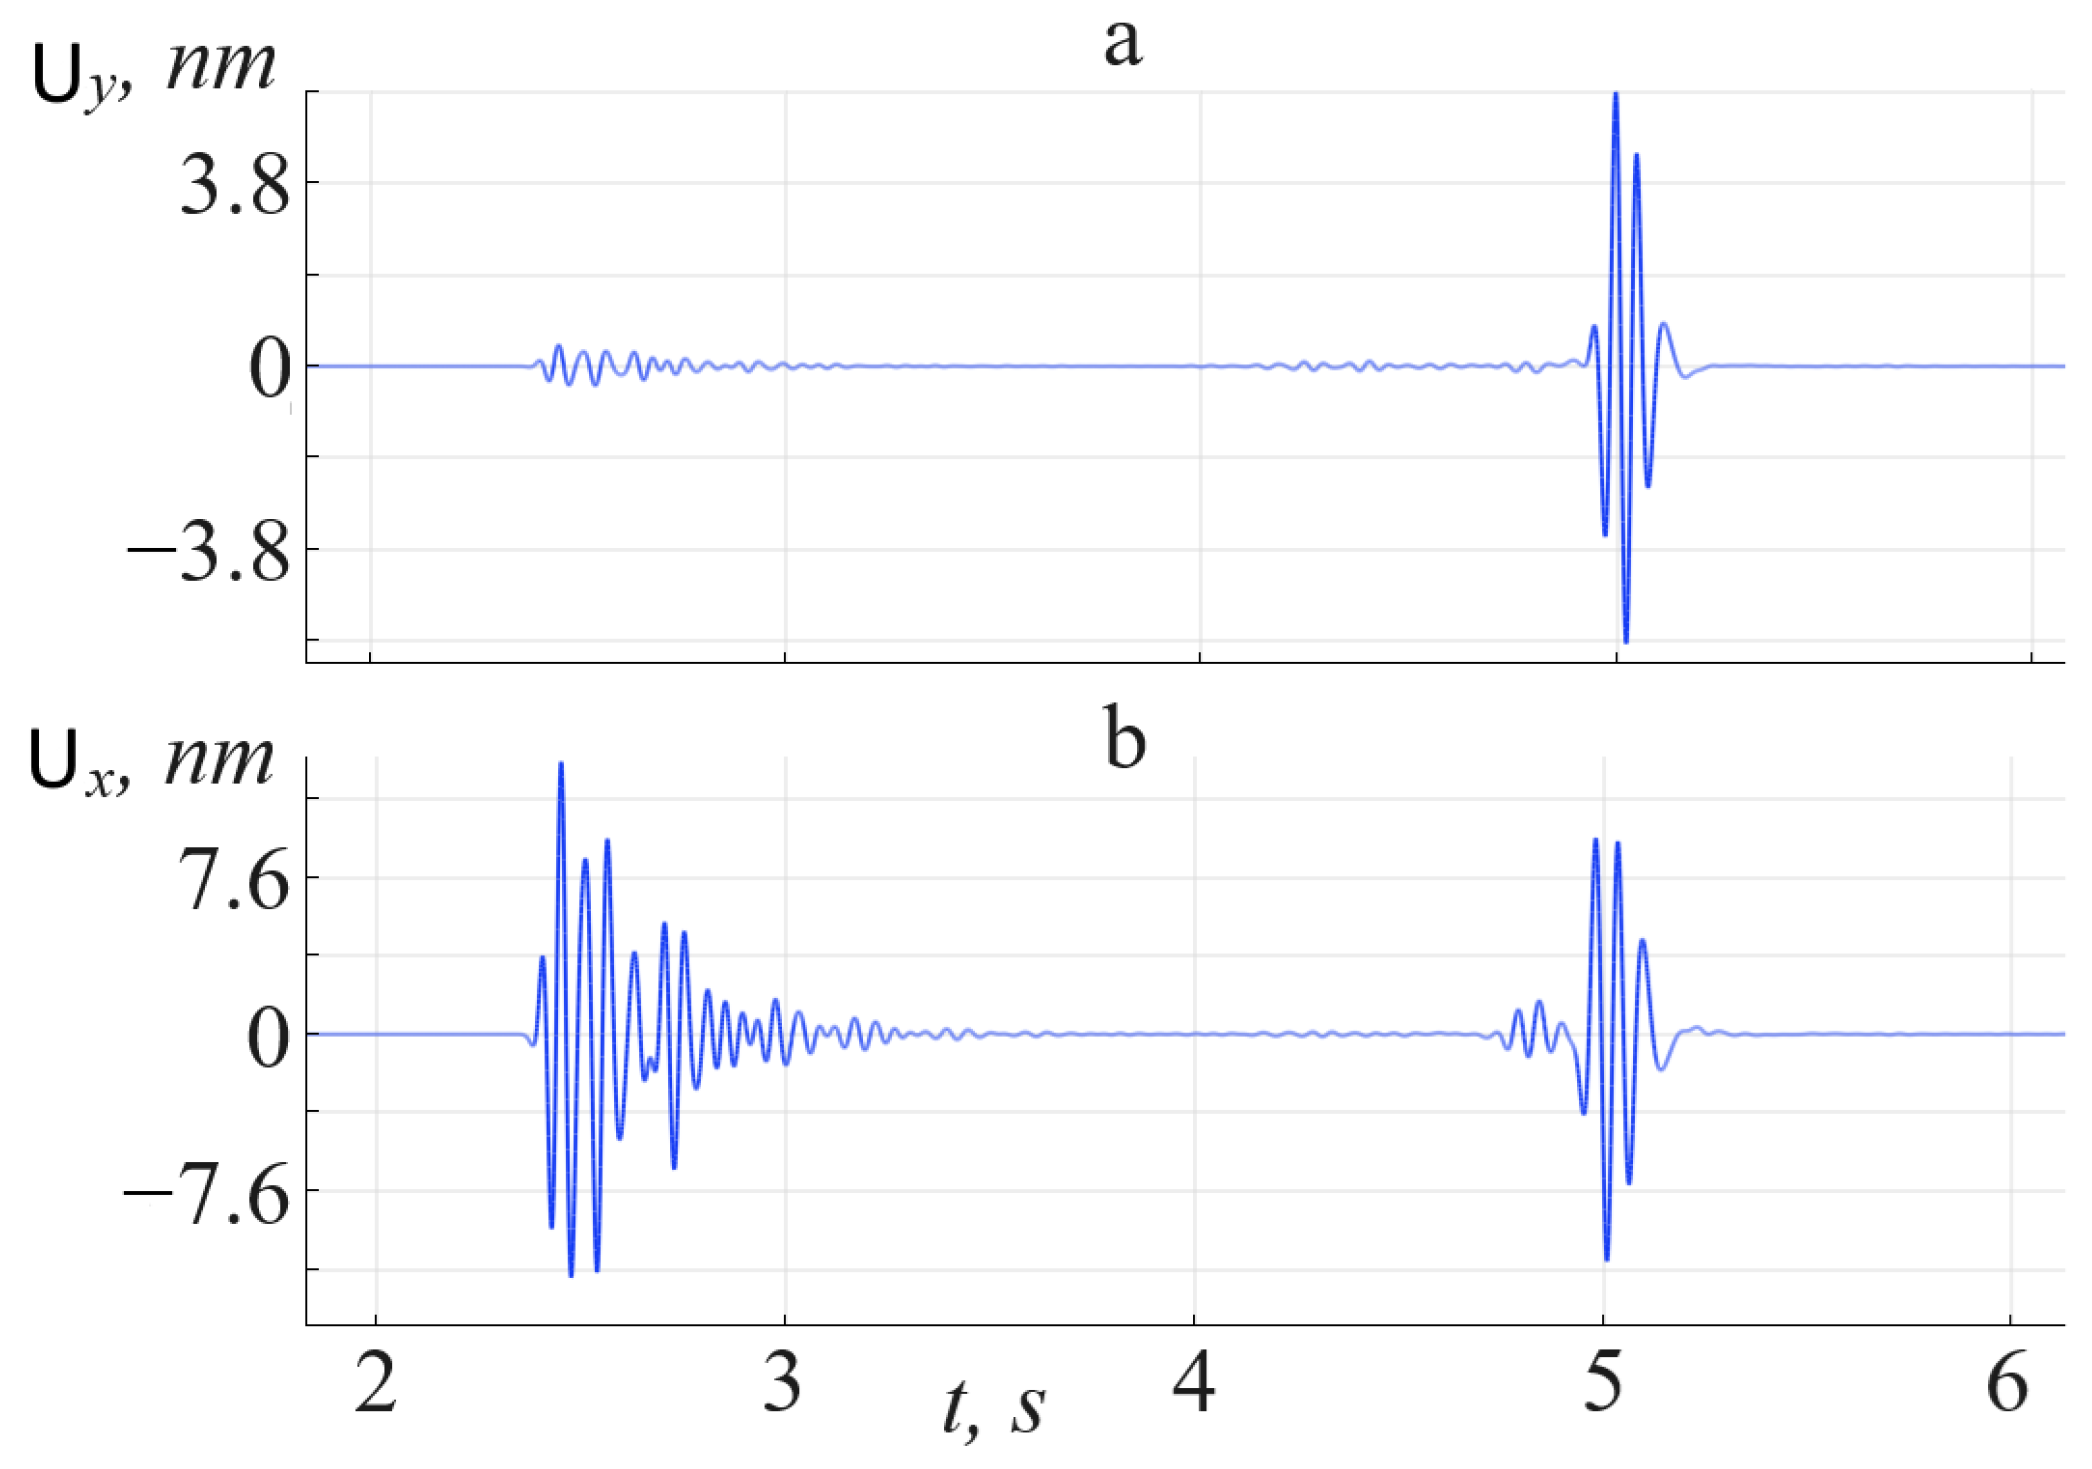
Let us proceed to the study of synthetic seismograms on the shore. At the chosen frequency of 22 Hz in the area of the laser strainmeter location there is a zone of attenuation of body waves on the surface, so the influence of the Rayleigh surface wave is particularly large here. For example, let us consider the action of a pulse source at Point S1 (Figure 1) at a distance of 4500 m from the wedge edge at a real bottom topography with a given longitudinal wave velocity of 2000 m/s. Figure 8 shows a calculated pulse seismogram at the location of the laser strainmeter, where at time intervals of about 2.5 s a wave train of body waves enters; then, at intervals of about 5 s, a Rayleigh wave is observed.
It can be concluded that in the case considered, the greatest contribution to the displacement field on land is made by Scholte surface waves generated on the seabed and transmitted to the land. Nevertheless, taking into account the specifics of the laser strainmeter operation and its sensitivity to horizontal deformations, it should be kept in mind that the signals from body and surface waves are commensurable. It is important to emphasize that the efficiency of surface wave generation in the sea significantly depends on the type of source and its location relative to the bottom.

5. Investigation of Seismic Signal Sensitivity to Coastal Wedge Parameters

During modeling, the source radiation parameters were selected so as to match the signal levels registered by the control hydrophone. From additional measurements of the levels of radiated acoustic energy, it is known that the amplitude of the signal P 0 on the control hydrophone located on the acoustic axis of the transmitter approximately 1 m away from the source during the experimental work was 6.9 ± 1 kPa (which corresponds to the acoustic power ~200 W), and the depth of the source h s could vary from −18 m to −15 m. The geologic model of the bottom at the experimental site is not known in detail. However, according to the modeling results available in the literature [16,17], which were verified by experimental data of acoustic measurements, the average values of longitudinal wave velocities at the bottom can be in the range of 1600 ≤ c l ≤ 2600 m/s, and the corresponding values of transverse wave velocities are estimated with acceptable accuracy as c t c l / 3 .
The values of spectral amplitudes of horizontal displacements on the shore were calculated on the basis of the numerical model described earlier. It is important to note that in the considered geometry of the problem, the field of displacements on the shore is characterized by spatial modulation, which can lead to a change in the obtained amplitude values of up to 10% when the observation point is moved along the land up to 10 m away. For this reason, the spectral amplitudes were averaged along the land area near the location of the laser strainmeter (Figure 2). Calculations were performed for various combinations of longitudinal c l and transverse c t wave velocities at the bottom, depths of the source location h s , and amplitudes of the radiated signal recorded by the control hydrophone P 0 within the limits of the permissible changes in these parameters: P 0 = 6.9 ± 1 kPa, h s [−18 m, −15 m], 1600 ≤ c l ≤ 2600 m/s, and c t c l / 3 . Thus, the simulation results allow us to evaluate the sensitivity of the calculated data to variations in the considered parameters c l , c t , h s , and P 0 . As it turned out, this influence in the selected ranges of parameter changes is quite significant. The final estimates of land displacements obtained by averaging the results of modeling performed for all combinations considering c l , c t , h s , and P 0 turned out to be equal to 4.2 ± 2 nm for the source at Point S1 and 0.6 ± 0.5 nm for the source at Point S2 (Figure 1). The results obtained coincide within the estimated accuracy with the experimental data obtained by the laser strainmeter (see Table 1): 2.5 nm for Point S1 and 0.9 nm for Point S2; however, the variance of the calculated estimates is unacceptably high.
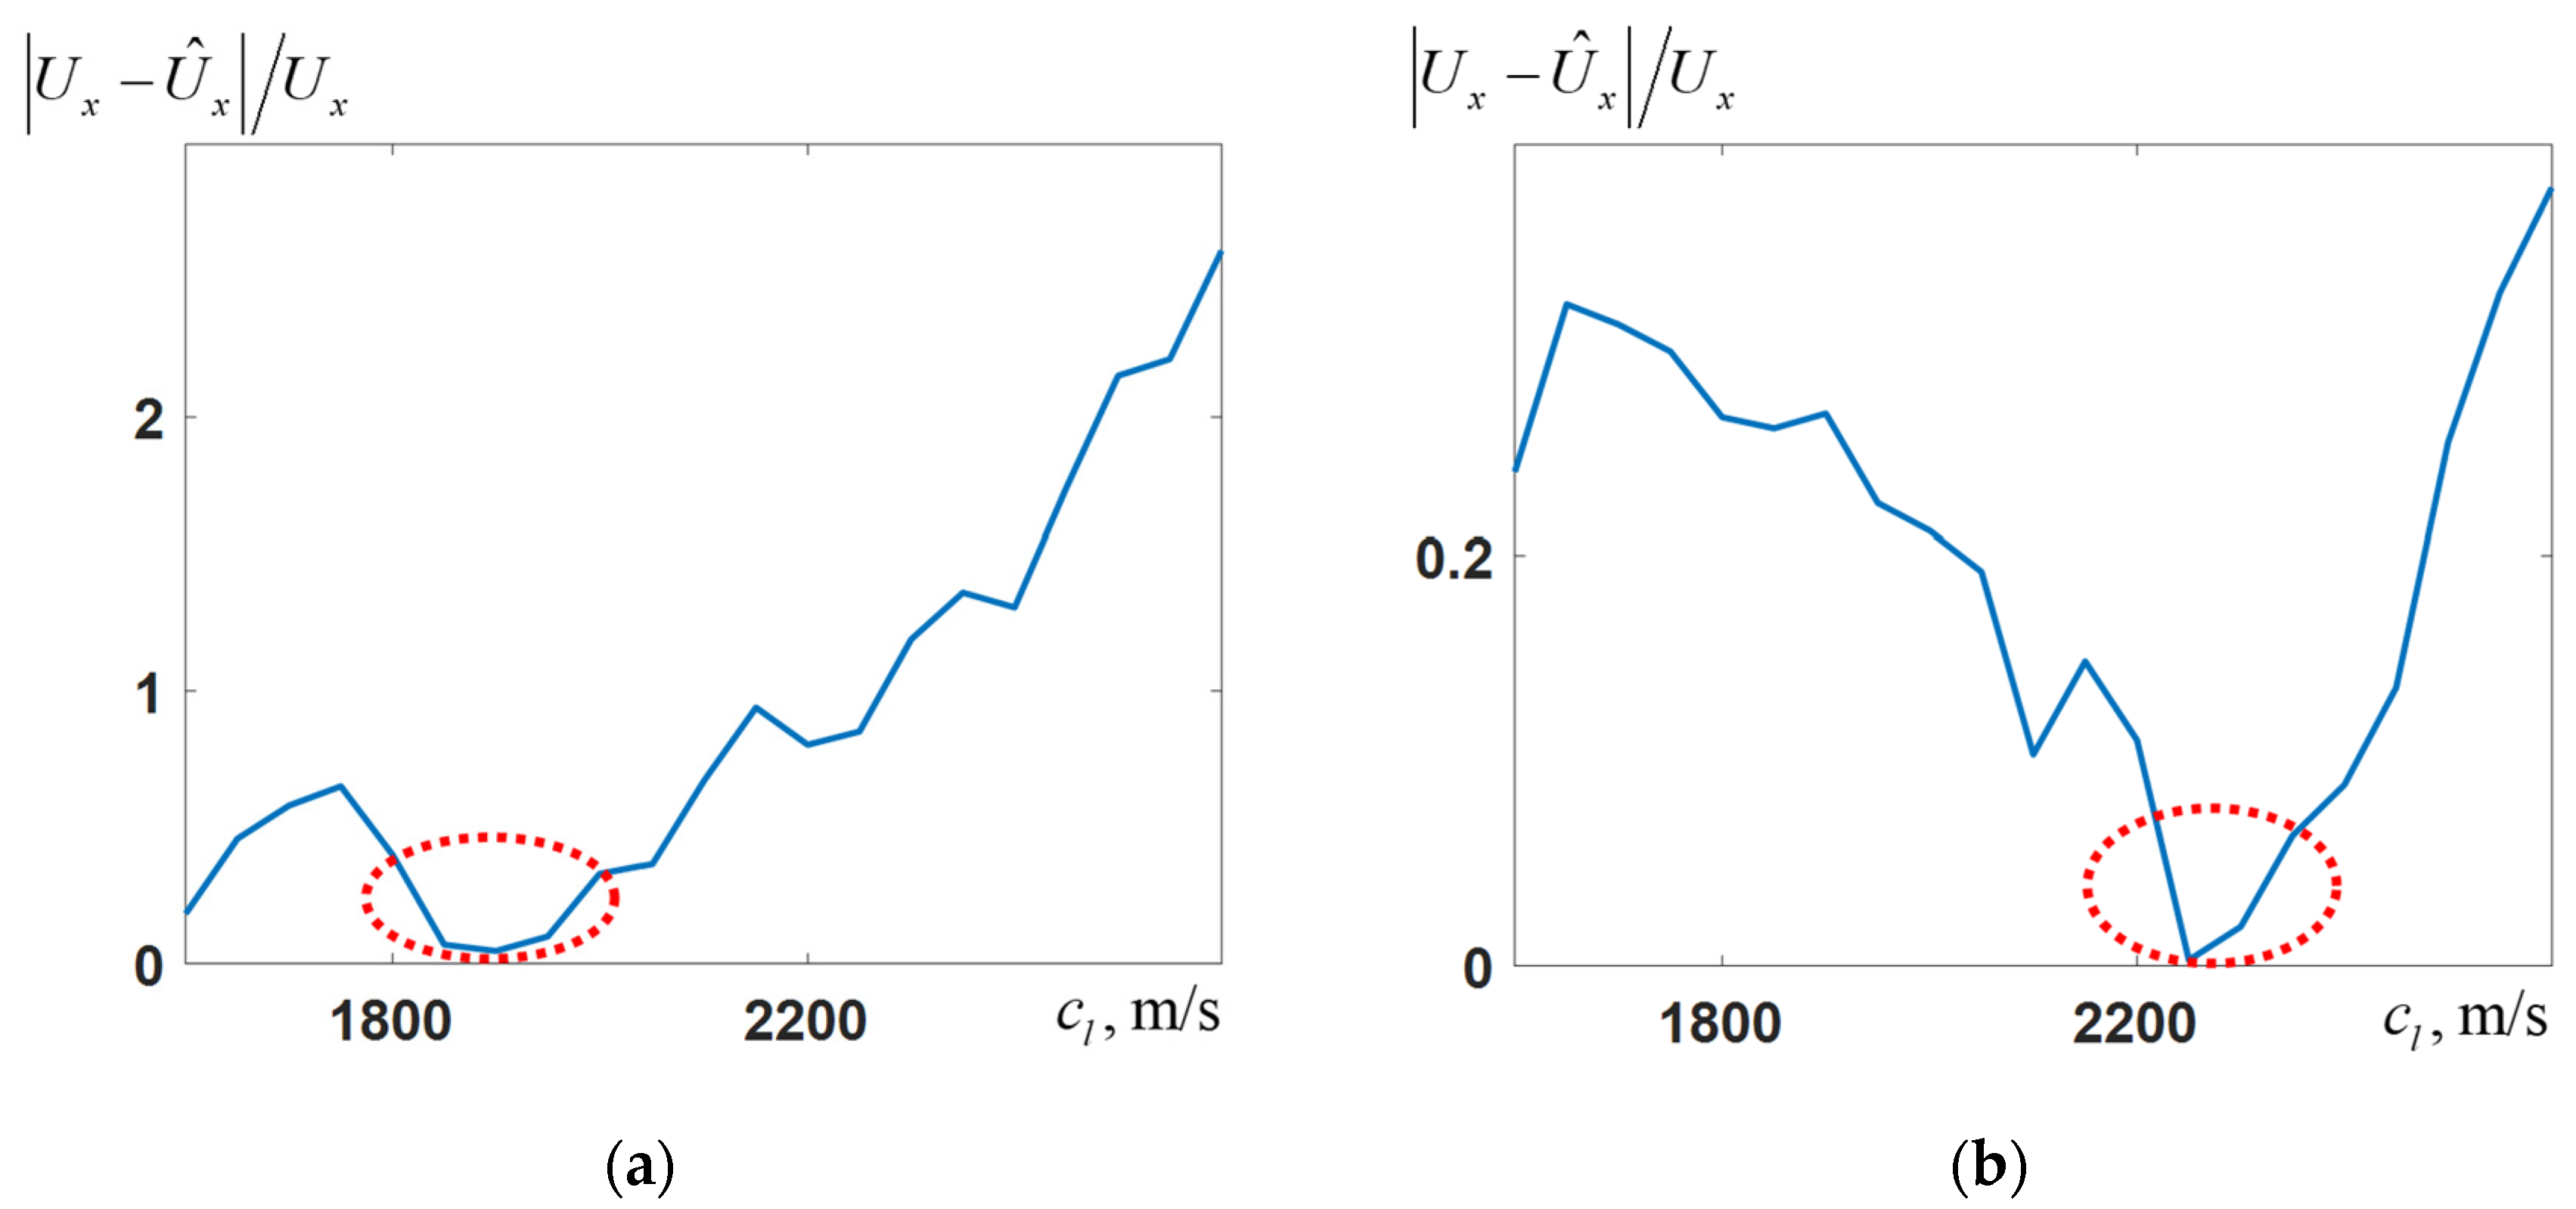
The greatest influence on the variation in the numerical modeling results is the change in longitudinal c l and transverse c t wave velocities at the bottom. The values of the source parameters h s and P 0 are known quite well, in contrast to the bottom characteristics c l and c t , which can undergo significant changes along the propagation path [17]. In the region under consideration, near the shore, there is a near-surface layer with velocities c l 1800 m/s, which affects the field formation at short distances, when the wave reaches the shore before the influence of the deep bottom structures begins to manifest itself. When moving away from the water’s edge, the radiated waves have time to penetrate into the bottom, where layers with higher velocity values are located. In the region under consideration, at a distance from the shore, the depth-averaged values of longitudinal wave velocities (taking into account low-velocity near-surface layers) are c l 2500 m/s [17]. Figure 9 shows the results of calculating the residuals between the experimentally measured displacements for the emission points S1 and S2 and their estimates numerically calculated for different values in the analyzed range 1600 ≤ c l ≤ 2600 m/s. The other parameters are fixed: P 0 = 6.9 kPa; h s = −18 m. As can be seen in Figure 9, a minimum of non-correlation is observed, which corresponds to different ranges of values c l .
As a result, if we consider Point S1 closest to the shore, modeling with parameters 1800 ≤ c l ≤ 2000 m/s gives a much more accurate estimate of the amplitude of land displacements with a noticeably smaller dispersion: 2.6 ± 0.6 nm. In turn, for Point S2, modeling in the range of longitudinal wave velocity variations 2200 ≤ c l ≤ 2450 m/s also provides a noticeably better estimate: 0.9 ± 0.2 nm.
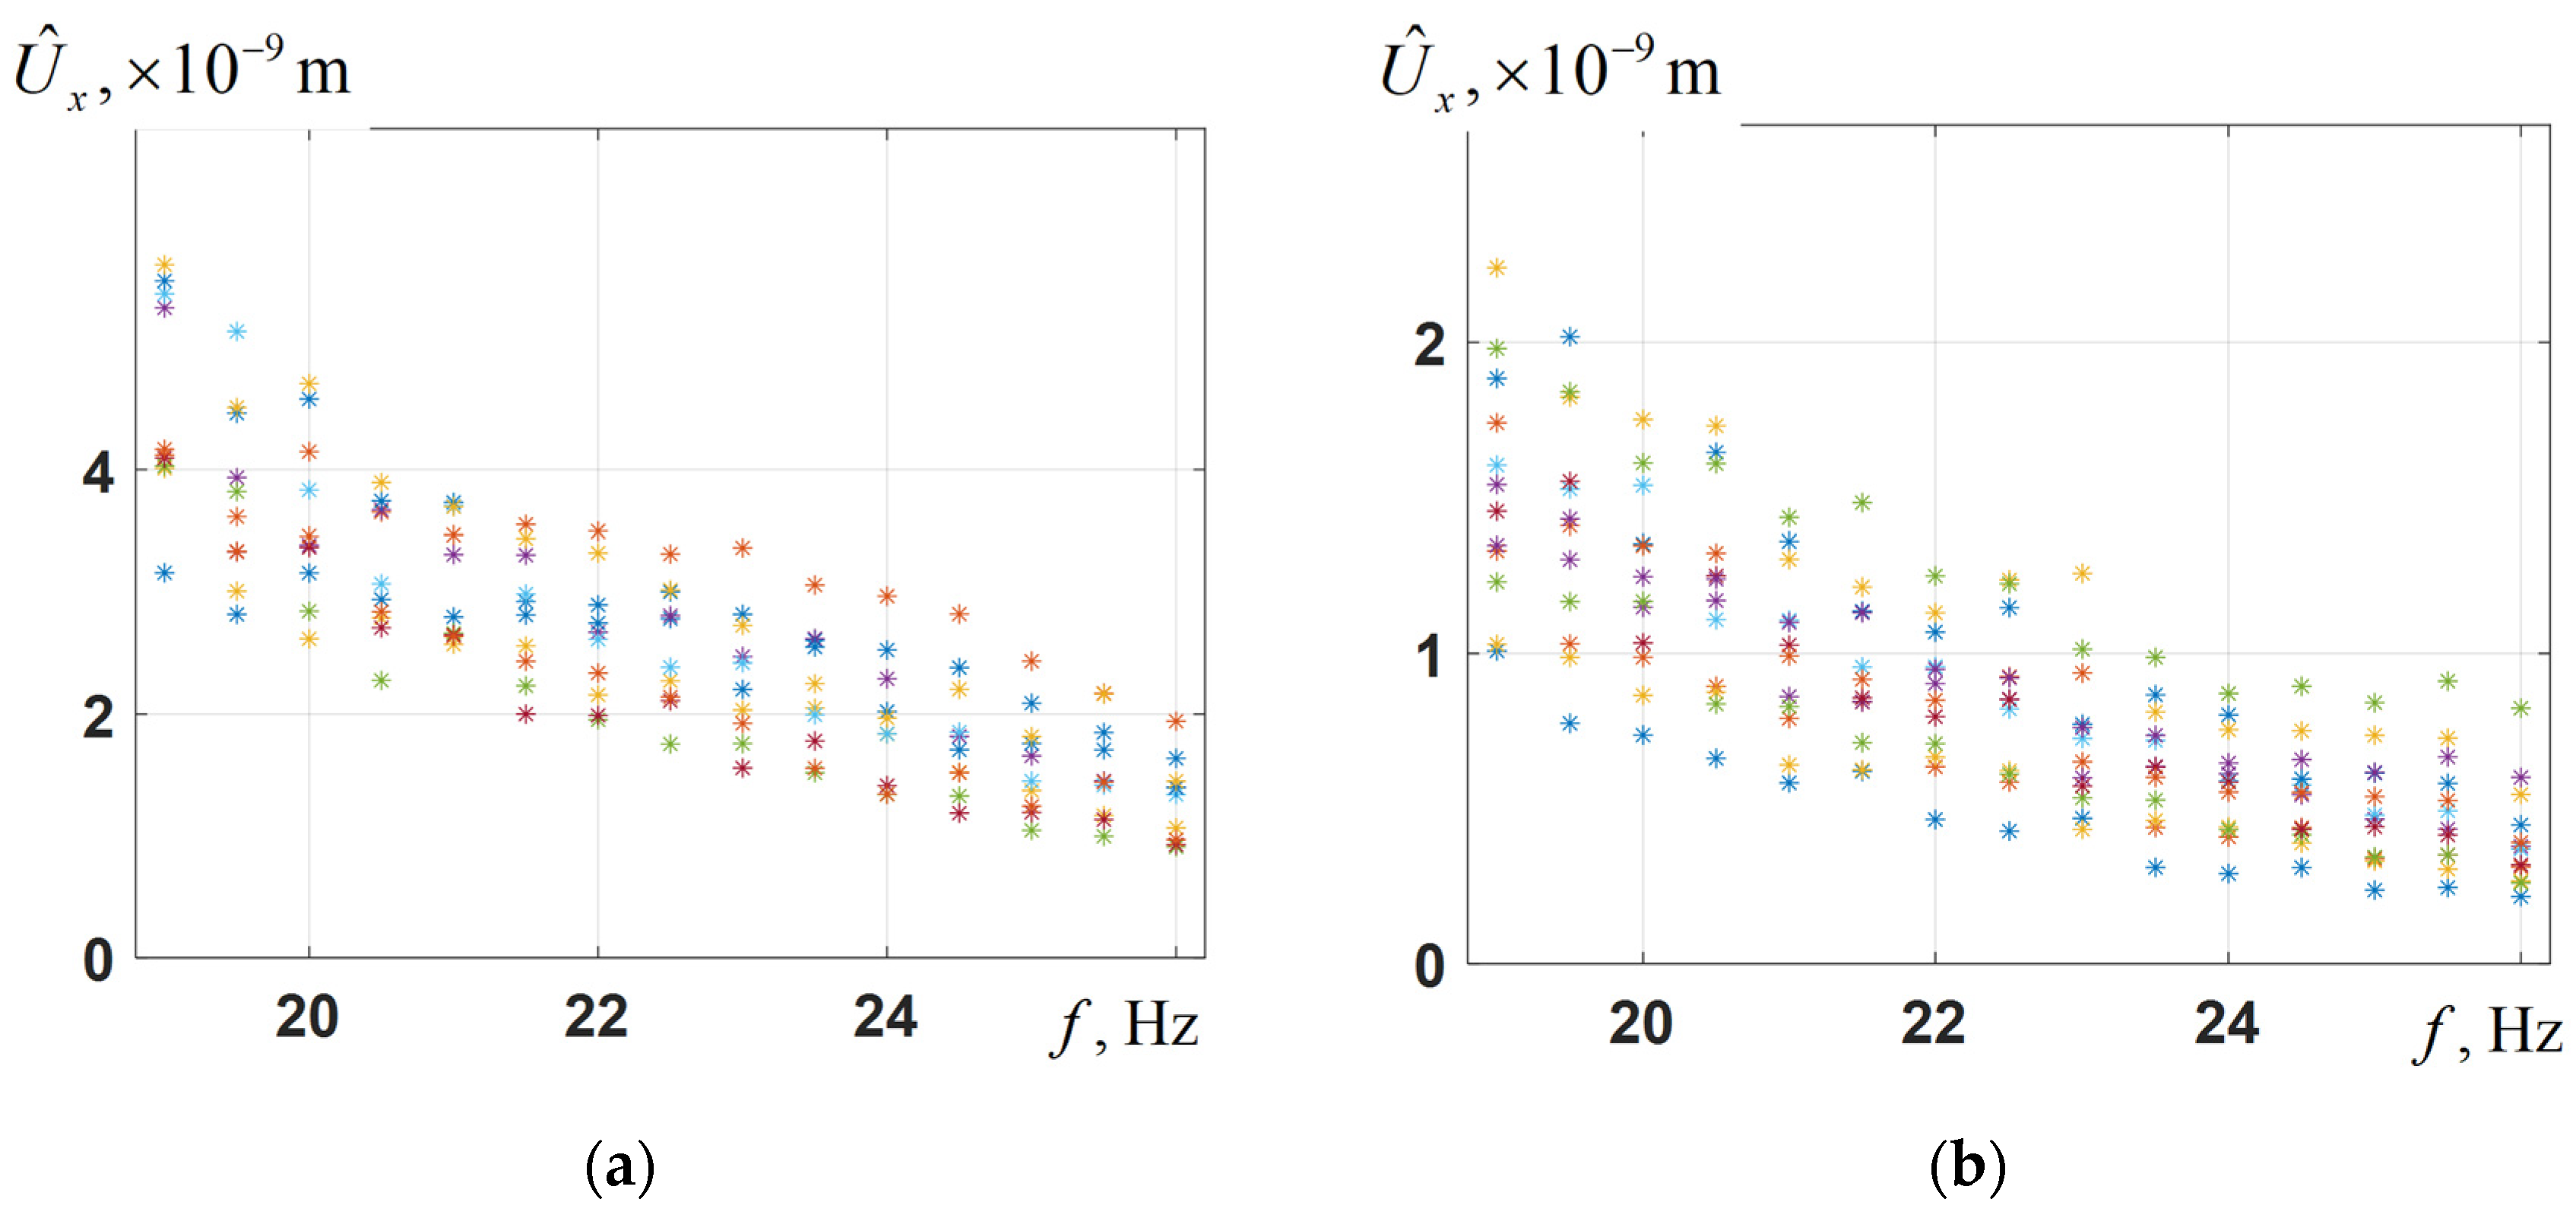
Figure 10 shows the calculated values of the spectral amplitudes of land displacements (averaged over the land surface) at the laser strainmeter locations in the band 19–26 Hz with the same spectral amplitude corresponding to the experimental data P 0 = 6.9 ± 1 kPa. For simplicity, it is assumed that the radiation amplitude is approximately the same throughout the entire frequency band. Different points in Figure 10 characterize a different set of simulation parameters c l , c t , h s , and P 0 , with 1800 ≤ c l ≤ 2000 m/s being used for the source at Point S1 and 2200 ≤ c l ≤ 2450 m/s for the source at Point S2. The data shown in Figure 10 demonstrate that variations in the values of these parameters can significantly affect the resulting displacement values. For the results obtained for Point S2, this influence is particularly strong at low frequencies when the elastic parameters of the bottom change since the seismic wave in this case penetrates to considerable depths.
The results obtained at the current stage of research indicate the necessity to take into account the layered bottom structure along the entire propagation path. Due to the fact that such data measured by independent (contact) methods are not available in a sufficiently dense grid of spatial coordinates, the question arises of estimating these parameters from the laser strainmeter measurements on land, i.e., of solving the inverse problem of restoring the characteristics of the propagation path. Methods for solving such inverse problems are known [9], but their realization belongs to the prospects of further research. The small amount of input experimental data impose restrictions on the range of medium parameters that can be reconstructed. For this reason, to solve an inverse problem, the travel times of the radiated waves should also be taken into account in the experiment, in addition to the amplitude of the received signal.

6. Conclusions

The paper proposes a model for the numerical study of the transformation of seismoacoustic signals during the transformation at the land–sea boundary. The model’s high computational efficiency enabled an extensive series of simulations across a broad range of physical parameters, facilitating robust comparison with experimental data. This made it possible to estimate the most appropriate parameters of the propagation medium and to achieve a satisfactory match between measured and calculated data. The further improvement in modeling accuracy is connected with model development—the consideration of three-dimensional problem formulation and the consideration of hydrology and layered bottom sediment structure. In addition, the inclusion of ocean bottom seismometers (OBSs) in the measurement system is required to improve the quality of the experimental data.
The main results of the present work include the following:
  • It was shown that it is possible to accurately model acoustic–elastic propagation at the transition between sea and land using a finite element method, after validation against known analytical solutions.
  • This study demonstrates that the shore displacement field is highly sensitive to the radiation efficiency of body waves, while the Scholte surface wave transforms during coastal landfall.
  • It is shown that the results of numerical modeling adequately describe the obtained experimental data, and it is established that the bottom sediment parameters—in particular, the velocities of elastic waves—have a crucial influence on the seismic signal value on the shore.
The developed model of the coastal wedge for the region of the Russian Far East allows us to create a database of typical waveforms corresponding to sources of different types and different physical nature for use in the task of the automatic identification of the signal presence. In addition, in the future, this model can be used to study different signal propagation paths along the source–receiver path and to determine the most intense wave types. If there is a large number of coastal/bottom receivers or a sufficient number of spatially distributed sources of low-frequency signals, it opens up the possibility of using tomographic schemes for monitoring the physical parameters of the water area, which is important in the light of global climate change [27]. Overall, this study offers a basic model for analyzing seismoacoustic wave propagation in coastal wedge conditions, which is essential for coastal monitoring and environmental studies. Future improvements will further enhance its role in understanding signal propagation in complex coastal environments.

Author Contributions

Conceptualization, G.D.; methodology, A.R.; software, R.Z. and A.S.; validation, R.Z. and D.P.; formal analysis, A.R.; investigation, D.P.; resources, M.B.; data curation, M.B.; writing—original draft preparation, D.P., R.Z. and A.S.; writing—review and editing, A.R. and D.Z.; visualization, R.Z., D.P. and A.S.; supervision, D.P.; project administration, G.D.; funding acquisition, G.D. All authors have read and agreed to the published version of the manuscript.

Funding

This work was carried out under Contract No. EП-32/2024 dated 27 August 2024 with the financial support of the Ministry of Science and Higher Education of the Russian Federation No. 075-15-2024-642, “Study of the processes and patterns of occurrence, development and transformation of catastrophic phenomena in the oceans and on continents using seismoacoustic monitoring methods”.

Institutional Review Board Statement

Not applicable.

Informed Consent Statement

Not applicable.

Data Availability Statement

Data are contained within the article.

Acknowledgments

The authors express their gratitude to S.S. Budrin, an employee of V.I. Il’ichev Pacific Oceanological Institute FEB RAS, for useful advice and discussion of the parameters of the experiment used in this work.

Conflicts of Interest

The authors declare no conflicts of interest.

References

  1. Buehler, J.S.; Shearer, P.M. T phase observations in global seismogram stacks. Geophys. Res. Lett. 2015, 42, 6607–6613. [Google Scholar] [CrossRef]
  2. de Groot-Hedlin, C.D.; Orcutt, J.A. Excitation of T-phases by seafloor scattering. J. Acoust. Soc. Am. 2001, 109, 1944–1954. [Google Scholar] [CrossRef] [PubMed]
  3. Okal, E.A. The generation of T waves by earthquakes. Adv. Geophys. 2008, 49, 1–65. [Google Scholar] [CrossRef]
  4. Adushkin, A.V.; Burchik, V.N.; Goncharov, A.I.; Kulikov, V.I.; Khristoforov, B.D. Seismic, Hydroacoustic, and Acoustic Action of Underwater Explosions. Combust. Explos. Shock Waves 2004, 40, 707–713. [Google Scholar] [CrossRef]
  5. Vedenev, A.I.; Kochetov, O.Y.; Lunkov, A.A.; Shurup, A.S.; Kassymbekova, S.S. Air–borne and Underwater Noise Produced by a Hovercraft in the North Caspian Region: Pressure and Particle Motion Measurements. J. Mar. Sci. Eng. 2023, 11, 1079. [Google Scholar] [CrossRef]
  6. Garagash, I.A.; Lobkovsky, L.I. Deformation tectonic waves as a possible trigger mechanism for the activation of methane emissions in the Arctic. Arct. Ecol. Econ. 2021, 11, 42–50. [Google Scholar] [CrossRef]
  7. Antonovskaya, G.; Konechnaya, Y.; Morozova, E.; Mikhailova, Y.; Shakhova, E. Potential of the Arkhangelsk seismic network for European Arctic monitoring. Earthq. Sci. 2024, 37, 1–11. [Google Scholar] [CrossRef]
  8. Kulchin, Y.N.; Kamenev, O.T.; Petrov, Y.S.; Romashko, R.V. Developing Physical Bases for Low-Frequency Acoustic Tomography in the Arctic Shelf Using Fiberoptic Geophones. Bull. Russ. Acad. Sci. Phys. 2018, 82, 487–490. [Google Scholar] [CrossRef]
  9. Sobisevich, A.L.; Presnov, D.A.; Shurup, A.S. Fundamentals of passive seismohydroacoustic methods for Arctic shelf investigation. Acoust. Phys. 2021, 67, 62–82. [Google Scholar] [CrossRef]
  10. Katsnelson, B.; Petnikov, V.; Lynch, J. Fundamentals of Shallow Water Acoustics; Springer: Boston, MA, USA, 2012. [Google Scholar]
  11. Jensen, F.B.; Kuperman, W.A.; Porter, M.B.; Schmidt, H. Computational Ocean Acoustics, 2nd ed.; Springer: New York, NY, USA, 2011; pp. 337–380, 420. [Google Scholar]
  12. Fatyanov, A.G.; Terekhov, A.V. High-performance modeling acoustic and elastic waves using the parallel dichotomy algorithm. J. Comput. Phys. 2011, 230, 1992–2003. [Google Scholar] [CrossRef]
  13. Kozitskiy, S. Coupled-Mode Parabolic Equations for the Modeling of Sound Propagation in a Shallow-WaterWaveguide with Weak Elastic Bottom. J. Mar. Sci. Eng. 2022, 10, 1355. [Google Scholar] [CrossRef]
  14. Zhu, Z.; Wang, Y.; Zhu, X.; Liu, W.; Lan, Q.; Xiao, W. Parallel optimization of three-dimensional wedge-shaped underwater acoustic propagation based on MPI+OpenMP hybrid programming model. J. Supercomput. 2021, 77, 4988–5018. [Google Scholar] [CrossRef]
  15. Stevens, J.L.; Hanson, J.; Nielsen, P.; Zampolli, M.; Le Bras, R.; Haralabus, G. Calculation of Hydroacoustic Propagation and Conversion to Seismic Phases at T-Stations. Pure Appl. Geophys. 2021, 178, 2579–2609. [Google Scholar] [CrossRef]
  16. Rutenko, A.N.; Manul’chev, D.S.; Kozitskii, S.B. Study of Acoustic Signal Propagation from Sea to Land. Acoust. Phys. 2019, 65, 279–287. [Google Scholar] [CrossRef]
  17. Budrin, S.; Dolgikh, G.; Chupin, V.; Dolgikh, S. Some Peculiarities of Low-Frequency Hydroacoustic Signals Behavior in Tomographic Studies of “Sea-Land-Sea” System. J. Mar. Sci. Eng. 2022, 10, 1550. [Google Scholar] [CrossRef]
  18. Li, G.; Wang, J.; Meng, X.; Hua, Q.; Kan, G.; Liu, C. Seafloor Sediment Acoustic Properties on the Continental Slope in the Northwestern South China Sea. J. Mar. Sci. Eng. 2024, 12, 545. [Google Scholar] [CrossRef]
  19. COMSOL. Acoustics Module User’s Guide. Available online: https://doc.comsol.com/5.4/doc/com.comsol.help.aco/html_AcousticsModuleManual.html (accessed on 12 November 2024).
  20. Tang, J.; Petrov, P.S.; Piao, S.; Kozitskiy, S.B. On the method of source images for the wedge problem solution in ocean acoustics: Some corrections and appendices. Acoust. Phys. 2018, 64, 225–236. [Google Scholar] [CrossRef]
  21. Zhostkov, R.A. Remote seismoacoustic probing of the bottom of a sea covered by ice. Bull. Russ. Acad. Sci. Phys. 2020, 84, 94–97. [Google Scholar] [CrossRef]
  22. Wen-Yu, L.; Chun-Mei, Y.; Ji-Xing, Q.; Zhang, R.H. Benchmark solutions for sound propagation in an ideal wedge. Chin. Phys. 2013, 22, 054301. [Google Scholar] [CrossRef]
  23. Bottero, A.; Cristini, P.; Komatitsch, D. On the Influence of Slopes, Source, Seabed and Water Column Properties on T Waves: Generation at Shore. Pure Appl. Geophys. 2020, 177, 5695–5711. [Google Scholar] [CrossRef]
  24. Deane, G.; Buckingham, M. An analysis of the three-dimensional sound field in a penetrable wedge with a stratified fluid or elastic basement. J. Acoust. Soc. Am. 1993, 93, 1319–1328. [Google Scholar] [CrossRef]
  25. Brekhovskikh, L.M.; Lysanov, Y.P. Fundamentals of Ocean Acoustics; Springer: New York, NY, USA, 2003. [Google Scholar]
  26. Brekhovskikh, L.M.; Godin, O.A. Acoustics of Layered Media I: Plane and Quasi-Plane Waves; Springer: Berlin/Heidelberg, Germany, 2012. [Google Scholar]
  27. Callies, J.; Wu, W.; Peng, S.; Zhan, Z. Vertical-slice ocean tomography with seismic waves. Geophys. Res. Letters. 2023, 50, e2023GL102881. [Google Scholar] [CrossRef]
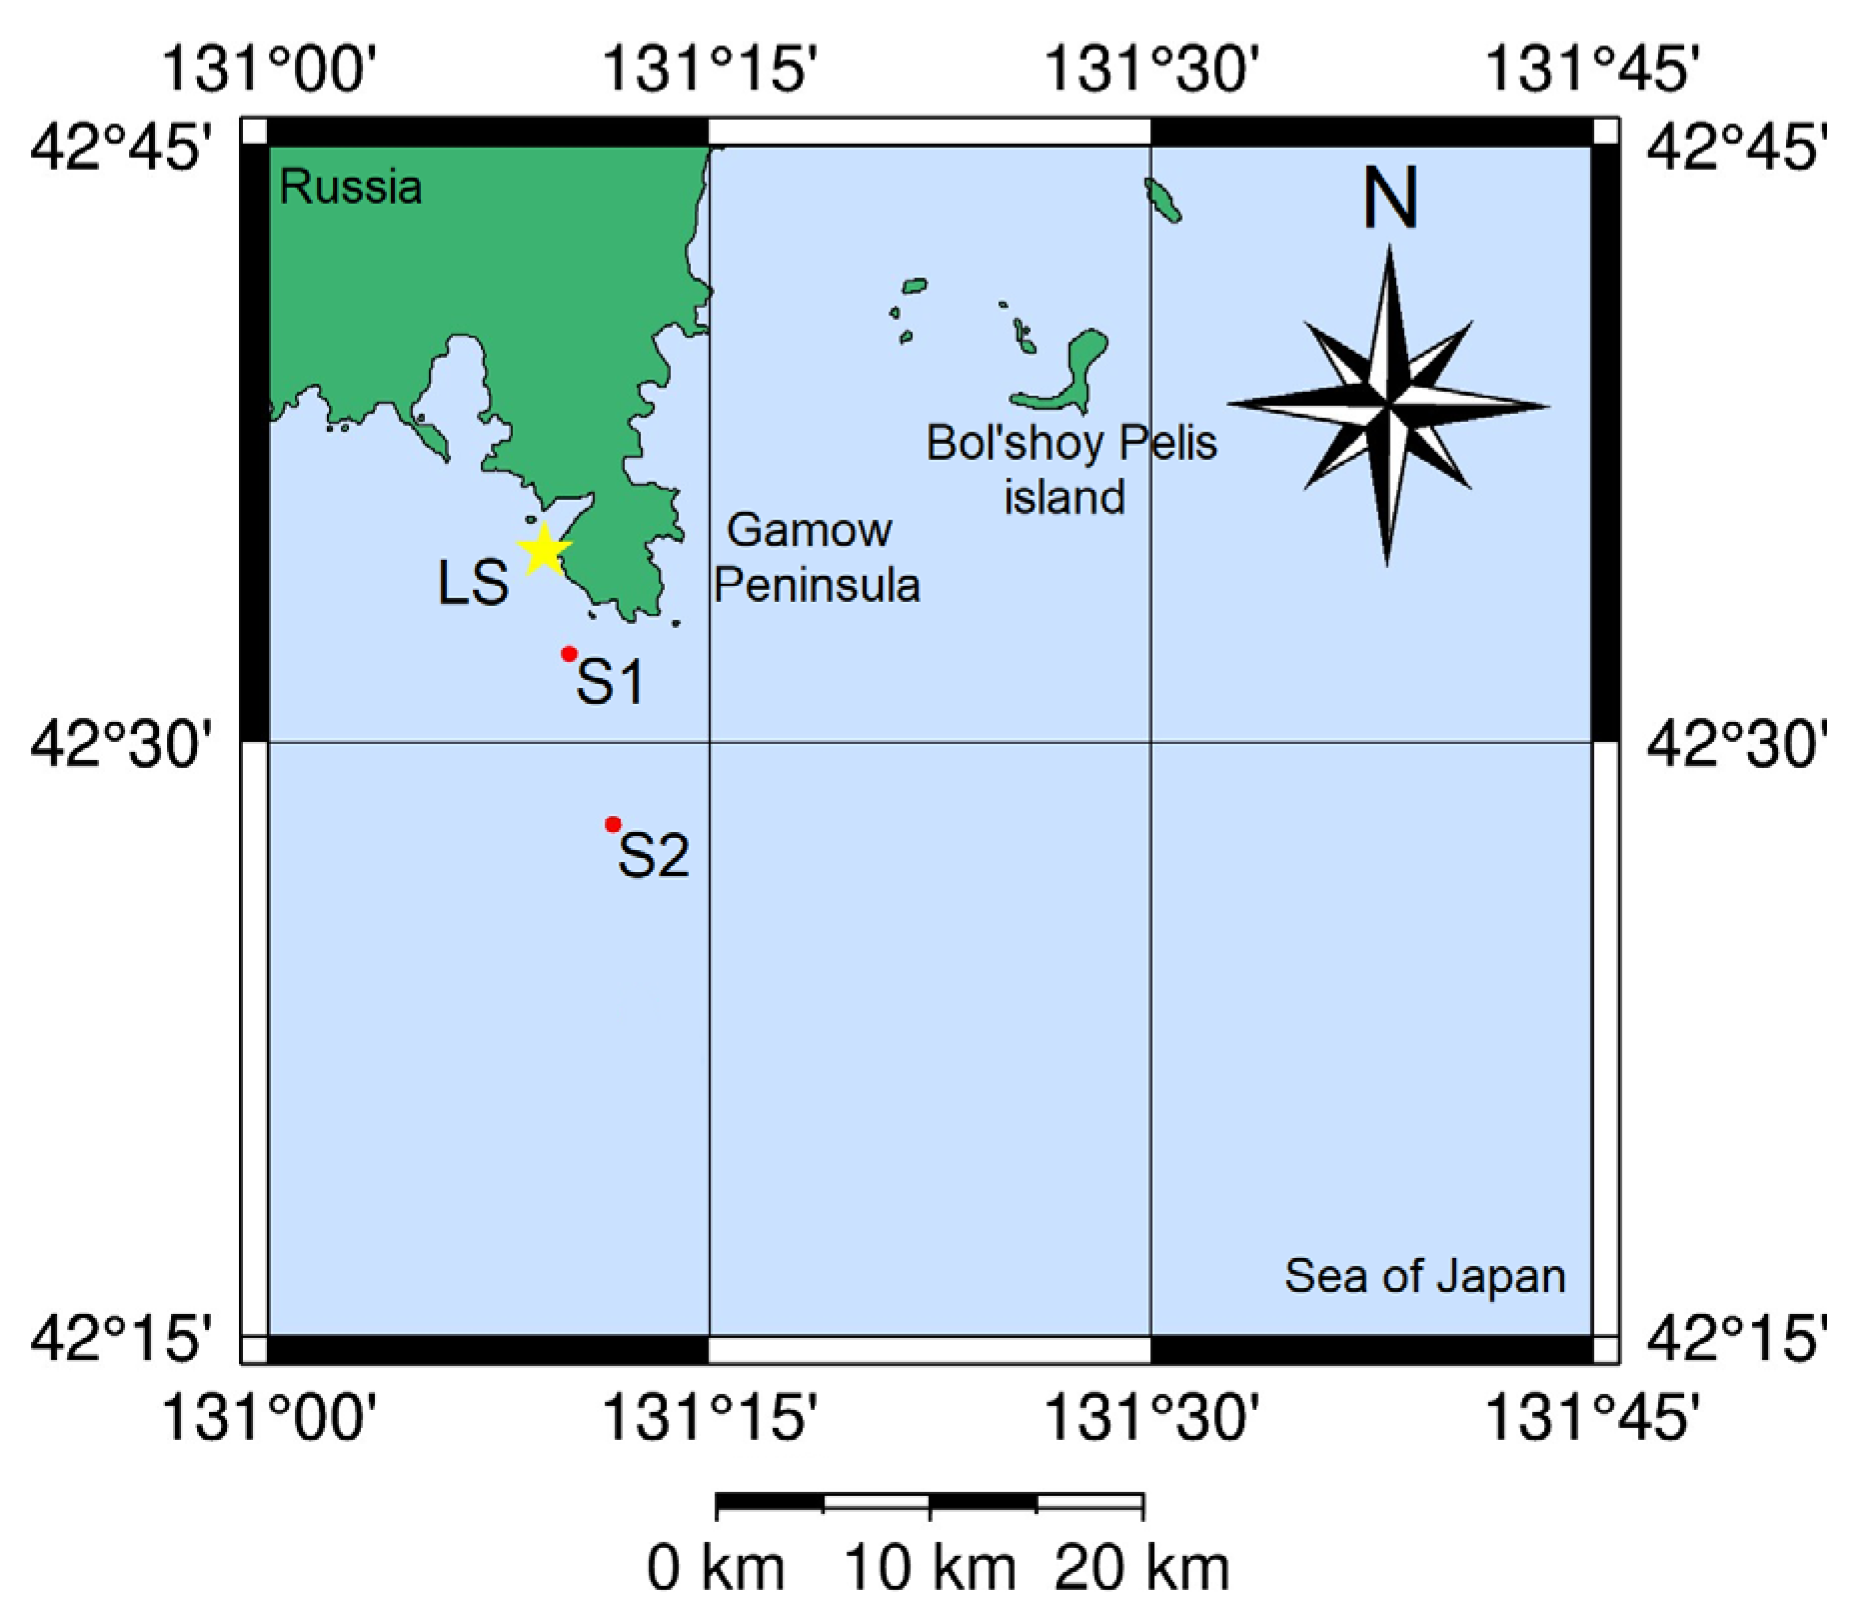
Figure 1. Map of the measurement site (Posieta Bay, Gamova Peninsula, near the Marine Experimental Station of V.I. Il’ichev Pacific Oceanological Institute). S1, S2—source points; LS—coastal laser strainmeter (receiver point).
Jmse 12 02112 g001
Figure 2. Realistic model geometry and finite element mesh. I—source; II—area of averaging displacement amplitude values (receiver); III—perfectly matched layers (PMLs).
Jmse 12 02112 g002
Figure 3. Geometry of the ASA coastal wedge model used for verification and validation.
Jmse 12 02112 g003
Figure 4. Pressure values at point (x = 2000 m, y = −30 m) as a function of the quality factor (KQ). The results show the stabilization of the solution as the KQ reaches 1, with deviations under 0.1%.
Jmse 12 02112 g004
Figure 5. Dependence of the pressure value at the point x = 2000 m, y = −30 m of the Δ—relative changes in the input parameters.
Jmse 12 02112 g005
Figure 6. Comparison of numerical simulation results and analytical solutions for hydroacoustic signal transmission loss (a) and vertical profile of the amplitude of displacement components on land normalized to the value on the surface (b).
Jmse 12 02112 g006
Figure 7. Propagation of a pulsed signal over time, time stamps: (a)—2 s; (b)—3 s; (c)—4.7 s; (d)—5.7 s. The color scale is limited to highlight weak variations. The signal, generated at a shallow depth, produces both body waves and a Scholte surface wave at the water–bottom interface.
Jmse 12 02112 g007
Figure 8. Calculated pulse seismogram at the laser strainmeter location. (a) Vertical displacements and (b) horizontal displacements show the arrival of body waves at 2.5 s intervals, followed by Rayleigh waves at 5 s intervals.
Jmse 12 02112 g008
Figure 9. Dependence of the residual U x U ^ x / U x between the experimentally measured U x horizontal displacement and its estimate U ^ x , numerically calculated for radiation Point S1 (a) and Point S2 (b). The dotted oval indicates the region of longitudinal wave velocities c l , where good agreement between the experimental and calculated data is observed.
Jmse 12 02112 g009
Figure 10. Modeling results of displacement amplitudes obtained for the source at Point S1 (a) and at Point S2 (b) (uniform radiation in the band 19–26 Hz with an amplitude of 6.9 ± 1 kPa is assumed). Different colors of the points on the graph correspond to different values of the simulation parameters: 1800 ≤ c l ≤ 2000 m/s for Point S1; 2200 ≤ c l ≤ 2450 m/s for Point S2 (these ranges are highlighted by dashed ovals in Figure 8).
Jmse 12 02112 g010
Table 1. Data of field experiments.
Distance, mGEBCO Depth (Measured), mMeasured Signal U x , nmEstimated Amplitude U ^ x , nm
Point S14300 48 (52)2.52.6 ± 0.6
Point S213,00062 (74)0.90.9 ± 0.2
Disclaimer/Publisher’s Note: The statements, opinions and data contained in all publications are solely those of the individual author(s) and contributor(s) and not of MDPI and/or the editor(s). MDPI and/or the editor(s) disclaim responsibility for any injury to people or property resulting from any ideas, methods, instructions or products referred to in the content.