Article

Effects on the Potential for Seepage Failure Under a Geotextile Mattress with Floating Plate

1
School of Environment and Architecture, University of Shanghai for Science and Technology, Shanghai 200093, China
2
School of Mechanical Engineering, University of Shanghai for Science and Technology, Shanghai 200093, China
3
College of Publishing, University of Shanghai for Science and Technology, Shanghai 200093, China
4
School of Ocean and Civil Engineering, Shanghai Jiao Tong University, Shanghai 200240, China
5
College of Civil Engineering, Tongji University, Shanghai 200092, China
*
Author to whom correspondence should be addressed.
J. Mar. Sci. Eng. 2024, 12(11), 1975; https://doi.org/10.3390/jmse12111975
Submission received: 1 October 2024 / Revised: 28 October 2024 / Accepted: 29 October 2024 / Published: 2 November 2024
(This article belongs to the Special Issue Analysis and Design of Marine Structures)

Abstract

:
The geotextile mattress with floating plate (GMFP) is an innovative scour protection device. This study examines the potential for seepage failure under the GMFP, which has been previously documented. The effects of flow velocity and GMFP configuration on the potential for seepage failure were analyzed. The variation pattern of the sloping angle was first revealed in flume tests, and the bed pressure near the GMFP with various configurations in steady currents was thereafter simulated. The average hydraulic gradient across the GMFP was observed to increase with an increase in the Froude number before reaching a plateau, which can be explained by the coupled effects of the rising Froude number and the decreasing sloping angle. The average hydraulic gradient was approximately inversely proportional to the mattress length upstream of the floating plate. With the decreasing mattress length downstream of the floating plate, the average hydraulic gradient initially rose and then declined when the downstream mattress was relatively short. This trend can be associated with the amplification of the vortices in the top vortex zone downstream of the GMFP with the shortened downstream mattress, which pushed the bottom vortex to the leeside. The shortened downstream mattress could increase the risk of overturning and slipping of the GMFP, although the average hydraulic gradient decreased.

1. Introduction

Marine structures such as bridge piers, pipelines, piers, and offshore wind turbines are constantly at risk from the danger of local scour. The sediment in proximity to the structure foundations can be eroded by excessive marine hydrodynamic forces with high sediment transport capacity, and the structure foundation previously buried in the seabed can thus become exposed. The exposure of the foundation to the environmental forces can compromise the stability of the structures, eventually leading to structural failure. Given the importance of many marine structures to the economy and society, the failure of such structures can bring unpredictable losses. For example, local scour beneath submarine pipelines can cause pipeline span and eventually pipeline failure [1]. The failure of pipelines can threaten the local energy supply, and oil and gas leakage due to the pipeline failure can bring ecological catastrophe. As a result, countermeasures against local scour have been the focus of many studies during the past decades.
Generally, there are two primary categories of scour protection methods, namely active protection and passive protection. Active protection seeks to prevent the local scour by adjusting the local flow pattern and decelerating the flow near the erodible bed. Passive protection tries to protect the erodible bed by covering the vulnerable area. Active protection methods mainly include groins [2,3], submerged breakwaters [4,5,6], and floating flow deflection structures. Passive protection methods mainly include ripraps [7,8] and scour protection plates [9,10]. A brief introduction to the specialized terms in this paper is proposed in Appendix A.
Floating flow deflection structures are a series of scour protection devices that are capable of reducing the near bottom velocity with the floating part of the structure. These structures can be applied to a wide range of scenarios, like protecting the underwater structures from local scour [11], preventing erosion on the river bed and seabed [12], and reducing the potential of bank collapses. Some of these structures are also capable of enhancing the sedimentation by trapping the bed load [12,13].
The working mechanism and protection effects of the floating flow deflection structures have been extensively investigated in the past decade or so. Li and Yu [13] studied the flow pattern on the leeside of a suspended flexible curtain. The effects on the dimension of the vortex downstream of the curtain were discussed. Wang et al. [14] improved the device of Li and Yu [13] by replacing the flexible curtain with a rigid one. The effects on the parameters of the suspended curtain, including the forces on the structure, the sloping angle, and the length of the recirculation zone, were systematically analyzed.
Xie et al. [12] proposed the geotextile mattress with sloping curtain (GMSC), and investigated the effect of the opening ratio on the sediment deposition process on the leeside of the device.
The geotextile mattress with floating plate (GMFP) is an update of the GMSC, which was proposed by Xie et al. [15]. Compared with the flow deflection devices proposed previously, the GMFP is more flexible when deployed in different scenarios. The GMFP consists of a geotextile mattress and a floating plate, which are connected with a series of strings. Figure 1 shows the structure and the working mechanism of the GMFP. More detailed information on the GMFP and its working mechanism can be referred to in [15,16].
Zhu et al. [11] validated the protective effects of the GMFP on a partially buried pipeline in steady currents with a series of flume experiments. The influence of the design parameters of the GMFP on the protection effects was analyzed, including the height of the plate, the sloping angle, and the opening ratio. Zhu et al. [16] measured the near bottom flow velocity on the leeside of the GMFP. The hydrodynamic characteristics of the GMFP were discussed, and an equation was proposed to predict the length of the bottom vortex downstream of the GMFP.
Despite the accomplishments regarding the operational mechanism and protective effects of the GMFP, knowledge regarding the stability of the GMFP remains constrained. When deployed in steady currents, the GMFP and similar floating flow deflection structures partially block the near bottom flow. Due to the blockage effect of the structures, the bed pressure rises on the upstream side of the structure and drops on the leeside. The pressure difference can thus appear between the upstream and downstream sides of the structure, and seepage flow develops in the sediment under the structure. When the pressure difference increases and the seepage flow becomes excessive, seepage failure can occur beneath the GMFP (Figure 2), which may threaten the safety of the GMFP and the protected structure [12,15]. Xie et al. [15] studied the effects of the GMFP design parameters on the average hydraulic gradient beneath the GMFP, and noted that the average hydraulic gradient underneath the mattress of the GMFP can be significantly smaller than the critical hydraulic gradient of seepage failure due to the complex contact condition between the mattress and the sediment bed.
Xie et al. [15] provided some elementary understanding on the potential of seepage failure under the GMFP, but there is some distance between their results and practical applications in engineering projects. On the one hand, the geotextile mattress was not included in the flume tests. The geotextile mattress did not only serve as the foundation of the structure, but also slowed down the bottom flow through the sand-pass opening (i.e., the gap between the mattress and the bottom edge of the floating plate, see Figure 1b). The absence of the mattress may remarkably change the local flow pattern adjacent to the structure. On the other hand, the sloping angle was fixed. The floating plate inclined downstream in a steady current. In practical applications, the sloping angle of the plate is apparently a function of the flow velocity, and changes with the variation of the flow velocity (Figure 1). However, the sloping angle was fixed in the experiment of [15], which is different to that in engineering practices.
In this paper, the relationship between the sloping angle of the floating plate and the flow velocity was first revealed through a series of flume experiments. Based on the flume test results, a series of numerical simulations were executed to investigate the effects of the flow velocity and the configuration of the geotextile mattress on the average hydraulic gradient beneath the GMFP. The attribution of the variation pattern of the average hydraulic gradient was also analyzed.
The outline of this paper is as follows. Section 2 provides the experimental results of the relationship between the sloping angle and the flow velocity. Section 3 introduces the numerical model setup, and the model validation is also included. Section 4 proposes the simulation results of the average hydraulic gradient beneath the GMFP in varying flow velocity and geotextile mattress configurations. The results are further discussed in Section 5. Section 6 proposes the conclusions.

2. Experiments on the Variation of the Sloping Curtain

When the GMFP is placed in a steady current, the floating plate inclines to the downstream side due to the drag force of the current. The sloping angle is an important factor that impacts the protection effects [15,16]. Meanwhile, it is also a sensitive function of the approaching flow velocity and the buoyancy of the plate [14]. However, the achievements on the variation of the sloping angle of the flow deflection devices are still limited [14]. Moreover, as the flow patterns near the flow deflection devices are different from each other, the results of other flow deflection devices cannot necessarily be applied directly to the GMFP. Thus, a series of flume experiments were performed to provide some elementary knowledge on the variation of the sloping plate, which served as a foundation of the simulation in later sections.

2.1. Experimental Setup

The experiments were performed in a hydraulic flume in the Laboratory of Hydraulic and Harbor Engineering, Tongji University (Figure 3). The flume was 50 m long, 0.8 m wide, and 1.2 m deep. The automatic flow generating system of the flume was equipped with a pump capable of generating a 1.0 m/s steady current at a 0.4 m flow depth. To ensure a steady flow within the flume, two metal fences were erected at the flume entrance and exit. The sidewalls of the channel were constructed from glass to facilitate observation during experiments, while the channel bed was composed of impermeable concrete.
The GMFP model (Figure 3) was installed 20 m downstream of the flume entrance. The width of the GMFP model was 0.8 m, which equaled that of the flume. The GMFP model included a model geotextile mattress, a model floating plate, and a series of strings connecting the two parts. The model geotextile mattress was 0.25 m long and 0.8 m wide. The model mattress was the foundation of the GMFP model, and consisted of 10 geotextile tubes filled with sand. Two model floating plates with different thickness were adopted in the experiment. The plates were made of foamed polyethylene, and were 0.10 m high and 0.8 m wide. The thickness of the plates t was 0.01 m and 0.015 m, and the buoyancy per unit width of the plates FB was 9.8 N/m and 14.7 N/m, respectively. The height of the sand-pass opening Hg was 0.03 m in all test cases. The floating plate was anchored near the center of the mattress (Figure 3). The length of the mattress upstream of the floating plate Lu was 0.10 m, and the length downstream Ld was 0.15 m.
The sloping angle of the plate α was measured with a protractor attached to the side wall of the flume. The accuracy of the protractor was ±1°. As the plate could fluctuate back and forth slightly due to vortex shedding, the minimum and maximum value of the sloping angle in each period of fluctuation was recorded. For each test case, the observation covered 10 periods of fluctuation. The sloping angle of the plate for the test case was determined by taking the average of the 10 minimum and 10 maximum sloping angle values. An acoustic doppler velocimeter (ADV) was used to monitor the depth-averaged velocity in the flume. The accuracy of the ADV was ±0.5% of the measured value ±1 mm/s, and the full scale of the ADV was ±1 m/s. The sampling frequency of the ADV was 100 Hz. The ADV was installed 3.0 m upstream of the GMFP model, which was 10 times the plate height. The sampling point of the ADV was located 0.16 m above the flume bottom (=0.4h0). The reflection particles of the ADV were 0.1 mm in size and the density of the particles was 1.05 × 10³ kg/m3.

2.2. Experiment Cases

A series of 8 test cases were designed to investigate the variation pattern of the sloping angle with the approaching flow velocity and the buoyancy of the floating plate (Table 1). The depth-averaged flow velocity varied between 0.26 m/s and 0.54 m/s. The flow depth was kept constant at 0.4 m in all cases. The Froude number Fr was between 0.126 and 0.274. The Froude number Fr is calculated by
F r = u 0 g h 0
where Fr = the Froude number; u0 = depth-averaged flow velocity; g = gravitational acceleration, and g = 9.8 m/s2; h0 = flow depth. The buoyancy per unit width of the plates was 9.8 N/m and 14.7 N/m, respectively. The range of the parameters was selected based on the setup and results of [11,14]. The other parameters were all kept constant in the test cases.

2.3. Experiment Results

Figure 4 shows the variation of the sloping angle with the Froude number. The sloping angle is plotted in radian. The prediction by Wang et al. [14] is also included. Figure 4 depicts that the sloping angle decreased almost linearly with the increase in the Froude number within the tested range of parameters. When the Froude number was constant, the sloping angle of the plate with the larger buoyancy force was also larger.
Figure 4 also indicates that the experiment results in the present study coincide well with the prediction formula by Wang et al. [14] within the range of parameters tested in this study. The coefficient of determination for FB = 9.8 N/m was 0.997, and for FB = 14.7 N/m was 0.998. Specifically, when the Froude number Fr < 0.22, the discrepancy between the test results and the prediction formula was minimal. When the Froude number rose above 0.22, the difference gradually became noticeable. This phenomenon can be explained as follows. As the Froude number ascended, the flow near the GMFP accelerated. Thus, the effects of the structural difference between the GMFP and the structure of Wang et al. [14] became increasingly remarkable, for example, the presence of the geotextile mattress of the GMFP beneath the sand-pass opening. As a result, the data points of the experiment gradually diverged from the prediction curve. The variation mechanism of the sloping angle with the approaching flow velocity will be discussed in detail in future papers.

3. Numerical Model

Based on the experiment results of the variation of the sloping angle with the flow velocity (Section 2), a series of numerical models were established to simulate the bed pressure distribution pattern on both sides of the GMFP. This section introduces the details of the numerical model. The simulation results will be proposed in Section 4.

3.1. Governing Equations

In this study, the commercial computational fluid dynamics software package Flow-3D (version 10.1.0; 2012; Flow Science, Inc., Santa Fe, NM, USA) was adopted to set up the numerical models. The core numerical approach of Flow-3D is based on both the finite difference method and the finite volume method [17]. In this study, the flow in the numerical flume was incompressible and viscous, and the governing equations included the mass continuity equation and the momentum equations.
The mass continuity equation in Cartesian coordinates is defined as [17]:
x u A x + y v A y + z w A z = 0
where x, y, z = coordinate directions; u, v, w = velocity components in x, y, and z directions; Ax, Ay, Az = area fractions for flow in x, y, and z directions.
The momentum conservation equations in the three coordinate directions are the Navier–Stokes equations with additional terms, which are expressed as [17]:
u t + 1 V F u A x u x + v A y u y + w A z u z = 1 ρ p x + G x + f x v t + 1 V F u A x v x + v A y v y + w A z v z = 1 ρ p y + G y + f y w t + 1 V F u A x w x + v A y w y + w A z w z = 1 ρ p z + G z + f z
where t = time; VF = fractional volume opens to flow; ρ = fluid density; p = pressure; Gx, Gy, Gz = body accelerations in x, y, and z directions; fx, fy, fz = viscous accelerations in x, y, and z directions.
The re-normalization group (RNG) k-ε model was used for the simulation of turbulent transport. The turbulent transport equations are written as follows [17]:
k T t + 1 V F u A x k T x + v A y k T y + w A z k T z = P T + Diff k T ε T
ε T t + 1 V F u A x ε T x + v A y ε T y + w A z ε T z = CDIS 1 · ε T k T P T + Diff ε CDIS 2 ε T 2 k T
where kT = turbulent kinetic energy; PT = turbulent kinetic energy production; DiffkT = diffusion term of turbulent kinetic energy; εT = rate of turbulent energy dissipation; CDIS1 = dimensionless parameter, and CDIS1 = 1.42 (default value); CDIS2 = dimensionless parameter, which is calculated based on the turbulent kinetic energy (kT) and the turbulent kinetic energy production (PT). Further details of the turbulence model can be referred to in [17]. The selection of the turbulence model was based on previous documentations with similar focus [18,19], in which the simulation results were convincing and reliable.
The free-surface of the flow in the model was defined by the volume of fluid (VOF) method [17,20]:
F t + 1 V F F A x u x + F A y v y + F A z w z = 0
where F = volume of fluid function.

3.2. Model Setup

A two-dimensional numerical flume was established as the computational domain to investigate the potential of seepage failure underneath the GMFP (Figure 5). The numerical flume was 12 m long and 0.6 m high. A Cartesian coordinate system was built in the domain with the origin of the axes at the midpoint of the flume bottom. The axes of the coordinate system were assigned as follows: x = streamwise; z = bed normal heading upwards. The y coordinate was defined according to the right-hand rule. The GMFP was deployed at x = 0. The distance between the GMFP and the boundaries on the x direction of the numerical flume was 6 m or 60Hp (Hp = height of the floating plate). The dimensions of the flume were selected based on [21] to minimize the effect of the boundaries.
The dimensions of the GMFP model in the simulation were identical to those in the experiment tests. The height of the floating plate Hp was 0.1 m. The thickness of the plate was 0.01 m and 0.015 m for the two floating plates, respectively. The height of the sand-pass opening was 0.03 m. The depth-averaged flow velocity was between 0.26 m/s and 0.54 m/s, and thus the sloping angle of the plate was between 35° and 65°. The flow depth was 0.4 m for all cases. The length of the mattress on the upstream side of the floating plate varied between 0 and 0.1 m, and the mattress length downstream of the floating plate was between 0 and 0.15 m. More details on the GMFP configuration parameters can be referred to in Section 3.3.
The boundary conditions were assigned as follows. The entrance of the numerical flume (X Min) was specified velocity. The velocity was set according to the cases, and the fluid elevation was 0.4 m in all cases. The exit of the numerical flume (X Max) was specified pressure, and the fluid elevation was 0.4 m. The bottom of the flume (Z Min) was wall boundary. The top of the flume (Z Max) was specified pressure, and the pressure was standard atmosphere. As the settings of the computational domain were three-dimensional in Flow-3D, boundary conditions on the side walls of the flume (Y Min and Y Max) were also needed. Thus, the boundary conditions of Y Min and Y Max were assigned to be symmetry boundary.
A structured rectangular mesh was used to discretize the computational domain. The mesh was non-uniform, and smaller grids were used near the GMFP and the bed to balance the accuracy of the simulation and the computational cost. The minimum size of the grids was 0.002 m, and the total number of cells was 120,000. Figure 6 shows the mesh adjacent to the GMFP. The initial time step was 0.002 s, and the time step was automatically controlled by stability and convergence. The finish time was 50 s for all cases.
In order to investigate the effects of the flow velocity, and the geotextile mattress on the potential of seepage failure beneath the GMFP, a series of cases were designed and simulated (Table 2). The simulation cases were divided into two groups. Group A focused on the effect of the approaching flow velocity, and the Froude number Fr varied between 0.126 and 0.274. The effect of the buoyancy of the floating plate was also considered. In Group A, the Froude number and sloping angle values of Cases A01–A04, A11, and A13–A15 were derived from the results of Cases 001–008 in Section 2. As the test results in Section 2 revealed that the prediction by Wang et al. [14] coincided well with the test results in Section 2 when the Froude number Fr < 0.22, an additional case (Case A12) was also included in Group A based on the prediction of [14] to provide more data on the effects of flow velocity. Group B focused on the effect of the configuration of the geotextile mattress. The length of mattress upstream of the floating plate Lu varied between 0 and 0.10 m, and the mattress length downstream of the floating plate Ld was between 0 and 0.15 m (Figure 5).

3.3. Model Validation

3.3.1. Validation of Bed Pressure Distribution

The bed pressure distribution adjacent to the GMFP was the basis of analysis regarding the potential of seepage failure. Xie et al. [15] studied the bed pressure distribution on both sides of a GMFP with a series of physical experiment tests, and the tests were reproduced with the model in the present study. The height of the floating plate was 0.03 m, and the sloping angle of the plate was 50°. The flow velocity was 0.3 m/s, and the flow depth was 0.1 m.
Figure 7 shows the numerical results of the present study and the experiment results in [15]. In Figure 7, the horizontal axis is the normalized distance to the GMFP x/Hp, where x = the coordinate, and Hp = the height of the floating plate. The vertical axis is the normalized relative bed pressure p/p0, where p = pressure on the bed and p0 = hydrostatic pressure on the bed (p0 = ρgh0 = 0.98 kPa). It is conveyed in Figure 7 that the bed pressure distribution predicted by the present model agrees well with the measured results in the experiments. Thus, the accuracy of the numerical model is satisfying for the present study.

3.3.2. Validation of Flow Pattern near the GMFP

Zhu et al. [16] investigated the near bottom flow pattern on the leeside of a GMFP with a series of flume experiment tests, which were also reproduced numerically to validate the simulation results of the flow pattern. The height of the floating plate was 0.1 m, and the sloping angle was 50°. The flow velocity was 0.4 m/s, and the flow depth was 0.4 m. The velocity 2.3 cm above the bed was measured.
Figure 8 shows both the numerical and experimental results of the near bottom velocity on the leeside of the GMFP. In Figure 8, the horizontal axis is the normalized distance to the GMFP x/Hp, which is identical to that in Figure 7. The vertical axis is the relative flow velocity u/u0, where u = the near bottom velocity, and u0 = approaching flow velocity (u0 = 0.4 m/s in Figure 8). Figure 8 shows that the simulated near bottom flow pattern is in good agreement with the experimental results. It can also be observed in Figure 8 that the reversed near bottom flow predicted is slower than that in the flume tests adjacent to the downstream edge of the geotextile mattress (near x/Hp = 3). This slight discrepancy may be attributed to the difference in the velocity output between the experimental and numerical results. In the experimental study, the velocity was measured with a propeller-type velocimeter, and the sampling time for each measuring point was 60 s. Meanwhile, the velocity value predicted by the numerical model was almost instantaneous. Due to the vortex shedding on the leeside of the GMFP, the instantaneous flow velocity close to the GMFP can vary significantly with time. Thus, a slight difference formed between the numerical and experimental results.

4. Effects on the Averaged Hydraulic Gradient Under the GMFP

The flow field near the GMFP in steady currents was simulated to investigate the effects on the potential of seepage failure beneath the GMFP. Due to the complexity of the seepage field and the contact conditions between the geotextile mattress and the seabed, the potential was evaluated by the average hydraulic gradient under the GMFP [15]. The average hydraulic gradient beneath the GMFP im is defined as follows.
i m = Δ p / ρ g L u + L d
where Δp = bed pressure difference between the upstream and the downstream edges of the geotextile mattress; ρ = fluid density, and ρ = 1.0 × 10³ kg/m3; Lu = length of mattress upstream of the floating plate; Ld = length of mattress downstream of the floating plate (Figure 5). In this section, the simulation results of the averaged hydraulic gradient underneath the GMFP were proposed with various flow velocities, buoyancies of the floating plate, and lengths of the geotextile mattress. The results are then further discussed in Section 5.

4.1. Effects of the Flow Velocity and the Buoyancy of the Floating Plate

The tests in Group 1 focused on the effect of the flow velocity on the seepage intensity under the GMFP. The effect of the buoyancy of the floating plate was also considered. In Cases A01–A04, the Froude number varied between 0.126 and 0.237, and the buoyancy of the plate was 9.8 N/m. The configuration of the geotextile mattress was kept constant. The length of the mattress on the upstream side of the floating plate was Lu = 0.10 m (=1.0Hp), and the length downstream was Ld = 0.15 m (=1.5Hp).
Figure 9 shows the bed pressure distribution adjacent to the GMFP with different flow velocities in Cases A01–A04. The flow velocity was normalized as the Froude number (Equation (1)). The horizontal axis was the normalized distance to the GMFP x/Hp, and the vertical axis was the normalized relative bed pressure p/p0, where p = pressure on the bed and p0 = hydrostatic pressure on the bed (p0 = ρgh0 = 0.98 kPa). In Figure 9, the variation trend of the curves is similar. The bed pressure on the upstream side increased as it became closer to the GMFP, and reached a peak on the upstream edge of the geotextile mattress. On the downstream side of the GMFP, the trend was opposite. The bed pressure hit a nadir near the downstream edge of the mattress, and gradually increased as it went farther away from the GMFP.
With the increase in the Froude number, the bed pressure on the upstream side of the GMFP increased gradually for Fr ≤ 0.212. When the Froude number was Fr ≥ 0.212, the variation of bed pressure on the upstream side of the GMFP was less remarkable. On the downstream side of the GMFP, the variation of the bed pressure curve with the Froude number was more significant. When Fr ≤ 0.212, the bed pressure on the leeside of the GMFP decreased with an increasing Froude number, and when the Froude number was over 0.212, the drop of bed pressure adjacent to the GMFP was less significant.
Further observation of Figure 9 shows that when Fr ≤ 0.177, the increase in bed pressure on the leeside of the GMFP was gentle and smooth, but when Fr > 0.177, the bed pressure curve on the downstream side showed more characteristics. When Fr > 0.177, the bed pressure rose gently near the downstream edge of the mattress, and then experienced a sharp increase near x/Hp = 5–10. After the sharp increase, the bed pressure was close to or even higher than that in cases with a lower Froude number. This phenomenon can be attributed to the decrease in the length of the bottom vortex due to the decrease in the sloping angle. The decrease in the sloping angle and the Froude number can both bring a decreasing length of the bottom vortex [16]. Especially when the sloping angle was relatively small, the decrease in the bottom vortex length was more remarkable. As the bottom vortex retreated upstream, part of the bed was not affected by the bottom vortex any longer, and the pressure distribution pattern could thus vary due to the variation of the bottom vortex.
In Cases A11–A15, the variation range of the Froude number further extended, which was between 0.126 and 0.274. The buoyancy of the floating plate was 14.7 N/m. The configuration of the geotextile mattress was kept constant. The length of the mattress on the upstream side was Lu = 0.10 m (=1.0Hp), and the length downstream was Ld = 0.15 m (=1.5Hp).
Figure 10 shows the bed pressure distribution adjacent to the GMFP with different flow velocities in Cases A11–A15. The flow velocity is expressed by the Froude number. The horizontal axis is the normalized distance to the GMFP x/Hp, and the vertical axis is the normalized relative bed pressure p/p0. In Figure 10, the variation pattern of the bed pressure and the effect of the flow velocity are similar to those in Figure 9. It is observable that the curves of Fr = 0.242 and 0.274 fall very close to each other, especially adjacent to the edges of the geotextile mattress. The sharp rise in bed pressure near x/Hp = 5–10 can also be seen in the curves of Fr = 0.242 and 0.274.
Figure 11 summarizes the variation of the average hydraulic gradient beneath the GMFP in the cases of Group A. The average seepage gradient was calculated according to Equation (7), which is a ratio of the water head difference on two edges of the geotextile mattress to the total length of the mattress. Figure 11 illustrates that the fluctuation pattern of the average hydraulic gradient with the Froude number remained consistent across experiments, with two plates of different buoyancy. Both data series experienced a linear rise before reaching a plateau for large Froude numbers. When Fr < 0.2, the difference in the average hydraulic gradient of two series was minimal, and when the buoyancy of the floating plate was smaller (FB = 9.8 N/m), the average hydraulic gradient was slightly smaller, which can be explained as follows. When the buoyancy of the floating plate was smaller, the sloping angle was also smaller for a fixed flow velocity. Thus, the blockage effect of the GMFP became less significant, and the seepage underneath the geotextile mattress was less intensified. Further discussion and analysis on the variation pattern of the average seepage gradient with the Froude number can be seen in Section 5.1.

4.2. Effects of the Length of Geotextile Mattress

Tests in Group 2 focused on the effects of the configuration of the geotextile mattress on the seepage intensity beneath the GMFP. In Group 2, the length of the mattress on the upstream side of the floating plate Lu varied between 0 and 0.10 m (Cases A02 and B01–B04), and the length downstream Ld varied between 0 and 0.15 m (Cases A02 and B11–B16). The flow velocity and the buoyancy of the floating plate was kept constant. The Froude number was 0.177, and the buoyancy of the plate was 9.8 N/m.
Figure 12 describes the bed pressure distribution adjacent to the GMFP with different mattress length on the upstream side (Cases A02 and B01–B04). The length of mattress on the upstream side was normalized as the dimensionless mattress length Lu/Hp, where Lu = the mattress length on the upstream side of the floating plate, and Hp = the height of the floating plate. The dimensionless mattress length on the upstream side Lu/Hp varied between 0 and 1.00 (Table 2). The horizontal axis is the normalized distance to the GMFP x/Hp, and the vertical axis is the normalized relative bed pressure p/p0. In Figure 12, the bed pressure curves with different mattress lengths on the upstream side almost collapse into a single curve, indicating that the effect of mattress length on the upstream side was unremarkable. In all five cases, the bed pressure rose gently on both sides of the GMFP. The peak point appeared on the upstream edge of the geotextile mattress, and the nadir point was located on the downstream edge of the mattress.
Figure 12 indicates that the major effect of the mattress length on the upstream side lay near the upstream edge of the mattress. When the upstream mattress length decreased, the bed pressure on the upstream edge of the mattress almost remained unchanged. At the same time, the bed pressure on the downstream edge of the mattress was also nearly constant. With the pressure difference across the mattress remaining constant and the total length of mattress dropping, the seepage intensity beneath the GMFP could become greatly intensified.
Figure 13 shows the variation of the average hydraulic gradient with the mattress length on the upstream side of the floating plate. The horizontal axis is the dimensionless mattress length Lu/Hp, and the vertical axis is the averaged seepage hydraulic gradient, calculated by Equation (7). In Figure 13, the average hydraulic gradient is approximately inversely proportional to the upstream mattress length, which can be attributed to the nearly constant pressure difference across the GMFP with the linear increase in the upstream mattress length (Figure 12). It should be noted that, although the amplitude of the increase seemed limited, and the value of the average hydraulic gradient was much smaller than the critical value of seepage failure, the potential of seepage failure should not be ignored. Due to the complex contact interface between the mattress and the sediment bed, the seepage failure could occur at a critical point when the local hydraulic gradient reached the critical value. At this moment, the average hydraulic gradient could still be well below the critical value [15].
Figure 14 shows the bed pressure distribution adjacent to the GMFP with different mattress lengths on the downstream side (Cases A02 and B11–B16). The length of mattress on the downstream side was expressed by the dimensionless mattress length Ld/Hp, where Ld = the mattress length on the downstream side of the floating plate. The dimensionless mattress length on the downstream side Ld/Hp varied between 0 and 1.50 (Table 2). The horizontal axis is the normalized distance to the GMFP x/Hp, and the vertical axis is the normalized relative bed pressure p/p0. In Figure 14, the bed pressure distribution adjacent to the GMFP shows more remarkable difference among the cases than that in Figure 12, indicating that the effect of the mattress length on the leeside of the GMFP was more significant than that on the upstream side. The bed pressure distribution upstream of the GMFP shared a similar trend. As shown in all cases in Figure 14, the bed pressure ascended gently as it approached the geotextile mattress on the upstream side. On the leeside of the GMFP, the bed pressure rose gently as it moved to the leeside when the downstream mattress length Ld/Hp ≥ 1.0, which was similar to the trend in Figure 12. When the downstream mattress length Ld/Hp < 1.0, the bed pressure on the downstream edge of the mattress was significantly higher than that in cases when Ld/Hp ≥ 1.0. As it went farther from the GMFP, the bed pressure experienced a significant drop, and rose again in fluctuation thereafter.
With the decrease in the downstream mattress length, the variation on the upstream side of the GMFP was minimal. When the mattress on the downstream side of the GMFP was not deployed (Ld/Hp = 0, Case B16), the bed pressure on the upstream side of the GMFP was slightly lower than that in other cases.
On the leeside of the GMFP, the effects of the downstream mattress length included two aspects (Figure 14).
  • The distribution pattern of bed pressure. When the mattress on the leeside of the floating plate was shortened, the pressure drop adjacent to the downstream edge of the mattress became more remarkable. The amplitude of bed pressure fluctuation also increased with the decrease in the downstream mattress length. This phenomenon can be associated with the variation of local flow pattern as the downstream mattress was shortened. A detailed discussion can be referred to in Section 5.2.
  • The bed pressure on the downstream edge of the mattress. The bed pressure on the downstream edge of the mattress almost remained constant when Ld/Hp ≥ 1.0. With a further decrease in the downstream mattress length, the bed pressure on the downstream edge of the mattress gradually increased, but the increase was not remarkable for Ld/Hp ≥ 0.5. When Ld/Hp < 0.5, the rise of bed pressure on the downstream edge of the mattress became significant. This variation pattern can influence the effect of the downstream mattress length on the average seepage hydraulic gradient.
Figure 15 describes the variation of the average hydraulic gradient with the mattress length on the leeside of the floating plate. The horizontal axis is the dimensionless mattress length Ld/Hp, and the vertical axis is the averaged seepage hydraulic gradient, calculated by Equation (7). Figure 15 depicts that the variation pattern of the average hydraulic gradient with the downstream mattress length was more complex than that of the upstream. The average hydraulic gradient rose gradually with the decrease in the downstream mattress length when the downstream mattress was larger than 0.5 times of the plate height. As the downstream mattress length continued decreasing, the average hydraulic gradient began to drop. This variation pattern can be explained as follows.
As described above, the variation of the bed pressure on both edges of the mattress was insignificant for Ld/Hp ≥ 0.5, and thus the pressure difference across the GMFP remained almost unchanged. With the pressure difference unchanged and the mattress length dropping, the averaged hydraulic gradient rose gradually with the mattress length when Ld/Hp ≥ 0.5. For Ld/Hp ≤ 0.5, the decrease in the downstream mattress length brought a sharp increase in the bed pressure on the downstream edge of the mattress. Consequently, when the downstream mattress length continued decreasing, both the mattress length and the pressure difference descended, which changed the variation trend of the average seepage hydraulic gradient.

5. Discussion and Analysis

In this section, some phenomena mentioned in Section 4 are further discussed and analyzed, which can help to better understand the effects on the seepage intensity beneath the GMFP.

5.1. Effects of the Flow Velocity

Section 4.1 mentions similar variation trends of the average hydraulic gradient under the GMFP with the Froude number for two different floating plate buoyancies. In both data series, the average hydraulic gradient increased steadily with the increasing Froude number before reaching a plateau. This trend can be demonstrated by the coupled effects of the flow velocity and the blockage height of the GMFP.
The GMFP is a typical flow blockage structure, like submarine pipelines. The seepage beneath the GMFP is powered by the pressure difference across the GMFP, which is closely associated with the blockage effect of the structure and the approaching flow velocity. The blockage effect of the GMFP is usually described with the blockage height [11,16], which is written as Hpsinα, where Hp = height of the floating plate, and α = the sloping angle of the plate. In the previous report on the pressure distribution adjacent to the GMFP [15], the pressure difference across the GMFP rose dramatically with the increasing sloping angle and the plate height, indicating a positive correlation between the blockage height and the pressure difference with the flow velocity kept constant. In this study, the sloping angle is designed as a function of the flow velocity, and thus the blockage height also varies with the flow velocity.
When the flow is accelerated from rest, the sloping angle gradually drops from π/2 (90°). In the tested range of parameters of this study, the sloping angle decreases almost linearly with the increasing Froude number (Figure 4). As the variation rate of sine function is relatively low near α = π/2 (90°), the blockage height (Hpsinα) descends slowly. At this time, the blockage height is close to the peak value, and the effects of the flow velocity on the pressure difference and thus the seepage begin to emerge and intensify. However, the seepage underneath the GMFP can be relatively weak due to the relatively low velocity. Consequently, the average hydraulic gradient beneath the GMFP can gradually increase.
When the Froude number becomes larger, the sloping angle continues decreasing, and the drop rate of the blockage height begins to increase due to the increase in the variation rate of sine function for smaller angles. The increasing Froude number can intensify the seepage under the GMFP, but the blockage height of the structure is decreasing, which can weaken the seepage. A critical point can be reached when the two effects on the seepage flow reach a balance, and the average hydraulic gradient stops increasing and levels. Figure 11 shows that the Froude number corresponding to this critical value can be different for different configurations of the floating plate. For the plate with a buoyancy of 9.8 N/m and 14.7 N/m, the Froude number is 0.212 and 0.243, respectively. Further comparison with the results in Figure 4 shows that the sloping angle of the plate at the critical value is 40° for both floating plates, which may be the critical sloping angle for more extensive scenarios.
In practical applications, the results in Figure 11 can indicate an upper boundary of the average seepage hydraulic gradient, which can be useful in evaluating the potential of seepage failure beneath the GMFP.

5.2. Effects of the Length of the Mattress Downstream of the Floating Plate

A dramatic increase in bed pressure is witnessed adjacent to the downstream edge of the mattress when the downstream mattress length is relatively small (Figure 14). This phenomenon can be associated with the significant variation of the flow pattern on the leeside of the GMFP, with the decrease in the downstream mattress length.
Figure 16 demonstrates the flow pattern near the GMFP when the relative downstream mattress length is 1.50 (Case A02, Figure 16a), 0.50 (Case B14, Figure 16b), 0.25 (Case B15, Figure 16c), and 0.00 (Case B16, Figure 16d). The coordinates are normalized with the height of the floating plate, which is in agreement with that in the figures above.
It is observable in Figure 16 that, with the decrease in downstream mattress length, the three-vortex system on the leeside of the mattress varies significantly. When the length of downstream mattress is 1.5Hp, the dimensions of the vortices in the top vortex zone are relatively small, and the bottom vortex covers a long range from the immediate downstream edge of the mattress. With the gradual decrease in the downstream mattress length, the coverage of the vortices in the top vortex zone expands dramatically, and meanwhile the bottom vortex retreats to the leeside.
The variation of flow pattern on the leeside of the GMFP with decreasing downstream mattress length can be explained as follows. When the downstream mattress is relatively long, the downstream mattress can provide enough friction to slow down the bottom flow through the sand-pass opening (Figure 1b). Thus, the anticlockwise vortex in the top vortex zone can be less developed, and fully falls in the coverage of the mattress. The bottom vortex can also extend to the downstream edge of the mattress (Figure 16a).
When the downstream mattress length gradually decreases, the velocity of bottom flow through the sand-pass opening increases, and the vortices in the top vortex zone can become more and more developed. Thus, the anticlockwise vortex extends beyond the downstream edge of the mattress, and the bottom vortex retreats downstream (Figure 16b–d). As part of the anticlockwise vortex lands directly on the bed, the high velocity adjacent to bottom flow through the sand-pass opening can directly impact the bed and can cause an increase in the bed pressure.
Although the decrease in the downstream mattress length can narrow the pressure difference across the GMFP, which is partially beneficial for the seepage stability of the GMFP, the side effect of the shortened downstream mattress can also threaten the safety and stability of the GMFP.
On one hand, the decrease in the mattress length can affect the anti-overturning stability of the GMFP. As mentioned above, the shortened downstream mattress can cause the acceleration of the bottom flow through the sand-pass opening. When the high velocity bottom flow lands directly on the downstream edge of the mattress, the bed sediment on the leeside of the mattress can be scoured, and a scour hole can form downstream of the mattress, which can harm the anti-overturning stability of the GMFP. Such local scour was previously observed by Xie et al. [15]. In addition, a decrease in the mattress length can lead to the drop in the anti-overturning moment, which can also affect the anti-overturning stability of the GMFP.
On the other hand, the anti-slip stability of the GMFP can also be threatened. The anti-slip stability relies on the friction between the mattress and the bed. The friction is dominated by the friction coefficient and the weight of the mattress. When the weight of the mattress descends due to the decrease in the mattress length, the friction also decreases, thus threatening the anti-slip stability of the GMFP.

6. Conclusions

This paper focuses on the potential of seepage pressure beneath the geotextile mattress with floating plate (GMFP) by simulating the bed pressure distribution near the GMFP in steady currents. The variation of the sloping angle of the plate with the Froude number of flow was first revealed with a series of flume experiments. Based on the test results, a series of numerical models were established to predict the bed pressure distribution near the GMFP. The effects of the flow velocity and the mattress configuration on the averaged hydraulic gradient under the mattress and the bed pressure distribution were analyzed with the simulation results. The following conclusions can be achieved based on the results and analysis.
  • The sloping angle of the floating plate descends almost linearly with the increase in the Froude number within the tested range of parameters. The prediction equation of a similar structure coincides well with the test results.
  • The average hydraulic gradient increases nearly linearly with the Froude number for small Froude numbers, and then reaches a plateau. This variation pattern can be attributed to the coupled effects of the rising Froude number, which can intensify the blockage effect of the GMFP, and the decreasing sloping angle, which can weaken the blockage effect.
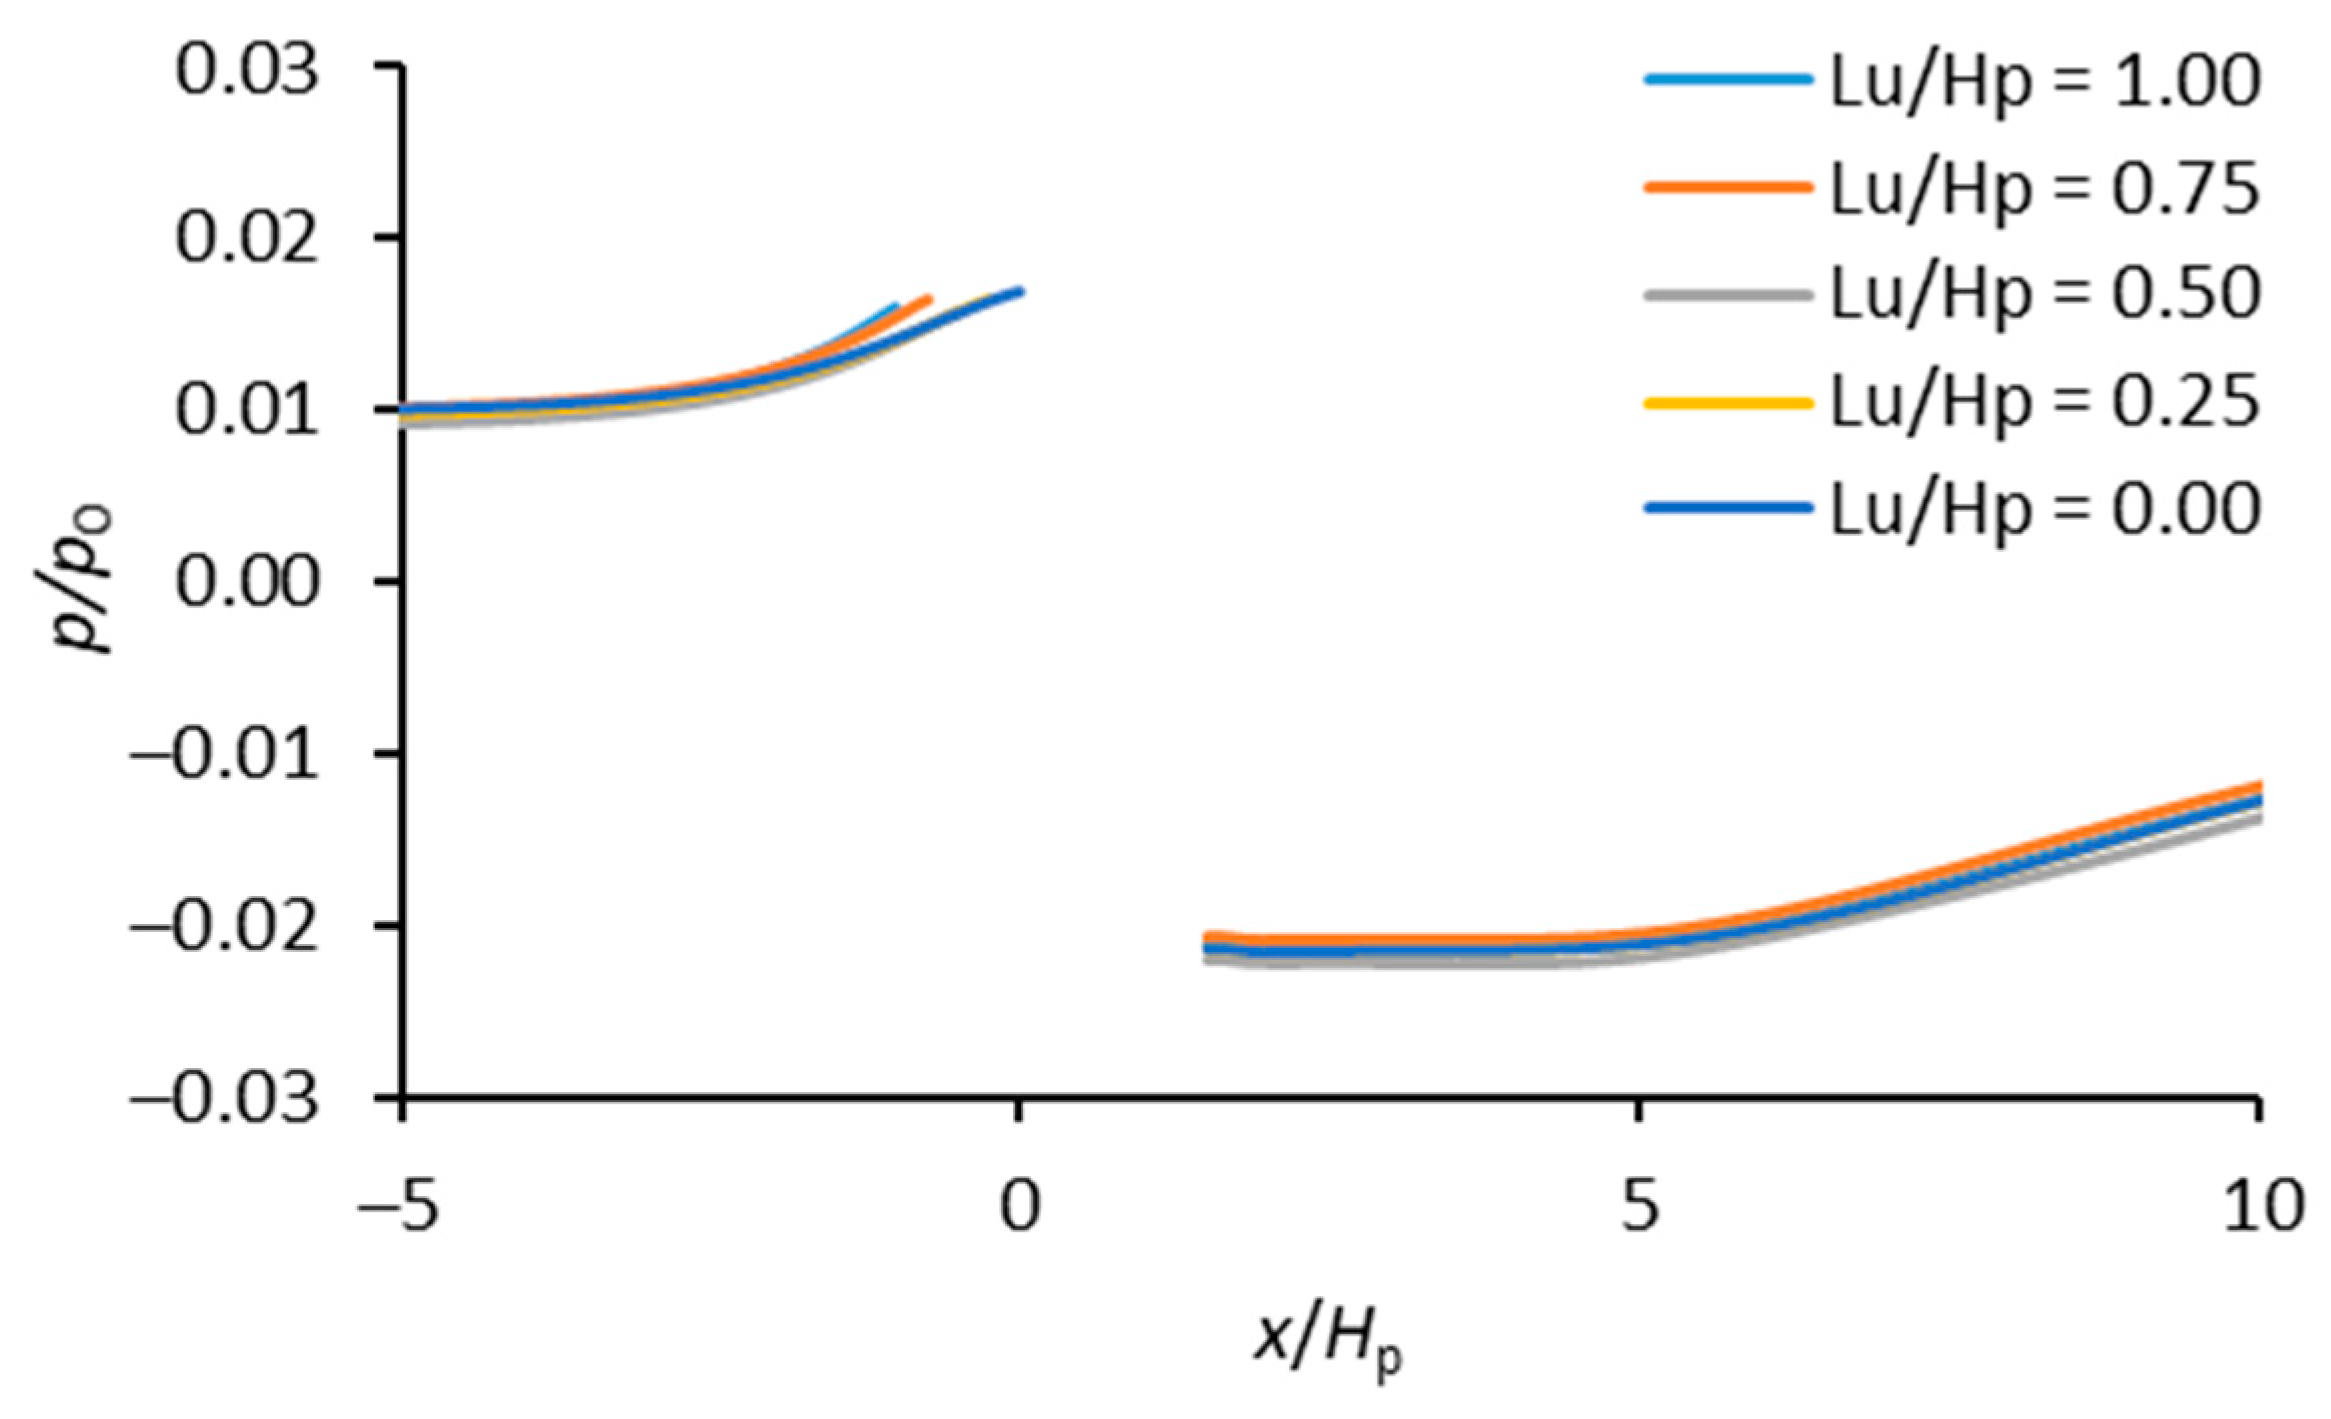
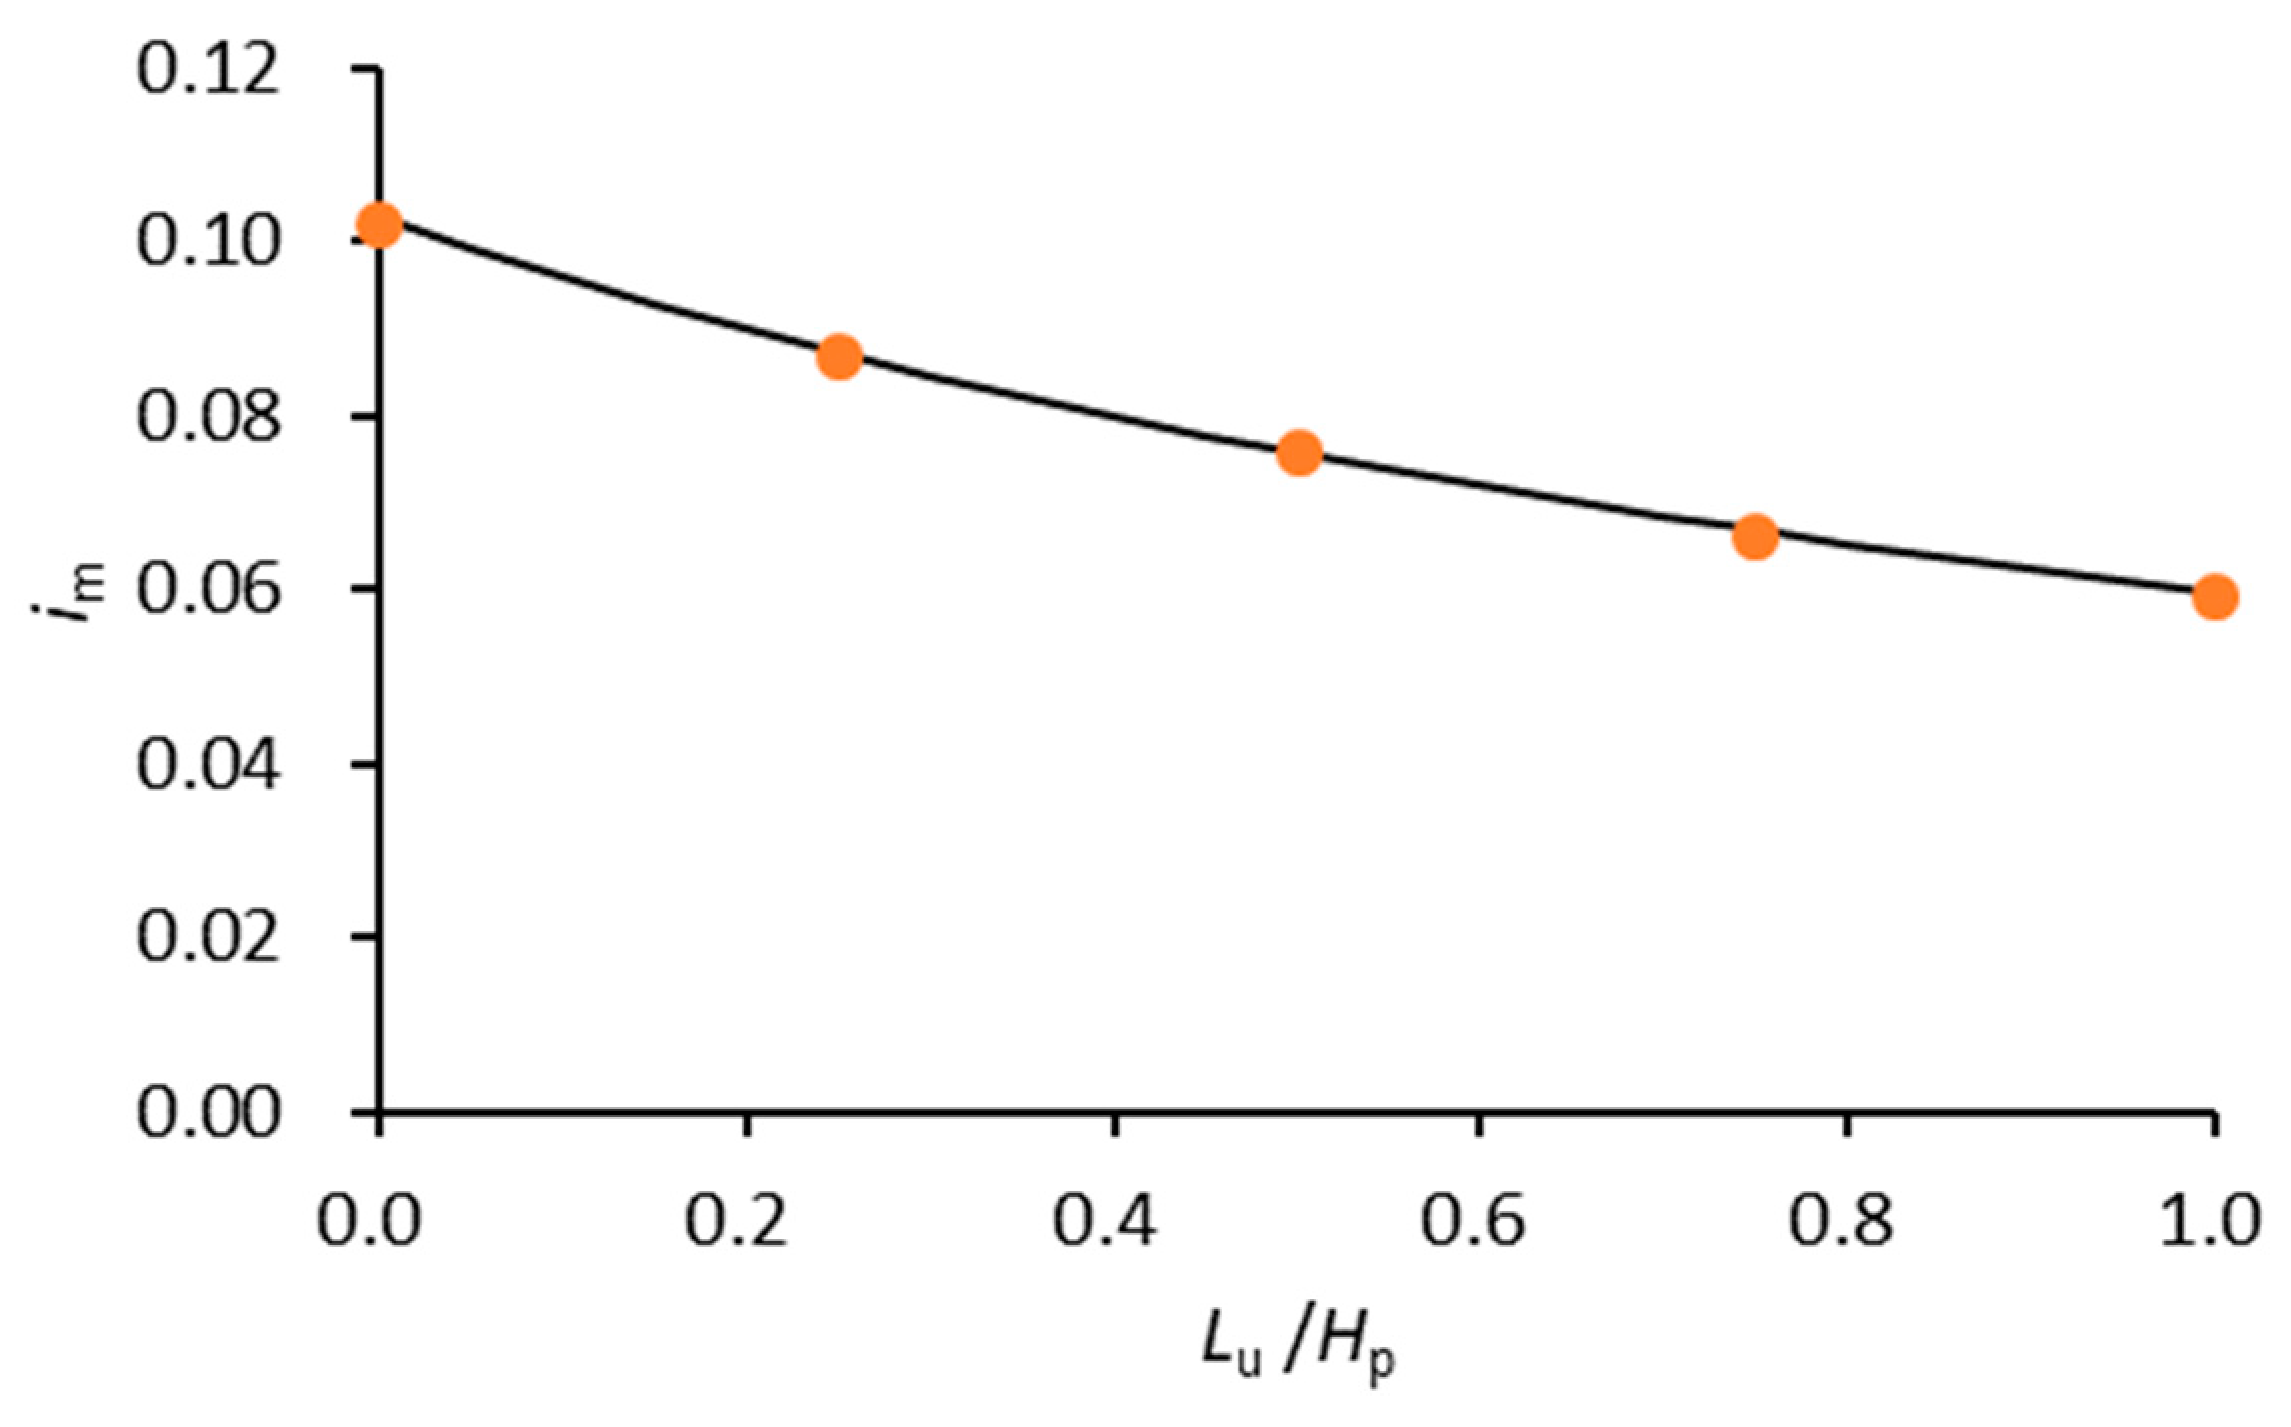
  • The average hydraulic gradient is approximately inversely proportional to the mattress length upstream of the floating plate. The effect of the upstream mattress length on the bed pressure distribution is minimal.
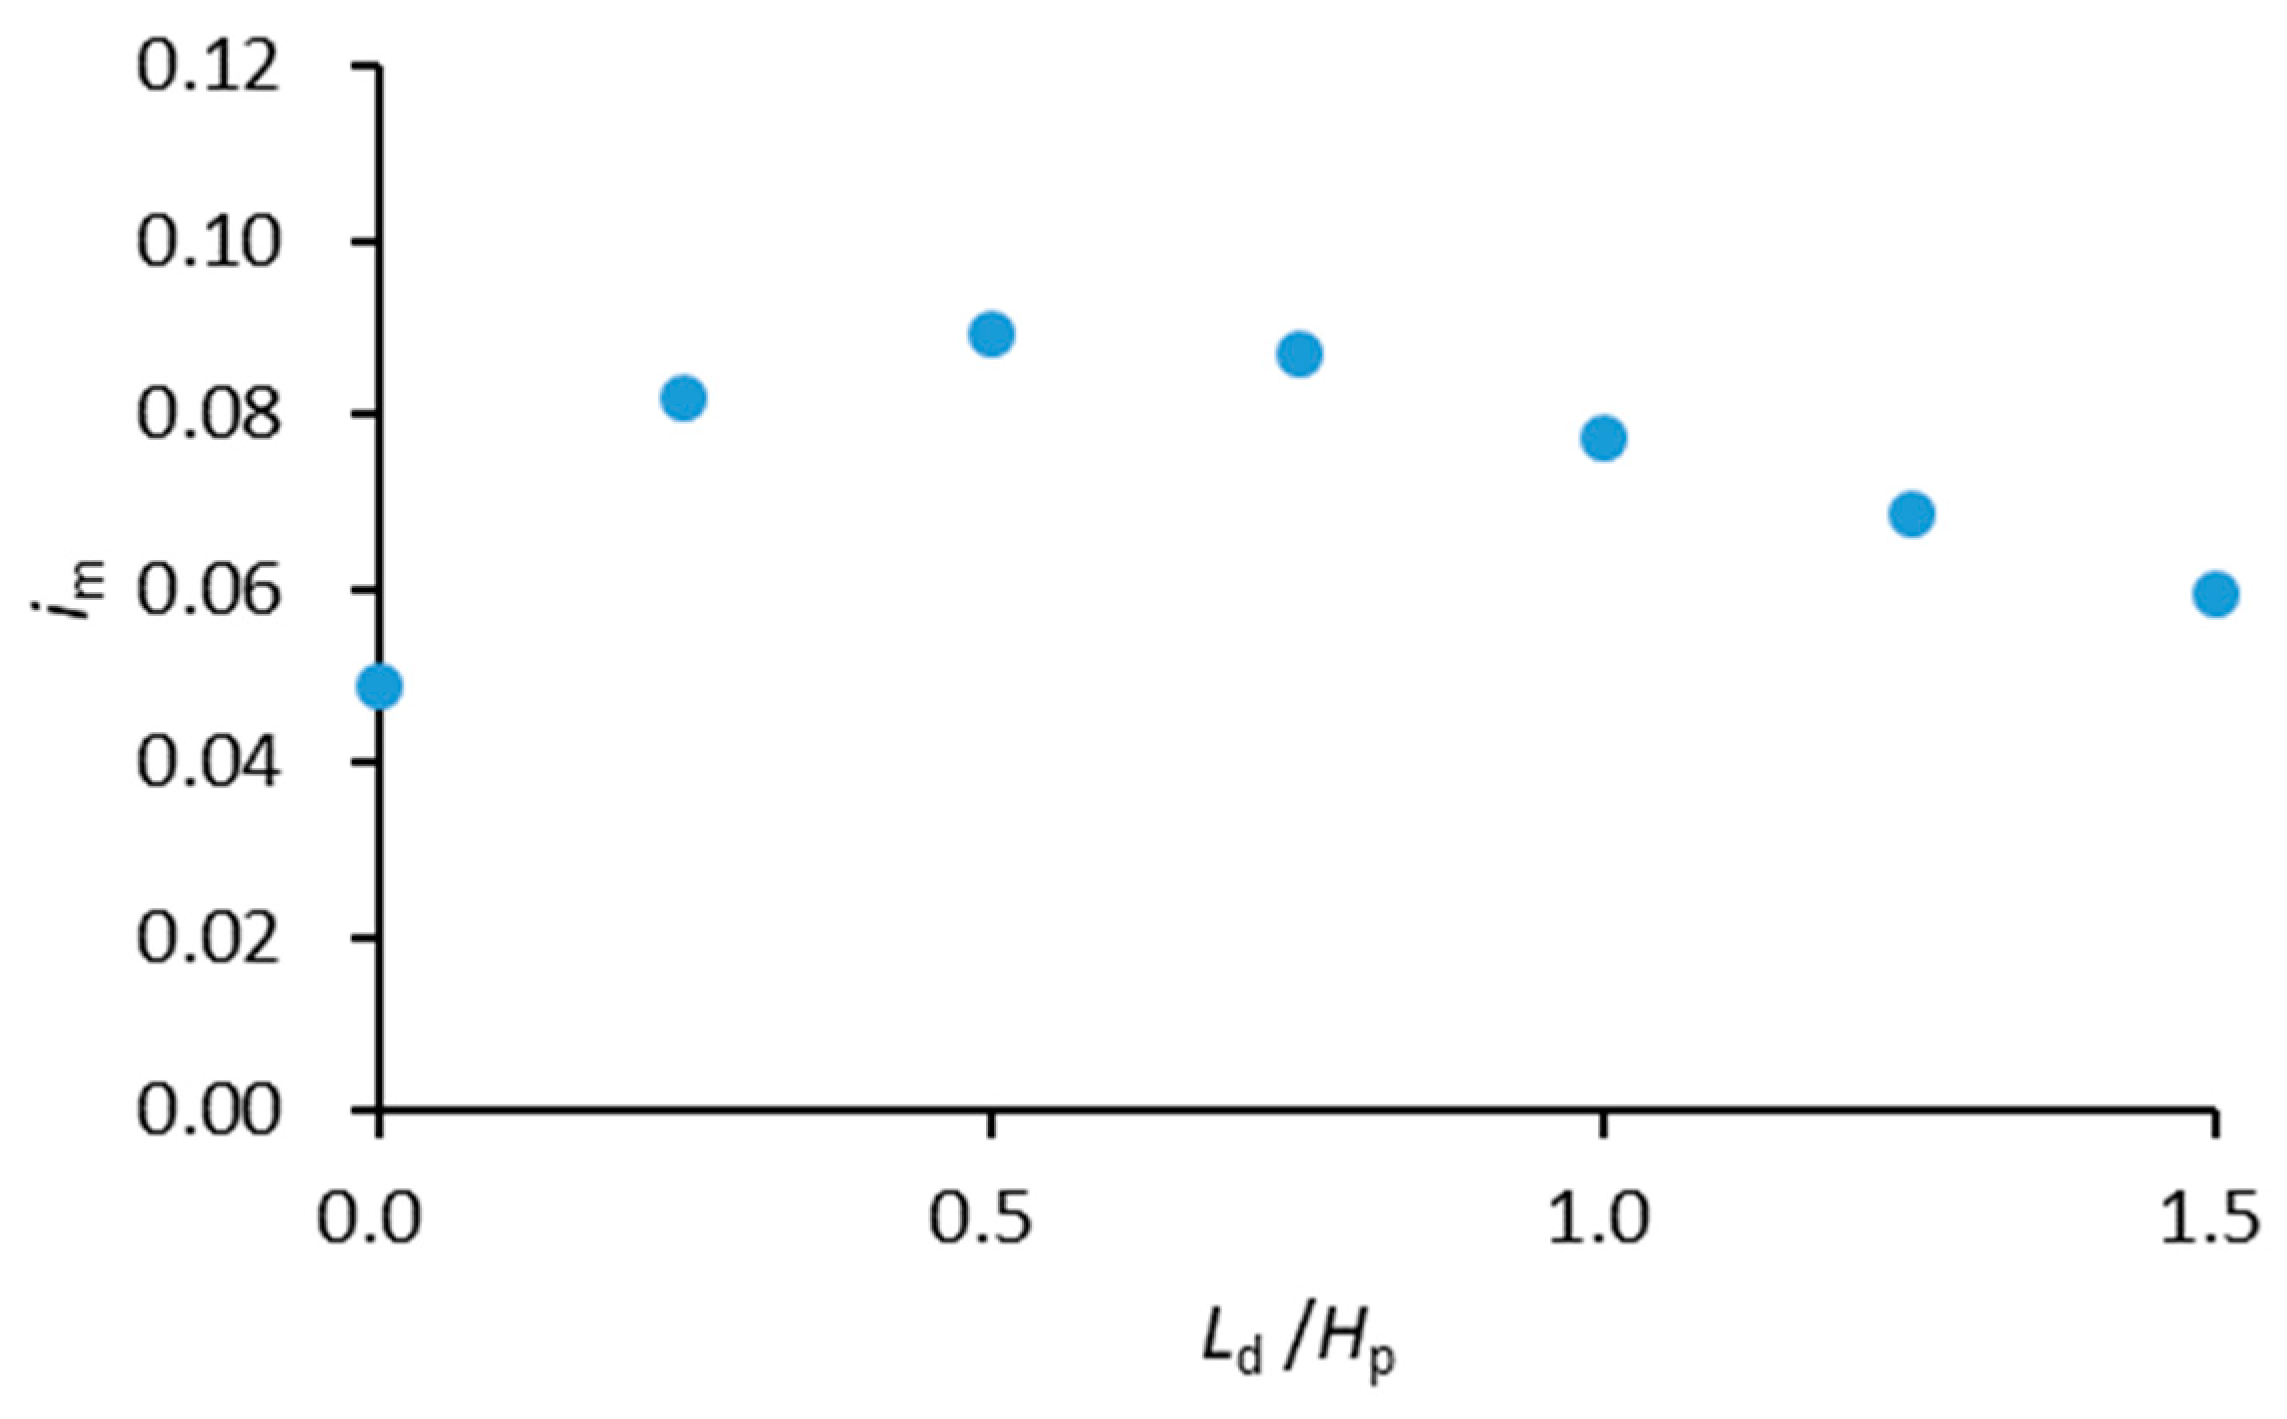
  • The average hydraulic gradient increases with the decreasing mattress length downstream of the floating plate when the downstream mattress length is over 0.5 times of the plate height. With the further drop in the downstream mattress length, the average hydraulic gradient gradually drops.
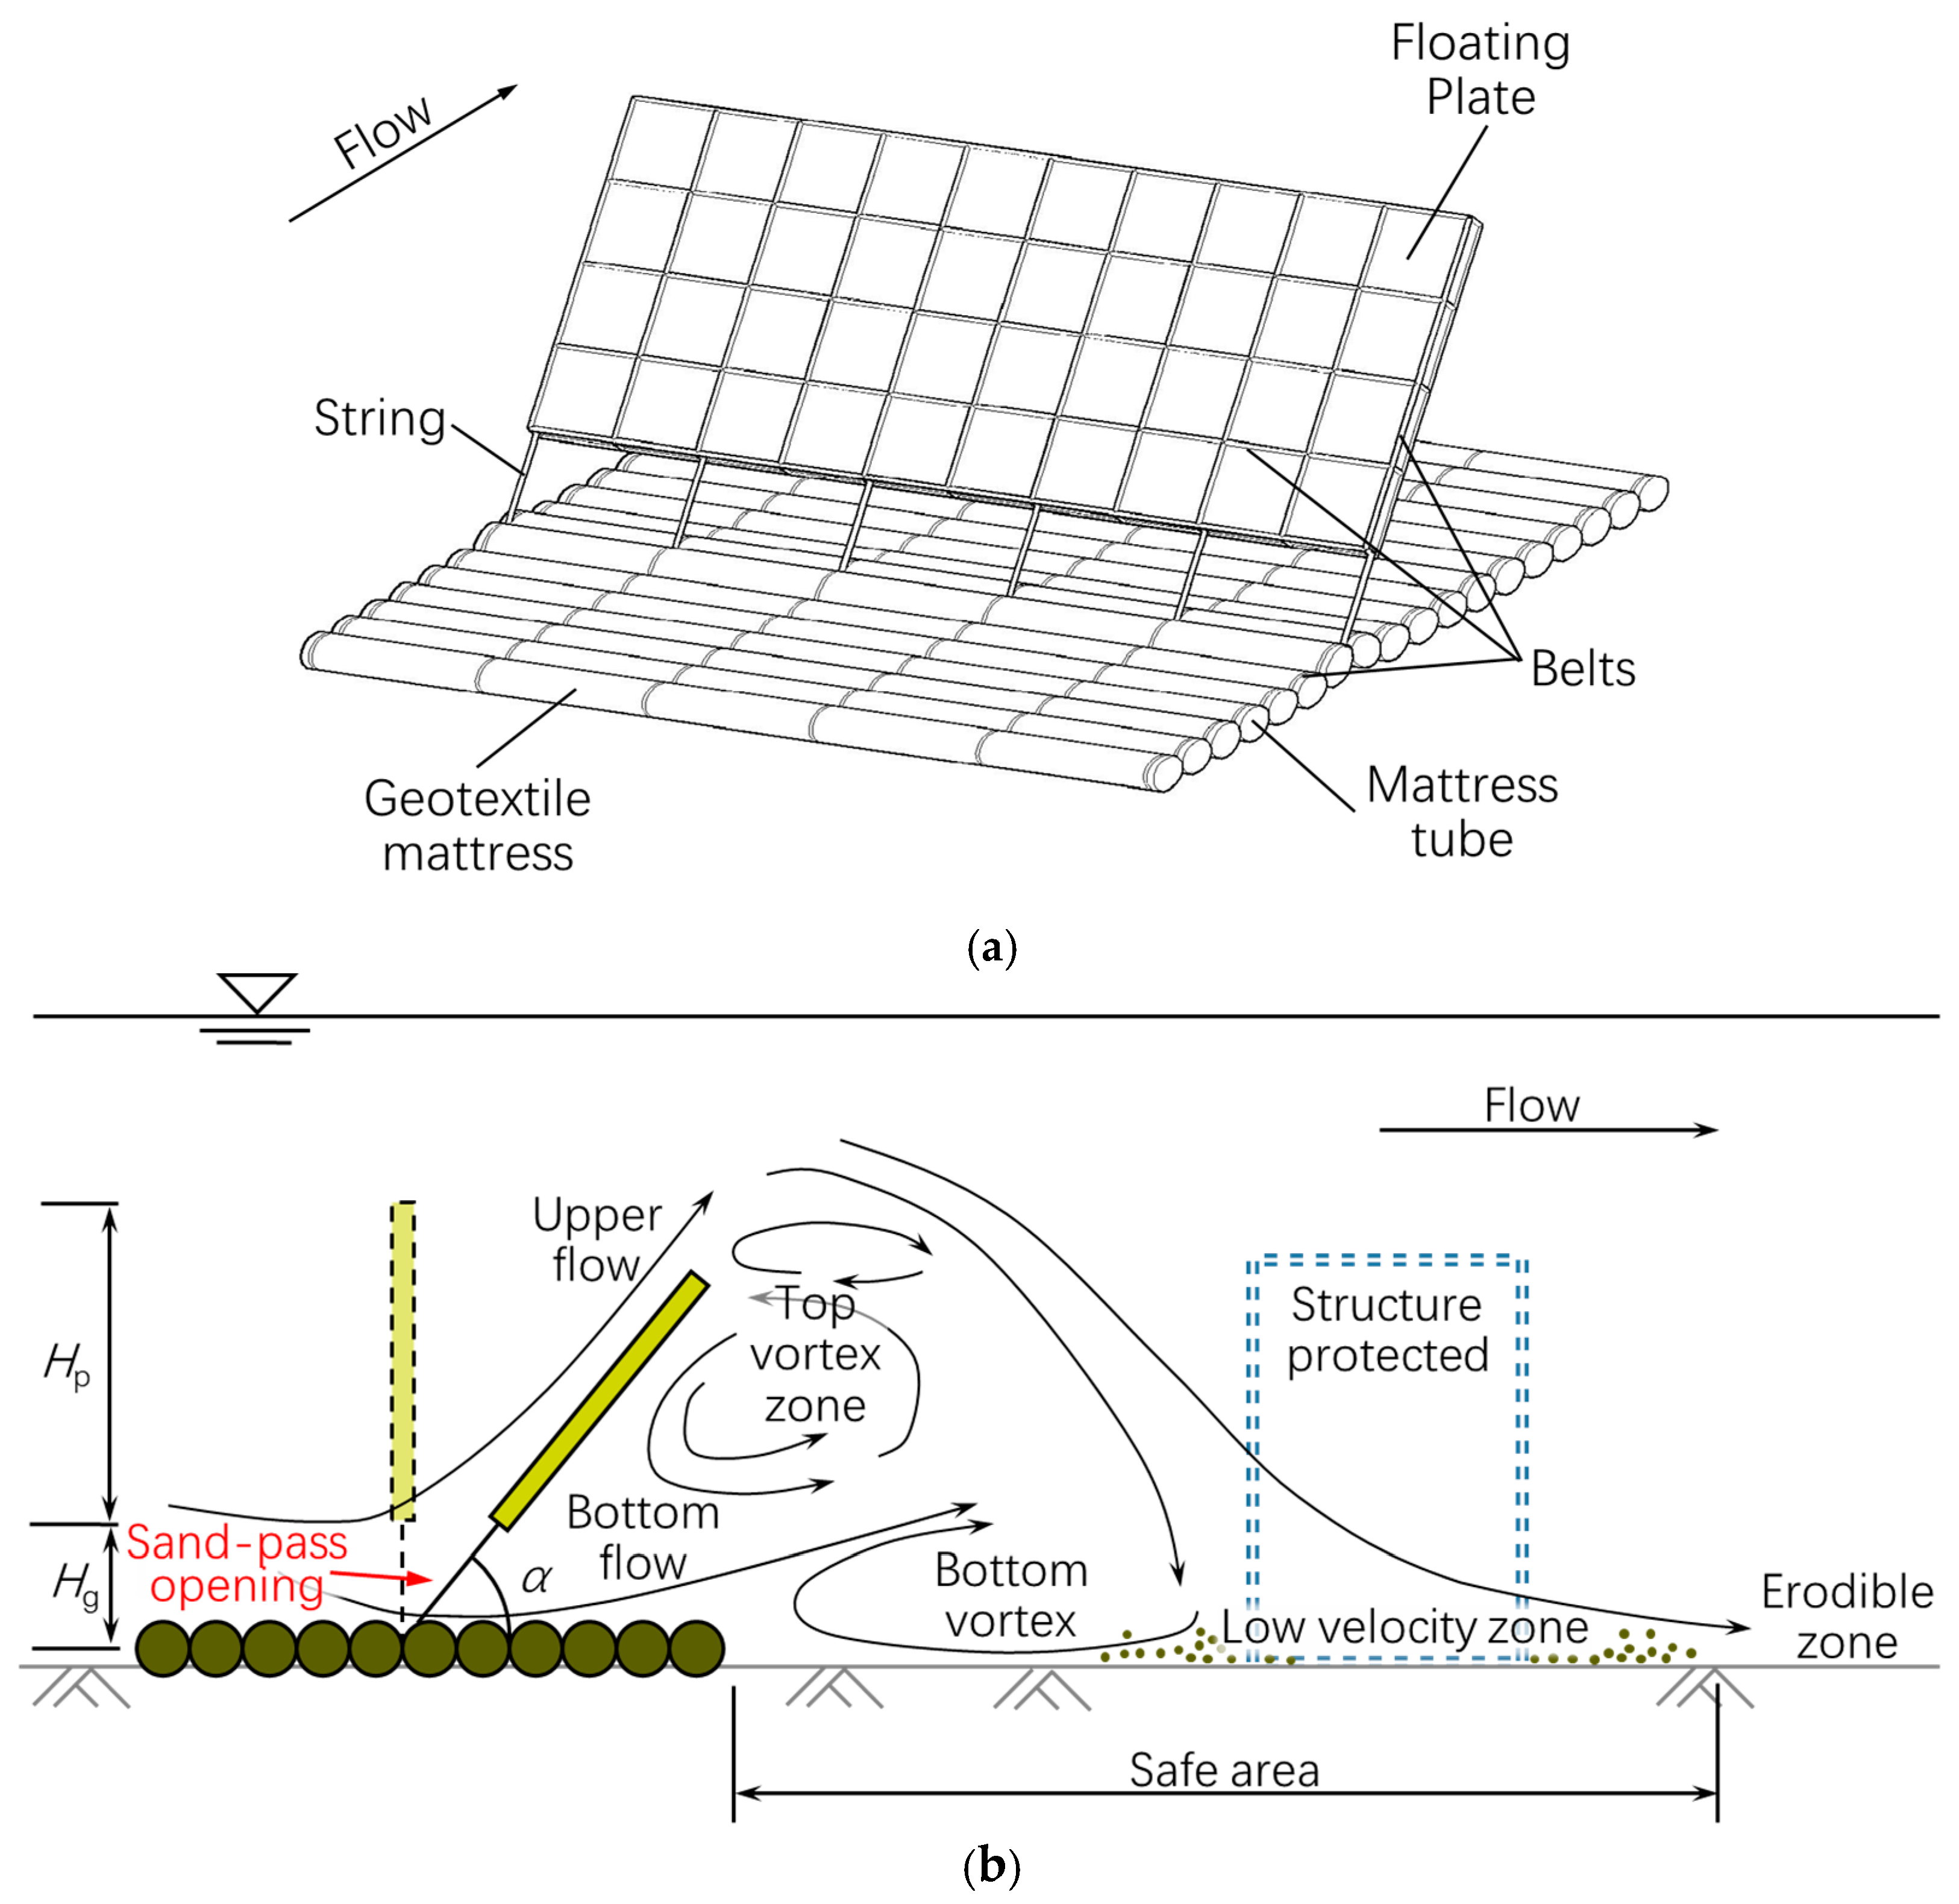
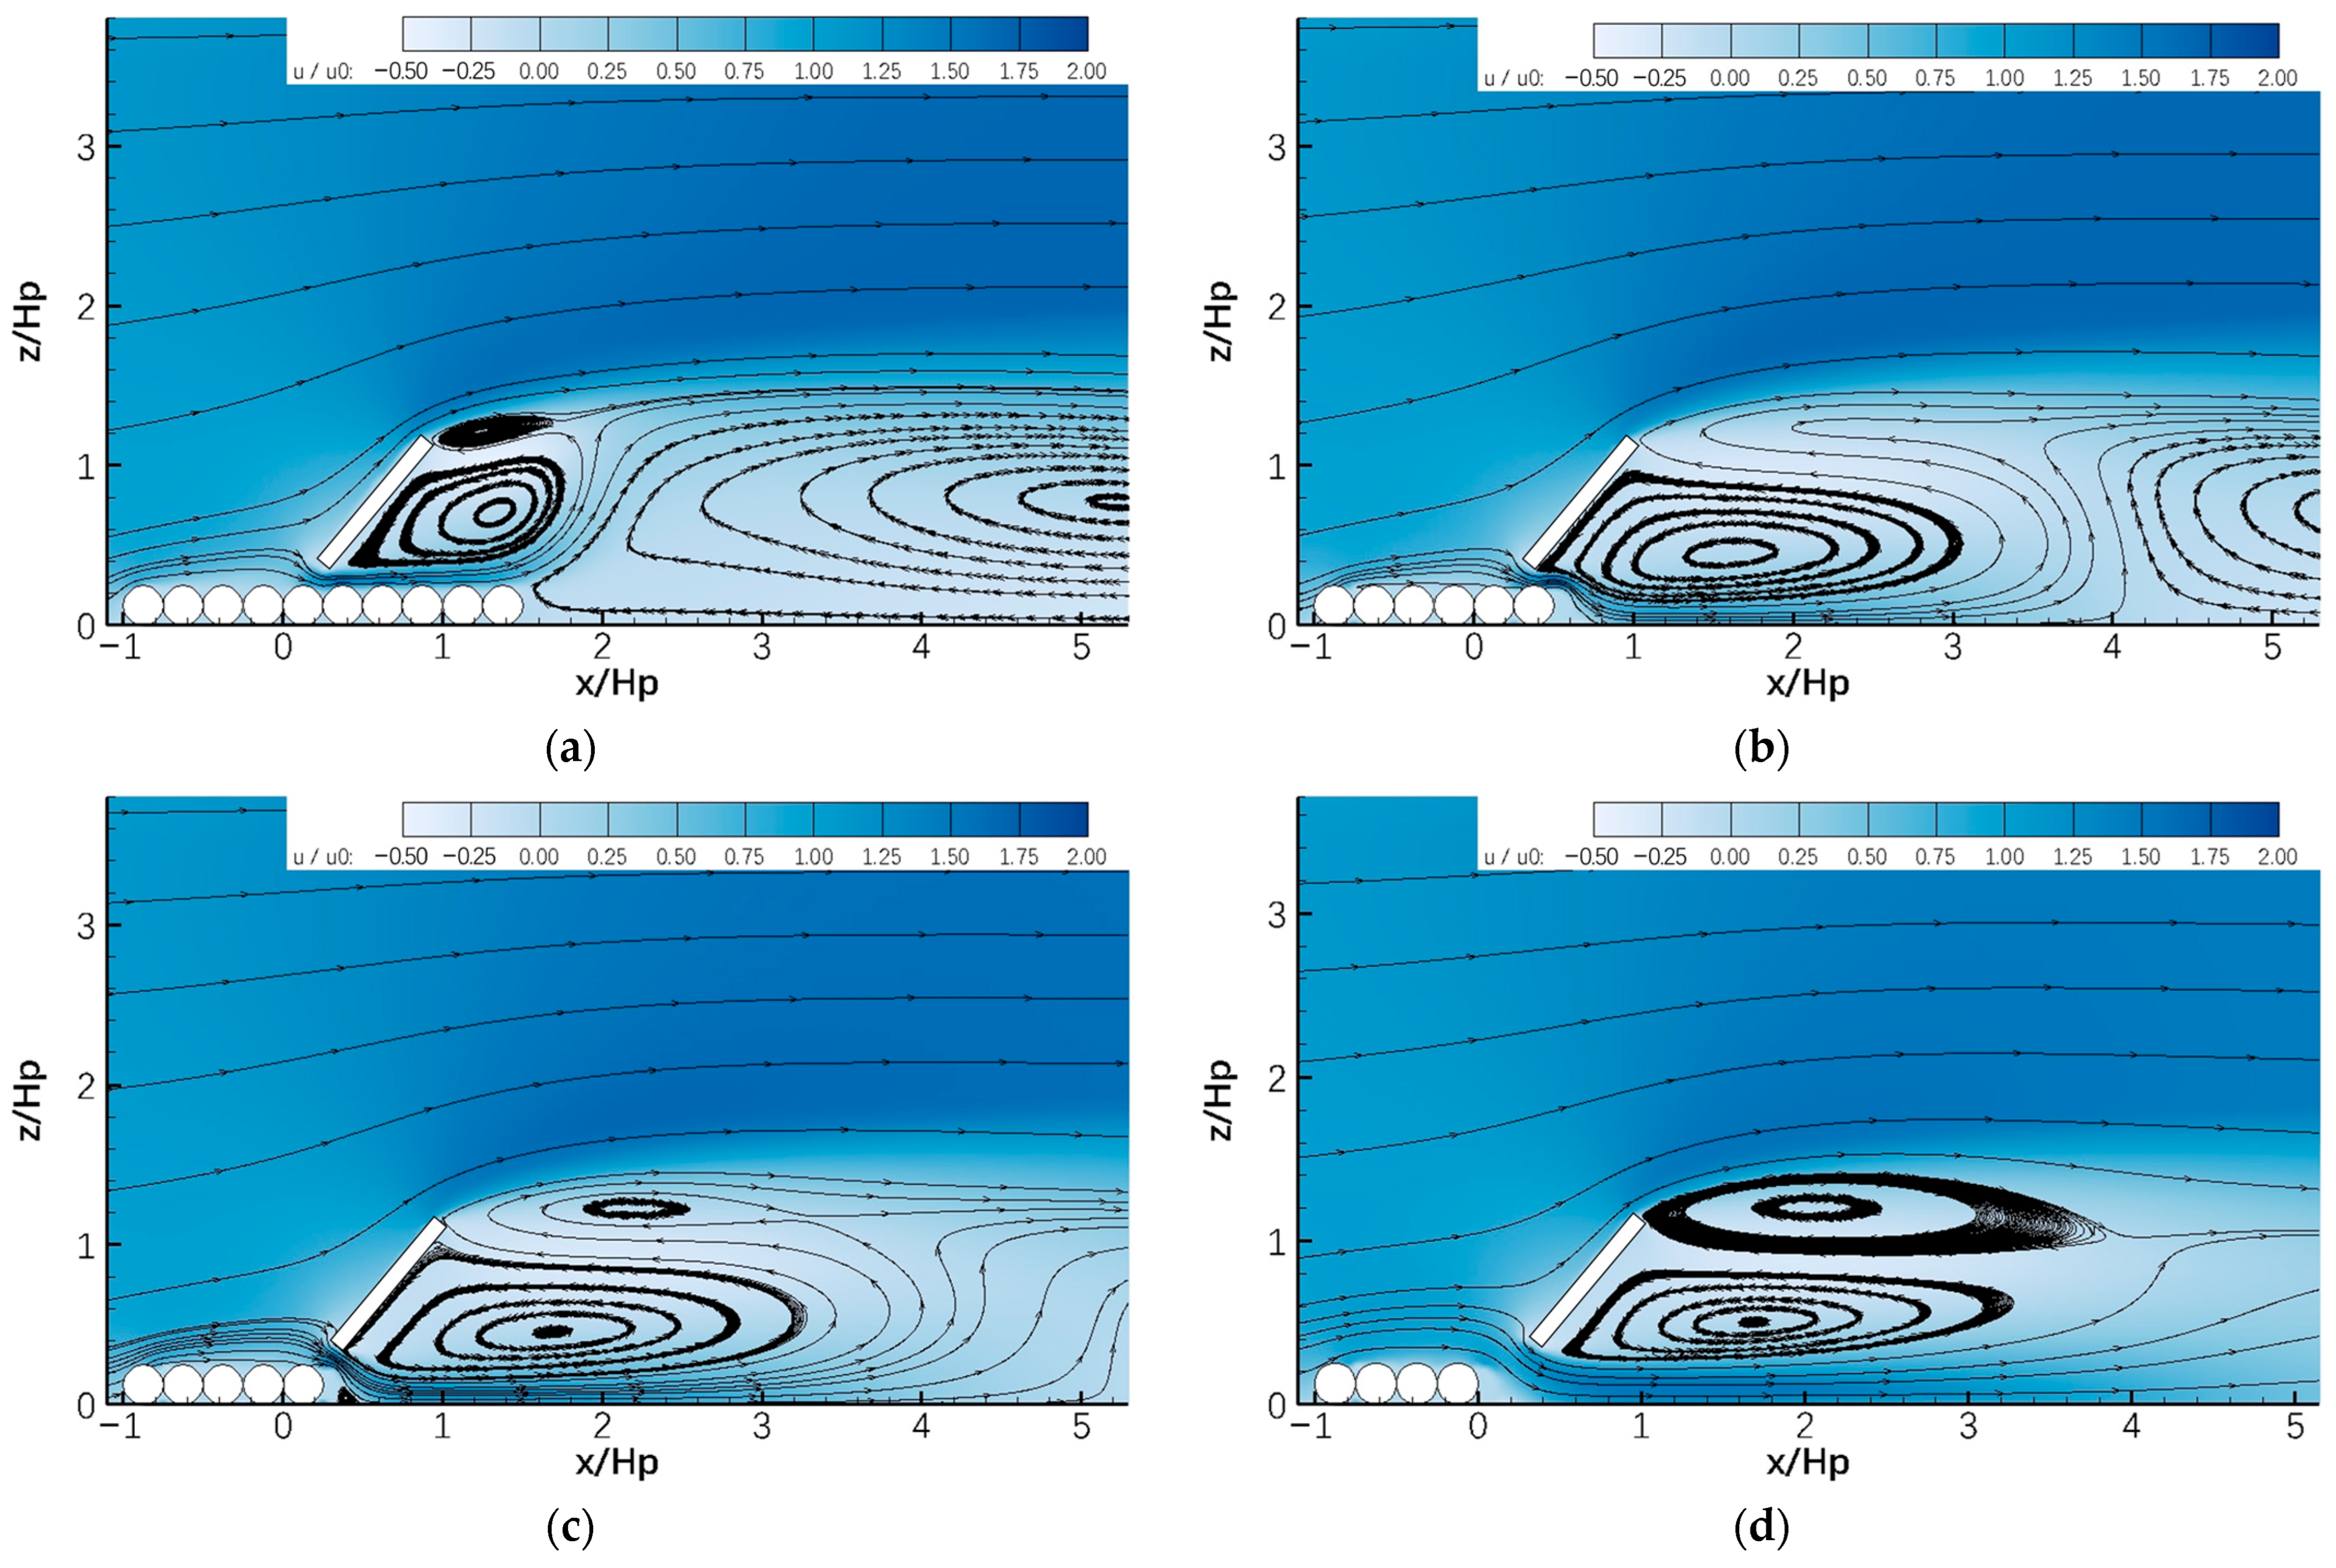
  • The effect of the downstream mattress length can be explained by the variation in the vortices in the top vortex zone on the leeside of the GMFP. When the downstream mattress is shortened, the mattress can fail to provide enough friction to slow down the bottom flow through the sand-pass opening, and thus the vortices in the top vortex zone can become excessively developed, pushing the bottom vortex to the leeside.
  • The shortened downstream mattress can increase the risk of the GMFP of overturning and slipping, although the average hydraulic gradient decreases.

Author Contributions

Conceptualization, Y.Z.; methodology, Y.Z.; validation, Y.Z., Q.W. and G.W.; formal analysis, Y.Z.; investigation, Y.Z., Q.W. and G.W.; resources, Y.Z., L.X. and Y.L.; writing—original draft preparation, Y.Z. and G.W.; writing—review and editing, Y.Z. and L.X.; visualization, Y.Z. and Q.W.; supervision, Y.Z.; project administration, Y.Z., L.X. and Y.L.; funding acquisition, L.X. and Y.Z. All authors have read and agreed to the published version of the manuscript.

Funding

This research was funded by the National Natural Science Foundation of China, grant numbers 11172213 and 51479137; China Scholarship Council, grant number 201806260166; and Student Innovation and Entrepreneurship Training Program of University of Shanghai for Science and Technology, grant number XJ2024514.

Institutional Review Board Statement

Not applicable.

Informed Consent Statement

Not applicable.

Data Availability Statement

The original contributions presented in this study are included in the article material, further inquiries can be directed to the corresponding author.

Acknowledgments

The first author would like to extend his sincere gratefulness to Wencai Huang, a former undergraduate student of Tongji University, for the assistance in performing the flume experiment in Section 2.

Conflicts of Interest

The authors declare no conflicts of interest. The funders had no role in the design of this study; in the collection, analyses, or interpretation of data; in the writing of the manuscript; or in the decision to publish the results.

Appendix A. Brief Introduction to Some Specialized Terms

This appendix provides a brief introduction to some of the specialized terms in this paper. Further information can be referred to in professional books.
Pipeline span. Submarine pipelines are usually laid directly on the seabed. When local scour appears underneath a pipeline, the scour hole can expand along the pipeline. Some part of the pipeline is no longer supported by the seabed. This part of the pipeline is thus spanning, and this phenomenon is called a pipeline span [1].
Groin. A groin, also known as a groyne, is a long narrow structure built from the coast into the water area to prevent scour on the coast, or to enhance sediment trapping on the coast. Most groins are perpendicular or slightly oblique to the coastline [22,23].
Riprap. A riprap is a layer of stones or chunks of concrete thrown together without order on an embankment slope, seabed, or riverbed to prevent erosion [24].
Geotextile mattress. A geotextile mattress, also termed as a geotextile grout-filled mattress, is an erosion-resistant revetment made from durable permeable fabric forms that are filled with high-strength grout [25].
Seepage failure. Seepage failure refers to the formation of channels in soil caused by the displacement of particles due to the strong horizontal force exerted by seepage flow. When the seepage intensity in the soil is excessive, soil particles can be displaced and carried away by the flow. This phenomenon sometimes leads to development of channels in the soil and some of the seepage failure is thus called piping [26,27].
Flume. A flume is a hydrodynamic channel usually powered by a pump. Flumes are often used to investigate the characteristics of the flow and the interaction between the flow and structures. Some flumes are also equipped with a wave maker to investigate waves.
Re-normalization group k-ε model. The re-normalization group (RNG) k-ε model is established by employing RNG methods to renormalize the Navier–Stokes equations, thereby taking into account the impact of smaller-scale movements. In the standard k-ε model, the eddy viscosity is calculated based on a single turbulence length scale, which means that the turbulent diffusion result reflects only that specific scale; whereas, actually, all scales of motion can affect the turbulent diffusion. The RNG model is a mathematical strategy for developing a turbulence model similar to the k-ε, and results in an improved form of the ε equation that seeks to incorporate various motion scales by changing the production term [28].
Fractional volume. The fractional volume is the fractional portion of grid cell volume that is occupied by the fluid [17].
Area fraction. The area fraction is the fraction portion of grid face area that is occupied by the fluid [17].

References

  1. Sumer, B.M. Flow–structure–seabed interactions in coastal and marine environments. J. Hydraul. Res. 2014, 52, 1–13. [Google Scholar] [CrossRef]
  2. Kuang, C.; Zheng, Y.; Gu, J.; Zou, Q.; Han, X. Experimental study on backflow patterns induced by a bilateral groin pair with different spacing. Appl. Sci. 2021, 11, 1486. [Google Scholar] [CrossRef]
  3. Zhang, R.; Chen, Y.; Yao, P.; Stive, M.J.F.; Zeng, J. Numerical simulations of effects of the layout of permeable pile groin systems on longshore currents. J. Mar. Sci. Eng. 2023, 11, 1823. [Google Scholar] [CrossRef]
  4. Jiang, L.; Zhang, J.; Tong, L.; Guo, Y.; He, R.; Sun, K. Wave motion and seabed response around a vertical structure sheltered by submerged breakwaters with Fabry–Pérot Resonance. J. Mar. Sci. Eng. 2022, 10, 1797. [Google Scholar] [CrossRef]
  5. Guo, L.; Qu, K.; Wang, X.; Huang, J.X. Numerical study on performance of submerged permeable breakwater under impacts of multi-directional focused wave groups. Ocean Eng. 2024, 302, 117665. [Google Scholar] [CrossRef]
  6. Mohammadnia, M.; Pak, A. A new method for designing cube armours for low-crested and submerged breakwaters. Ocean Eng. 2023, 281, 114769. [Google Scholar] [CrossRef]
  7. Wang, W.; Yan, J.; Chen, S.; Liu, J.; Jin, F.; Wang, B. Gridded cemented riprap for scour protection around monopile in the marine environment. Ocean Eng. 2023, 272, 113876. [Google Scholar] [CrossRef]
  8. Tang, Z.; Melville, B.; Shamseldin, A.Y.; Singhal, N.; Guan, D.; Stolte, A. Performance of riprap armour at vibrating offshore wind turbine monopile foundations. Coast. Eng. 2023, 186, 104392. [Google Scholar] [CrossRef]
  9. Chiew, Y.M. Mechanics of local scour around submarine pipelines. J. Hydraul. Eng. 1990, 116, 515–529. [Google Scholar] [CrossRef]
  10. Zhang, Z.; Shi, B.; Guo, Y.; Yang, L. Numerical investigation on critical length of impermeable plate below underwater pipeline under steady current. Sci. China Technol. Sci. 2013, 56, 1232–1240. [Google Scholar] [CrossRef]
  11. Zhu, Y.; Xie, L.; Su, T.-C. Scour protection effects of a geotextile mattress with floating plate on a pipeline. Sustainability 2020, 12, 3482. [Google Scholar] [CrossRef]
  12. Xie, L.; Huang, W.; Yu, Y. Experimental study of sediment trapping by geotextile mattress installed with sloping curtain. Geosynth. Int. 2013, 20, 389–395. [Google Scholar] [CrossRef]
  13. Li, Y.; Yu, G. Experimental investigation on flow characteristics at leeside of suspended flexible curtain for sedimentation enhancement. China Ocean Eng. 2009, 23, 565–576. [Google Scholar]
  14. Wang, H.; Si, F.; Lou, G.; Yang, W.; Yu, G. Hydrodynamic characteristics of a suspended curtain for sediment trapping. J. Waterw. Port Coast. Ocean Eng. 2015, 141, 04014030. [Google Scholar] [CrossRef]
  15. Xie, L.; Zhu, Y.; Li, Y.; Su, T.-C. Experimental study on bed pressure around geotextile mattress with sloping plate. PLoS ONE 2019, 14, e0211312. [Google Scholar] [CrossRef] [PubMed]
  16. Zhu, Y.; Xie, L.; Su, T.-C. Flow characteristics on the leeside of a geotextile mattress with floating plate. Ocean Eng. 2022, 265, 112624. [Google Scholar] [CrossRef]
  17. Flow Science Inc. FLOW-3D Documentation; Release 10.1.0; Flow Science, Inc.: Santa Fe, NM, USA, 2012; pp. 76–206. [Google Scholar]
  18. Li, L.; Zheng, J.; Peng, Y.; Zhang, J.; Wu, X. Numerical investigation of flow motion and performance of a horizontal axis tidal turbine subjected to a steady current. China Ocean Eng. 2015, 29, 209–222. [Google Scholar] [CrossRef]
  19. Zhang, J.; Gao, P.; Zheng, J.; Wu, X.; Peng, Y.; Zhang, T. Current-induced seabed scour around a pile-supported horizontal-axis tidal stream turbine. J. Mar. Sci. Technol. 2015, 23, 929–936. [Google Scholar]
  20. Hirt, C.W.; Nichols, B.D. Volume of fluid (VOF) method for the dynamics of free boundaries. J. Comput. Phys. 1981, 39, 201–225. [Google Scholar] [CrossRef]
  21. Zheng, Z.; Hu, Z.; Xie, X.; Huang, W. Local scour around the monopile: A microscopic perspective using CFD-DEM. Ocean Eng. 2024, 299, 117318. [Google Scholar] [CrossRef]
  22. Groynes. Available online: https://www.coastalwiki.org/wiki/Groynes (accessed on 28 October 2024).
  23. Groin. Available online: https://www.britannica.com/technology/groin (accessed on 28 October 2024).
  24. Riprap: Merriam-Webster.com Dictionary. Available online: https://www.merriam-webster.com/dictionary/riprap (accessed on 28 October 2024).
  25. A New Specification for Geotextile Grout Filled Mattresses. Available online: https://geosyntheticsmagazine.com/2021/04/01/a-new-specification-for-geotextile-grout-filled-mattresses (accessed on 28 October 2024).
  26. Seepage in Civil Engineering: Definition, Effects, Remedial Measures. Available online: https://testbook.com/civil-engineering/seepage-in-civil-engineering (accessed on 28 October 2024).
  27. Piping Failure in Hydraulic Structures. Available online: https://www.elementaryengineeringlibrary.com/civil-engineering/soil-mechanics/piping-failure-in-hydraulic-structures (accessed on 28 October 2024).
  28. RNG k-Epsilon Model. Available online: https://www.cfd-online.com/Wiki/RNG_k-epsilon_model (accessed on 28 October 2024).
Figure 1. Geotextile mattress with floating plate (GMFP). (a) Sketch of the GMFP [11]; (b) basic working mechanism of the GMFP (side view, not to scale) [16]. Symbols: Hp—height of the floating plate; Hg—height of the sand-pass opening (the gap between the geotextile mattress and the bottom edge of the floating plate); α—sloping angle of the floating plate.
Jmse 12 01975 g001
Figure 2. Scour beneath the mattress of a floating flow deflection structure [15].
Jmse 12 01975 g002
Figure 3. Sketch of the experiment setup (not to scale). (a) Test flume; (b) photo of the GMFP model. Symbols: Hp—height of the floating plate; Hg—height of the sand-pass opening; α—sloping angle; u0—depth averaged flow velocity; h0—flow depth; t—thickness of the floating plate.
Jmse 12 01975 g003
Figure 4. Variation of the sloping angle with the Froude number. The empirical curves proposed by Wang et al. [14] are also plotted.
Jmse 12 01975 g004
Figure 5. Layout of the computational domain (not to scale). Symbols: Hp—height of the floating plate; Hg—height of the sand-pass opening; α—sloping angle; Lu—length of geotextile mattress upstream of the floating plate; Ld—length of geotextile mattress downstream of the floating plate; h0—flow depth; t—thickness of the floating plate.
Jmse 12 01975 g005
Figure 6. Mesh near the GMFP.
Jmse 12 01975 g006
Figure 7. Comparison of the bed pressure distribution near the GMFP between the experimental research [15] and the numerical results in the present study.
Jmse 12 01975 g007
Figure 8. Comparison of near bottom velocity downstream of the GMFP between the experimental research [16] and the numerical results in the present study.
Jmse 12 01975 g008
Figure 9. Bed pressure near the GMFP with varying Froude number (buoyancy of the floating plate FB = 9.8 N/m).
Jmse 12 01975 g009
Figure 10. Bed pressure near the GMFP with varying Froude number (buoyancy of the floating plate FB = 14.7 N/m).
Jmse 12 01975 g010
Figure 11. Variation of the average hydraulic gradient under the GMFP with the Froude number and the buoyancy of the floating plate.
Jmse 12 01975 g011
Figure 12. Bed pressure near the GMFP with varying mattress lengths upstream of the floating plate.
Jmse 12 01975 g012
Figure 13. Variation of the average hydraulic gradient under the GMFP with mattress length upstream of the floating plate.
Jmse 12 01975 g013
Figure 14. Bed pressure near the GMFP with varying mattress lengths downstream of the floating plate.
Jmse 12 01975 g014
Figure 15. Variation of the average hydraulic gradient under the GMFP with mattress length downstream of the floating plate.
Jmse 12 01975 g015
Figure 16. Flow pattern on the leeside of the GMFP in cases with different lengths of mattress downstream of the floating plate: (a) Ld = 1.50Hp; (b) Ld = 0.50Hp; (c) Ld = 0.25Hp; (d) Ld = 0.00Hp. Symbols: Ld—length of mattress downstream of the floating plate; Hp—height of floating plate.
Jmse 12 01975 g016
Table 1. Experiment cases.
CaseFrFB (N/m)
0010.1269.8
0020.1779.8
0030.2129.8
0040.2379.8
0050.12614.7
0060.18914.7
0070.24314.7
0080.27414.7
Table 2. Numerical simulation cases.
GroupCaseFrFB (N/m)Lu/HpLd/Hp
AA010.1269.81.001.50
A020.1779.81.001.50
A030.2129.81.001.50
A040.2379.81.001.50
A110.12614.71.001.50
A120.15114.71.001.50
A130.18914.71.001.50
A140.24314.71.001.50
A150.27414.71.001.50
BA020.1779.81.001.50
B010.1779.80.751.50
B020.1779.80.501.50
B030.1779.80.251.50
B040.1779.80.001.50
B110.1779.81.001.25
B120.1779.81.001.00
B130.1779.81.000.75
B140.1779.81.000.50
B150.1779.81.000.25
B160.1779.81.000.00
Disclaimer/Publisher’s Note: The statements, opinions and data contained in all publications are solely those of the individual author(s) and contributor(s) and not of MDPI and/or the editor(s). MDPI and/or the editor(s) disclaim responsibility for any injury to people or property resulting from any ideas, methods, instructions or products referred to in the content.

