Article

Research on the Give-Way Ships Determination Based on Field Theory

1
Merchant Marine College, Shanghai Maritime University, Shanghai 201306, China
2
Ningbo Dagang Pilotage Co., Ltd., Ningbo 315100, China
*
Author to whom correspondence should be addressed.
J. Mar. Sci. Eng. 2024, 12(11), 1973; https://doi.org/10.3390/jmse12111973
Submission received: 30 September 2024 / Revised: 23 October 2024 / Accepted: 31 October 2024 / Published: 2 November 2024
(This article belongs to the Section Ocean Engineering)

Abstract

:
The Convention on the International Regulations for Preventing Collisions at Sea, 1972 (COLREGs) stipulates ships’ obligations when encountering each other. However, human action remains a primary cause of collision accidents. In the complex environment of mixed navigation involving MASS and manned ships, the applicability of the COLREGs for determining the give-way ship has faced certain challenges. Therefore, this study proposes a model for determining the give-way ship, combining ship characteristics and using an asymmetric Gaussian function to construct the potential field of stand-on ships from the perspective of give-way ships. It constructs the cost function based on field theory to determine the respective avoidance costs for both ships in a crossing situation, with the ship incurring the lowest cost selected as the give-way ship, followed by a case study to validate the model. The research is dedicated to coordinating avoidance action objectively, effectively reducing maritime collisions, and providing exploratory guidance for collision avoidance decision-making in future mixed navigation environments.

1. Introduction

With the promotion of the Belt and Road Initiative, waterway transportation has become an important link in international trade. Ships gradually progress to high-speed, unmanned development, and the increasing scale of ships complicates the navigation environment, maritime collision accidents often occur. Additionally, according to the European Maritime Safety Agency survey, “human action” was identified as the primary cause of ship collision accidents from 2014 to 2022, accounting for 59.1% of the total incidents [1]. Ahmed et al. [2] pointed out that the main issues include improper collision avoidance actions and misjudgments by the duty officer. To reduce the interference of human subjective factors and achieve autonomous collision avoidance for ships, Maritime Autonomous Surface Ships (MASS) have attracted extensive attention and discussion in the academic community [3,4]. However, the development of MASS is a gradual process, and it is impossible to replace all conventional ships overnight; the future waterway transportation system will be a hybrid system with both manned and autonomous ships coexisting [5,6,7].

1.1. Related Works

In recent years, much research has been done on autonomous ship collision avoidance decision-making [8,9,10,11,12]. Öztürk Ü has introduced path planning algorithms of MASS in respect to navigation safety [13]. The evolution of mathematical models for collision avoidance decision-making is described in detail in the review article by Statheros et al. [14]. Based on the existing research results, autonomous collision avoidance algorithms can broadly be put into two categories: algorithms based on mathematical models and artificial intelligence algorithms.
(1)
Algorithms Based on Mathematical Models
Mathematical model-based collision avoidance algorithms primarily consider the physical kinematics and dynamics models, addressing collision avoidance problems through quantifiable methods, which enables more accurate collision avoidance decisions. Common mathematical model-based algorithms include geometric analysis, artificial potential fields [15], velocity obstacle methods, etc.
Geometric analysis, one of the earliest methods of collision avoidance studies, usually assumes that the two ships maintain course and speed, ignoring the size of the ships [16]. Hayama Imazu [17] first combined DCPA (Distance to Nearest Point) and TCPA (Time to Nearest Point) to determine the timing of ship avoidance, and proposed the corresponding collision risk calculation model. Subsequently, many scholars conducted further research on collision avoidance [18,19] and collision risk calculation [20] based on this foundation, however, such studies suffer from inconsistencies in dimension. Zhu [21] introduced the DCPA-TCPA criterion into the improved Artificial Potential Field method, but there is the problem of local minima [22]. In addition, Abdelaal [23] proposed a ship collision avoidance algorithm combined with nonlinear Model Predictive Control, achieving faster collision avoidance decisions through an accurate ship motion control model. However, the method only considered the starboard side avoidance strategy, which presents certain limitations. Wang et al. [24] developed a probabilistic model to solve the ship collision avoidance problem and designed a greedy algorithm that uses a cost function to search for possible movement paths. Moreover, CHO et al. [25] proposed an automatic collision avoidance algorithm based on probabilistic velocity obstacle method, refining maritime traffic rules and introducing symmetrical role classification criteria. To further narrow down the feasible solution space, Zheng et al. [26] introduced multiple constraints in their method, improving the accuracy of the collision avoidance strategy. Zhang et al. [27] proposed a real-time collision avoidance method for autonomous ships based on an improved velocity obstacle algorithm and a gray cloud model, incorporating COLREGs.
(2)
Artificial Intelligence Algorithms
Artificial intelligence and soft computing algorithms are able to learn from historical data or environments and respond to complex navigational environments through autonomous decision-making mechanisms. Such algorithms generate solutions by learning and adaptive mechanisms for approximate results, mainly including methods such as reinforcement learning, evolutionary algorithms, and neural networks, etc.
In order to ensure the economy of navigation, Tsou et al. [28,29] calculated the shortest sailing path of a ship under the condition of meeting navigation safety by combining the genetic algorithm and biological evolution model with full consideration of the COLREGs. Xu et al. utilized the danger immune algorithm [30] and the non-dominated sorting genetic algorithm II (NSGA-II) [31] to develop an optimal collision avoidance strategy by constructing a multi-objective evaluation function that considers safety, economy, and smoothness. Liang et al. [32] employ a good point set theory to optimize the initial population selection, which addresses the issue of NSGA-II being prone to premature convergence and the formation of local optimal solutions. The study effectively generates economical collision avoidance paths under partial COLREG constraints. However, the multi-ship collision avoidance experiment did not consider the interactions between the target ships themselves. Hu et al. [33] proposed a multiobjective particle swarm optimization (H-MOPSO) algorithm that considers COLREGs and good seamanship. However, good seamanship only considers that course changes are preferred over speed changes, and speed changes are limited to three discrete values: half speed, double speed and zero speed. Zhao et al. [33] consider the kinematic and energy consumption constraints of USVs, and propose an adaptive enhanced non-dominated sorting genetic algorithm (AENSGA-II) for maritime collision avoidance, which demonstrates strong global search capabilities. However, the method lacks experimental validation. Additionally, Lee [34] transformed the collision avoidance rules into mathematical formulas and used fuzzy logic to formulate collision avoidance paths that conformed to COLREGs. Chen et al. [35] proposed a distributed obstacle avoidance algorithm based on deep reinforcement learning that significantly reduces the obstacle avoidance time of two-agent. Ho et al. [36] develops a collision risk inference system using IF-THEN fuzzy rules based on the COLREGs.

1.2. Reflection

It is not difficult to find that many studies integrate some regulations of the COLREGs for collision avoidance. However, it is noteworthy that with the development of MASS, the applicability of the COLREGs warrants further discussion [37,38]. Specifically:
COLREGs provide normative guidance for the navigation of manned ships and are intended to help duty officers make reasonable judgments based on navigational experience [39]. So, COLREGs contain a large amount of qualitative content, making them difficult to translate into machine-readable form [40]. Current collision avoidance studies considering COLREGs can only realize the quantifiable aspects [41], while qualitative expressions such as ‘good seamanship’ or ‘ordinary practice of seamen’ are difficult to represent through mathematical models [42]. The existing MASS also has relatively limited rule reasoning capabilities, which means they can only handle a limited number of scenarios set by researchers [37].
For example, under COLREGs Rule 13, when a ship is in any doubt as to whether it is overtaking another, it shall assume that this is the case and act accordingly. However, some inexperienced duty officers may confuse this with a starboard wide-angle crossing encounter, where the interpretation of give way responsibilities is exactly the opposite [32]. In addition, Kuwata [43] points out that even in simple scenarios, the determination of the give-way ship is not solely based on the relative positions and courses of the two ships under COLREGs Rule 15. When the speed of the give-way ship under COLREGs in relation to the stand-on ship is very low, the reasonableness of the COLREGs becomes questionable.
Therefore, this study reconsiders the determination of the give-way ship in the COLREGs and proposes a give-way ship determination model, using the principle of least cost to determine the give-way ship objectively and quantitatively. It constructs a ship collision risk field based on field theory, transforming the environmental perceptions experienced by the ship’s duty officer during collision avoidance into a psychological force of “avoiding harm”. The specific ideas are: assuming that the target ship (TS) is the give-way ship, constructing the collision risk field of the stand-on ship owner ship (OS) under the viewpoint of the TS, determining its cost value of avoidance collision. Switch the viewpoint, assuming that OS is a give-way ship, and similarly calculating the cost value, and choosing the ship with the lowest cost value to be the give-way ship in a comprehensive consideration. This model is dedicated to reducing the influence of subjective factors, improving the coordination of the two ships’ avoidance, effectively reducing maritime collision accidents, and providing exploratory guidance for collision avoidance decision-making in future mixed navigation environments.

2. Theoretical Foundations

2.1. Encounter Situation Classification

The COLRGEs divide encounter situations into specific criteria. When ships are in sight of one another and have risk of collision, there are three types of encounter situations, including head-on situation (A), crossing situation (B, C), and overtaking (D). The coordinate system of the ship is established as shown in Figure 1, and B is the relative azimuth of the approaching ship (which will be described in detail in the following text). When the relative azimuth satisfies the condition B ∈ [112.5°, 247.5°], and speed is greater than the ship, it is judged that they constitute an overtaking situation. When the relative azimuth satisfies the condition B ∈ [0°, 10°] ∪ [350°, 360°] and the courses are reciprocal or nearly reciprocal, it is judged that they constitute a head-on situation, and the relative azimuth satisfies the condition B ∈ (10°, 112.5°) ∪ (247.5°, 350°) and the courses are crossed, it is judged that the approaching ship and this ship constitute a crossing situation.
Despite the application of traffic separation schemes reducing the probability of collisions occurring in head-on situations, crossing situations still frequently result in collisions, especially in complex waters, such as the warning area, and it is also the most common situation for ships to meet [44]. Therefore, this study focuses on analyzing the give-way ship determination model in a more complex crossing situation.

2.2. Field Theory

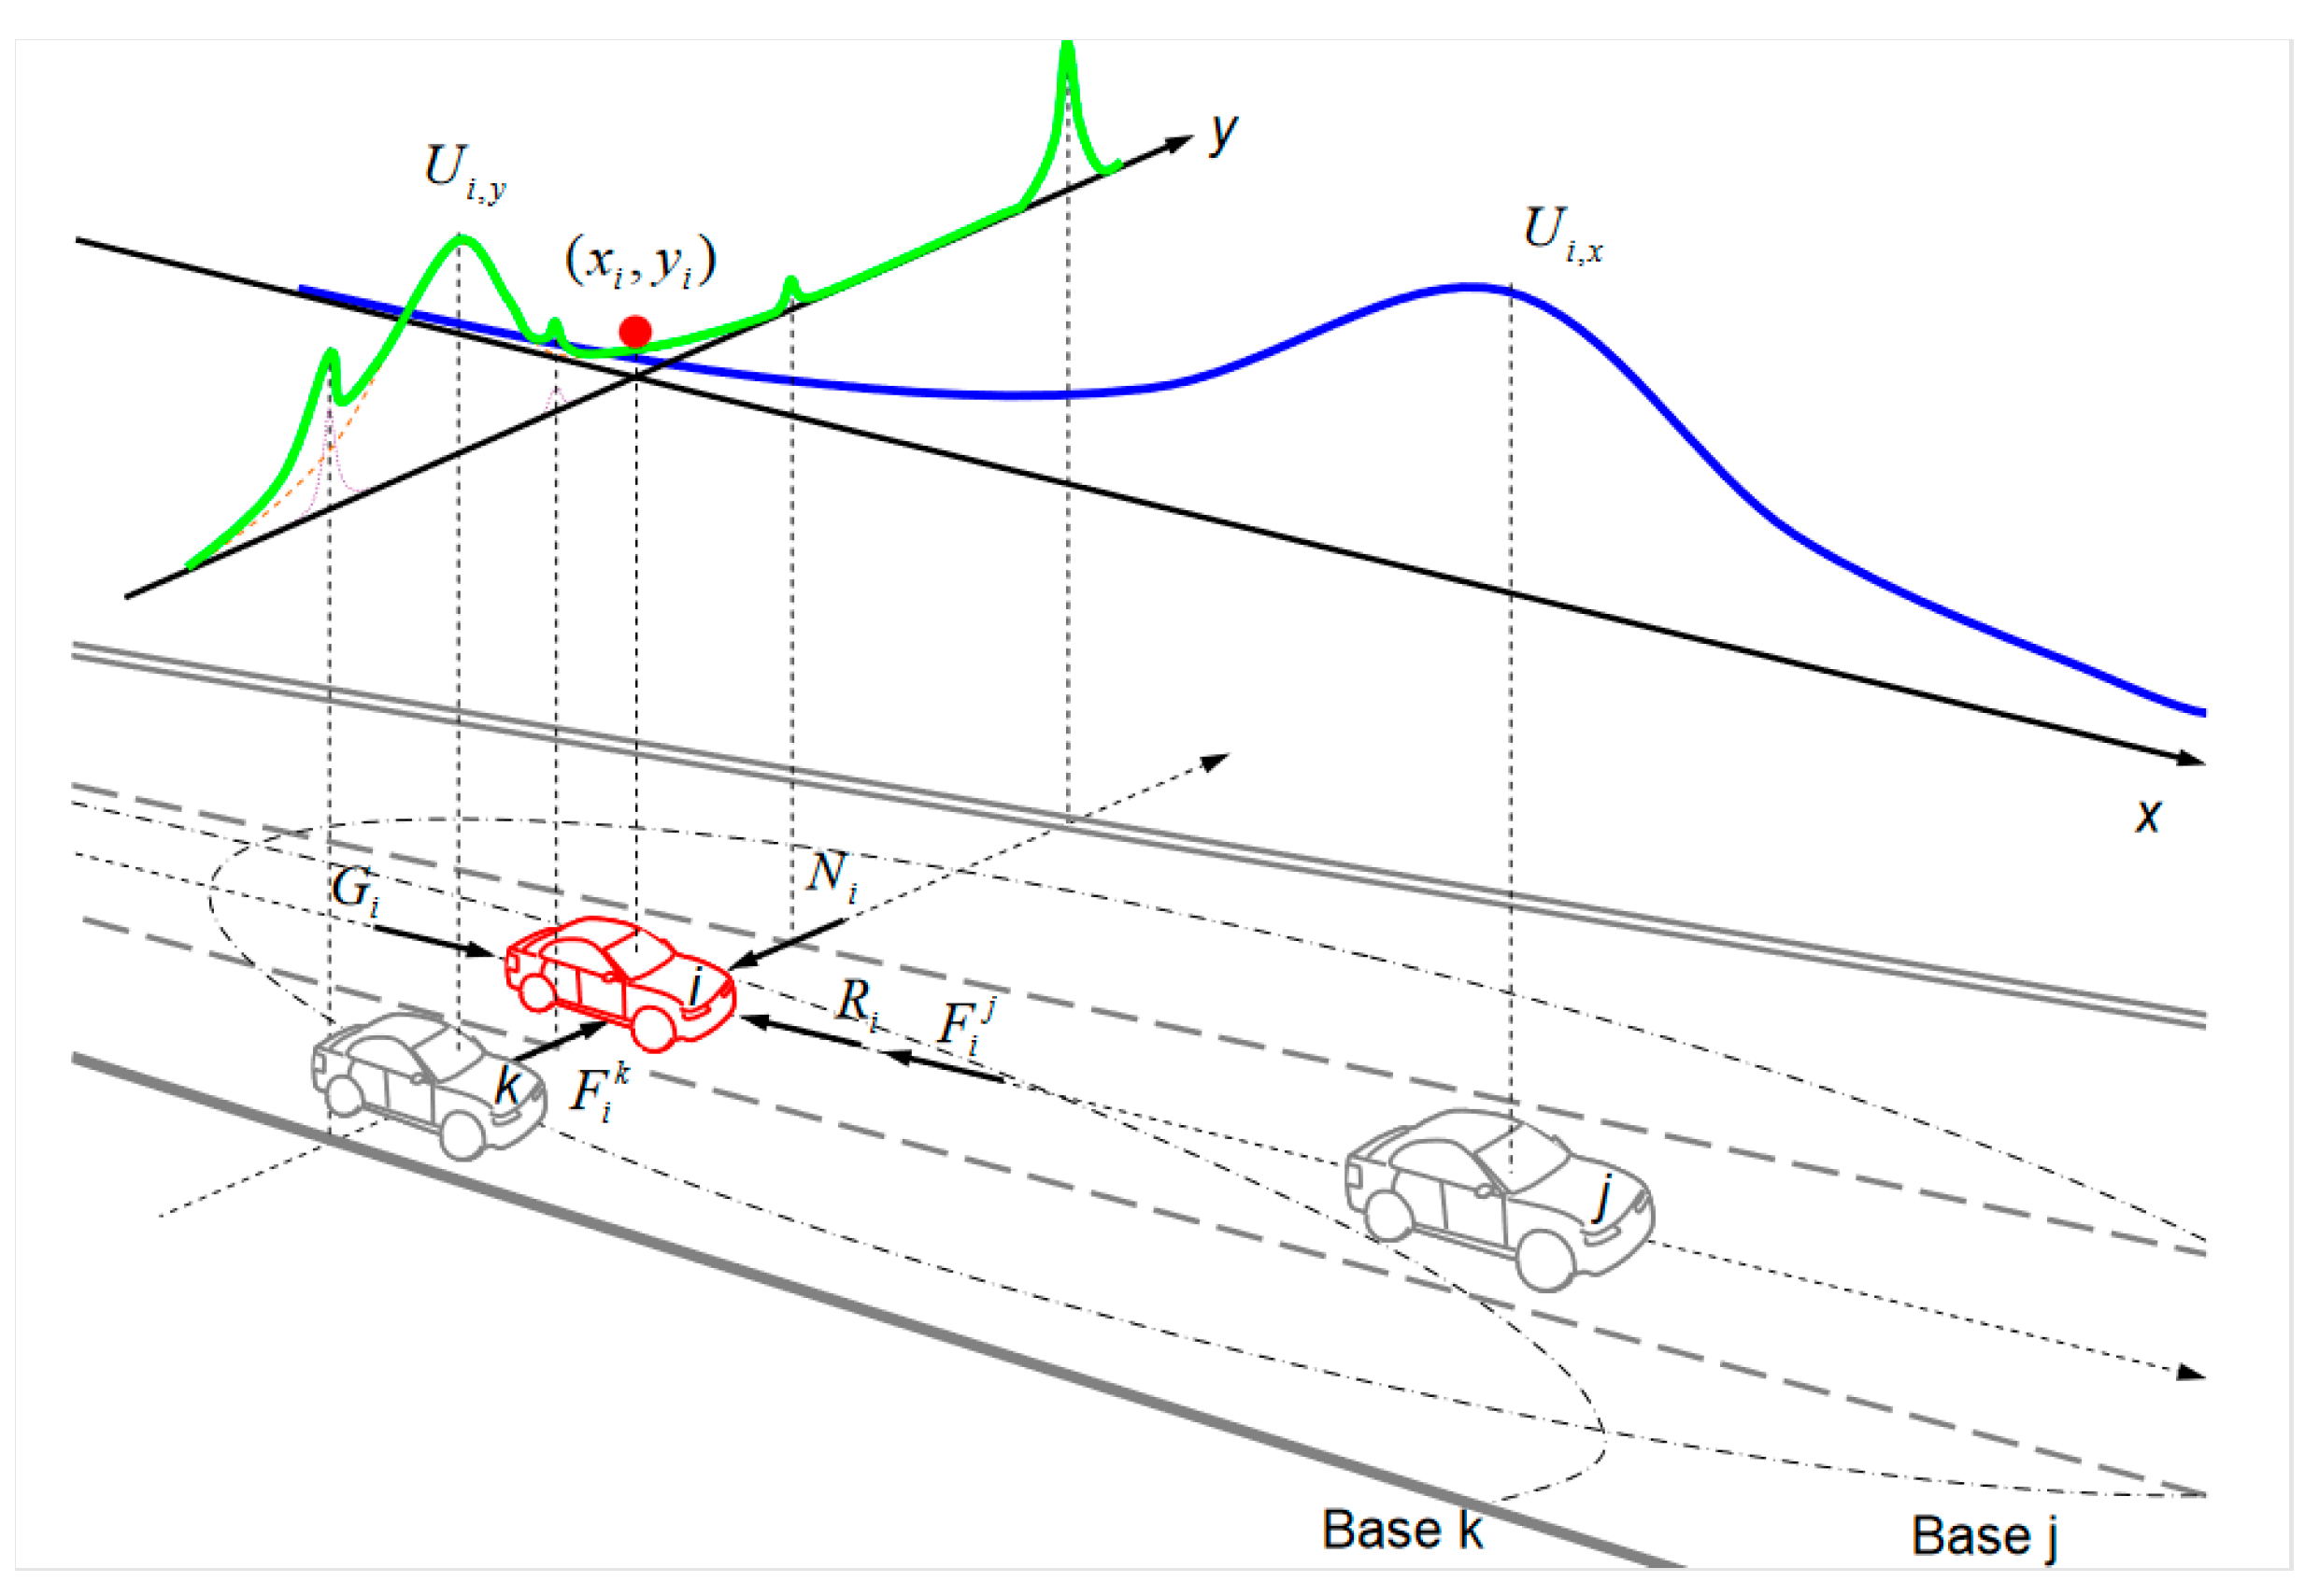
As shown in Figure 2, in the context of roads system, Ni [45] argues that the transportation system is composed of both physical systems and social systems, as it involves biological entities (human drivers) and non-biological objects (roads and vehicles), situated between hard physical laws and soft social rules. Therefore, he proposed the idea of field theory from the perspectives of physics and psychology. The theory transforms the environment perceived by the driver into the psychological force of “avoiding harm”, which is then represented as a virtual field. Since waterway transportation is consistent with road systems in this aspect, this study draws this theory and further considers the differences in ship scale. From the perspective of the give-way ship, a collision risk field for the stand-on ship has been constructed. The essence of this field is a form of psychological pressure exerted by the stand-on ship on the give-way ship, and its range is related to the distance and state of the two ships. When the distance between a ship and an obstacle is less than the minimum safe distance, a collision occurs. From the perspective of field theory, this means that the ship has entered the obstacle’s collision risk field, so the process of collision avoidance involves the give-way ship sailing along the edge of the collision risk field of the stand-on ship.
The vast majority of duty officers prefer to be the give-way ship and take the initiative to avoid collisions. Therefore, field theory is used to construct the collision risk field of the stand-on ship from the perspective of the give-way ship, which aligns with people’s psychological perception. Collision risk radiates outward from the center: the closer to the center, the greater the risk, conversely, the farther from the center, the smaller the risk. In addition, the dynamic risk field is anisotropic, which is specifically manifested in the following two aspects:
(a)
Acceleration exists when the ship is sailing, so the ship will be subject to a wider range of ship collision risk along the direction of speed than in the opposite direction, which is equivalent to the risk of collision extending to the bow orientation.
(b)
In the view of the give-way ship, the direct ship’s bearing towards itself is more dangerous compared to the bearing away itself, which is equivalent to the risk of collision extended to the give-way ship’s bearing.

2.3. Relative Motion Parameters

Figure 3 takes the course of the stand-on ship T C as the coordinate axis to establish a coordinate system, the two-dimensional plane coordinates of the stand-on and give-way ships are ( x 1 , y 1 ), ( x 2 , y 2 ) , respectively, and the true azimuth of the give-way ship relative to the stand-on ship is
T B = a r c t a n x 2 x 1 y 2 y 1 + δ where δ = 0 x 2 x 1 > 0 , y 2 y 1 > 0 π x 2 x 1 > 0 , y 2 y 1 < 0 π x 2 x 1 < 0 , y 2 y 1 < 0 2 π x 2 x 1 < 0 , y 2 y 1 > 0
relative bearing is
α = T B T C , when   α < 0 , α = α + π

3. Modeling Methodology

Due to the rapid development of artificial intelligence, the comprehensive application of unmanned ships in maritime transport has become possible. However, the current COLREGs cannot guide the collision avoidance practices of unmanned ships [46], and full compliance with COLREGs may result in extremely inefficient navigation. Therefore, this research objectively determines the give-way ships according to the principle of minimum cost based on field theory, which not only ensures the coordination of the two ships in avoiding collision, reduces the collision accidents caused by “misjudgment” but also improves the efficiency of navigation.

3.1. Collision Risk Field

3.1.1. Asymmetric Gaussian Functions

Since the dynamic field in this research is anisotropic, the quaternion collision risk field of a stand-on ship from the perspective of a give-way ship is constructed with reference to an asymmetric Gaussian function [47]. Unlike road vehicles, marine ships vary greatly in scale, so the model is constructed by considering the ships’ length and width:
Z = A e ( ( 2 ( x x 1 ) ( 1 + s g n x x 1 ) σ i r + ( 1 s g n ( x x 1 ) ) σ i l W 2 + 2 ( y y 1 ) ( 1 + s g n y y 1 ) σ i f + ( 1 s g n ( y y 1 ) ) σ i b L 2 ) )
where Z refers to the value of the potential energy of the collision risk field, and ( x 1 , y 1 ) are the coordinates of the stand-on ship in the Cartesian coordinate system. A is the height value of the center of the collision risk field, and the formula is
A = 1 2 σ m σ n , m , n l , f , r , f , r , b , l , b
s g n t t 1 = 1 , t t 1 > 0 0 , t t 1 = 0 1 , t t 1 < 0   , w h e r e   t t 1 x x 1 , y y 1
L and W represent the ship’s length and width, respectively, while σ t i represents the impact factor of axis i at moment t . The larger the value of the impact factor, the gentler the collision risk field and the wider the range of impacts.

3.1.2. Impact Factors

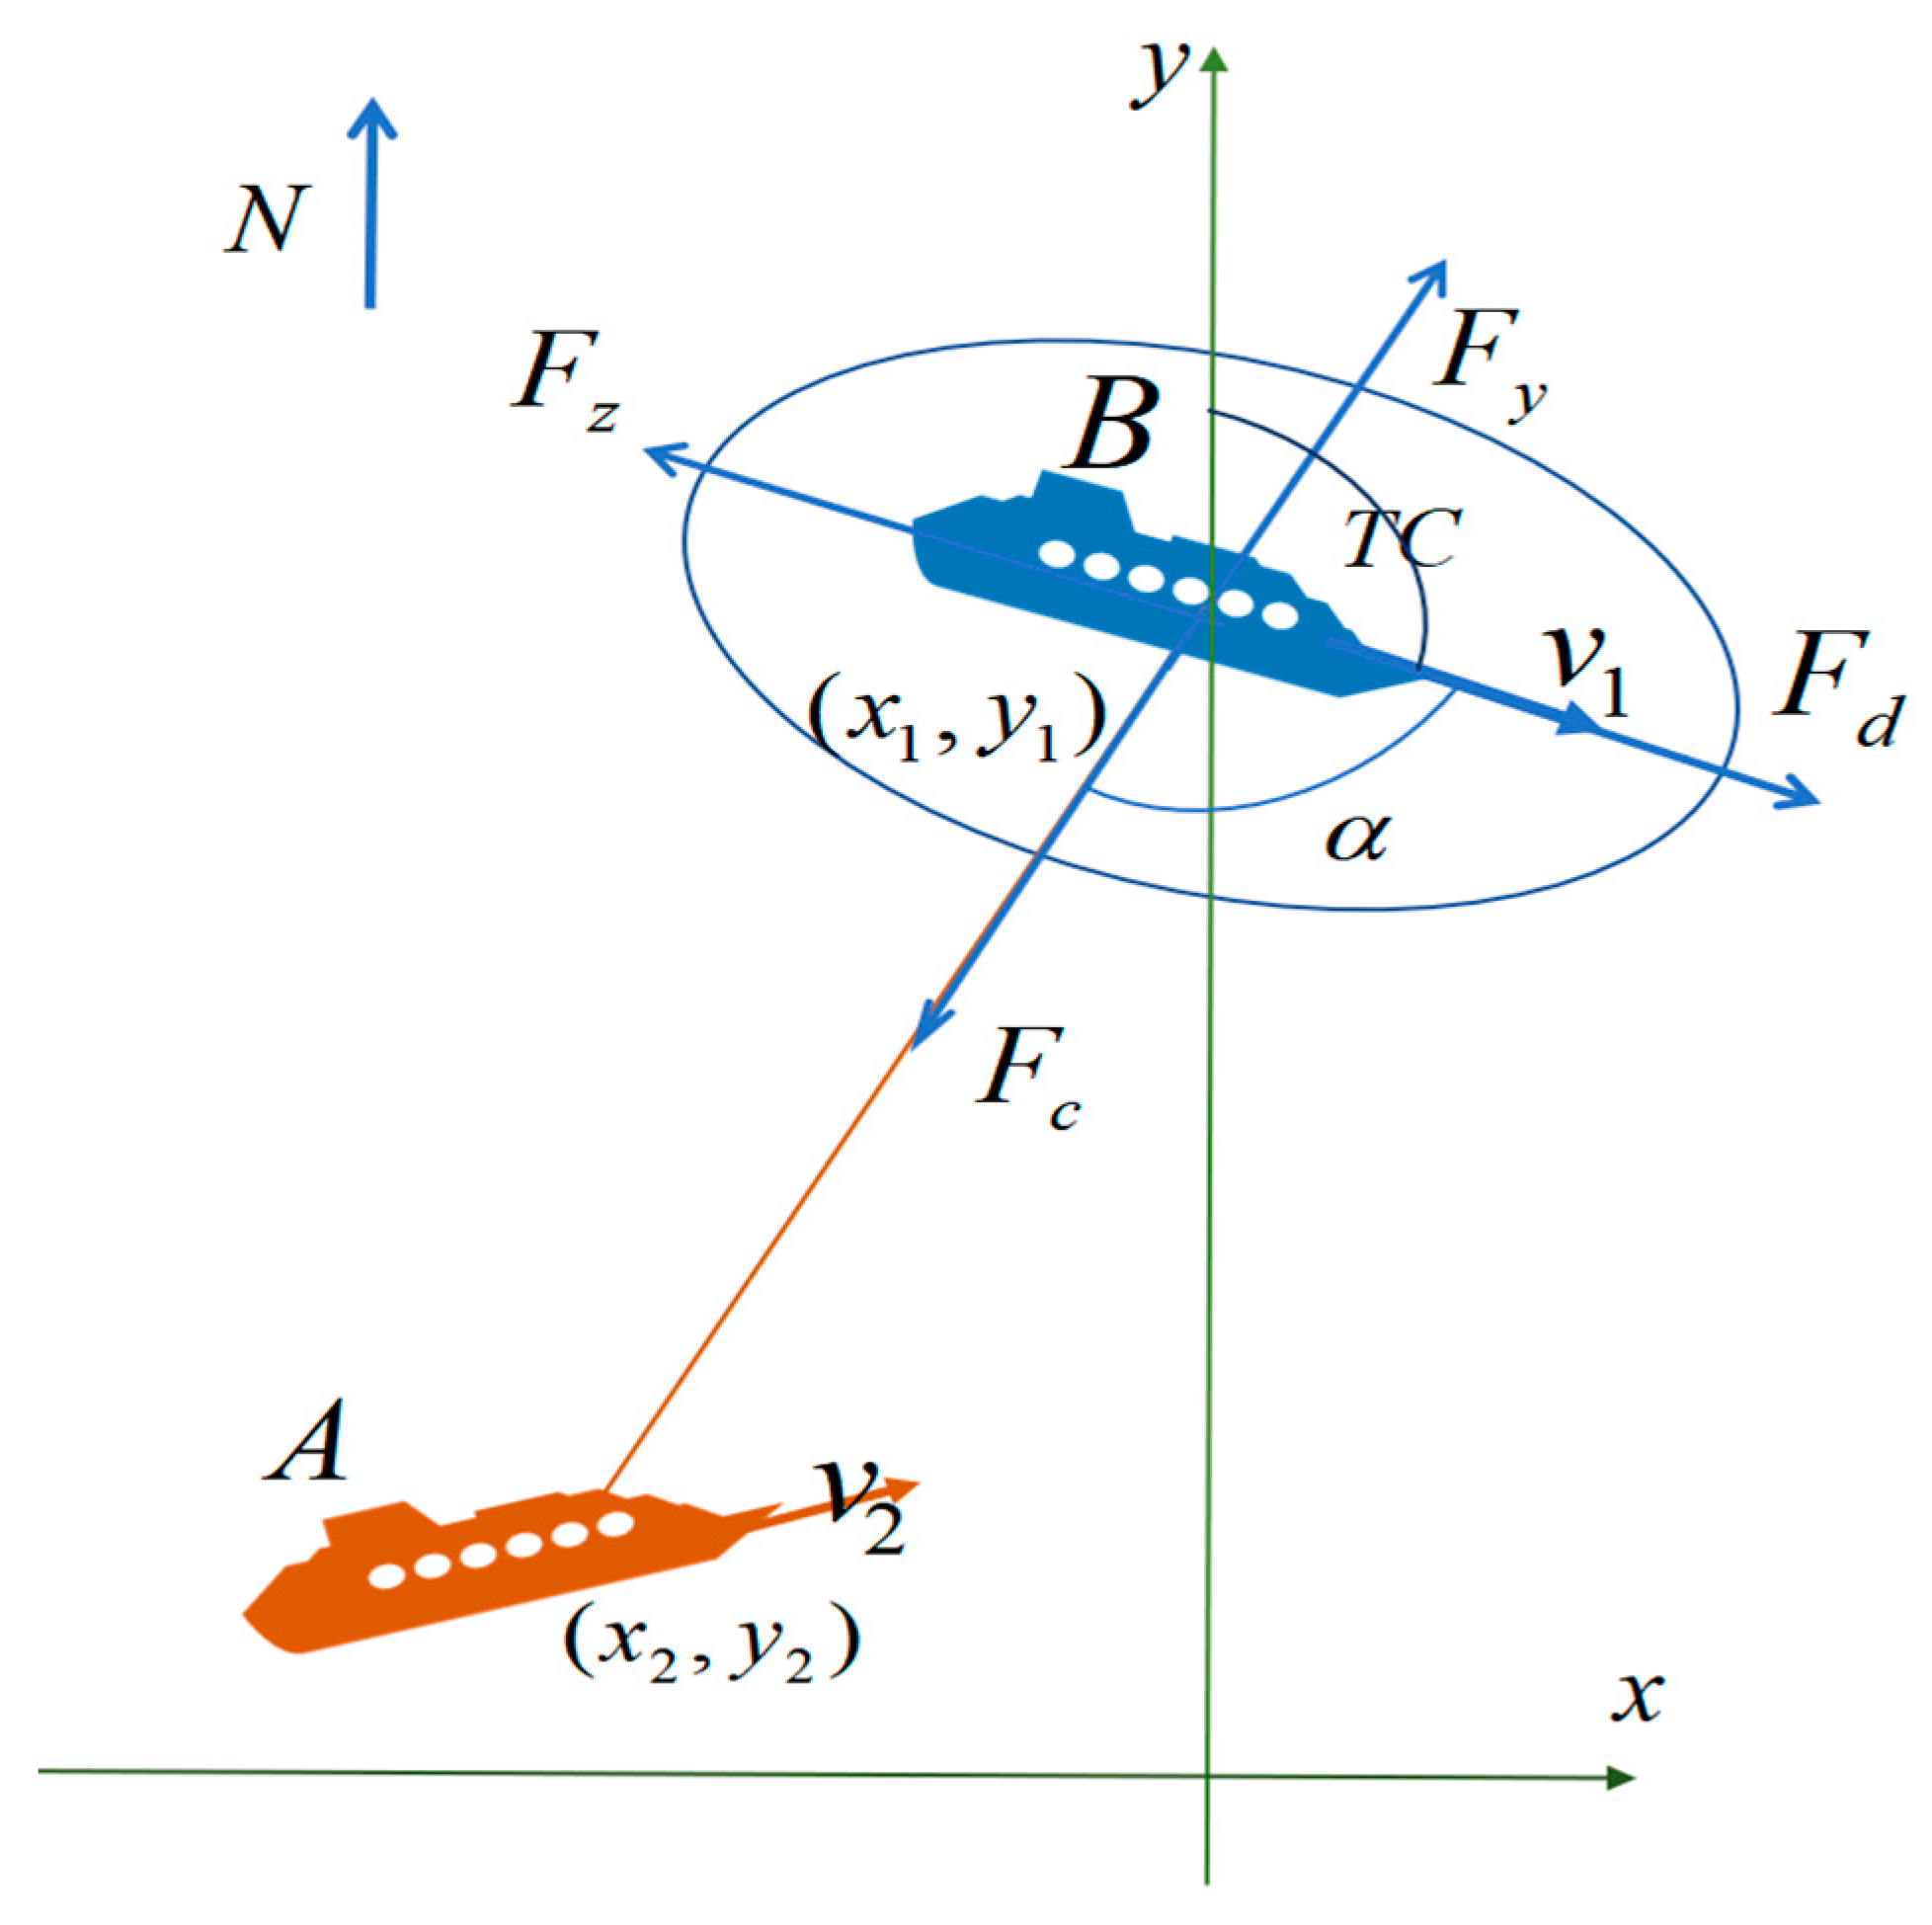
Ni assuming the road is a physical field, the vehicle is subjected to gravity in the forward direction along the road and resistance in the opposite direction [45]. As shown in Figure 4, this research draws on this idea to denote the mentality of accelerating along the direction of the velocity as the motive force:
F d = m 1 g
Its opposite direction is due to traffic rules, ship performance and other constraints, the duty officer of the ship for maneuverability cannot be satisfied with the psychological, expressed as resistance:
F z = m 1 g V v 1 λ
where V = 1 represents the duty officer’s ideal sailing speed, v 1 is the actual speed of the stand-on ship, and λ is the adjustment coefficient.
In addition, in the view of the give-way ship, the space in which a stand-on ship towards itself is more dangerous than deviating from its bearing, so the psychological force towards the give-way ship is defined as a repulsive force, referencing the law of universal gravitational force that is also always present in any object with mass:
F c = k m 1 m 2 r 2
r = x 2 x 1 2 + y 2 y 1 2
where r is the distance between the two ships, k is the adjustment coefficient.
The give-way ship always prefers the stand-on ship to be farther away, so the force deviating from the give-way ship’s bearing is defined as gravitational force:
F y = m 2 v 2 2 r
According to the relative azimuth of the give-way ship with respect to the stand-on ship, these four psychological forces are decomposed onto a coordinate system established with the stand-on ship’s course as the coordinate axis. The influence factors on the coordinate axes are then obtained. The steps are as follows:
  • The four psychological forces ( F d , F z , F c , F y ) are decomposed according to the relative azimuthal α   into a coordinate system built with the course of the stand-on ship as the coordinate axis:
    F f = F y cos π α     F r = F c sin π α F b = F c cos π α     F l = F y sin π α  
  • According to the decomposed psychological forces to get the impact factor corresponding to the axis, the larger the impact factor, the wider the range of collision risk.
    σ f = F d + F f / 10,000     σ r = F r / 10,000 σ b = F z + F b / 10,000     σ l = F l / 10,000
  • The minimum encounter distance between the two ships in the AIS data is calculated according to Equation (10), which is combined with the parameters in the least square method calibration as λ = 2 , k = 0.0027 .
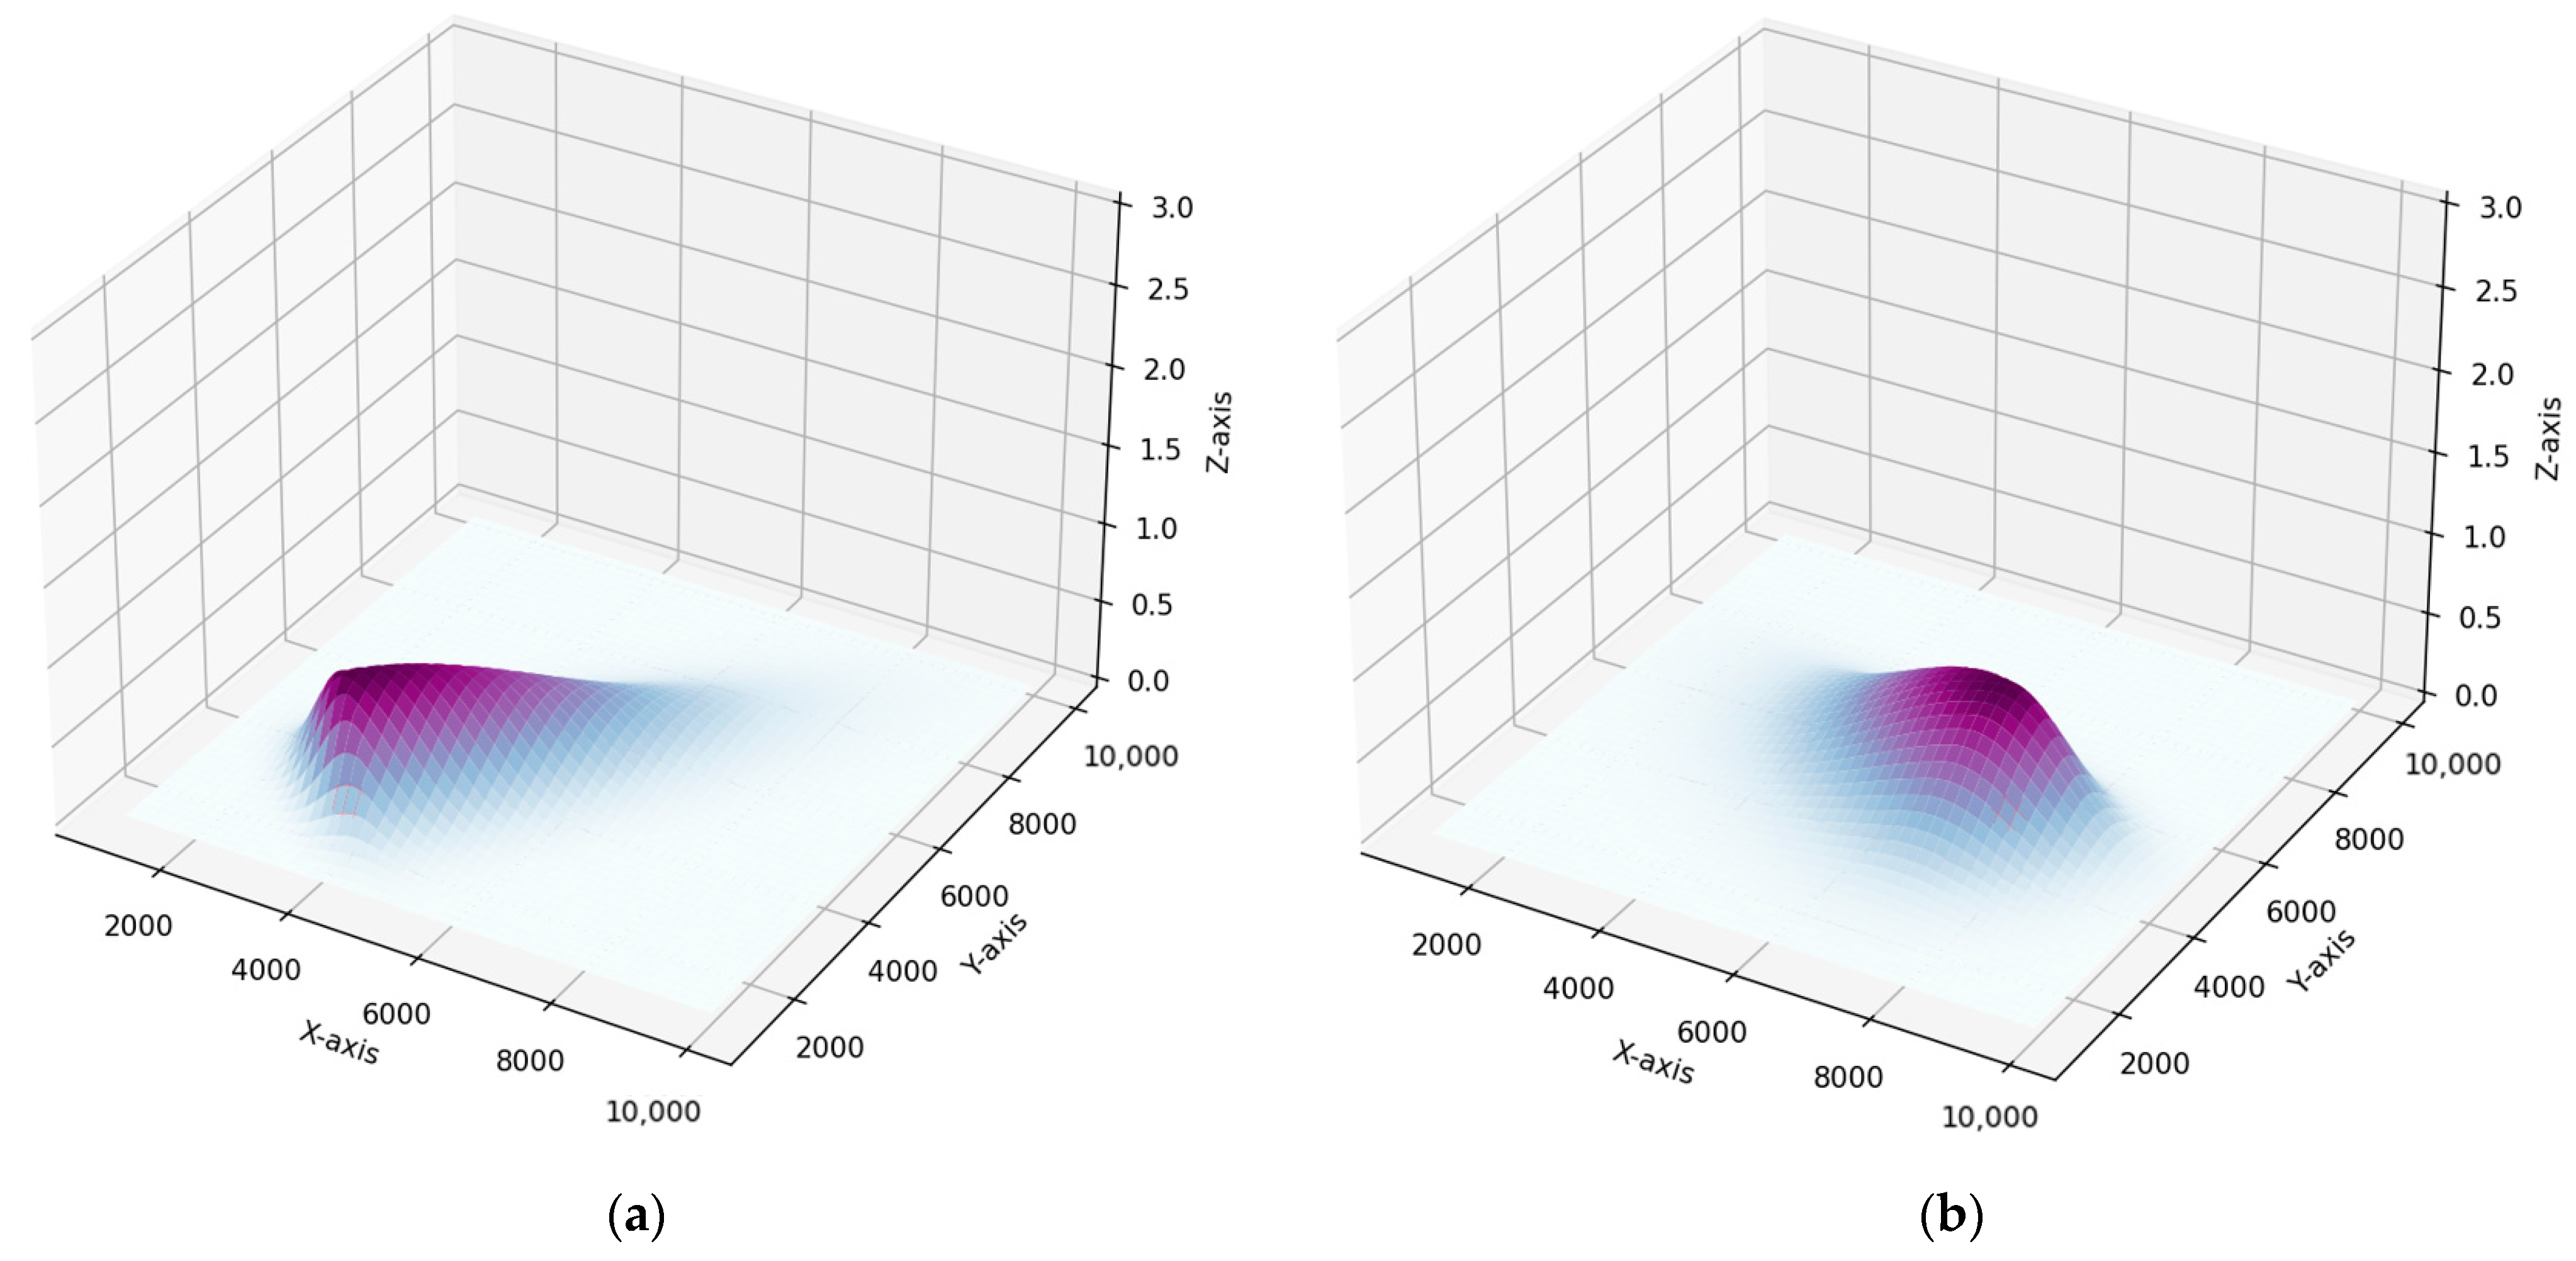
A schematic diagram of the three-dimensional ship collision risk field as shown in Figure 5a. The brighter yellow part represents the infinity of the collision risk and spreads out to all sides, the blue part of the horizontal plane represents the absence of the collision risk, and Figure 5b is the top view of Figure 5a. it can be seen that the risk ranges differ in different spaces. The collision risk ranges are wider in the sailing direction (top) and the obstacle direction (lower left).

3.2. Cost Function

The cost function is constructed based on the quaternion collision risk field, taking into account the comfort of path traveling and the global path-keeping ability, the trajectory offset cost function f s expresses the global path-keeping ability, while the navigation comfort is expressed as the path smoothness cost function f r u . The weighted multi-objective cost function is expressed as
F τ = ω s f s τ + ω r u f r u τ
In Equation (13): F τ denotes the value of the cost value of the path τ , and ω s , ω r u are the weight coefficients of each cost function, respectively.
f s τ = l s l j l s
f r u τ = 0 T θ
0 T θ = a r c t a n x 2 t x 2 0 y 2 t y 2 0 T r
where l s represents the actual avoidance path, l j represents the planned sailing path and T r is the give-way ship’s course, reference Chen [48] setting ω r u = 0.75 , ω s = 0.25 .
It is important to note that, during collision avoidance maneuvers, course changes are easier and faster to perform than speed changes, and should only be slowed down when necessary [49], therefore, the loss of speed change is not considered in this study. Course changes less than 15° also may be misguided or may not completely avoid collision risk, and course changes greater than 60 ° are inefficient, so rudder angle changes in the range of θ ( 15 ° ,   60 ° ) are appropriate.
The safety of the ship in collision avoidance is the primary consideration, this research is based on the actual AIS data of the two ships’ distance to the closest point of approach to calibrate the risk impact range, so the give-way ship in the avoidance cannot infringe on the danger field of the stand-on ship, once invasion, then the risk of collision is not bearable. At the same time, the give-way ship should take efficient avoidance measures, so calculate the path cost of letting the give-way ship avoid along the edge of the collision risk field.
Based on the constructed quaternionic dynamic collision risk field, a system of equations to solve the cost function was established.
z i j = 1 2 σ i σ j e x x 1 σ i W 2 + y y 1 σ j L 2 y = μ x μ x 2 + y 2
where ( i , j ) ( ( l , f ) , ( r , f ) , ( r , b ) , ( l , b ) ) , solve for
A Δ = 1 W 2 σ i 2 + μ 2 L 2 σ j 2
Β Δ = 2 μ y 2 L 2 σ j 2 2 x 1 W 2 σ i 2 2 μ 2 x 2 L 2 σ j 2 2 μ y 1 L 2 σ j 2
C Δ = 4.4 + x 1 2 W 2 σ i 2 + μ 2 x 2 2 + 2 μ x 2 y 1 2 μ x 2 y 2 + y 1 2 2 y 1 y 2 + y 2 2 L 2 σ j 2
According to B 2 4 A B = 0 , the value of μ is solved to further obtain the tangent points of the collision risk field and avoidance path at that moment. Note that it is necessary to determine whether these tangent point values are located on the quaternionic collision risk field, if they do retain the tangent points to derive the final tangent point values. Subsequently, the trajectory offset cost and course deviation cost are calculated based on the constructed cost function.

4. Experimental Analysis

4.1. Experiment Presentation

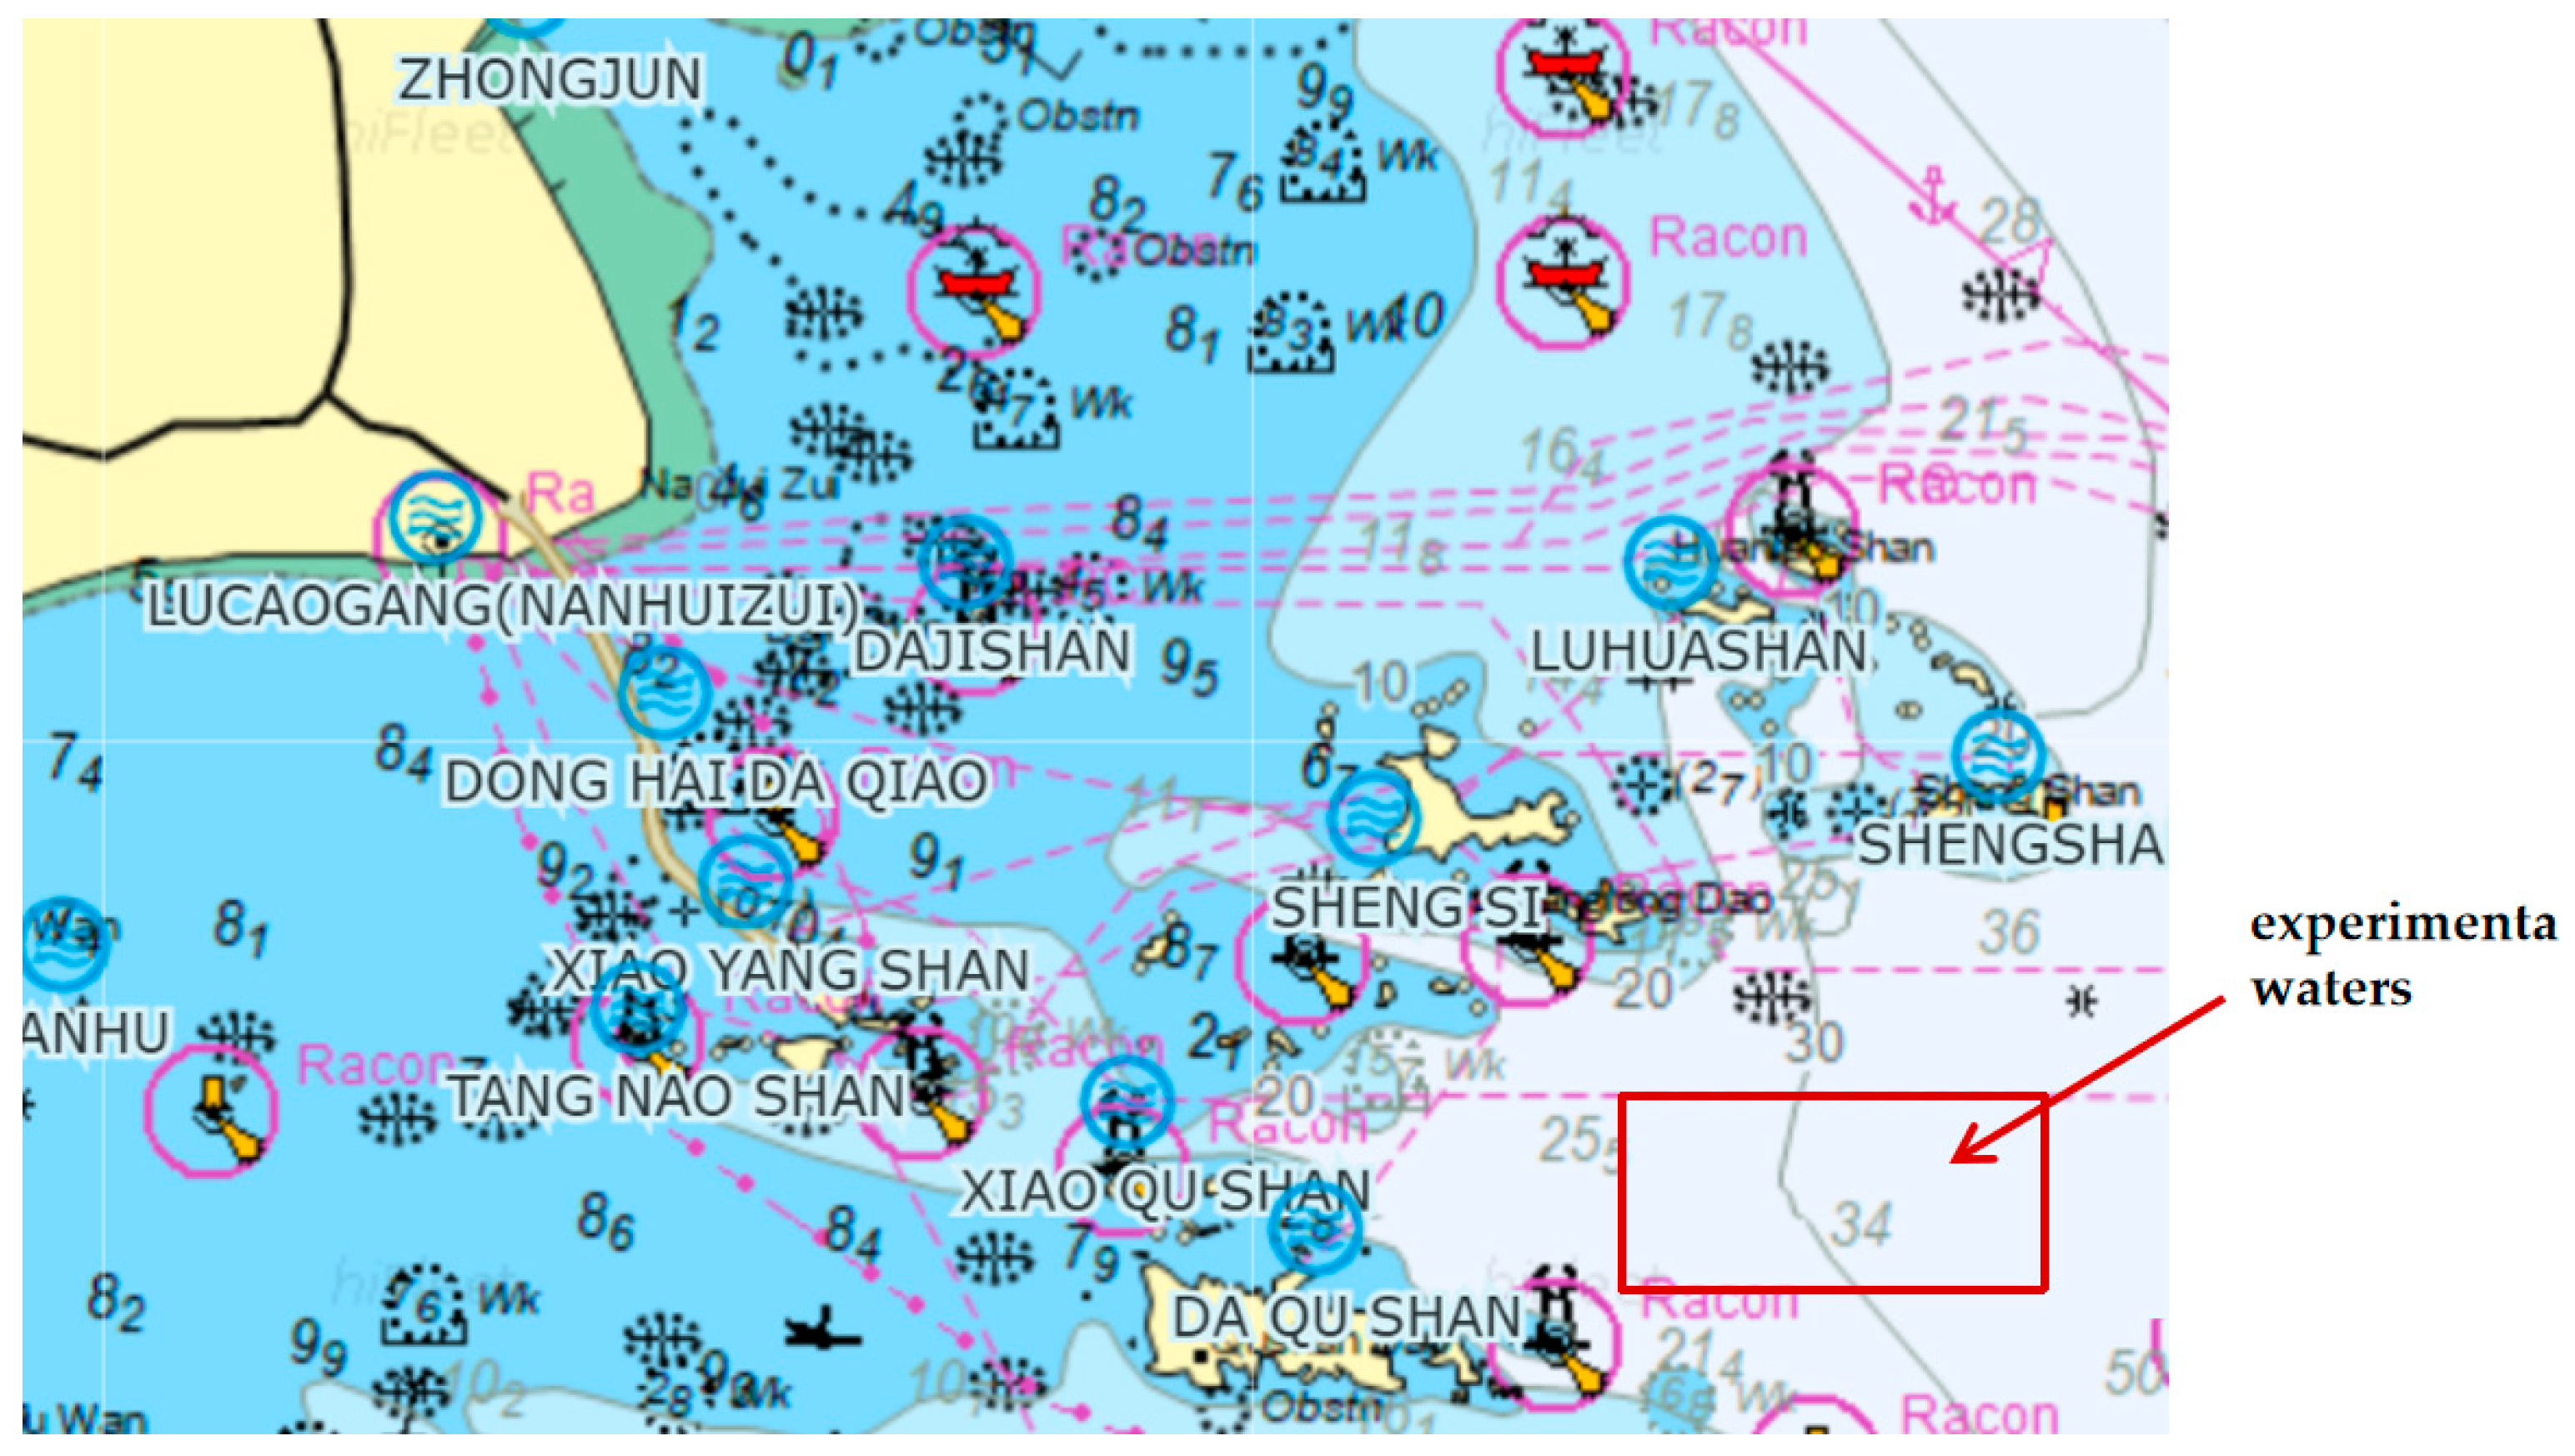
In waterways such as intersections and warning areas, navigation is characterized by complex conditions and numerous crossing and overtaking situations. However, the high ship density and numerous obstructions introduce excessive interference, which complicates the study of collision avoidance for individual ship encounters. Therefore, this study selects the open waters near Zhoushan’s Shulanghu Island as the experimental area, with the specific location shown in Figure 6.
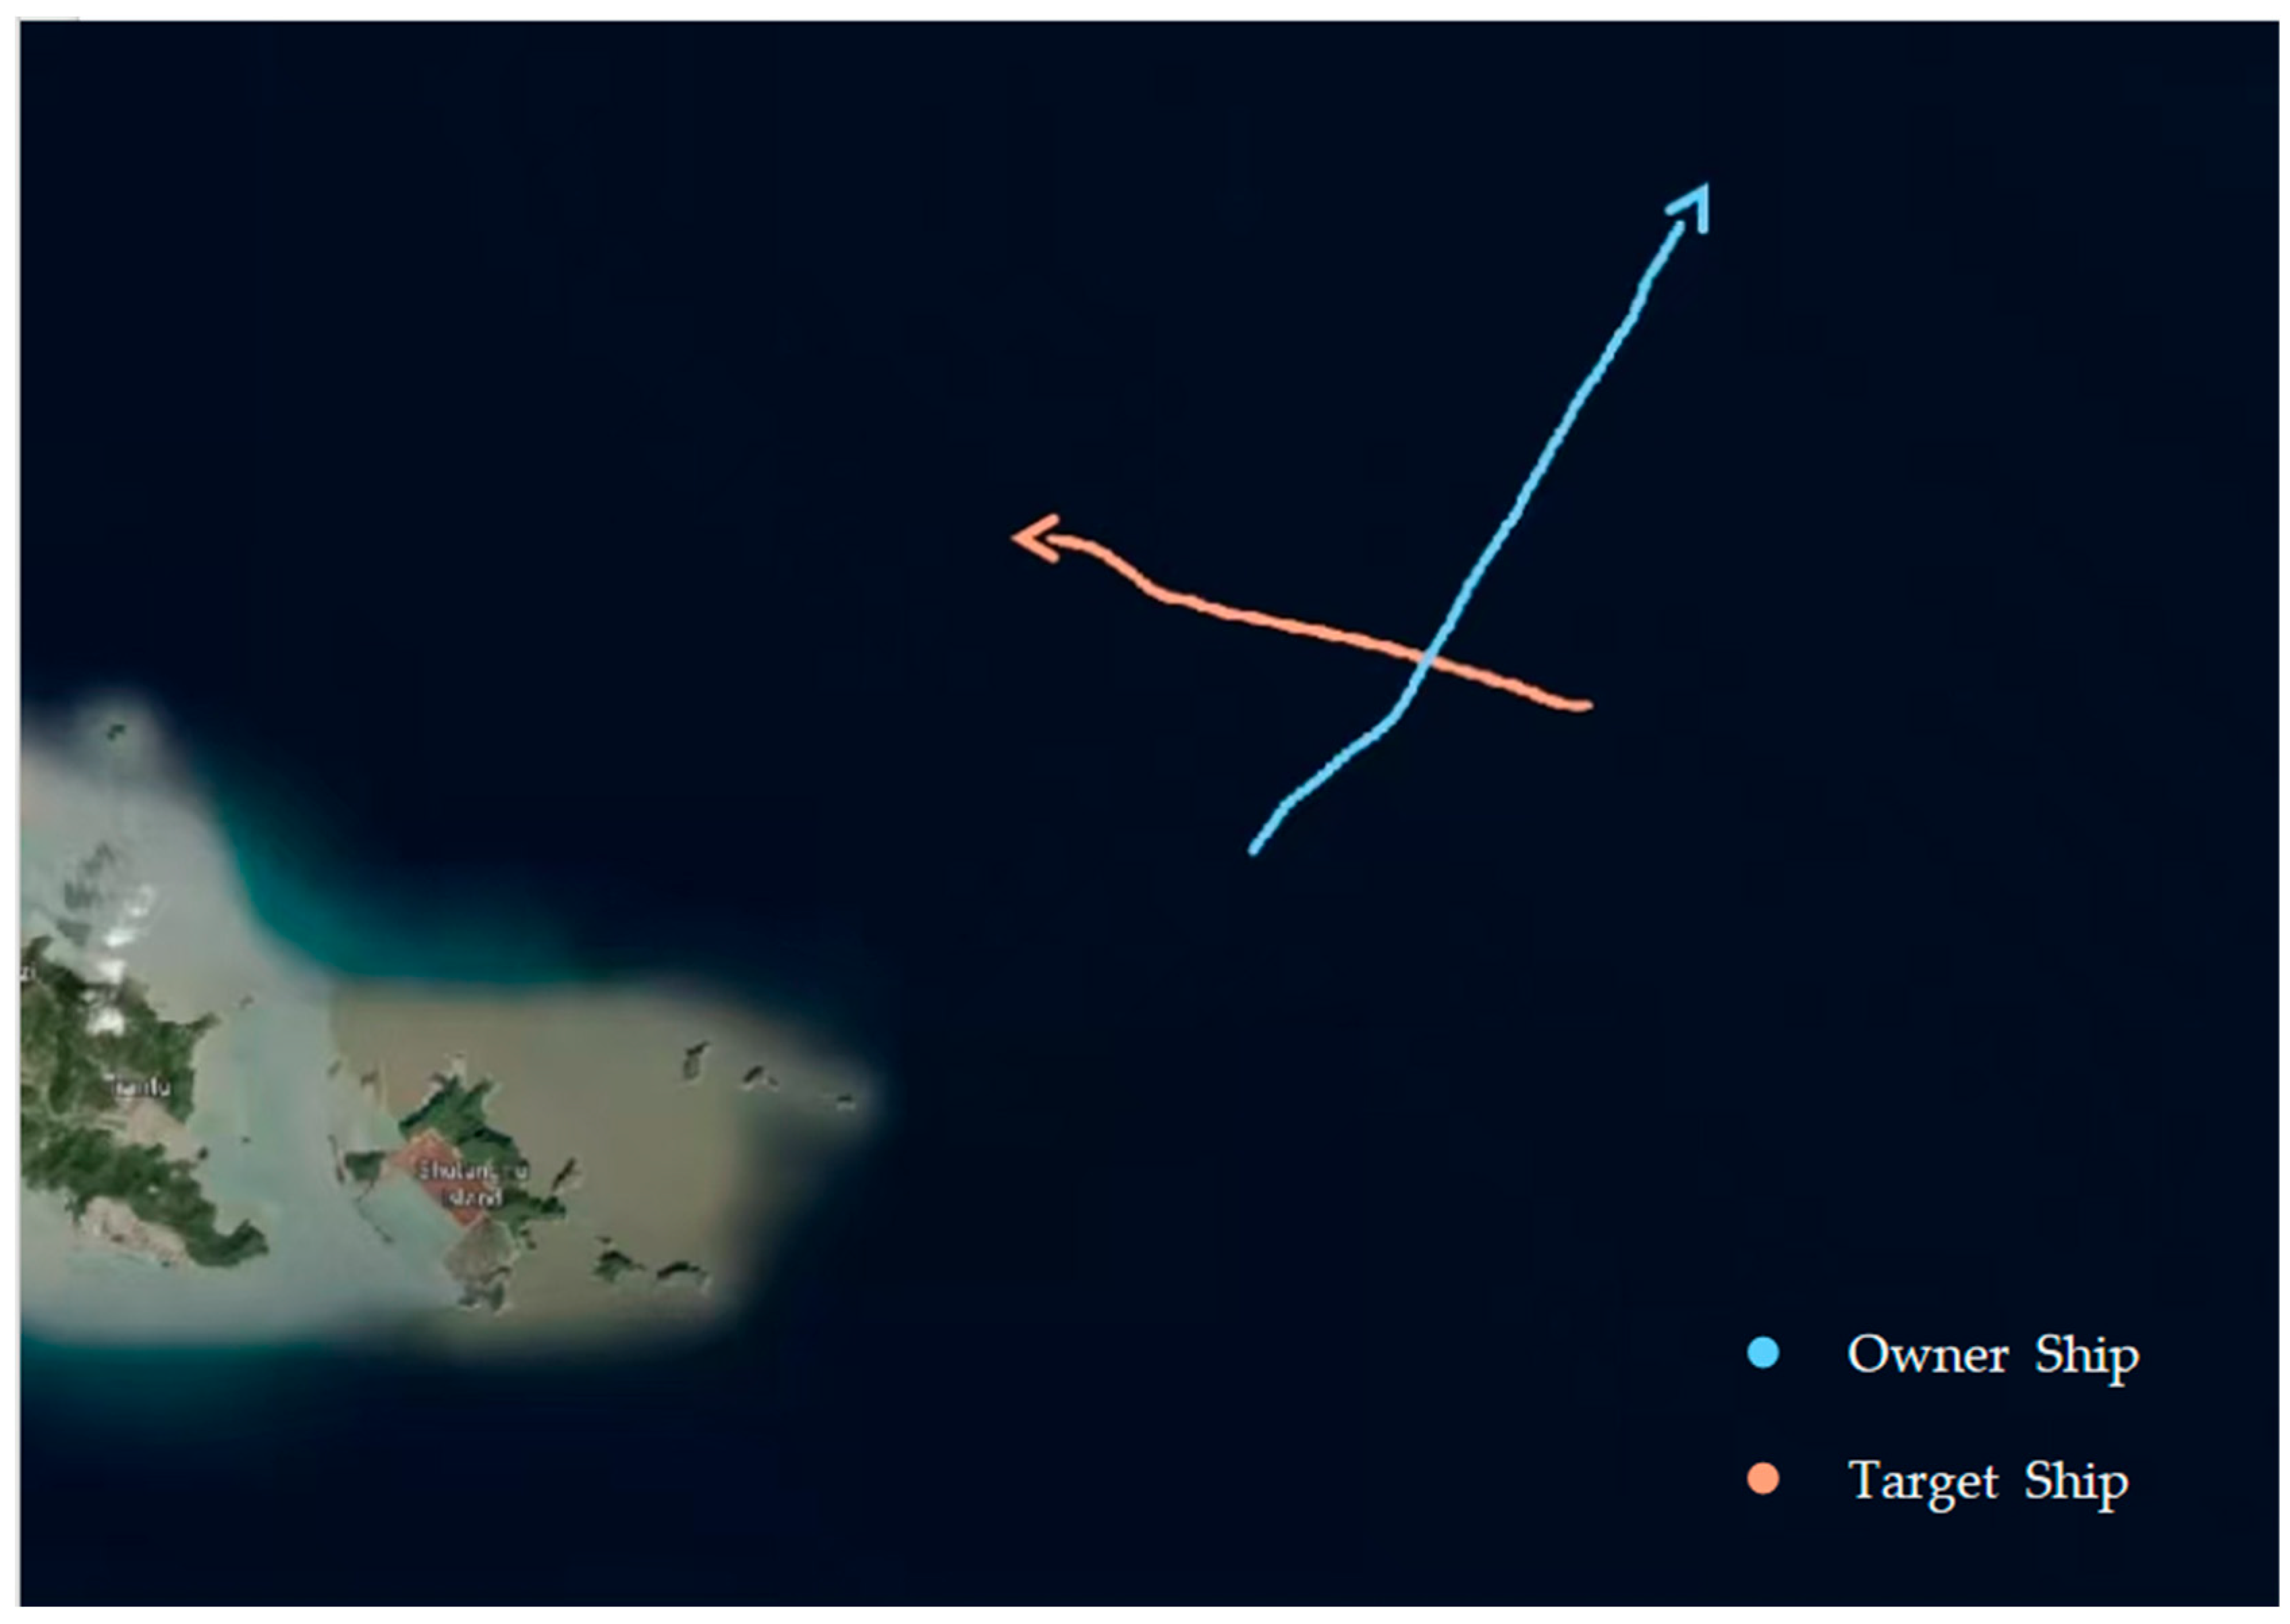
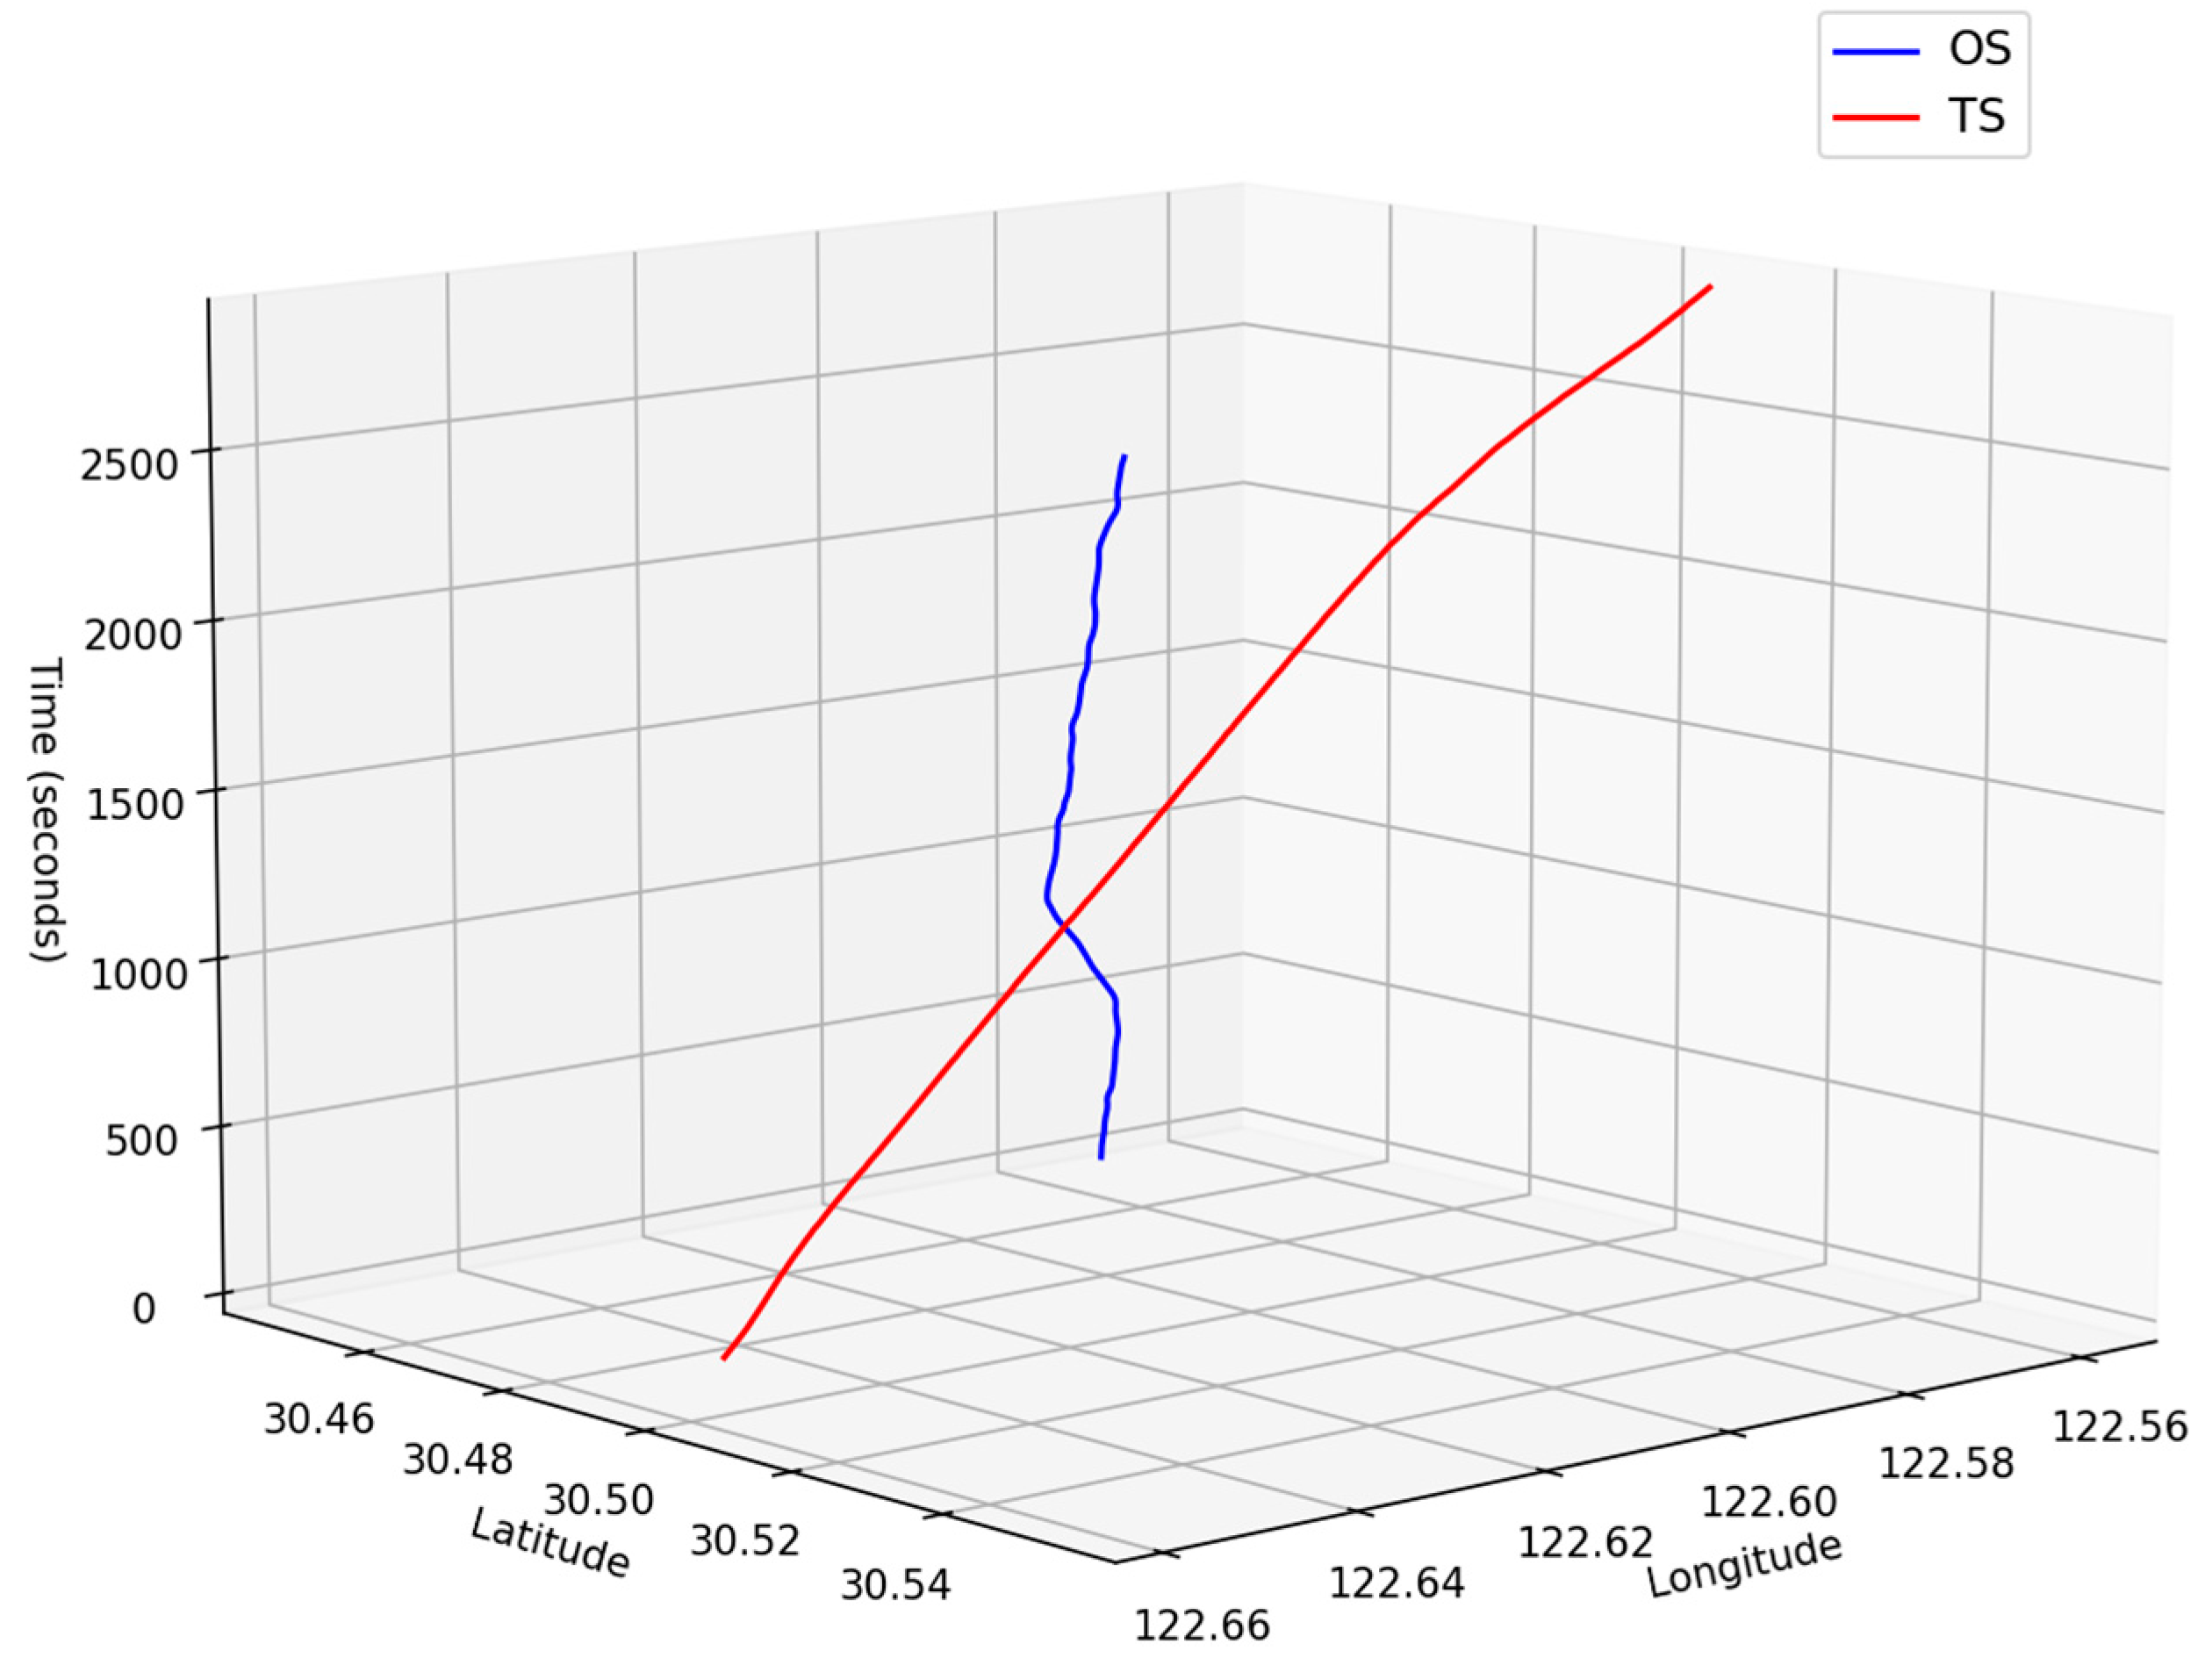
Combining the AIS data of January 2021, the time is converted into seconds uniformly, and the start time is set to zero on the 1st of the month, to filter the ship dataset information for the same time. In this area, the latitude, longitude, and course of the OS (MMSI: 412750950) are (122.58889 E, 30.467489 N) and 33.8147°, respectively, while those of the TS (MMSI: 477726100) are (122.633877 E, 30.490872 N) and 292.6°, forming a crossing encounter situation. The information for both ships is shown in Table 1, and their overall trajectories are depicted in Figure 7.
The 3 D space–time trajectory diagram of the two ships at the same time is created by interpolating the AIS data at 15-s intervals using the cubic spline method, as shown in Figure 8.
Constructing the collision risk field of the stand-on ship:
Perspective 1. 
Assuming that TS is the give-way ship, construct the collision risk field of the stand-on ship OS in the perspective of TS.
Perspective 2. 
Assuming that OS is the give-way ship, construct the collision risk field of the stand-on ship TS in the perspective of OS.
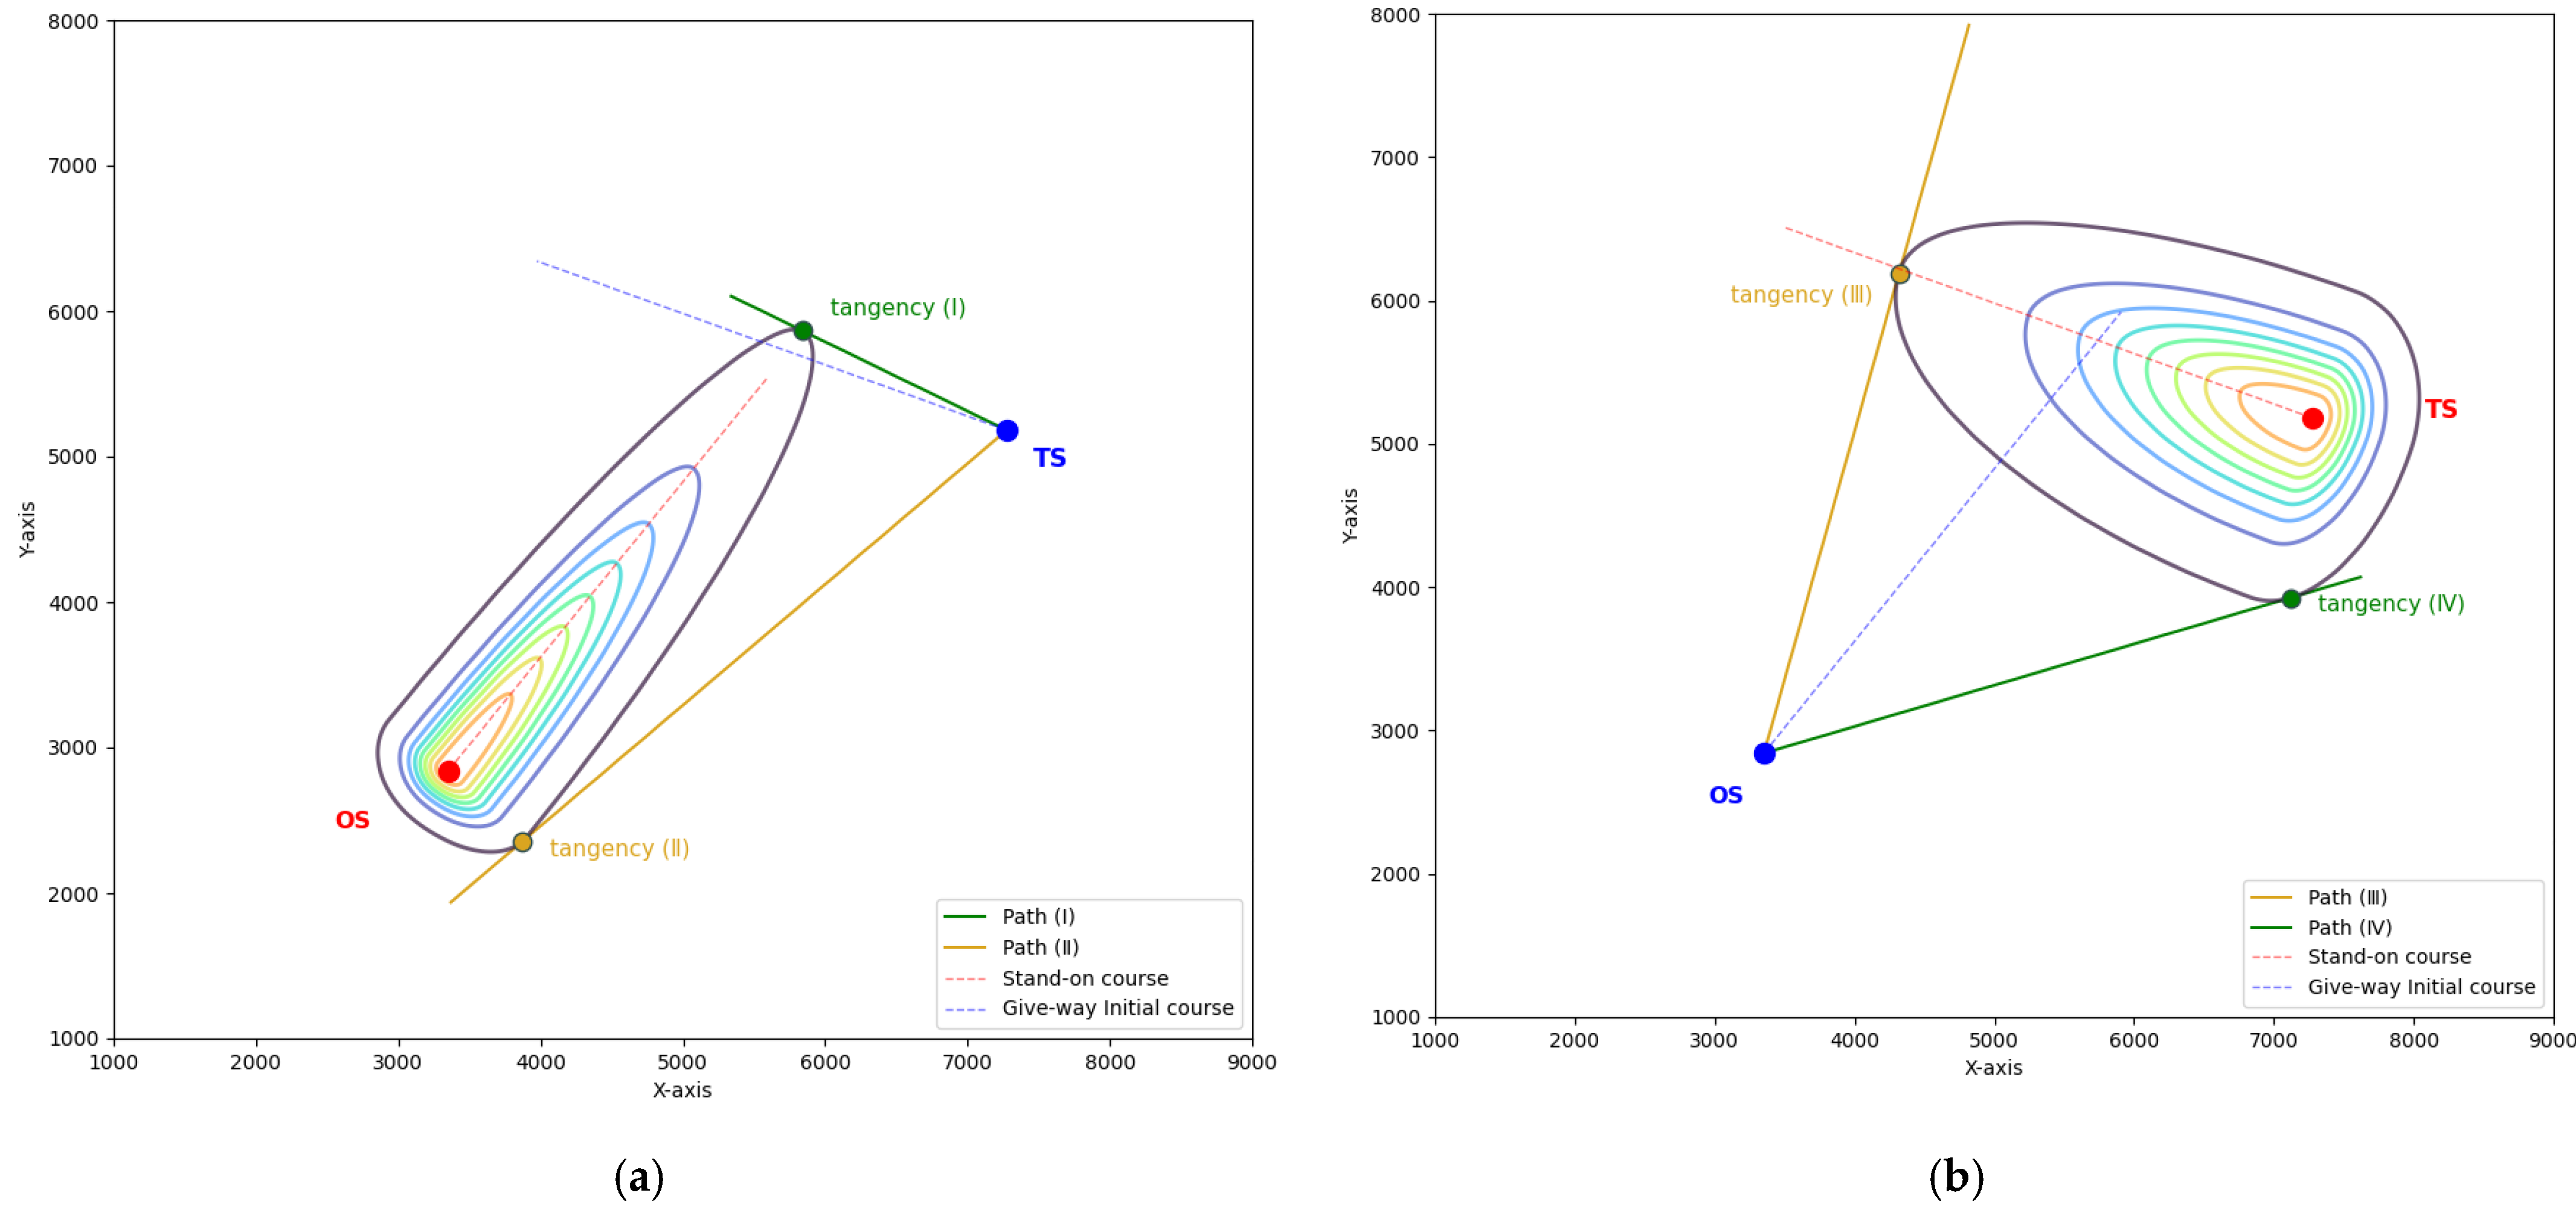
Since OS’s speed is nearly twice that of TS, the collision risk area in the direction of OS’s motion is larger than that of TS. Additionally, OS has a length of 140 m, while TS measures 292 m in length and has a displacement 4.5 times greater than OS. As a result, TS, due to its enormous physical presence, exerts greater psychological pressure on the give-way ship, further increasing the collision risk field created by TS during navigation. The deepest point in Figure 9 represents the coordinate position of the stand-on ship, and the lighter the color represents the farther away from the position of the stand-on ship. From Figure 9 and Figure 10, it can be observed that TS has a larger and more rounded overall collision risk area, whereas OS’s collision risk area is relatively narrow and sharp, which is consistent with people’s psychological perceptions.
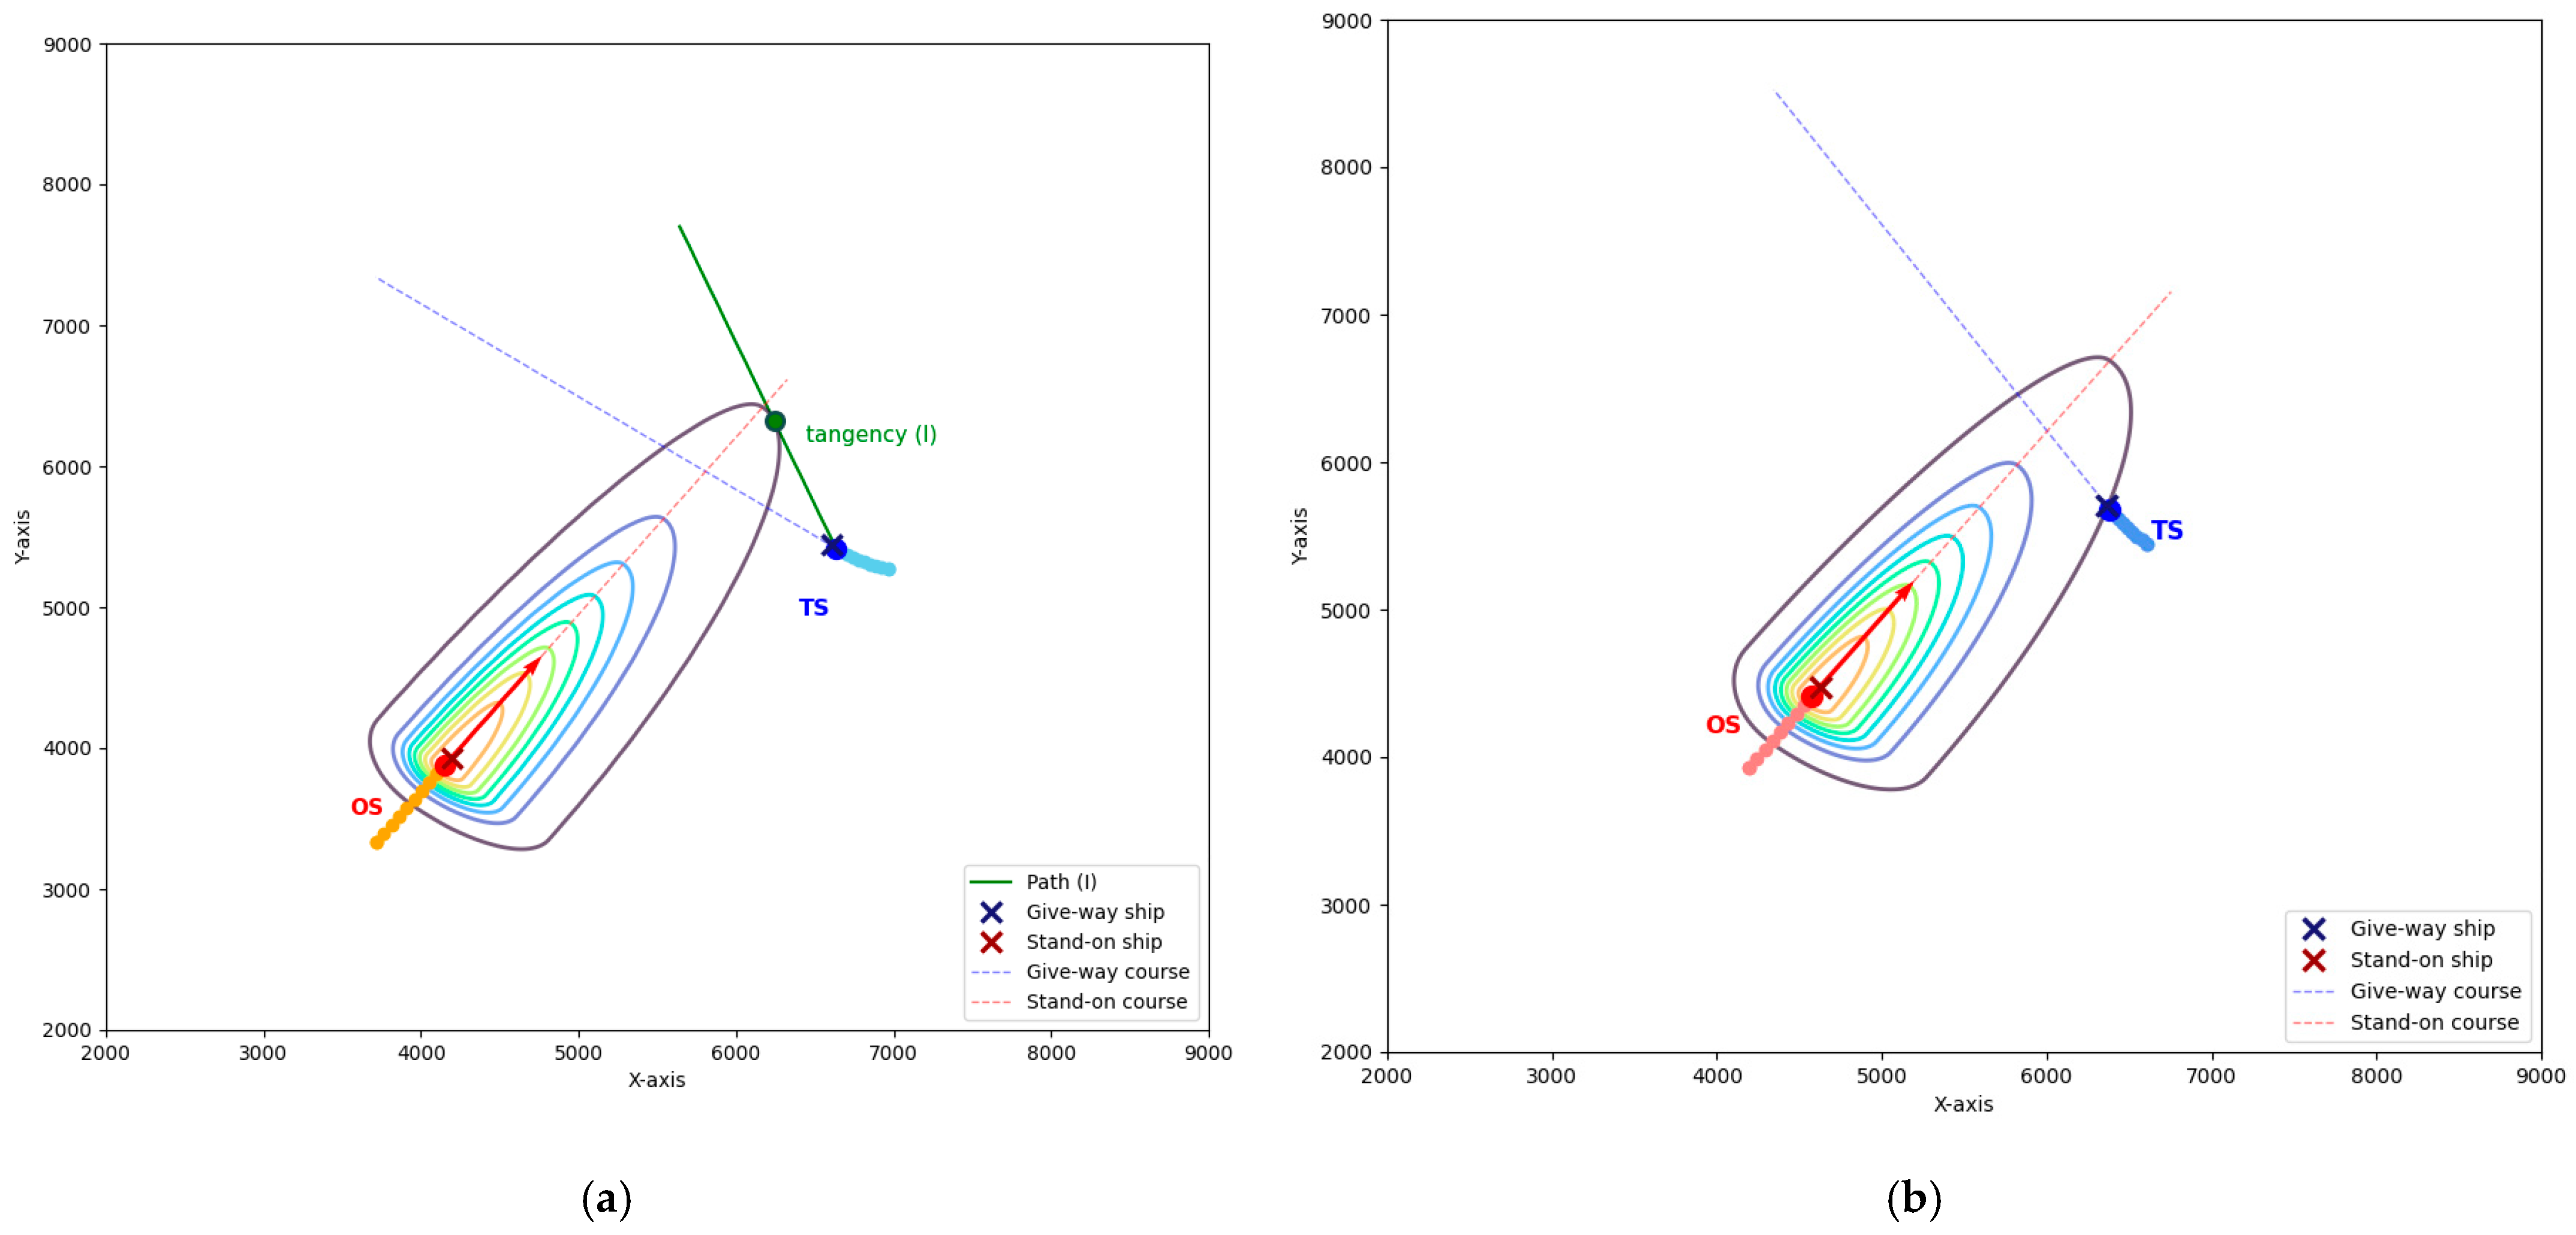
Generally, when two ships encounter each other in a crossing situation in open waters, the give-way ship can either alter its course to pass behind the other ship or choose to cross ahead, thus avoiding the risk of collision. In Figure 10, points OS and TS represent the initial positions at moment t 0 , before the collision avoidance maneuver. The blue “×” represents the ship acting as the give-way ship in the next moment, fulfilling the obligation to make a large and early change in course to give ample clearance to the other ship. The red “×” indicates the ship acting as the stand-on ship in the next moment, fulfilling the obligation to maintain speed and course.
The data points are predicted in real-time at 15-s intervals, and the collision risk field of the stand-on ship is dynamically changed according to the distance and status information of the two ships in real-time. In Figure 11, Figure 12, Figure 13 and Figure 14, each set of the colored data points corresponds to different periods.
In Perspective 1, the TS is the give-way ship, and the large inertia generated by its huge size and displacement leads to sluggish steering response, small angular velocity of turning head, and poor rudder efficiency when sailing at low speed. As shown in Figure 11, when the TS turns right and passes the bow of the OS, a larger angle crossing situation is created. Although the relative speed is lower, the crossing time is relatively short, resulting in a narrow avoidance window. The give-way ship reaches the edge of the stand-on ship’s collision risk field in just 300 s from moment t 0 , making the maneuvering difficult. At moment t 2 I , the two ships are still in a large-angle crossing situation with a relatively small distance between them. Given that the collision risk field is inviolable, it can be anticipated that a collision will occur shortly. Even if a collision does not happen, the give-way ship’s duty officer would be under immense pressure and would incur substantial costs to avoid it, making the cost of Path I extremely high.
In the case of Path II, the TS steers to the left, converting the large-angle cross encounter for avoidance as shown in Figure 12. After 225 s, at moment t 1 II , the courses of the two ships are still crossing but at a reduced angle. Continuing to sail along the tangent direction of the collision risk field of the stand-on ship for 390 s, the give-way ship reaches time t 2 II , where it is positioned at the edge of the collision risk field, navigating away from the stand-on ship’s stern. After 510 s, at moment t 3 II , the courses of the two ships are nearly opposite, and the collision risk has disappeared. This Path deviates by 63.54° from the initial course. Although the relative speed is higher, the give-way ship has more opportunities and time to take collision avoidance action.
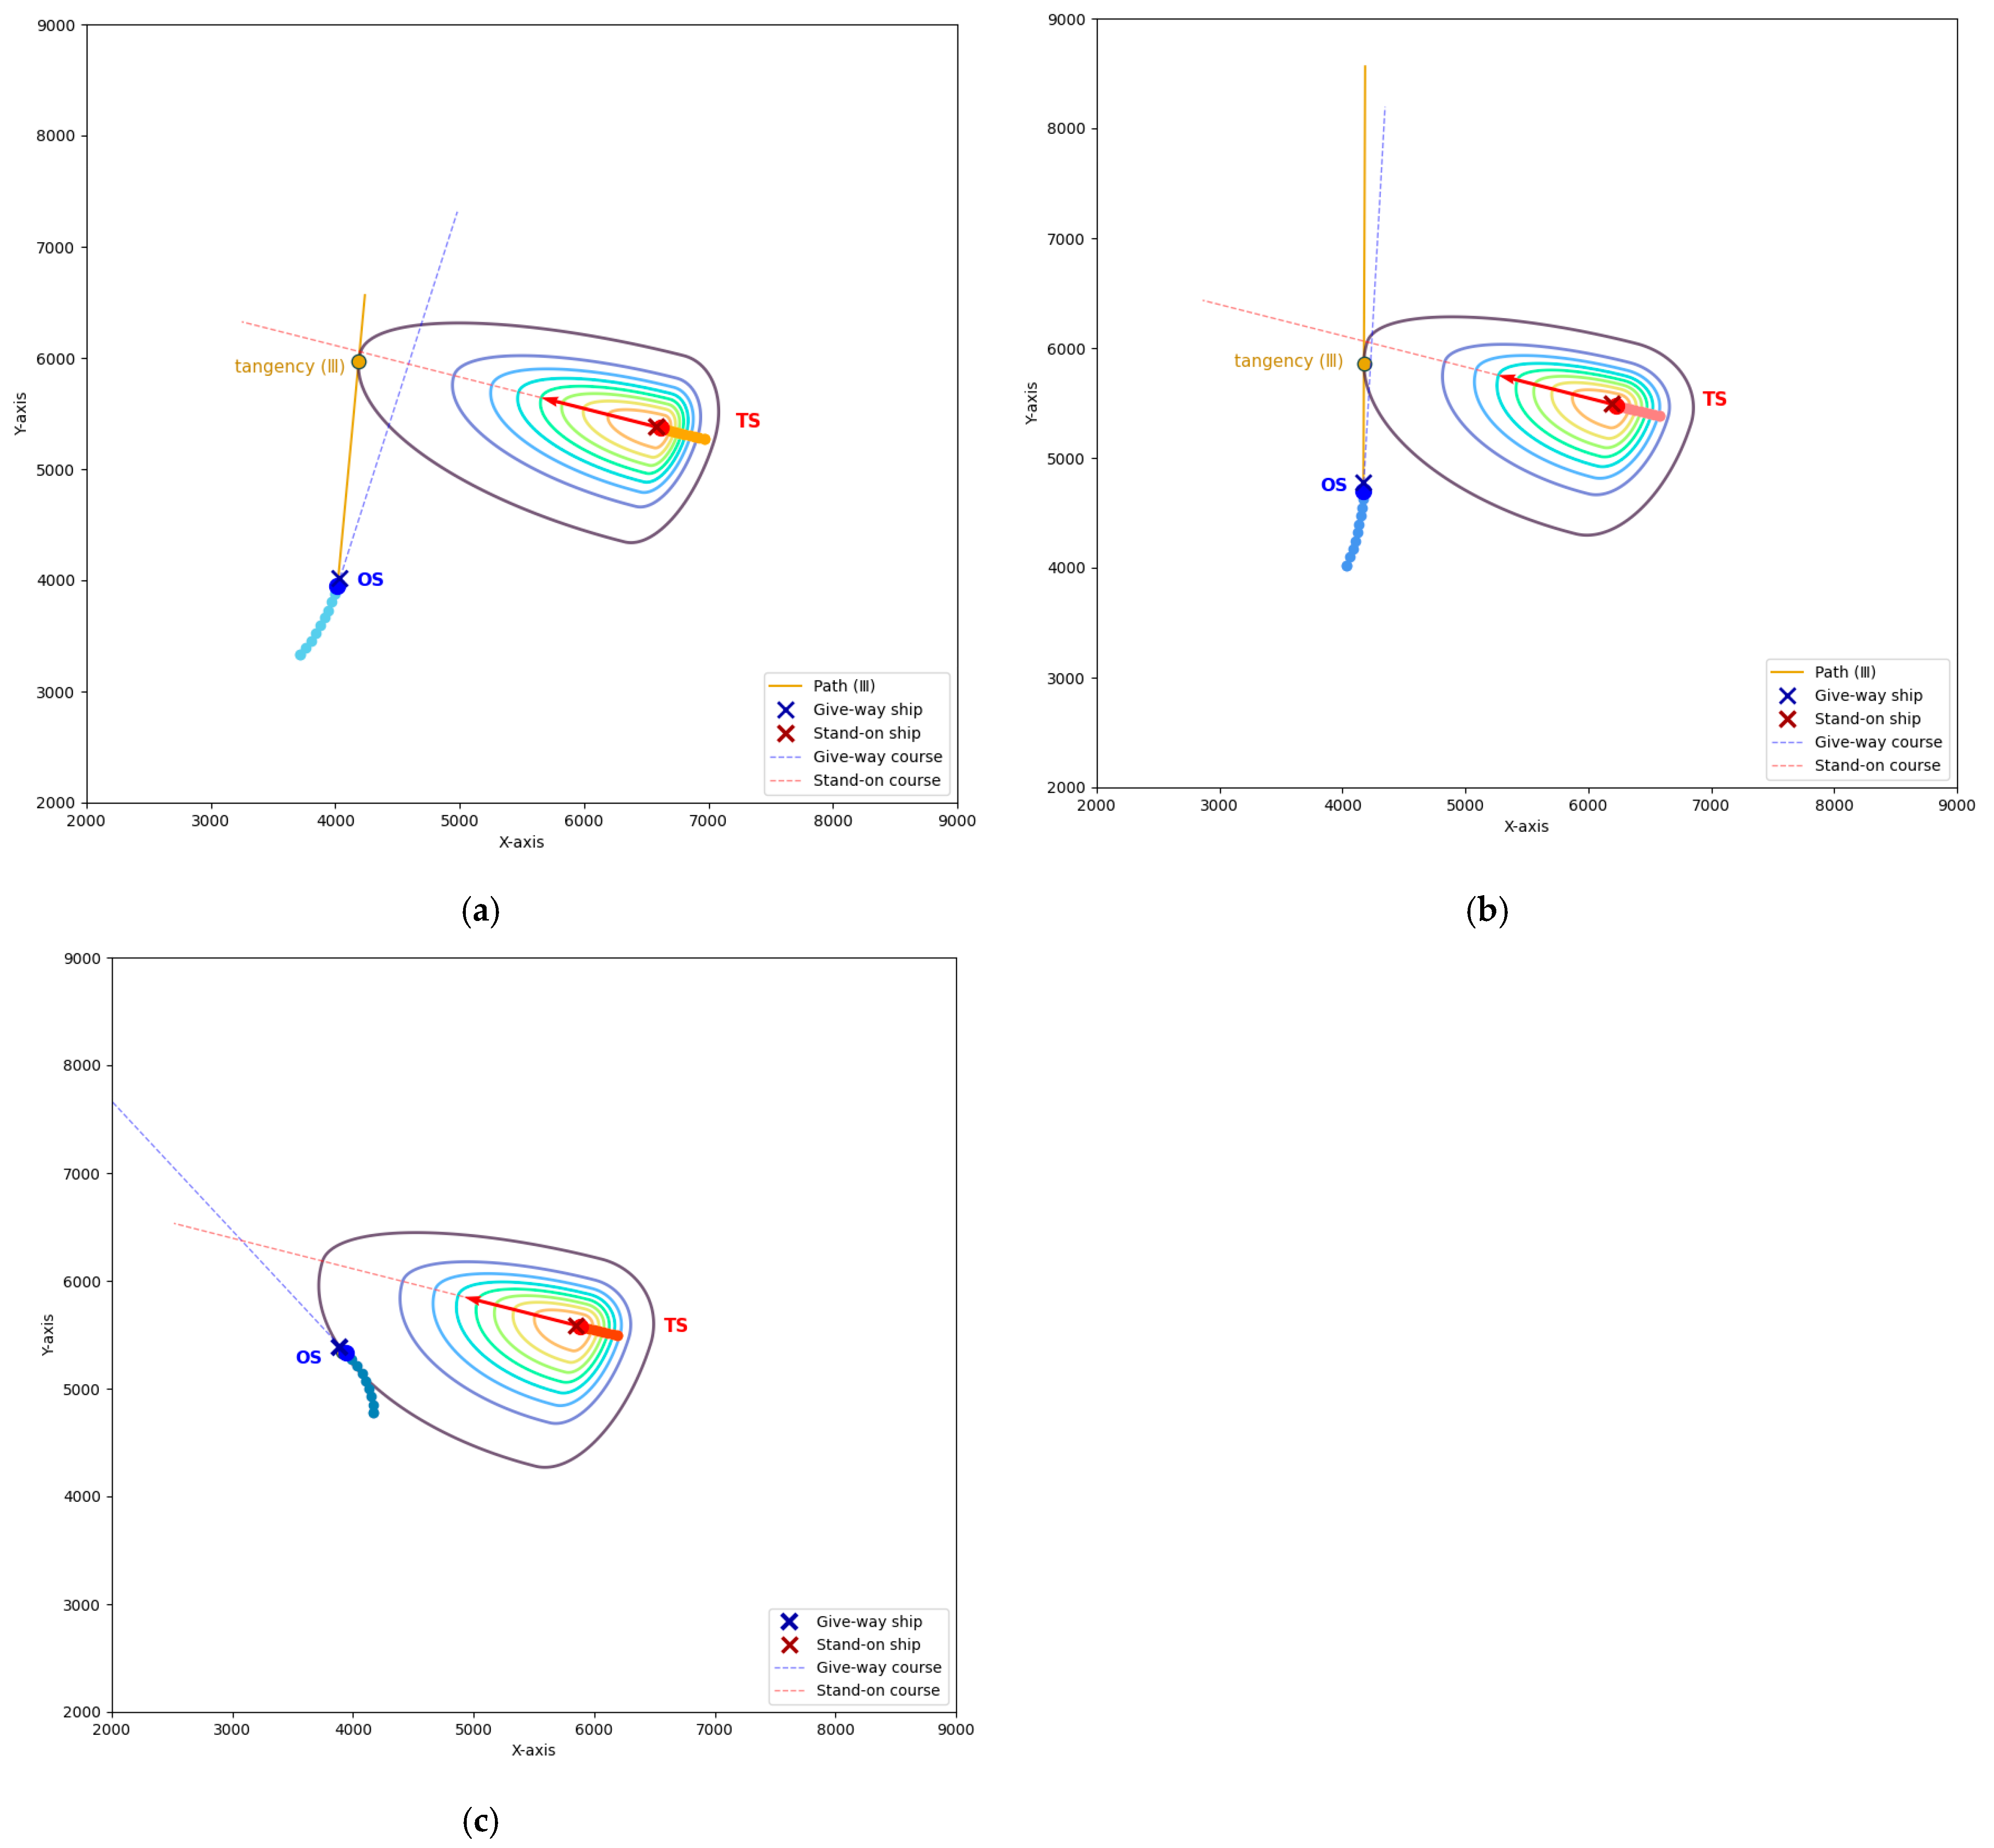
In Perspective 2, OS, as the give-way ship, when at moment t 0 , turns left and chooses to pass through the bow of the stand-on ship TS along the edge of TS’s collision risk field, after 285 s, at moment t 2 III the give-way ship’s course approaches the tangential direction. However, although this increases the crossing angle of the course, it also reduces the time available for avoidance. As shown in Figure 13c, after 435 s, at moment t 3 III , the give-way ship navigates closely along the collision risk field of the stand-on ship and gradually deviates from the original course, with both ships still in a crossing encounter situation. Therefore, in situations where there is a significant size difference between the two ships, even with a high speed, the give-way ship cannot completely pass in front of TS, resulting in a high avoidance cost for Path III.
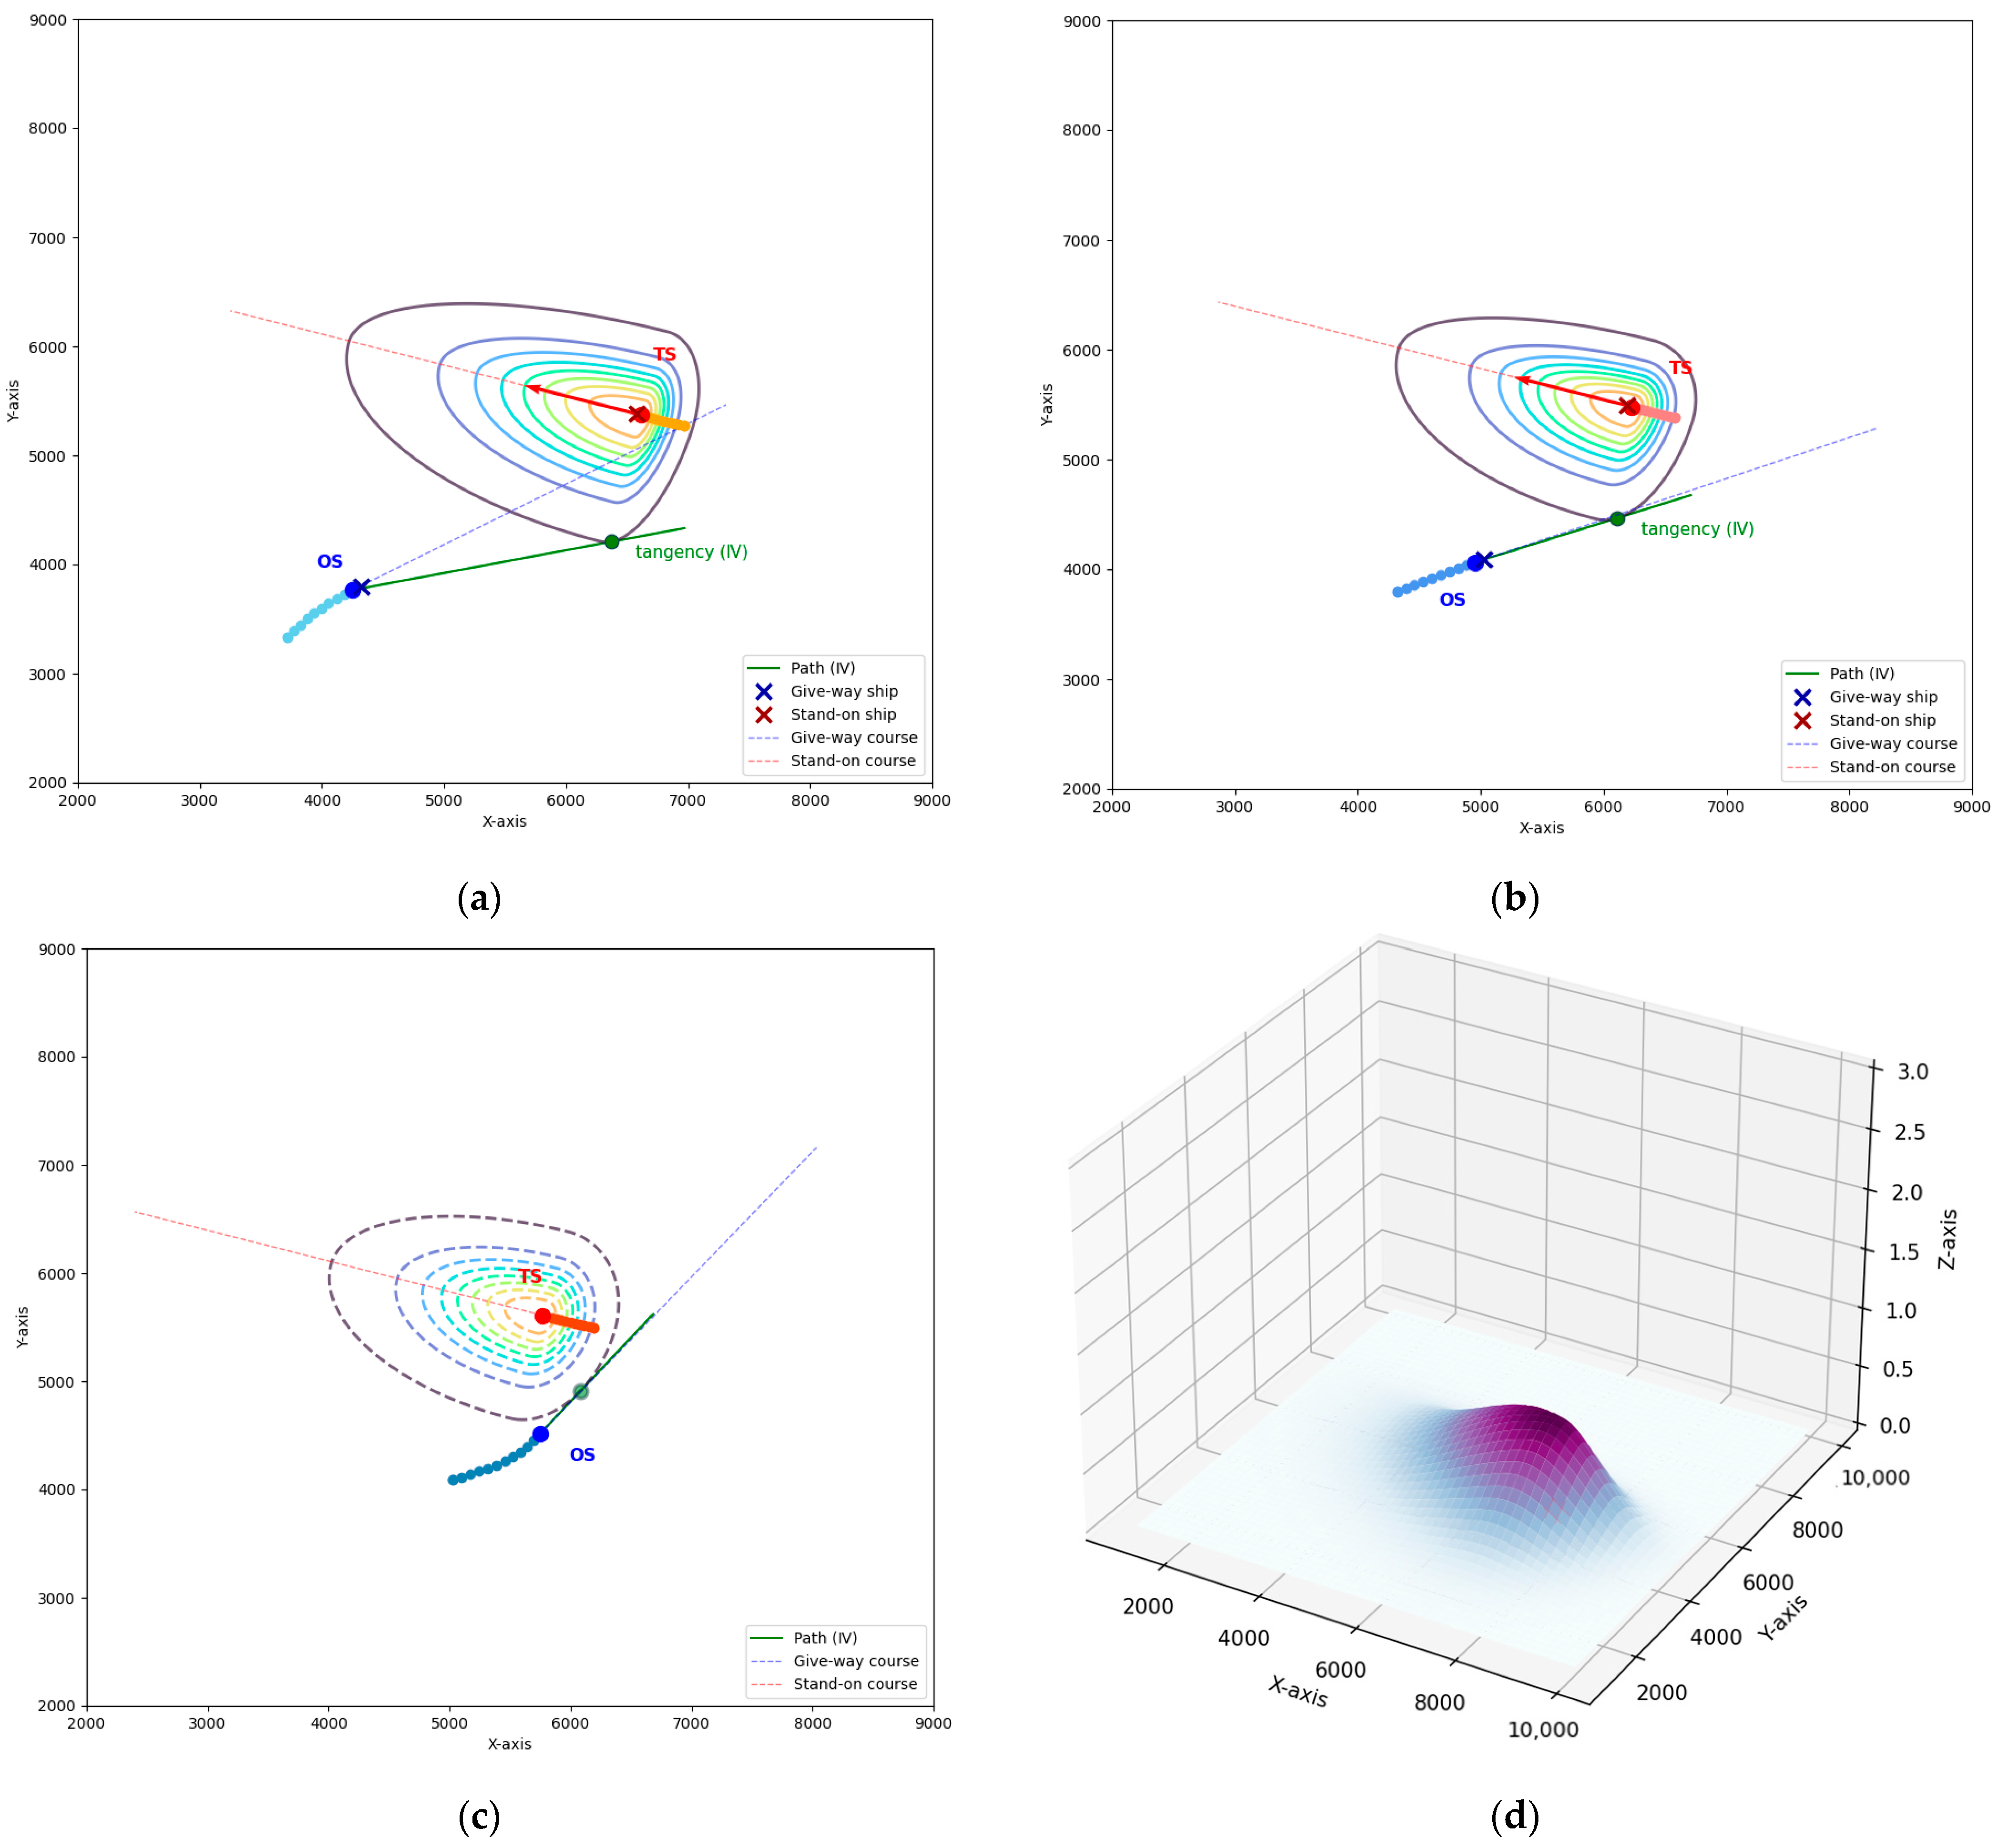
At moment t 0 , OS turns right to avoid the collision risk field of TS from the stern. After only 135 s, at moment t 1 IV , the two ship courses have been separated along the tangent direction to continue sailing 480 s, then give way to the ship sailing to the straight ship’s aft near the collision risk area, sailing through the give-way to clear the deviation from the OS’s initial course only 1.72°.

4.2. Results and Discussion

4.2.1. Results and Evaluation

Table 2 presents the impact factor values at several time points, corresponding to the collision avoidance processes shown in Figure 11, Figure 12, Figure 13 and Figure 14. It is evident that the impact factor values for the velocity direction, σ f , are generally higher than those for other axes, indicating that the risk primarily extends along this direction. Due to the smaller scale and higher speed of TS relative to OS, the impact factor value for the velocity direction of TS is notably higher than those for the stern, port, and starboard directions. Conversely, the impact factor values for OS show smaller differences between directions but are generally higher overall, resulting in a sharp collision risk field for TS and a more rounded one for OS.
Furthermore, when OS is the give-way ship and positioned to the port side of TS, the σ r value for the starboard side of the stand-on ship TS is generally lower than that for the port side, σ l . Conversely, when TS is the give-way ship and is positioned to the starboard side of the stand-on ship OS, the σ f value for the starboard side is generally higher than that for the port side, σ l , indicating that the risk has extended to the give-way ship’s position.
As shown in Table 3, through experimental comparison and analysis, it was found that Path IV had the smallest total distance and course change between the experimental trajectory and the planned trajectory, resulting in the lowest overall avoidance cost. Therefore, the final decision of the model is that OS is the give-way ship, which turns its rudder to the right to sail past the stern of TS, and TS is the stand-on ship and fulfills the obligation of keeping speed and direction. The decision made by the give-way ship aligns with the COLREGs and is also consistent with the actual sailing situation.
In Figure 15, the dark red horizontal dashed line represents the initial course of TS (285.97°), the dark blue horizontal dashed line represents the initial course of OS (36.07°), and the remaining curves illustrate the trend of course change of Paths I, II, III and IV, respectively. It can be observed that, for Path IV, the course of the give-way ship OS gradually increases within the first 165 s (see Figure 14a), reaching approximately 67° and stabilizing (see Figure 14b). After 375 s, the course begins to show a noticeable downward trend, gradually approaching the original course of OS (see Figure 14c). By 480 s, at moment t 3 IV , the give-way ship has largely returned to its original course. Subsequently, the ship’s trajectory no longer intersects with the collision risk field of the stand-on ship, effectively eliminating the collision risk. From the perspective of OS, the collision risk field disappears, and the stand-on ship resumes its normal navigation state.
Through literature review and expert surveys, it is understood that, in open waters, it is generally appropriate to maintain a safety distance of 1–2 nautical miles for collision avoidance. When sea conditions are calm and both ships have reached an agreement, the encounter distance can be appropriately reduced. From Figure 16, it can be seen that the actual collision avoidance path ends at 9 min, with the minimum distance between the two ships being only 593.86 m, or approximately 0.32 nautical miles (marked by the dashed line in Figure 17). In Figure 17, the light-colored trajectories represent the collision avoidance paths from the actual AIS data, while the three sets of dark-colored trajectories represent the model-optimized avoidance paths. The moment t 1 IV , t 2 IV , t 3 IV correspond to Figure 14a–c, respectively. In this case, the avoidance pressure on the give-way ship is significant, especially when the two ships have not communicated effectively and have not reached an agreement. The model-optimized path ends at 8 min, with a minimum distance of 1054.44 m, or approximately 0.57 nautical miles (shown by the solid line in Figure 17 of Path IV). This path, while ensuring safety, seeks a more economical and efficient collision avoidance solution.
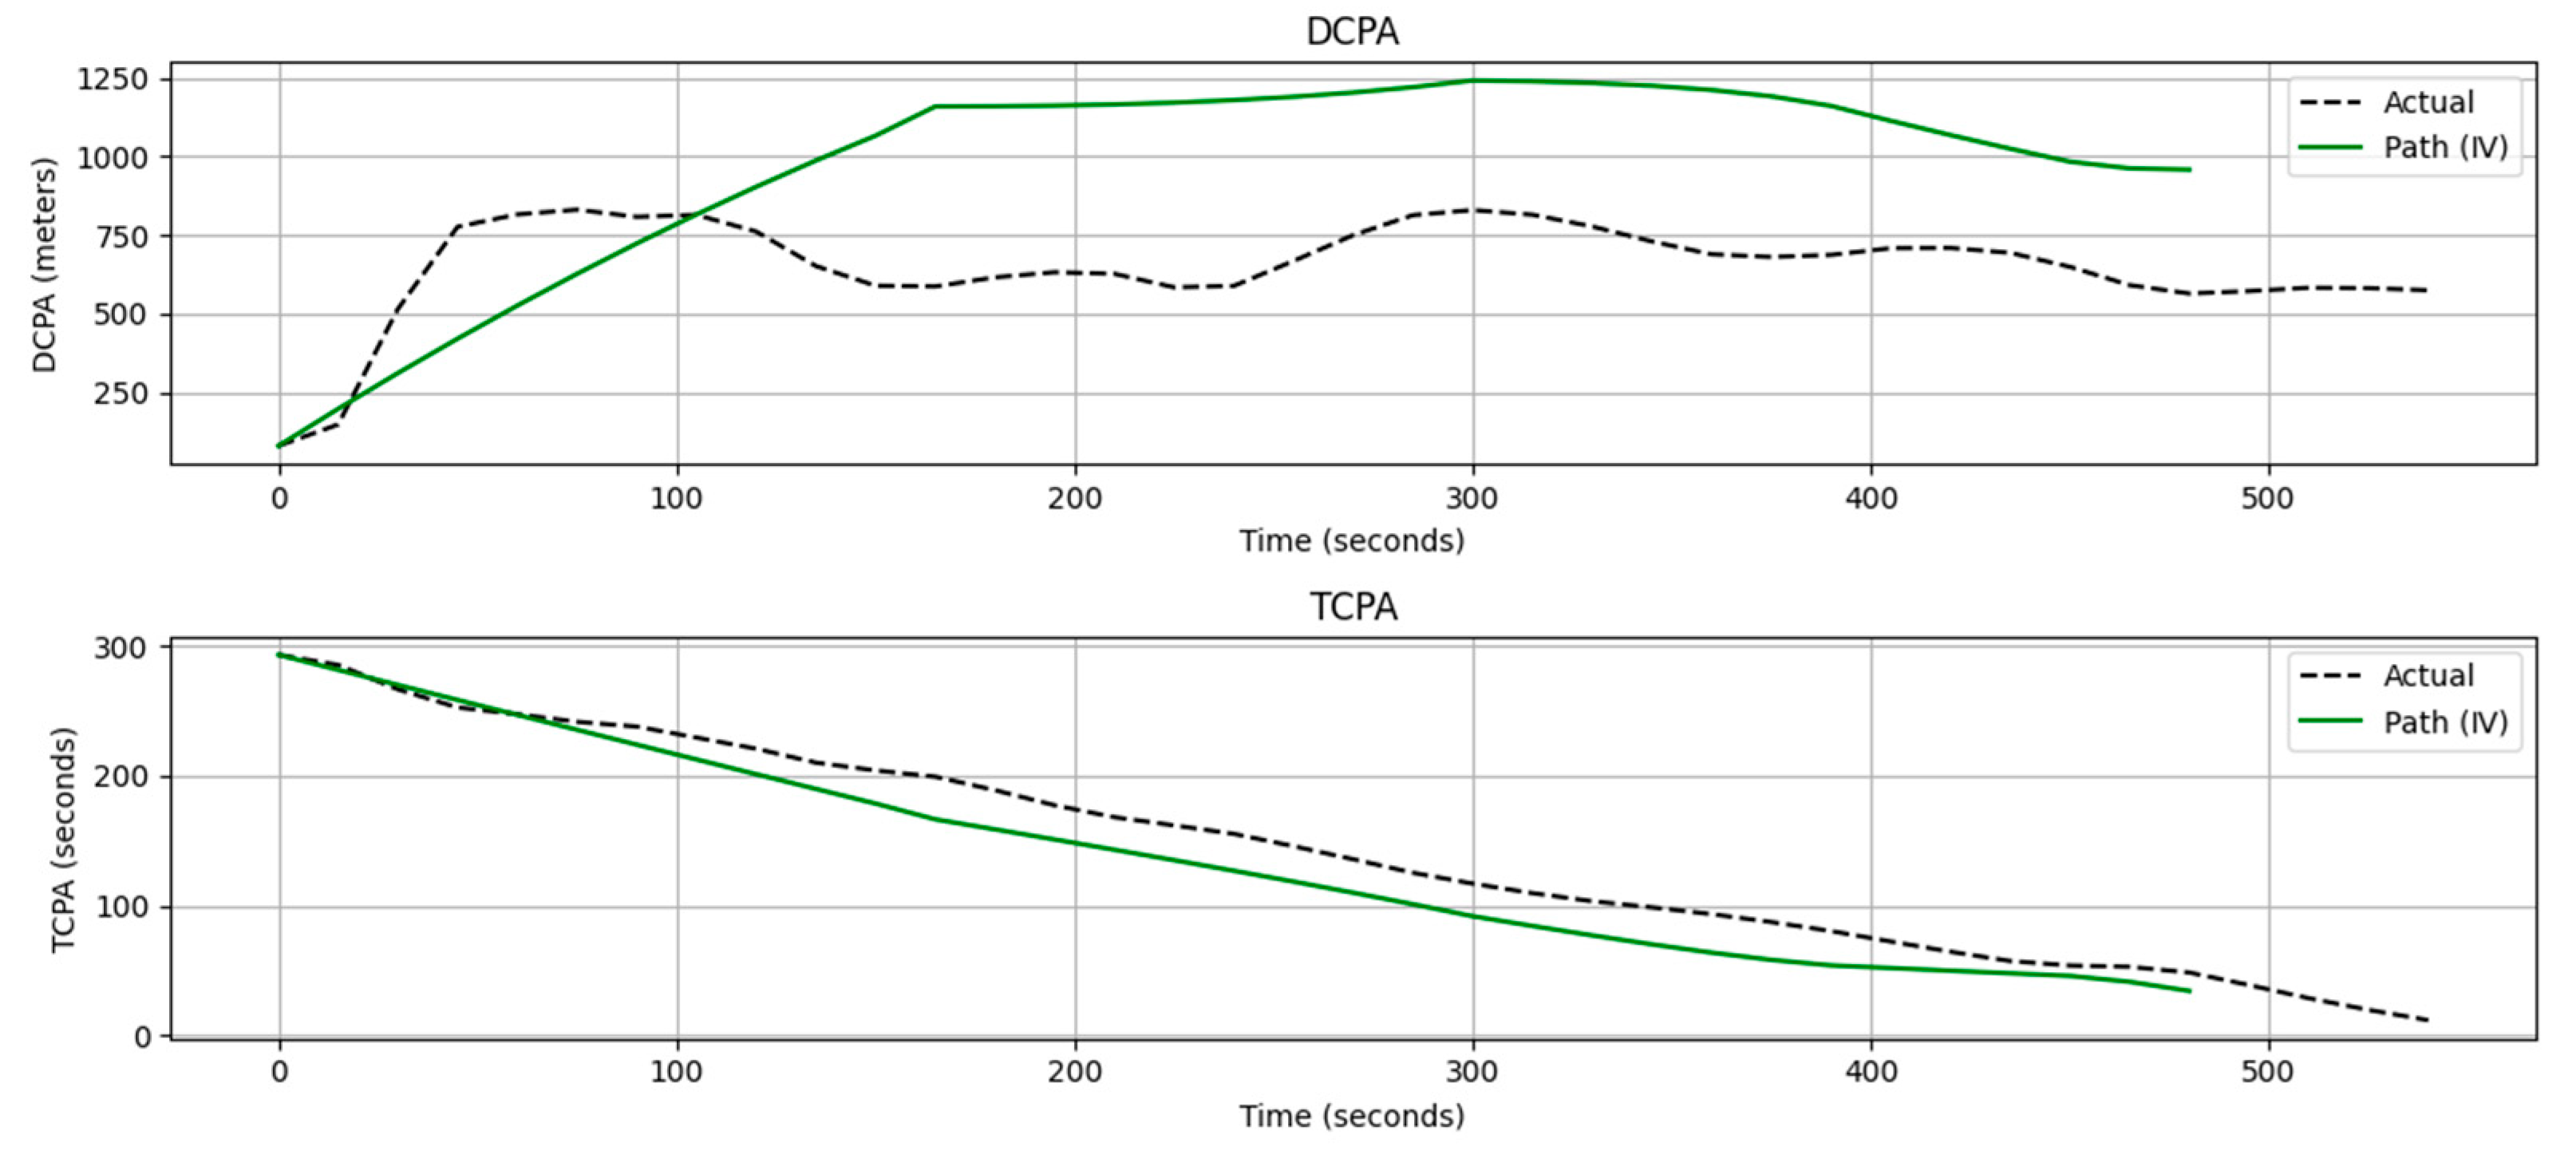
DCPA (Distance to Closest Point of Approach) represents the minimum distance between two ships at their closest encounter point based on their current navigational states. TCPA (Time to Closest Point of Approach) indicates the time remaining until this closest point is reached. A small DCPA value signifies that the ships are in close proximity, presenting a high risk of collision, while a short TCPA value indicates limited time for the ship’s duty officer to take action. In maritime practice, the ship’s duty officer typically monitors DCPA and TCPA to determine whether to take action. Increasing DCPA can be achieved by altering the ship’s course, while extending TCPA can be accomplished by reducing speed.
From Figure 18, it can be seen that whether it is the actual trajectory or the experimental trajectory, the slope of the TCPA is more stable, the speed is basically maintained, and the flexible avoidance is mainly carried out through steering. When TCPA is 292 s and DCPA is 70 m, the ships are dangerously close, indicating a high collision risk. Following a course adjustment, the actual trajectory shows that when TCPA reduces to 11s, DCPA increases to 583 m, with some fluctuations in DCPA, indicating significant avoidance pressure and associated risks. The experimental trajectory demonstrates a more reassuring outcome. At the final TCPA of 33 s, DCPA reaches 963 m, which is approximately 6.9 times the length of OS and 3.3 times the length of TS. The model has been validated through practical examples, confirming that it not only aligns with actual maritime conditions but also ensures both safety and efficiency in collision avoidance.

4.2.2. Limitations of the Research

This experiment constructed a ship collision risk field model based on real AIS data in wide waterways, which will better align with maritime realities when applying this model to future Level 4 MASS.
In encounters between two ships, crossing situations are more complex and frequent compared to other types of encounters. The collision risk field model has already considered all relative bearings of approaching ships according to Equations (1) and (2), and is not constrained by relative bearings. Therefore, the experimental section of this study focuses solely on validating crossing situations. However, if the experimental section were to also validate head-on and overtaking and even multiple vessel collision avoidance situations, the significance of the model would be even more pronounced.
Additionally, the research only considers changing course to avoid collisions and does not account for speed reduction measures. In narrow waters, due to limited maneuvering space, ships also often reduce speed to avoid collisions. Therefore, the methodology of this study is not suitable for application in narrow waters.

5. Conclusions

This research proposes an objective and quantitative method for determining the give-way ship, by constructing a dynamic collision risk field from the perspective of the give-way ship. This approach ensures safe navigation while achieving autonomous and efficient maneuvering. It reduces the cost of avoidance and avoids the fuzzy decisions caused by qualitative judgment. This method makes the rights and responsibilities of the two ships clear when avoiding collision, significantly enhancing coordination and effectively reducing the likelihood of maritime collision accidents caused by human error. Additionally, it facilitates autonomous avoidance for unmanned ships:
  • Introducing the concept of field theory, this research realizes real-time dynamic changes according to the distance and state of the two ships, and taking into account the length, width and other factors, constructing a dynamic collision hazard field based on the speed direction, and integrating the danger of the spatial orientation of the give-way ship. In addition, calibrating the boundary of the collision hazard field according to the actual data is more in line with the actual navigational environment and meets people’s psychological feelings.
  • Considering the comfort of path traveling and the keeping ability of global sailing, the cost function is used to quantitatively determine the give-way ship, the ship with the lowest cost is identified as the give-way ship, which is easy to understand and apply to practice.
To promote the further development of MASS and apply the model to practical production, we can consider the impact of environmental factors in future and further research dynamic experiments involving multiple ships. We hope to enhance the rapid coordination capability for collision avoidance, improving the economic efficiency of avoidance maneuvers while ensuring safety and reducing maritime collision incidents caused by human factors. This is dedicated to providing a new approach for future research on autonomous collision avoidance for MASS.

Author Contributions

The authors confirm that the contributions to this paper are as follows: conceptualization, Y.Z. and Y.L.; methodology, Y.Z. and Y.L.; software, Y.Z.; validation, Y.Z.; formal analysis, Y.Z. and Z.X.; data curation, Y.Z.; writing—original draft preparation, Y.Z. and Y.L.; writing—review and editing, Y.Z. and Y.S.; visualization, Y.Z.; supervision, Y.S. and Z.X.; funding acquisition, Y.L. All authors have read and agreed to the published version of the manuscript.

Funding

This work was funded by Research and Application Demonstration Project of Key Technologies for Safeguarding of Container vessels in Ningbo Zhoushan Port Based on Intelligent Navigation under grant ZJHG-FW-2024-27, the Shanghai Commission of Science and Technology Project under grants 21DZ1201004 and 2300501900, the Anhui Provincial Department of Transportation Project under grant 2021-KJQD-011, the National Natural Science Foundation of China under grant 51509151, and in part by the Shandong Province Key Research and Development Project under grant 2019JZZY020713.

Institutional Review Board Statement

Not applicable.

Informed Consent Statement

Not applicable.

Data Availability Statement

No new data were created or analyzed in this study. Data sharing is not applicable to this article.

Conflicts of Interest

Authors Yong Shen, Zhexue Xie were employed by the company Ningbo Dagang Pilotage Co., Ltd. The remaining authors declare that the research was conducted in the absence of any commercial or financial relationships that could be construed as a potential conflict of interest.

References

  1. European Maritime Safety Agency. Annual Overview of Marine Casualties and Incidents 2023; European Maritime Safety Agency: Lisbon, Portugal, 2023. [Google Scholar]
  2. Ahmed, Y.A.; Hannan, M.A.; Oraby, M.Y.; Maimun, A. European Maritime Safety Agency. Mar. Sci. Eng. 2021, 9, 790. [Google Scholar] [CrossRef]
  3. Li, X.; Yuen, K.F. A Human-Centred Review on Maritime Autonomous Surfaces Ships: Impacts, Responses, and Future Directions. Transp. Rev. 2024, 44, 791–810. [Google Scholar] [CrossRef]
  4. Namgung, H. Local Route Planning for Collision Avoidance of Maritime Autonomous Surface Ships in Compliance with COLREGs Rules. Sustainability 2021, 14, 198. [Google Scholar] [CrossRef]
  5. Huang, Y.; Chen, L.; Negenborn, R.R.; van Gelder, P.H.A.J.M. A Ship Collision Avoidance System for Human-Machine Cooperation during Collision Avoidance. Ocean. Eng. 2020, 217, 107913. [Google Scholar] [CrossRef]
  6. Ventikos, N.P.; Chmurski, A.; Louzis, K. A Systems-Based Application for Autonomous Vessels Safety: Hazard Identification as a Function of Increasing Autonomy Levels. Saf. Sci. 2020, 131, 104919. [Google Scholar] [CrossRef]
  7. Hagen, I.B.; Knutsen, K.S.; Johansen, T.A.; Brekke, E. Exploration of COLREG-Relevant Parameters from Historical AIS-Data. J. Navig. 2024, 1–19. [Google Scholar] [CrossRef]
  8. Wang, S.; Zhang, Y.; Song, F.; Mao, W. A Collaborative Collision Avoidance Strategy for Autonomous Ships under Mixed Scenarios. J. Navig. 2023, 76, 200–224. [Google Scholar] [CrossRef]
  9. Ohn, S.-W.; Namgung, H. Requirements for Optimal Local Route Planning of Autonomous Ships. J. Mar. Sci. Eng. 2022, 11, 17. [Google Scholar] [CrossRef]
  10. Zhang, X.; Wang, C.; Jiang, L.; An, L.; Yang, R. Collision-Avoidance Navigation Systems for Maritime Autonomous Surface Ships: A State of the Art Survey. Ocean. Eng. 2021, 235, 109380. [Google Scholar] [CrossRef]
  11. Zhang, J.; Zhang, D.; Yan, X.; Haugen, S.; Guedes Soares, C. A Distributed Anti-Collision Decision Support Formulation in Multi-Ship Encounter Situations under COLREGs. Ocean. Eng. 2015, 105, 336–348. [Google Scholar] [CrossRef]
  12. Vagale, A.; Bye, R.T.; Oucheikh, R.; Osen, O.L.; Fossen, T.I. Path Planning and Collision Avoidance for Autonomous Surface Vehicles II: A Comparative Study of Algorithms. J. Mar. Sci. Technol. 2021, 26, 1307–1323. [Google Scholar] [CrossRef]
  13. Öztürk, Ü.; Akdağ, M.; Ayabakan, T. A Review of Path Planning Algorithms in Maritime Autonomous Surface Ships: Navigation Safety Perspective. Ocean. Eng. 2022, 251, 111010. [Google Scholar] [CrossRef]
  14. Statheros, T.; Howells, G.; Maier, K.M. Autonomous Ship Collision Avoidance Navigation Concepts, Technologies and Techniques. J. Navig. 2008, 61, 129–142. [Google Scholar] [CrossRef]
  15. Xue, Y.; Clelland, D.; Lee, B.S.; Han, D. Automatic Simulation of Ship Navigation. Ocean. Eng. 2011, 38, 2290–2305. [Google Scholar] [CrossRef]
  16. Lyu, H.; Hao, Z.; Li, J.; Li, G.; Sun, X.; Zhang, G.; Yin, Y.; Zhao, Y.; Zhang, L. Ship Autonomous Collision-Avoidance Strategies—A Comprehensive Review. J. Mar. Sci. Eng. 2023, 11, 830. [Google Scholar] [CrossRef]
  17. IMAZU, H.; KOYAMA, T. The Determination of Collision Avoidance Action. J. Jpn. Inst. Navig. 1984, 70, 31–37. [Google Scholar] [CrossRef]
  18. Kang, L.; Lu, Z.; Meng, Q.; Gao, S.; Wang, F. Maritime Simulator Based Determination of Minimum DCPA and TCPA in Head-on Ship-to-Ship Collision Avoidance in Confined Waters. Transp. A: Transp. Sci. 2019, 15, 1124–1144. [Google Scholar] [CrossRef]
  19. Wang, X.; Liu, Z.; Cai, Y. The Ship Maneuverability Based Collision Avoidance Dynamic Support System in Close-Quarters Situation. Ocean. Eng. 2017, 146, 486–497. [Google Scholar] [CrossRef]
  20. Xu, Q.; Wang, N. A Survey on Ship Collision Risk Evaluation. Promet Traffic Transp. 2014, 26, 475–486. [Google Scholar] [CrossRef]
  21. Zhu, Z.; Lyu, H.; Zhang, J.; Yin, Y. An Efficient Ship Automatic Collision Avoidance Method Based on Modified Artificial Potential Field. J. Mar. Sci. Eng. 2021, 10, 3. [Google Scholar] [CrossRef]
  22. Mohanan, M.G.; Salgoankar, A. A Survey of Robotic Motion Planning in Dynamic Environments. Rob. Auton. Syst. 2018, 100, 171–185. [Google Scholar] [CrossRef]
  23. Abdelaal, M.; Fränzle, M.; Hahn, A. Nonlinear Model Predictive Control for Trajectory Tracking and Collision Avoidance of Underactuated Vessels with Disturbances. Ocean. Eng. 2018, 160, 168–180. [Google Scholar] [CrossRef]
  24. Wang, J.; Wang, J.; Zhao, R.; Liang, X.; Wei, Q. Collision Avoidance Strategies for Unmanned Surface Vehicles Based on Probabilistic Game Theory Framework. In Proceedings of the OCEANS 2022—Chennai, Chennai, India, 21–24 February 2022; IEEE: New York, NY, USA, 2022; pp. 1–6. [Google Scholar]
  25. Cho, Y.; Han, J.; Kim, J. Efficient COLREG-Compliant Collision Avoidance in Multi-Ship Encounter Situations. IEEE Trans. Intell. Transp. Syst. 2022, 23, 1899–1911. [Google Scholar] [CrossRef]
  26. Zheng, M.; Zhang, K.; Han, B.; Lin, B.; Zhou, H.; Ding, S.; Zou, T.; Yang, Y. An Improved VO Method for Collision Avoidance of Ships in Open Sea. J. Mar. Sci. Eng. 2024, 12, 402. [Google Scholar] [CrossRef]
  27. Zhang, K.; Huang, L.; He, Y.; Zhang, L.; Huang, W.; Xie, C.; Hao, G. Collision Avoidance Method for Autonomous Ships Based on Modified Velocity Obstacle and Collision Risk Index. J. Adv. Transp. 2022, 2022, 1534815. [Google Scholar] [CrossRef]
  28. Tsou, M.-C.; Hsueh, C.-K. The Study of Ship Collision Avoidance Route Planning by Ant Colony Algorithm. J. Mar. Sci. Technol. 2010, 18, 16. [Google Scholar] [CrossRef]
  29. Tsou, M.-C.; Kao, S.-L.; Su, C.-M. Decision Support from Genetic Algorithms for Ship Collision Avoidance Route Planning and Alerts. J. Navig. 2010, 63, 167–182. [Google Scholar] [CrossRef]
  30. Xu, Q. Collision Avoidance Strategy Optimization Based on Danger Immune Algorithm. Comput. Ind. Eng. 2014, 76, 268–279. [Google Scholar] [CrossRef]
  31. Xu, Q.; Zhang, C.; Wang, N. Multiobjective Optimization Based Vessel Collision Avoidance Strategy Optimization. Math. Probl. Eng. 2014, 2014, 914689. [Google Scholar] [CrossRef]
  32. Liang, Z.; Li, F.; Zhou, S. An Improved NSGA-II Algorithm for MASS Autonomous Collision Avoidance under COLREGs. J. Mar. Sci. Eng. 2024, 12, 1224. [Google Scholar] [CrossRef]
  33. Zhao, L.; Bai, Y.; Paik, J.K. Achieving Optimal-Dynamic Path Planning for Unmanned Surface Vehicles: A Rational Multi-Objective Approach and a Sensory-Vector Re-Planner. Ocean. Eng. 2023, 286, 115433. [Google Scholar] [CrossRef]
  34. Lee, S.-M.; Kwon, K.-Y.; Joh, J. A Fuzzy Logic for Autonomous Navigation of Marine Vehicles Satisfying COLREG Guidelines. Int. J. Control Autom. Syst. 2004, 2, 171–181. [Google Scholar]
  35. Chen, Y.F.; Liu, M.; Everett, M.; How, J.P. Decentralized Non-Communicating Multiagent Collision Avoidance with Deep Reinforcement Learning. In Proceedings of the 2017 IEEE International Conference on Robotics and Automation (ICRA), Singapore, 29 May–3 June 2017; IEEE: New York, NY, USA, 2017; pp. 285–292. [Google Scholar]
  36. Namgung, H.; Kim, J.-S. Collision Risk Inference System for Maritime Autonomous Surface Ships Using COLREGs Rules Compliant Collision Avoidance. IEEE Access 2021, 9, 7823–7835. [Google Scholar] [CrossRef]
  37. Wróbel, K.; Gil, M.; Huang, Y.; Wawruch, R. The Vagueness of COLREG versus Collision Avoidance Techniques—A Discussion on the Current State and Future Challenges Concerning the Operation of Autonomous Ships. Sustainability 2022, 14, 16516. [Google Scholar] [CrossRef]
  38. Stępień, B. Towards a New Horizon: 1972 COLREG in the Era of Autonomous Ships. Ocean. Dev. Int. Law. 2024, 55, 170–184. [Google Scholar] [CrossRef]
  39. Akdağ, M.; Solnør, P.; Johansen, T.A. Collaborative Collision Avoidance for Maritime Autonomous Surface Ships: A Review. Ocean. Eng. 2022, 250, 110920. [Google Scholar] [CrossRef]
  40. García Maza, J.A.; Argüelles, R.P. COLREGs and Their Application in Collision Avoidance Algorithms: A Critical Analysis. Ocean. Eng. 2022, 261, 112029. [Google Scholar] [CrossRef]
  41. Chang, C.-H.; Wijeratne, I.B.; Kontovas, C.; Yang, Z. COLREG and MASS: Analytical Review to Identify Research Trends and Gaps in the Development of Autonomous Collision Avoidance. Ocean. Eng. 2024, 302, 117652. [Google Scholar] [CrossRef]
  42. Zhou, X.-Y.; Huang, J.-J.; Wang, F.-W.; Wu, Z.-L.; Liu, Z.-J. A Study of the Application Barriers to the Use of Autonomous Ships Posed by the Good Seamanship Requirement of COLREGs. J. Navig. 2020, 73, 710–725. [Google Scholar] [CrossRef]
  43. Kuwata, Y.; Wolf, M.T.; Zarzhitsky, D.; Huntsberger, T.L. Safe Maritime Autonomous Navigation With COLREGS, Using Velocity Obstacles. IEEE J. Ocean. Eng. 2014, 39, 110–119. [Google Scholar] [CrossRef]
  44. Namgung, H.; Ohn, S.-W. Fuzzy Inference and Sequence Model-Based Collision Risk Prediction System for Stand-On Vessel. Sensors 2022, 22, 4983. [Google Scholar] [CrossRef] [PubMed]
  45. Ni, D. A Unified Perspective on Traffic Flow Theory, Part I: The Field Theory. In Proceedings of the ICCTP 2011, Nanjing, China, 14–17 August 2011; American Society of Civil Engineers: Reston, VA, USA; pp. 4227–4243. [Google Scholar]
  46. Rødseth, Ø.J.; Wennersberg, L.A.L.; Nordahl, H. Improving Safety of Interactions between Conventional and Autonomous Ships. Ocean. Eng. 2023, 284, 115206. [Google Scholar] [CrossRef]
  47. Elguebaly, T.; Bouguila, N. Finite Asymmetric Generalized Gaussian Mixture Models Learning for Infrared Object Detection. Comput. Vision. Image Underst. 2013, 117, 1659–1671. [Google Scholar] [CrossRef]
  48. Chen, Y.-L.; Du, W.-K.; Hu, X.-Y.; Bai, G.-Q.; Zhang, J.-B. USV Collision Hazard Assessment and Track Planning Algorithm. Ocean. Eng. 2022, 261, 112149. [Google Scholar] [CrossRef]
  49. Coldwell, T.G. Marine Traffic Behaviour in Restricted Waters. J. Navig. 1983, 36, 430–444. [Google Scholar] [CrossRef]
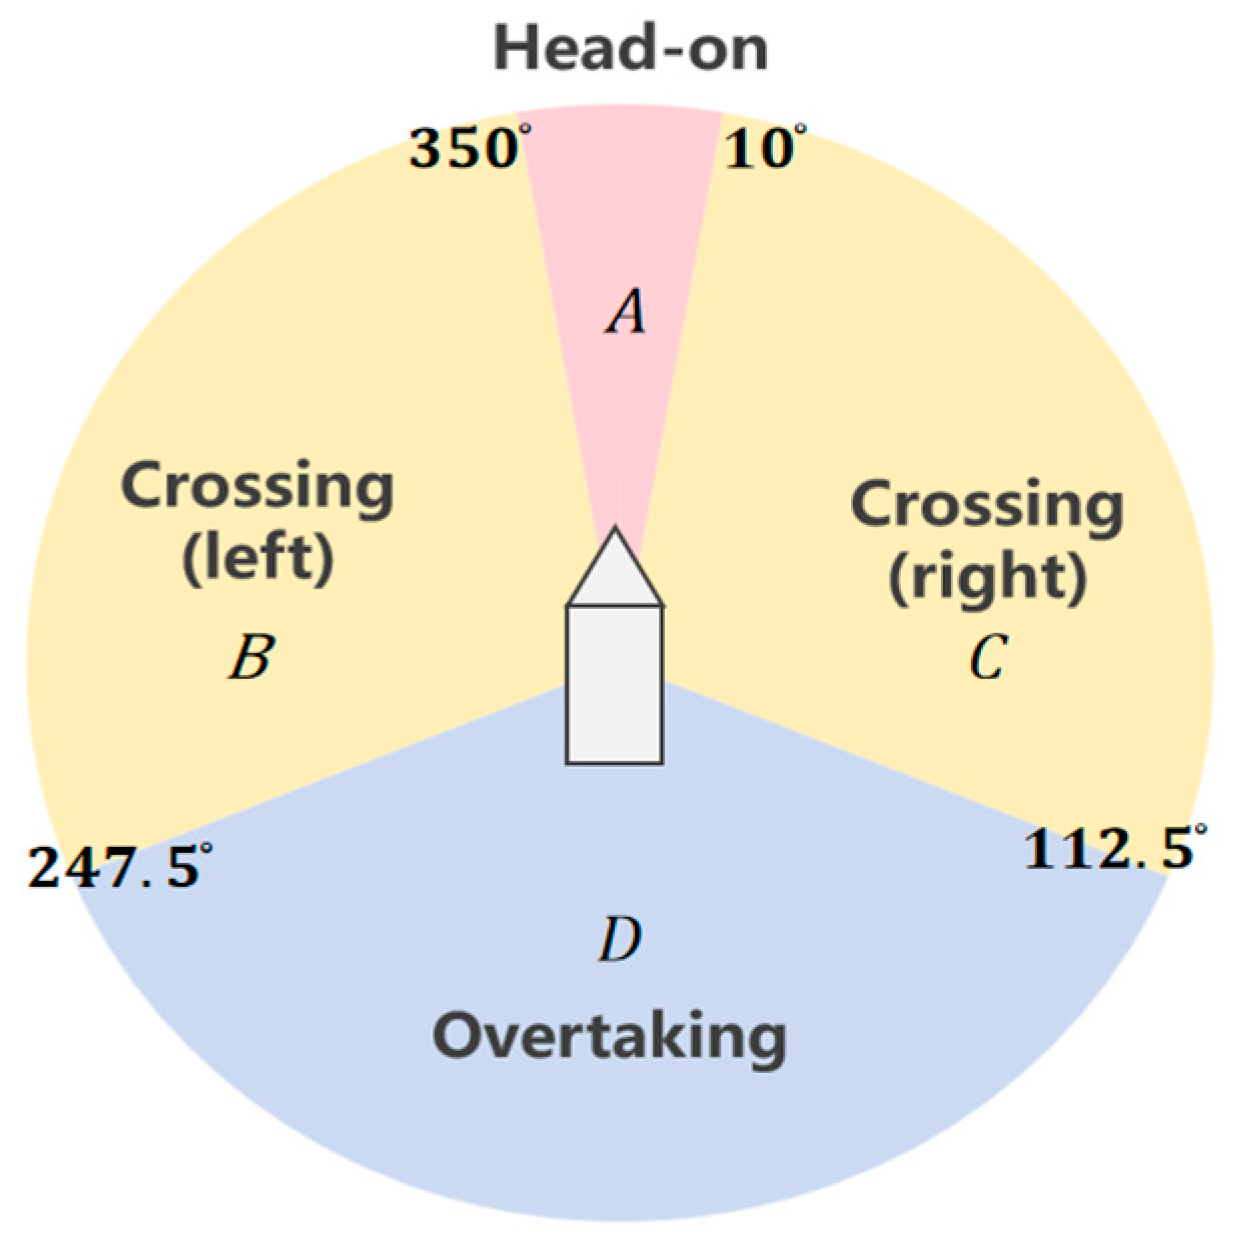
Figure 1. Division of the encounter situation.
Jmse 12 01973 g001
Figure 2. Schematic diagram of road aspect field theory.
Jmse 12 01973 g002
Figure 3. Schematic diagram of relative bearing.
Jmse 12 01973 g003
Figure 4. Schematic diagram of psychological forces.
Jmse 12 01973 g004
Figure 5. Schematic of the collision risk field: (a) three-dimensional; (b) two-dimensional top view.
Jmse 12 01973 g005
Figure 6. Map of the study area.
Jmse 12 01973 g006
Figure 7. Ships’ trajectory diagram.
Jmse 12 01973 g007
Figure 8. 3D space–time trajectory diagram.
Jmse 12 01973 g008
Figure 9. Three-dimensional collision risk field: (a) TS as the give-way ship (Perspective 1); (b) OS as the give-way ship (Perspective 2).
Jmse 12 01973 g009
Figure 10. Contour map of the collision risk field: (a) TS as the give-way ship (Perspective 1); (b) OS as the give-way ship (Perspective 2).
Jmse 12 01973 g010
Figure 11. The collision avoidance process for Path I: (a) during the period t 0 t 1 I ; (b) during the period t 1 I t 2 I .
Jmse 12 01973 g011
Figure 12. The collision avoidance process for Path II: (a) during the period t 0 t 1 II ; (b) during the period t 1 II t 2 II ; (c) during the period t 2 II t 3 II ; (d) the three-dimensional collision risk field at moment t 3 II .
Jmse 12 01973 g012
Figure 13. The collision avoidance process for Path III: (a) during the period t 0 t 1 III ; (b) during the period t 1 III t 2 III ; (c) during the period t 2 III t 3 III .
Jmse 12 01973 g013
Figure 14. The collision avoidance process for Path IV: (a) during the period t 0 t 1 IV ; (b) during the period t 1 IV t 2 IV ; (c) during the period t 2 IV t 3 IV ; (d) the three-dimensional collision risk field at moment t 3 IV .
Jmse 12 01973 g014
Figure 15. Course change diagram.
Jmse 12 01973 g015
Figure 16. Distance change diagram.
Jmse 12 01973 g016
Figure 17. Comparison of actual and experimental trajectories.
Jmse 12 01973 g017
Figure 18. Variations of DCPA and TCPA.
Jmse 12 01973 g018
Table 1. Ships’ basic information.
MMSIOS: 412750950TS: 477726100
Length (m)140292
Width (m)2045
Speed (kn)105.2
Course (deg)36.07285.97
Displacement (kg)18,468,268.582,023,165
Ship typeCargoCargo
Table 2. Impact factor values.
Give-Way ShipPath t Stand-On Ship σ i
σ f σ b σ l σ r
TS t 0 231.1920.774.258.43
Path I t 1 I 258.9327.456.4410.15
t 2 I 236.1433.866.3910.68
Path II t 1 II 249.5527.186.978.59
t 2 II 244.1924.415.389.01
t 3 II 225.1644.105.898.72
OS t 0 338.8048.4218.619.25
Path III t 1 III 349.7362.0822.8914.54
t 2 III 294.0687.7626.1612.56
t 3 III 309.4484.8429.0013.94
Path IV t 1 IV 346.8060.9825.9117.05
t 2 IV 274.7171.3822.8113.52
t 3 IV 252.0785.9121.2517.20
Table 3. Cost values of different Paths.
TSOS
Path   I Path   II Path   III Path   IV
l s 804.091364.762750.842456.04
l j 626.31174.911252.692394.95
0 T | θ | 46.5066.0488.0930.05
t \510\480
cost\33.46\15.04
Disclaimer/Publisher’s Note: The statements, opinions and data contained in all publications are solely those of the individual author(s) and contributor(s) and not of MDPI and/or the editor(s). MDPI and/or the editor(s) disclaim responsibility for any injury to people or property resulting from any ideas, methods, instructions or products referred to in the content.