Article

Variation in Structure and Functional Diversity of Surface Bacterioplankton Communities in the Eastern East China Sea

1
Department of Marine Chemistry, College of Marine Science and Technology, Zhejiang Ocean University, Zhoushan 316022, China
2
Cooperative Innovation Center of Industrial Fermentation (Ministry of Education & Hubei Province), Key Laboratory of Fermentation Engineering (Ministry of Education), National “111” Center for Cellular Regulation and Molecular Pharmaceutics, College of Bioengineering, Hubei Key Laboratory of Industrial Microbiology, Hubei University of Technology, Wuhan 430068, China
3
Zhejiang Provincial Key Laboratory of Petrochemical Pollution Control, College of Petrochemical Engineering and Environment, Zhejiang Ocean University, Zhoushan 316022, China
4
Institute of Animal Science, Guangdong Academy of Agricultural Sciences, Guangzhou 510640, China
5
Donghai Laboratory, Zhoushan 316022, China
6
ABI Group, Laboratory of Phycosphere Microbiology, Zhejiang Ocean University, Zhoushan 316021, China
7
Joint R&D Center of Phycosphere Microbiology, GPMP Consortium, Shanghai 201306, China
*
Authors to whom correspondence should be addressed.
J. Mar. Sci. Eng. 2024, 12(1), 69; https://doi.org/10.3390/jmse12010069
Submission received: 9 November 2023 / Revised: 15 December 2023 / Accepted: 19 December 2023 / Published: 27 December 2023
(This article belongs to the Special Issue Marine Microbiology: Biodiversity and Ecology)

Abstract

:
Bacterioplankton communities are critical components of varied ecosystems in the oceans. Their occurrences represent a variety of connections between environmental and ecological elements. However, our current knowledge about the shaping factors of surface bacterioplankton communities in the eastern East China Sea (ECS) is still limited. In this study, we reveal the spatial patterns of the taxonomic and functional profiles of the surface bacterioplankton communitiesies in the nearshore and offshore areas in the eastern ECS, based on 16S rRNA gene pyrosequencing and functional annotation analysis. The obtained results show that the surface bacterioplankton communities in the nearshore areas are mainly dominated by the firmicutes (85.9%), actinobacteria (8.1%), and proteobacteria (5.4%), which are mainly involved in organic compound metabolism. Meanwhile, different bacteria predominate the composition of the offshore group, namely proteobacteria (71.1%) and bacteroidetes (22.0%) responsible for nitrogen and sulfur metabolism. Furthermore, their distribution pattern is shown to be spatially determined, along with a modest finding of functional diversity when comparing the bacterial species. The primary two shaping factors of bacterioplankton diversity are found to be the offshore distance and temperature. Overall, these findings add to those previously published on bacterial species and offer up functional information on the surface bacterioplankton communities in the eastern ECS. To extend our research, we propose that, in the future, it may be beneficial to monitor the dynamics of the ecosystem in this sea area.

1. Introduction

The East China Sea (ECS) is a complex ecosystem, which is characterized by a wide range of biological, chemical, and physical processes [1]. In recent years, there has been increasing interest in understanding the ecology of this specific region due to its growing importance as a key commercial fishery, maritime shipping and transportation route, and oceanic energy resource in China [2]. One of the main geographical features of this sea area is its high biological productivity, which is largely driven by nutrient inputs from the Yangtze River and other coastal rivers [3]. These nutrients support diverse marine life including phytoplankton, zooplankton, and fish and thus make this sea area a critical spawning and feeding ground for varied commercially important fishery species [4,5,6]. However, the ecological health of the ECS area is unfavorably influenced by various coastal human activities [7]. Rapid coastal economic development, diverse pollution, overfishing, and global and regional climate change are becoming major challenges that disrupt the natural balance of marine ecosystems [8].
The surface bacterioplankton community plays vital roles in biogeochemical cycling of nutrients in the oceans [9,10,11]. Previous studies have shown that bacterioplankton in the ECS were mainly dominated by a few phyla, including proteobacteria, bacteroidetes, and actinobacteria [12,13]. However, their abundance usually varied depending on environmental factors including the temperature, salinity, and nutrient availability [14]. In addition, bacterioplankton communities are also influenced by interactions among different organisms such as phytoplankton and viruses [15]. Thus, the ecology of surface bacterioplankton in the ECS area is a complex and dynamic system, and it is shaped by a variety of biotic and abiotic factors [16]. In this setting, more research is needed to further understand the natural roles of the surface bacterioplankton in the ecosystem and the patterns by which they respond to the environmental changes that are occurring.
The bacterioplankton are one of the largest reservoirs of marine biodiversity, and they can contribute to various ecological processes in marine ecosystems [2]. They have been used as a sensitive and aggregate biological indicator for monitoring ecological changes [3]. To that end, understanding their spatiotemporal variability and underlying mechanisms is essential to reveal their functions in space and time [3,15]. Variations in latitude or distance from the shore, as well as different environmental gradients that may arise in coastal waters, are responsible for the different spatial patterns of bacterial communities [17]. Microbial dynamics are usually greater in the surface seawaters than at depths [18]. Due to the importance of bacterioplankton communities for habitat environmental assessment, it is necessary to accumulate microbiota information, monitor their dynamic changes, and reveal the fundamental processes underlying the biogeographic and ecological patterns of bacterioplankton diversity. However, for the eastern ECS area, the characterizations of surface bacterioplankton communities are limited to only a few studies, which offer only snapshots of the real communities [19,20,21]. Moreover, there is limited knowledge available of the driving elements in this area.
In this study, the 16S rRNA gene pyrosequencing approach was used to study bacterioplankton communities in the coastal and offshore surface seawaters in selected eastern ECS areas, as was functional annotation analysis. The aims of this study were to clarify the structure and functional characteristics of the bacterioplankton communities in the investigated area and also to collect and reveal the environmental factors influencing the formation and function of the surface bacterioplankton communities. The results obtained improve our environmental profiles of the surface bacterioplankton communities in the eastern ECS areas and help advance marine ecological monitoring and ecological and environment protection.

2. Materials and Methods

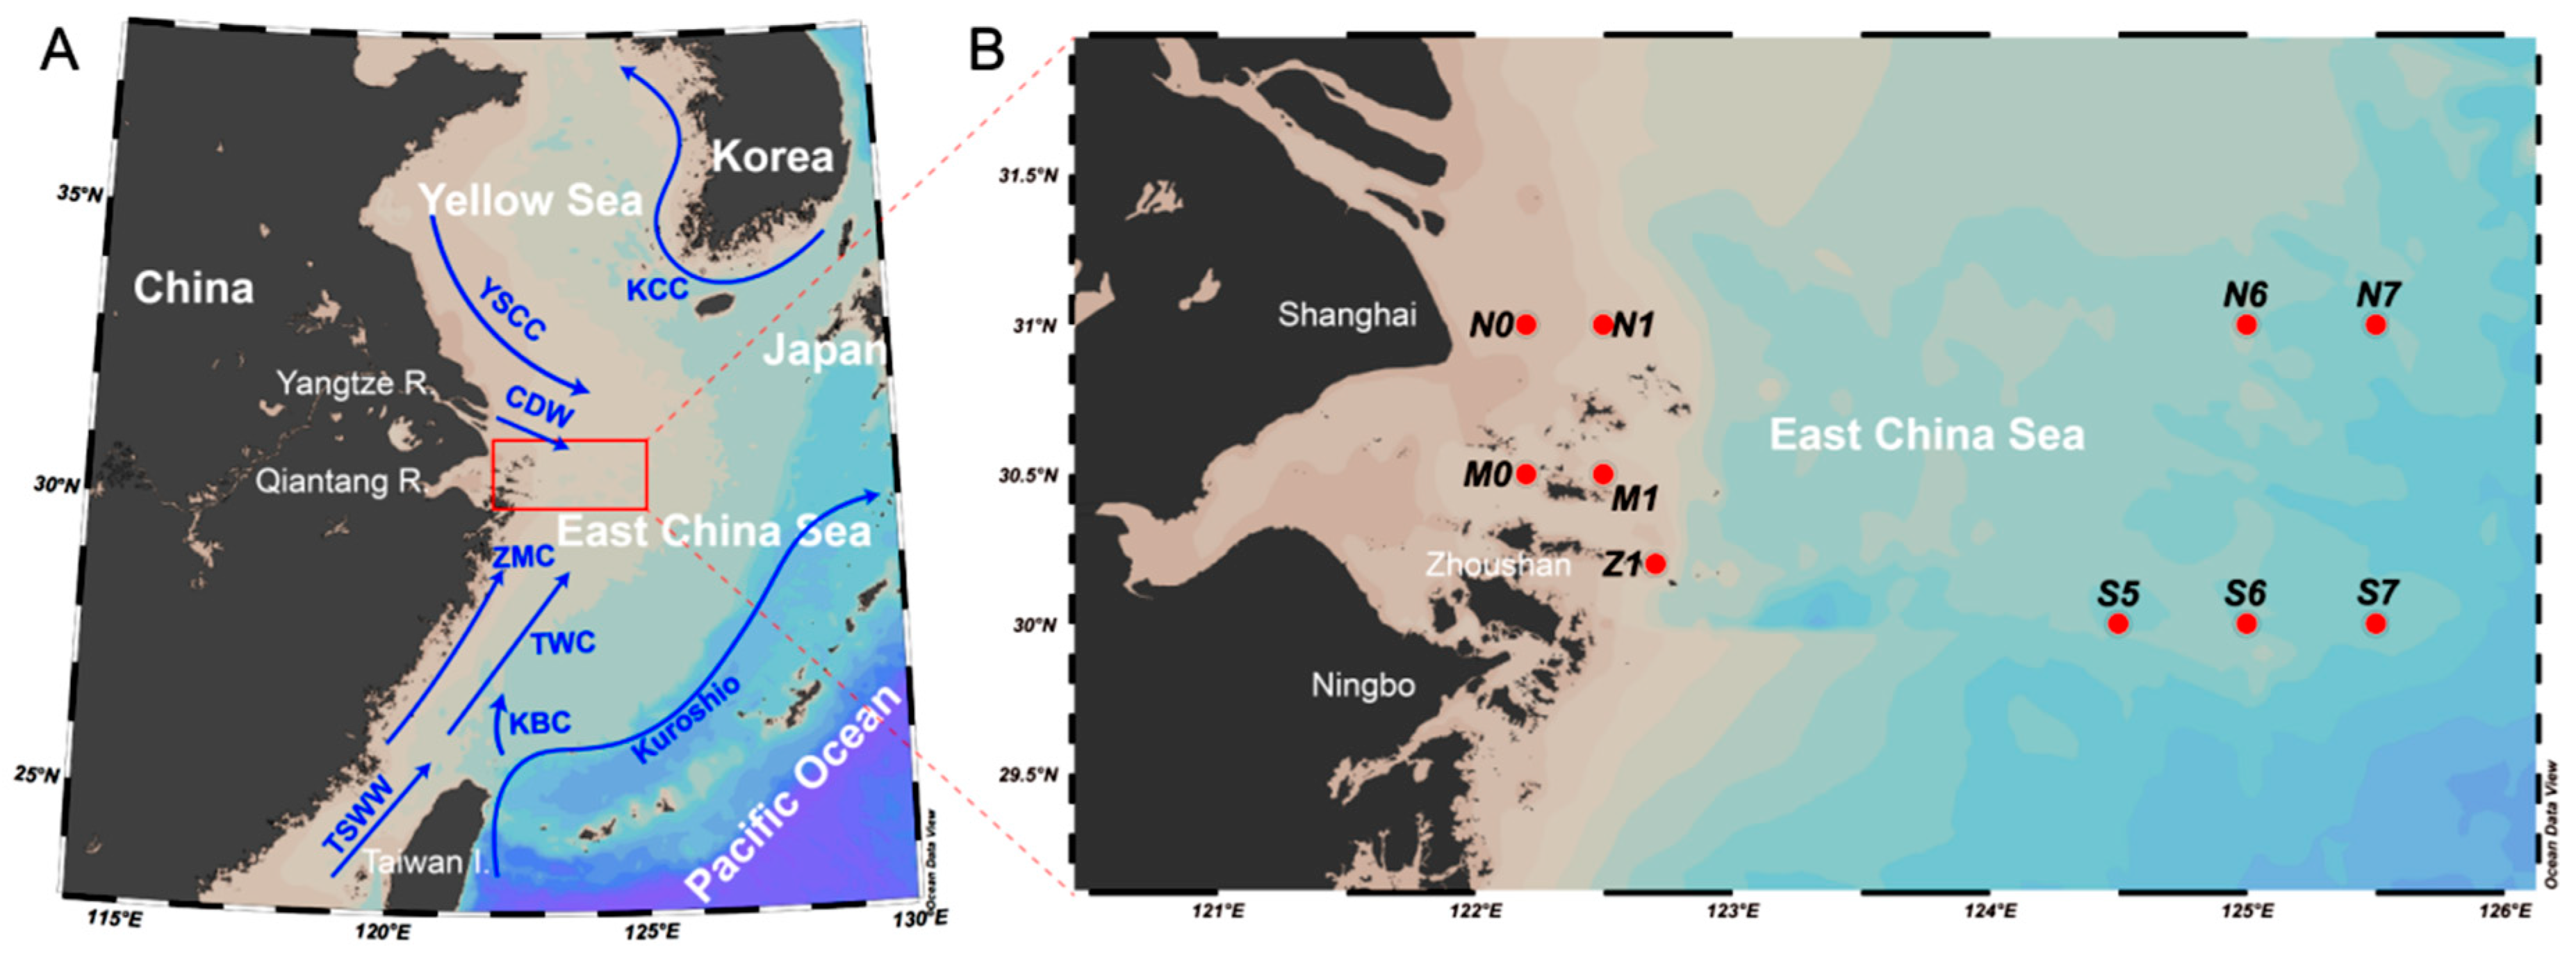
2.1. Sample and Environmental Data Collection

A seven-day cruise was carried out onboard the oceanographic research vessel “Zheyuke-2” from 8 to 14 August 2020. The station areas were between 31° N and 30° N, starting from the Zhoushan Daiquyang area and extending to the eastern 126° E area. We were surrounded by various ocean currents in this sea area (Figure 1). The cruise route passed from the Zhoushan Sea area near the Yangtze River Estuary to the edge of the ECS Shelf. In total, 10 stations were selected. At each station, environmental parameters including the depth, temperature, and conductivity were assessed using a conductivity, temperature, and depth (CTD) probe (SeaBird CTD profiler SBE 19 plus V2) equipped on the ship. The pH and dissolved oxygen were measured as described previously [22]. The obtained data were extracted using Seasoft V2 software and then plotted using Ocean Data View (ODV, version 4.7.10) software.
For the replicates, three seawater samples were collected for each station using a 12-bottle rosette sampler equipped with 8 L Niskin bottles. The station coordinates, bottom depths, and distances between stations and the shore are given in Table 1. Each sample (3 L) was passed through syringe filters (Acrodisc CR, 13 mm, 0.2 μm PTFE membranes, Pall Life Sciences, Show Low, AZ, USA) and then placed in a refrigerator at −80 °C for subsequent experiments.

2.2. DNA Extraction and 16S rRNA Gene Pyrosequencing

The total genomic DNA (gDNA) on the filter membranes was extracted using DNA extraction kits (Promega, Madison, WI, USA). The concentration and purity of the extracted gDNA were measured using a NanoDrop One Spectrophotometer (Thermo Fisher Scientifific, Waltham, MA, USA). The general bacterial primer pair, 338F (5′-ACTCCTACGGGAGGCAGCA-3′) and 806R (5′-GGACTACHVGGGTWTCTAAT-3′), with barcodes of the V3-V4 variable region of the 16S gene, was used for PCR amplification [21]. The PCR was performed using the following thermocycling procedures: 5 min at 94 °C for initialization; 30 cycles of 30 s denaturation at 94 °C, 30 s annealing at 52 °C, and 30 s extension at 72 °C, followed by a 10 min final elongation at 72 °C [22]. The PCR products were purified via 2% agarose gel electrophoresis, and the target PCR bands were recovered via tapping [23]. Sequencing was performed on the HiSeq 2500 MiSeq Genome Sequencer (Illumina, San Diego, CA, USA) at the DNA Services facility of BioMajor Bio. Corp. (Shanghai, China).

2.3. Data Analysis

2.3.1. Sequence Processing

Processing of the sequenced data was conducted by following the “Atacama soil microbiome tutorial” of QIIME2docs along with customized program scripts (https://docs.qiime2.org, accessed on 2 June 2023) [24]. The original sequence was imported into QIIME2 (version 2023.7) using the “QIIME tools import” plug-in. The following parameters were used: -input-format PairedEndFastqManifestPhred33V2. Then, the “QIIME dada2 denoise- paired” plugin was used for quality control, pruning, denoising, splicing, and chimera removal with the following parameters: --p-trunc-len-f220, --p-trunc-len-r220 [24]. This operation produced the tables of amplicon sequence variant (ASV) from the database, enabling us to obtain the taxonomy assignment and community function information. The ASV characteristic sequence and ASV abundance table were also obtained [25]. Then, the QIIME2 feature classifier plug-in was used to compare representative ASV sequences with pre-trained silva (https://data.qiime2.org/2023.2/common/silva-138-99-nb-classifier.qza, accessed on 19 July 2023), to produce a classification information table of the samples [25]. In addition, the picrust2 software (version 3.4.1) was used to predict the potential functions of the bacterial communities [26].

2.3.2. Analysis of the α- and β-Diversity

In order to compare the α-diversity, all samples were pumped out, and the depth of the pumped-out values was set at 95% of the minimum sample sequence size to correct for differences in α-diversity caused by sequencing depth. The α-diversity indices of the bacterial community were calculated using the “QIIME diversity alpha” plugin, including the Chao1, Simpson, Shannon, Pielou_e, Observed_species, and Faith_pd indices. The R package of the “ggplot2” software was used to visualize the α-diversity data [27]. The β-diversity analysis was performed using principal coordinates analysis (PCoA) based on the Bray–Curtis distance, to visually demonstrate the differences in the sample flora between different groups (implemented through the “vegan” package in R) [28,29]. The ggplot2 software (version 3.4.1) was used for data visualization [27].

2.3.3. Statistical Analysis and Data Visualization

To perform circle plotting analysis, the top 30 genera obtained based on average abundance were selected. Circos software (version v0.67-pre5) was used for online drawing [30]. Next, ggplot2 software (version 3.4.1) was used to draw stacked bar charts based on the abundance table of species composition at the phylum level. To visualize the results of KEGG functional analysis and the top 30 categories of the MetaCyc analysis (version 27.1), ggplot2 software (version 3.4.1) was also used for data visualization with the predicted functional abundance table [31].

2.3.4. Partial Least Squares Discriminant Analysis

To select the species and functions with the greatest differences between various groups, the partial least squares discriminant analysis (PLS-DA) method was used. It was implemented using the “ropls” package (version 4.3) and the results were visualized using ggplot2 software (version 3.4.1) [27]. Then, a t-test was conducted on different selected species and functions, and ggplot2 was used for data visualization [27].

2.3.5. Co-Occurrence Network Analysis

Based on the relative abundance information obtained of the main microbial species in the samples, co-occurrence network analysis was used to calculate the Spearman rank correlation coefficient. This calculation was used to determine the correlation relationship, as well as retain a correlation relationship of p < 0.05 and |r| > 0.6. Finally, the Gephi software (version 0.10.1) was used for graphing of the constructed networks [32].

2.3.6. Redundancy Analysis

Redundancy analysis (RDA) was applied to reveal the potential correlations between the microbial community structure at different taxa levels and varied environmental factors. The R package “vegan” was used for data analysis [33]. A mix of packages was used to calculate the correlations between environmental factors and species, as well as the correlations between environmental factors and bacterial functions. The thresholds for statistical significance were set as p < 0.01 and |r| > 0.6. The results obtained were visualized using “corrplot” in the “linkET” package. The heatmap was drawn using the “pheatmap” package in R [34].

3. Results

3.1. Sequencing Data Assessment

The data of the environmental factors for each statio are shown in Table 1. Based on the sequencing analysis, 3,297,665 raw reads were obtained for all ten surface seawater samples. Filtered, denoised, high-quality data, with an average of 94,999 ± 8725 reads per sample, are shown in Table S1. The barcode sequence and DNA concentration of samples are shown in Table S2. As shown in Figure S1, the sequence length distribution analysis showed the sequence lengths were all over 400 bp.
In order to evaluate whether the sequencing depth met the analysis requirements, the rarefaction curves and Shannon index were plotted, and the results are shown in Figures S2 and S3. Based on the plotting, the constructed Shannon curves for each sample reached a plateau at approximately 5000 sequences. This indicated that new bacterial species may be discovered by increasing the sequencing number; however, the bacterial diversity would not change accordingly. The results also indicated that the current sequencing amount could reflect the majority of bacterial species information in the tested samples. The sequencing depths of all samples tested met the requirements for subsequent bioinformatics analysis.

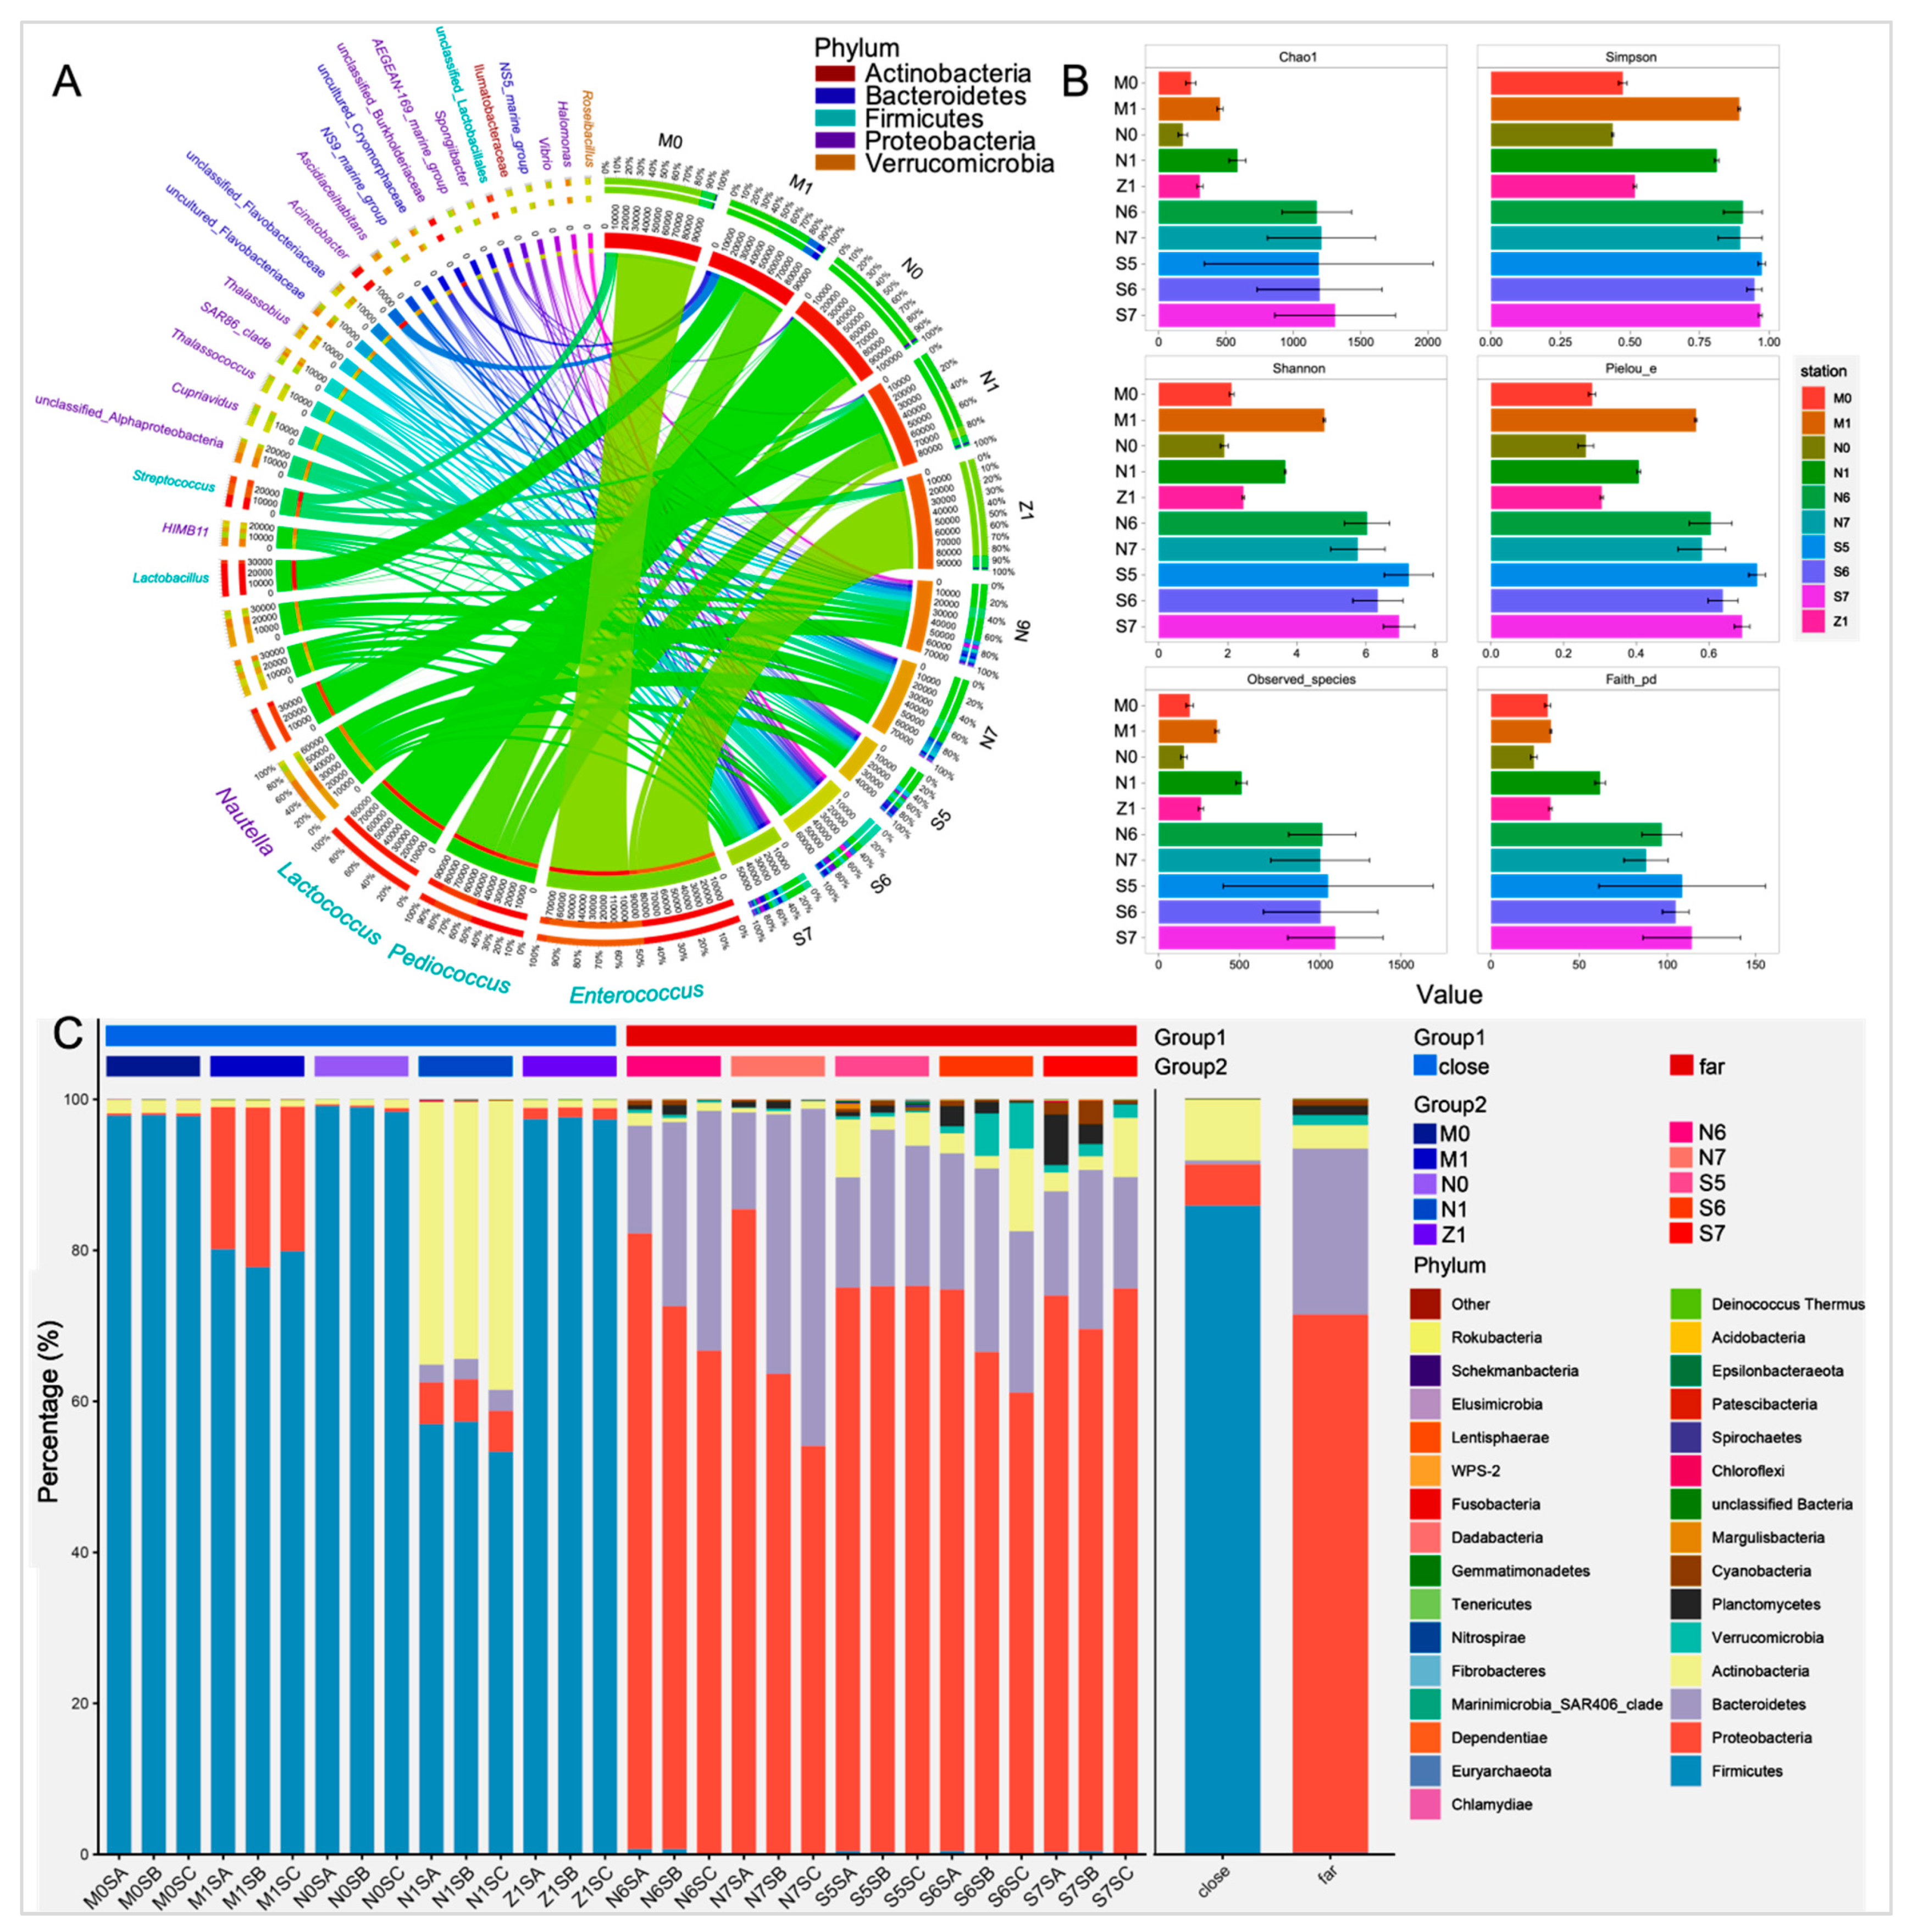
3.2. Taxonomy-Based Comparisons of Surface Bacterioplankton Communities at Phylum and Genus Levels

As shown in Figure 2A, the bacterioplankton communities at the nearshore stations were mainly predominated by firmicutes such as Enterococcus and Pediococcus. However, at the offshore stations, they were dominated by proteobacteria. The α-index of the bacterioplankton communities in the offshore areas was higher than that for the nearshore areas (Figure 2B and Figure S4). This indicated that the abundance and diversity of bacterioplankton communities in the offshore surface seawaters were higher than those in the nearshore areas.
The top 30 genera of different stations were calculated and determined based on their relative bacterial abundances in the samples (Figure 2A). The microbial composition at the phylum level was also characterized (Figure 2C). The number of phyla with an abundance over 0.1% nearshore was lower than the number offshore. At the nearshore stations, four phyla—the firmicutes (85.9%), actinobacteria (8.1%), proteobacteria (5.4%), and bacteroidetes (0.5%)—were identified, which accounted for about 99.9% of the total. Meanwhile, at the offshore stations, there were seven phyla—the proteobacteria (71.1%), bacteroidetes (22.0%), actinobacteria (3.1%), verrucomicrobia (1.3%), planctomycetes (1.3%), cyanobacteria (0.6%), and firmicutes (0.3%)—with abundance of over 0.1%, which contributed 99.7% of the total. In addition, we found that the bacterial abundances of the firmicutes and the actinobacteria in the samples at the nearshore stations were higher than that for the offshore stations. However, the bacterial abundances of the proteobacteria, bacteroidetes, verrucomicrobia, planctomycetes, and cyanobacteria in the samples of the offshore stations were greater than those for the nearshore group.

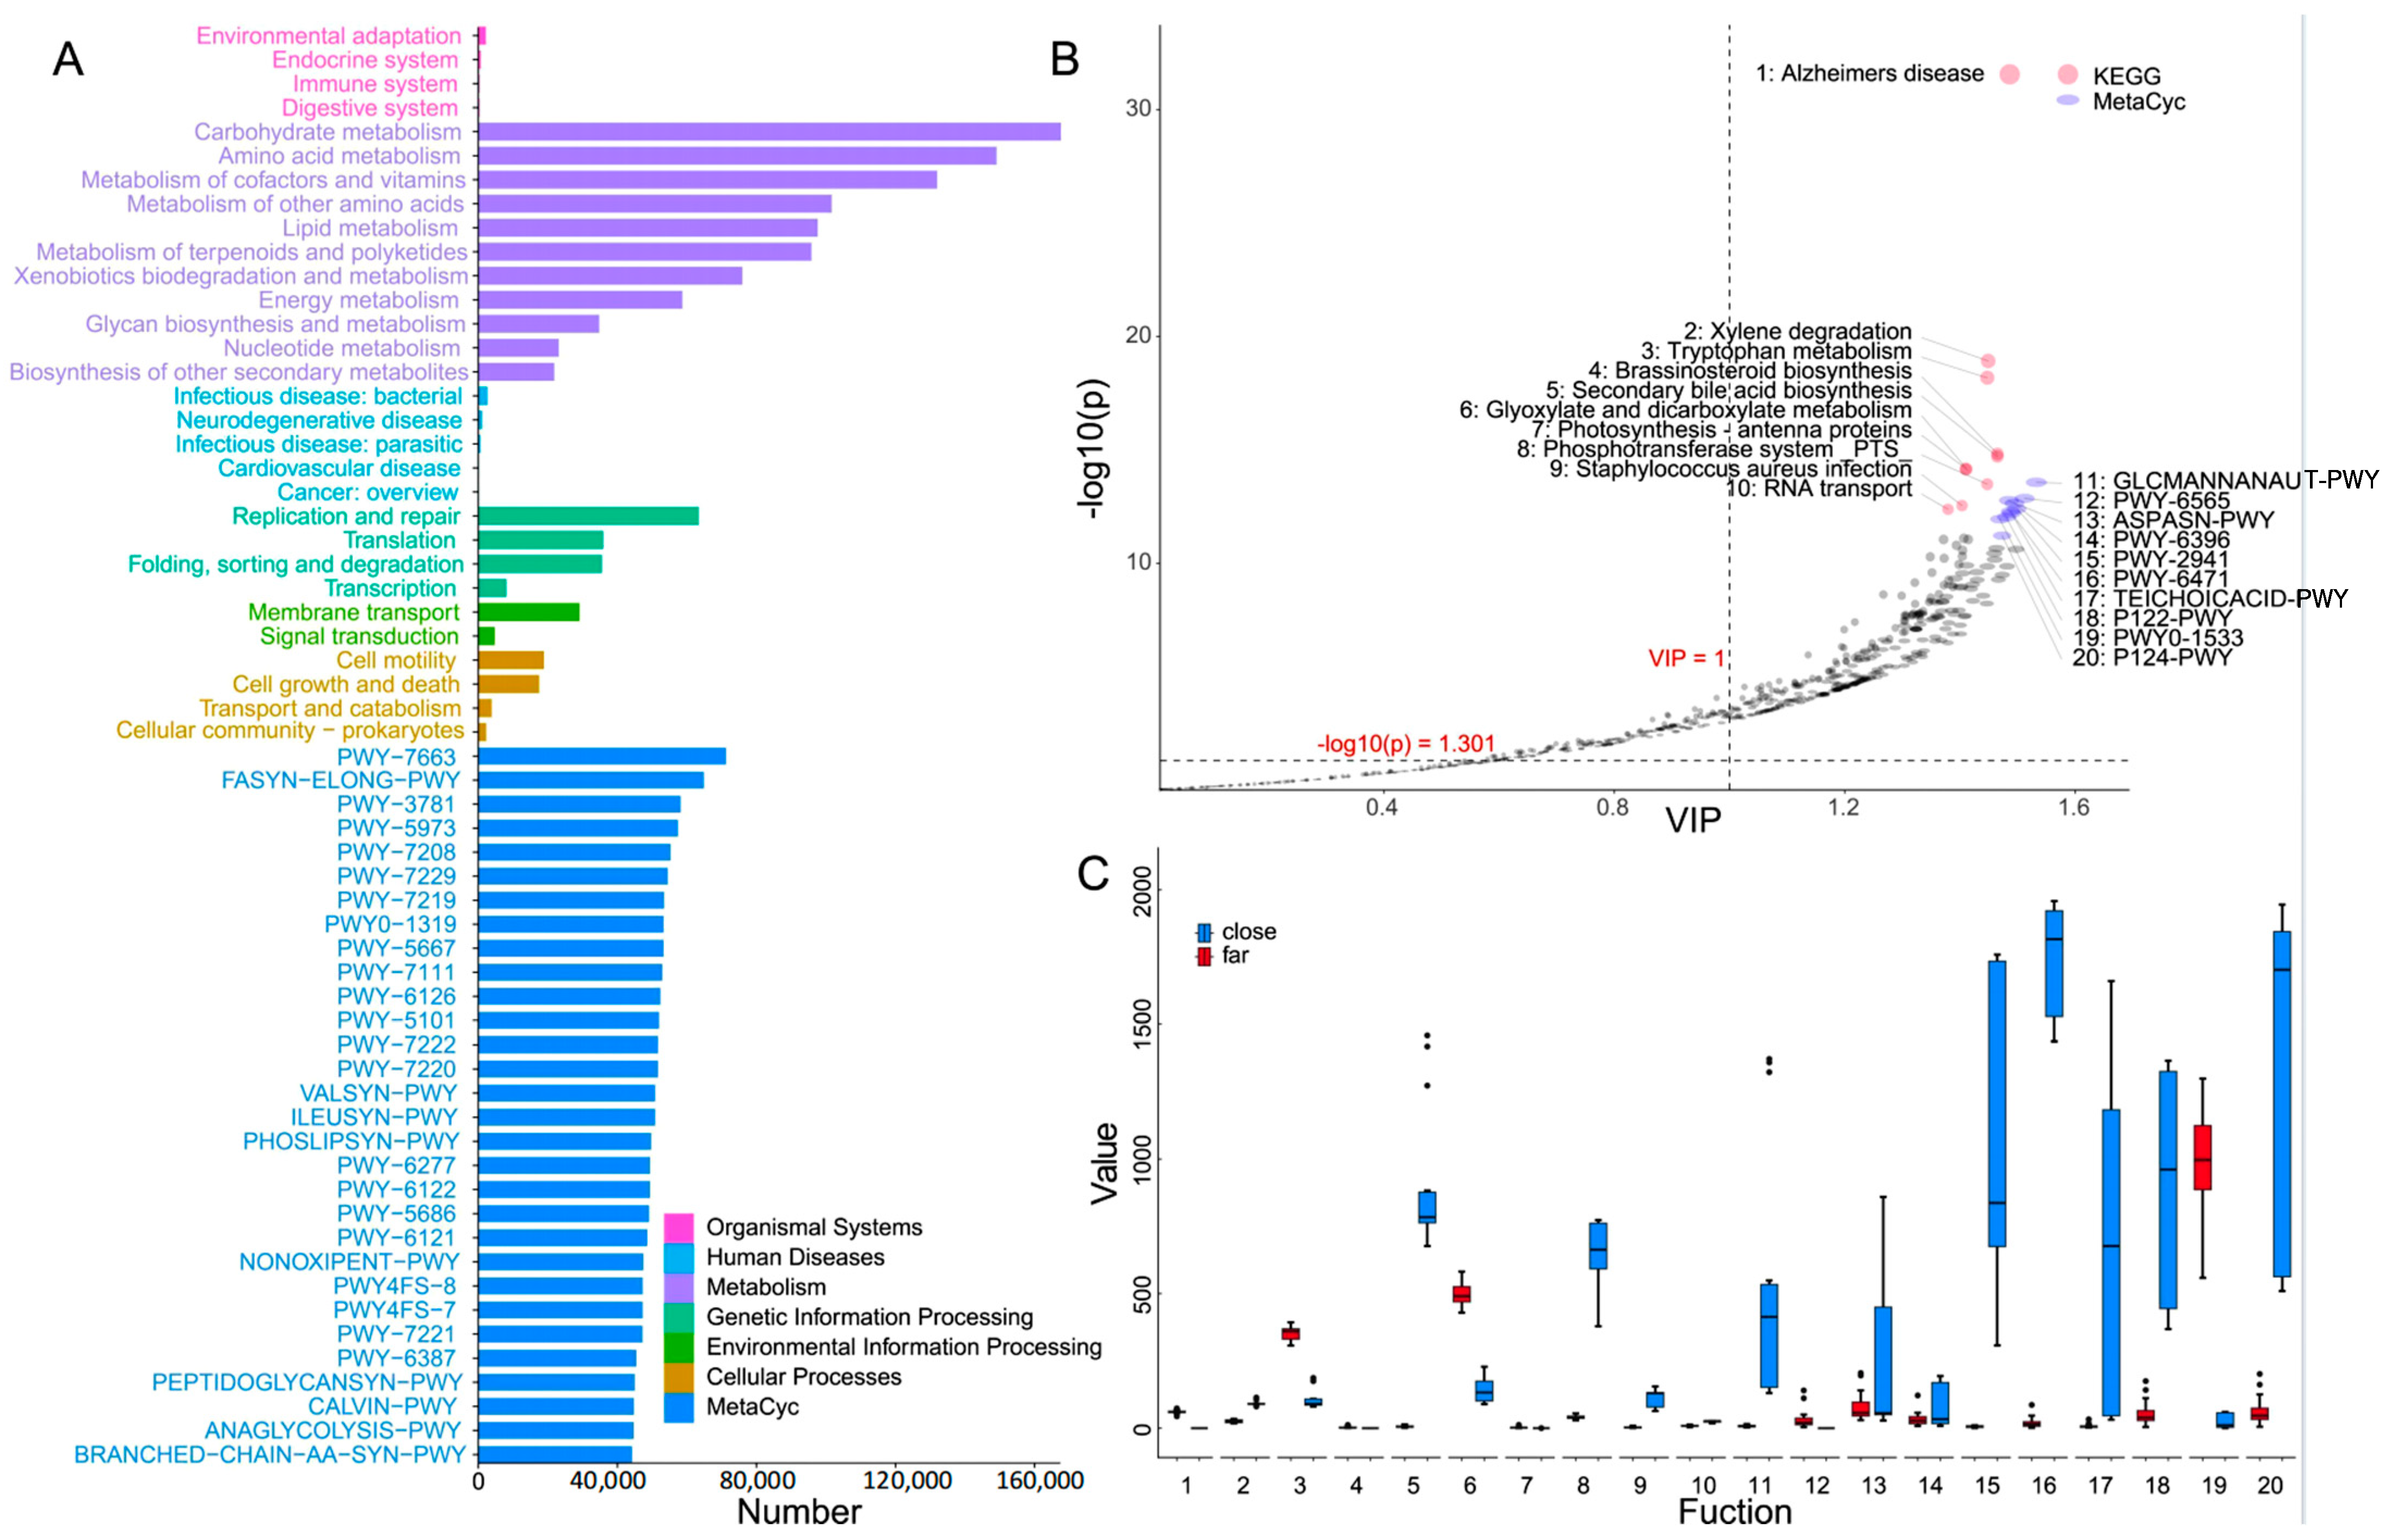
3.3. Functional Prediction of Surface Bacterioplankton Communities

The biological functions of the surface bacterioplankton communities in the samples of the nearshore and offshore stations were predicted based on KEGG pathway analysis. Then, based on the consequent MetaCyc analysis, the obtained top 30 abundant pathways were found, as shown in Figure 3A. The KEGG annotation obtained showed that the metabolism pathway (80.8% on average) was the main cluster in the k1-level pathway, followed by the genetic information processing, contributing 12.2%. Meanwhile, the k2-level pathways were mainly occupied with carbohydrate metabolism (14.3%), amino acid metabolism (12.5%), Metabolism of Cofactors and metabolism of cofactors and vitamins (11.1%) (Figure 3A and Figure S5). The top five pathways with the highest abundance during the MetCyc analysis were identified as PWY-7663, FASYN-ELONG-PWY, PWY-3781, PWY-5973, and PWY-7208, respectively. These metabolism pathways corresponded to gondoate biosynthesis (anaerobic), saturated fatty acid elongation, aerobic respiration I (cytochrome c), cis-vaccenate biosynthesis, and the superpathway of pyrimidine nucleobase salvage, respectively (Figure 3A).

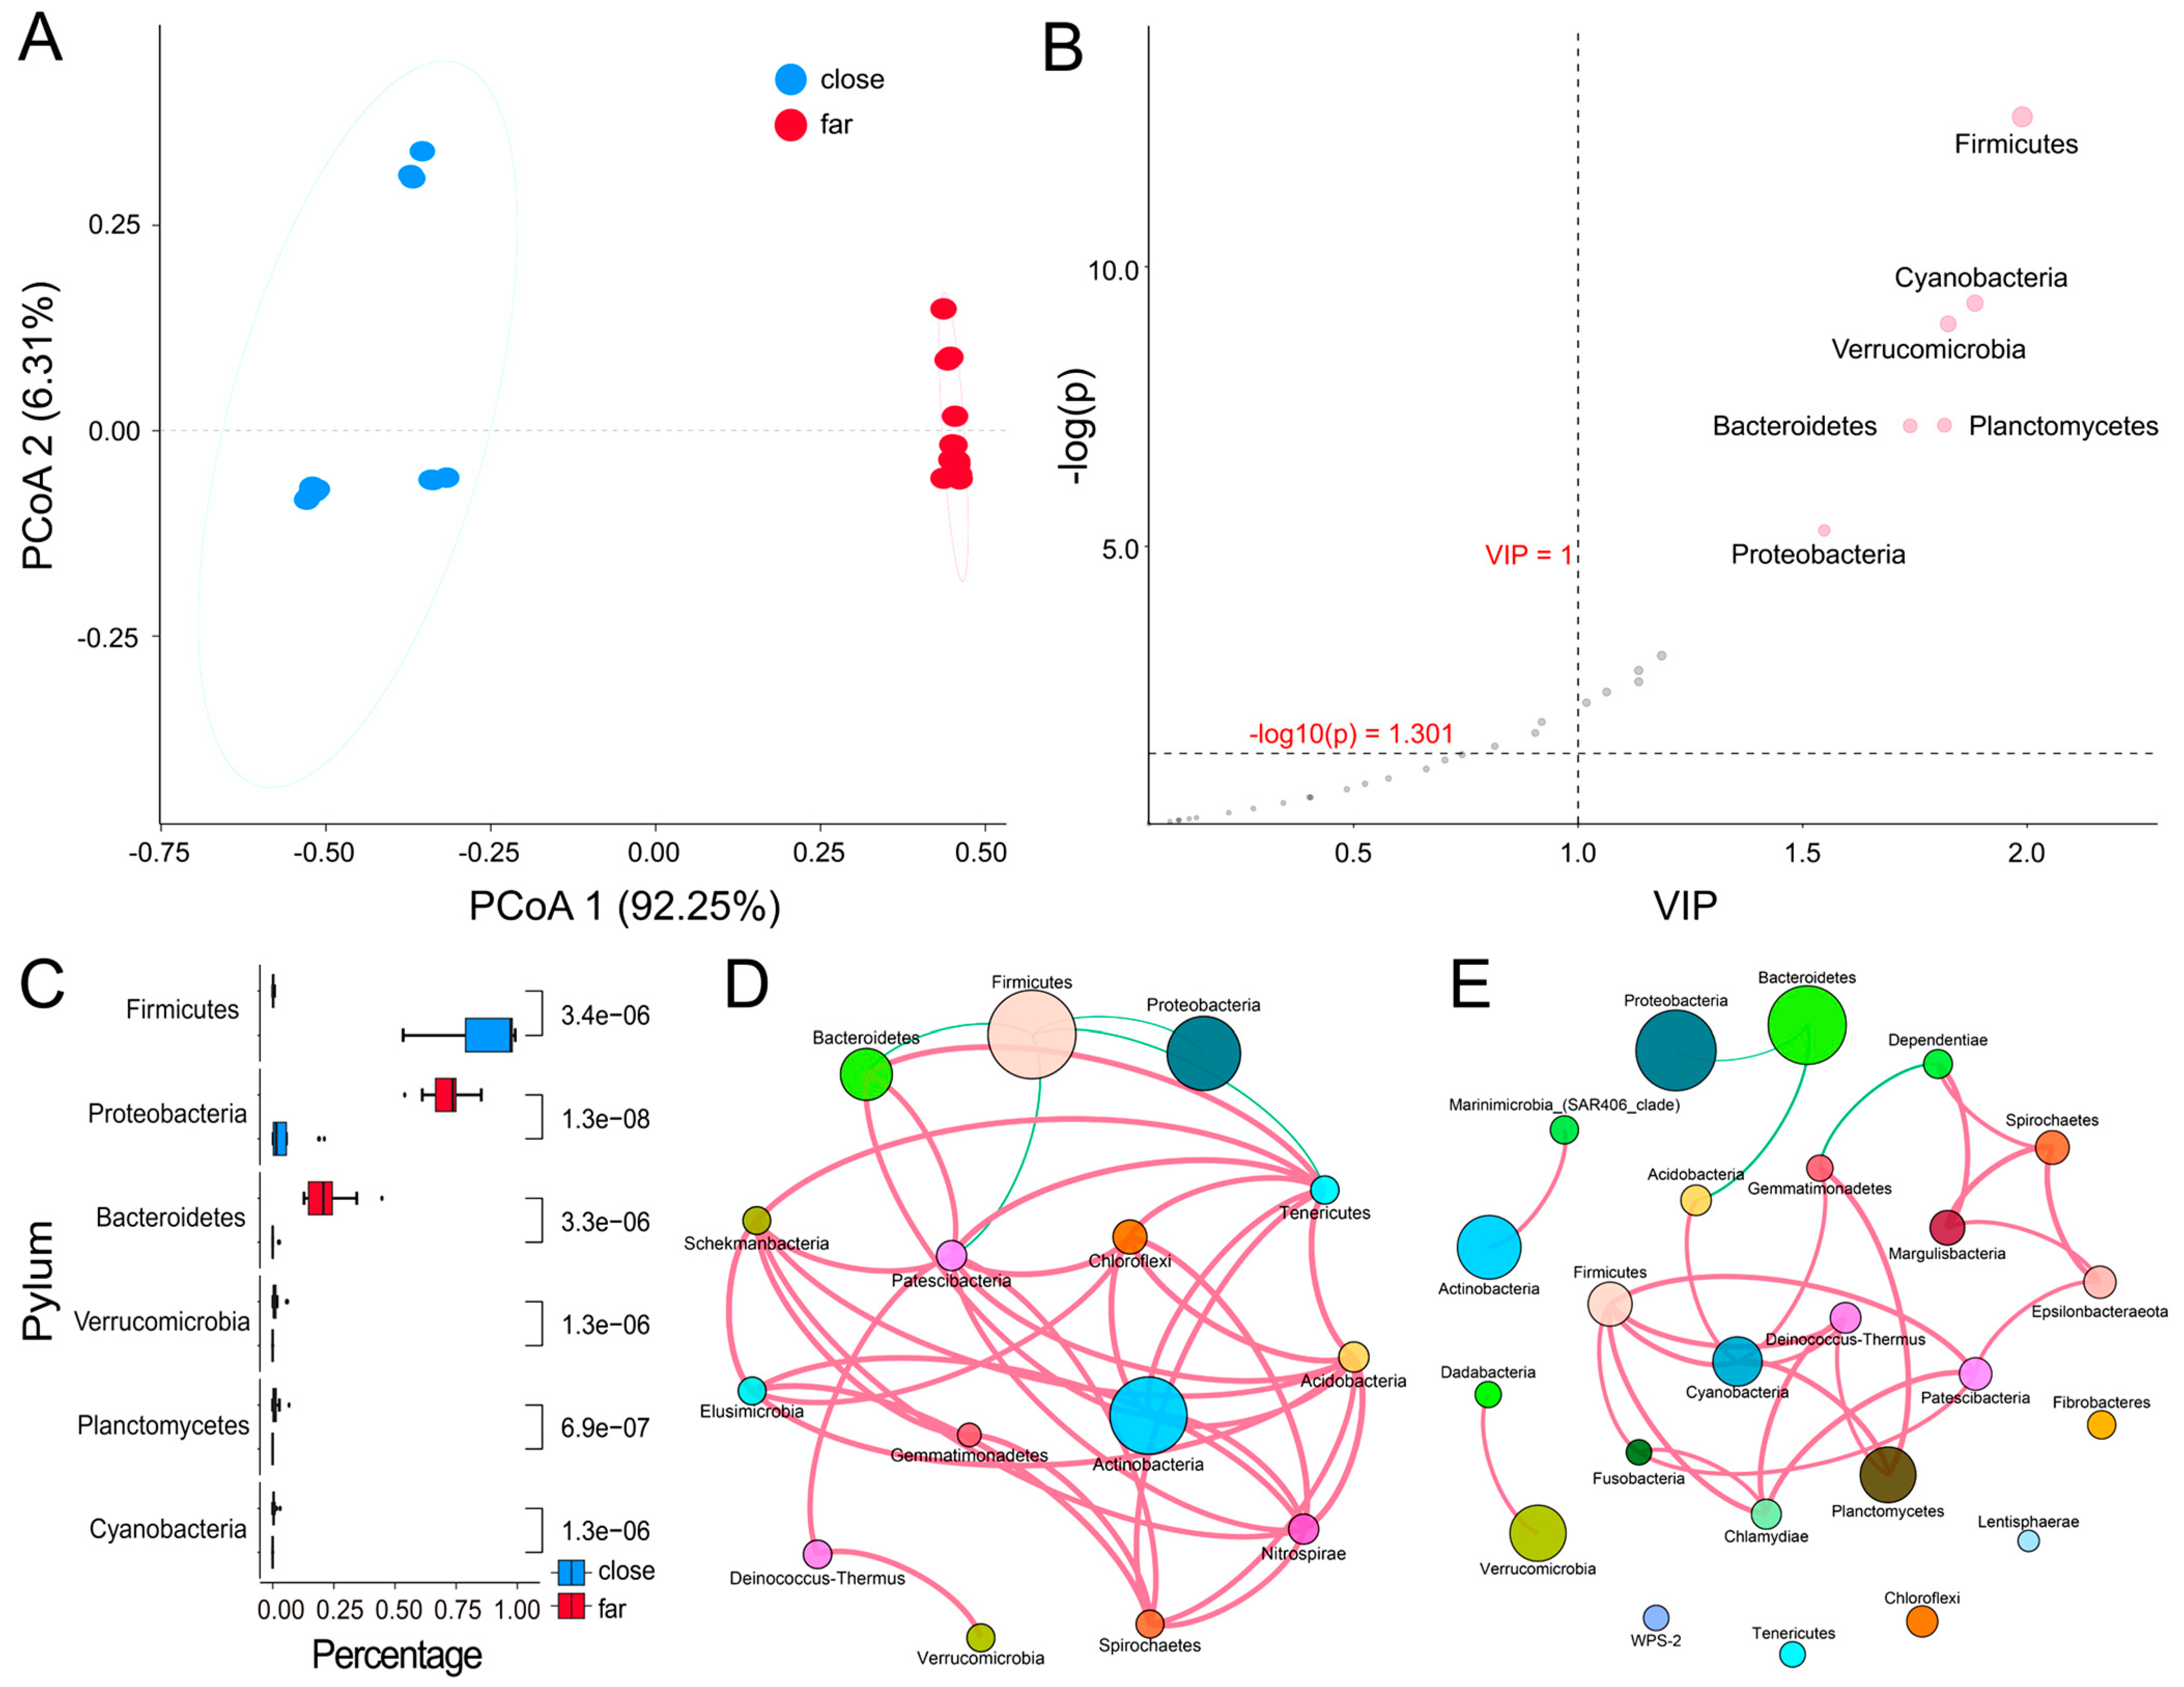
3.4. Comparison of Bacterial Biodiversity between the Nearshore and Offshore Groups

In order to explore the taxa classifications of the bacterioplankton community and the potential driving factors, weighted UniFrac principal coordinate analysis (PCoA) based on Bray–Curtis clustering as applied to explore the diversity between various samples. The first principal coordinate indicated that the samples at the horizontal phyla level were clustered separately based on their proximity to the nearshore or offshore region (Figure 4A). The distribution of the community structure was clearly demonstrated to have a spatial pattern. Meanwhile, the nearshore samples were clustered according to the site in terms of species, indicating that the distance from the shore significantly correlated with the bacterioplankton structure. The clusters offshore were denser than those nearshore, which indicated that the factors affecting the bacterial structure of the bacterioplankton community at the nearshore stations were more complex than those for the offshore areas. Our study also showed that the bacterioplankton community structure exhibited spatial differences with a geographical distribution.
For the differences in the spatial distribution and functions of the bacterioplankton community, we further explored the phyla and functions in the nearshore and offshore areas. Six phyla as the biomarkers—the firmicutes, cyanobacteria, planctomycetes, verrucomicrobia, bacteroidetes, and proteobacteria—were selected based on orthogonal partial least squares discriminant analysis (OPLS-DA), as shown in Figure 4B. Statistical significance (both p < 0.01) for the biomarker abundance was found for both the nearshore and offshore groups (Figure 4C). In addition, the relative abundances of the five phyla in the offshore group were higher compared with the nearshore group, but the firmicutes showed a relatively higher abundance nearshore compared to offshore.
The OPLS-DA was then conducted to determine the differences between the nearshore and offshore groups. The results obtained showed that there were significant differences for the 10 KEGG pathways and the 8 MetaCyc pathways of the bacterioplankton communities between the nearshore and offshore groups (Figure 3C). Based on KEGG pathway analysis, compared with the offshore group, the functional clusters with greater abundance in the nearshore group were identified as secondary bile acid biosynthesis, the phosphotransferase system (PTS), Staphylococcus aureus infection, xylene degradation, and RNA transport, respectively. Meanwhile, the functions with higher abundance in the offshore group were photosynthesis-antenna proteins, brassinosteroid biosynthesis, Alzheimer’s disease, tryptophan metabolism, and glyoxylate and dicarboxylate metabolism, respectively. The MetaCyc pathways with higher abundance in the nearshore group were PWY-6471, P124-PWY, PWY-2941, P122-PWY, TEICHOICACID-PWY, ASPASN-PWY, PWY-6396, and GLCMANNANAUT-PWY, respectively. These pathways were mainly related to the synthesis of peptidoglycan, L-lysine, poly(glycerol phosphate) wall teichoic acid, L-aspartate, L-asparagine, and 2,3-butanediol, as well as the degradation of heterolactic, N-acetylglucosamine, N-acetylmannosamine, and N-acetylneuraminate. The two pathways with higher abundance in the offshore group were PWY-6565 and PWY0-1533, which were responsible for polyamine biosynthesis and methylphosphonate degradation, respectively.
A co-occurrence network was established in order to analyze the potential relationships between the nearshore and offshore groups. It was found that the firmicutes in the nearshore group demonstrated a significant negative correlation with the acidobacteria, proteobacteria, and bacteroidetes (Figure 4D). Meanwhile, the firmicutes and the chlamydiae, patescibacteria, and cyanobacteria showed significant positive correlations in the offshore group (Figure 4E). The proteobacteria were negatively correlated in both the near- and offshore groups. Moreover, the bacteroidetes were negatively correlated with other phyla in the offshore group. In addition, various positively correlated species were also found between a few phyla in the nearshore group (Figure 4D,E). In addition, the constructed network in the offshore group possessed more modules compared with the nearshore group, which may indicate that the interactions between the species in the nearshore group were more frequent and complex.

3.5. Correlation Analysis of Surface Bacterioplankton Biodiversity with Environmental Factors

RDA was used to reveal the bacterial species classification and the correlation between the bacterial functions and environmental factors. The results obtained showed that temperature was the main environmental factor for the bacterioplankton distribution and functional classification, followed by the offshore distance (Figure 5A,B). Based on the results, the offshore distance was a significant factor when analyzing the effect of physical parameters on the bacterioplankton community. However, no significant correlation of distance between stations and Bray–Curtis dissimilarity was found. Moreover, three samples (N1SA, N1SB, and N1SC) from the most coastal station (N1) were grouped apart from the other samples of the four more nearshore stations, N0, M0, M1, and Z1, in the RDA plot.
As shown in Figure 3C, eight MetaCyc pathways exhibited significant differences: the GLCMANNANAUT-PWY, PWY-6565, PWY-2941, PWY-6471, P122-PWY, TEICHOICACID-PWY, PWY0-1533, and P124-PWY pathways. The GLCMANNANAUT-PWY pathway was negatively correlated with PWY-6565 and PWY0-1533 and positively correlated with other pathways. The PWY-6565 pathway was positively correlated with PWY0-1533 and negatively with other pathways. Moreover, PWY-2941 was negatively correlated with both PWY-1533 and PWY-6565 and positively with the other five pathways (Figure 5C). The environmental factors and the MetaCyc pathways also demonstrated good correlations based on the statistic calculation (Figure 5C). Furthermore, it was found that PWY-6565 was positively correlated with the temperature, salinity, and offshore distance. Meanwhile, PWY0-1533 was positively correlated with the temperature and offshore distance.
Four pathways, GLCMANNANAUT-PWY, TEICHOICACID-PWY, P122-PWY and P124-PWY, were negatively correlated with the temperature, salinity, and offshore distance. Additionally, PWY-2941 and PWY-6471 were negatively correlated with both the temperature and offshore distance. As shown in Figure 5C, correlations were found of the environmental factors and six phyla of the bacterioplankton community, the firmicutes, proteobacteria, bacteroidetes, verrucomicrobia, planctomycetes and cyanobacteria, all with significant differences. The firmicutes were found to be negatively correlated with the other five phyla, which were positively correlated with each other. The firmicutes were also negatively correlated with the temperature and the offshore distance. Moreover, the cyanobacteria all positively correlated with the temperature, salinity, and offshore distance, while the other four phyla were all found to positively correlate with the temperature and offshore distance (Figure 5C).

4. Discussion

4.1. Taxa Classification and Functional Characteristics of Surface Bacterioplankton Communities

In this study, we found that the firmicutes were the dominant bacterial species of surface bacterioplankton communities in the nearshore seawater samples. Previous studies have verified that the firmicutes in the nearshore seawaters are mostly Gram-positive bacteria, and they are usually resistant to desiccation and robust in a variety of extreme environments [35]. Some species of firmicutes can generate energy through anaerobic photosynthesis [36], and even when distributed in the nearshore hypoxic zone, their metabolism activities showed no significant decay [37].
The abundance of firmicutes is inversely proportional to the offshore distance. Previous studies have shown that the relative abundance of the firmicutes was higher in coastal areas compared with other offshore areas. Interestingly, the firmicutes were found to dominate in various sea areas that were seriously polluted, and it was shown that they can resist adverse impacts of harsh environments by entering dormancy [38]. The representation of firmicutes in the nearshore samples tested in the current study was relatively high, which may indicate the investigated nearshore areas have certain pollution [39].
We found that the surface bacterioplankton communities in the nearshore areas were mainly dominated by the firmicutes and actinobacteria, which were mainly involved in organic compound metabolism. Meanwhile, in the offshore areas, different bacteria predominated, specifically the proteobacteria and bacteroidetes responsible for nitrogen and sulfur metabolism. In this study, proteobacteria were the most abundant among the total bacterial community in the offshore areas. A similar observation was previously reported by Wu et al. They studied the bacterial biodiversity of the surface, middle, and bottom seawater in summer in the estuary of the Yangtze River, and found that proteobacteria (~64%) and bacteroidetes (~28%) were predominant in the investigated surface seawater samples [40]. Proteobacteria constitute the dominant phylum in offshore areas, mainly including bacteria responsible for nitrogen fixation (Rhizobium) and sulfur metabolism (Acidithiobacillus thiooxidans, Desulfovibrio) [41].
Bacteroidetes were found to be the second most abundant bacterial species in the offshore samples. In oceans, bacteroidetes are assumed to attach to particles and can degrade polymers. They prefer to consume polymers rather than monomers [41]. Bacteroidetes are abundant especially during and following algal blooms [42]. In this study, we found that the changes in bacterial functions of the bacterioplankton communities in the nearshore and offshore groups were lower than those at various taxa classification levels. This may indicate that the variability of the bacterial functional classification was high (at the phylum level), but the functional changes were relatively stable. The predicted abundances of the PWY-6565 and PWY0-1533 pathways were higher in the nearshore group compared with those in the offshore group, and they were negatively correlated with the offshore distance. These pathways are responsible for the superpathway of polyamine biosynthesis III, and for methylphosphonate degradation I, respectively. Additionally, three pathways, which are responsible for L-lysine biosynthesis (PWY-2941), peptidoglycan biosynthesis (PWY-6471), and glycerol teichoic acid biosynthesis (TEICHOIVAVID-PWY), showed high functional abundance in the offshore group. These three pathways are partly associated with bacterial reproductive division, which may explain why the variation in the abundance and diversity of bacterioplankton communities in the offshore group was greater than that in the nearshore group. However, this proposal must be verified through combined hydrochemical characterization.

4.2. Spatial Distribution and Shaping Factors of Surface Bacterioplankton Communities

This study revealed that the average temperature of the nearshore surface seawater (26.1 °C) was lower than that at the offshore stations (29.4 °C). Kirchman et al. demonstrated that higher temperatures of seawaters promoted the growth rate of specific bacterial types in the sub-Arctic Pacific areas [43]. A further biodiversity analysis indicated that the α-indexes of the bacterioplankton communities were higher in the offshore group compared with the nearshore group [43]. A similar observation was previously reported by the Tara Ocean project, which showed that temperature and dissolved oxygen were two key factors influencing the distribution patterns of bacterioplankton communities at a global scale [3,44]. In our study, the nearshore stations had lower salinity due to the effect of Changjiang Diluted Water, which lowers the salinity of the nearshore seawater (Figure 1). Among the investigated stations, station N0 (located in the estuary of the Yangtze River) had the lowest salinity. The other three stations, N1, M0, and M1, were also affected by the diluted water of the Yangtze River, and they had lower salinity values compared with those in the offshore group. Many previous studies found that salinity was the main factor influencing the composition of bacterial communities in the coastal gradient from an estuary to open ocean areas [35,45,46]. Additionally, Su et al. found that the bacterioplankton communities in the brackish water in the Pearl River Estuary were mainly dominated by the proteobacteria and actinobacteria [47], a finding that differs from ours reported in this study for the eastern ECS areas. We found that the nearshore areas were mainly dominated by the firmicutes, and the N1 station also had a large number of actinobacteria species. This may have been due to a lower salinity of the seawater at the N1 station, since most actinobacteria have a limited tolerance to salinity [48]. Previously, Zhu et al. found that the firmicutes were more abundant at mesohaline seawater stations than elsewhere [49]. That finding is consistent with our similar observation in this study. However, for the offshore stations, this was not the case. That difference may suggest that salinity has a certain effect on the bacterial structure of the bacterioplankton community in the nearshore areas, but it may not be the main shaping factor for the bacterioplankton community in the eastern ECS areas [50].
We also found that the average oxygen content in the nearshore surface seawater was usually lower than that at the offshore stations. Among the investigated stations, station M1 had the lowest surface oxygen content. This may have caused differences in bacterioplankton structure compared to the other sites. Previous studies have found that the abundance and diversity of bacteria in anoxic zones were higher than those in non-anoxic zones (surface layer) [40]. In our study, the oxygen content in the nearshore group was lower than that in the offshore group, and a similar status was also observed in the comparison of abundance and diversity of bacterioplankton communities between the two groups. Furthermore, based on the correlation analysis and RDA, we determined that dissolved oxygen was not the factor shaping the formation of bacterioplankton communities in the eastern ECS areas in our investigation. However, the oxygen content was found to be one of the key environmental factors for variation in bacterial community composition. A previous study explored the structure and function of bacterioplankton in the southern part of the ECS area, and found that the spatial difference in the classification of bacterioplankton was significantly higher than the spatial difference in functional composition [51]. Another study also found spatial changes in the bacterioplankton community along the coast that correlated to the offshore gradient in the ECS area during the different seasons [13]. In our study, we found that the composition of the bacterial communities was significantly correlated with the offshore distance. As the offshore distance increased, the abundance of the firmicutes tended to decrease, whereas the abundance of the proteobacteria and the bacteroidetes instead increased. As shown in Figure S6, the Chao1 index estimating the total richness, along with the Shannon index indicating both richness and evenness, both increased with the increasing offshore distance (R2 > 0.6). These findings may suggest that the offshore distance is a considerable factor shaping the community structure of the surface bacterioplankton communities in the investigated ECS sea areas. There are, however, some potential limitations to the approaches used in our study that merit further inveatigations; for instance, our findings need to be verified through studies based on larger-scale real sample collection and correlation analysis.

5. Conclusions

In this study, based on the bacterial populations and functional diversity profiling of the bacterioplankton communities in the surface seawater of ten stations in eastern ECS areas, as well as correlation characterization, we found that the proteobacteria and bacteroidetes were the dominant bacterial species in the offshore group, whereas the firmicutes and actinobacteria were the top two prevailing in the nearshore group. Moreover, the abundance and diversity of bacterioplankton communities in the offshore group were higher than those in the nearshore group. The main factors shaping the bacterioplankton communities in the investigated ECS areas were found to be temperature, salinity, and offshore distance, respectively. In conclusion, the findings obtained in this study add to the scientific data on bacterioplankton composition and the connection to the environmental niche in eastern ECS areas. They will help with monitoring the ecosystem and with further research on the roles of bacterioplankton communities in marine ecosystems.

Supplementary Materials

The following supporting information can be downloaded at: https://www.mdpi.com/article/10.3390/jmse12010069/s1, Table S1: Sample quality control data; Table S2: Barcode sequence and DNA concentration for each sample; Figure S1: Sequence length distribution; Figure S2: Rarefaction curves of observed_ASVs index; Figure S3: Rarefaction curves of the Shannon index; Figure S4: Six α-indexes of the nearshore and offshore stations; Figure S5: KEGG annotation results at k1 and k2 levels of all samples; Figure S6: Linear regression between the offshore distance and α-index.

Author Contributions

Conceptualization, Q.Y., X.Z. and X.Y.; methodology, P.X., J.D. and X.Y.; validation, X.Z. and X.Y.; formal analysis, P.X., J.D. and L.Z.; investigation, Z.W. and P.X.; resources, Q.Y. and X.Z.; data curation, Z.W. and X.Z.; writing—original draft preparation, Z.W. and P.X.; writing—review and editing, Q.Y., X.Z. and X.Y.; project administration, Q.Y., X.Z. and X.Y.; funding acquisition, Q.Y., X.Z. and X.Y. All authors have read and agreed to the published version of the manuscript.

Funding

This work was supported by the Key Research and Development Program of Guangdong Province (2020B0202080004), the Natural Science Foundation of Zhejiang (LY23D060005), a Project of the Collaborative Innovation Center of GDAAS (XTXM202202-2021A1515012401), an Open Project of the Key Laboratory of Fermentation Engineering of the Ministry of Education (202209FE04), a Project from the Municipal Science and Technology Bureau of Zhoushan (2022C41018), an Open Project of Zhejiang Provincial Key Laboratory of Petrochemical Pollution Control (2022Y03), an Open Project of the Key Laboratory of Prevention and Control of Livestock and Poultry Disease of Guangdong (YDWS202108), NSF of China (41876114), and the Science Foundation of Donghai Laboratory (DH-2022KF0218).

Institutional Review Board Statement

Not applicable.

Informed Consent Statement

Not applicable.

Data Availability Statement

All relevant data are included in the manuscript.

Acknowledgments

The authors acknowledge the Sophisticated Ocean Front and Fisheries Investigation Project, supported by Zhejiang Ocean University, for its sampling assistance.

Conflicts of Interest

The authors declare no conflicts of interest.

References

  1. Fu, X.; Ding, W.; Dadd, K.; Li, J.; Zhu, W.; Feng, K.; Geng, J.; Xu, X. An exotic origin of the eastern East China Sea basement before-150 Ma. Sci. Bull. 2022, 67, 1939–1942. [Google Scholar] [CrossRef] [PubMed]
  2. Wang, J.; Xu, X.; Zhou, L.; Tao, S.; Liu, X.; Shi, G. A preliminary study of microbial diversity of the surface layer sediments from the East China Sea. Oceanol. Limnol. Sin. 2012, 43, 805–813. [Google Scholar]
  3. Sunagawa, S.; Coelho, L.P.; Chaffron, S.; Kultima, J.R.; Labadie, K.; Salazar, G.; Djahanschiri, B.; Zeller, G.; Mende, D.R.; Alberti, A. Structure and function of the global ocean microbiome. Science 2015, 348, 1261359. [Google Scholar] [CrossRef] [PubMed]
  4. Chen, C.C.; Shiah, F.K.; Chiang, K.P.; Gong, G.C.; Kemp, W.M. Effects of the Changjiang (Yangtze) River discharge on planktonic community respiration in the East China Sea. J. Geophys. Res. Ocean. 2009, 114, C03005. [Google Scholar] [CrossRef]
  5. Wu, Y.; Dittmar, T.; Ludwichowski, K.-U.; Kattner, G.; Zhang, J.; Zhu, Z.Y.; Koch, B.P. Tracing suspended organic nitrogen from the Yangtze River catchment into the East China Sea. Mar. Chem. 2007, 107, 367–377. [Google Scholar] [CrossRef]
  6. Liu, C.; Wang, R.; Gao, H.; Wu, X.; Yin, D. Transport of trace metals and their bioaccumulation in zooplankton from Changjiang (Yangtze River) to the East China Sea. Sci. Total Environ. 2022, 851, 158156. [Google Scholar] [CrossRef] [PubMed]
  7. Lejeusne, C.; Chevaldonné, P.; Pergent-Martini, C.; Boudouresque, C.F.; Pérez, T. Climate change effects on a miniature ocean: The highly diverse, highly impacted Mediterranean Sea. Trends Ecol. Evol. 2010, 25, 250–260. [Google Scholar] [CrossRef] [PubMed]
  8. Duarte, C.M. Global change and the future ocean: A grand challenge for marine sciences. Front. Mar. Sci. 2014, 1, 63. [Google Scholar] [CrossRef]
  9. Cui, Z.; Du, D.; Zhang, X.; Yang, Q. Modeling and Prediction of Environmental Factors and Chlorophyll A Abundance by Machine Learning Based on Tara Oceans Data. J. Mar. Sci. Eng. 2022, 10, 1749. [Google Scholar] [CrossRef]
  10. Conan, P.; Pujo-Pay, M.; Agab, M.; Calva-Benítez, L.; Chifflet, S.; Douillet, P.; Dussud, C.; Fichez, R.; Grenz, C.; Gutierrez Mendieta, F. Biogeochemical cycling and phyto-and bacterioplankton communities in a large and shallow tropical lagoon (Términos Lagoon, Mexico) under 2009–2010 El Niño Modoki drought conditions. Biogeosciences 2017, 14, 959–975. [Google Scholar] [CrossRef]
  11. Sun, Y.; Li, H.; Wang, X.; Li, H.; Deng, Y. Kelp Culture Enhances Coastal Biogeochemical Cycles by Maintaining Bacterioplankton Richness and Regulating Its Interactions. Msystems 2023, 8, e00002–e00023. [Google Scholar] [CrossRef] [PubMed]
  12. Zhang, M.; Jiang, R.; Zhang, J.; Li, K.; Zhang, J.; Shao, L.; He, W.; He, P. The Impact of IMTA on the Spatial and Temporal Distribution of the Surface Planktonic Bacteria Community in the Surrounding Sea Area of Xiasanhengshan Island of the East China Sea. J. Mar. Sci. Eng. 2023, 11, 476. [Google Scholar] [CrossRef]
  13. Hu, H.; He, J.; Yan, H.; Hou, D.; Zhang, D.; Liu, L.; Wang, K. Seasonality in spatial turnover of Bacterioplankton along an ecological gradient in the East China Sea: Biogeographic patterns, processes and drivers. Microorganisms 2020, 8, 1484. [Google Scholar] [CrossRef] [PubMed]
  14. Giovannoni, S.J.; Nemergut, D. Microbes ride the current. Science 2014, 345, 1246. [Google Scholar] [CrossRef] [PubMed]
  15. Yang, G.-P.; Zhuang, G.-C.; Zhang, H.-H.; Dong, Y.; Yang, J. Distribution of dimethylsulfide and dimethylsulfoniopropionate in the Yellow Sea and the East China Sea during spring: Spatio-temporal variability and controlling factors. Mar. Chem. 2012, 138, 21–31. [Google Scholar] [CrossRef]
  16. Tsai, A.-Y.; Gong, G.-C.; Huang, J.-K.; Lin, Y.-C. Viral and nanoflagellate control of bacterial production in the East China Sea summer 2011. Estuar. Coast. Shelf Sci. 2013, 120, 33–41. [Google Scholar] [CrossRef]
  17. Falcón, L.I.; Noguez, A.M.; Espinosa-Asuar, L.; Eguiarte, L.E.; Souza, V. Evidence of biogeography in surface ocean bacterioplankton assemblages. Mar. Genom. 2008, 1, 55–61. [Google Scholar] [CrossRef]
  18. Cram, J.A.; Chow, C.-E.T.; Sachdeva, R.; Needham, D.M.; Parada, A.E.; Steele, J.A.; Fuhrman, J.A. Seasonal and interannual variability of the marine bacterioplankton community throughout the water column over ten years. ISME J. 2015, 9, 563–580. [Google Scholar] [CrossRef]
  19. Wang, Y.; Zhang, R.; He, Z.; Van Nostrand, J.D.; Zheng, Q.; Zhou, J.; Jiao, N. Functional Gene Diversity and Metabolic Potential of the Microbial Community in an Estuary-Shelf Environment. Front. Microbiol. 2017, 8, 1153. [Google Scholar] [CrossRef]
  20. Ye, Q.; Wu, Y.; Zhu, Z.; Wang, X.; Li, Z.; Zhang, J. Bacterial diversity in the surface sediments of the hypoxic zone near the Changjiang Estuary and in the East China Sea. MicrobiologyOpen 2016, 5, 323–339. [Google Scholar] [CrossRef]
  21. Wang, K.; Ye, X.; Chen, H.; Zhao, Q.; Hu, C.; He, J.; Qian, Y.; Xiong, J.; Zhu, J.; Zhang, D. Bacterial biogeography in the coastal waters of northern Zhejiang, East China Sea is highly controlled by spatially structured environmental gradients. Environ. Microbiol. 2015, 17, 3898–3913. [Google Scholar] [CrossRef]
  22. Zhang, X.; Ma, L.; Tian, X.; Huang, H.; Yang, Q. Biodiversity study of intracellular bacteria closely associated with paralytic shellfish poisoning dinoflagellates Alexandrium tamarense and A. minutum. Int. J. Environ. Res. 2015, 4, 23–27. [Google Scholar] [CrossRef]
  23. Li, S.; Liu, Q.; Duan, C.; Li, J.; Sun, H.; Xu, L.; Yang, Q.; Wang, Y.; Shen, X.; Zhang, L. c-di-GMP inhibits the DNA binding activity of H-NS in Salmonella. Nat. Commun. 2023, 14, 7502. [Google Scholar] [CrossRef] [PubMed]
  24. Callahan, B.J.; McMurdie, P.J.; Rosen, M.J.; Han, A.W.; Johnson, A.J.A.; Holmes, S.P. DADA2: High-resolution sample inference from Illumina amplicon data. Nat. Methods 2016, 13, 581–583. [Google Scholar] [CrossRef] [PubMed]
  25. Bokulich, N.A.; Kaehler, B.D.; Rideout, J.R.; Dillon, M.; Bolyen, E.; Knight, R.; Huttley, G.A.; Gregory Caporaso, J. Optimizing taxonomic classification of marker-gene amplicon sequences with QIIME 2′s q2-feature-classifier plugin. Microbiome 2018, 6, 90. [Google Scholar] [CrossRef] [PubMed]
  26. Douglas, G.M.; Maffei, V.J.; Zaneveld, J.R.; Yurgel, S.N.; Brown, J.R.; Taylor, C.M.; Huttenhower, C.; Langille, M.G. PICRUSt2 for prediction of metagenome functions. Nat. Biotechnol. 2020, 38, 685–688. [Google Scholar] [CrossRef]
  27. Wickham, H. ggplot2. Wires. Comput. Stat. 2011, 3, 180–185. [Google Scholar] [CrossRef]
  28. Oksanen, J.; Blanchet, F.G.; Kindt, R.; Legendre, P.; Minchin, P.R.; O’hara, R.; Simpson, G.L.; Solymos, P.; Stevens, M.H.H.; Schliep, K.P. phangorn: Phylogenetic analysis in R. Bioinformatics 2011, 27, 592–593. [Google Scholar]
  29. Gustavsson, E.K.; Zhang, D.; Reynolds, R.H.; Garcia-Ruiz, S.; Ryten, M. ggtranscript: An R package for the visualization and interpretation of transcript isoforms using ggplot2. Bioinformatics 2022, 38, 3844–3846. [Google Scholar] [CrossRef]
  30. Krzywinski, M.; Schein, J.; Birol, I.; Connors, J.; Gascoyne, R.; Horsman, D.; Jones, S.J.; Marra, M.A. Circos: An information aesthetic for comparative genomics. Genome Res. 2009, 19, 1639–1645. [Google Scholar] [CrossRef]
  31. Bastian, M.; Heymann, S.; Jacomy, M. Gephi: An open source software for exploring and manipulating networks. In Proceedings of the International AAAI Conference on Web and Social Media, San Jose, CA, USA, 17–20 May 2009; pp. 361–362. [Google Scholar]
  32. Landry, Z.C.; Vergin, K.; Mannenbach, C.; Block, S.; Yang, Q.; Blainey, P.; Carlson, C.; Giovannoni, S.J. Optofluidic Single-Cell Genome Amplification of Sub-micron Bacteria in the Ocean Subsurface. Front. Microbiol. 2018, 9, 1152. [Google Scholar] [CrossRef] [PubMed]
  33. Campbell, B.J.; Kirchman, D.L. Bacterial diversity, community structure and potential growth rates along an estuarine salinity gradient. ISME J. 2013, 7, 210–220. [Google Scholar] [CrossRef] [PubMed]
  34. Rippy, M.A.; Franks, P.J.; Feddersen, F.; Guza, R.T.; Moore, D.F. Physical dynamics controlling variability in nearshore fecal pollution: Fecal indicator bacteria as passive particles. Mar. Pollut. Bull. 2013, 66, 151–157. [Google Scholar] [CrossRef] [PubMed]
  35. Chen, C.; He, R.; Cheng, Z.; Han, M.; Zha, Y.; Yang, P.; Yao, Q.; Zhou, H.; Zhong, C.; Ning, K. The seasonal dynamics and the influence of human activities on campus outdoor microbial communities. Front. Microbiol. 2019, 10, 1579. [Google Scholar] [CrossRef] [PubMed]
  36. Chen, D.; Zeng, L.; Boot, K.; Liu, Q. Satellite observed spatial and temporal variabilities of particulate organic carbon in the East China Sea. Remote Sens. 2022, 14, 1799. [Google Scholar] [CrossRef]
  37. Coclet, C.; Garnier, C.; Durrieu, G.; Omanović, D.; D’Onofrio, S.; Le Poupon, C.; Mullot, J.U.; Briand, J.F.; Misson, B. Changes in bacterioplankton communities resulting from direct and indirect interactions with trace metal gradients in an urbanized marine coastal area. Front. Microbiol. 2019, 10, 257. [Google Scholar] [CrossRef] [PubMed]
  38. Cottrell, M.T.; Kirchman, D.L. Natural assemblages of marine proteobacteria and members of the Cytophaga-Flavobacter cluster consuming low-and high-molecular-weight dissolved organic matter. Appl. Environ. Microbiol. 2000, 66, 1692–1697. [Google Scholar] [CrossRef]
  39. Wu, D.; Dai, Q.; Liu, X.; Fan, Y.; Wang, J. Comparison of bacterial community structure and potential functions in hypoxic and non-hypoxic zones of the Changjiang Estuary. PLoS ONE 2019, 14, e0217431. [Google Scholar] [CrossRef]
  40. DeLong, E.F.; Franks, D.G.; Alldredge, A.L. Phylogenetic diversity of aggregate-attached vs. Free-living marine bacterial assemblages. Limnol. Oceanogr. 1993, 38, 924–934. [Google Scholar] [CrossRef]
  41. Pinhassi, J.; Sala, M.M.; Havskum, H.; Peters, F.; Guadayol, O.; Malits, A.; Marrasé, C. Changes in bacterioplankton composition under different phytoplankton regimens. Appl. Environ. Microbiol. 2004, 70, 6753–6766. [Google Scholar] [CrossRef]
  42. Kirchman, D.L.; Keel, R.G.; Simon, M.; Welschmeyer, N.A. Biomass and production of heterotrophic bacterioplankton in the oceanic subarctic Pacific. Deep Sea Res. Part I Oceanogr. Res. Pap. 1993, 40, 967–988. [Google Scholar] [CrossRef]
  43. Karlusich, J.J.P.; Ibarbalz, F.M.; Bowler, C. Phytoplankton in the Tara Ocean. Ann. Rev. Mar. Sci. 2020, 12, 233–265. [Google Scholar] [CrossRef] [PubMed]
  44. Fortunato, C.S.; Herfort, L.; Zuber, P.; Baptista, A.M.; Crump, B.C. Spatial variability overwhelms seasonal patterns in bacterioplankton communities across a river to ocean gradient. ISME J. 2012, 6, 554–563. [Google Scholar] [CrossRef] [PubMed]
  45. Fisher, R.F.; Long, S.R. Rhizobium–plant signal exchange. Nature 1992, 357, 655–660. [Google Scholar] [CrossRef] [PubMed]
  46. Liu, J.; Fu, B.; Yang, H.; Zhao, M.; He, B.; Zhang, X. Phylogenetic shifts of bacterioplankton community composition along the Pearl Estuary: The potential impact of hypoxia and nutrients. Front. Microbiol. 2015, 6, 64. [Google Scholar] [CrossRef] [PubMed]
  47. Su, Z.; Dai, T.; Tang, Y.; Tao, Y.; Huang, B.; Mu, Q.; Wen, D. Sediment bacterial community structures and their predicted functions implied the impacts from natural processes and anthropogenic activities in coastal area. Mar. Pollut. Bull. 2018, 131, 481–495. [Google Scholar] [CrossRef] [PubMed]
  48. Zhu, J.; Hong, Y.; Zada, S.; Hu, Z.; Wang, H. Spatial variability and co-acclimation of phytoplankton and bacterioplankton communities in the pearl river estuary, China. Front. Microbiol. 2018, 9, 2503. [Google Scholar] [CrossRef]
  49. Wang, Z.; Juarez, D.L.; Pan, J.F.; Blinebry, S.K.; Gronniger, J.; Clark, J.S.; Johnson, Z.I.; Hunt, D.E. Microbial communities across nearshore to offshore coastal transects are primarily shaped by distance and temperature. Environ. Microbiol. 2019, 21, 3862–3872. [Google Scholar] [CrossRef]
  50. Yang, W.; Zheng, S.; Zhou, S.; Zhao, L.; Zhu, J.; Lukwambe, B.; Nicholaus, R.; Li, C.; Zheng, Z. Structure and Functional Diversity of Surface Bacterioplankton Communities in an Overwintering Habitat for Large Yellow Croaker, Pseudosciaena Crocea, of the Southern East China Sea. Front. Mar. Sci. 2020, 7, 472. [Google Scholar] [CrossRef]
  51. Zhang, X.L.; Tian, X.Q.; Ma, L.Y.; Feng, B.; Liu, Q.H.; Yuan, L.D. Biodiversity of the symbiotic bacteria associated with toxic marine dinoflagellate Alexandrium tamarense. J. Biosci. Med. 2015, 3, 23–28. [Google Scholar] [CrossRef]
Figure 1. Schematic diagram of the sampling stations. The schematic map of the most influential currents around the eastern ECS areas in summer (Pane (A)). Arrows with solid lines represent the currents that flow in the given direction. Abbreviations for the ocean currents are marked forfor the Yellow Sea Coastal Current (YSCC), Changjiang Diluted Water (CDW), Taiwan Warm Current (TWC), Zhe Min Coastal Current (ZMC), Taiwan Strait Warm Water (TSWW), Kuroshio Branch Current (KBC), and Korea Coastal Current (KCC). The red box is for the sampling area shown in Pane (B).
Jmse 12 00069 g001
Figure 2. Microbial community structure analysis of the surface bacterioplankton in the investigated stations in the eastern ECS areas. Pane (A): The circos analysis at the genus level. The left half circle displays the most abundant 30 genera, with different colors representing various phylum-level classifications. Within each genus, the lines represent the proportions of samples in different groups. The right half circle displays different sampling stations, and the lines represent the proportions of different genera. Read number in the inner circle represents the bacterial abundance at the genus level; the percentage in the outer circle represents the proportion of the composition in that genus. The areas of each colored ribbon describe the contributions of different genera to different stations. Pane (B): Alpha diversity of each group, with different colors representing different sampling stations. The alpha diversity index for each station was calculated as the average of all samples, with error bars representing the SEM. Pane (C): The stacked bar plots of species at the phylum level were generated for each sample. Group 1 indicates the samples in the nearshore and offshore stations, and Group 2 indicates the different stations.
Jmse 12 00069 g002
Figure 3. Functional prediction of the bacterioplankton communities in the samples of the nearshore and offshore stations. Pane (A): The results of the KEGG functional prediction and MetaCyc functional prediction. Pane (B): The PLS-DA of the bacterioplankton functions. The red dots represent the obtained top 10 KEGG pathways that show significant differences between the samples of the nearshore and offshore stations, while the blue dots represent the top 10 MetaCyc pathways obtained. The y-axis is for the negative logarithm of significance, with the horizontal dashed line indicating p = 0.05. The x-axis is for the variable importance in the projection (VIP) value to estimate the importance of each variable, with the vertical dashed line indicating a VIP score of 1, which served as a threshold for selecting significant pathways. Pane (C): The t-test analysis for the statistical difference of the predicted biological functions.
Jmse 12 00069 g003
Figure 4. The beta-diversity analysis of the surface bacterioplankton communities between the nearshore and offshore groups. Pane (A): PCoA analysis based on the phylum abundance, where blue solid circles are for the nearshore group and red solid circles are for the offshore group. Pane (B): PLS-DA for the two groups. The red dots are for the species with the most distinct differences between the two groups. The y-axis represents the negative logarithm of significance, with a horizontal dotted line at p = 0.05. The variable importance in the projection (VIP) is represented on the y-axis, with a vertical dotted line at VIP = 1 as the threshold value for the selection. Pane (C): The t-test analysis of different species in the two groups. Pane (D): The co-occurrence network analysis for the nearshore group. Different colors represent various phyla, where the sizes of the nodes are for the relative abundance and the lines are for the correlation, with the red color for the positive and the green for the negative correlation, respectively. Only the correlation relationships with p < 0.05 and |r| > 0.6 are shown. Pane (E): The co-occurrence network analysis of the offshore group.
Jmse 12 00069 g004
Figure 5. Correlation analysis between the bacterioplankton species, functions, and environmental factors. Redundancy analysis (RDA) showing the relationship between the physicochemical parameters and bacterial abundance at the phylum level (Pane (A)), and the bacterial MetaCyc metabolic pathways (Pane (B)). Pane (C): Mantel correlation analysis between the environmental factors with taxa classification at the phylum level and the predicted bacterial function. The colors of the lines are for the correlations, with orange for a positive and green for a negative correlation, respectively. Only the correlation relationships with p < 0.01 are shown.
Jmse 12 00069 g005
Table 1. Geographic locationslocation of the 10 sampling stations and four environmental parameters for the samples.
Station No.LatitudeLongitudeOffshore Distance (km)Depth/mTemperature/°CSalinity/psuOxygen/mg/L
N031.00 E122.20 N32.501.9928.215.244.70
N131.00 E122.50 N20.501.9426.5910.924.85
M030.50 E122.20 N5.103.9725.9320.574.27
M130.50 E122.50 N3.303.4824.5325.534.13
Z130.20 E122.70 N1.001.4925.2630.065.77
N631.00 E125.00 N242.303.4929.4028.645.62
N731.00 E125.50 N297.803.9728.9529.214.72
S530.00 E124.50 N191.802.9429.2928.545.43
S630.00 E125.00 N247.303.0129.7730.364.70
S730.00 E125.50 N302.902.0329.5630.994.63
Disclaimer/Publisher’s Note: The statements, opinions and data contained in all publications are solely those of the individual author(s) and contributor(s) and not of MDPI and/or the editor(s). MDPI and/or the editor(s) disclaim responsibility for any injury to people or property resulting from any ideas, methods, instructions or products referred to in the content.

