
A Benchmark for Maritime Object Detection with Centernet on an Improved Dataset, ABOships-PLUS


Abstract
:1. Introduction
2. Related Work
2.1. Class-Generic Object Detection
2.2. Maritime Object Detection
3. CNN-Based Detectors
3.1. Anchor-Based Detectors
3.2. Anchor-Free Object Detectors
4. ABOships Dataset
5. ABOships-PLUS—An Improved ABOships Dataset
6. Experimental Results
6.1. Evaluation Criteria
- True positive (TP): a correct prediction of a ground-truth bounding box made by the detector;
- False positive (FP): an incorrect detection of a non-existent object or a misplaced detection of an existing one;
- False negative (FN): a ground-truth bounding box which was not detected.
- True negative (TN): this metric is not applicable in object detection, since the number of bounding boxes that should not be detected in a given image is infinite.
6.2. Training
6.3. Transfer Learning vs. Learning from Scratch
7. Discussion
8. Conclusions
Author Contributions
Funding
Institutional Review Board Statement
Informed Consent Statement
Data Availability Statement
Conflicts of Interest
References
- Su, L.; Chen, Y.; Song, H.; Li, W. A survey of maritime vision datasets. Multimed. Tools Appl. 2023, 82, 28873–28893. [Google Scholar] [CrossRef]
- Fefilatyev, S.; Goldgof, D.; Shreve, M.; Lembke, C. Detection and tracking of ships in open sea with rapidly moving buoy-mounted camera system. Ocean. Eng. 2012, 54, 1–12. [Google Scholar] [CrossRef]
- Deng, J.; Dong, W.; Socher, R.; Li, L.J.; Li, K.; Fei-Fei, L. Imagenet: A large-scale hierarchical image database. In Proceedings of the CVPR, Miami, FL, USA, 20–25 June 2009; IEEE: Piscataway, NJ, USA, 2009; pp. 248–255. [Google Scholar]
- Lin, T.Y.; Maire, M.; Belongie, S.; Hays, J.; Perona, P.; Ramanan, D.; Dollár, P.; Zitnick, C. Microsoft COCO: Common objects in context. In Proceedings of the ECCV, Zurich, Switzerland, 6–12 September 2014; Springer: Berlin/Heidelberg, Germany, 2014; pp. 740–755. [Google Scholar]
- Everingham, M.; Eslami, S.; Van Gool, L.; Williams, C.; Winn, J.; Zisserman, A. The Pascal Visual Object Classes Challenge: A retrospective. Int. J. Comput. Vis. 2015, 111, 98–136. [Google Scholar]
- Shao, Z.; Wu, W.; Wang, Z.; Du, W.; Li, C. Seaships: A large-scale precisely annotated dataset for ship detection. IEEE Trans. Multimed. 2018, 20, 2593–2604. [Google Scholar]
- Torralba, A.; Efros, A. Unbiased look at dataset bias. In Proceedings of the CVPR, Colorado Springs, CO, USA, 20–25 June 2011; IEEE: Piscataway, NJ, USA, 2011; pp. 1521–1528. [Google Scholar]
- Liu, Y.; Wang, R.; Shan, S.; Chen, X. Structure inference net: Object detection using scene-level context and instance-level relationships. In Proceedings of the CVPR, Salt Lake City, UT, USA, 18–23 June 2018; pp. 6985–6994. [Google Scholar]
- Teutsch, M.; Krüger, W. Classification of small boats in infrared images for maritime surveillance. In Proceedings of the 2010 International WaterSide Security Conference, Carrara, Italy, 3–5 November 2010; IEEE: Piscataway, NJ, USA, 2010; pp. 1–7. [Google Scholar]
- Staff, A.M.; Zhang, J.; Li, J.; Xie, J.; Traiger, E.A.; Glomsrud, J.A.; Karolius, K.B. An Empirical Study on Cross-Data Transferability of Adversarial Attacks on Object Detectors. In Proceedings of the AI-Cybersec@ SGAI, Cambridge, UK, 14 December 2021; pp. 38–52. [Google Scholar]
- Prasad, D.; Rajan, D.; Rachmawati, L.; Rajabally, E.; Quek, C. Video processing from electro-optical sensors for object detection and tracking in a maritime environment: A survey. IEEE Trans. Intell. Transp. Syst. 2017, 18, 1993–2016. [Google Scholar] [CrossRef]
- Zheng, Y.; Zhang, S. Mcships: A Large-Scale Ship Dataset For Detection And Fine-Grained Categorization In The Wild. In Proceedings of the 2020 IEEE International Conference on Multimedia and Expo (ICME), London, UK, 6–10 July 2020; IEEE: Piscataway, NJ, USA, 2020; pp. 1–6. [Google Scholar]
- Gundogdu, E.; Solmaz, B.; Yücesoy, V.; Koc, A. Marvel: A large-scale image dataset for maritime vessels. In Proceedings of the Asian Conference on Computer Vision, Taipei, Taiwan, 20–24 November 2016; Springer: Berlin/Heidelberg, Germany, 2016; pp. 165–180. [Google Scholar]
- Zhang, M.M.; Choi, J.; Daniilidis, K.; Wolf, M.T.; Kanan, C. VAIS: A dataset for recognizing maritime imagery in the visible and infrared spectrums. In Proceedings of the IEEE Conference on Computer Vision and Pattern Recognition Workshops, Boston, MA, USA, 7–12 June 2015; pp. 10–16. [Google Scholar]
- Zwemer, M.H.; Wijnhoven, R.G.J.; de With, P.H.N. Ship Detection in Harbour Surveillance based on Large-Scale Data and CNNs. In Proceedings of the VISIGRAPP (5: VISAPP), Madeira, Portugal, 27–29 January 2018; pp. 153–160. [Google Scholar]
- Kaur, P.; Aziz, A.; Jain, D.; Patel, H.; Hirokawa, J.; Townsend, L.; Reimers, C.; Hua, F. Sea situational awareness (seasaw) dataset. In Proceedings of the IEEE/CVF Conference on Computer Vision and Pattern Recognition, New Orleans, LA, USA, 18–24 June 2022; pp. 2579–2587. [Google Scholar]
- Petković, M.; Vujović, I.; Lušić, Z.; Šoda, J. Image Dataset for Neural Network Performance Estimation with Application to Maritime Ports. J. Mar. Sci. Eng. 2023, 11, 578. [Google Scholar] [CrossRef]
- Iancu, B.; Soloviev, V.; Zelioli, L.; Lilius, J. ABOships—An Inshore and Offshore Maritime Vessel Detection Dataset with Precise Annotations. Remote Sens. 2021, 13, 988. [Google Scholar] [CrossRef]
- Nunes, D.; Fortuna, J.; Damas, B.; Ventura, R. Real-time vision based obstacle detection in maritime environments. In Proceedings of the 2022 IEEE International Conference on Autonomous Robot Systems and Competitions (ICARSC), Santa Maria da Feira, Portugal, 29–30 April 2022; IEEE: Piscataway, NJ, USA, 2022; pp. 243–248. [Google Scholar]
- Zhou, X.; Wang, D.; Krähenbühl, P. Objects as points. arXiv 2019, arXiv:1904.07850. [Google Scholar]
- Farahnakian, F.; Zelioli, L.; Heikkonen, J. Transfer learning for maritime vessel detection using deep neural networks. In Proceedings of the 2021 IEEE International Intelligent Transportation Systems Conference (ITSC), Indianapolis, IN, USA, 19–22 September 2021; IEEE: Piscataway, NJ, USA, 2021; pp. 1–6. [Google Scholar]
- Wu, X.; Sahoo, D.; Hoi, S. Recent advances in deep learning for object detection. Neurocomputing 2020, 396, 39–64. [Google Scholar]
- Liu, L.; Ouyang, W.; Wang, X.; Fieguth, P.; Chen, J.; Liu, X.; Pietikäinen, M. Deep learning for generic object detection: A survey. Int. J. Comput. Vis. 2020, 128, 261–318. [Google Scholar] [CrossRef]
- Prasad, D.; Prasath, C.; Rajan, D.; Rachmawati, L.; Rajabaly, E.; Quek, C. Challenges in video based object detection in maritime scenario using computer vision. arXiv 2016, arXiv:1608.01079. [Google Scholar]
- Lee, S.J.; Roh, M.I.; Lee, H.W.; Ha, J.S.; Woo, I.G. Image-Based Ship Detection and Classification for Unmanned Surface Vehicle Using Real-Time Object Detection Neural Networks. In Proceedings of the ISOPE International Ocean and Polar Engineering Conference (ISOPE), Sapporo, Japan, 10–15 June 2018. [Google Scholar]
- Redmon, J.; Farhadi, A. YOLO9000: Better, faster, stronger. In Proceedings of the CVPR, Honolulu, HI, USA, 21–26 July 2017; pp. 7263–7271. [Google Scholar]
- Ren, S.; He, K.; Girshick, R.; Sun, J. Faster r-cnn: Towards real-time object detection with region proposal networks. In Proceedings of the Advances in Neural Information Processing Systems, Montreal, QC, Canada, 7–12 December 2015; pp. 91–99. [Google Scholar]
- Liu, W.; Anguelov, D.; Erhan, D.; Szegedy, C.; Reed, S.; Fu, C.Y.; Berg, A. SSD: Single shot multibox detector. In Proceedings of the ECCV, Amsterdam, The Netherlands, 11–14 October 2016; Springer: Berlin/Heidelberg, Germany, 2016; pp. 21–37. [Google Scholar]
- Sun, Y.; Wang, X.; Tang, X. Deep learning face representation from predicting 10,000 classes. In Proceedings of the IEEE Conference on Computer Vision and Pattern Recognition, Columbus, OH, USA, 23–28 June 2014; pp. 1891–1898. [Google Scholar]
- Chang, C.C.; Lin, C.J. LIBSVM: A library for support vector machines. ACM Trans. Intell. Syst. Technol. TIST 2011, 2, 1–27. [Google Scholar] [CrossRef]
- Yu, W.; Yang, K.; Bai, Y.; Xiao, T.; Yao, H.; Rui, Y. Visualizing and comparing AlexNet and VGG using deconvolutional layers. In Proceedings of the 33rd International Conference on Machine Learning, New York, NY, USA, 19–24 June 2016. [Google Scholar]
- Simonyan, K.; Zisserman, A. Very deep convolutional networks for large-scale image recognition. arXiv 2014, arXiv:1409.1556. [Google Scholar]
- Kanan, C. Fine-grained object recognition with gnostic fields. In Proceedings of the IEEE Winter Conference on Applications of Computer Vision, Steamboat Springs, CO, USA, 24–26 March 2014; IEEE: Piscataway, NJ, USA, 2014; pp. 23–30. [Google Scholar]
- Moosbauer, S.; Konig, D.; Jakel, J.; Teutsch, M. A benchmark for deep learning based object detection in maritime environments. In Proceedings of the CVPR Workshops, Long Beach, CA, USA, 16–17 June 2019; IEEE: Piscataway, NJ, USA, 2019. [Google Scholar]
- Dai, J.; Li, Y.; He, K.; Sun, J. R-fcn: Object detection via region-based fully convolutional networks. In Proceedings of the Advances in Neural Information Processing Systems, Barcelona, Spain, 5–10 December 2016; pp. 379–387. [Google Scholar]
- He, K.; Gkioxari, G.; Dollár, P.; Girshick, R. Mask r-cnn. In Proceedings of the ICCV, Venice, Italy, 22–29 October 2017; pp. 2961–2969. [Google Scholar]
- Law, H.; Deng, J. Cornernet: Detecting objects as paired keypoints. In Proceedings of the ECCV, Munich, Germany, 8–14 September 2018; pp. 734–750. [Google Scholar]
- Law, H.; Teng, Y.; Russakovsky, O.; Deng, J. Cornernet-lite: Efficient keypoint based object detection. arXiv 2019, arXiv:1904.08900. [Google Scholar]
- Duan, K.; Bai, S.; Xie, L.; Qi, H.; Huang, Q.; Tian, Q. Centernet: Keypoint triplets for object detection. In Proceedings of the Proceedings of ICCV, Seoul, Republic of Korea, 27 October–2 November 2019; pp. 6569–6578. [Google Scholar]
- Taha, A.A.; Hanbury, A. Metrics for evaluating 3D medical image segmentation: Analysis, selection, and tool. BMC Med. Imaging 2015, 15, 1–28. [Google Scholar] [CrossRef] [PubMed]
- Padilla, R.; Netto, S.L.; Da Silva, E.A. A survey on performance metrics for object-detection algorithms. In Proceedings of the 2020 International Conference on Systems, Signals and Image Processing (IWSSIP), Sofia, Bulgaria, 1–3 June 2020; IEEE: Piscataway, NJ, USA, 2020; pp. 237–242. [Google Scholar]
- Kingma, D.P.; Ba, J. Adam: A method for stochastic optimization. arXiv 2014, arXiv:1412.6980. [Google Scholar]
- Shao, Z.; Wang, L.; Wang, Z.; Du, W.; Wu, W. Saliency-aware convolution neural network for ship detection in surveillance video. IEEE Trans. Circuits Syst. Video Technol. 2019, 30, 781–794. [Google Scholar] [CrossRef]
- Russakovsky, O.; Deng, J.; Su, H.; Krause, J.; Satheesh, S.; Ma, S.; Huang, Z.; Karpathy, A.; Khosla, A.; Bernstein, M.; et al. Imagenet large scale visual recognition challenge. Int. J. Comput. Vis. 2015, 115, 211–252. [Google Scholar] [CrossRef]


| Maritime Datasets | ||||
|---|---|---|---|---|
| Denomination | Images | Annotations | Classes | Resolution |
| SeaShips [6] | 31,455 | 40,077 | 6 | 1920 × 1080 |
| SMD [11] | 17,450 | 192,980 | 10 | 1920 × 1080 |
| McShips [12] | 14,709 | 26,529 | 13 | varied |
| Harbour Surveillance [15] | 48,966 | 70,513 | 1 | 2048 × 1536 |
| SeaSAw [16] | 1,900,000 | 14,600,000 | 12 | varied |
| Maritime Ports [17] | 19,337 | 27,849 | 12 | 1920 × 1080 |
| ABOships [18] | 9880 | 41,967 | 11 | 1920 × 720 |
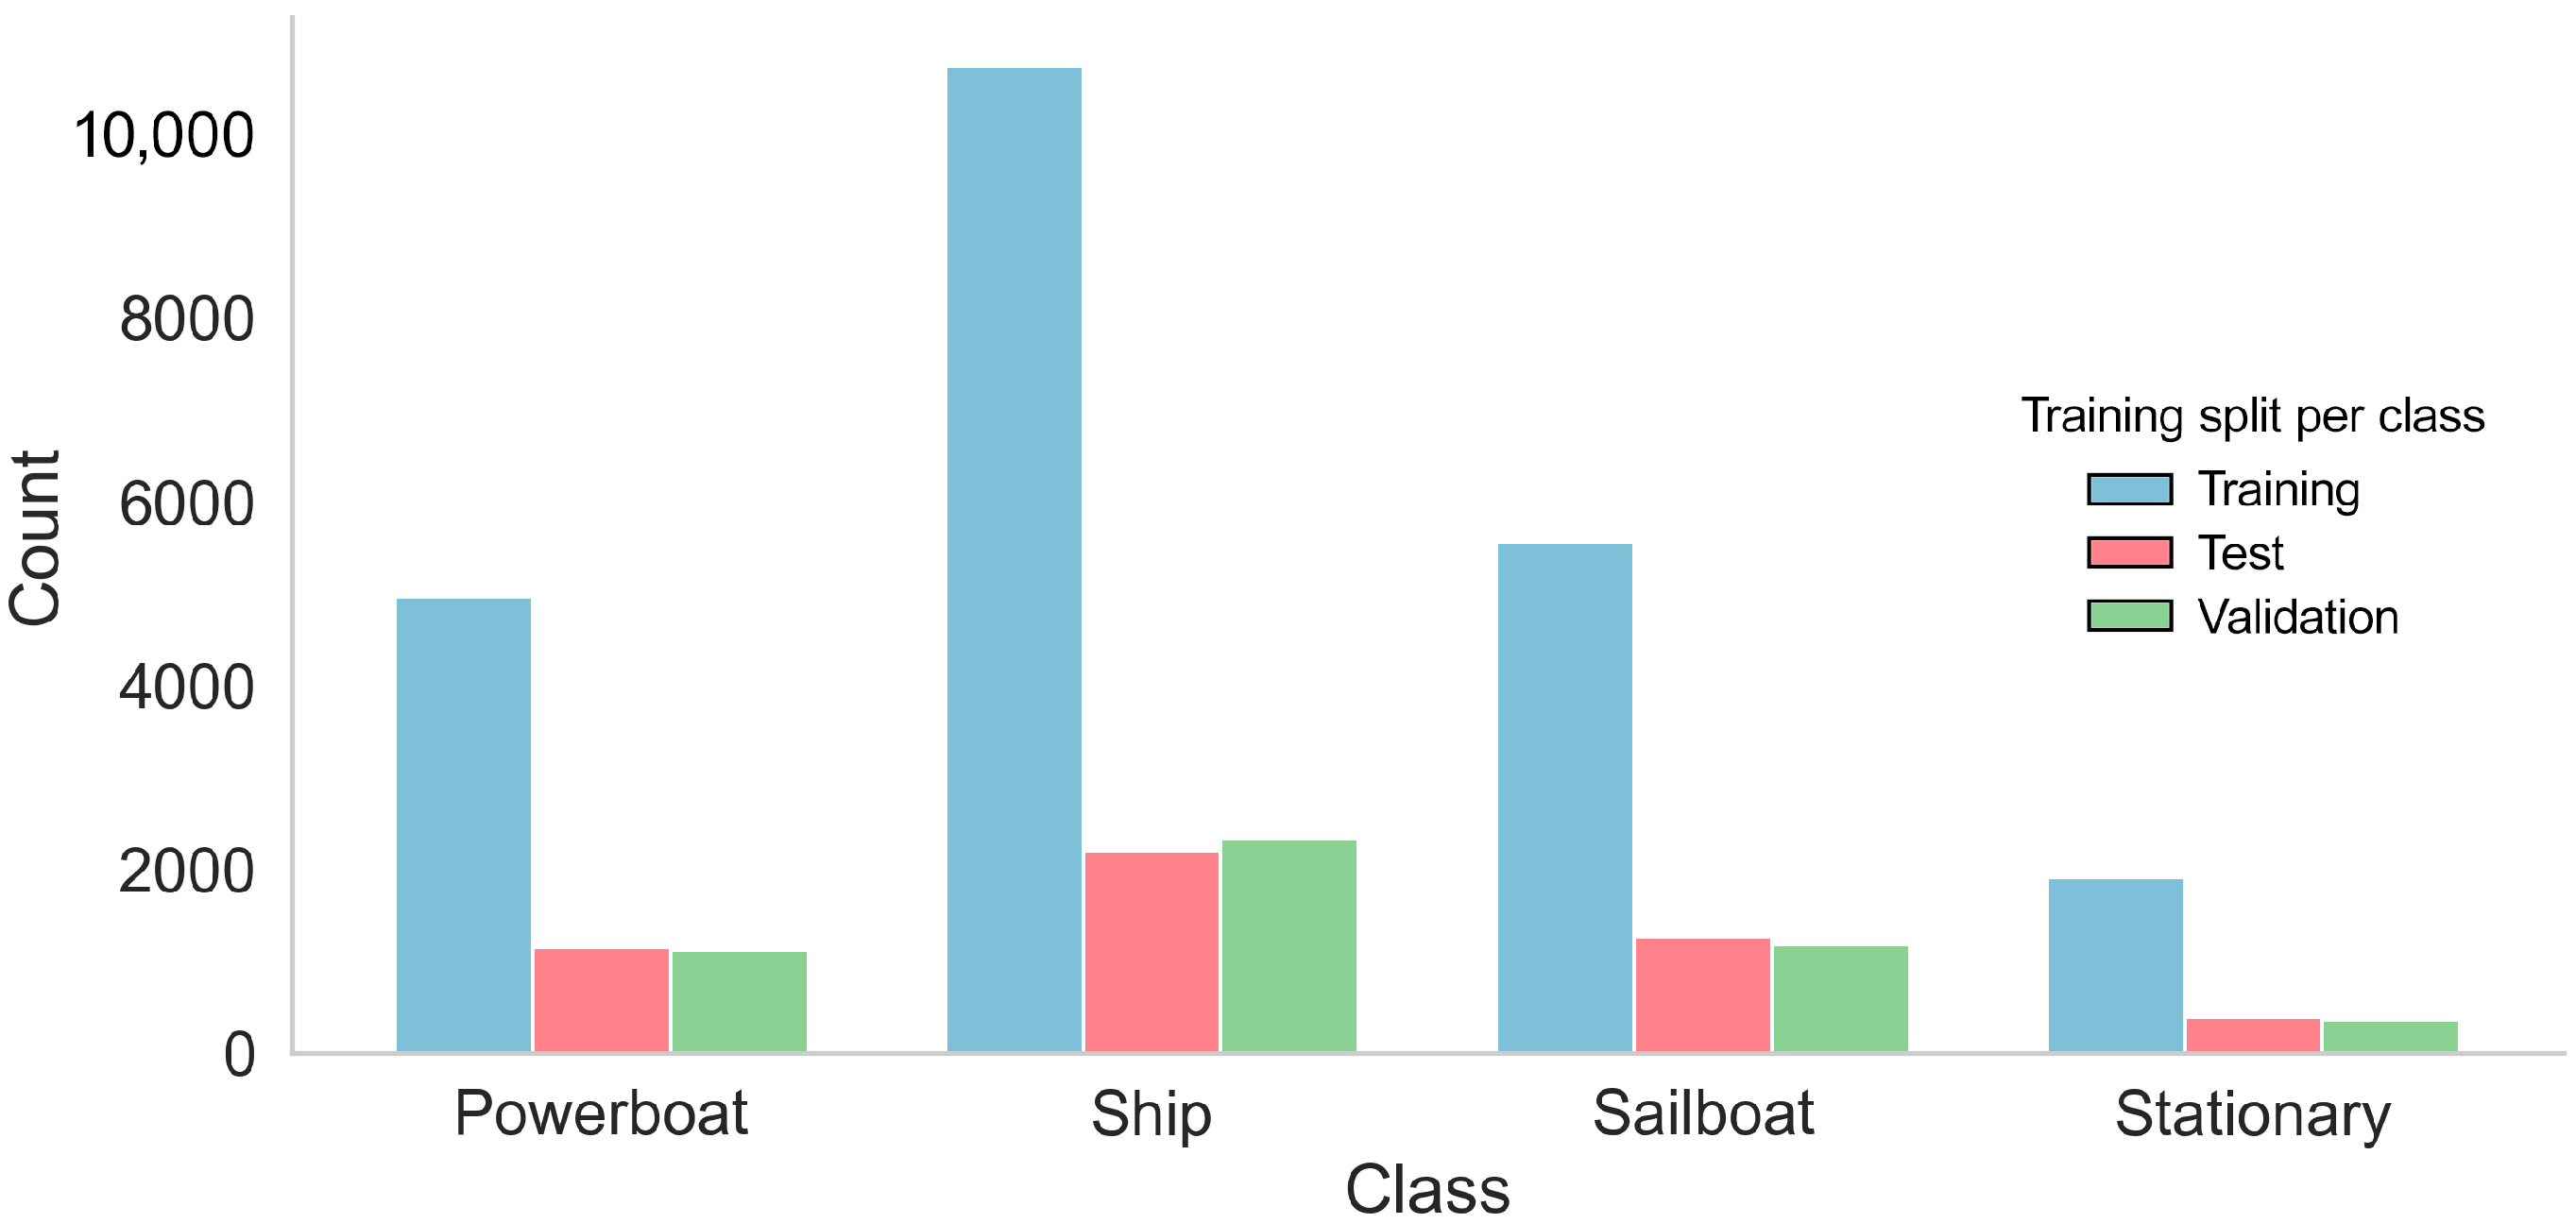
| Properties of ABOships-PLUS | ||||
|---|---|---|---|---|
| ABOships-PLUS Super Class | ABOships Included Classes | Annotations per Class | Annotations Ratio over All Classes | Annotated Images per Class |
| Sailboat | Sailboat | 8029 | 24% | 3756 |
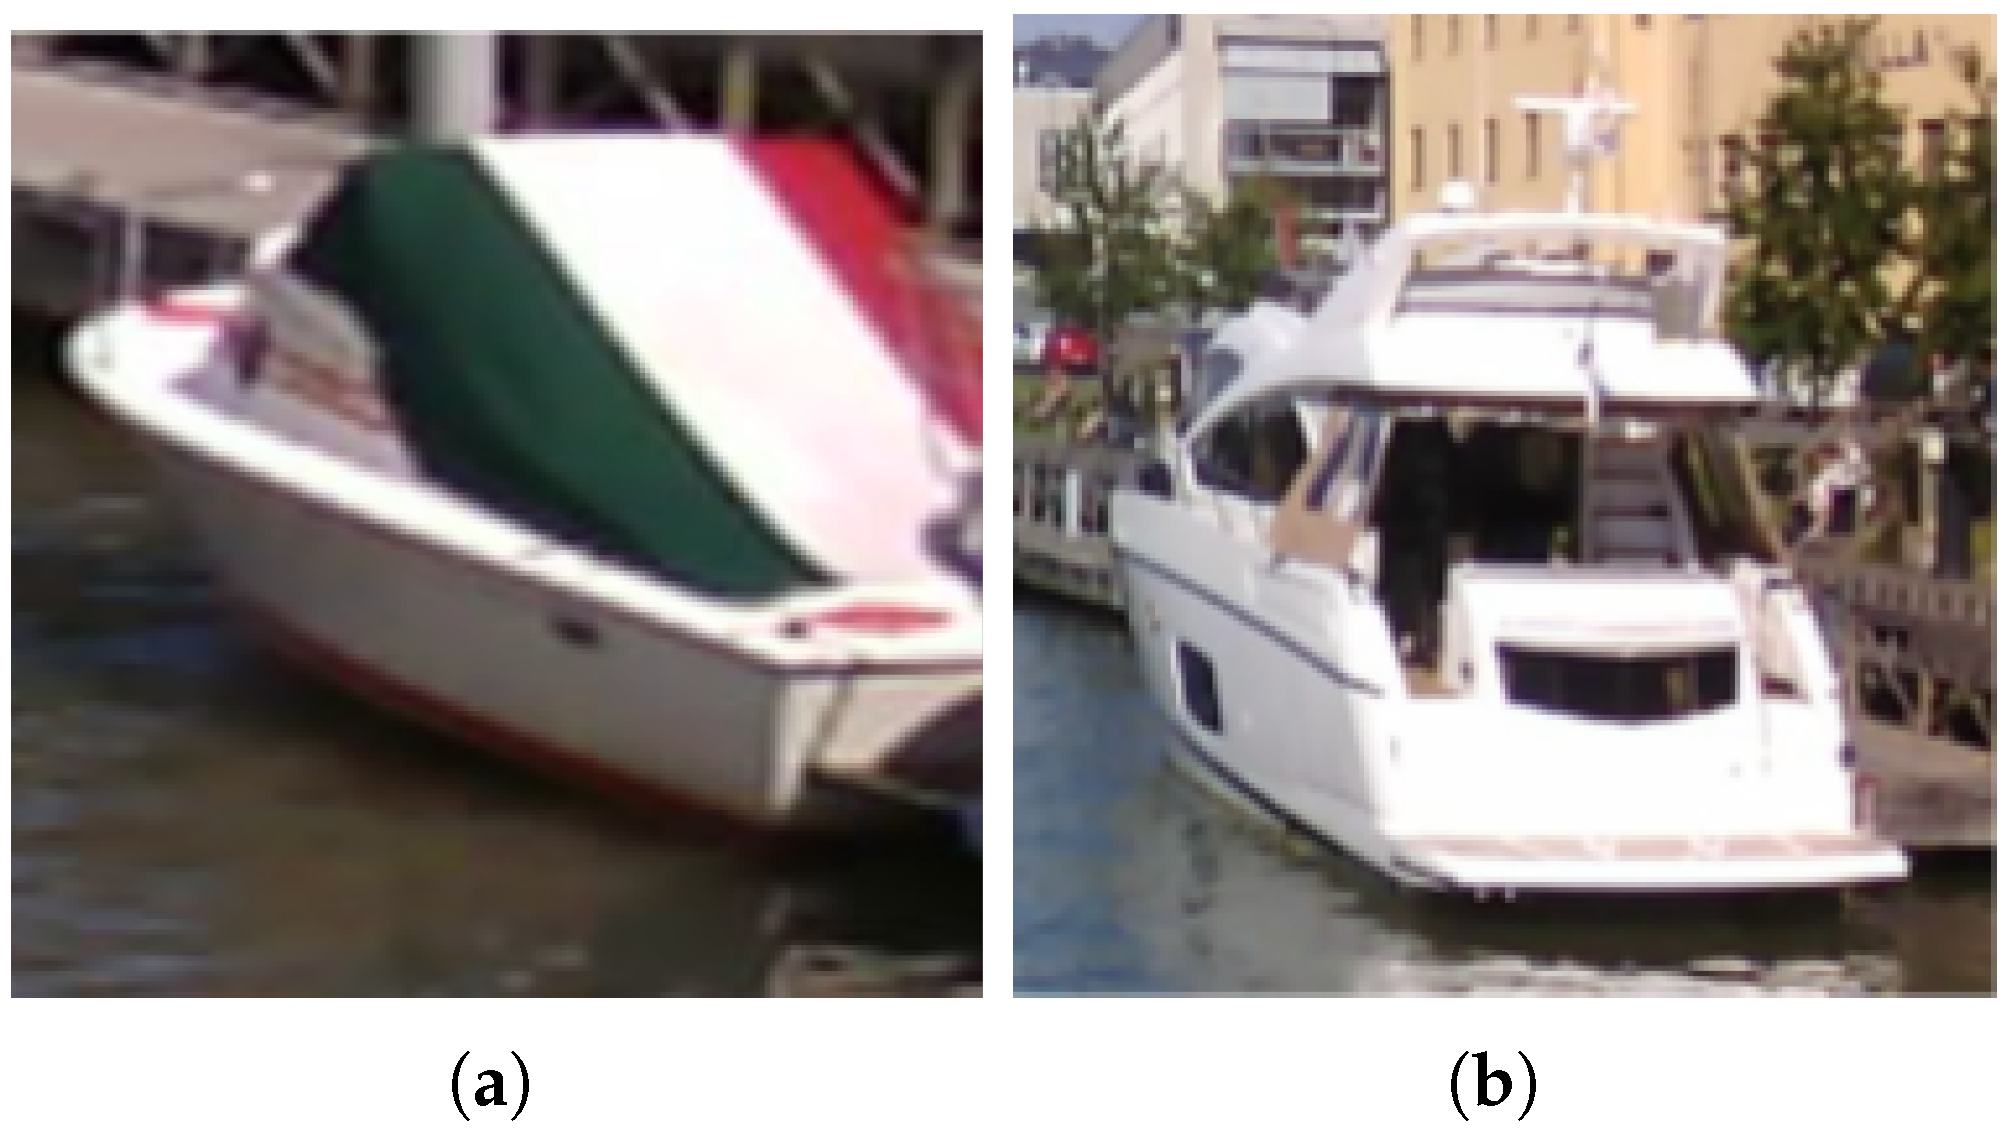
| Powerboat | Boat, Motorboat | 7244 | 22% | 4044 |
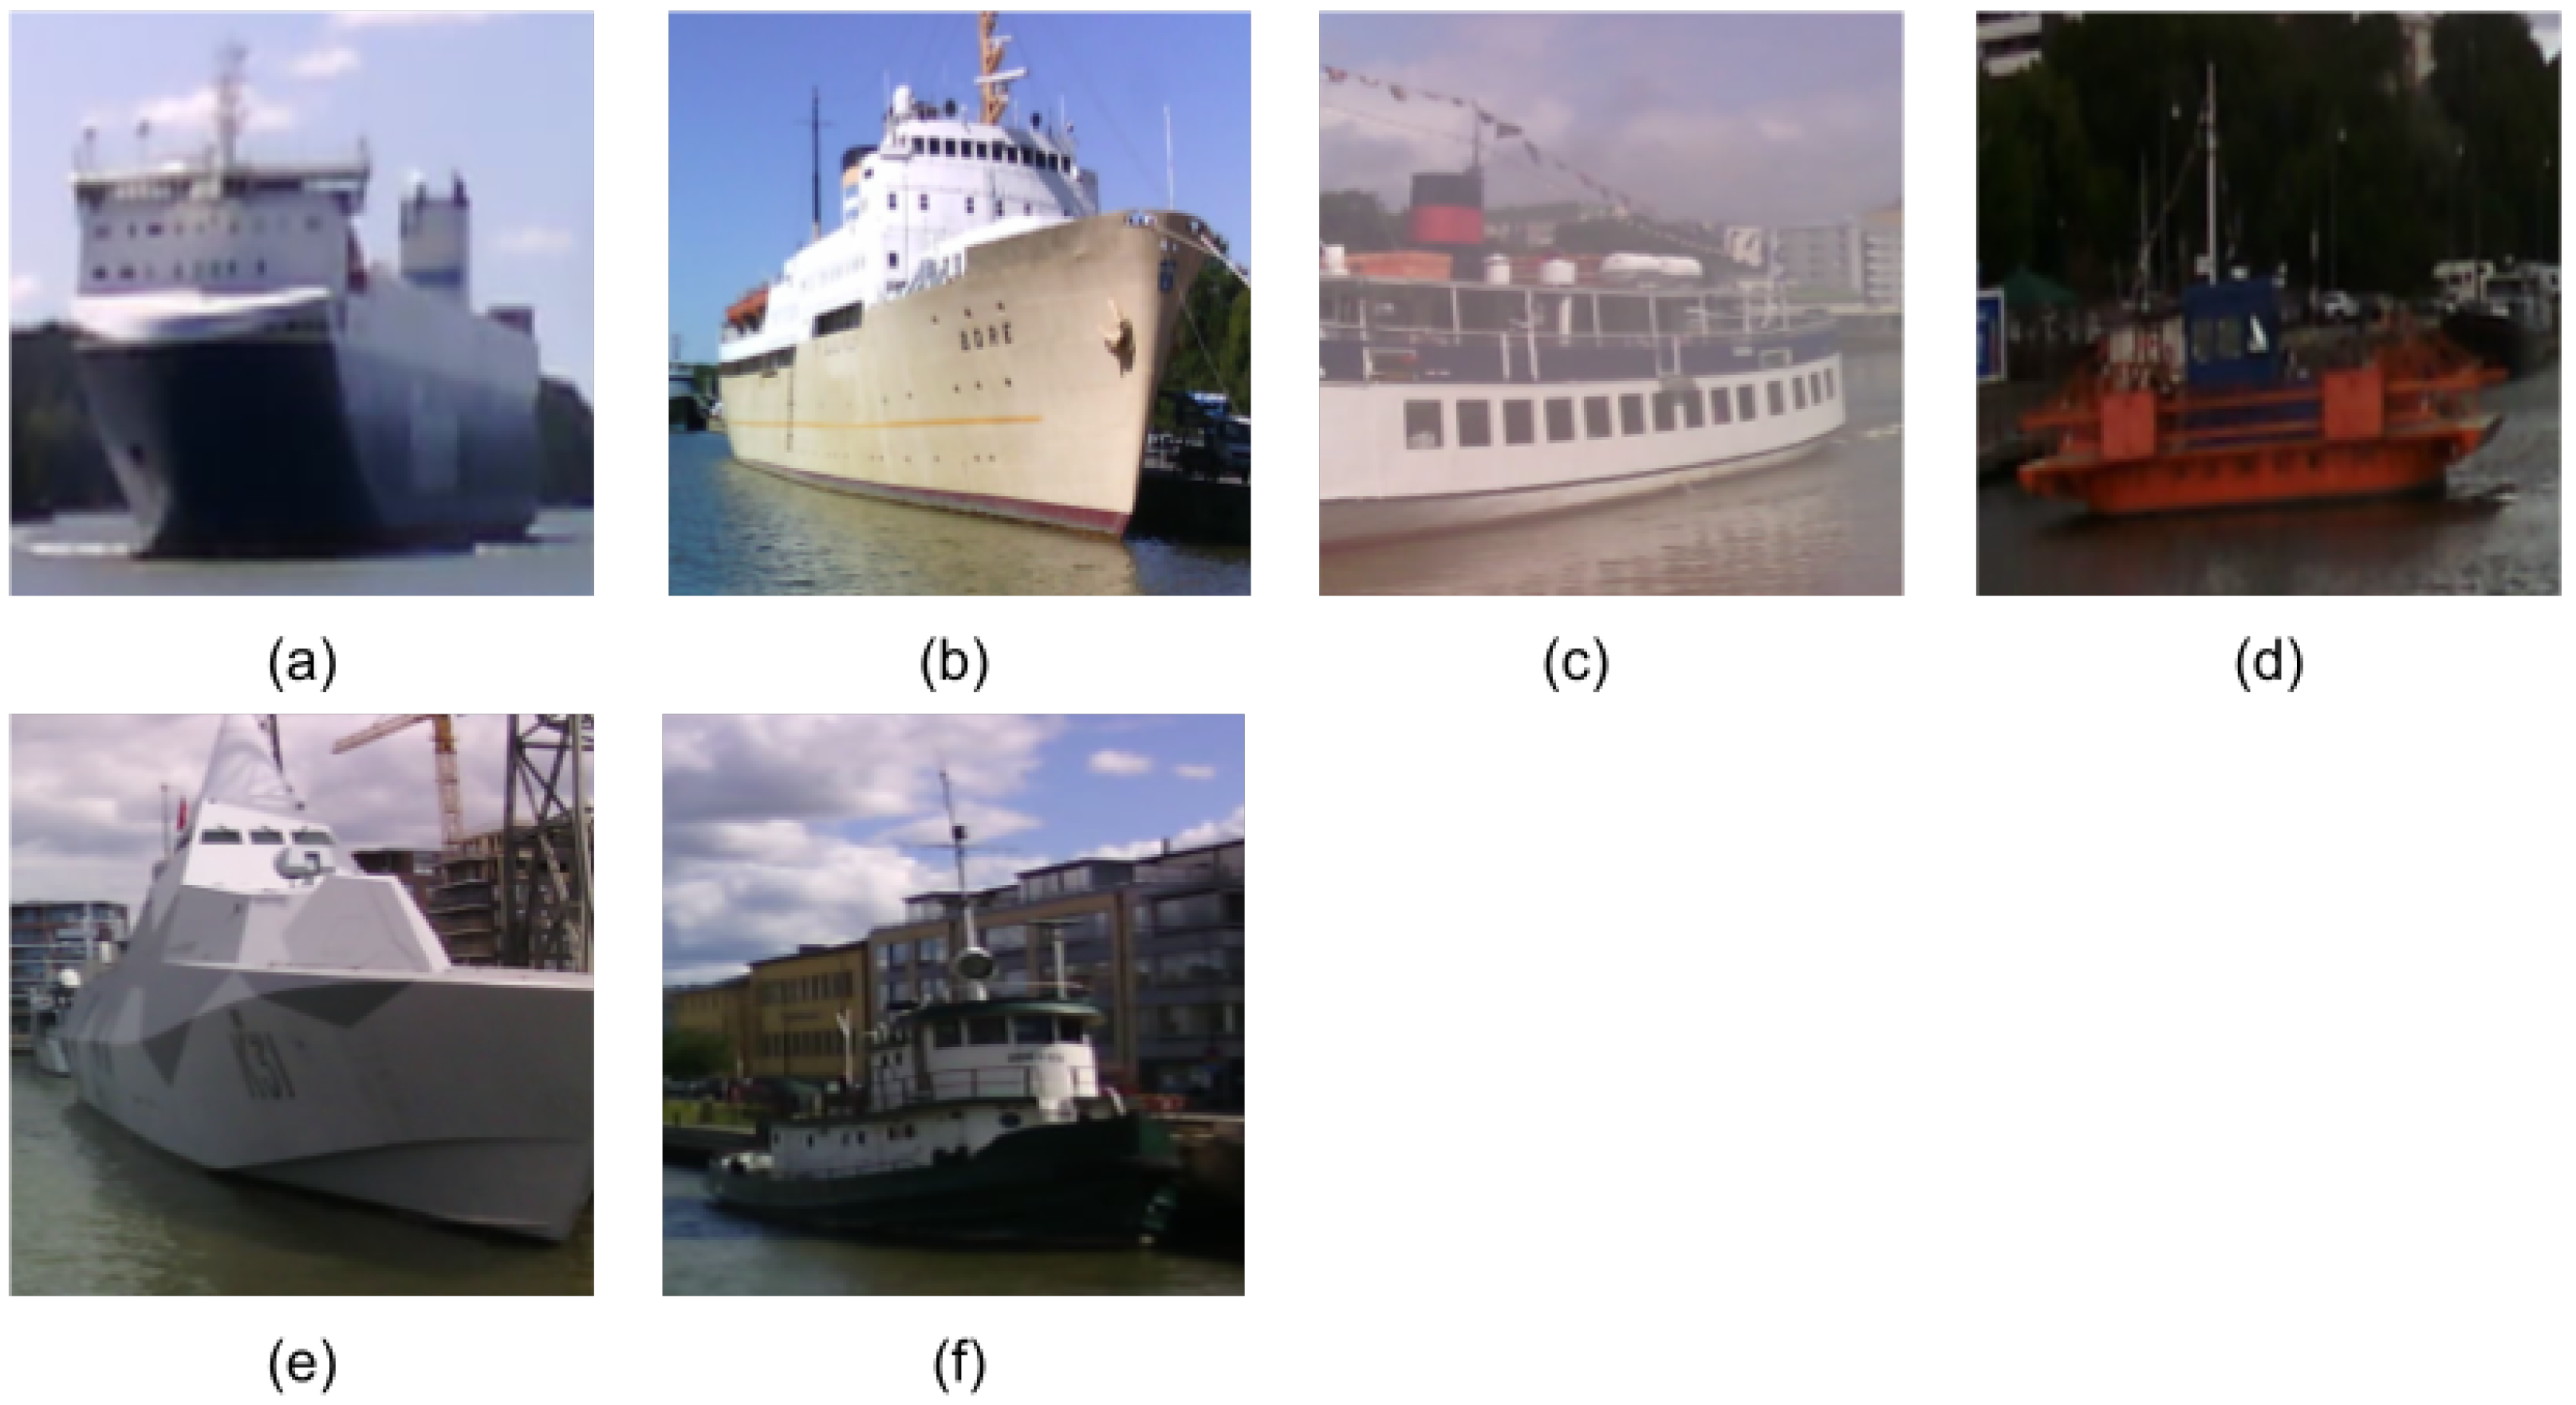
| Ship | Passengership, Ferry, Cruiseship, Cargoship, Militaryship, Miscboat | 15,272 | 46% | 5887 |
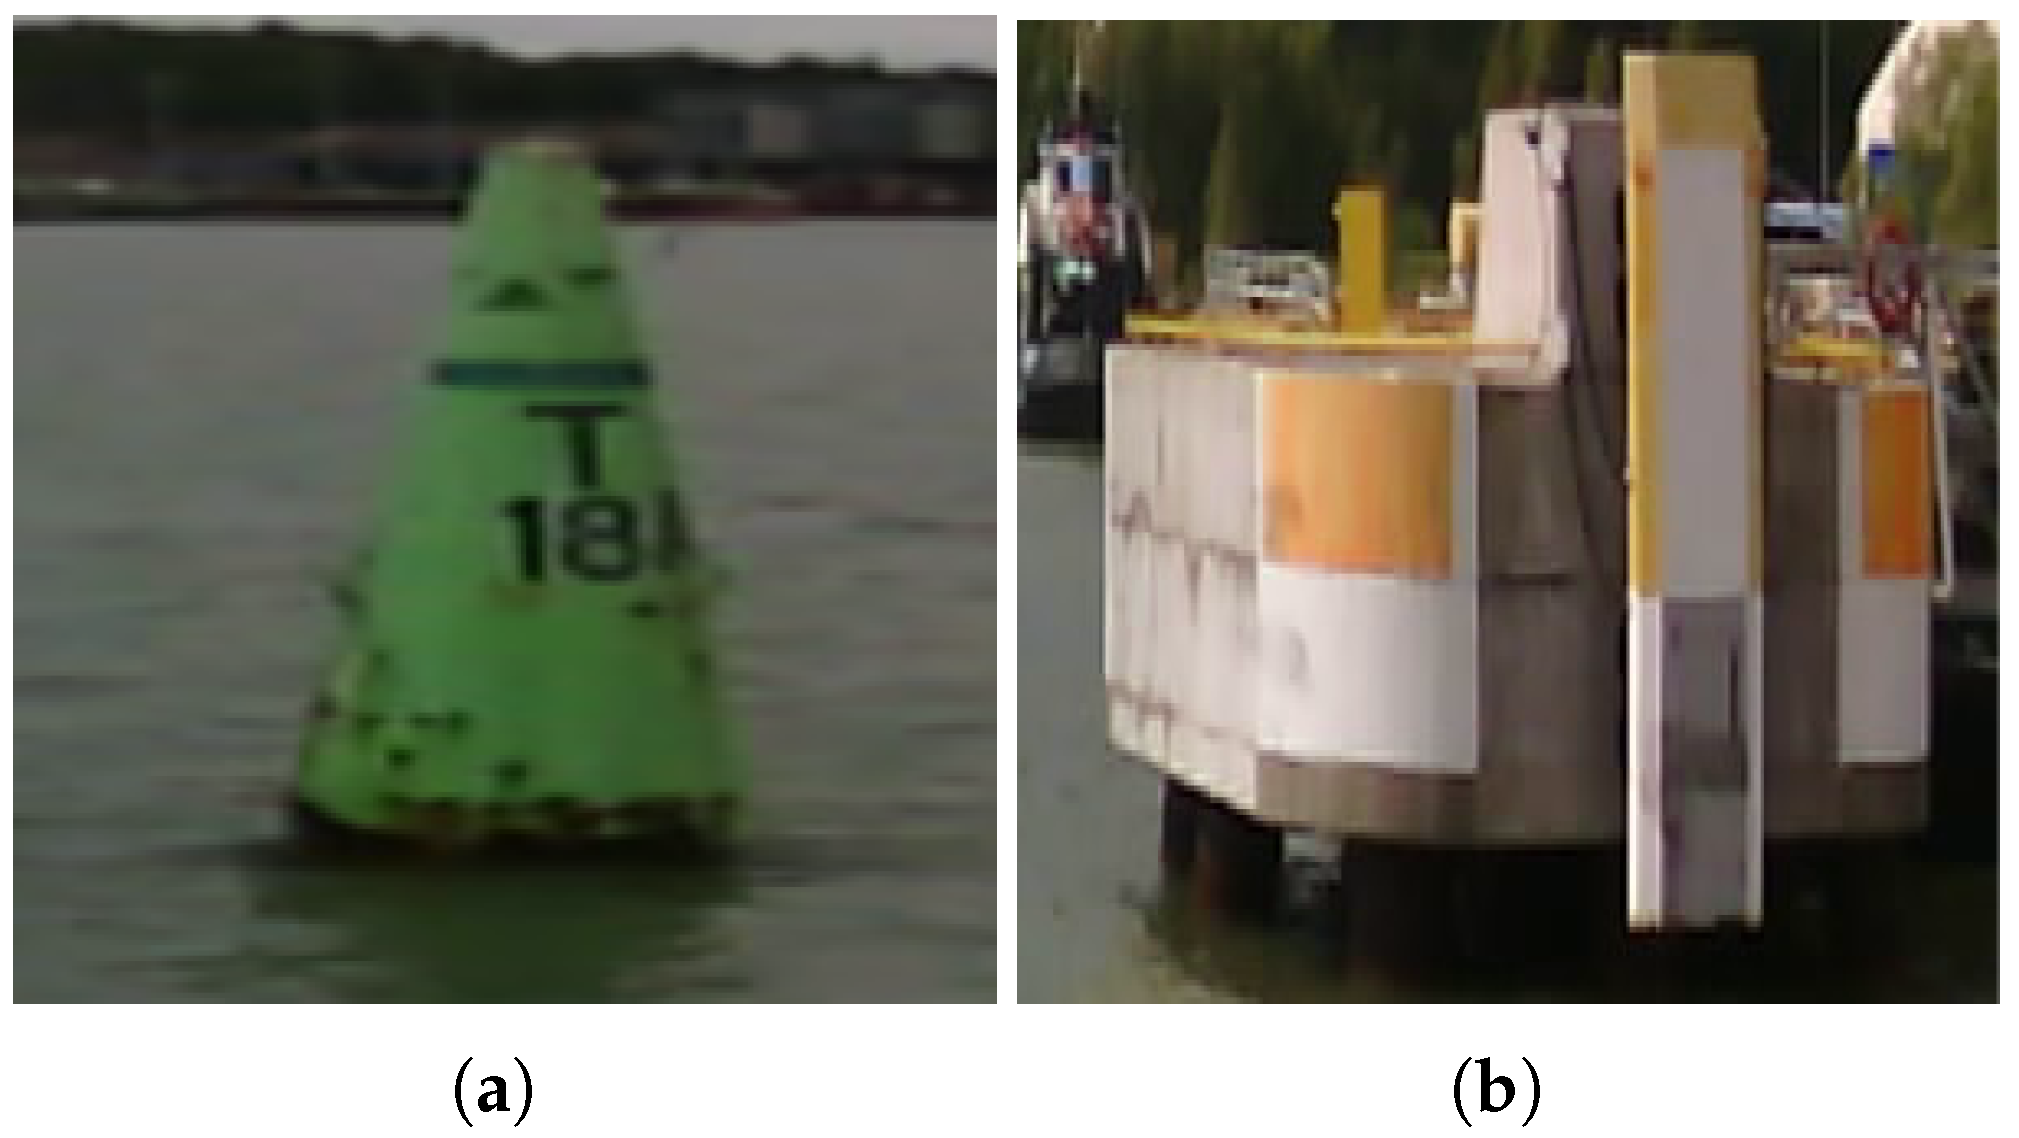
| Stationary | Seamark Miscellaneous floaters | 2682 | 8% | 2151 |
| Performance Metrics (mAP50 in %) of Centernet for ABOships-PLUS Dataset from Scratch with Different Feature Extractors | ||||
|---|---|---|---|---|
| Feature Extractor | N.A. | F | MS | MS&F |
| DLA | 61.0 | 62.1 | 66.8 | 68.4 |
| Hourglass | 49.0 | 50.2 | 61.7 | 63.7 |
| Resnet101 | 48.8 | 50.9 | 56.7 | 59.3 |
| Restnet18 | 51.4 | 53.9 | 60.2 | 62.6 |
| Performance Metrics (mAP50 in %) of Centernet for ABOships-PLUS Dataset with Transfer Learning with Different Feature Extractors | ||||
|---|---|---|---|---|
| Feature Extractor | N.A. | F | MS | MS&F |
| DLA | 67.4 | 68.6 | 73.1 | 74.4 |
| Hourglass | 64.8 | 66.7 | 70.4 | 72.2 |
| Resnet101 | 67.4 | 69.8 | 72.3 | 72.6 |
| Restnet18 | 63.8 | 66.2 | 69.8 | 71.4 |
| Performance of Centernet Training from Scratch for ABOships-PLUS Dataset (mAP across Scales) | |||
|---|---|---|---|
| Feature Extractor | |||
| DLA | 45.3 | 56.0 | 75.2 |
| Hourglass | 47.3 | 62.5 | 78.8 |
| Resnet101 | 30.8 | 55.5 | 73.9 |
| Restnet18 | 31.3 | 56.3 | 75.8 |
| Performance of Transfer Learning for Centernet on the ABOships-PLUS Dataset (mAP across Scales) | |||
|---|---|---|---|
| Feature Extractor | |||
| DLA | 50.4 | 65.2 | 81.7 |
| Hourglass | 47.7 | 58.0 | 82.5 |
| Resnet101 | 42.8 | 60.4 | 82.5 |
| Restnet18 | 42.6 | 57.7 | 82.2 |
| Performance of Transfer Learning for Centernet on the ABOships Dataset (mAP across Scales) | |||
|---|---|---|---|
| Feature Extractor | |||
| DLA | 46.71 | 59.5 | 80.4 |
| Hourglass | 47.5 | 59.5 | 81.0 |
| Resnet101 | 40.6 | 56.3 | 74.1 |
| Restnet18 | 33.3 | 56.8 | 74.1 |
| Inter-Class Variation of Performance Metrics for Transfer Learning with Centernet on ABOships-PLUS | ||||
|---|---|---|---|---|
| Feature Extractor | Powerboat | Sailboat | Ship | Stationary |
| DLA | 69.5 | 71.9 | 78.4 | 64.1 |
| Hourglass | 69.6 | 73.0 | 74.1 | 74.2 |
| Resnet101 | 66.5 | 71.7 | 61.7 | 73. 1 |
| Restnet18 | 59.4 | 71.4 | 71.7 | 65.5 |
Disclaimer/Publisher’s Note: The statements, opinions and data contained in all publications are solely those of the individual author(s) and contributor(s) and not of MDPI and/or the editor(s). MDPI and/or the editor(s) disclaim responsibility for any injury to people or property resulting from any ideas, methods, instructions or products referred to in the content. |
© 2023 by the authors. Licensee MDPI, Basel, Switzerland. This article is an open access article distributed under the terms and conditions of the Creative Commons Attribution (CC BY) license (https://creativecommons.org/licenses/by/4.0/).
Share and Cite
Iancu, B.; Winsten, J.; Soloviev, V.; Lilius, J. A Benchmark for Maritime Object Detection with Centernet on an Improved Dataset, ABOships-PLUS. J. Mar. Sci. Eng. 2023, 11, 1638. https://doi.org/10.3390/jmse11091638
Iancu B, Winsten J, Soloviev V, Lilius J. A Benchmark for Maritime Object Detection with Centernet on an Improved Dataset, ABOships-PLUS. Journal of Marine Science and Engineering. 2023; 11(9):1638. https://doi.org/10.3390/jmse11091638
Chicago/Turabian StyleIancu, Bogdan, Jesper Winsten, Valentin Soloviev, and Johan Lilius. 2023. "A Benchmark for Maritime Object Detection with Centernet on an Improved Dataset, ABOships-PLUS" Journal of Marine Science and Engineering 11, no. 9: 1638. https://doi.org/10.3390/jmse11091638
APA StyleIancu, B., Winsten, J., Soloviev, V., & Lilius, J. (2023). A Benchmark for Maritime Object Detection with Centernet on an Improved Dataset, ABOships-PLUS. Journal of Marine Science and Engineering, 11(9), 1638. https://doi.org/10.3390/jmse11091638