Article

Comparative Analysis of Genetic Structure and Diversity in Five Populations of Yellowtail Kingfish (Seriola aureovittata)

1
Yellow Sea Fisheries Research Institute, Chinese Academy of Fishery Sciences, Qingdao 266071, China
2
Joint Laboratory for Deep Blue Fishery Engineering, Qingdao 266071, China
3
Fisheries Laboratory, University of Tokyo, Maisaka 431-0214, Shizuoka, Japan
*
Author to whom correspondence should be addressed.
J. Mar. Sci. Eng. 2023, 11(8), 1583; https://doi.org/10.3390/jmse11081583
Submission received: 19 June 2023 / Revised: 3 August 2023 / Accepted: 7 August 2023 / Published: 12 August 2023
(This article belongs to the Special Issue New Techniques in Marine Aquaculture)

Abstract

:
To clarify the population genetic structure, intrapopulation diversity, and interpopulation differentiation of yellowtail kingfish (Seriola aureovittata), we sampled 143 individuals from five collections of yellowtail kingfish: farmed (n = 30) and wild (n = 33) collections in China, a wild collection in Japan (n = 20), and farmed (n = 31) and wild (n = 29) collections in Australia. Using 2b-RAD simplified genome sequencing, we obtained an average of 287,594 unique tags per population, with an average sequencing depth of 27.13×. Our final genotype dataset included 48,710 SNPs (Single Nucleotide Polymorphisms). The five collections were all in Hardy–Weinberg equilibrium, and the interpopulation differentiation varied among the sample collections. The genetic differentiation coefficients (Fst) between the Chinese and Japanese yellowtail kingfish collections were low and the gene flow (Nm) values were high. These results suggest continuous gene flow occurs frequently between the collections, indicating that they belong to the same population. In contrast, genetic differentiation was high between the Australian collections and the Chinese and Japanese populations, suggesting different evolutionary origins and belonging to different populations. The farmed and wild Australian collections fell into distinct clades in a neighbor-joining phylogeny tree, suggesting farmed fish have begun to differentiate from the wild collection. A similar level of genetic diversity between the wild collections in China and Japan suggests that they originated from the same spawning ground. This, therefore, reminds us that in future aquaculture processes attention is needed regarding implementing targeted breeding strategies. In addition, our data will contribute to Chinese yellowtail kingfish genetic breeding and the sustainable use of Chinese yellowtail kingfish germplasms.

1. Introduction

The yellowtail kingfish, Seriola aureovittata Temminck and Schlegel (1845) (Perciformes: Carangidae), is a long-distance migratory oceanic fish that inhabits temperate and subtropical waters worldwide [1]. The yellowtail kingfish is large, grows rapidly, and is highly favored by the international consumption market due to its excellent taste, nutritional quality, and economic value [2]. The yellowtail kingfish is the most valuable sashimi product after bluefin tuna in Japan [3]. Several countries have attempted to culture the yellowtail kingfish in recent years, including China, Japan, Australia, New Zealand, Chile, the Netherlands, and South Africa [1], and the current annual global aquaculture production of the yellowtail kingfish is 7000–8000 tons. In China, populations of wild yellowtail kingfish are mainly found in the Yellow Sea, Bohai Sea, and East China Sea [4,5]. In addition, China has cultivated yellowtail kingfish since 2012, and a breakthrough in artificial breeding in 2017 promoted the rapid development of the Chinese yellowtail kingfish aquaculture industry [6]. At present, the Chinese annual production of yellowtail kingfish is around 300–400 tons. As the aquaculture industry develops and the market demand for this species increases, with increasingly frequent exchanges of embryos and larvae, as well as international import and exports of products, careful attention to and control of the associated genetic risks to local populations of yellowtail kingfish will be required [7]. Moreover, while aquaculture is seen to reduce fishing pressure on natural populations, cultured fish can also have a significant impact on the health and stability of wild populations [8]. Therefore, it is necessary to investigate population genetic structure, intrapopulation genetic diversity, and interpopulation differentiation to protect the health of local fish populations and ecosystems.
In previous studies, a significant genetic divergence was determined between yellowtail kingfish populations from Japan and Australia/New Zealand, whereas no significant differentiation was found between Australian and New Zealand populations using microsatellite DNA and mitochondrial DNA (mtDNA) control region markers [9]. Martinez-Takeshita et al. (2015) used mitochondrial and nuclear genetic markers and morphometric analysis to reveal the significant genetic and morphological divergence among yellowtail kingfish from the Northeast Pacific, Northwest Pacific, and Southern Hemisphere. The yellowtail kingfish was shown to be a complex of three cryptic species. The name proposed for the Northwest Pacific species is Seriola aureovittata Temminck and Schlegel (1845), for the Northeast Pacific species is Seriola dorsalis Gill (1863), and for the Southern Hemisphere species, Seriola lalandi Valenciennes (1833) [10]. To demonstrate this, Ai et al. (2021) collected wild samples from the Bohai Sea (China) and Southern Ocean (Australia) and evaluated genetic diversity based on 17,690 nuclear loci. Their analyses showed that yellowtail kingfish from China and Australia formed two distinct clusters, and that there was no genetic introgression from the Australian population into the Chinese population [11]. To date, there have been no comparative studies of the genetic structure in wild/farmed yellowtail kingfish populations in the northwestern Pacific (i.e., China and Japan) and southern (e.g., Australia) populations, or in relation to wild/farmed yellowtail kingfish populations, using SNP molecular markers at the genome level. The available research on the genetic characteristics of wild yellowtail kingfish in China, have analyzed karyotype banding patterns and mitochondrial DNA sequence variation [12,13,14]. Cui et al. (2020) developed 100 high-quality SNP markers using the 2b-RAD sequencing of 33 wild yellowtail kingfish individuals, which were collected in a database for resource conservation research [15].
Studies on the genetic structure of yellowtail kingfish populations from Chinese and other international waters have become important for genetic breeding and large-scale farming. Moreover, the genetic differentiation between the wild and farmed populations of yellowtail kingfish has sparked interest in the genetic improvement of this species for sustainable aquaculture. Compared with traditional molecular markers, such as mitochondrial DNA and microsatellite, 2b-RAD technology can obtain numerous genome-wide SNP markers in a species without an available reference genome. 2b-RAD-constructed genomes are repeatable, with uniform coverage and sequencing depth, good label independence, high typing accuracy, and other advantages [16]. Therefore, 2b-RAD has been widely used in various genetic studies of aquatic animals, including high-density genetic map constructions, QTL (quantitative trait locus) positioning, genome-wide association analysis, population evolution characterization, assisted genome assembly, and whole-genome selective breeding [17,18,19,20]. Therefore, we aimed to characterize wild and farmed Chinese, wild Japanese, and wild and farmed Australian populations of yellowtail kingfish with respect to genetic structure, interpopulation differentiation, and intrapopulation diversity by using SNP molecular markers through 2b-RAD genomic sequencing. Our data will provide theoretical and technical support for the selective breeding of yellowtail kingfish to ensure the sustainable culture of this species in China.

2. Materials and Methods

2.1. Fish Sampling

We assessed five collections of yellowtail kingfish from China (wild and farmed), Japan (wild), and Australia (wild and farmed) (Figure 1): wild yellowtail kingfish (n = 33) from the Yellow Sea, off the coast of Dalian, China (39°57′ N, 123°04′ E); F1 generation yellowtail kingfish (n = 30) were provided by the Dalian Fugu Food Co., Ltd. (Zhuanghe, Dalian, China); wild yellowtail kingfish (n = 20) were collected off the Gotō Islands, Japan (32°45′ N, 128°27′ E); wild yellowtail kingfish (n = 29) were collected from the Tasman sea off of New South Wales, Australia (33°44′ S, 151°45′ E); and F2 generation, farmed yellowtail kingfish (n = 31) were provided by the South Australian Department of Primary Industries and Regions. Pectoral fin clips were collected from the wild and farmed fish from China and Australia; the fin tissues were immersed in 95% ethanol and stored in a refrigerator at 4 °C before genomic DNA was extracted. Genomic DNA from the fin clips of wild fish from Japan was provided by a collaborator at the University of Tokyo.

2.2. DNA Extraction, SNP Library Construction, and SNP Marker Typing

DNA from fin clips was extracted using animal-tissue genomic DNA Extraction Kits (DP121221; Qiagen, Hilden, Germany). DNA concentration was measured using a NanoDrop 2000 (Thermo Fisher, Waltham, MA, USA), and DNA integrity was checked using 1% agarose gel electrophoresis. Extracted genomic DNA was stored at −20 °C until use. The 2b-RAD libraries were constructed by Qingdao OE Biotechnology Co., Ltd. (Qingdao, China), following the methods of Wang et al. [16]. In brief, 100–200 ng of each DNA sample was digested with a Type IIB restriction enzyme (Bsa XI), and the digested products were ligated to restriction-site-specific adaptor sequences using T4 DNA Ligase (New England Biolabs Inc., Ipswich, MA, USA). Sample-specific barcodes were incorporated by PCR. PCR products were purified using the MinElute PCR Purification Kit and then pooled for paired-end sequencing using the Illumina Hiseq Xten sequencing platform (Illumina, CA, USA). Raw reads were cleaned by removing adaptor sequences, reads containing more than 8% unknown (N) bases, and low-quality reads (those where more than 15% of all bases had quality values lower than Q30). We used PEAR v0.9.6 (Heidelberg, Germany) [21] to stitch the pairs of clean reads together, and then reads corresponding to each sample were extracted based on sample location at the time of library building. Reads containing enzyme recognition sites were extracted. The selected samples were CW13, CW23, CW26, CW29, CW32, CW3, AF13, AF23, AF3, AW13, AW23, AW3, CF13, CF23, CF3. The ustacks module in the Stacks software package v1.34 (Eugene OR, USA) [22] was used to cluster the sequences and identify the reference sequences. The extracted reads containing enzyme recognition sites were aligned to the reference sequences using the SOAP software (Shenzhen, China) [23] with the following requirements: unique alignment, optimal alignment, and with a maximum of two mismatches allowed (−r 0 −M 4 −v 2). We performed 2b-RAD genotyping using the maximum likelihood (ML) method in RADtyping software [24]. To ensure the accuracy of subsequent analyses, we excluded the following SNP sites from all samples: those for which less than 80% of the associated individuals could be typed; those with MAF (minor allele frequency) values less than 0.01; those with one or four alleles; and those with more than one SNP within the tag.

2.3. Population Genetic Diversity

We calculated the probability that each collection was in Hardy–Weinberg equilibrium (HW-P) using the chi-square test in the R package Genepop v1.0.5 (Montpellier, France) [25] with probabilities >0.05; for collections in Hardy–Weinberg equilibrium, expected heterozygosity (He) and observed heterozygosity (Ho) were then calculated. We calculated nucleotide diversity (Pi) for each of the five collections using VCFtools v0.1.14 (Cambridge, UK) [26]. We also used Genepop v1.0.5 (Montpellier, France) [25] to calculate the inbreeding coefficient within each collection (Fis), the inbreeding coefficient across all collections (Fit), and the pairwise genetic differentiation coefficient between collections (Fst). We calculated Reynolds’s genetic distance (DR) and gene flow (Nm) between pairs of collections as −ln (1 − Fst) and (1 − Fst)/4 × Fst, respectively.

2.4. Population Genetic Structure

We used PLINK 1.9 (Massachusetts, USA) [27] to assess SNPs across the entire constructed reference sequence of the yellowtail kingfish genome and to identify SNPs with no close linkages (using the main parameter “indep-pairwise 50 10 0.6”, where 0.6 is the r2 threshold). We used ADMIXTURE v1.3.0 (Houston, USA) [28], with 10 different seeds for 10 repeated analyses, to determine the most likely number of subpopulations (K) among the 143 individuals, with tested values of K from 1 to 10. Using PLINK v2.0 [29], we performed a PCA (principal component analysis) of the obtained SNP markers. Finally, we constructed a phylogenetic tree based on neighbor-joining (NJ) analyses using bottom-up clustering for 143 individual yellowtail kingfish, using TreeBest v1.9.2 (Hinxton, UK) [30] with 1000 bootstrap replicates.

3. Results

3.1. Yellowtail Kingfish Population Genetics

The average number of unique tags per sample was 287,594, and the average sequencing depth was 27.13×. Across all samples, the percentage of unique tags was 94.61–96.25%. After quality control filtering, 48,710 sites remained.
In the genetic diversity indicators, He ranges from 0 to 1, where 0 represents no polymorphism, and 1 represents an infinite number of alleles with the same frequency. A higher Pi value indicates greater genetic diversity between sequences, meaning there is a larger degree of variation among the samples or populations. Conversely, a smaller Pi value indicates higher genetic similarity between sequences, implying a lower level of variation among the samples or populations. Fis represents the inbreeding coefficient within populations. Fit represents the total population inbreeding coefficient, and their values range from −1 to 1. A significantly positive value of Fis indicates a high level of inbreeding within the population, while a significantly negative value suggests the presence of outbreeding. Fst ranges from 0 to 1, and a larger value indicates a more pronounced genetic differentiation between subpopulations. Across all five yellowtail kingfish collections, the average probability of the Hardy–Weinberg equilibrium was 0.4112 (p > 0.05; Table 1), which indicated that each of the collections were in Hardy–Weinberg equilibrium. The average Ho was 0.0824, average He was 0.2013, average Pi was 0.2020, average Fis was 0.0627, average Fit was 0.3298, and average Fst was 0.2898.
In general, the Ho, He, and Pi values for the farmed Chinese yellowtail kingfish collection (0.0828, 0.0814, and 0.0829, respectively) were greater than those for the wild Chinese yellowtail kingfish collection (0.0718, 0.0771 and 0.0785, respectively, p < 0.05). In contrast, the He and Pi values for the farmed Australian yellowtail kingfish collection (0.0927 and 0.0943, respectively) were lower than those for the wild Australian yellowtail kingfish population (0.0955 and 0.0974, respectively), although the value of Ho was greater for the farmed collection (0.0940) for the wild (0.0902; Table 1).
Among the Chinese and Japanese collections, Fst was 0.00097–0.01888 and DR was 0.0010–0.0191; similarly, Fst and DR were 0.02569 and 0.0260, respectively, between the two Australian collections (Table 2), suggesting no genetic differentiation (Fst < 0.05). However, the Fst values between the Chinese or Japanese collections and the Australian collections were 0.7256–0.7447 (DR: 1.2932–1.3653; Table 2), suggesting substantial genetic differentiation (Fst > 0.25).
The Nm values among the Chinese and Japanese collections were high (12.9287–256.4499), as was the Nm value between the Australian collections (9.9002; Table 3). This suggested frequent gene exchange between the wild Chinese and farmed Chinese and wild Japanese collections, as well as between the wild Australian and farmed Australian collections. Indeed, the highest Nm was calculated between the Chinese and Japanese wild collections, and the gene flow may be frequent and/or recent. In contrast, the Nm values between the Chinese or Japanese and Australian collections were low (0.0864–0.0953; Table 3), indicating little to no gene exchange between the Asian and Australian yellowtail kingfish collections.

3.2. Yellowtail Kingfish Population Structure

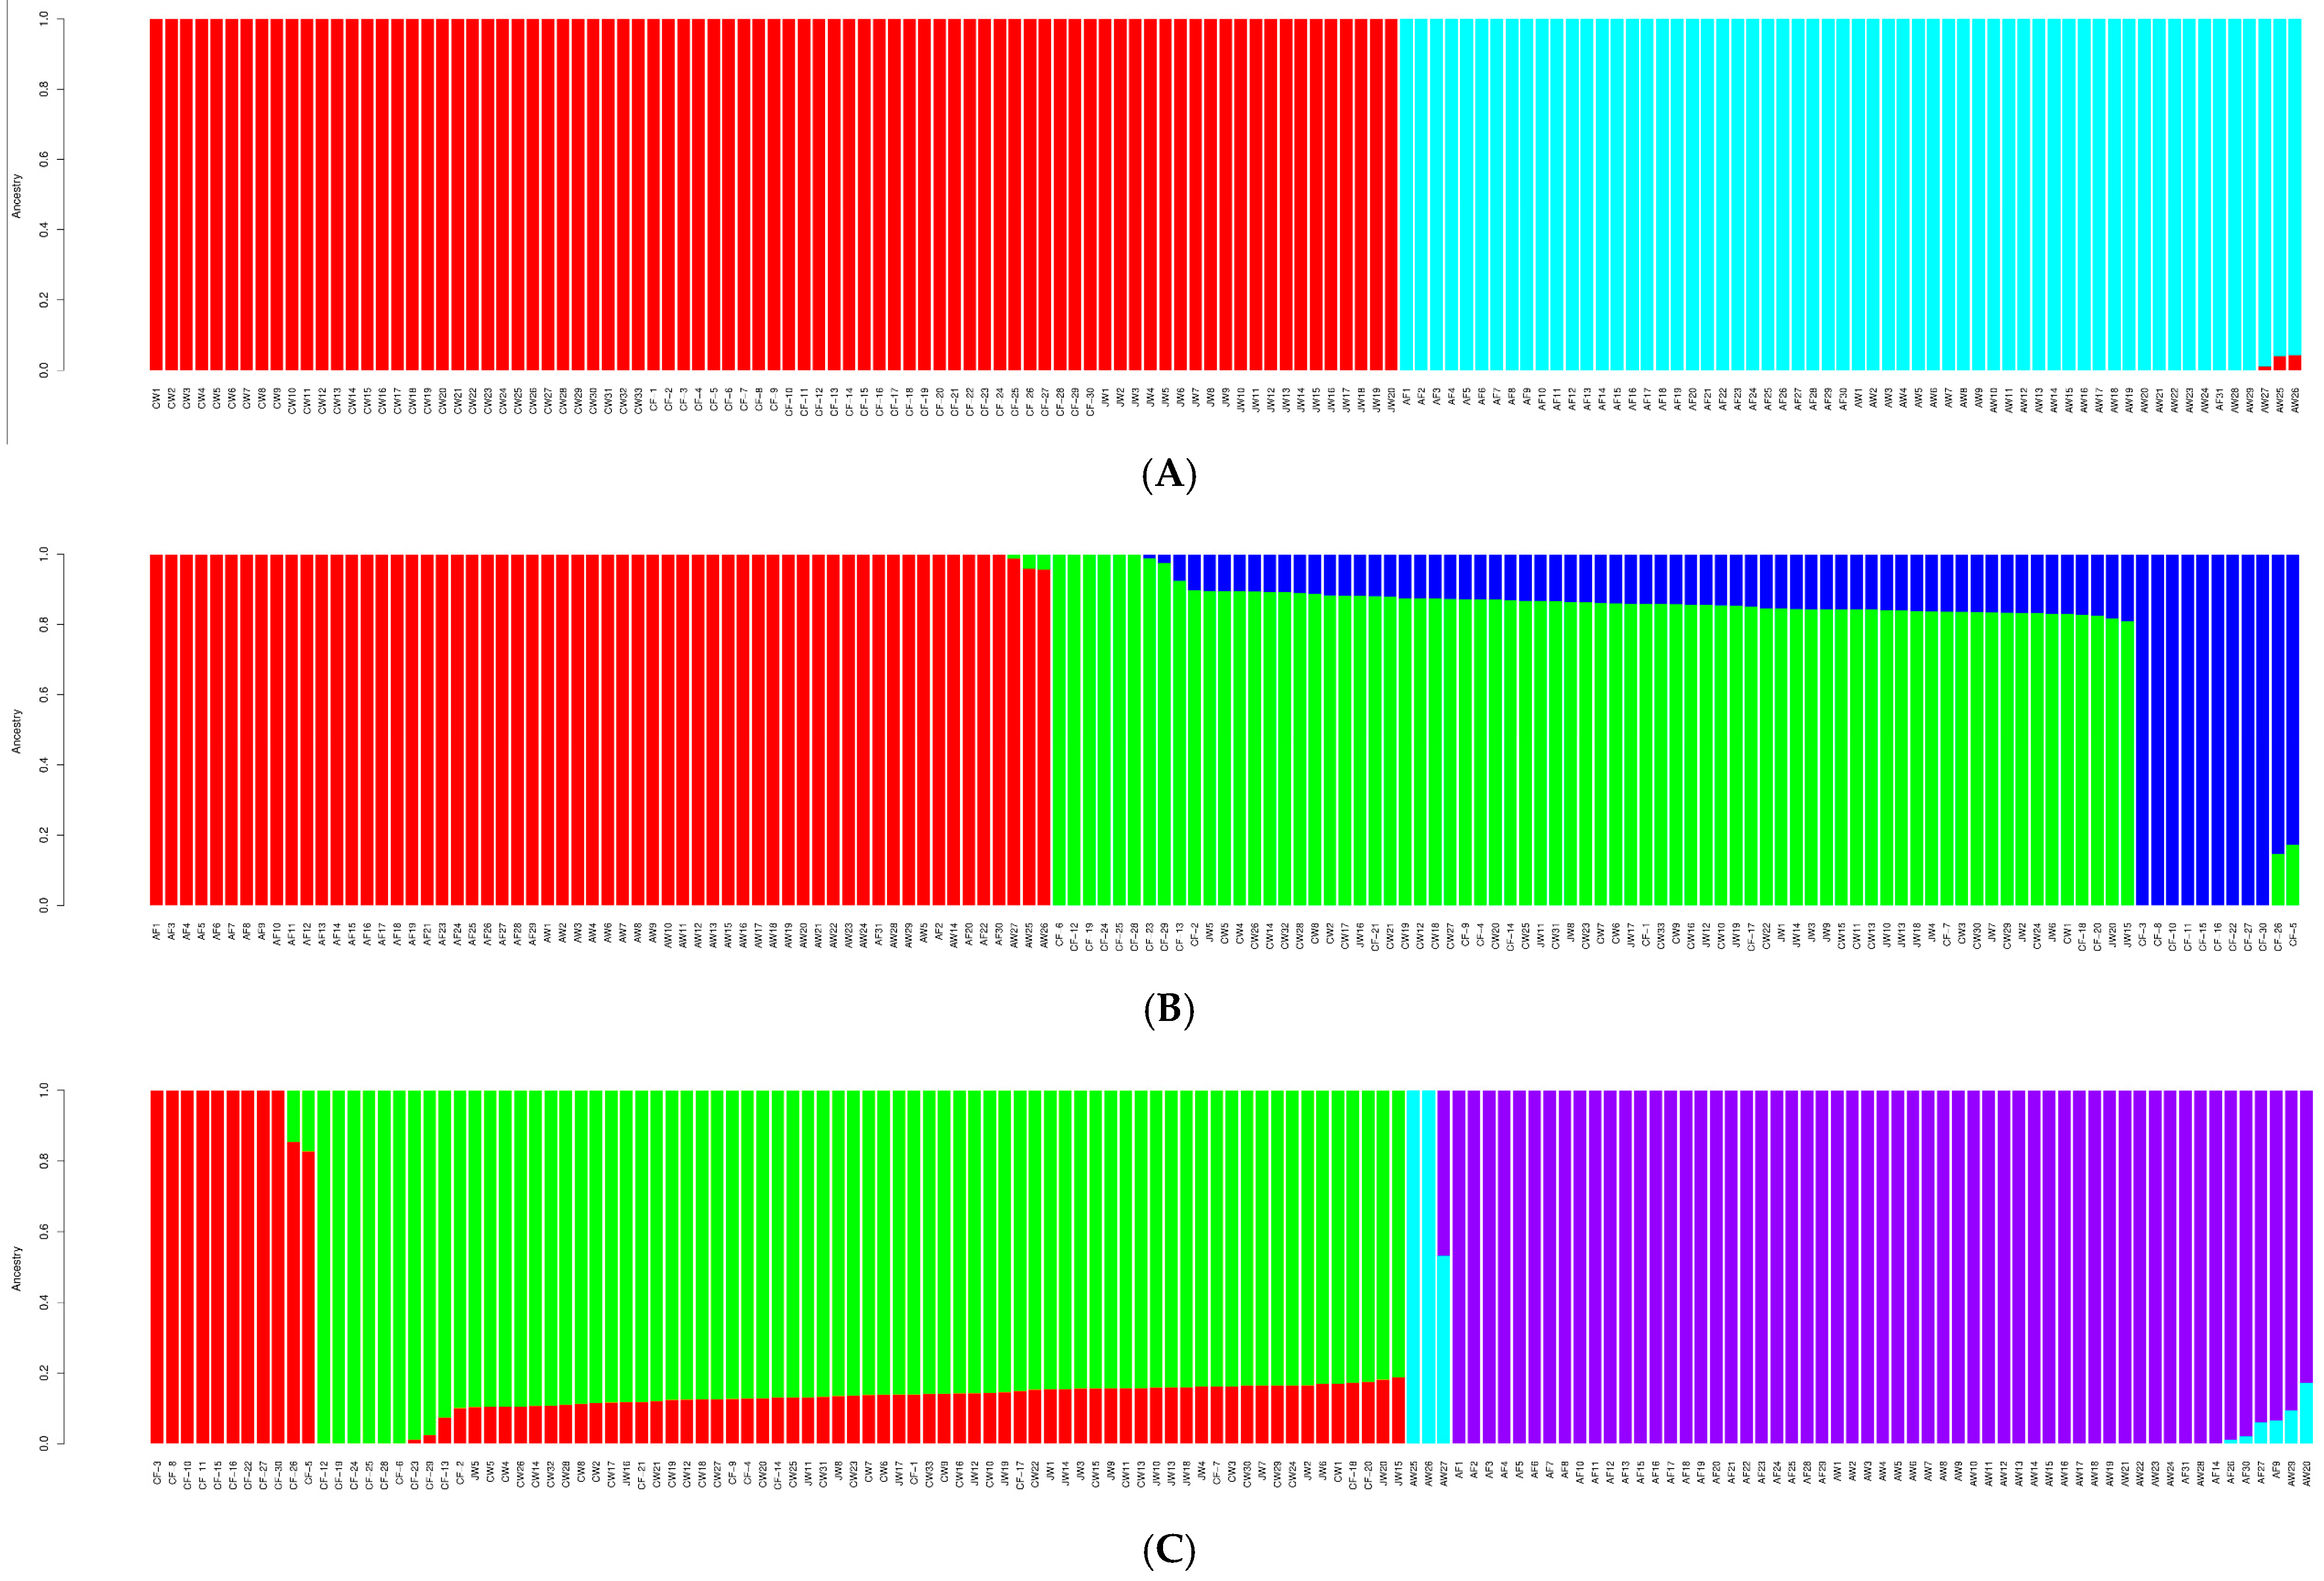
The ADMIXTURE cross-validation error levels indicated that the most likely number of subpopulations (parameter K) was 2 (Figure S1). When K = 2, the Australian wild and farmed collections are grouped together in one cluster, while the Chinese wild and farmed collections, as well as the Japanese wild collections, form another cluster. When K = 3 or K = 4 (Figure 2B,C), individual outliers from the cultured population cluster separately within the Australian and Chinese farmed collections, but did not show distinct separations. Based on the current analysis, the origins of the Chinese and Japanese populations are similar, while the Australian collections origins are different (Figure 2A). Similarly, our PCA showed that the Chinese and Japanese collections clustered together, distinct from the Australian cluster (Figure 3A); PC1 and PC2 explained 41.16% and 3.73% of the variance across populations, respectively. On PC1, there were individual outliers within the wild Australian collection. PC3 revealed a weak clustering pattern in the Australian cultured collection, and PC3 explained only 1.26% of the variance across populations (Figure 3B). Similarly, PC4 indicated a weak clustering pattern in the Chinese cultured collection, and PC4 explained only 1.16% of the variance across populations (Figure 3C).
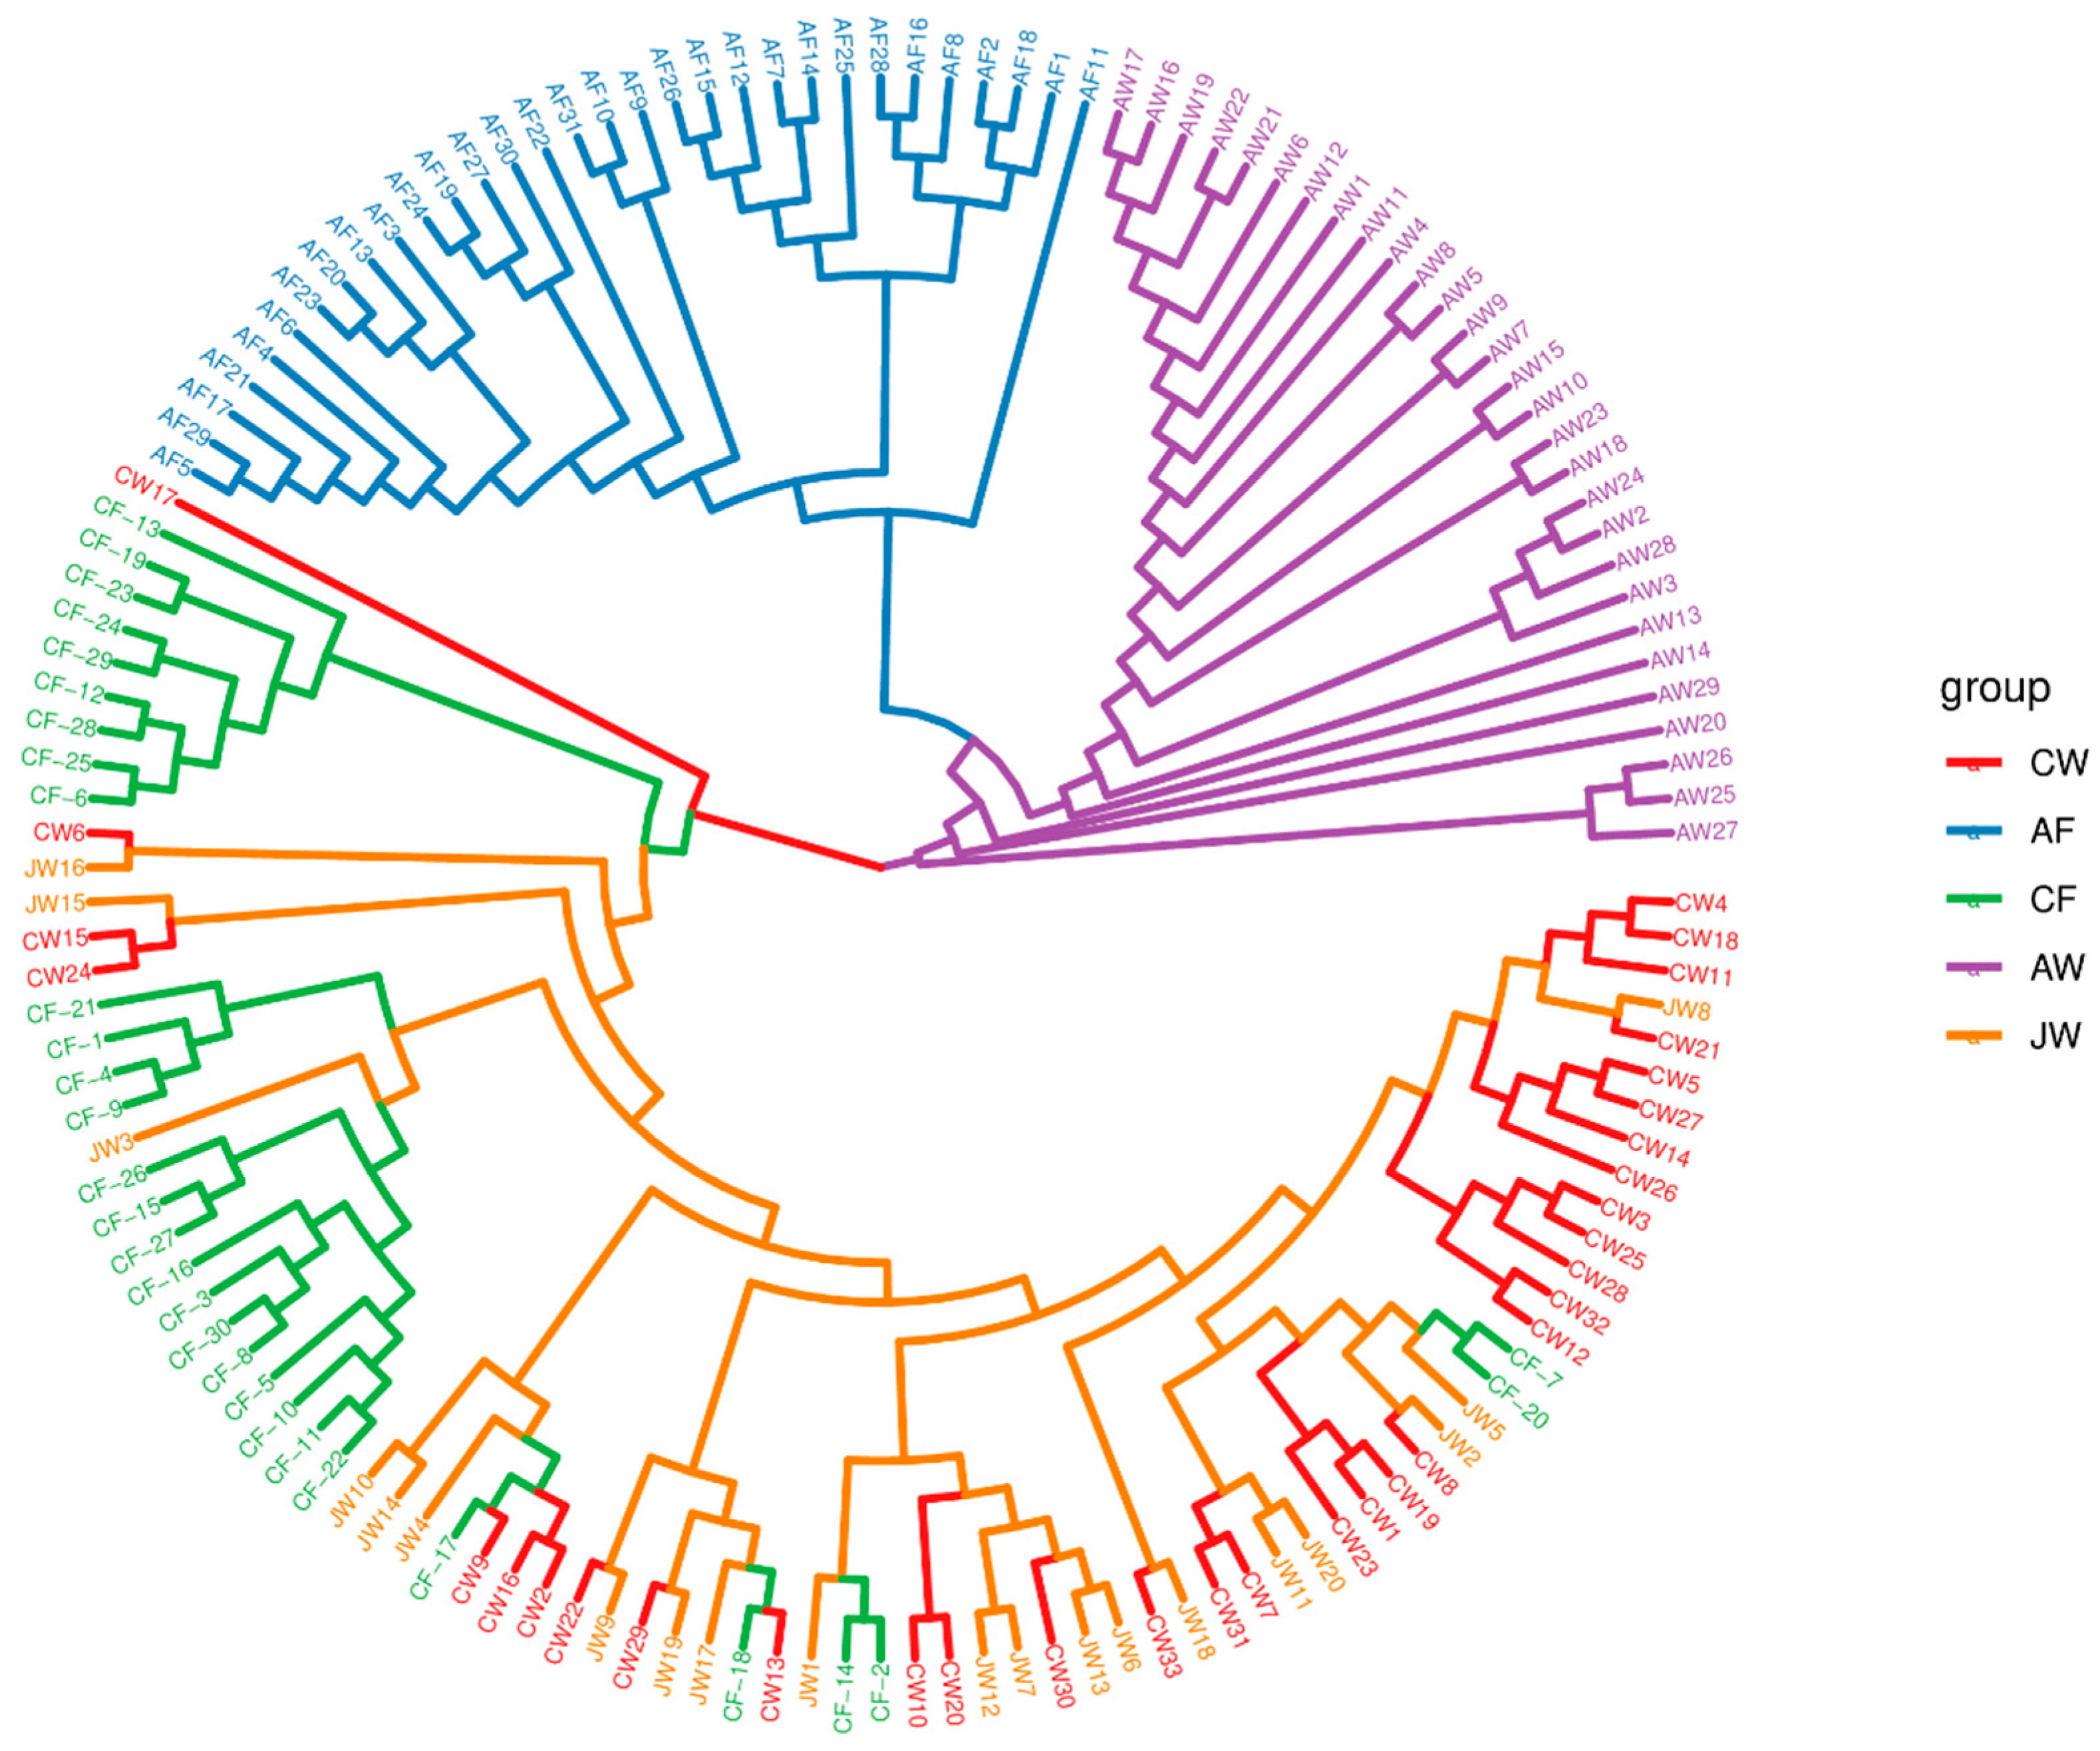
The phylogenetic tree shows that Australian collections and Chinese and Japanese collections are divided into two distinct clades. The farmed and wild Australian collections formed two distinct clades. Whereas, the wild Chinese and Japanese collection formed a branch, with the wild Japanese collection branching off from the farmed Chinese collection, though no clear clade divergence was observed among these three collections (Figure 4).

4. Discussion

A large number of molecular markers were obtained by the 2b-RAD genome sequencing of yellowtail kingfish samples from five collections. A comparative analysis of the genetic characters of the wild and farmed Chinese collections, the wild Japanese collection, and the wild and farmed Australian collections was performed using these markers. The results of the population genetic structure analysis, PCA, and a neighbor-joining phylogenetic tree all supported the same conclusions. Genetic differentiation of the wild and farmed Chinese populations, wild Japanese populations, and the wild and farmed Australian populations was high. The calculated gene flow values for the wild and farmed Australian populations compared with the wild and farmed Chinese populations and wild Japanese population were much less than 1, which indicates almost no gene exchange. These results are consistent with the findings of Ai et al. [11], who showed, by comparing nuclear loci and morphological characters in samples from the Bohai Sea, that the Chinese and Australian yellowtail kingfish formed two completely distinct clusters and that there was no genetic introgression from the Australian yellowtail kingfish into the Chinese yellowtail kingfish population based on nuclear gene markers and morphological characteristics.
Although yellowtail kingfish are an oceanic species that can migrate more than 2000 km, their migration routes are confined to continental shelf waters within the same hemisphere, and adult fish mostly migrate at regional scales; thus, the likelihood of migration across the open ocean is low [31,32]. In addition, the equator acts as a natural geographic barrier to yellowtail kingfish migration in the Pacific Ocean because the equatorial water temperatures (18–24 °C in continental shelf areas) exceed those tolerated by yellowtail kingfish [33]. Therefore, the gene flow between Northern Hemisphere and Southern Hemisphere yellowtail kingfish is blocked [10]. The equator has also been shown to act as a natural barrier to gene flow in other wide-ranging or migratory teleosts. For example, mtDNA analyses indicated a lack of genetic communication between Pacific jack mackerel (Trachurus symmetricus) populations from the North and South Pacific Ocean [34], and genetic differentiation between the North Pacific and South Pacific populations of yellowfin tuna (Thunnas albacares) in the two oceans was attributed to equatorial isolation [35]. Similarly, our data showed high genetic differentiation between the Chinese, Japanese and Australian populations, indicating that these populations are geographically (and therefore reproductively) isolated. Sepúlveda et al. (2017) pointed out that the temporal movements of yellowtail kingfish in the southeastern Pacific revealed a particular life strategy (i.e., reproductive or habitat segregation) for this species [36]. This was consistent with previous studies of genetic differentiation among Australian, Japanese, and/or Chinese yellowtail kingfish populations analyzed by mtDNA or nuclear genes [9,31]. Using mitochondrial and nuclear genetic markers and morphometric analysis, Martinez-Takeshita et al. (2015) revealed significant genetic and morphological divergence between yellowtail kingfish (Seriola lalandi) specimens collected from the Northeast Pacific, Northwest Pacific, and Southern Hemisphere [10]. Even if it were possible for yellowtail kingfish to migrate across the equator, gene exchange remains unlikely. Yellowtail kingfish in the Northern Pacific spawn between March and October (e.g., the Chinese wild populations spawn from April to June) [37,38], but in the Southern Hemisphere they typically spawn between October and January [39].
Although previous studies speculated that the Chinese and Japanese yellowtail kingfish populations are indistinct based on their geographic distributions [1], genetic and quantitative morphological evidence for this was lacking. Previously, we found that the mitochondrial genome structure of Chinese yellowtail kingfish was highly similar to that of Japanese yellowtail kingfish, except that the mitochondrial genome of the Chinese population was slightly longer, and that variation in the COX1 and NAD5 genes was observed between Chinese and Japanese populations [14,40]. This awakened our interest in exploring the population genetic structure of Chinese and Japanese yellowtail kingfish. Here, our population genetic structure analysis showed no genetic differentiation between the wild and farmed Chinese populations and the wild Japanese population, suggesting that they are derived from the same population. The phylogenetic analysis showed that the first branch of the Chinese wild population was closely related to the wild Japanese population, while the wild Japanese population was linked to the farmed Chinese population. Interestingly, gene flow between the Chinese and Japanese wild populations (Nm 256.4499) was much higher than that between the Chinese wild and farmed populations. The Nm value between the farmed Chinese and wild Japanese populations was slightly higher than that between the wild Chinese and wild Japanese populations. The calculated Fst and DR values also suggested that the wild populations in China and Japan are most closely related to each other. This may be because China and Japan are located in Current and Kuroshio Current, of which are relatively high. However, the Northern Pacific Ocean currents are colder and thus more suitable for the migration of yellowtail kingfish adults, juveniles, and larvae. Indeed, two of the main factors affecting the migratory routes of yellowtail kingfish are ocean currents and temperature [41,42,43]. Our preliminary surveys indicated that the Dasha fishing ground in the Yellow Sea (~32°00′–34°00′ N, ~122°30′–125°00′ E) is the spawning grounds of the wild Chinese yellowtail kingfish population. Furthermore, fishermen in various coastal Chinese cities report catching yellowtail kingfish adults, juveniles, and larvae at staggered periods throughout the year: April–June at Qingdao, May–August at Dalian, July–August at Weihai, and August–October at Zhoushan. From this we inferred that yellowtail kingfish migrate south to north along the Chinese coast, following food resources and the Kuroshio Current, and then swim either northwestward into the Yellow Sea with the Yellow Sea Warm Current or northwestward around the Korean peninsula with the Tsushima Current. However, further genetic data from yellowtail kingfish populations in the East China Sea and the Yellow Sea are required to verify this speculation. Therefore, in our next study, we plan to establish 8–10 large-scale sampling stations in various locations along the hypothesized yellowtail kingfish migration route (e.g., the East China Sea, Yellow Sea, Bohai Sea, Japan Sea, and Korean Peninsula coastal waters) to capture individuals at various spatial and temporal points during their migration. These data will also help to further clarify the phylogenetic relationship between the Chinese and Japanese populations.
When a fish population is influenced by factors such as mutation, selection pressure, migration, random genetic drift or non-random mating, the genotype frequencies within the population can be affected. All populations conform to the Hardy-Weinberg equilibrium, but the Hardy–Weinberg equilibrium (HW-P) value for the total sample was lower than the HW-P values for each cluster. This is consistent with the result of He (0.2013) being higher than Ho (0.0824). All clusters were divided into two populations, with gene flow occurring within each. Gene flow between the Chinese and Japanese populations displayed an especially high level at Nm 256.449. The Northwest Pacific yellowtail kingfish has a common spawning ground and follows similar migration routes. We calculated the F-statistics, Fit (0.3298) is greater than Fst (0.2898), which is greater than Fis (0.0627). There was no inbreeding between individuals and there was genetic differentiation between each population. Fernández et al. (2015) studied the genetic structure of the Chilean population of Seriola lalandi to detect moderate inbreeding (Fis = 0.12). Previous studies [9,44] consistently yielded higher Ho and He values for yellowtail kingfish populations in comparison to the present findings. Significantly higher values than obtained in this study might be an outcome of different sequencing methods. The size of the sample may also be one of the factors that influence the results. It has been suggested that sample sizes of more than 50 are best for population analysis.
In the Chinese populations, the genetic diversity values were only slightly higher for the farmed versus wild fish. This could reflect the influence of aquaculture domestication on Chinese yellowtail kingfish, even though the culture of this species in China is still in an initial stage and the culture effort has not yet undertaken direct breeding. As a result, there is no significant genetic differentiation attributed to kinship within the population. In general, cultured fish populations frequently originate from a limited number of individuals, leading to a constrained genetic background. This species tends to show a small degree of schooling behavior [36]. In contrast, aquaculture efforts in Australia have focused on the impact of escaped farmed fish on the wild population [8], although no significant genetic differentiation has yet been detected between wild and farmed populations there. Although the phylogenetic results show distinct distributions between the wild and farmed fish in Australia. In the PCA, individual outliers could be observed, but their impact seems minimal. Structure to K = 3 or 4, there are no clear clusters within the two populations. Genetic diversity is a valuable piece of information for fish farmers to use to improve and manage their fish stocks [36]. Based on the results of our low genetic diversity, the underlying reasons for this outcome could be complex and may also be influenced by the experimental methods used. Nevertheless, this serves as a reminder for us to pay attention to improving the genetic diversity of farmed populations and preserving the integrity of the habitats and wild populations. This highlights supplementing new individuals to farmed populations to increase gene flow between individuals, and should also remind us of the benefit of implementing targeted breeding strategies. Additionally, comprehensive genetic management plans should be developed and implemented, including monitoring and maintaining genotype frequencies, genetic diversity, and genetic health, along with appropriate intervention measures.

5. Conclusions

We isolated and identified SNP markers in yellowtail kingfish populations from China (wild and farmed), Japan (wild), and Australia (wild and farmed). The genetic structure of each population was analyzed using these SNP markers. Our analyses show that: (1) no significant genetic differentiation was detected between the wild and farmed Chinese and wild Japanese populations, and both of those populations showed significant genetic differentiation from the wild and farmed Australian populations; (2) no obvious genetic differentiation was observed between the wild and farmed Chinese populations, whereas the wild and farmed Australian populations are likely becoming genetically differentiated because of longer farming generations or genetic bottleneck. Moreover, the genetic relationship between the Chinese and Japanese wild populations was closer than that between the wild and farmed Chinese populations. Our data will provide theoretical and technical support for genetic breeding, ensuring the sustainable production of wild and farmed yellowtail kingfish in China.

Supplementary Materials

The following supporting information can be downloaded at: https://www.mdpi.com/article/10.3390/jmse11081583/s1, Figure S1: Boxplot showing cross-validation error levels for various numbers of subpopulations (K = 1–10).

Author Contributions

Conceptualization, Y.X. and A.C.; methodology, Y.X. and A.C.; validation, Y.X., K.K. and Y.J.; formal analysis, A.C. and Y.X.; investigation, A.C. and Y.X.; data curation, K.K., Y.J., B.W., T.K. and X.L.; writing—original draft preparation, A.C.; writing—review and editing, A.C. and Y.X.; supervision, Y.X.; funding acquisition, Y.X. All authors have read and agreed to the published version of the manuscript.

Funding

This work was supported by grants from National Key R&D Program of China (2022YFD2401102), Marine Science and Technology Fund of Shandong Province for Qingdao Marine Science and Technology Center (2022QNLM030001), Taishan Industrial Experts Program, Central Public-interest Scientific Institution Basal Research Fund, CAFS (2020TD47), and Earmarked Fund for China Agriculture Research System (CARS-47).

Institutional Review Board Statement

The animal study protocol was approved by the Institutional Animal Care and Use Committee of Yellow Sea Fisheries Research Institute, Chinese Academy of Fishery Sciences (Approval code: YSFRI-2022025, and date: 3 July 2019).

Informed Consent Statement

Not applicable.

Data Availability Statement

The data in this study are available from the authors upon reasonable request.

Conflicts of Interest

The authors declare no conflict of interest.

References

  1. Sicuro, B.; Luzzana, U. The state of Seriola spp. other than yellowtail (S. quinqueradiata) farming in the world. Rev. Fish Sci. Aquac. 2016, 24, 314–325. [Google Scholar] [CrossRef]
  2. Liu, X.; Xu, Y.; Li, R.; Lu, Y.; Shi, B.; Ning, J.; Wang, B. Analysis and evaluation of nutritional composition of the muscle of yellowtail kingfish (Seriola aureovittata). Prog. Fish. Sci. 2017, 1, 128–135. [Google Scholar]
  3. Whatmore, P.; Nguyen, N.H.; Miller, A.; Lamont, R.; Powell, D.; D’Antignana, T.; Bubner, E.; Elizur, A.; Knibb, W. Genetic parameters for economically important traits in yellowtail kingfish seriola lalandi. Aquaculture 2013, 400–401, 77–84. [Google Scholar] [CrossRef]
  4. Zhang, C. Investigation Report on Fishes in the Yellow Sea and Bohai Sea; Science Press: Beijing, China, 1995; pp. 116–119. [Google Scholar]
  5. Liu, J.; Chen, Y.; Ma, L. Fish Atlas of the Yellow Sea and Bohai Sea; Science Press: Beijing, China, 2015; pp. 171–173. [Google Scholar]
  6. Liu, X. Great breakthrough has been made in breeding technology of yellowtail kingfish. Ocean. Fish. 2017, 8, 19. [Google Scholar]
  7. Premachandra, H.K.A.; La Cruz, L.D.; Takeuchi, Y.; Miller, A.; Fielder, S.; O’Connor, W. Genomic DNA variation confirmed seriola lalandi comprises three different populations in the pacific, but with recent divergence. Sci. Rep. 2017, 7, 9386. [Google Scholar] [CrossRef] [Green Version]
  8. Purcell, C.M.; Chabot, C.L.; Craig, M.T.; Martinez-Takeshita, N.; Allen, L.G. Developing a genetic baseline for the yellowtail amberjack species complex, Seriola lalandi sensu lato, to assess and preserve variation in wild populations of these globally important aquaculture species. Conserv. Genet. 2015, 16, 1475–1488. [Google Scholar] [CrossRef]
  9. Nugroho, E.; Ferrell, D.J.; Smith, P.; Taniguchi, N. Genetic divergence of kingfish from Japan, Australia and New Zealand inferred by microsatellite DNA and mitochondrial DNA control region markers. Fish Sci. 2001, 67, 843–850. [Google Scholar] [CrossRef] [Green Version]
  10. Martinez-Takeshita, N.; Purcell, C.M.; Chabot, C.L.; Craig, M.T.; Paterson, C.N.; Hyde, J.R.; Allen, L.G. A tale of three tails: Cryptic speciation in a globally distributed marine fish of the genus seriola. Copeia 2015, 103, 357–368. [Google Scholar] [CrossRef]
  11. Ai, Q.; Song, L.; Tan, H.; Huang, X.; Bao, B.; Li, C. Genetic and morphological differences between yellowtail kingfish (Seriola lalandi) from the Bohai Sea, China and the Southern Ocean, Australia. Aquac. Fish. 2021, 6, 260–266. [Google Scholar] [CrossRef]
  12. Shi, B.; Liu, Y.; Liu, X.; Xu, Y.; Li, R.; Song, X.; Zhou, L. Study on the karyotype of yellowtail kingfish (Seriola aureovittata). Prog. Fish. Sci. 2017, 1, 136–141. [Google Scholar]
  13. Liu, Y.; Liu, X.; Shi, B.; Xu, Y.; Li, R.; Lv, Y.; Song, X.; Wang, B.; Jiang, Y. Analysis of the banding patterns of Seriola aureovittata. J. Fish. China 2018, 9, 1338–1347. [Google Scholar]
  14. Shi, B.; Liu, X.; Liu, Y.; Zhang, Y.; Gao, Q.; Xu, Y.; Wang, B.; Jiang, Y.; Song, X. Complete sequence and gene organization of the mitochondrial genome of Seriola aureovittata. J. Fish. Sci. China 2019, 26, 405–415. [Google Scholar] [CrossRef]
  15. Cui, A.; Wang, B.; Jiang, Y.; Liu, X.; Xu, Y. Development of SNP markers for yellowtail kingfish (Seriola lalandi) by 2b-RAD simplified genome sequencing. Conserv. Genet. Resour. 2020, 12, 403–407. [Google Scholar] [CrossRef]
  16. Wang, S.; Meyer, E.; Mckay, J.K.; Matz, M.V. 2b-rad: A simple and flexible method for genome-wide genotyping. Nat. Methods 2012, 9, 808–810. [Google Scholar] [CrossRef]
  17. Pecoraro, C.; Babbucci, M.; Villamor, A.; Franch, R.; Papetti, C.; Leroy, B.; Cariani, A. Methodological assessment of 2b-RAD genotyping technique for population structure inferences in yellowfin tuna (Thunnus albacares). Mar. Genom. 2016, 25, 43–48. [Google Scholar] [CrossRef]
  18. Dou, J.; Li, X.; Fu, Q.; Jiao, W.; Li, Y.; Li, T. Evaluation of the 2b-rad method for genomic selection in scallop breeding. Sci. Rep. 2016, 6, 19244. [Google Scholar] [CrossRef] [Green Version]
  19. Yi, S.; Li, Y.; Shi, L.; Zhang, L.; Li, Q.; Chen, J. Characterization of population genetic structure of red swamp crayfish, Procambarus clarkii, in China. Sci. Rep. 2018, 8, 5586. [Google Scholar] [CrossRef] [Green Version]
  20. Manuzzi, A.; Zane, L.; Muñoz-Merida, A.; Griffiths, A.M.; Veríssimo, A. Population genomics and phylogeography of a benthic coastal shark (Scyliorhinus canicula) using 2b-RAD single nucleotide polymorphisms. Biol. J. Linn. Soc. 2018, 126, 289–303. [Google Scholar] [CrossRef] [Green Version]
  21. Zhang, J.; Kobert, K.; Flouri, T.; Stamatakis, A. PEAR: A fast and accurate Illumina Paired-End reAd mergeR. Bioinformatics 2013, 30, 614–620. [Google Scholar] [CrossRef] [Green Version]
  22. Catchen, J.; Hohenlohe, P.A.; Bassham, S.; Amores, A.; Cresko, W.A. Stacks: An analysis tool set for population genomics. Mol. Ecol. 2013, 22, 3124–3140. [Google Scholar] [CrossRef] [PubMed] [Green Version]
  23. Li, R.; Li, Y.; Kristiansen, K. SOAP: Short oligonucleotide alignment program. Bioinformatic 2008, 24, 713–714. [Google Scholar] [CrossRef] [PubMed] [Green Version]
  24. Fu, X.; Dou, J.; Mao, J.; Su, H.; Jiao, W.; Zhang, L.; Hu, X.; Huang, X.; Wang, S.; Bao, Z. RADtyping: An integrated package for accurate de novo codominant and dominant RAD genotyping in mapping populations. PLoS ONE 2013, 8, e79960. [Google Scholar] [CrossRef] [PubMed] [Green Version]
  25. Rousset, F. GENEPOP‘ 007: A complete re-implementation of the GENEPOP software for Windows and Linux. Mol. Ecol. Resour. 2008, 8, 103–106. [Google Scholar] [CrossRef]
  26. Danecek, P.; Auton, A.; Abecasis, G. The variant call format and VCFtools. Bioinformatics 2011, 27, 2156–2158. [Google Scholar] [CrossRef] [PubMed] [Green Version]
  27. Purcell, S.; Neale, B.; Toddbrown, K. PLINK: A tool set for whole-genome association and population-based linkage analyses. Am. J. Hum. Genet. 2007, 81, 559–575. [Google Scholar] [CrossRef] [Green Version]
  28. Chakraborty, R.; Weiss, K.M. Admixture as a tool for finding linked genes and detecting that difference from allelic association between loci. Proc. Natl. Acad. Sci. USA 1988, 85, 9119–9123. [Google Scholar] [CrossRef] [PubMed]
  29. Chang, C.C.; Chow, C.C.; Cam, T.L.; Shashaank, V.; Purcell, S.M.; Lee, J.J. Second-generation plink: Rising to the challenge of larger and richer datasets. Giga Sci. 2015, 4, 7. [Google Scholar] [CrossRef]
  30. Vilella, A.; Severin, J.; Ureta-Vidal, A.; Heng, L.; Durbin, R.; Birney, E. Ensembl Compara Gene Trees: Complete, duplication-aware phylogenetic trees in vertebrates. Genome Res. 2009, 19, 327–335. [Google Scholar] [CrossRef] [Green Version]
  31. Gillanders, B.M.; Ferrell, D.J.; Andrew, N.L. Estimates of movement and life-history parameters of yellowtail kingfish (seriola lalandi): How useful are data from a cooperative tagging programme? Mar. Freshw. Res. 2001, 52, 179–192. [Google Scholar] [CrossRef]
  32. Miller, P.A.; Fitch, A.J.; Gardner, M.; Hutson, K.S.; Mair, G. Genetic population structure of yellowtail kingfish (Seriola lalandi) in temperate Australasian waters inferred from microsatellite markers and mitochondrial DNA. Aquaculture 2011, 319, 328–336. [Google Scholar] [CrossRef]
  33. Wolvaardt, C. Initiation of Company Coverage—IPO, Western Kingfish Ltd.; State One Stockbroking Ltd.: Sydney, Australia, 2007; pp. 1–9. [Google Scholar]
  34. Poulin, E.; Cardenas, L.; Hernandez, C.E.; Kornfield, I.; Ojeda, F.P. Resolution of the taxonomic status of Chilean and Californian jack mackerels using mitochondrial DNA sequence. J. Fish Biol. 2004, 65, 1160–1164. [Google Scholar] [CrossRef]
  35. Díaz-Jaimes, P.; Uribe-Alcocer, M.; Rocha-Olivares, A.; García-de-León, F.J.; Nortmoon, P.; Durand, J.D. Global phylogeography of the dolphinfish (coryphaena hippurus): The influence of large effective population size and recent dispersal on the divergence of a marine pelagic cosmopolitan species. Mol. Phylogenet Evol. 2010, 57, 1209–1218. [Google Scholar] [CrossRef]
  36. Sepúlveda, F.A. and González, M.T. Spatio-temporal patterns of genetic variations in populations of yellowtail kingfish Seriola lalandi from the south-eastern Pacific Ocean and potential implications for its fishery management. J. Fish Biol. 2017, 90, 249–264. [Google Scholar] [CrossRef]
  37. Sala, E.; Aburtooropeza, O.; Paredes, G.; Thompson, G. Spawning aggregations and reproductive behavior of reef fishes in the gulf of California. B Mar. Sci. 2003, 72, 103–121. [Google Scholar]
  38. Erisman, B.; Mascarenas, I.; Paredes, G.; Mitcheson, Y.S.D.; Aburto-Oropeza, O.; Hastings, P. Seasonal, annual, and long-term trends in commercial fisheries for aggregating reef fishes in the gulf of California, Mexico. Fish Res. 2010, 106, 279–288. [Google Scholar] [CrossRef]
  39. Poortenaar, C.; Hooker, S.; Sharp, N. Assessment of yellowtail kingfish (Seriola lalandi) reproductive physiology, as a basis for aquaculture development. Aquaculture 2001, 201, 271–286. [Google Scholar] [CrossRef]
  40. Iguchi, J.; Takashima, Y.; Namikoshi, A.; Yamashita, M. Species identification method for marine products of seriola and related species. Fish Sci. 2012, 78, 197–206. [Google Scholar] [CrossRef]
  41. Moran, D.; Smith, C.K.; Gara, B.; Poortenaar, C.W. Reproductive behaviour and early development in yellowtail kingfish (Seriola lalandi Valenciennes 1833). Aquaculture 2007, 262, 95–104. [Google Scholar] [CrossRef]
  42. Moran, D.; Gara, B.; Wells, R.M.G. Energetics and metabolism of yellowtail kingfish (Seriola lalandi Valenciennes 1833) during embryogenesis. Aquaculture 2007, 265, 359–369. [Google Scholar] [CrossRef]
  43. National Oceanic and Atmospheric Administration. NOAA Optimum Interpolation Sea Surface Temperature Analysis; NOAA/OAR/ESRL PSD (United States Department of Commerce): Boulder, CO, USA, 2011.
  44. Fernández, G.; Cichero, D.; Patel, A.; Martínez, V. Genetic structure of Chilean populations of Seriola lalandi for the diversification of the national aquaculture in the north of Chile. Lat. Am. J. Aquat. Res. 2015, 43, 374–379. [Google Scholar] [CrossRef]
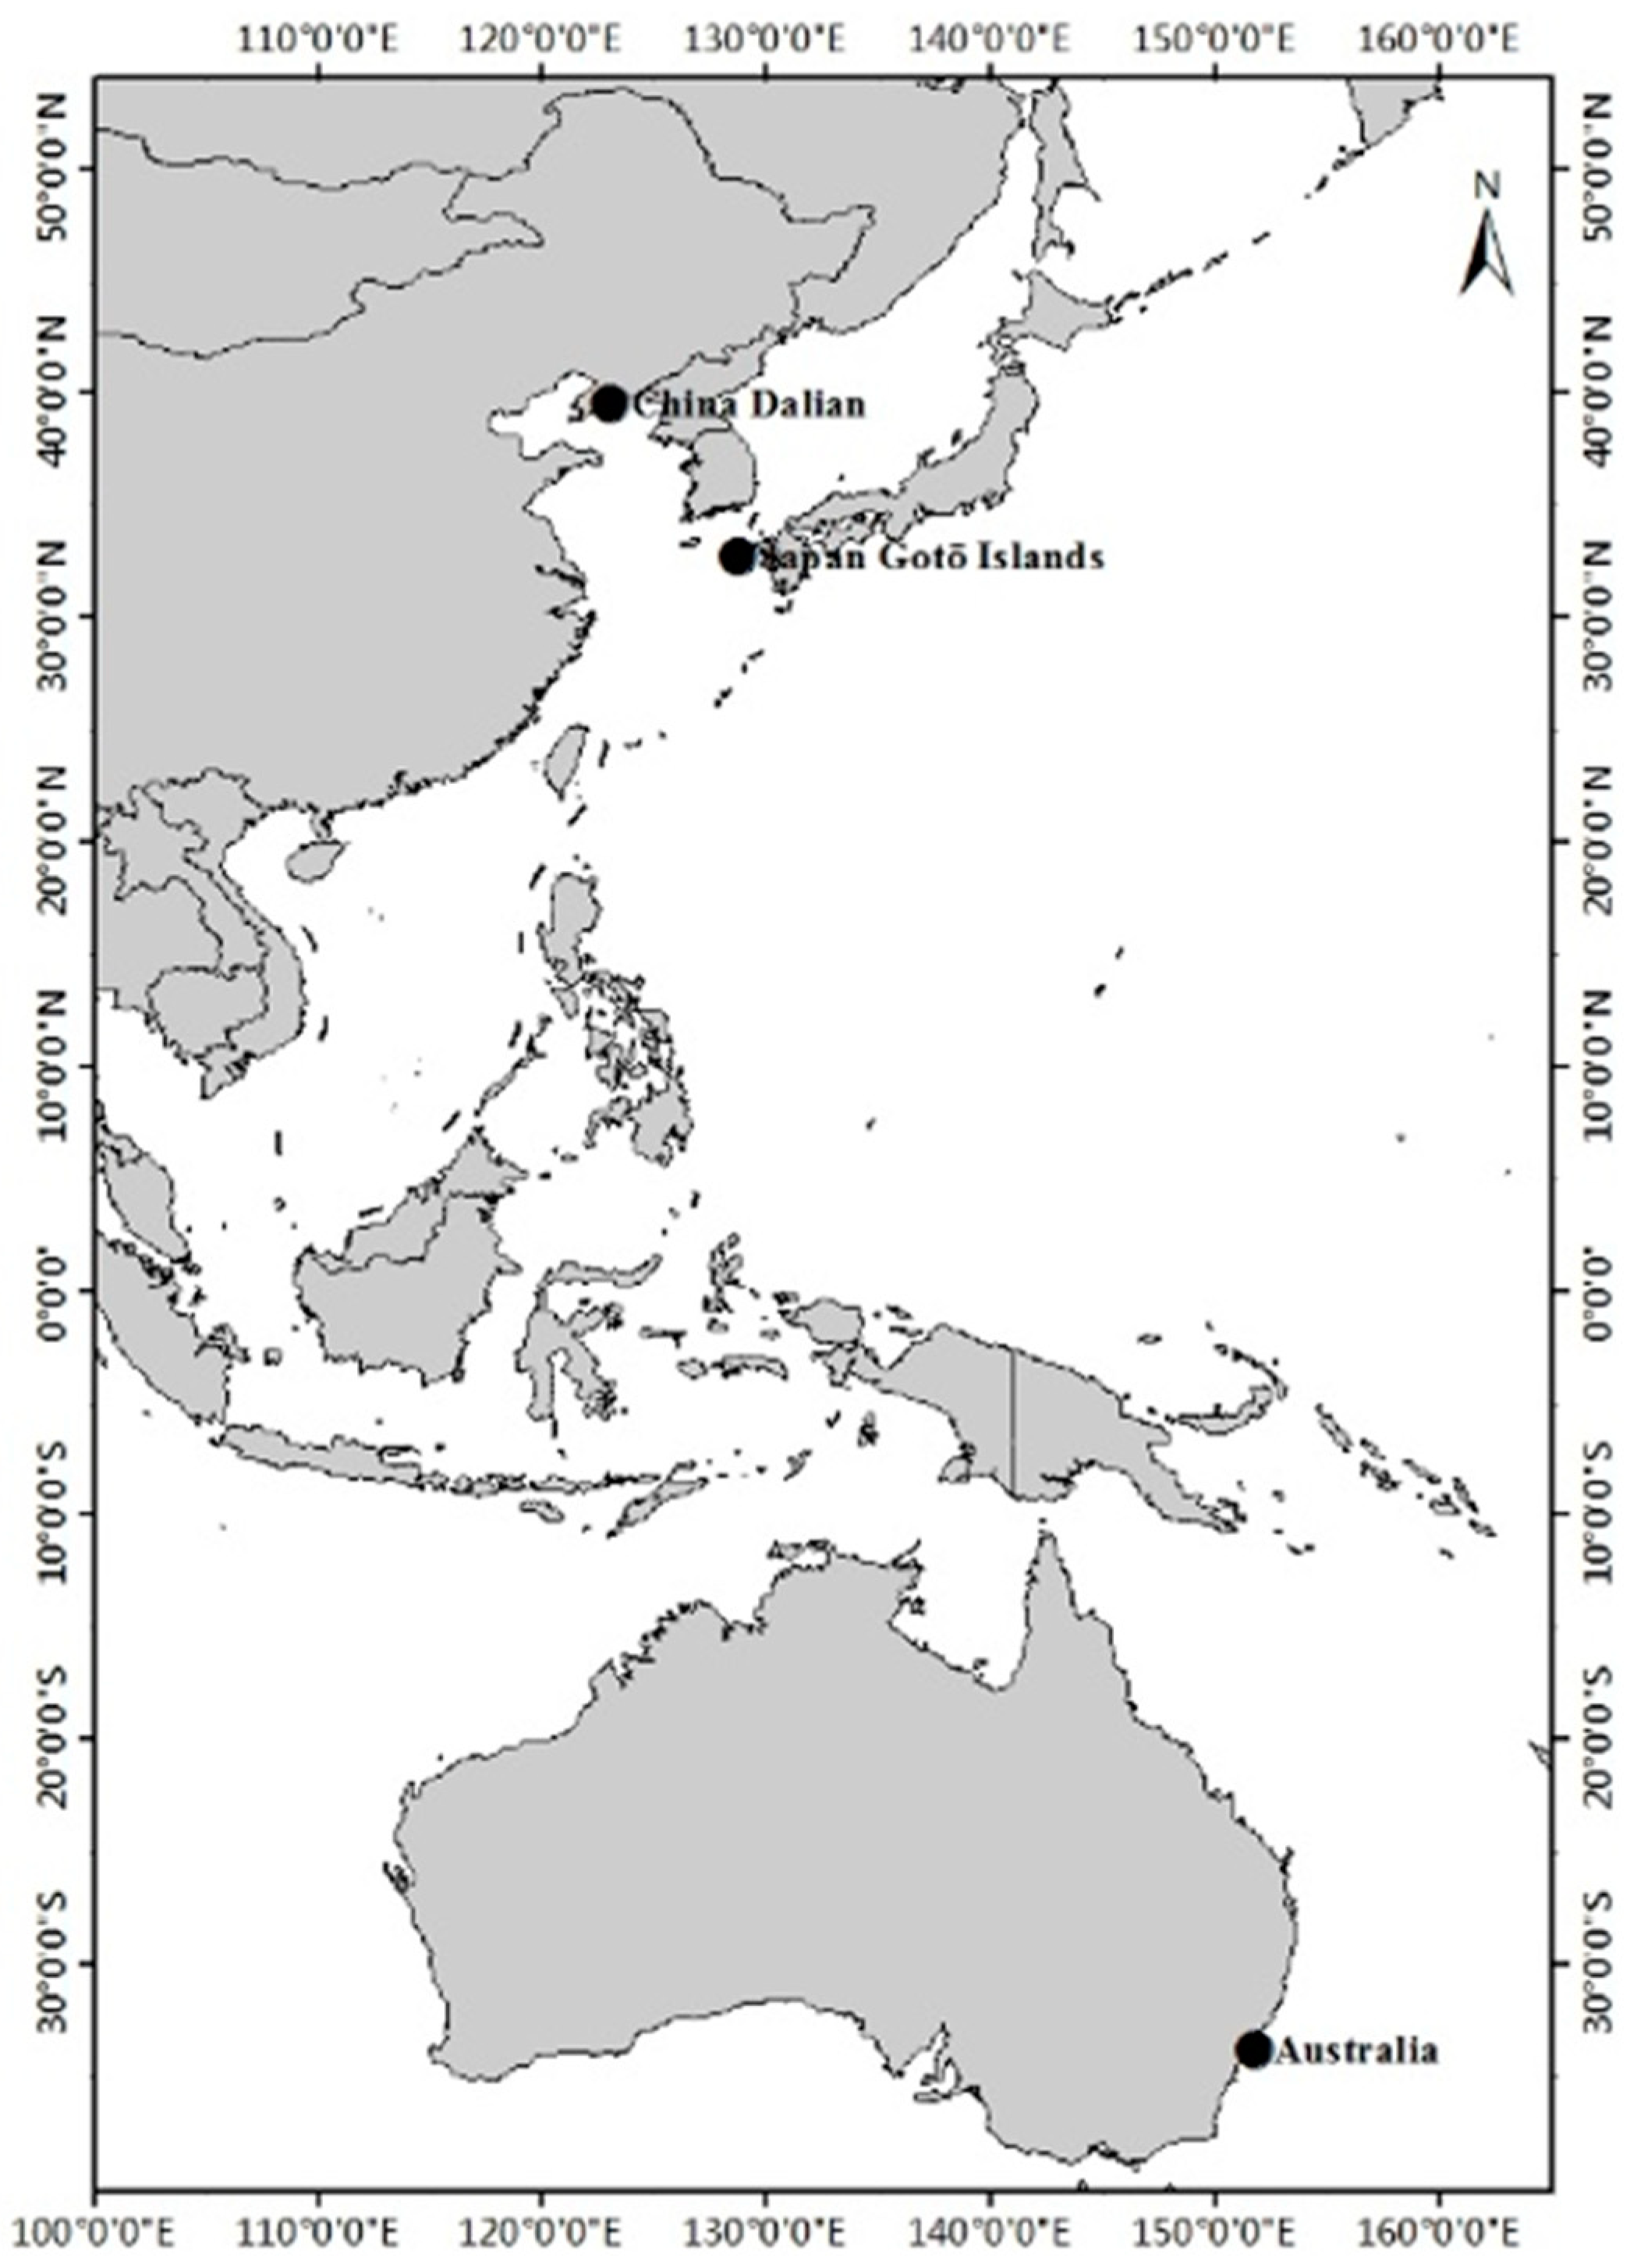
Figure 1. Geographical distribution of the yellowtail kingfish collections sampled in this study.
Jmse 11 01583 g001
Figure 2. (A). The genetic structure of the five yellowtail kingfish collections for K = 2. (B). The genetic structure of the five yellowtail kingfish collections for K = 3. (C). The genetic structure of the five yellowtail kingfish collections for K = 4. Notes: Each bar represents one individual. Different colors suggest different origins and show the proportion of each genotype belonging to each genetic cluster.
Jmse 11 01583 g002
Figure 3. (AC). Principal components analysis (PCA) showing the genetic structure of five yellowtail kingfish collections. Notes: A Japanese wild collection (JW), Chinese farmed collection (CF), Chinese wild collection (CW), Australian farmed collection (AF), and Australian wild collection (AW). Each symbol represents an individual fish.
Jmse 11 01583 g003
Figure 4. Neighbor-joining phylogenetic tree of the five yellowtail kingfish collections. Notes: The reliability of the phylogenetic tree was assessed using the bootstrap method with 1000 replicates. Branch lengths reflect the genetic distance. A Japanese wild collection (JW), Chinese farmed collection (CF), Chinese wild collection (CW), Australian farmed collection (AF), and Australian wild collection (AW).
Jmse 11 01583 g004
Table 1. Genetic diversity of five yellowtail kingfish collections.
CollectionHoHePiHW-P
All0.08240.20130.20200.4112
JW0.08330.08140.08370.9239
CW0.07180.07710.07850.8872
CF0.08280.08140.08290.9093
AW0.09020.09550.09740.8591
AF0.09400.09270.09430.8996
Notes: A Japanese wild collection (JW), Chinese farmed collection (CF), Chinese wild collection (CW), Australian farmed collection (AF), and Australian wild collection (AW). Ho: observed heterozygosity; He: expected heterozygosity; Pi: nucleotide diversity; HW-P: p-value for the Hardy–Weinberg equilibrium test.
Table 2. Pairwise measures of genetic differentiation among five collections of yellowtail kingfish.
CollectionJWCWCFAWAF
JW-0.00100.01681.29321.3205
CW0.00097-0.01911.34091.3653
CF0.016620.01888-1.31641.3417
AW0.72560.73840.7319-0.0260
AF0.73300.74470.73860.02569-
Notes: A Japanese wild collection (JW), Chinese farmed collection (CF), Chinese wild collection (CW), Australian farmed collection (AF), and Australian wild collection (AW). The genetic differentiation coefficient (Fst) is shown below the diagonal, and the genetic distance (DR) is shown above the diagonal.
Table 3. Values of the gene flow parameter (Nm) among the five collections of yellowtail kingfish.
CollectionJWCWCFAWAF
JW-
CW256.4499-
CF14.792112.9287-
AW0.09530.08940.0923-
AF0.09110.08640.08929.9002-
Notes: A Japanese wild collection (JW), Chinese farmed collection (CF), Chinese wild collection (CW), Australian farmed collection (AF), and Australian wild collection (AW).
Disclaimer/Publisher’s Note: The statements, opinions and data contained in all publications are solely those of the individual author(s) and contributor(s) and not of MDPI and/or the editor(s). MDPI and/or the editor(s) disclaim responsibility for any injury to people or property resulting from any ideas, methods, instructions or products referred to in the content.