
Sea Level Rise and Future Projections in the Baltic Sea


Abstract
1. Introduction
- To provide an overview of sea level rise in the Baltic Sea based on different studies where tide gauges, satellite altimetry, and sea level rise model data were used;
- To verify the absolute sea level rise values at the coast of the Baltic Sea using sea level rise models and determine the relative sea level rise in the coastal area of the Baltic Sea, the rates from land uplift models were compared to absolute sea level rise models.
2. Sea Level Trends in the Baltic Sea
2.1. Sea Level Observations
2.1.1. Tide Gauges
2.1.2. Satellite Altimetry
2.2. Sea Level Trends in the Baltic Sea
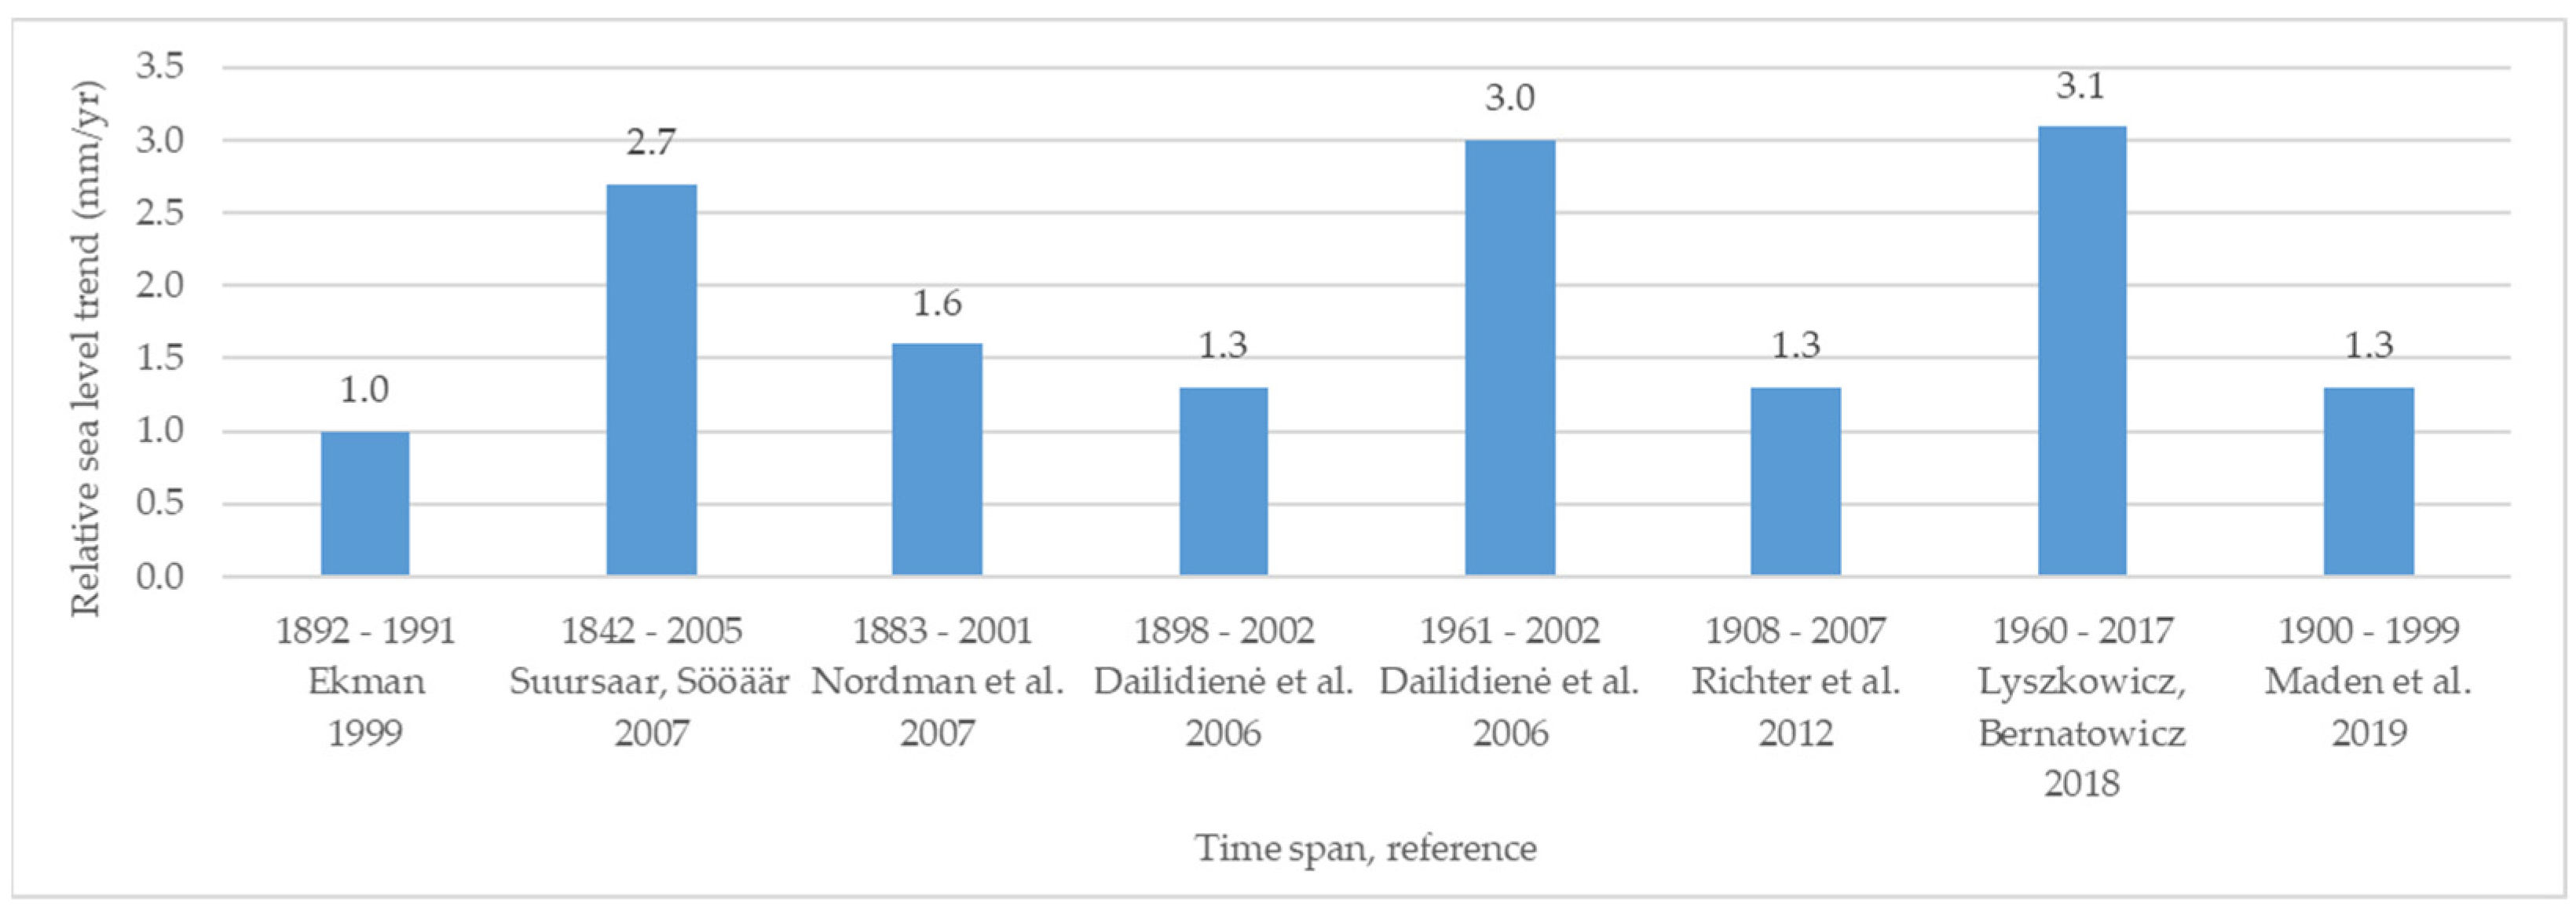
2.2.1. Tide Gauges Data
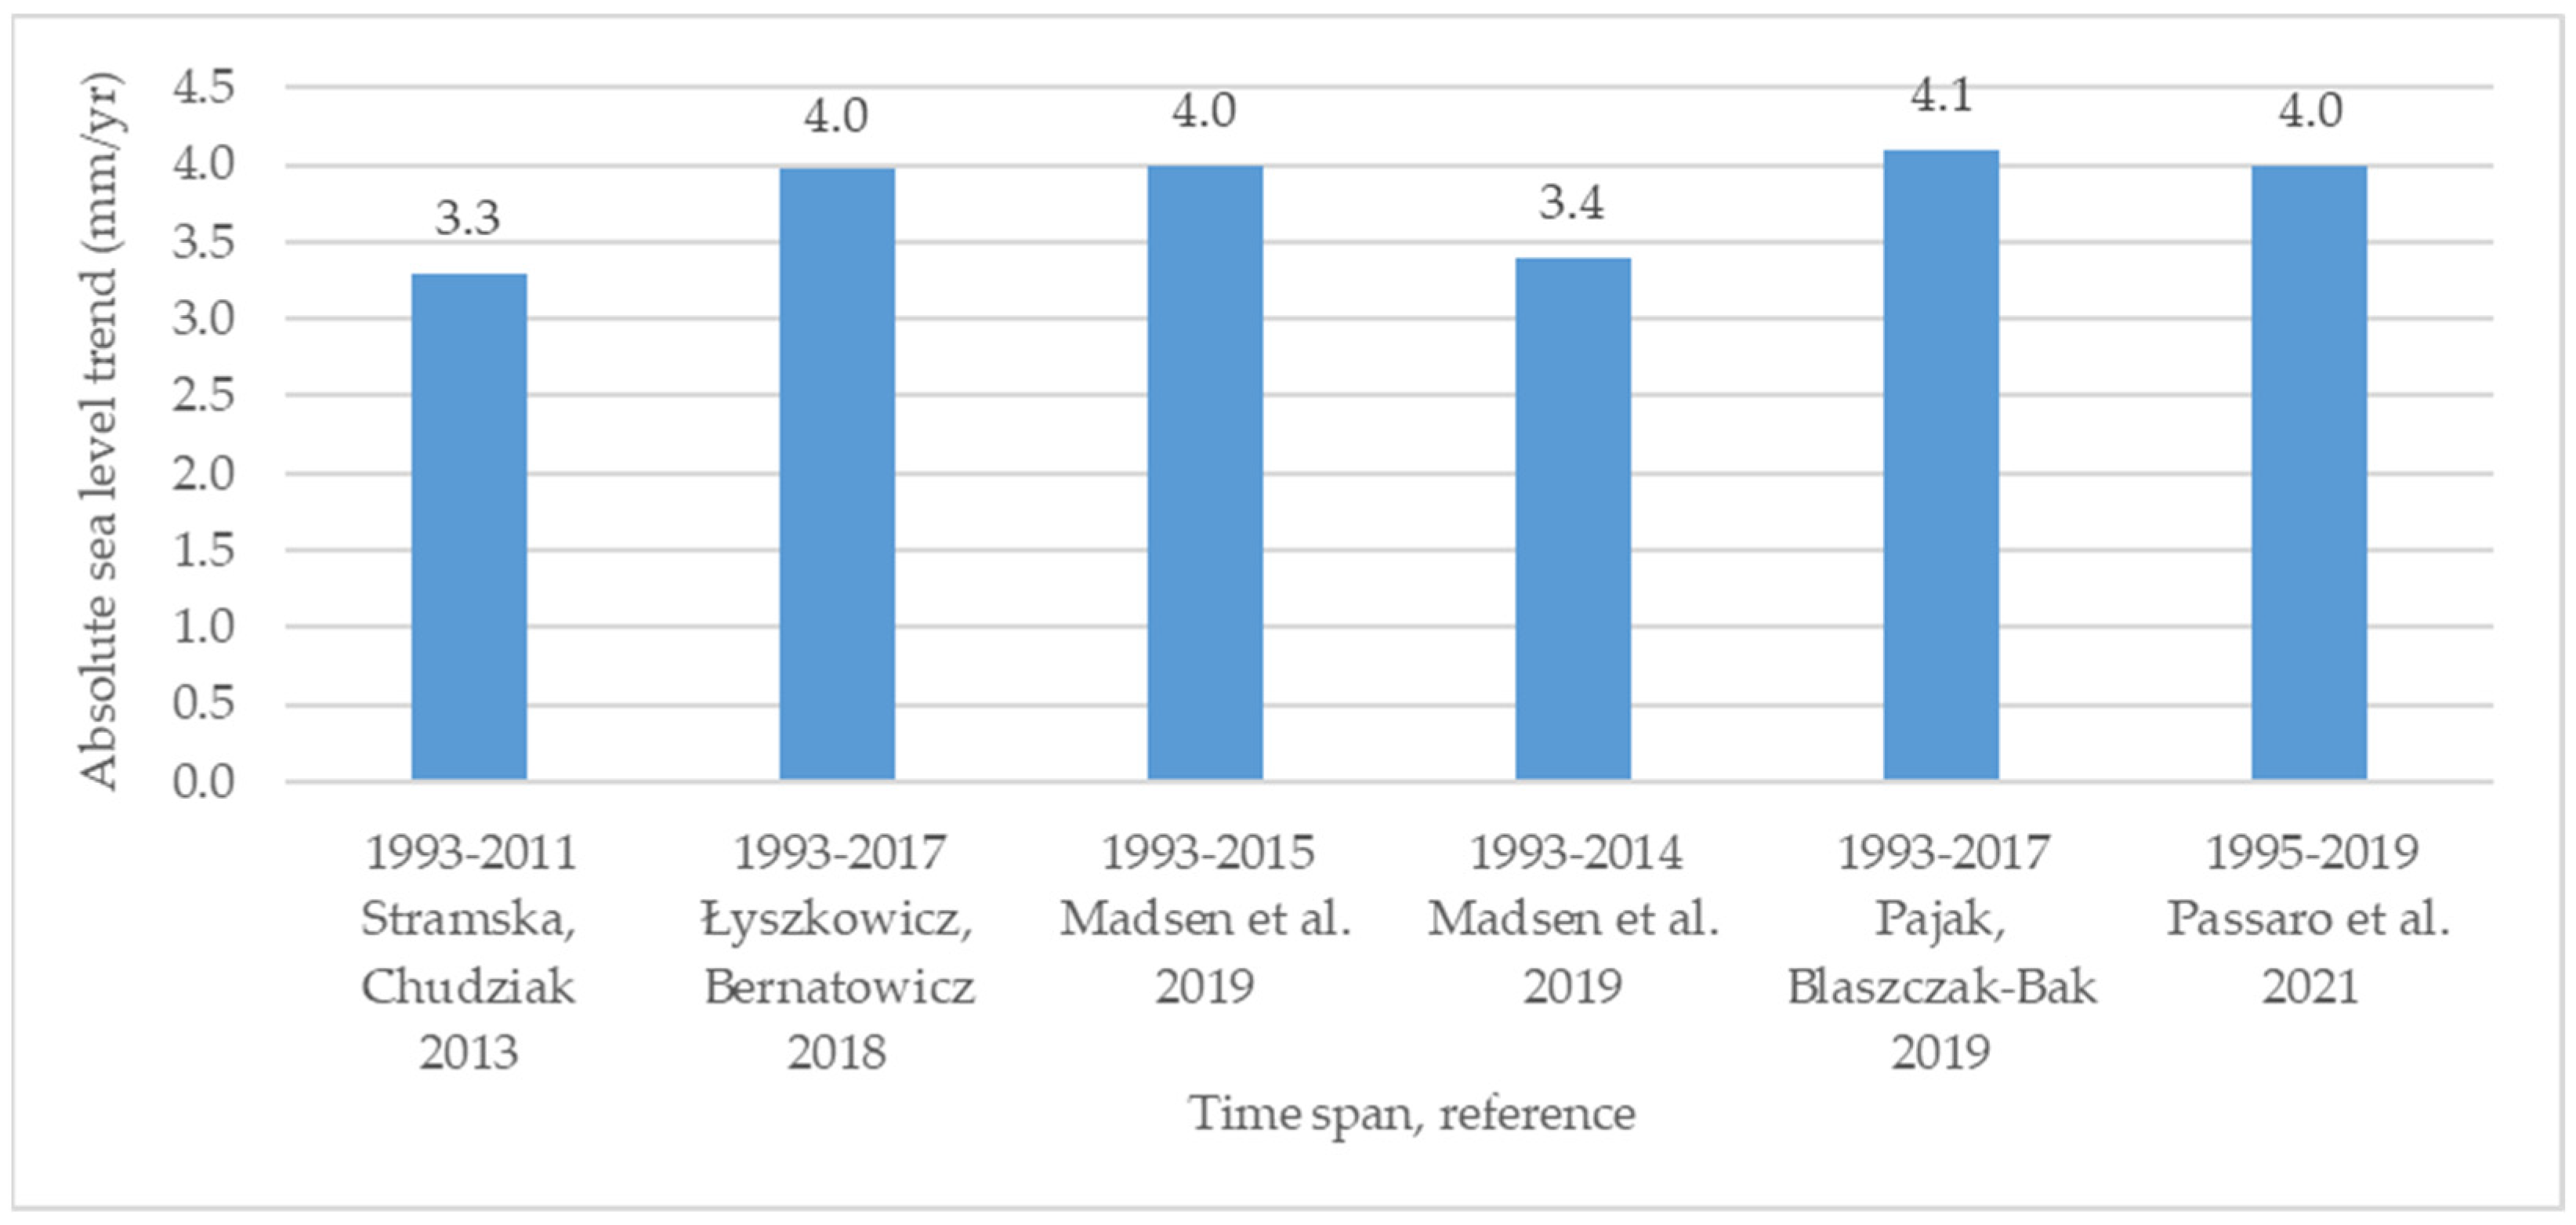
2.2.2. Satellite Altimetry Data
2.2.3. Sea Level Models
- RCP2.6: This scenario assumes that CO2 emissions will reach their peak around 2020 and subsequently decline to zero by 2100. It is designed to achieve global warming levels below 2 °C;
- RCP4.5: In this scenario, CO2 emissions are expected to peak around 2040 and then gradually decline. The projected global warming falls between 2 °C and 3 °C;
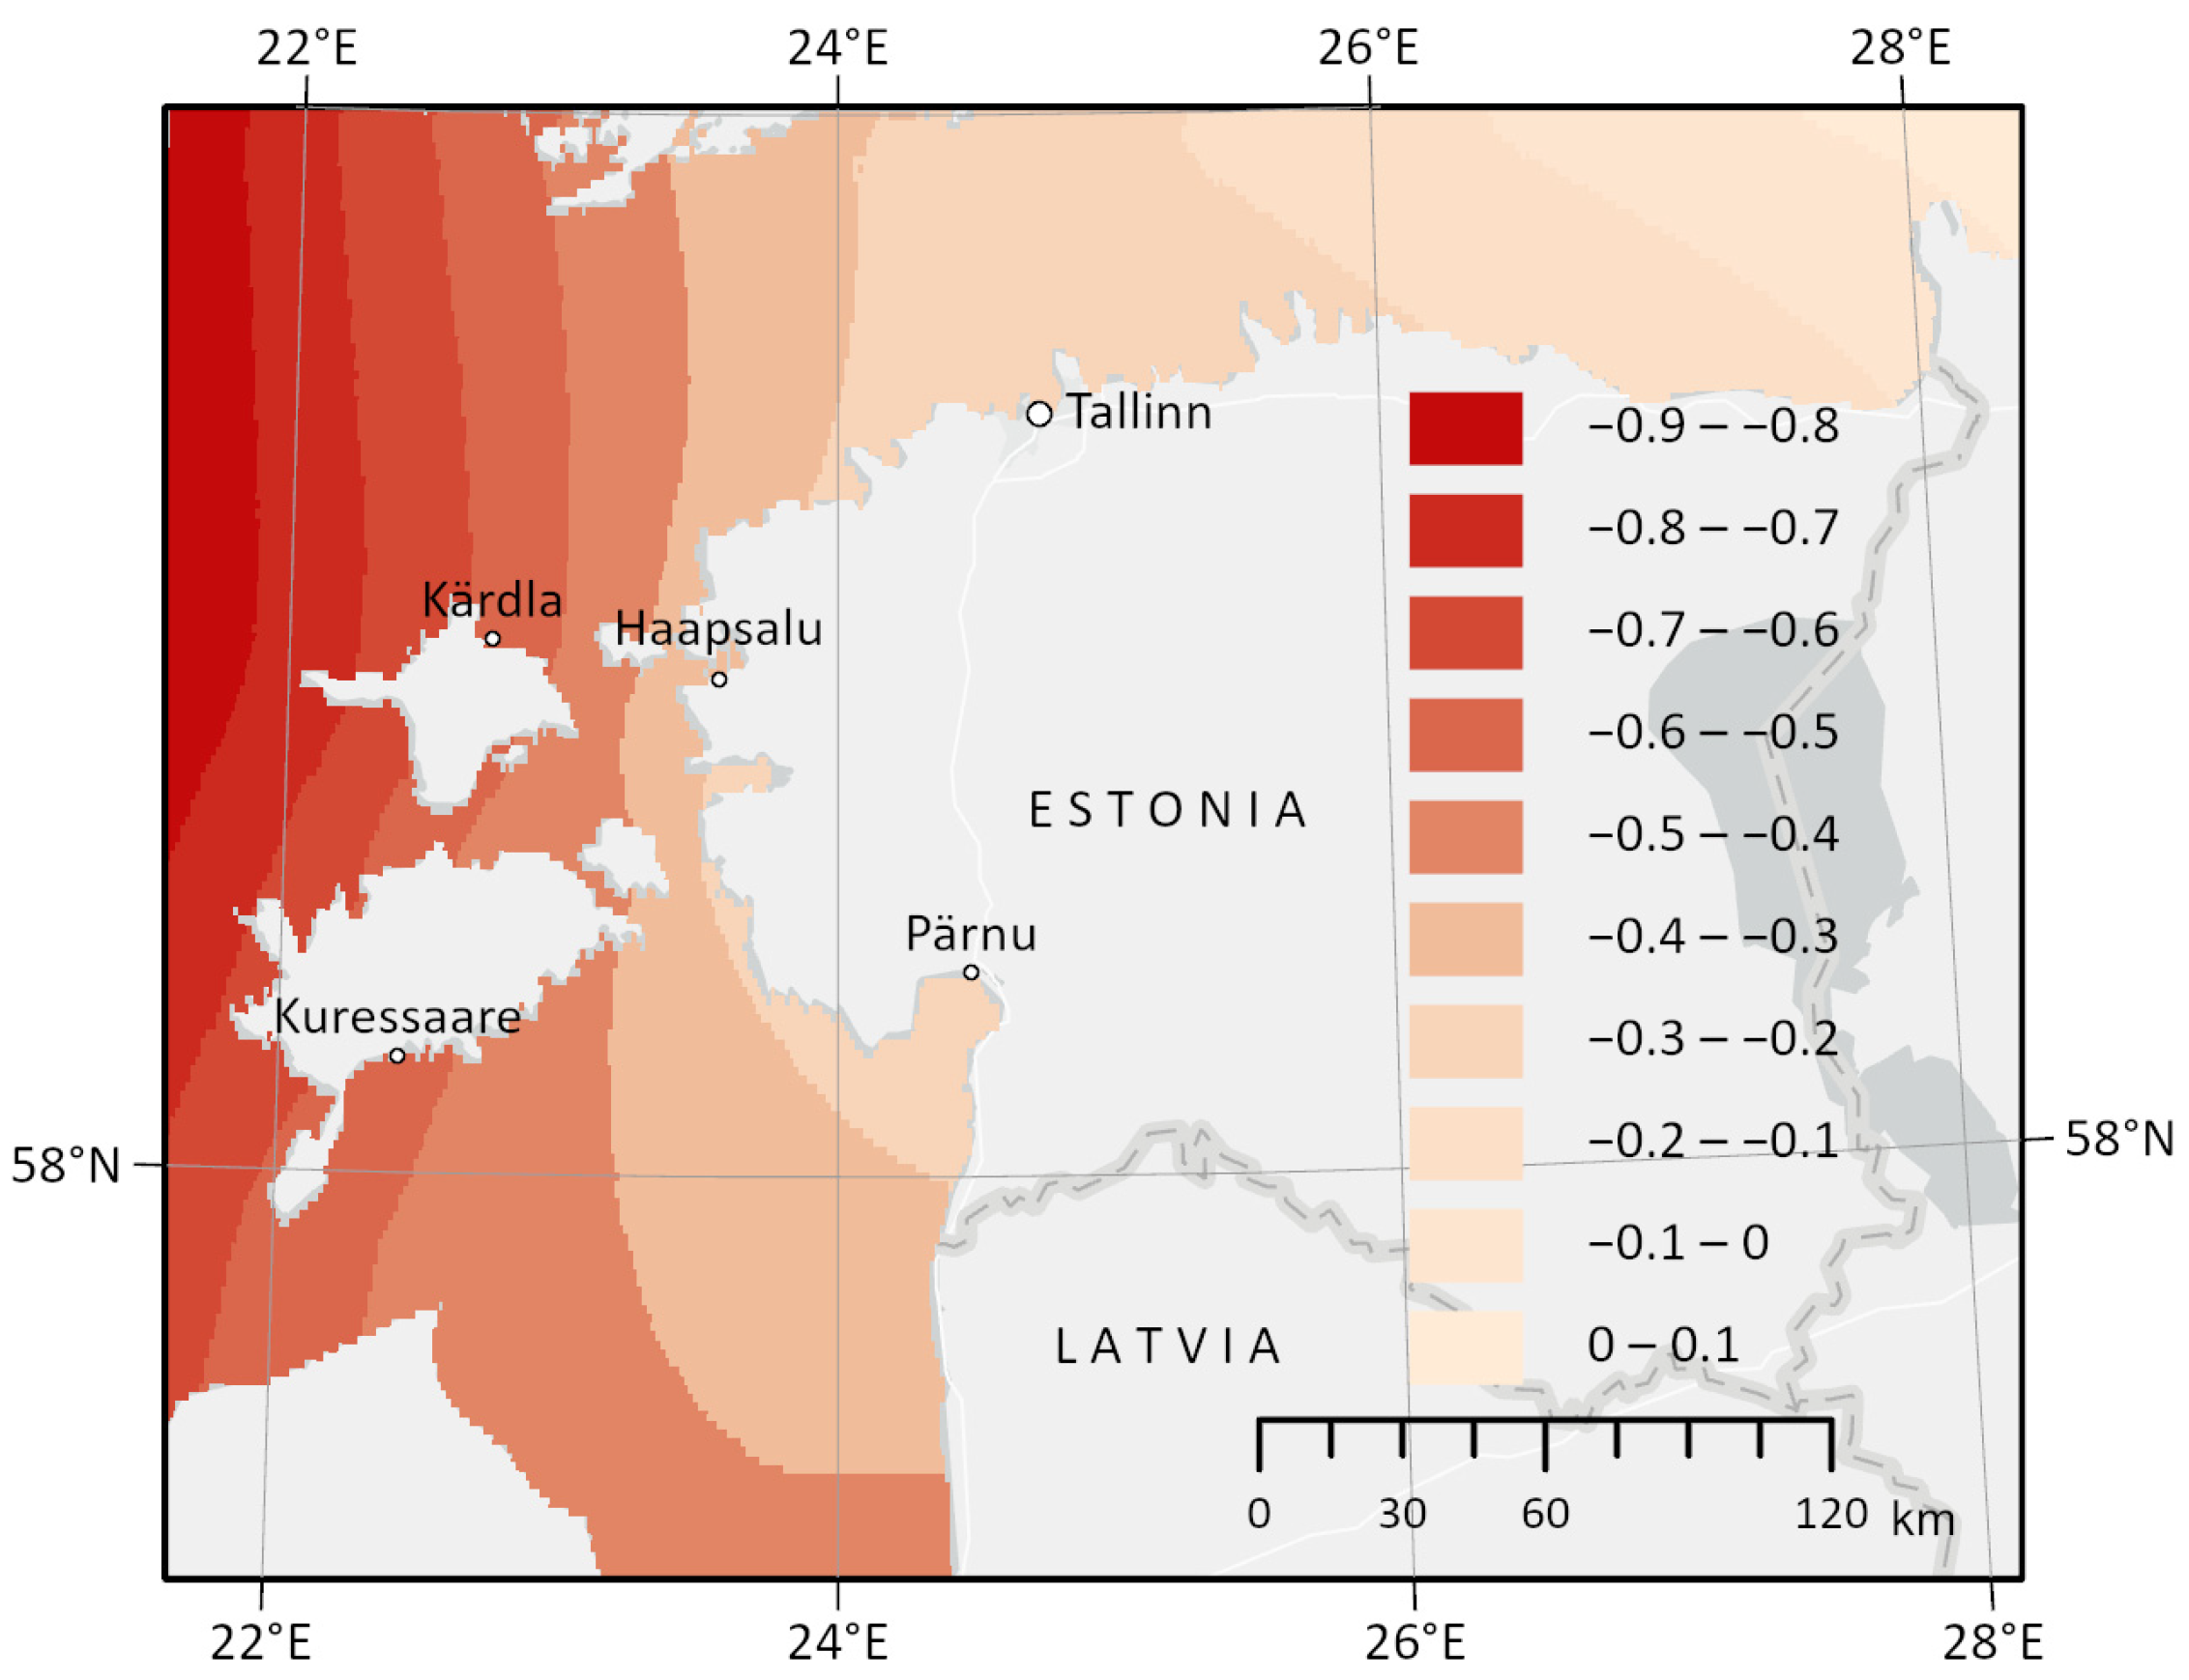
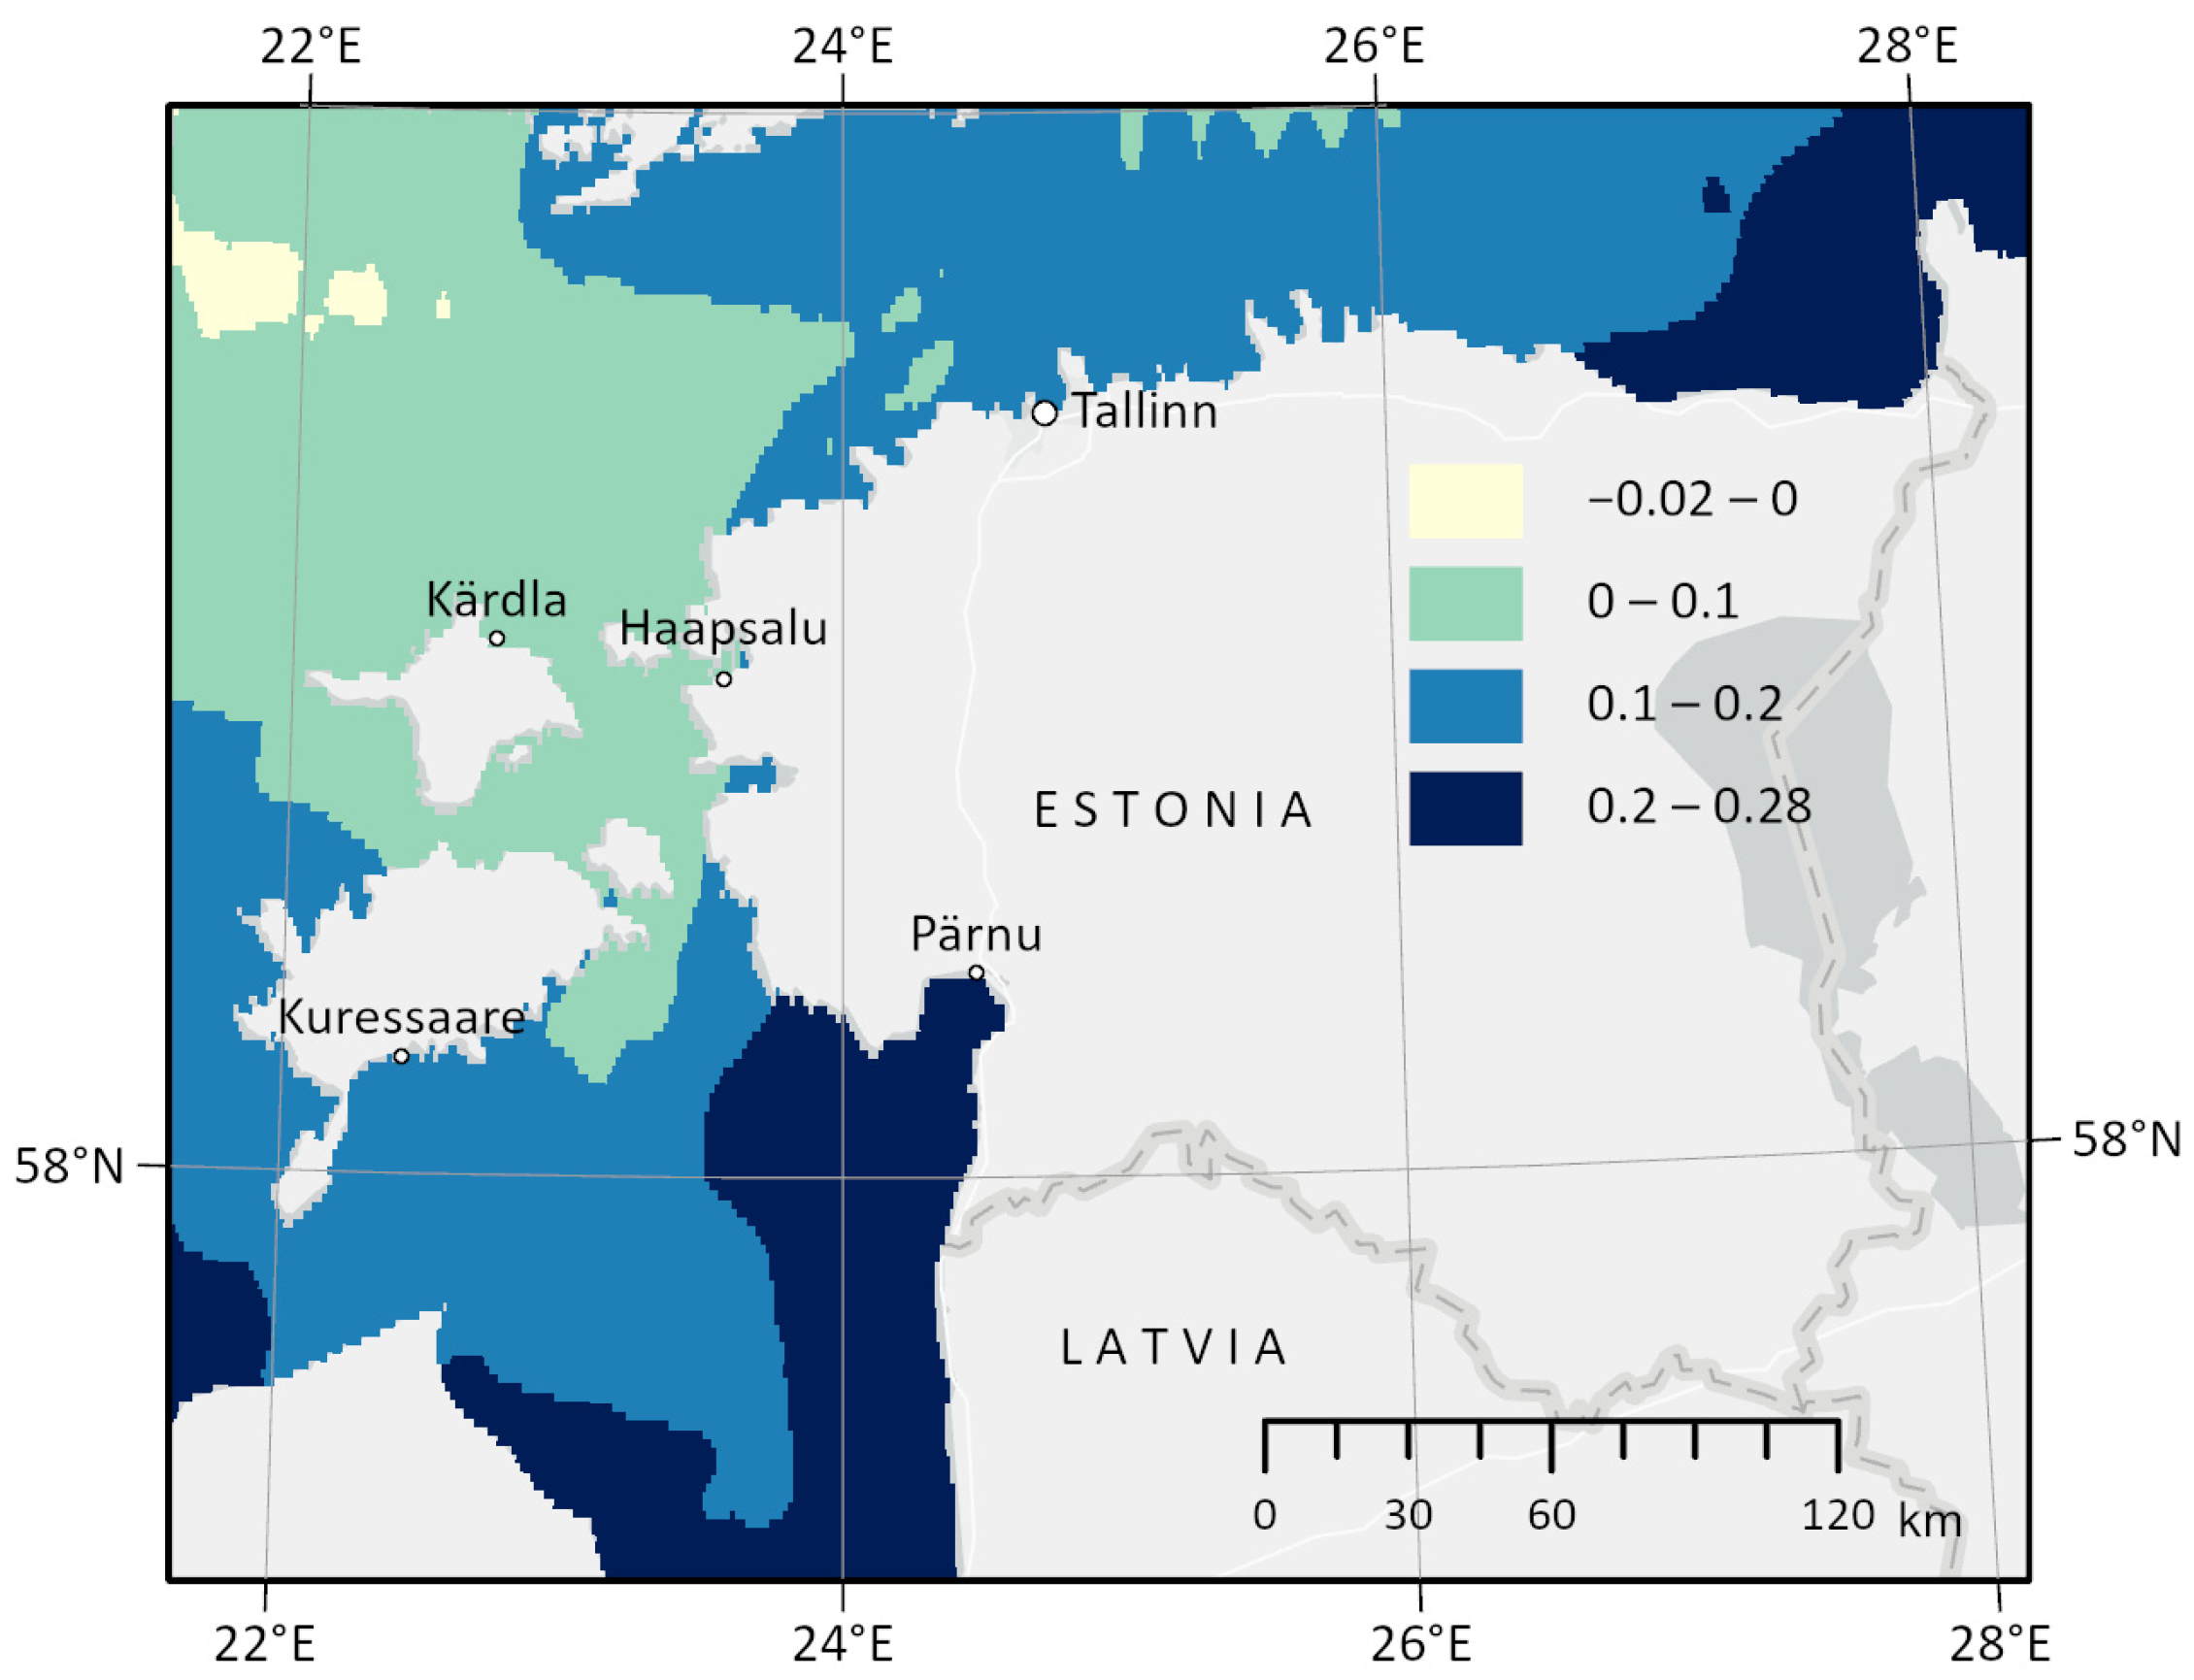
3. Land Uplift Models
4. Relative Sea Level Rise in the Baltic Sea
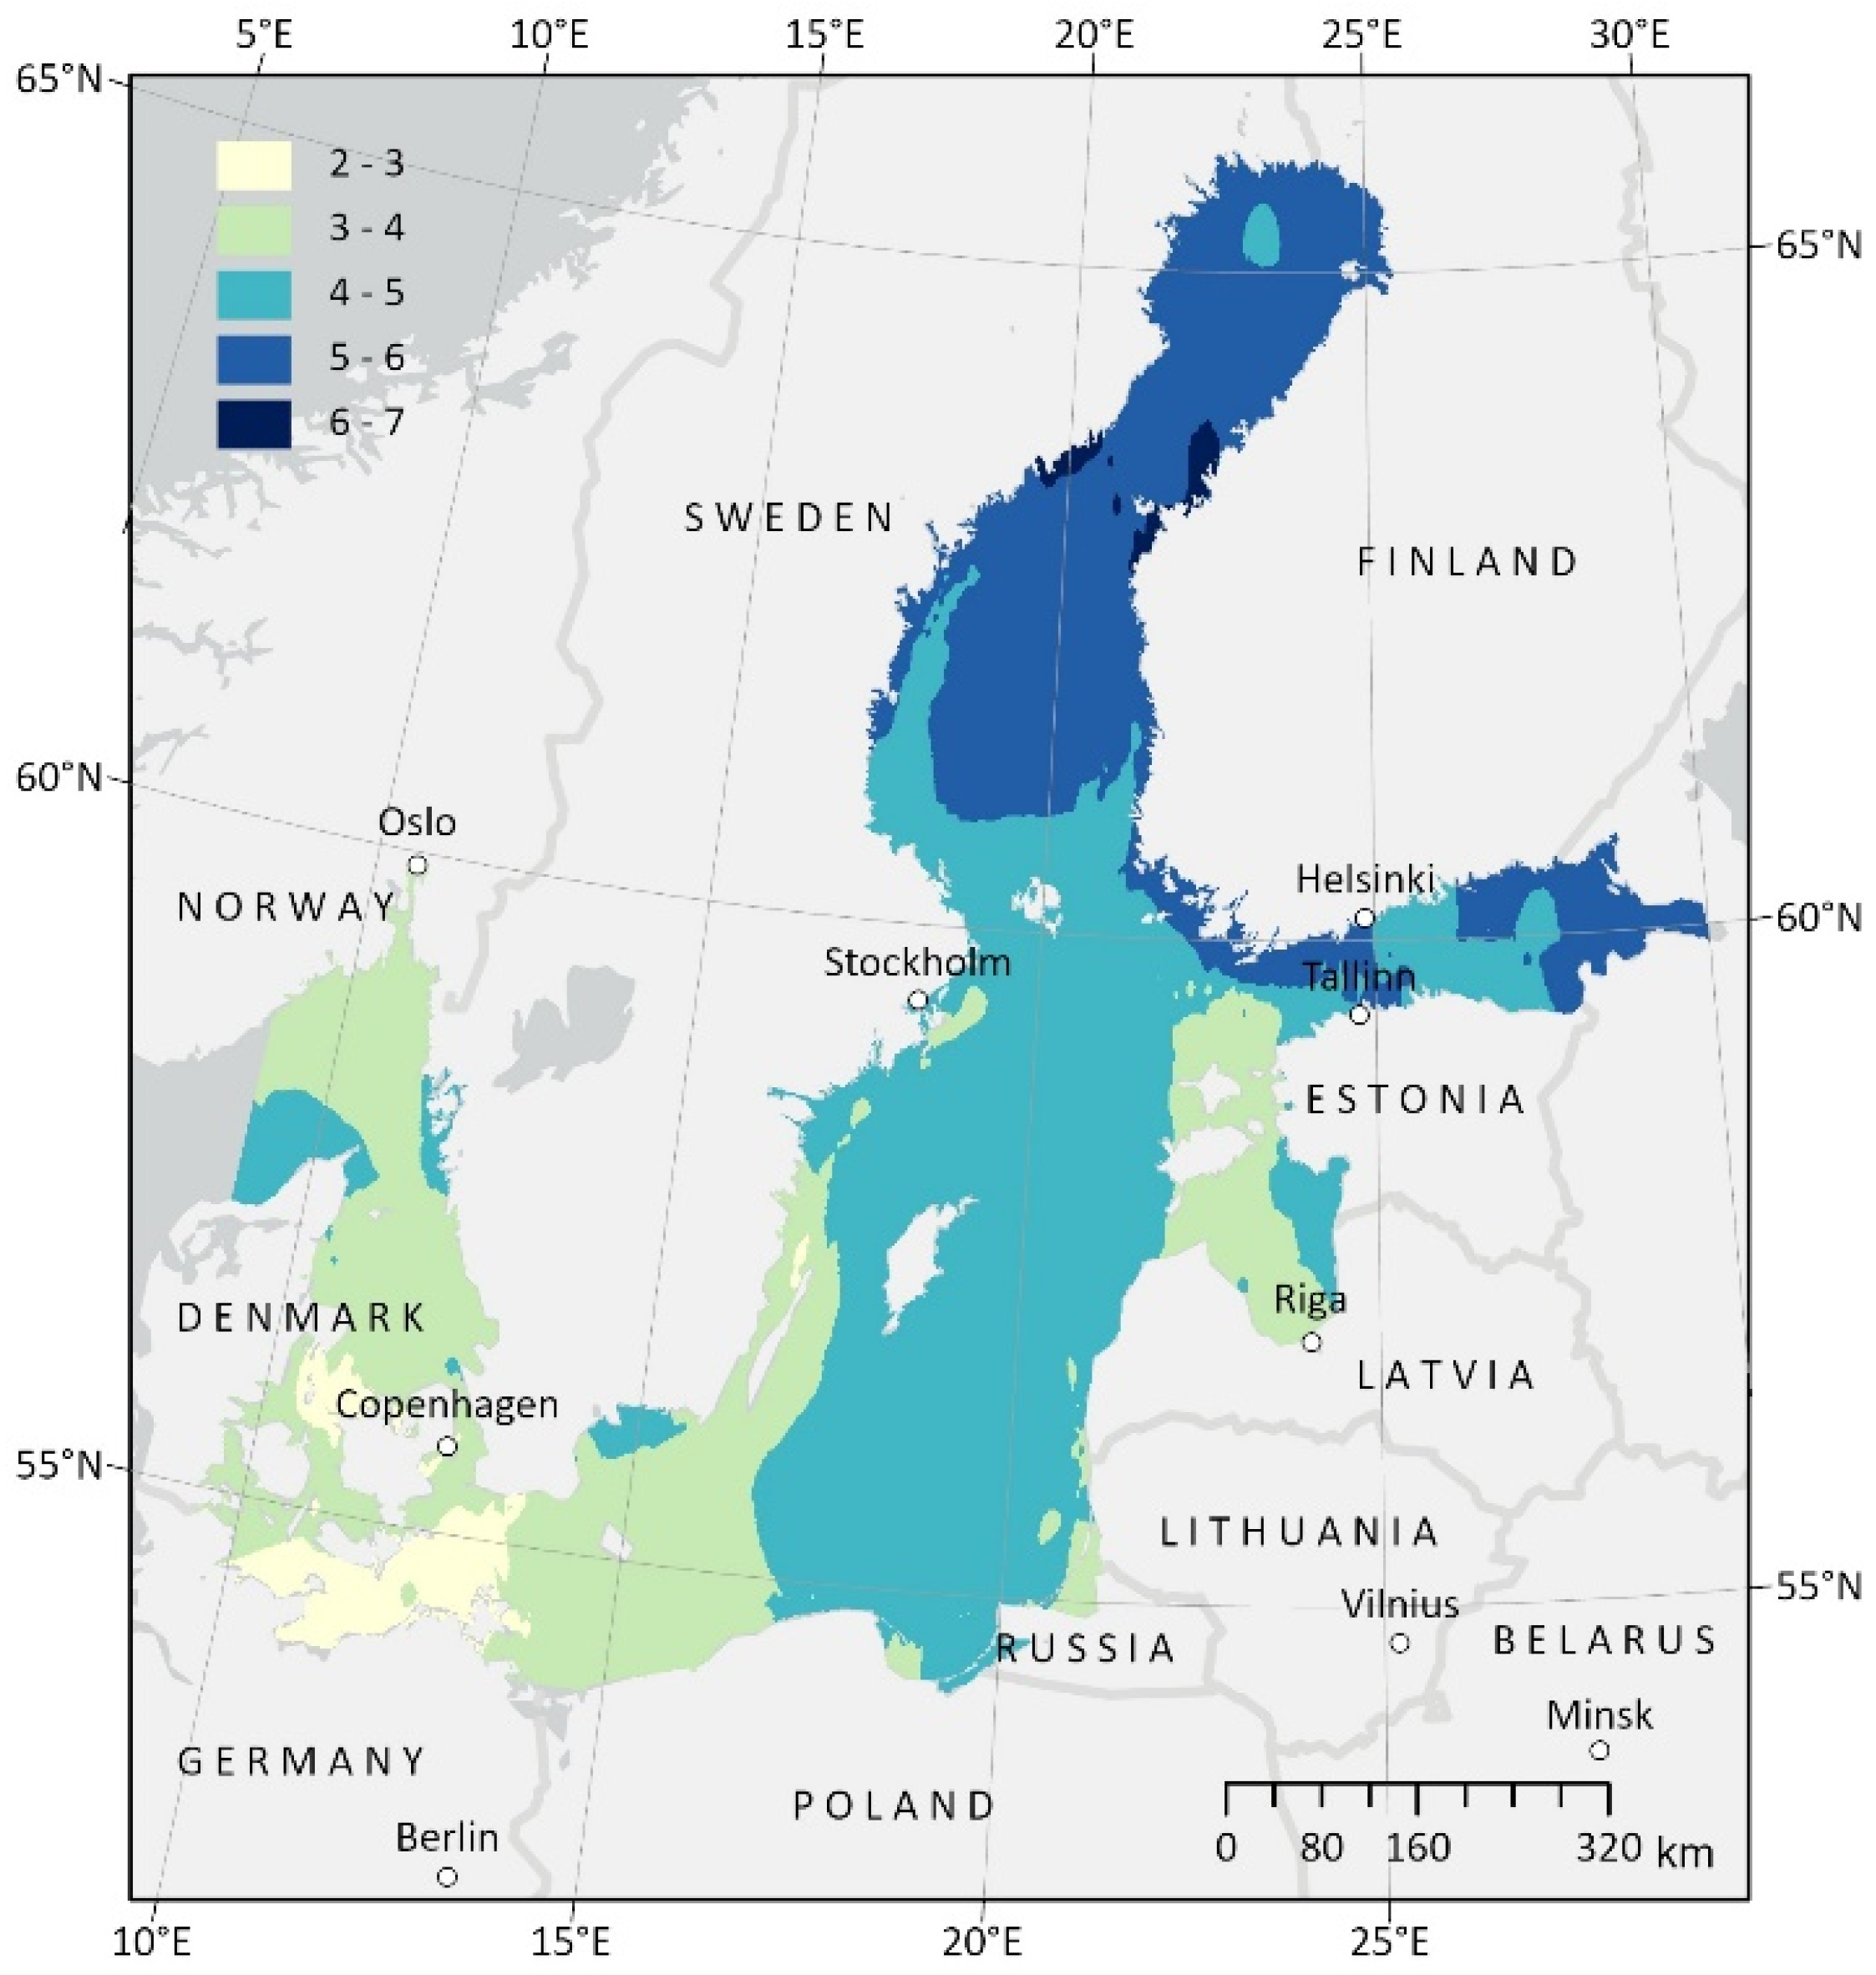
4.1. Coastal Area of the Baltic Sea
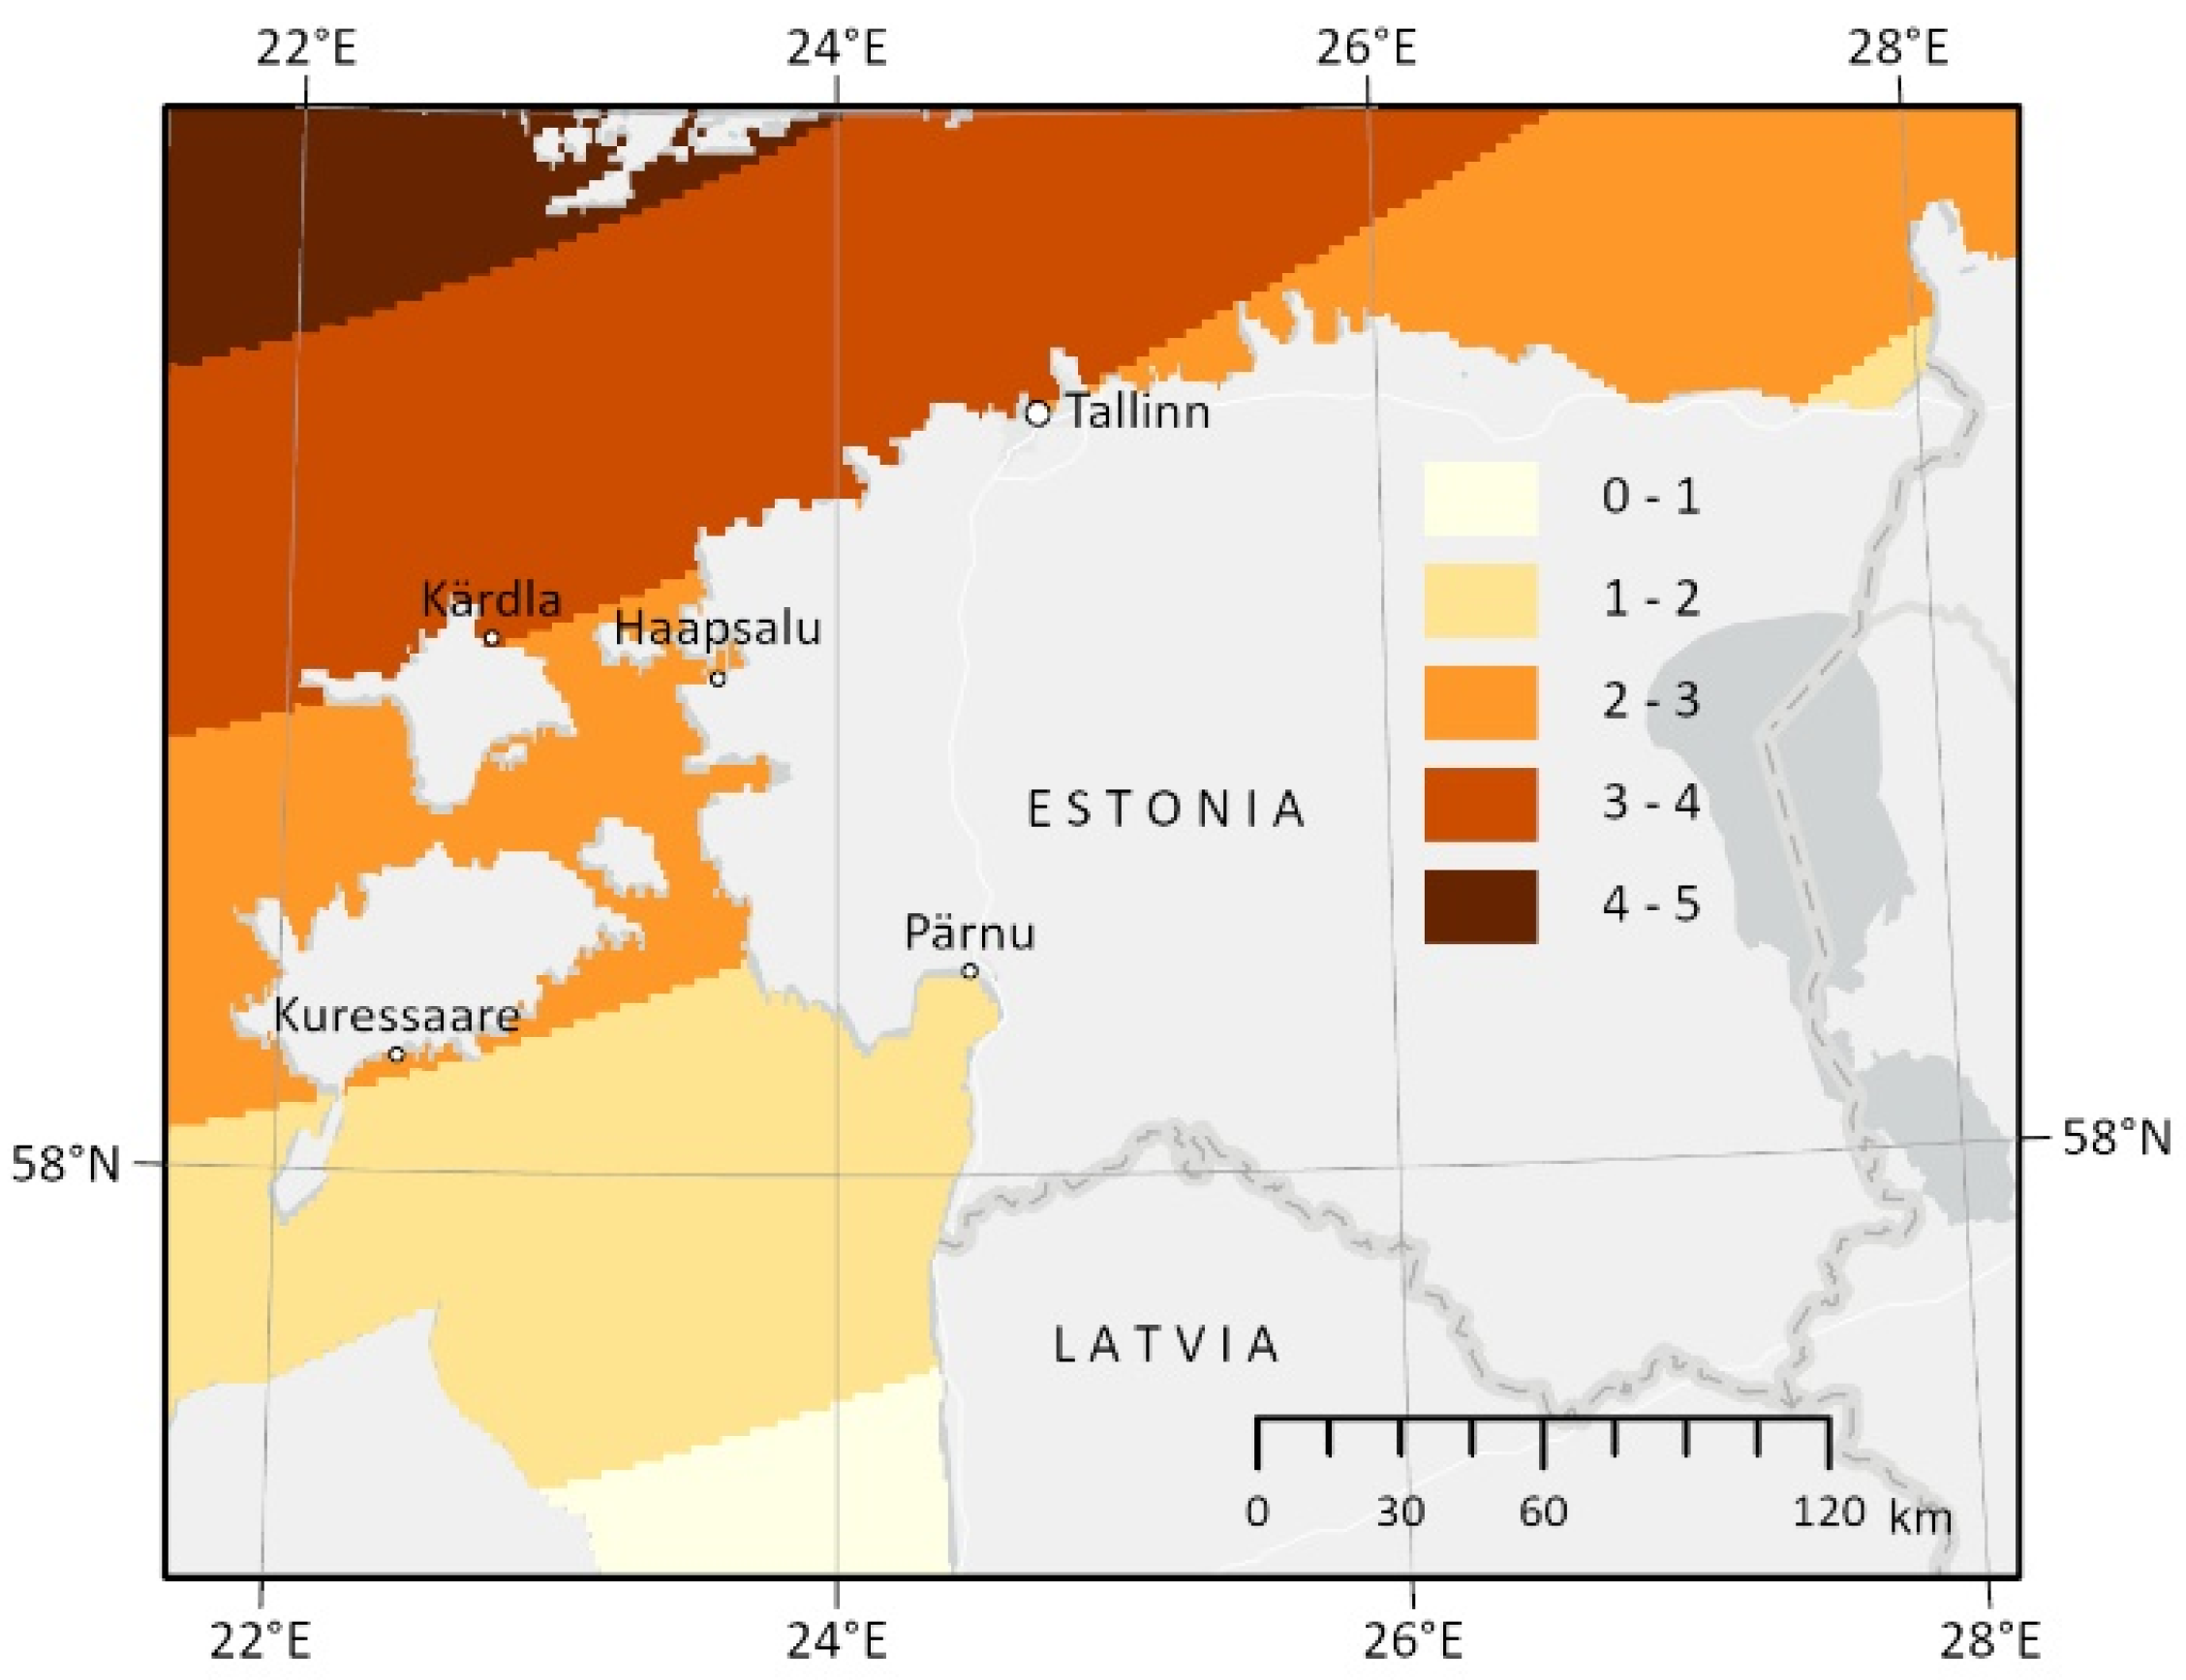
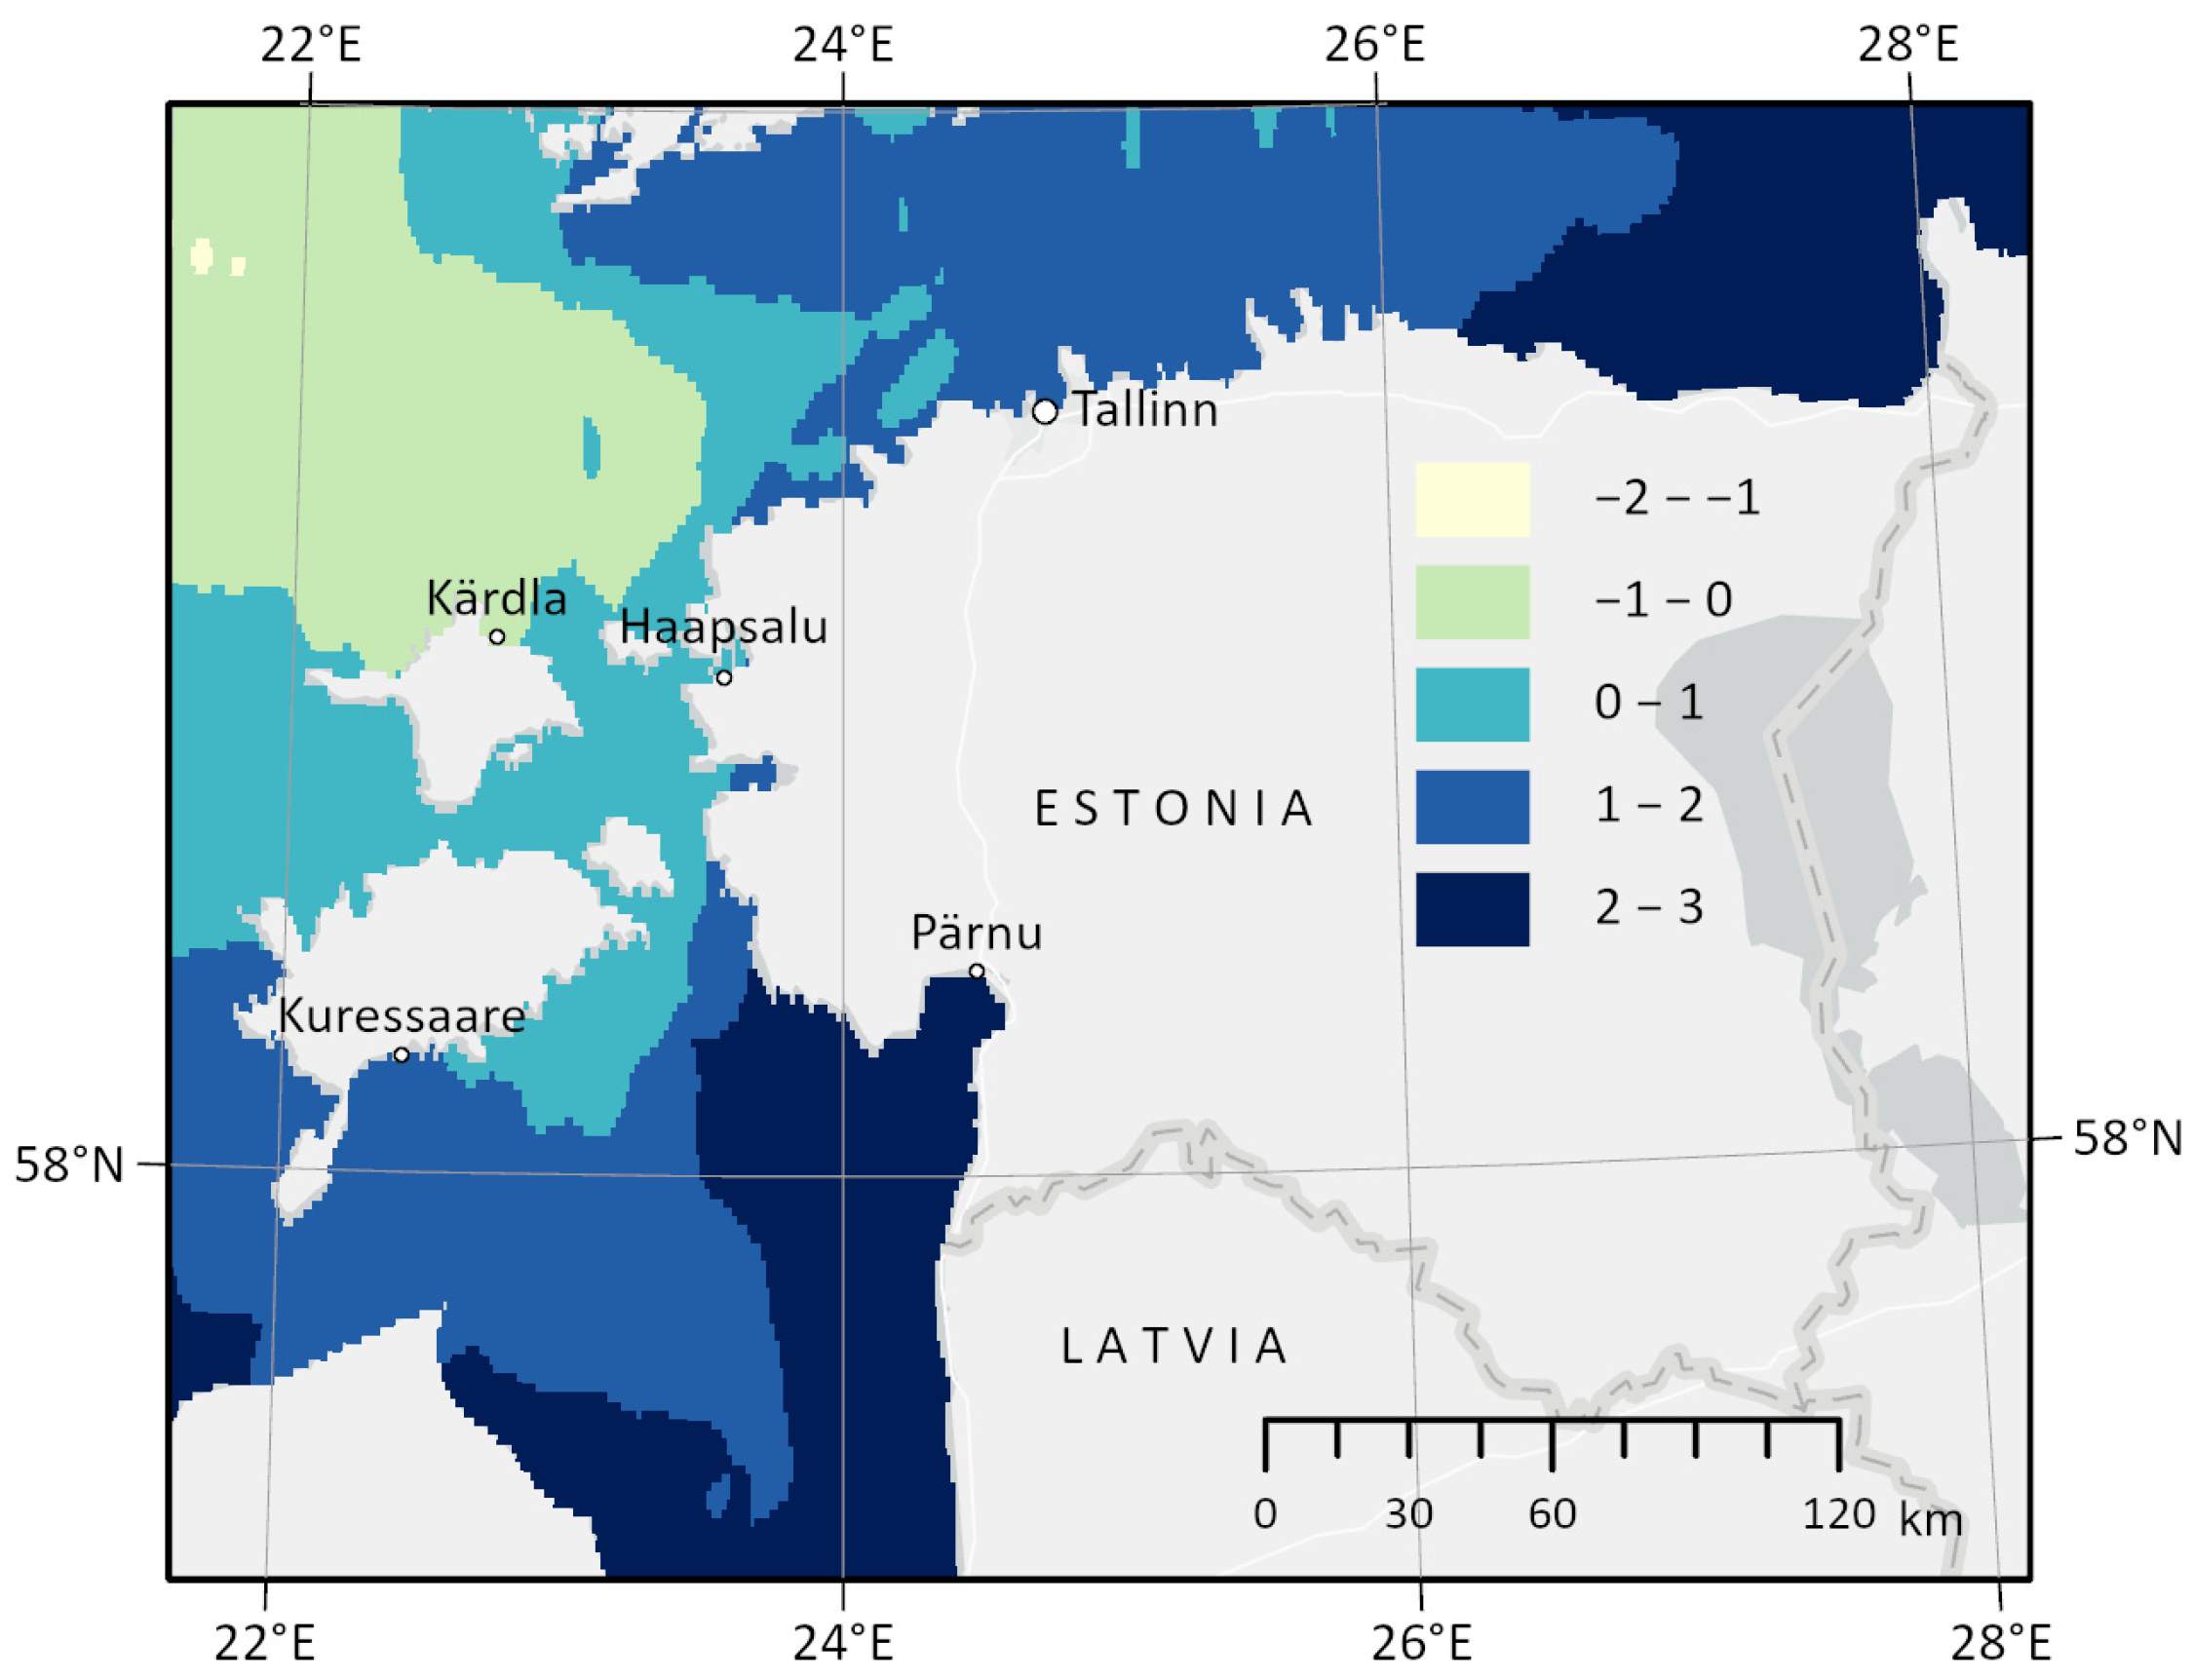
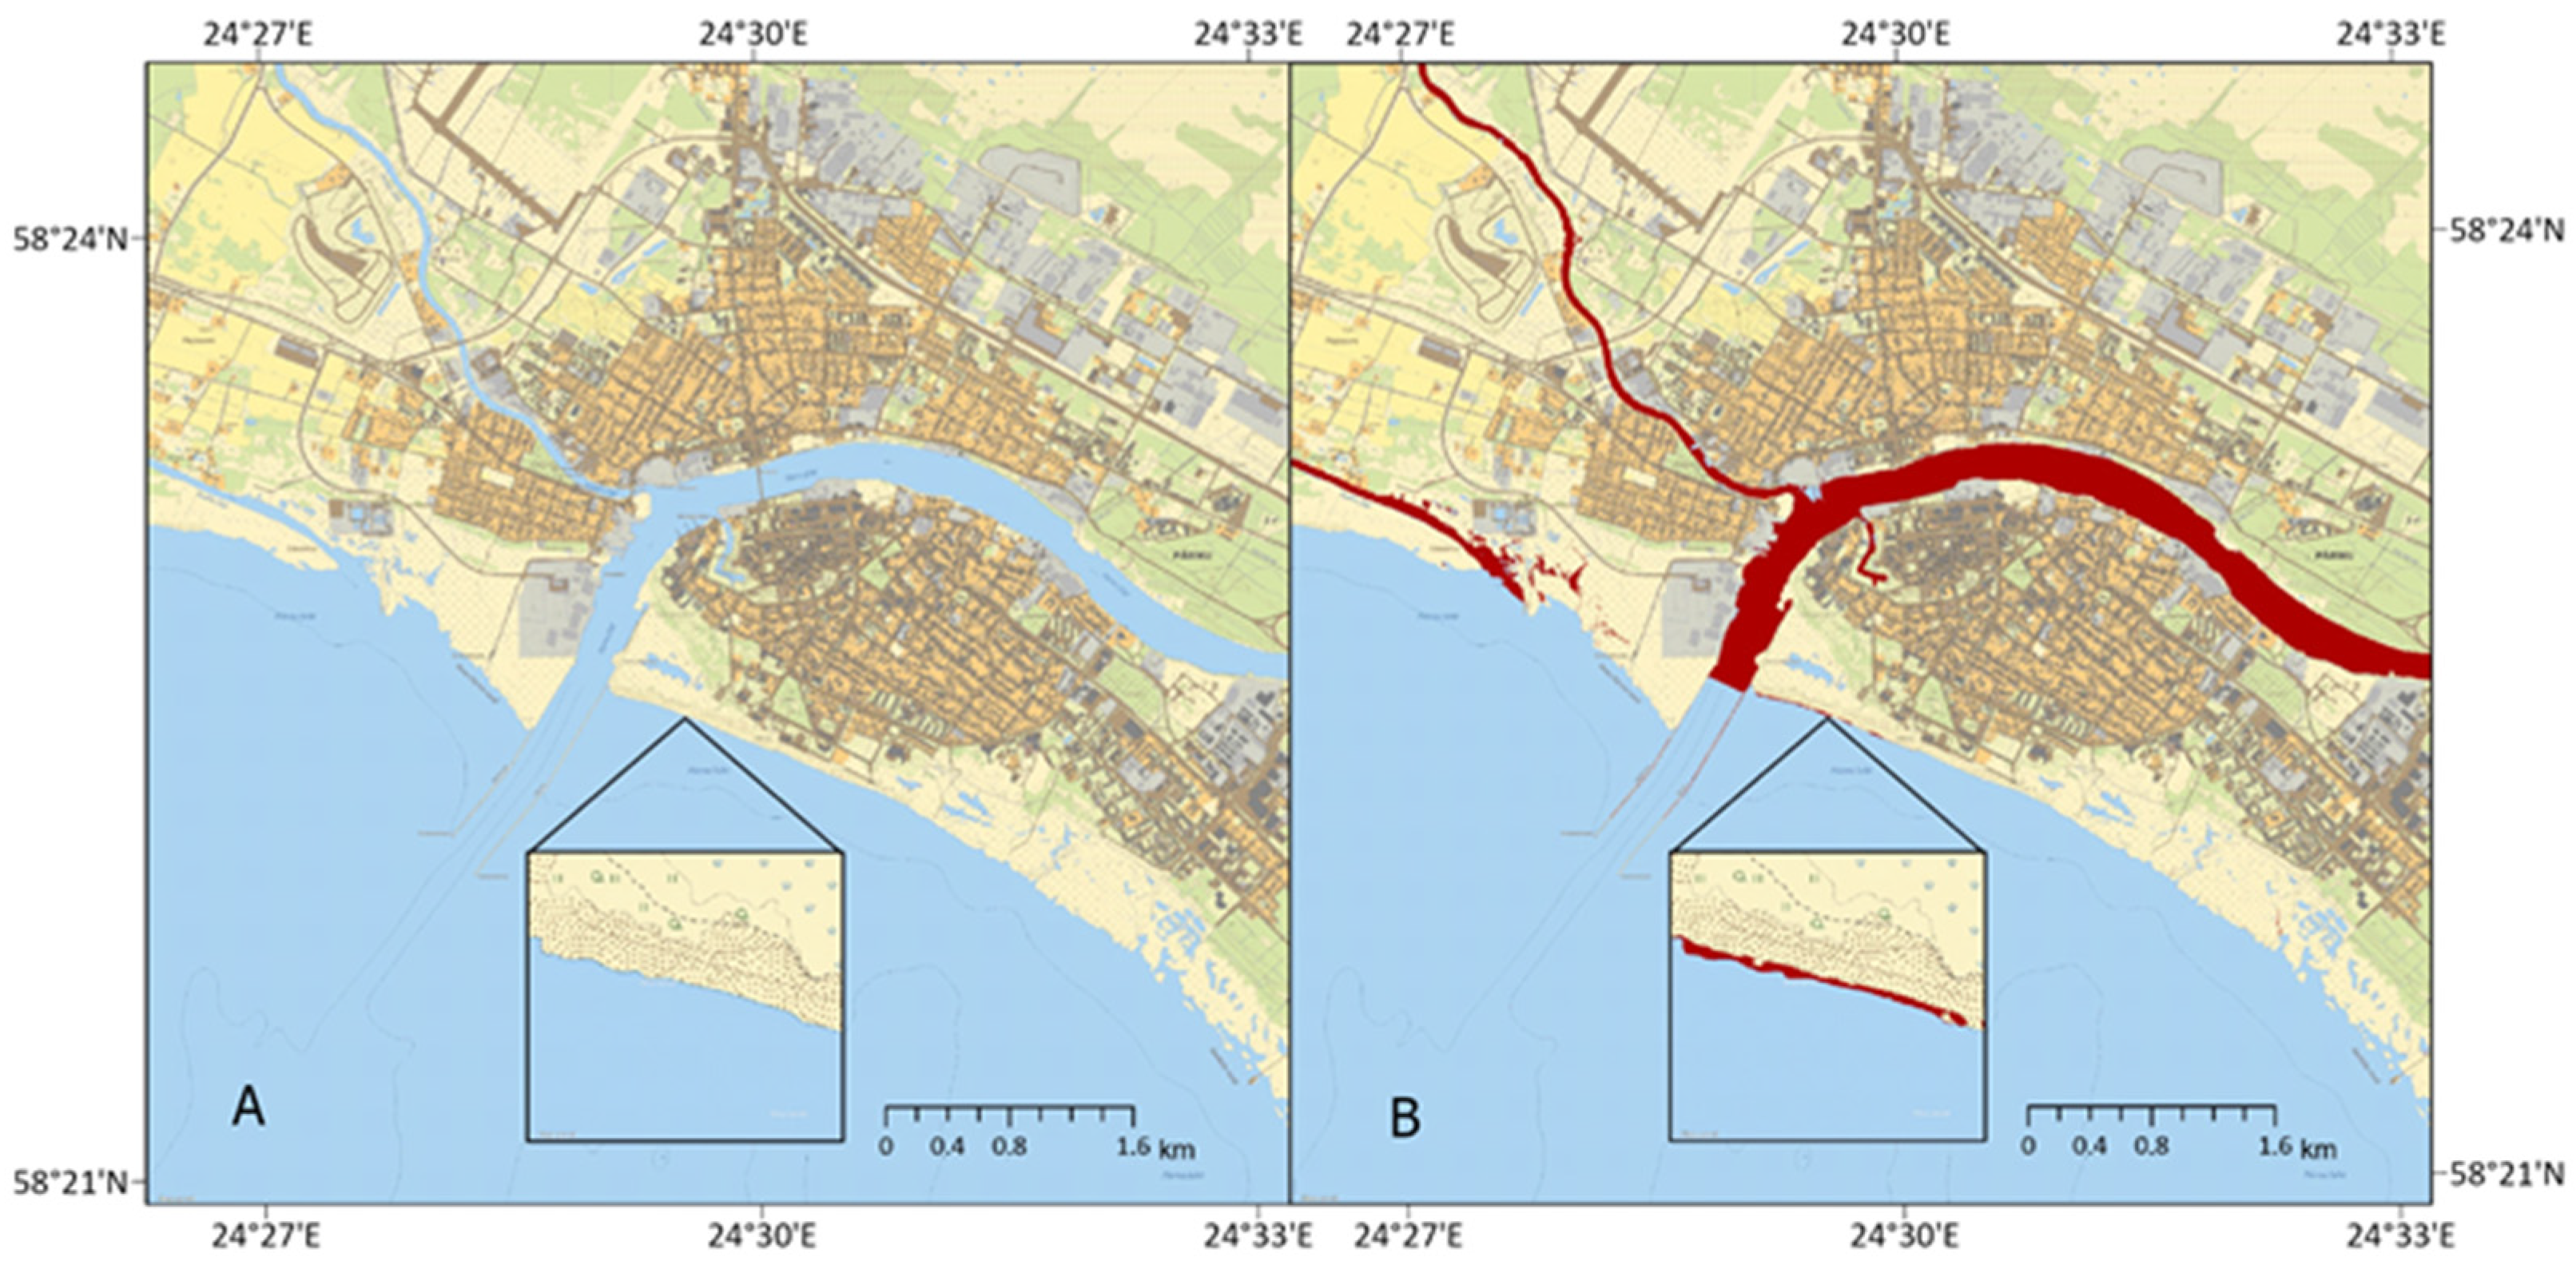
4.2. Coastal Area of Estonia
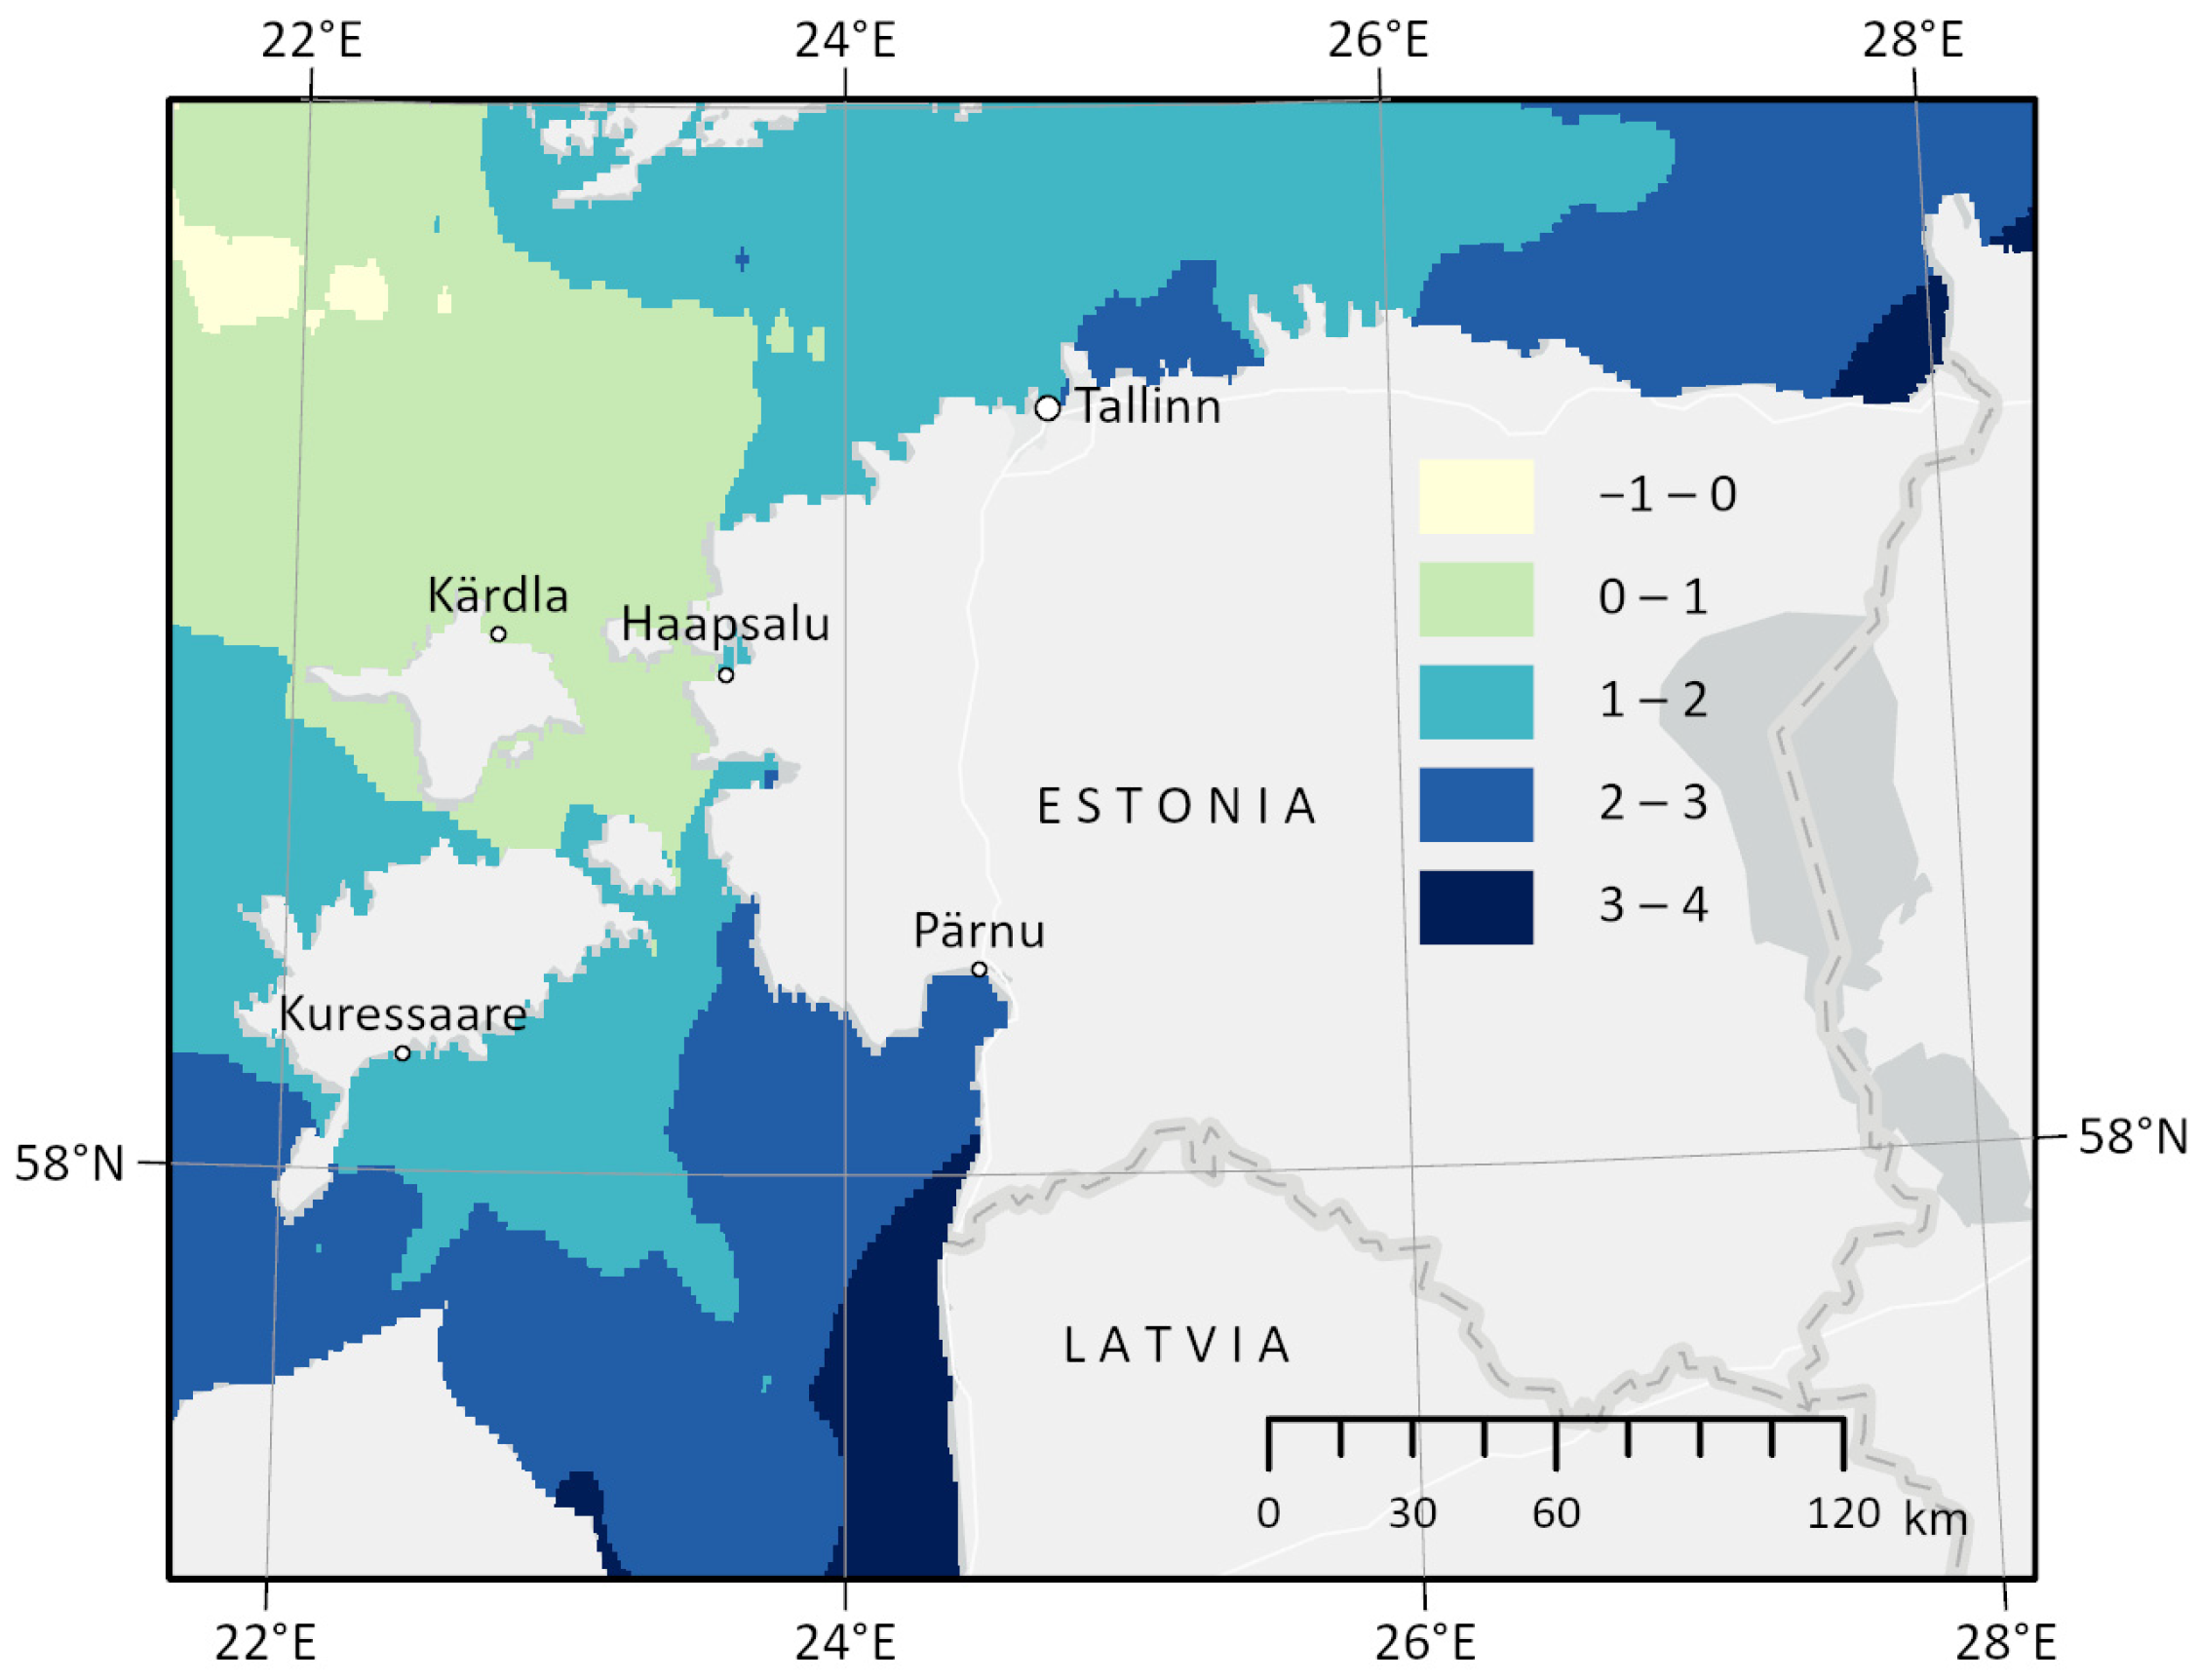
5. Sea Level Projections for the Year 2100
5.1. Sea Level Projections on the Coastal Area of Estonia
6. Conclusions
Author Contributions
Funding
Institutional Review Board Statement
Informed Consent Statement
Data Availability Statement
Acknowledgments
Conflicts of Interest
References
- Parker, B.B. Sea level as an indicator of climate and global change. Mar. Technol. Soc. J. 1992, 25. [Google Scholar]
- Nicholls, R.J.; Wong, P.P.; Burkett, V.R.; Codignotto, J.O.; Hay, J.E.; Mclean, R.F.; Ragoonaden, S.; Woodroffe, C.D. Coastal Systems and Low-Lying Areas. In Climate Change 2007: Impacts, Adaptation and Vulnerability; Parry, M.L., Canziani, O.F., Palutikof, J.P., Van Der Linden, P.J., Hanson, C.E., Eds.; Contribution of Working Group II to the Fourth Assessment Report of the Intergovernmental Panel on Climate Change; Cambridge University Press: Cambridge, UK, 2007; pp. 315–356. [Google Scholar]
- Gopalakrishnan, T.; Hasan, M.K.; Haque, A.T.M.S.; Jayasinghe, S.L.; Kumar, L. Sustainability of Coastal Agriculture under Climate Change. Sustainability 2019, 11, 7200. [Google Scholar] [CrossRef]
- Gornall, J.; Betts, R.; Burke, E.; Clark, R.; Camp, J.; Willett, K.; Wiltshire, A. Implications of climate change for agricultural productivity in the early twenty-first century. Philos. Trans. R. Soc. London Ser. B Biol. Sci. 2010, 365, 2973–2989. [Google Scholar] [CrossRef] [PubMed]
- Bin, O.; Poulter, B.; Dumas, C.F.; Whitehead, J.C. Measuring the Impact of Sea-Level Rise on Coastal Real Estate: A Hedonic Property Model Approach. J. Reg. Sci. 2011, 51, 751–767. [Google Scholar] [CrossRef]
- BACC I Author Team. Assessment of Climate Change for the Baltic Sea Basin, 1st ed.; Springer: Berlin/Heidelberg, Germany, 2008. [Google Scholar]
- BACC II Author Team. Second Assessment of Climate Change for the Baltic Sea Basin, 2nd ed.; Springer: Berlin/Heidelberg, Germany, 2015. [Google Scholar]
- Meier, H.E.M.; Broman, B.; Kjellstrom, E. Simulated sea level in past and future climates of the Baltic Sea. Clim. Res. 2004, 27, 59–75. [Google Scholar] [CrossRef]
- Kont, A.; Jaagus, J.; Aunap, R. Climate change scenarios and the effect of sea-level rise for Estonia. Glob. Planet. Chang. 2003, 36, 1–15. [Google Scholar] [CrossRef]
- Meier, H.E.M.; Broman, B.; Kallio, H.; Kjellström, E. Projections of future surface winds sea levels and wind waves in the late 21st century and their application for impact studies of flood prone areas in the Baltic Sea region. In Special Paper of Geological Survey of Finland; Schmidt-Tome, P., Ed.; Geological Survey of Finland: Helsinki, Finland, 2006; pp. 23–43. [Google Scholar]
- Orviku, K.; Jaagus, J.; Kont, A.; Ratas, U.; Rivis, R. Increasing activity of coastal processes associated with climate change in Estonia. J. Coast. Res. 2003, 19, 364–375. [Google Scholar]
- Hünicke, B.; Zorita, E.; Soomere, T.; Madsen, K.S.; Johansson, M.; Suursaar, Ü. Recent Change—Sea Level and Wind Waves. In Second Assessment of Climate Change for the Baltic Sea Basin; Regional Climate Studies; The BACC II Author Team, Ed.; Springer: Cham, Switzerland, 2015; pp. 155–180. [Google Scholar] [CrossRef]
- Suursaar, Ü.; Kullas, T. Influence of wind climate changes on the mean sea level and current regime in the coastal waters of west Estonia, Baltic Sea. Oceanologia 2006, 48, 361–383. [Google Scholar]
- Jaagus, J.; Suursaar, Ü. Long-term storminess and sea level variations on the Estonian coast of the Baltic Sea in relation to large-scale atmospheric circulation. Est. J. Earth Sci. 2013, 62, 73–92. [Google Scholar] [CrossRef]
- Bonaduce, A.; Staneva, J.; Behrens, A.; Bidlot, J.-R.; Wilcke, R.A.I. Wave Climate Change in the North Sea and Baltic Sea. J. Mar. Sci. Eng. 2019, 7, 166. [Google Scholar] [CrossRef]
- Myslenkov, S.A.; Medvedeva, A.Y.; Arkhipkin, V.; Markina, M.; Surkova, G.; Krylov, A.; Dobrolyubov, S.; Zilitinkevich, S.; Koltermann, K. Long-term statistics of storms in the Baltic, Barents and White Seas and their future climate projections. Geogr. Environ. Sustain. 2018, 11, 93–112. [Google Scholar] [CrossRef]
- Suursaar, U.; Kullas, T.; Otsmann, M.; Saaremae, I.; Kuik, J.; Merilain, M. Cyclone Gudrun in January 2005 and modelling its hydrodynamic consequences in the Estonian coastal waters. Boreal Environ. Res. 2006, 11, 143–159. [Google Scholar]
- BRGM: Regional Sea Level Change (IPCC AR5). Available online: https://sealevelrise.brgm.fr/sea-level-scenarios/#map=0/2/0.000000/0.000000/ar5scenario_allmodels_RCP85/2027/greendyn_m,greensmb_m,antdyn_m,antsmb_m,glac_m,gia_m,ocn_m,grw_m&map=1/2/0.000000/0.000000/greendyn_m,greensmb_m,antdyn_m,antsmb_m,glac_m,ocn_m,grw_m,gia_m/5,10,16,-5,18,32,5,1&map=2/4/-5.595840/46.046576/low/low-end-SLR-projections-RCP26/proj_median&map=3/1.4429434958487284/0.000000/0.000000/srocc-slr-85/2022/slr_md&tab=ar5 (accessed on 24 July 2022).
- Church, J.A.; Clark, P.U.; Cazenave, A.; Gregory, J.M.; Jevrejeva, S.; Levermann, A.; Merrifield, M.A.; Milne, G.A.; Nerem, R.S.; Nunn, P.D.; et al. Sea Level Change. In Climate Change 2013: The Physical Science Basis. Contribution of Working Group I to the Fifth Assessment Report of the Intergovernmental Panel on Climate Change; Stocker, T.F., Qin, D., Plattner, G.-K., Tignor, M., Allen, S.K., Boschung, J., Nauels, A., Xia, Y., Bex, V., Midgley, P.M., Eds.; Cambridge University Press: Cambridge, UK; New York, NY, USA, 2013; pp. 1137–1216. [Google Scholar]
- Climate Change Indicators: Sea Level. Available online: https://www.epa.gov/climate-indicators/climate-change-indicators-sea-level (accessed on 26 January 2023).
- Ekman, M. The Changing Level of the Baltic Sea During 300 Years: A Clue to Understanding the Earth; Summer Institute for Historical Geophysics: Åland Islands, Finland, 2009. [Google Scholar]
- Ekman, M. Post-glacial rebound and sea level phenomena with special reference to Fennoscandia and the Baltic Sea. Geod. Geophys. 1993, 115, 7–70. [Google Scholar]
- Lambeck, K.; Smither, C.; Johnston, P. Sea-level change, glacial rebound and mantle viscosity for Northern Europe. Geophys. J. Int. 1998, 134, 102–144. [Google Scholar] [CrossRef]
- Milne, G.A.; Davis, J.L.; Mitrovica, J.X.; Scherneck, H.G.; Johansson, J.M.; Vermeer, M.; Koivula, H. Space-geodetic constraints on glacial isostatic adjustment in Fennoscandia. Science 2001, 291, 2381–2385. [Google Scholar] [CrossRef]
- Steffen, H.; Kaufmann, G.; Wu, P. Three-dimensional finite-element modeling of the glacial isostatic adjustment in Fennoscandia. Earth Planet. Sci. Lett. 2006, 250, 358–375. [Google Scholar] [CrossRef]
- Zhao, S.; Lambeck, K.; Lidberg, M. Lithosphere thickness and mantle viscosity inverted from GPS-derived deformation rates in Fennoscandia. Geophys. J. Int. 2012, 190, 278–292. [Google Scholar] [CrossRef]
- Van der Wal, W.; Barnhoorn, A.; Stocchi, P.; Gradmann, S.; Wu, P.; Drury, M.R.; Vermeersen, B. Glacial isostatic adjustment model with composite 3-D Earth arheology for Fennoscandia. Geophys. J. Int. 2013, 194, 61–77. [Google Scholar] [CrossRef]
- Vestøl, O.; Ågren, J.; Steffen, H.; Kierulf, H.; Tarasov, L. NKG2016LU: A new land uplift model for Fennoscandia and the Baltic Region. J. Geod. 2019, 93, 1759–1779. [Google Scholar] [CrossRef]
- Pattyn, F.; Ritz, C.; Hanna, E.; Asay-Davis, X.; DeConto, R.; Durand, G.; Favier, L.; Fettweis, X.; Goelzer, H.; Golledge, N.R. The Greenland and Antarctic ice sheets under 1.5 °C global warming. Nat. Clim. Chang. 2018, 8, 1053–1061. [Google Scholar] [CrossRef]
- Wigley, T.; Raper, S. Thermal expansion of sea water associated with global warming. Nature 1987, 330, 127–131. [Google Scholar] [CrossRef]
- Oppenheimer, M.; Glavovic, B.C.; Hinkel, J.; van de Wal, R.; Magnan, A.K.; Abd-Elgawad, A.; Cai, R.; Cifuentes-Jara, M.; DeConto, R.M.; Ghosh, T.; et al. Sea Level Rise and Implications for Low-Lying Islands, Coasts and Communities. In IPCC Special Report on the Ocean and Cryosphere in a Changing Climate; Pörtner, H.-O., Roberts, D., Masson, C., Delmotte, V., Zhai, P., Tignor, M., Poloczanska, E., Mintenbeck, K., Alegría, A., Nicolai, M., et al., Eds.; Cambridge University Press: Cambridge, UK; New York, NY, USA, 2019; pp. 321–445. [Google Scholar] [CrossRef]
- Ablain, M.; Cazenave, A.; Larnicol, G.; Balmaseda, M.; Cipollini, P.; Faugère, Y.; Fernandes, M.J.; Henry, O.; Johannessen, J.A.; Knudsen, P.; et al. Improved sea level record over the satellite altimetry era (1993–2010) from the Climate Change Initiative project. Ocean Sci. 2015, 11, 67–82. [Google Scholar] [CrossRef]
- Cazenave, A.; Dieng, H.-B.; Meyssignac, B.; Schuckmann, K.; Decharme, B.; Berthier, E. The rate of sea-level rise. Nat. Clim. Chang. 2014, 4, 358–361. [Google Scholar] [CrossRef]
- Nerem, R.S.; Beckley, B.D.; Fasullo, J.T.; Hamlington, B.D.; Masters, D.; Mitchum, G.T. Climate-change-driven accelerated sea-level rise detected in the altimeter era. Proc. Natl. Acad. Sci. USA 2018, 115, 2022–2025. [Google Scholar] [CrossRef] [PubMed]
- World Meteorological Organization. State of the Global Climate 2022; WMO: Geneva, Switzerland, 2023. [Google Scholar]
- Ekman, M. The worlds longest continued series of sea level observations. Pure Appl. Geophys. 1988, 127, 73–77. [Google Scholar] [CrossRef]
- Bogdanov, V.I.; Medvedev, M.Y.; Solodov, V.A.; Trapeznikov, Y.A.; Troshkov, G.A.; Trubitsina, A.A. Mean monthly series of sea level observations (1777–1993) at the Kronstadt gauge. In Reports of the Finnish Geodetic Institute; Finnish Geospatial Research Institute: Kirkkonummi, Finland, 2000; pp. 1–34. [Google Scholar]
- Pugh, D. Tides, Surges and Mean Sea Level: A Handbook for Engineers and Scientists; John Wiley & Sons: Chichester, UK, 1987; 472p. [Google Scholar]
- Boiten, W. Hydrometry: IHE Delft Lecture Note Series, 3rd ed.; CRC Press: Boca Raton, FL, USA, 2008. [Google Scholar] [CrossRef]
- Intergovernmental Oceanographic Commission. Manual on Sea Level Measurement and Interpretation; Volume IV—An Update to 2006; UNESCO: Paris, France, 2006; 87p. [Google Scholar] [CrossRef]
- Copernicus Marine Environment Monitoring Service In Situ Thematic Assembly Centre. Available online: http://www.marineinsitu.eu/dashboard/ (accessed on 15 January 2023).
- Permanent Service for Mean Sea Level (PSMSL). Available online: https://www.psmsl.org/ (accessed on 20 January 2023).
- Madsen, K.S.; Hoyer, J.L.; Suursaar, U.; She, J.; Knudsen, P. Sea Level Trends and Variability of the Baltic Sea from 2D Statistical Reconstruction and Altimetry. Front. Earth Sci. 2019, 7, 243. [Google Scholar] [CrossRef]
- Global Extreme Sea Level Analysis Initiative (GESLA). Available online: https://www.gesla.org/ (accessed on 20 January 2023).
- The Flanders Marine Institute (VIZ). Available online: https://www.vliz.be/en (accessed on 20 January 2023).
- The University of Hawaii-Sea-Level Central (UHSLC). Available online: https://uhslc.soest.hawaii.edu/ (accessed on 20 January 2023).
- Nerem, S.R.; Chambers, P.D.; Choe, C.; Mitchum, T.G. Estimating Mean Sea Level Change from the TOPEX and Jason Altimeter Missions. Mar. Geod. 2010, 33, 435–446. [Google Scholar] [CrossRef]
- Fu, L.L.; Cazenave, A. Satellite Altimetry and Earth Sciences: A Handbook of Techniques and Applications; Elsevier International Geophysics Series; Elsevier: Amsterdam, The Netherlands, 2001; pp. 1–463. [Google Scholar]
- Legeais, J.-F.; Ablain, M.; Zawadzki, L.; Zuo, H.; Johannessen, J.A.; Scharffenberg, M.G.; Fenoglio-Marc, L.; Fernandes, M.J.; Andersen, O.B.; Rudenko, S.; et al. An improved and homogeneous altimeter sea level record from the ESA Climate Change Initiative. Earth Syst. Sci. Data 2018, 10, 281–301. [Google Scholar] [CrossRef]
- Liibusk, A.; Kall, T.; Rikka, S.; Uiboupin, R.; Suursaar, Ü.; Tseng, K.-H. Validation of Copernicus Sea Level Altimetry Products in the Baltic Sea and Estonian Lakes. Remote Sens. 2020, 12, 4062. [Google Scholar] [CrossRef]
- Liebsch, G.; Novotny, K.; Dietrich, R.; Shum, C.K. Comparison of Multimission Altimetric Sea-Surface Heights with Tide Gauge Observations in the Southern Baltic Sea. Mar. Geod. 2002, 25, 213–234. [Google Scholar] [CrossRef]
- Richter, A.; Groh, A.; Dietrich, R. Geodetic observation of sea-level change and crustal deformation in the Baltic Sea region. Phys. Chem. Earth 2012, 53, 43–53. [Google Scholar] [CrossRef]
- Ekman, M. Climate changes d etected through the world’s longest sea level series. Glob. Planet. Chang. 1999, 21, 215–224. [Google Scholar] [CrossRef]
- Suursaar, Ü.; Sooäär, J. Decadal variations in mean and extreme sea level values along the Estonian coast of the Baltic Sea. Tellus A Dyn. Meteorol. Oceanogr. 2007, 59, 249–260. [Google Scholar] [CrossRef]
- Nordman, M.; Poutanen, M.; Koivula, H. Tide gauge monitoring using GPS. In Dynamic Planet; Springer: Berlin/Heidelberg, Germany, 2007; pp. 75–79. [Google Scholar] [CrossRef]
- Dailidiene, I.; Davuliene, L.; Tilickis, B.; Stankevičius, A.; Myrberg, K. Sea level variability at the Lithuanian coast of the Baltic Sea. Boreal Environ. Res. 2006, 11, 109–121. [Google Scholar]
- Lyszkowicz, A.; Bernatowicz, A. Geocentric Changes of the Mean Sea Level of the Baltic Sea from Altimeter and Tide Gauge Data. In Proceedings of the 2018 Baltic Geodetic Congress (BGC Geomatics), Olsztyn, Poland, 21–23 June 2018; pp. 202–206. [Google Scholar] [CrossRef]
- Vallner, L.; Sildvee, H.; Torim, A. Recent crustal movements in Estonia. J. Geodyn. 1988, 9, 215–223. [Google Scholar] [CrossRef]
- Church, J.A.; White, N.J. A 20th century acceleration in global sea-level rise. Geophys. Res. Lett. 2006, 33, L10602. [Google Scholar] [CrossRef]
- Stramska, M.; Chudziak, N. Recent multiyear trends in the Baltic Sea level. Oceanologia 2013, 55, 319–337. [Google Scholar] [CrossRef]
- Pajak, K.; Błaszczak-Bąk, W. Baltic Sea level changes from satellite altimetry data based on the OptD metod. Acta Geodyn. Geomater. 2019, 16, 235–244. [Google Scholar] [CrossRef]
- Passaro, M.; Müller, F.L.; Oelsmann, J.; Rautiainen, L.; Dettmering, D.; Hart-Davis, M.G.; Abulaitijiang, A.; Andersen, O.B.; Høyer, J.L.; Madsen, K.S.; et al. Absolute Baltic Sea Level Trends in the Satellite Altimetry Era: A Revisit. Front. Mar. Sci. 2021, 8, 647607. [Google Scholar] [CrossRef]
- Novotny, K.; Liebsch, G.; Lehmann, A.; Dietrich, R. Variability of Sea Surface Heights in the Baltic Sea: An Intercomparison of Observations and Model Simulations. Mar. Geod. 2006, 29, 113–134. [Google Scholar] [CrossRef]
- Madsen, K.; Høyer, J.; Tscherning, C.C. Near-coastal satellite altimetry: Sea surface height variability in the North Sea--Baltic Sea area. Geophys. Res. Lett. 2007, 34, L14601. [Google Scholar] [CrossRef]
- Sølvsteen, C.; Hansen, C. Validation of the operational wave models WAVEWATCH-III and Mike21-OSW against satellite altimetry and coastal buoys. Royal Danish Administr. Navig. Hydrogr. 2006, 53. [Google Scholar]
- Hünicke, B.; Zorita, E. Decadal sea level changes in the Baltic Sea. In Proceedings of the Baltic Sea Science Congress, St. Petersburg, Russia, 22–26 August 2011. [Google Scholar]
- Madsen, K.S. Recent and Future Climatic Changes of the North Sea and the Baltic Sea—Temperature, Salinity, and Sea Level; LAMBERT Academic Publishing: Saarbrücken, Germany, 2011. [Google Scholar]
- Funkquist, L.; Kleine, E. HIROMB: An Introduction to HIROMB, an Operational Baroclinic Model for the Baltic Sea; Report Oceanography; Swedish Meteorological and Hydrological Institute: Norrkoping, Sweden, 2007; Volume 37. [Google Scholar]
- SWAN. Available online: https://www.tudelft.nl/citg/over-faculteit/afdelingen/hydraulic-engineering/sections/environmental-fluid-mechanics/research/swan (accessed on 12 July 2023).
- Savchuk, O.; Gustafsson, B.; Muller-Karulis, B. BALTSEM—A Marine Model for the Decision Support within the Baltic Sea Region; Baltic Nest Institute Technical Report 7; Baltic Nest Institute: Stockholm, Sweden, 2012. [Google Scholar]
- Baltic Sea Multi-Mission Sea Level Products. Available online: https://balticseal.eu/data-access/ (accessed on 8 July 2022).
- Rautiainen, L.; Särkkä, J.; Tuomi, L.; Müller, F.; Passaro, M. Baltic+ SEAL: Validation Report, Version 2.2; Technical Report Delivered under the Baltic+ SEAL Project; Technische Universität München: München, Germany, 2020. [Google Scholar] [CrossRef]
- Steffen, H.; Wu, P. Glacial isostatic adjustment in Fennoscandia-A review of data and modeling. J. Geodyn. 2011, 52, 169–204. [Google Scholar] [CrossRef]
- Zhelnin, G. On the recent movements of the Earth’s surface in the Estonian SSR. Ann. Acad. Sci. Fenn. 1966, 90, 489–493. [Google Scholar]
- Kall, T.; Oja, T.; Tänavsuu, K. Post-glacial land uplift in Estonia based on four precise levelings. Tectonophysics 2014, 610, 25–38. [Google Scholar] [CrossRef]
- Jevrejeva, S.; Rüdja, A.; Mäkinen, J. Post-glacial rebound in Fennoscandia: New results from Estonian tide gauges. In Gravity Geoid and Geodynamics 2000; Sideris, M.G., Ed.; Springer: Berlin/Heidelberg, Germany, 2002; pp. 193–198. [Google Scholar]
- Suursaar, Ü.; Kall, T. Decomposition of relative sea level variations at tide gauges using results from four estonian precise levelings and uplift models. IEEE J. Sel. Top. Appl. Earth Obs. Remote Sens. 2018, 11, 1966–1974. [Google Scholar] [CrossRef]
- Kall, T.; Oja, T.; Kollo, K.; Liibusk, A. The Noise Properties and Velocities from a Time-Series of Estonian Permanent GNSS Stations. Geosciences 2019, 9, 233. [Google Scholar] [CrossRef]
- Kall, T.; Oja, T.; Kruusla, K.; Liibusk, A. New 3D velocity model of Estonia from GNSS measurements. Est. J. Earth Sci. 2021, 70, 107–125. [Google Scholar] [CrossRef]
- Grinsted, A.; Jevrejeva, S.; Riva, R.; Dahl-Jensen, D. Sea level rise projections for Northern Europe under RCP8.5. Clim. Res. 2015, 64, 15–23. [Google Scholar] [CrossRef]
- Listra, E.; Talviste, P. Geotehniline Kontroll Nõrkade Savipinnaste Levialal. I Köide. Pinnaseomadused ja Vajumisvaatluste Analüüs Pärnus [Geotechnical Control in the Areas of Weak Surfaces of Clay and Till. Vol. 1. Subsidence Observations in Pärnu]; Report from the Database of Estonian Geological Engineering, Thematical Research; National Institute of Building Research: Tallinn, Estonia, 1988; p. 219. (In Estonian) [Google Scholar]
- Vilo, A. Ehitusgeoloogia; University of Tartu: Tartu, Estonia, 1986; 110p. [Google Scholar]
- Liblik, T.; Listra, H.; Talviste, P. Uued Vundeerimissuunad Pärnus [New Foundation Directions in Pärnu]; Estonian Construction Geology Database Report No 26633; National Institute of Construction Research: Tallinn, Estonia, 1989. [Google Scholar]
- Taaleš, T. Audru GNSS Püsijaama Stabiilsuse Kontrollimine InSAR Kaugseire Põhjal Määratud Maapinna Deformatsioonidega [Checking the Stability of Audru GNSS Base Station with Ground Deformations Determined by InSAR Remote Sensing]. Master’s Thesis, Estonian University of Life Sciences, Tartu, Estonia, 2021. [Google Scholar]


| Data | Area | Time Span (yr) | Trend (mm/yr) | Author(s) |
|---|---|---|---|---|
| 1 tide gauge | Stockholm, Sweden | 1892–1991 | 1.0 | Ekman [53] |
| 4 tide gauges | Estonia | 1842–2005 | 1.5–2.7 1 | Suursaar, Sooäär [54] |
| 6 tide gauges | Finland | 1883–2001 | 1.6 ± 1.0 2 | Nordman et al. [55] |
| 5 tide gauges 1 tide gauge | Lithuania | 1898–2002 1961–2002 | 1.3 3.0 | Dailidienė et al. [56] |
| 13 tide gauges | Germany | 1908–2007 | 1.3 3 | Richter et al. [52] |
| 8 tide gauges | Baltic Sea | 1960–2017 | 3.09 4 | Łyszkowicz, Bernatowicz [57] |
| 56 tide gauges | Baltic Sea | 1900–1999 | 1.3 ± 0.3 | Madsen et al. [43] |
| Data | Time Span (yr) | Trend (mm/yr) | References |
|---|---|---|---|
| TOPEX/Poseidon, Jason-1, Jason-2 | 1993–2011 | 3.3 | Stramska, Chudziak [60] |
| Jason-3, Sentinel-3A, HY-2a, SARAL/AltiKa, CryoSat-2, Jason-2, Jason-1, TOPEX-Poseidon, Envisat, GFO, ERS-1, ERS-2 | 1993–2017 | 3.97 | Łyszkowicz, Bernatowicz [57] |
| TOPEX/Poseidon, Jason-1 & 2, ERS-1, ERS-2, Envisat, GFO, SARAL/AltiKa, CryoSat-2 | 1993–2015 1993–2014 (reconstruction) | 4.0 ± 1.4 3.4 ± 0.7 | Madsen et al. [43] |
| TOPEX/Poseidon, Jason-1, Jason-2, ERS-1, ERS-2, Envisat | 1993–2017 | 4.1 ± 0.2 | Pajak, Blaszczak-Bak [61] |
| TOPEX-Poseidon, Jason-1, Jason-2, ERS-2, Envisat, SARAL, Cryosat-2, Sentinel-3A, Sentinel-3B | 1995–2019 | 2.0 to 6.0 (avg. 4.0) | Passaro et al. [62] |
| Projection | Relative Sea Level Rise by 2100 |
|---|---|
| Baltic Sea | |
| RCP2.6 | −0.6 to 0.3 |
| RCP4.5 | −0.5 to 0.4 |
| RCP8.5 | −0.3 to 0.7 |
| Estonia | |
| RCP2.6 | −0.2 to 0.2 |
| RCP4.5 | −0.1 to 0.3 |
| RCP8.5 | 0.2 to 0.4 |
Disclaimer/Publisher’s Note: The statements, opinions and data contained in all publications are solely those of the individual author(s) and contributor(s) and not of MDPI and/or the editor(s). MDPI and/or the editor(s) disclaim responsibility for any injury to people or property resulting from any ideas, methods, instructions or products referred to in the content. |
© 2023 by the authors. Licensee MDPI, Basel, Switzerland. This article is an open access article distributed under the terms and conditions of the Creative Commons Attribution (CC BY) license (https://creativecommons.org/licenses/by/4.0/).
Share and Cite
Kapsi, I.; Kall, T.; Liibusk, A. Sea Level Rise and Future Projections in the Baltic Sea. J. Mar. Sci. Eng. 2023, 11, 1514. https://doi.org/10.3390/jmse11081514
Kapsi I, Kall T, Liibusk A. Sea Level Rise and Future Projections in the Baltic Sea. Journal of Marine Science and Engineering. 2023; 11(8):1514. https://doi.org/10.3390/jmse11081514
Chicago/Turabian StyleKapsi, Ivar, Tarmo Kall, and Aive Liibusk. 2023. "Sea Level Rise and Future Projections in the Baltic Sea" Journal of Marine Science and Engineering 11, no. 8: 1514. https://doi.org/10.3390/jmse11081514
APA StyleKapsi, I., Kall, T., & Liibusk, A. (2023). Sea Level Rise and Future Projections in the Baltic Sea. Journal of Marine Science and Engineering, 11(8), 1514. https://doi.org/10.3390/jmse11081514