Article

Probabilistic Modeling of Maritime Accident Scenarios Leveraging Bayesian Network Techniques

1
School of Management, Shenzhen Polytechnic, Shenzhen 518055, China
2
College of Transport and Communications, Shanghai Maritime University, Shanghai 201306, China
3
Naval Architecture and Shipping College, Guangdong Ocean University, Zhanjiang 524088, China
*
Authors to whom correspondence should be addressed.
J. Mar. Sci. Eng. 2023, 11(8), 1513; https://doi.org/10.3390/jmse11081513
Submission received: 18 June 2023 / Revised: 14 July 2023 / Accepted: 28 July 2023 / Published: 29 July 2023

Abstract

:
This paper introduces a scenario evolution model for maritime accidents, wherein Bayesian networks (BNs) were employed to predict the most probable causes of distinct types of maritime incidents. The BN nodes encompass factors such as accident type, life loss contingency, accident severity, quarter and time period of the accident, and type and gross tonnage of the involved ships. An analysis of 5660 global maritime accidents spanning the years 2005 to 2020 was conducted. Using Netica software, a tree augmented network (TAN) model was constructed, thus accounting for interdependencies among risk-influencing factors. To confirm these results, a validation process involving sensitivity analysis and historical accident records was performed. Following this, both forward causal inference and reverse diagnostic inference were carried out on each node variable to scrutinize the accident development trend and evolution process under preset conditions. The findings suggest that the model was competent in effectively predicting the likelihood of various accident scenarios under specific conditions, as well as extrapolating accident consequences. Forward causal reasoning unveiled that general cargo ships with a gross tonnage of 1–18,500 t were most prone to experiencing collision and stranding/grounding accidents in the first quarter. Reverse diagnostic reasoning indicated that, in the early morning hours, container ships, general cargo ships, and chemical ships with a tonnage of 1–18,500 t were less likely to involve life loss in the event of collision accidents.

1. Introduction

Intricately variable and multifaceted climatic conditions, endemic to an expansive marine environment, have perpetually underscored maritime transport as a vocation of considerable risk. Incidents disrupting maritime transit, which encompass a spectrum of occurrences from vessel collisions to groundings, and from onboard fires to devastating explosions, bear the hallmark of low frequency yet are marked by their profoundly destructive aftermath [1]. Upon the unfortunate manifestation of a maritime accident, a tsunami of undesirable outcomes typically ensues, including, notably, substantial financial loss, a tragic toll of human casualties, or even the insidious onset of extensive environmental pollution [2]. As an imperative and fundamental step toward mitigating the inherent perils of maritime navigation, a comprehensive exploration into the multifactorial etiology of these traffic mishaps proves indispensable [3,4,5]. Moreover, it becomes increasingly pivotal to meticulously undertake a dynamic risk evaluation, focusing on the myriad facets of maritime operations [6,7,8]. Complementing this, the development and implementation of robust predictive models, which can potentially forecast the calamitous conjunction of human fatality and its probability in the event of an accident, could contribute significantly toward minimizing future maritime disasters [9,10,11,12].
Over the years, an impressive corpus of scholarly efforts has been devoted to enhancing our understanding of maritime traffic safety, including explorations into accident causation analysis [3,4,5,13], accident consequence assessment [14,15,16], and accident loss computation [17,18]. These endeavors have given rise to an array of innovative evaluation methodologies. In one notable study, Hu et al. [3] skillfully harnessed the capabilities of the Human Failure Analysis and Classification System (HFACS) in tandem with structural equation modeling (SEM) to disentangle an intricate web of causal factors underpinning marine traffic accidents (MTAs). Chou et al. [4], in a synergistic integration of technologies, amalgamated the Automatic Identification System, Geographic Information System, and an electronic chart (e-chart) to scrutinize the interplay between environmental factors, geographical locations, and the common causes of marine mishaps. By overlaying vessel traffic flows, accident sites, and environmental data on a shared e-chart, their research unfurled valuable insights into port authorities when streamlining ship traffic flow and curtailing the prevalence of marine accidents in the vicinity of ports. Meanwhile, Xue et al. [5] proffered a comprehensive analytical framework for investigating the peculiarities and causative factors of ship accidents, utilizing a decade’s worth of historical data that were harvested from the capriciously fluctuating backwater expanse of the Three Gorges Reservoir region. Their extensive work yielded a thorough summary and visualization of vessel accident categories and severity, involved vessel types, spatial–temporal distribution characteristics, and vessel accident loss, along with the underlying causes and lessons gleaned from pertinent accidents that were achieved through a rigorous statistical and comparative analysis of historical data. Elsewhere, Fu et al. [13] engineered a bivariate probit model to delve into an array of 311 Arctic ship accidents spanning from 1998 to 2017. Their study brought to the fore influential factors such as gross tonnage, ship type, ship age, accident type, accident year, accident location, wind, and sea ice as the primary contributors to accident severity. Simultaneously, their research unveiled an intriguing negative correlation between serious accidents and those resulting in pollution. As research on maritime traffic accidents has illuminated a gamut of potential causative factors, the increased granularity of available accident data has spurred a growing number of scholars to concentrate on the ramifications of these mishaps, specifically on the evaluation of accident consequences and loss computation. Such undertakings have risen to prominence, particularly in the eyes of managers concerned with incidents that yield significant economic damage and human casualties. For instance, Chen et al. [15] presented an evidence-based Fuzzy Bayesian network methodology to erect probabilistic models of marine accidents, thereby enabling the appraisal of accidents that were likely to spawn severe consequences. In a similar vein, Ventikos and Giannopoulos [16] introduced a criterion to assess the risks and repercussions within the maritime transport sector from a societal perspective, thereby formulating a novel framework for the marine risk assessment, which facilitated a comparison of disparate accident scales and characteristics, while accurately mirroring the risk threshold society was prepared to tolerate. Chen et al. [17] pioneered an enhanced entropy weight-TOPSIS model to furnish a holistic analysis and appraisal of the marine total loss incidents, encompassing a global scope from 1998 to 2018. These studies, though highly impactful, predominantly undertake analyses either from the standpoint of accident causation or the evaluation of accident consequences. Rarely do these scholarly pursuits straddle both domains in a bidirectional inquiry.
In the realm of accident scenario analysis, methodological constructs like event tree analysis and accident tree analysis are frequently utilized in the assembly of traffic accident scenario evolution models [19,20,21,22,23]. However, the breadth of most accident cause analyses often overshadows their specificity, impeding their ability to yield targeted recommendations to forestall analogous events [24]. To bridge this gap, scholars could employ a Bayesian network-based maritime accident scenario modeling approach. Bayesian networks stand as a form of a probabilistic graphical model, which is deftly equipped to encapsulate and deliberate over uncertain knowledge and nebulous relationships among variables. This versatile modeling approach, designed to embrace the labyrinthine and dynamic character of maritime activities, excels at discerning the contributory factors that precipitate maritime accidents [3,5]. Employing a synergistic blend of historical data and expert acumen, this model could approximate both the likelihood of an accident’s occurrence and the potential fallout arising from a range of accident scenarios [14,16]. Bayesian networks (BN) find broad application in confronting uncertain multi-factor causality inference, accident causation analysis, and scenario prediction, making them invaluable tools in road and waterway transportation sectors [25,26,27,28,29,30,31,32]. Various scholars have employed these tools in diverse studies: Zou and Yue [33] melded the probabilistic risk analysis with the BN theory to explore the origins of road traffic accidents; Yuan et al. [34] constructed a scenario-derived prediction model for the repercussions of fire accidents in oil and gas storage and transportation emergency processes, leveraging a defuzzification method and a dynamic BN model. Other researchers, such as Zhao et al. [35], have used the ISM-BN model to assess the impact of varying factors on maritime safety, successfully pinpointing the critical risk components for different accident types. Afenyo et al. [36] utilized a BN model to sketch an Arctic shipping accident scenario and illuminated the crucial causative elements of a potential accident scenario. Similarly, Jiang et al. [37] proposed a Bayesian network-based risk analysis strategy to evaluate maritime accidents along the 21st-century Maritime Silk Road (MSR), identifying the principal influencing factors that could bolster accident prevention measures and ensure maritime transportation safety and sustainability. In a more focused study, Si et al. [38] employed a BN structure learning algorithm that paired the kernel density estimation with a model weighted average strategy to dissect the causative elements of container ship collisions, basing their analysis on a limited set of container ship collision sample data. Other studies like Fan et al. [39] and Hänninen et al. [40] proposed similar Bayesian network-based risk analysis approaches to understand the contributing factors to maritime transport accidents, with the latter focusing more on maritime safety management and its relationship with maritime traffic safety. Despite these successes, these aforementioned studies suffer from a triad of limitations: (1) a paucity of sample data from maritime accidents, (2) a labor-intensive and time-consuming data collection process, and (3) the inherent difficulty of obtaining accident loss records. Summarily, while waterway transportation research has honed its focus on accident causality reasoning and accident causation analysis, there remains a conspicuous void in the research landscape pertaining to accident scenario modeling.
In light of this, this paper aimed to build a BN model for the evolution of maritime accident scenarios using global maritime accident data. These data derived from the Global Integrated Shipping Information System (GISIS) and established by the International Maritime Organization (IMO) have been widely used by scholars in maritime accident studies [41,42,43,44,45,46,47]. The novelty of this research lies in the use of a BN-based approach to model maritime traffic accident scenarios. This is a unique method of analyzing the causes of maritime traffic accidents through performing dynamic risk assessments on shipping activities and predicting the probability of accident occurrence and its consequences. This innovative approach enables the identification and simulation of influencing factors across a range of accident scenarios, providing an intricate understanding of the complexities associated with maritime traffic accidents.
This study provides comprehensive analysis and valuable insights into 5660 global maritime accidents from 2005 to 2020. The accident data were well sampled, non-manually collected, open, and, more importantly, provided a high number of data fields in relation to accident losses. This made it possible to compensate for data limitations that have existed in previous studies. This study had two main contributions. First, a tree augmented network (TAN) model was developed to construct BN and train the data, and a data-driven BN-based method was proposed that could effectively predict the probability and consequences of accidents. Second, the proposed model was able to predict the causal factors that were most likely to lead to specific accident consequences; this could help maritime stakeholders implement effective preventive measures to improve maritime transportation safety.
The rest of this article is structured as follows. Section 2 briefly introduces the structure and construction method of BN and further introduces the method TAN driven by the data. Section 3 builds the TAN model based on the data of 5660 maritime accidents and carries out sensitivity analysis and simulation verification on the built model. Section 4 uses the two-way reasoning ability of the TAN model to predict the accident chain and analyze the accident causes. Finally, the fifth part summarizes the full text.

2. BN Structure Learning—TAN

BN is a directed acyclic graph (DAG) that is composed of nodes and directed edges and is widely employed to illustrate the interdependence and strength of associations between variables. As shown in Figure 1, in DAG S = X , E , X denotes the set of nodes in the network, X i X denotes the random variable in the domain of the definition of this restriction, and E denotes a set of directed edges in this network. The network represents the interrelationship between variables through vectorial arcs, with the intensity of each association specified by a table of conditional probabilities.
There are two primary approaches to the generation of BN structures: (1) the expert knowledge method and (2) the data-driven method. In the expert knowledge method, the BN structure was built by subjectively evaluating the causal relationships between variables. Conversely, the data-driven method was employed to uncover the interdependence between variables based on the learning algorithm of the BN model and data correlations. In this study, since sufficient sample data were collected, the data-driven method was used to construct the BN structure.
Data-driven Bayesian approaches could be classified into three main categories: (1) the naive Bayesian network (NBN), (2) the augmented naive Bayesian network (ABN), and (3) the tree augmented network (TAN). Among these, TAN learning effectively combined the simplicity and robustness of NBN computation with its ability to characterize interaction dependencies among variables, thus providing insights into the key factors leading to the outcomes of specific accidents [48]. Therefore, this paper employed the data-driven TAN approach to construct the BN structure.
BN encodes the joint probability distribution over a set of random variables U . We let U = A 1 , A n , C , where n denoted the number of influencing factors, where A 1 , A n represent the influencing factors, and C is a class variable (accident type). It was established that the set of parent nodes of C in U was empty, meaning C = . Moreover, A i had at most one other node in addition to C that could have an associated edge pointing to it. The joint probability density distribution adhered to the following equation:
P A 1 , A n , C = P C i = 1 n P A i | C
In the process of learning the TAN structure, Chow and Liu [49] proposed an approach to optimize and construct the BN structure using the conditional mutual information of each attribute pair. This function was defined as:
I P A i , A j C = a i i , a j i , c i P a i i , a j i , c i log P a i i , a j i c i P a i i c i P a j i c i
where I P denotes the conditional mutual information; a i i is the i-th state of the influencing factor A i ; and a j i is the i-th state of the influencing factor A j .

3. Global Maritime Accident TAN Model

3.1. Data Collection

This paper utilized the Marine Casualties and Incidents (MCI) database in GISIS, which is managed by IMO [50]. GISIS is a comprehensive, global maritime information system. In accordance with IMO regulations, every country with sovereignty over its territorial sea is required to report maritime accidents that occur within its waters to the IMO. The MCI database contains two types of information in relation to global maritime accidents: first, the factual data gathered from various sources, and second, detailed data obtained from casualty investigation reports submitted to the IMO.
The MCI database houses global maritime accident data dating back to 1973. Between 1973 and 2000, the annual number of recorded maritime accidents was quite limited. From 2001 onward, the number of accidents documented in the MCI database has been more consistent. However, the accident timestamps during 2001–2004 are only accurate to the day, which is not sufficient for studying the specific time periods in which these accidents occurred. Consequently, low-quality data from the early years have been excluded, and a total of 5660 maritime accidents recorded from 2005 to 2020 were utilized to construct the BN model.

3.2. Node Variable Definitions

Based on the literature’s studies on maritime accident factor analysis [1,43,51,52], there are 16 primary factors that contribute to maritime accidents, including the ship type, hull type, ship’s age, length, gross tonnage, operation, voyage segment, ship’s speed, condition, equipment or device condition, ship’s design, interaction information, weather conditions, ocean conditions, time period, and channel traffic condition. Combining these factors with the information available in the MCI database, seven node variables for the BN model were selected; these included the accident quarter, accident period, accident type, ship type involved, total tonnage of the ship involved, life loss contingency, and accident severity.
Given the requirement of discrete variables for BN nodes, it was necessary to discretize continuous variables in the accident statistics. The division of accident occurrence quarters into the first quarter (January, February, and March), second quarter (April, May, and June), third quarter (July, August, and September), and fourth quarter (October, November, and December) were conducted. The categorization of accident periods was made during dawn (0:00–5:59), early morning (6:00–8:59), morning (9:00–11:59), noon (12:00–13:59), afternoon (14:00–16:59), early evening (17:00–19:59), and evening (20:00–23:59). To discretize the gross tonnage of the ships involved, the collected data and the centroid clustering (CC) algorithm were utilized for their classification. The CC algorithm, which uses the minimization error sum of squares as the objective function, was employed and terminated when the number of iterations reached a preset maximum of 5000 iterations. The optimal classification results yielded four groups based on the gross tonnage of the ships involved: (1–18,500 t), (18,501–57,500 t), (57,501–120,000 t), and (120,001–403,342 t). Among these, 403,342 t represented the maximum total tonnage of the ships involved in the collected data.
Furthermore, in this paper, we classified non-routine accidents, such as missing ships, life-saving equipment accidents, and numerous accident types with irregular or rare records, accounting for no more than 5% as “others” [53]. Multipurpose ships, tugboats, supply, and offshore vessels, unspecified ship types, and other ship types represented no more than 10% were categorized as “others” [53]. Table 1 presents the names, classifications, frequency of occurrence, and percentages of each discrete variable category. Specifically, the “quarter of accident” is a variable divided into four categories, corresponding to the four quarters of the year. Category “a” represents accidents that occurred in the first quarter (January to March), with a frequency of 1539, accounting for 27.19% of the total occurrences. Similarly, “b” is for the second quarter (April to June), “c” for the third quarter (July to September), and “d” for the fourth quarter (October to December), each with their respective frequencies and percentages. The “ship type” is a variable that has seven categories. For instance, “a” represents general cargo ships, which were involved in accidents 989 times, making up 17.47% of the total occurrences. “b” stands for bulk carriers, “c” for container ships, “d” for chemical tankers/oil tankers, “e” for passenger ships, “f” for fishing ships, and “g” for others. Each category has its corresponding frequencies and percentages of occurrence. The “accident type” is a variable that categorizes the types of accidents that occur. For example, category “a” denotes collisions, which occurred 1016 times, representing 17.95% of the total accidents. Similarly, “b” stands for stranding/grounding, “c” for fire/explosions, “d” for capsize, “e” for machinery damage, “f” for contact, and “g” for others, each with their respective frequencies and percentages. Each of the remaining variables in Table 1 followed a similar pattern, wherein specific categories were defined for each variable, along with their frequency of occurrence and corresponding percentages.

3.3. TAN Modeling

Based on the data processing results, the relationship between the six influencing factors and accident consequences was examined. Netica software with a “learning network” function was employed to develop a TAN model, which was grounded on Equation (2), ensuring that all connections between nodes were meaningful. The BN qualitative structure was trained by data, followed by a rigorous review conducted by domain experts to confirm the significance of the links between these nodes. In this study, no changes were made during the finetuning process, as all the interrelationships suggested by the data were in alignment with reality. The initial structure of TAN, which is depicted in Figure 2, was based on the data-driven TAN training results that showcased the realistic correlations between variables. The numbers depicted in Figure 2 represent the initial results of the TAN model. For instance, if the type of accident is divided into seven categories, the initial proportion of each category after initialization is approximately 14.3%. Therefore, the sum of the proportions for all categories would equate to 100%. This explanation is applicable to all other variables depicted in Figure 2 as well.
Utilizing the TAN model, Netica software employed basis functions to create a structure learning module and a parameter learning module, which automatically learned the conditional probability table (CPT) parameters from the sample dataset. The construction of TAN and the obtainment of CPT facilitated the calculation of the posterior probability of each variable. The statistical results of these probabilistic variables were instrumental in the analysis of maritime safety considerations and the facilitation of accident prevention. Figure 3 presents the TAN results for the random variables of interest.

3.4. Sensitivity Analysis and Model Validation

3.4.1. Sensitivity Analysis

In the Netica software, the accident type was selected as the target node, and sensitivity analysis on this node was conducted to identify the factors with the greatest influence on the target node within the TAN model.
The mutual information value represents the sensitivity level between two random variables; a higher value indicates the greater sensitivity of the influencing factor to the target node and, conversely, its lower sensitivity. The sensitivity analysis function in Netica software was used to calculate the mutual information value, percentage, and variance for each influencing factor and accident type, as displayed in Table 2. According to Table 2, the accident consequence and accident severity were the factors most sensitive to the accident type performance, with mutual information values of 0.14246 and 0.14033, respectively; these were notably higher than those of the other four factors. These results revealed how accident consequence and accident severity were the two most intuitive factors for determining the type of accident, followed by ship type, gross tonnage of the ship, time period, and quarter.
Concerning the pivotal factors impacting a variety of accident types, the subsequent step entailed a discernment of how these factors, or the states of these factors, influence the intended accident category. This was conducted by calculating the joint probability of each factor and the “accident category”, as depicted in Table 3.
According to Table 3, the state of each factor that exerted the most significant impact on an accident category is disclosed (in bold value). For instance, in the “life loss contingency” category, when in the state “life loss”, the highest likelihood was for accident type “collision” (22.2%), whereas in the state “no life loss”, there was the lowest probability to be “collision” (7.9%). In the “severity of accident” category, state “serious accidents” demonstrated the highest probability for accident type “stranding/grounding” (23.5%), while state “particularly serious accidents” exhibited the lowest probability for accident type “stranding/grounding” (7.09%). Looking at the “ship type”, type “bulk carrier” showed the highest likelihood for accident type “collision” (25.9%), whereas type “fishing ship” indicated the lowest probability for accident type “collision” (8.53%), but had the highest probability to be in “fire/explosion” (21.9%) and “capsize” (12.4%). Although “gross tonnage” and “quarter of accident” showed little difference in the probability of influencing “accident type”, the probability of “collision” was the highest. In addition, both “collision” and “capsize” showed the highest probability at nighttime.
This analysis underscores the influence that a particular state had on a single factor in an accident category. Additionally, it demonstrates how different states of a single factor contributed to the probability of a specific accident category. Generally, more attention should be paid to those conditions that display high probabilities of accidents due to the state of the single factor under an accident type.

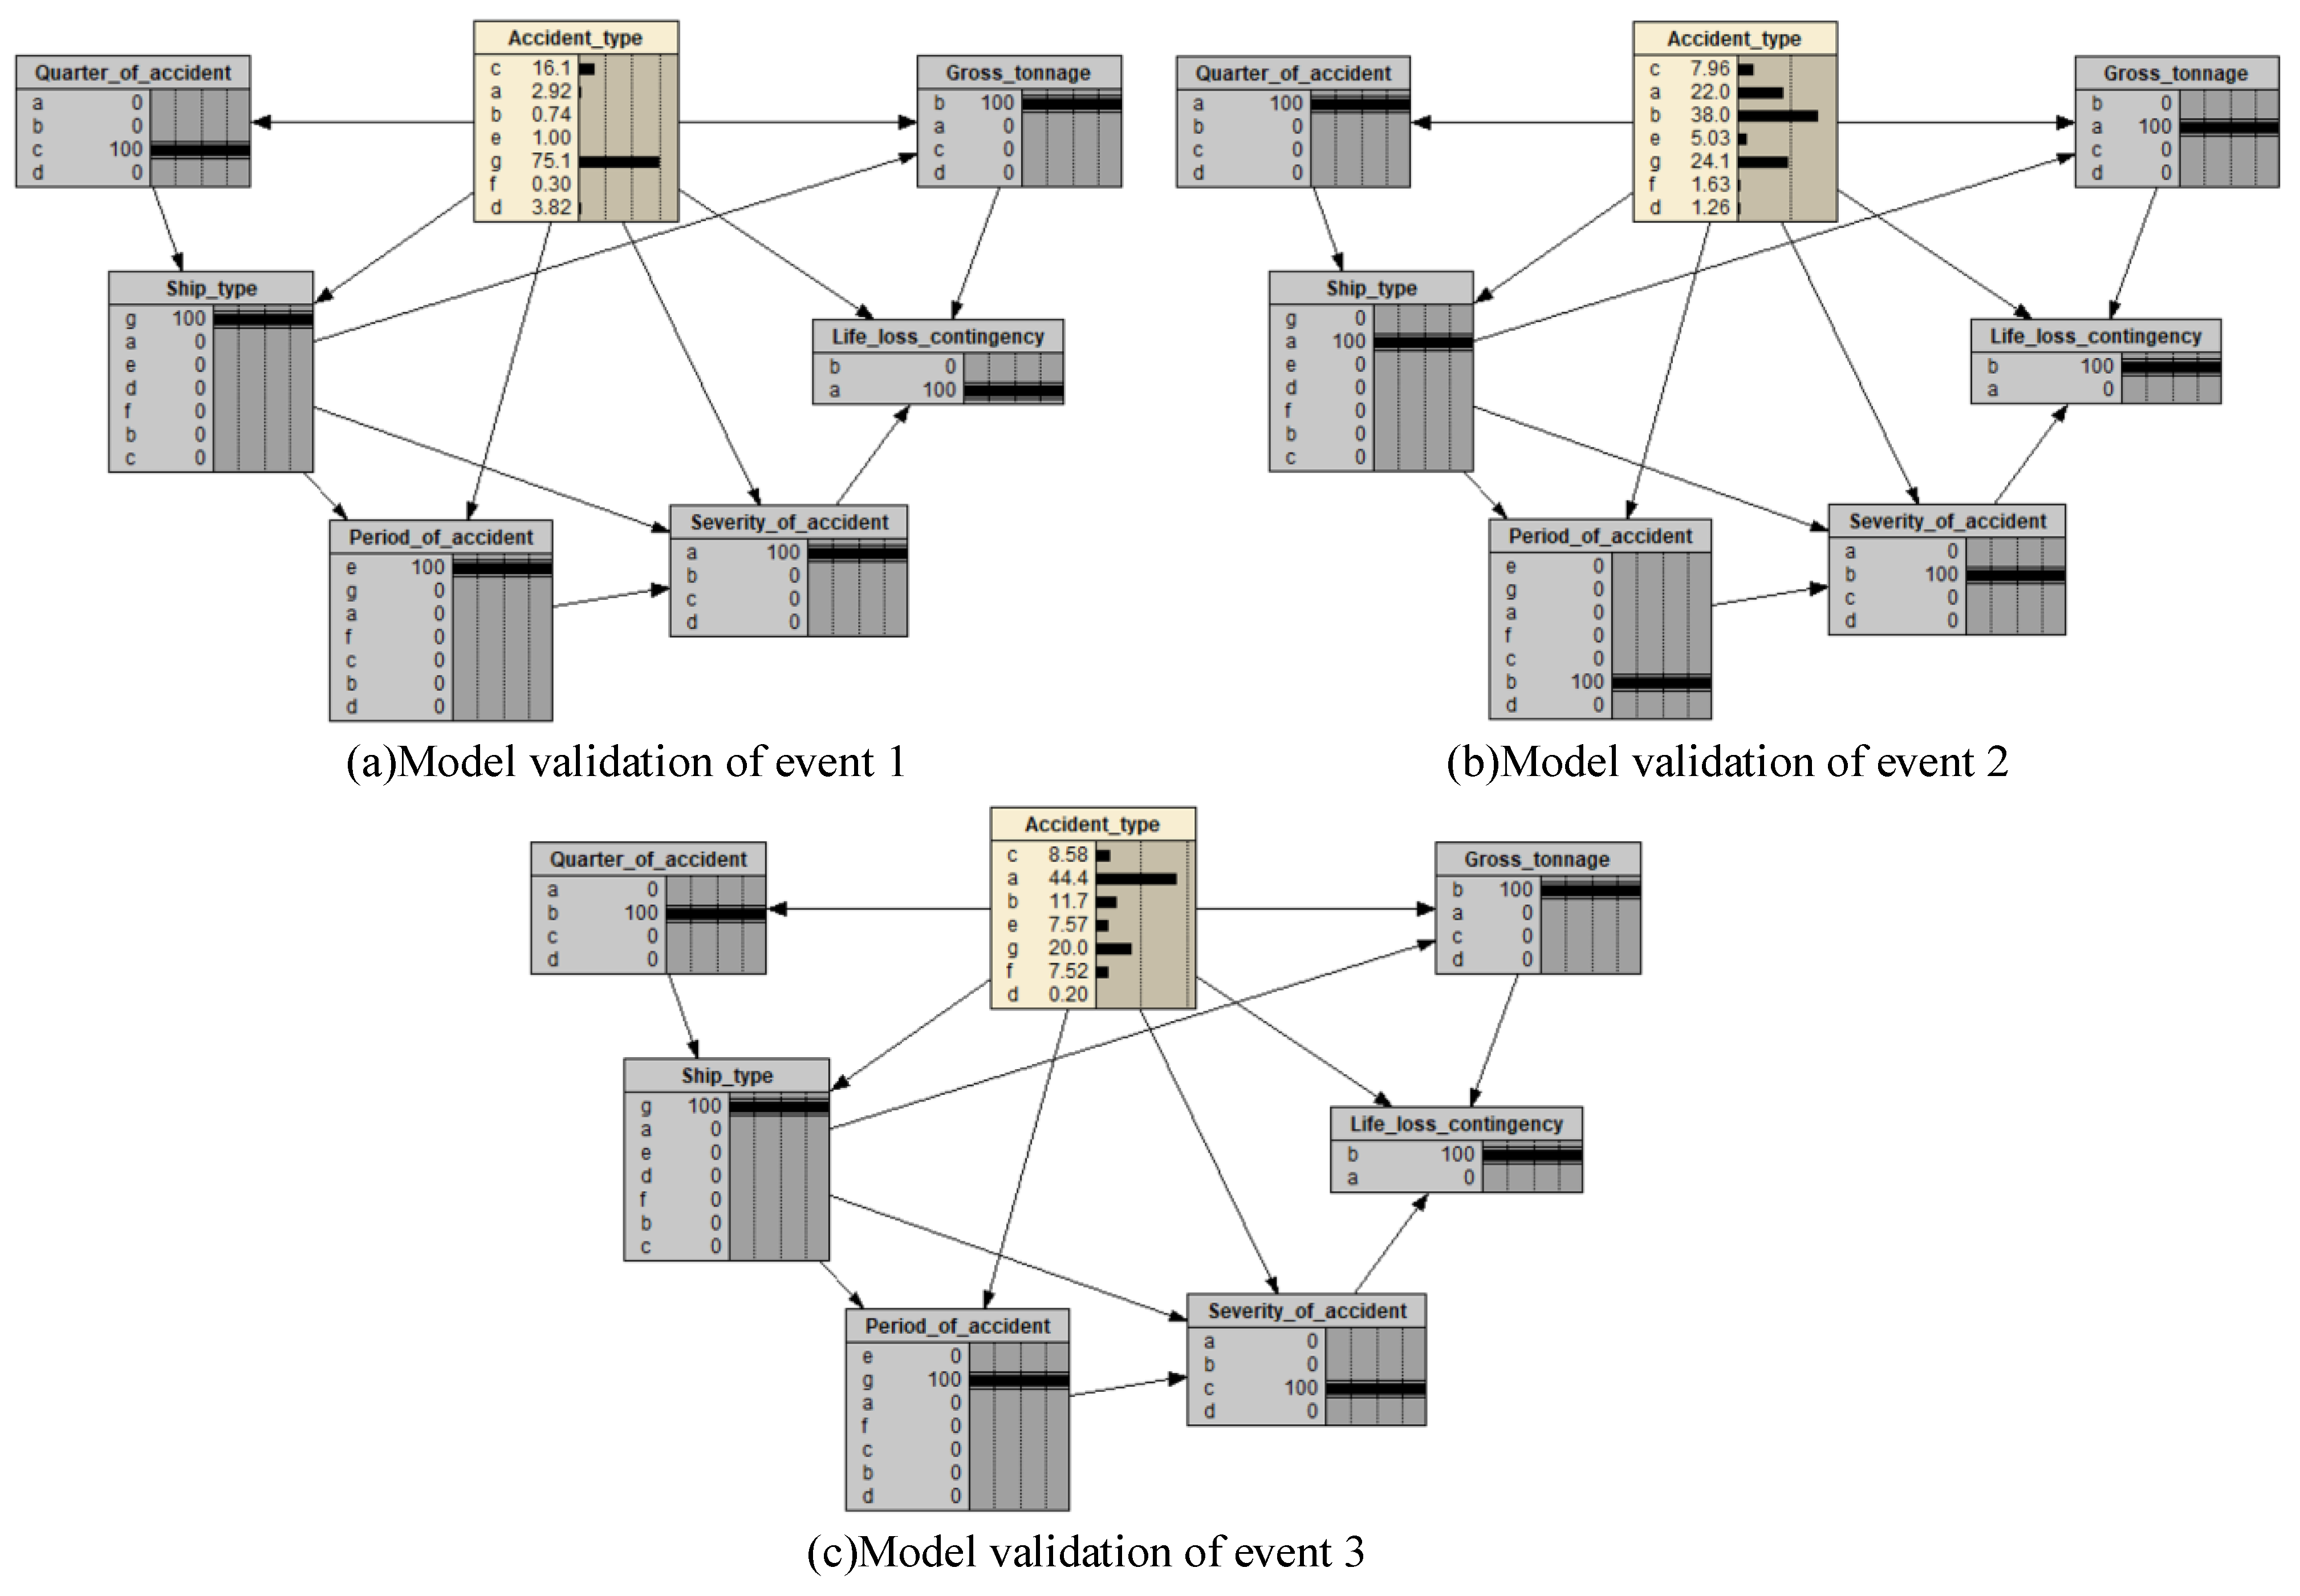
3.4.2. Model Validation

To validate the effectiveness of the TAN model, three offshore accident cases from 2021 were randomly selected, each with varying accident consequences and severities, and were labeled as events 1, 2, and 3. The case data were input into the model for scenario analysis, and Table 4 presents the relevant data information for these accident cases.
Based on the data from three randomly selected events, the probability of the known nodes, such as the quarter, time period, vessel type, accident consequence, accident severity, and gross tonnage of the vessel, was set to 100%. The types and probabilities of the predicted accidents were then observed. As illustrated in Table 4, the probability of other accident types occurring in event 1 was 75.1%; the probability of stranding/grounding in event 2 was 38.0%; and the probability of collision in event 3 was 44.4%. When compared to the original data’s accident types, the predicted accident types for the three events matched, indicating that the model’s predictions were accurate to some extent. Since the occurrence probability of other accident types in the original data was significantly higher than that of collision and stranding/grounding, the data-driven TAN model’s simulation results demonstrated better performance in predicting the occurrence probability of other accident types (e.g., Figure 4a) and for average results in predicting collision and stranding/grounding accidents (e.g., Figure 4b,c).

4. Results and Discussion

The TAN model has the ability to reason bidirectionally and can help explain the most likely scenarios that are associated with a specific accident type. The data-driven TAN-based model examined the correlations between various influencing factors of maritime accidents and accident types, as well as accident consequences. This analysis enabled the prediction of the likelihood of various accident scenarios and the extrapolation of accident consequences under specific conditions.

4.1. Accident Chain Forecast

After the manipulation of the TAN model using Netica software, the relationships between the influencing factors and the accident type, including life loss contingency and the probability of each node, were obtained. By adjusting the placement bar of a single node or multiple nodes, the target node’s probability trend was observed; therefore, a judgment could be formed of the potential trends and consequences of the accident.
The parameters of the conditions for maritime accidents were first simulated by changing a single node and observing the changes in the target node. When changing the ship type, more significant changes occurred in the probability of each accident type. For example, when the ship type was set to a chemical ship, the probability of a fire/explosion accident type increased significantly. When the ship type was a bulk carrier, the probability of the collision accident type increased notably. This study showed that different ship types could lead to significant differences in the occurrence of accident types. Additionally, the ship’s gross tonnage and the accident’s quarter and time also impacted the accident type.
Since the accident type was influenced by the joint decision of several nodes, the influence of a single node on the accident type was more one-sided. Therefore, the accident quarter was set to the first quarter (with the variable node’s confidence bar set to 100%), the ship type was set to a general cargo ship, and the gross tonnage to 1–18,500 t, as shown in Figure 5. The change in the accident type and accident severity node probability from the early morning to evening is shown in Figure 6. As seen in Figure 6, among the types of maritime accidents throughout the day, the probability of a fire/explosion on ships was low, except for the afternoon time period, which was 18.2%; the probabilities of capsize, machinery damage, and contact were also low below 10%. Among other accidents, the probabilities of ship collision and stranding/grounding accidents were significantly higher at around 20%. Additionally, it was observed that the occurrence probability of stranding/grounding accidents was significantly higher during the dawn and evening than in other periods.
Unlike previous studies, this paper focused specifically on the question of whether or not the consequences of an accident could involve a loss of human life when an accident occurred under this scenario. As shown in Figure 7, the change in the probability of the “life loss contingency” node from the early morning to the evening showed that the probability of an accident consequence that did not involve loss of life was much higher than the probability of an accident consequence that involved loss of life throughout the day in this scenario. The results of the study indicate that the probability of potential loss of life is low for all accident types in this scenario. Therefore, accidents involving collisions and fires/explosions do not necessarily result in loss of life outcomes either and may need to be combined with additional accident causation in order to obtain more reliable conclusions.
In summary, the highest probabilities of collision and stranding/grounding occurred at dawn, with the accident severity for this appearing particularly serious. A collision was most likely to occur at noon, with high accident severity. Particularly severe collision and stranding/grounding accidents were more likely to occur in the evening. It is worth mentioning that although the probabilities of collision and stranding/grounding of ships were higher in this scenario, the probability of life loss was relatively low, and the accident consequences were less affected by the time of the accidents.

4.2. Accident Cause Analysis

In this study, the bidirectional reasoning of the TAN model was employed, allowing for both causal reasoning and diagnostic reasoning. The application of causal reasoning aided in the prediction of accident chains, while diagnostic reasoning assisted in the analysis of the accident causes. By determining the type, consequence, and severity of an accident, a more intuitive comprehension of the causes and mechanisms behind maritime accidents could be achieved.
As demonstrated in Figure 8, certain patterns were identified from the research data. For instance, when the accident type was classified as a collision, with severity as a general accident and no involvement of life loss, there was a significantly higher probability of container ships, general cargo ships, and chemical ships that were involved compared to other ship types. This indicates a necessity for focusing on the safety measures of these types of vessels, given their higher likelihood of being involved in collision accidents. The results also revealed a correlation between ship tonnage, time of the accident, and frequency of collision accidents. Ships with a tonnage between 1 and 18,500 t were more prone to collisions during dawn hours. A plausible explanation for this might be the combined influence of lower visibility conditions, potential crew fatigue, and less active navigation during these hours.
Furthermore, the data suggest that accidents involving container ships, general cargo ships, and chemical ships of such tonnage typically have a lower probability of causing life loss. This might be attributed to the relative ease with which personnel can escape from smaller ships in distress or potentially the higher success rate of rescue operations due to the manageability of these smaller vessels.
These findings provide essential insights into maritime accident patterns. By identifying specific circumstances and ship types that are associated with a higher risk of accidents, it could be possible to develop more targeted safety protocols and preventive measures. It also highlights the usefulness of predictive models, such as the TAN model, for risk management in the maritime industry.
In conclusion, these findings emphasize the intricate nature of maritime accidents and the numerous variables involved. Through the bidirectional reasoning of the TAN model, a more thorough understanding of these accidents could be obtained, potentially leading to the development of more effective accident prevention strategies and, ultimately, the enhancement of maritime safety.

5. Conclusions

Ship safety has always been a major concern in the maritime transportation industry. In this paper, a TAN model for a maritime traffic accident risk assessment was constructed to analyze the relationship between the consequences of maritime accidents and various influencing factors and to use model simulation to analyze how different risk factors can affect different types of maritime accidents.
The TAN model was constructed based on data from a total of 5660 maritime accidents from 2005 to 2020. In addition to other accident types, the accident type with the highest probability of occurrence among maritime traffic accidents included collision, followed by stranding/grounding, and then fire/explosion.
The sensitivity analysis and simulation validation of the constructed model showed that accident consequences and accident severity are the two most intuitive factors when determining the type of accident occurrence, followed by the ship type, gross tonnage of the ship, time period, and season. The constructed model effectively predicted the likelihood of various accident scenarios and accident consequence projections under specific conditions.
According to the causal reasoning analysis of the TAN model and under the conditions of “first quarter”, “general cargo ship”, and “ship’s gross tonnage of 1–18,500 t,” the probability of ship collision and stranding/grounding accidents was higher, while the probability of life loss was relatively low, and the consequences of this accident were less affected by the time of the accident. According to the analysis of the model’s diagnostic reasoning, in the general collision accident chain without loss of life, container ships, general cargo ships, and chemical ships were the main types of ships involved in such accidents. Ships with a tonnage of 1–18,500 t were more likely to have such accidents during the dawn; however, their probability of causing loss of life was lower. These findings carry significant implications for enhancing safety measures in the maritime transportation industry. By understanding the frequency, severity, and common conditions of various types of accidents, stakeholders could develop more targeted and effective accident prevention strategies.
Despite utilizing a substantial volume of publicly available accident data to achieve reliable predictive outcomes, we acknowledge the limitations of our study. It is plausible that the introduction of more variables could alter these results. Future work should focus on expanding this model to include additional variables such as environmental factors (weather conditions, sea state), ship design and maintenance factors, human factors (crew experience, fatigue), and others that could impact the risk and consequences of maritime accidents. Additionally, more in-depth research should be carried out to investigate the different patterns of accidents associated with different types of ships at various times of day to refine preventative measures accordingly.

Author Contributions

Conceptualization, methodology, software, writing—original draft, S.L.; supervision, J.W.; writing—review and editing, Z.Z.; data curation, F.L. and Z.L.; visualization, Z.L. All authors have read and agreed to the published version of the manuscript.

Funding

This research was supported by the National Natural Science Foundation of China under grant 52072237, the Guangdong Basic and Applied Basic Research Foundation of China under grant 2022A1515110776, and the Project of Educational Commission of Guangdong Province of China under grant 2021WTSCX222.

Institutional Review Board Statement

Not applicable.

Informed Consent Statement

Not applicable.

Data Availability Statement

Not applicable.

Conflicts of Interest

The authors declare no conflict of interest.

References

  1. Fan, S.; Blanco-Davis, E.; Yang, Z.; Zhang, J.; Yan, X. Incorporation of human factors into maritime accident analysis using a data-driven Bayesian network. Reliab. Eng. Syst. Saf. 2020, 203, 107070. [Google Scholar] [CrossRef]
  2. Zhang, G.; Thai, V.V. Expert elicitation and Bayesian Network modeling for shipping accidents: A literature review. Saf. Sci. 2016, 87, 53–62. [Google Scholar] [CrossRef]
  3. Hu, S.; Li, Z.; Xi, Y.; Gu, X.; Zhang, X. Path Analysis of Causal Factors Influencing Marine Traffic Accident via Structural Equation Numerical Modeling. J. Mar. Sci. Eng. 2019, 7, 96. [Google Scholar] [CrossRef] [Green Version]
  4. Chou, C.-C.; Wang, C.-N.; Hsu, H.-P.; Ding, J.-F.; Tseng, W.-J.; Yeh, C.-Y. Integrating AIS, GIS and E-Chart to Analyze the Shipping Traffic and Marine Accidents at the Kaohsiung Port. J. Mar. Sci. Eng. 2022, 10, 1543. [Google Scholar] [CrossRef]
  5. Xue, J.; Papadimitriou, E.; Reniers, G.; Wu, C.; Jiang, D.; van Gelder, P.H.A.J.M. A comprehensive statistical investigation framework for characteristics and causes analysis of ship accidents: A case study in the fluctuating backwater area of Three Gorges Reservoir region. Ocean Eng. 2021, 229, 108981. [Google Scholar] [CrossRef]
  6. Göksu, S.; Arslan, Ö. Quantitative Analysis of Dynamic Risk Factors for Shipping Operations. J. ETA Marit. Sci. 2020, 8, 86–97. [Google Scholar] [CrossRef]
  7. Li, Z.; Yao, C.; Zhu, X.; Gao, G.; Hu, S. A decision support model for ship navigation in Arctic waters based on dynamic risk assessment. Ocean Eng. 2022, 244, 110427. [Google Scholar] [CrossRef]
  8. Guo, Y.; Jin, Y.; Hu, S.; Yang, Z.; Xi, Y.; Han, B. Risk evolution analysis of ship pilotage operation by an integrated model of FRAM and DBN. Reliab. Eng. Syst. Saf. 2023, 229, 108850. [Google Scholar] [CrossRef]
  9. Zhang, L.; Wang, H.; Meng, Q.; Xie, H. Ship accident consequences and contributing factors analyses using ship accident investigation reports. Proc. Inst. Mech. Eng. Part O J. Risk Reliab. 2019, 233, 35–47. [Google Scholar] [CrossRef]
  10. Otay, E.N.; Özkan, S. Stochastic Prediction of Maritime Accidents in the strait of Istanbul. In Proceedings of the 3rd International Conference on Oil Spills in the Mediterranean and Black Sea regions, Istanbul, Turkey, 1 September 2003; pp. 92–104. [Google Scholar]
  11. Koromila, I.; Nivolianitou, Z.; Giannakopoulos, T. Bayesian network to predict environmental risk of a possible ship accident. In Proceedings of the 7th International Conference on PErvasive Technologies Related to Assistive Environments, Rhodes Greece, 27–30 May 2014; pp. 1–5. [Google Scholar]
  12. Zhang, C.; Zou, X.; Lin, C. Fusing XGBoost and SHAP models for maritime accident prediction and causality inter-pretability analysis. J. Mar. Sci. Eng. 2022, 10, 1154. [Google Scholar] [CrossRef]
  13. Fu, S.; Liu, Y.; Xi, Y.; Zhang, M.; Hu, S. Analysis of influencing factors on severity of ship accidents in ice-covered Arctic waters. China Saf. Sci. J. 2019, 29, 84. (In Chinese) [Google Scholar]
  14. Baksh, A.-A.; Abbassi, R.; Garaniya, V.; Khan, F. Marine transportation risk assessment using Bayesian Network: Application to Arctic waters. Ocean Eng. 2018, 159, 422–436. [Google Scholar] [CrossRef]
  15. Chen, P.; Zhang, Z.; Huang, Y.; Dai, L.; Hu, H. Risk assessment of marine accidents with Fuzzy Bayesian Networks and causal analysis. Ocean Coast. Manag. 2022, 228, 106323. [Google Scholar] [CrossRef]
  16. Ventikos, N.P.; Giannopoulos, I.F. Assessing the consequences from marine accidents: Introduction to a risk acceptance criterion for Greece. Hum. Ecol. Risk Assess. Int. J. 2013, 19, 699–722. [Google Scholar] [CrossRef]
  17. Chen, J.; Bian, W.; Wan, Z.; Yang, Z.; Zheng, H.; Wang, P. Identifying factors influencing total-loss marine accidents in the world: Analysis and evaluation based on ship types and sea regions. Ocean Eng. 2019, 191, 106495. [Google Scholar] [CrossRef]
  18. Chen, J.; Zhang, F.; Yang, C.; Zhang, C.; Luo, L. Factor and trend analysis of total-loss marine casualty using a fuzzy matter element method. Int. J. Disaster Risk Reduct. 2017, 24, 383–390. [Google Scholar] [CrossRef]
  19. Nivolianitou, Z.; Leopoulos, V.; Konstantinidou, M. Comparison of techniques for accident scenario analysis in hazardous systems. J. Loss Prev. Process. Ind. 2004, 17, 467–475. [Google Scholar] [CrossRef]
  20. Wang, W.; Jiang, X.; Xia, S.; Cao, Q. Incident tree model and incident tree analysis method for quantified risk assessment: An in-depth accident study in traffic operation. Saf. Sci. 2010, 48, 1248–1262. [Google Scholar] [CrossRef]
  21. Liu, P.; Yang, L.; Gao, Z.; Li, S.; Gao, Y. Fault tree analysis combined with quantitative analysis for high-speed railway accidents. Saf. Sci. 2015, 79, 344–357. [Google Scholar] [CrossRef]
  22. Ung, S.-T. Evaluation of human error contribution to oil tanker collision using fault tree analysis and modified fuzzy Bayesian Network based CREAM. Ocean Eng. 2019, 179, 159–172. [Google Scholar] [CrossRef]
  23. Ahn, Y.-J.; Yu, Y.-U.; Kim, J.-K. Accident Cause Factor of Fires and Explosions in Tankers Using Fault Tree Analysis. J. Mar. Sci. Eng. 2021, 9, 844. [Google Scholar] [CrossRef]
  24. Kim, K.-I.; Jeong, J.S.; Lee, B.-G. Study on the Analysis of Near-Miss Ship Collisions Using Logistic Regression. J. Adv. Comput. Intell. Intell. Inform. 2017, 21, 467–473. [Google Scholar] [CrossRef]
  25. Yu, H.; Khan, F.; Veitch, B. A Flexible Hierarchical Bayesian Modeling Technique for Risk Analysis of Major Accidents. Risk Anal. 2017, 37, 1668–1682. [Google Scholar] [CrossRef] [PubMed]
  26. Hänninen, M. Bayesian networks for maritime traffic accident prevention: Benefits and challenges. Accid. Anal. Prev. 2014, 73, 305–312. [Google Scholar] [CrossRef] [PubMed]
  27. Abistado, K.G.; Arellano, C.N.; Maravillas, E.A. Weather forecasting using artificial neural network and Bayesian network. J. Adv. Comput. Intell. Intell. Inform. 2014, 18, 812–817. [Google Scholar] [CrossRef]
  28. Wang, J.; Zhang, M.; Huang, X.; Chen, J. Scenario analysis of road transportation accidents of inflammable and explosive hazardous chemicals. China Saf. Sci. J. 2019, 29, 171. (In Chinese) [Google Scholar]
  29. Qiao, W.; Liu, Y.; Ma, X.; Liu, Y. Human factors analysis for maritime accidents based on a dynamic fuzzy Bayesian network. Risk Anal. 2020, 40, 957–980. [Google Scholar] [CrossRef]
  30. Zhang, G.; Thai, V.V.; Yuen, K.F.; Loh, H.S.; Zhou, Q. Addressing the epistemic uncertainty in maritime accidents modelling using Bayesian network with interval probabilities. Saf. Sci. 2018, 102, 211–225. [Google Scholar] [CrossRef]
  31. Li, K.X.; Yin, J.; Bang, H.S.; Yang, Z.; Wang, J. Bayesian network with quantitative input for maritime risk analysis. Transp. A Transp. Sci. 2012, 10, 89–118. [Google Scholar] [CrossRef]
  32. Wang, L.; Yang, Z. Bayesian network modelling and analysis of accident severity in waterborne transportation: A case study in China. Reliab. Eng. Syst. Saf. 2018, 180, 277–289. [Google Scholar] [CrossRef]
  33. Zou, X.; Yue, W.L. A Bayesian Network Approach to Causation Analysis of Road Accidents Using Netica. J. Adv. Transp. 2017, 2017, 2525481. [Google Scholar] [CrossRef] [Green Version]
  34. Yuan, C.; Hu, Y.; Zhang, Y.; Zuo, T.; Wang, J.; Fan, S. Evaluation on consequences prediction of fire accident in emergency processes for oil-gas storage and transportation by scenario deduction. J. Loss Prev. Process. Ind. 2021, 72, 104570. [Google Scholar] [CrossRef]
  35. Zhao, J.; Xie, L.; Yang, Y.; Hu, X.; Ou, C.; Zeng, R. An ISM-BN based research on navigation risk factors of inland waterway vessels. China Saf. Sci. J. 2022, 32, 37. (In Chinese) [Google Scholar]
  36. Afenyo, M.; Khan, F.; Veitch, B.; Yang, M. Arctic shipping accident scenario analysis using Bayesian Network approach. Ocean Eng. 2017, 133, 224–230. [Google Scholar] [CrossRef]
  37. Jiang, M.; Lu, J.; Yang, Z.; Li, J. Risk analysis of maritime accidents along the main route of the Maritime Silk Road: A Bayesian network approach. Marit. Policy Manag. 2020, 47, 815–832. [Google Scholar] [CrossRef]
  38. Si, D.; Zhang, J.; Lang, K. Causation analysis of container ship collision accidents based on improved BN. China Saf. Sci. J. 2019, 29, 31. (In Chinese) [Google Scholar]
  39. Fan, S.; Yang, Z.; Blanco-Davis, E.; Zhang, J.; Yan, X. Analysis of maritime transport accidents using Bayesian networks. Proc. Inst. Mech. Eng. Part O J. Risk Reliab. 2020, 234, 439–454. [Google Scholar] [CrossRef]
  40. Hänninen, M.; Banda, O.A.V.; Kujala, P. Bayesian network model of maritime safety management. Expert Syst. Appl. 2014, 41, 7837–7846. [Google Scholar] [CrossRef]
  41. Zhao, X.; Yuan, H.; Yu, Q. Autonomous vessels in the Yangtze river: A study on the maritime accidents using data-driven bayesian networks. Sustainability 2021, 13, 9985. [Google Scholar] [CrossRef]
  42. Acharya, T.D.; Yoo, K.W.; Lee, D.H. GIS-based Spatio-temporal Analysis of Marine Accidents Database in the Coastal Zone of Korea. J. Coast. Res. 2017, 79, 114–118. [Google Scholar] [CrossRef] [Green Version]
  43. Uğurlu, Ö.; Köse, E.; Yıldırım, U.; Yüksekyıldız, E. Marine accident analysis for collision and grounding in oil tanker using FTA method. Marit. Policy Manag. 2015, 42, 163–185. [Google Scholar] [CrossRef]
  44. Antão, P.; Teixeira, A.; Soares, C.G. Statistical characterization of risk influencing factors in ship collision accidents. In Developments in Maritime Technology and Engineering; CRC Press: Boca Raton, FL, USA, 2021; pp. 221–229. [Google Scholar]
  45. Magda, B. Fires as a cause of ship accidents—A statistical approach. Saf. Fire Technol. 2015, 37, 171–180. [Google Scholar]
  46. Li, H.; Ren, X.; Yang, Z. Data-driven Bayesian network for risk analysis of global maritime accidents. Reliab. Eng. Syst. Saf. 2023, 230, 108938. [Google Scholar] [CrossRef]
  47. Huang, D.-Z.; Hu, H.; Li, Y.-Z. Spatial Analysis of Maritime Accidents Using the Geographic Information System. Transp. Res. Rec. J. Transp. Res. Board 2013, 2326, 39–44. [Google Scholar] [CrossRef]
  48. Friedman, N.; Geiger, D.; Goldszmidt, M. Bayesian network classifiers. Mach. Learn. 1997, 29, 131–163. [Google Scholar] [CrossRef] [Green Version]
  49. Chow, C.; Liu, C. Approximating discrete probability distributions with dependence trees. IEEE Trans. Inf. Theory 1968, 14, 462–467. [Google Scholar] [CrossRef] [Green Version]
  50. International Maritime Organization-Global Integrated Shipping Information System. Marine Casualties and Incidents. Available online: https://gisis.imo.org/Public/MCI/Default.aspx (accessed on 21 June 2022).
  51. Zhu, L.; Lu, L.; Zhang, W.; Zhao, Y.; Song, M. Analysis of Accident Severity for Curved Roadways Based on Bayesian Networks. Sustainability 2019, 11, 2223. [Google Scholar] [CrossRef] [Green Version]
  52. Liu, L.; Ye, X.; Wang, T.; Yan, X.; Chen, J.; Ran, B. Key Factors Analysis of Severity of Automobile to Two-Wheeler Traffic Accidents Based on Bayesian Network. Int. J. Environ. Res. Public Health 2022, 19, 6013. [Google Scholar] [CrossRef]
  53. Zhang, Y.; Sun, X.; Chen, J.; Cheng, C. Spatial patterns and characteristics of global maritime accidents. Reliab. Eng. Syst. Saf. 2020, 206, 107310. [Google Scholar] [CrossRef]
Figure 1. Graph of a valid BN with directed acyclic graph structure.
Jmse 11 01513 g001
Figure 2. Initial structure of TAN model.
Jmse 11 01513 g002
Figure 3. TAN of vessel navigation risk.
Jmse 11 01513 g003
Figure 4. Event model validation.
Jmse 11 01513 g004
Figure 5. Analysis of the accident chain with the characteristics “first quarter”, “general cargo”, and “gross ship tonnage set to 1–18,500 t”.
Jmse 11 01513 g005
Figure 6. The posterior probability of “accident type” and “severity of accident” in specific accident scenarios.
Jmse 11 01513 g006
Figure 7. The posterior probability of “life loss contingency” in specific accident scenarios.
Jmse 11 01513 g007
Figure 8. Analysis of accident scenarios with the characteristics “collision”, “general accident”, and “no life loss”.
Jmse 11 01513 g008
Table 1. Variables for building BN.
Variable NameClassificationFrequencyPercentage/%Variable NameClassificationFrequencyPercentage/%
Quarter of accidenta (the first quarter)153927.19Ship typea (general cargo ship)98917.47
b (the second quarter)135323.90b (bulk carrier)2554.50
c (the third quarter)140624.84c (container ship)3706.54
d (the fourth quarter)136224.06d (chemical tanker/oil tanker)5379.49
Period of accidenta (dawn 0–5 a.m.)195434.52e (passenger ship)4538.00
b (early morning 5–8 a.m.)5629.93f (fishing ship)63411.20
c (morning 8–11 p.m.)69312.24g (others)242242.79
d (noon 11–13 p.m.)4277.54Gross tonnagea (gross tonnage [1,18,500])401170.87
e (afternoon 13–16 p.m.)64711.43b (gross tonnage [18,501,57,500])121921.54
f (early evening 16–19 p.m.)5409.01c (gross tonnage [57,501,120,000])3406.00
g (evening 19–24 p.m.)83714.79d (gross tonnage [120,001,403,342])901.59
Accident typea (collision)101617.95Life loss contingencya (life loss)165129.17
b (stranding/grounding)82314.54b (no life loss)400970.83
c (fire/explosion)75413.32Severity of accident a (particularly serious accidents)283750.12
d (capsize)3656.45b (serious accidents)203435.94
e (machinery damage)2875.07c (general accident)62210.99
f (contact)2814.96d (unspecified accident)1672.95
g (others)213437.70
Table 2. Mutual information shared with “accident type”.
NodesMutual Information ValuePercentage/%Variance
Life loss contingency0.142465.8000.0176774
Accident severity0.140335.7100.0088289
Ship type0.042351.7200.0013155
Vessel gross tonnage0.020960.8530.0004918
Time period0.020060.8170.0012170
Quarter0.004210.1710.0000869
Table 3. The joint probability of the TAN model.
Life loss contingency
abcdefg
a7.903.3412.1010.302.311.9462.10
b22.2019.3013.804.836.276.2727.20
Severity of accident
abcdefg
a14.507.0913.109.652.181.9451.60
b22.0023.5014.902.777.076.7323.00
c20.5017.6011.403.469.1810.3027.60
d17.4017.1010.608.038.197.8730.90
Ship type
abcdefg
a18.8019.907.767.685.965.3934.50
b25.9021.905.632.386.014.9833.20
c21.7010.8013.002.174.734.7342.90
d22.6013.1021.002.045.684.5131.00
e10.7014.8015.406.025.149.2338.70
f8.5310.3021.9012.404.702.5739.70
g18.9013.5012.106.634.624.7739.50
Gross tonnage
abcdefg
a16.8015.2013.608.525.434.6035.90
b21.0014.3012.101.443.345.4842.30
c20.1011.0013.101.986.065.5642.20
d18.207.9618.004.878.209.5533.20
Period of accident
abcdefg
a19.2016.0014.307.395.193.1634.70
b21.8017.3011.404.703.885.8335.10
c12.609.4213.905.225.906.6346.40
d17.0011.4012.807.254.385.7241.50
e14.6011.3016.607.154.956.1239.30
f12.9016.5010.507.295.085.8441.90
g23.5016.5011.505.075.475.2332.70
Quarter of accident
abcdefg
a17.4016.9013.305.994.564.8237.00
b18.8012.5014.905.864.605.4837.80
c17.1014.6013.806.625.983.8738.10
d18.6013.8011.207.425.225.8037.90
Table 4. State values of real event factor variables.
VariablesEvent Number
123
Quarterlycab
Time periodebg
Ship typegag
Life loss contingencyabb
Accident severityabc
Vessel gross tonnagebab
Accident typegba
Accident probability75.1%38.0%44.4%
Disclaimer/Publisher’s Note: The statements, opinions and data contained in all publications are solely those of the individual author(s) and contributor(s) and not of MDPI and/or the editor(s). MDPI and/or the editor(s) disclaim responsibility for any injury to people or property resulting from any ideas, methods, instructions or products referred to in the content.

