Article

Plastic Response and Failure of the Cruciform Structure under In-Plane Load

1
School of Naval Architecture and Ocean Engineering, Jiangsu University of Science and Technology, Zhenjiang 212003, China
2
School of Ship and Ocean Engineering, Huazhong University of Science and Technology, Wuhan 430074, China
*
Author to whom correspondence should be addressed.
J. Mar. Sci. Eng. 2023, 11(7), 1478; https://doi.org/10.3390/jmse11071478
Submission received: 2 July 2023 / Revised: 20 July 2023 / Accepted: 21 July 2023 / Published: 24 July 2023
(This article belongs to the Special Issue Advances in Marine Mechanical and Structural Engineering)

Abstract

:
In this study, a common cruciform structure in ship hulls was designed and experimented with in order to analyze its deformation characteristics under planar collision and quasi-static loading. The mechanical parameters of the materials were determined by performing tensile tests on the plates used in the specimens. The applicability of the EPS, BWH, and RTCL failure criteria in the simulation of compressive structures was investigated by finite element simulation of quasi-static tests and falling weight impact tests. The effects of mesh size on the deformation and impact force of the cruciform structure under plane loading were comparatively analyzed. The results show that under plane loading, the cruciform structure undergoes axial compression deformation first, followed by buckling and wrinkling deformation. Compared with the quasi-static test, the drop hammer impact test showed higher deformation concentration and smaller wrinkle height. Under the same axial deformation condition, the structural resistance of the drop hammer impact test was about 13% higher than that of the quasi-static test. It is worth noting that the RTCL failure criterion is effective in modeling the failure of compressive structures in simulations with structures with different compressive deformations.

1. Introduction

The hull structural damage caused by collision and grounding accidents varies depending on the situation. Minor collision accidents usually only result in slight plastic deformation of the structure, which can be restored through repairs. However, severe accidents can cause extensive structural damage, resulting in cabin leakage, oil spills, and even causing the vessel to break due to insufficient remaining strength, leading to major disasters. According to statistics from the ITOPF organization on the causes of large oil spills from 1970 to 2022, 62% of accidents were caused by ship collisions and groundings [1]. In recent decades, to investigate the structural resistance of ships, many scholars have studied the structural response in collision and grounding accidents, using methods such as model testing, nonlinear finite element analysis, simplified analytical methods, and empirical formulae. They have investigated the response and damage modes of typical structures in ship structures subjected to impact loading, which has significant implications for ship structure design.
Experimental methods are the most reliable means to evaluate the resistance and collision response of ship structures. However, due to their high cost in terms of time and manpower, the practical operation of experimental methods is difficult. Simplified analytical methods are used for the preliminary design of structure collision prevention.
Stiffened plates are the most common structures in ship structures, and assessing their resistance performance is particularly important for the design of ship structures. Due to the demanding experimental methods that are time-consuming and labor-intensive, many scholars have verified other research methods through impact tests on stiffened plates. Cho and Lee [2] conducted collision tests on stiffened plates and proposed a simplified analytical method to predict the extent of damage to stiffened plates under in-plane loads. Liu K and Liu B [3,4], Yang L and Wang D [5], Alsos and Amdahl [6,7], and others have compared the influence of key parameters of material settings, including dynamic behaviors of materials and different failure models, on simulation results through experiments, optimizing numerical simulation methods and making simulation results more credible. Zhang M [8] conducted experimental and numerical simulation studies on a scaled ship side-shell quasi-statically punched at the mid-span by a raked bow indenter to investigate its damage characteristics from deformation to a large opening. For strong supporting structures commonly found in double-layer hull structures, such as the web girder and other supporting structures, Wang G [9], Zhang M [10], and Villavicencio R [11] proposed simplified analytical methods. The cruciform structure is widely used in ship structures as an energy absorption structure. Chen B [12] investigated the structural response of a double-hull structure under in-plane loading by changing the size of the indenter. Urban [13] conducted axial compression tests on aluminum L-shaped and cruciform structures and obtained types of damage modes. The supporting structure mainly produced relatively uniform wrinkling deformation, while the cruciform structure suffered damage at the axial weld seam. Zhou [14] investigated the energy absorption capacity of a similar cruciform structure by changing the axial weld seam under planer load. Haris S and Amdahl J [15,16] derived the resistance calculation formula for cruciform structures under overall compression and studied the buckling deformation process of the cruciform structures under planar loads. The proposed analytical method is used to estimate the energy absorbed by the structure in collision and grounding accidents. Hayduk and Wierzbicki [17] studied the deformation of cruciform structures, T-shaped structures, and L-shaped structures under planar loads and derived analytical calculation formulae for average resistance. Yang and Caldwell [18] conducted experimental research on the energy absorption and average compressive strength of cruciform structures and T-shaped structures under compression. Wang G [9] studied the variation of structural resistance of the cruciform structure under axial load in the longitudinal direction. The deformation of the cruciform structure differs when there are constraints around it compared to when it is alone. When the loading surface is large, the load-bearing condition of the cruciform structure is the same as that of the structure analyzed by Urban and Zhou [13,14]. When the loading surface is small, i.e., when the ship is subjected to minor structural impacts or grounded on small reefs, the outer side of the cruciform structure is not free and can be regarded as bearing local loads, as shown in Figure 1. The aforementioned studies conducted tests on designed structures under quasi-static or impact loads. Quasi-static tests are more suitable for accidents involving static compression and low-speed collisions, while collision tests can study the response of structures in high-speed collision scenarios. The impact of dynamic effects on structural response has been relatively less studied in experiments. This article will compare the structural response of a cross-shaped structure under two types of loads, quasi-static and impact, to investigate their differences.
In recent years, with the rapid development of computer performance, the finite element method has been widely used to simulate the structural response in ship collision and grounding scenarios. One of the most vital issues in the ship collision finite element analysis is the prediction of structural damage, including the location and damage size of the structure, which will have essential effects on the subsequent overall structural deformation mode and energy dissipation. The widely used failure criteria include the EPS failure criterion, BWH failure criterion, RTCL failure criterion, and so on. The EPS failure criterion has been widely applied because of its simplicity and convenience. However, due to the existence of strain gradients, the definition of failure strain is related to the element size [19,20,21,22,23,24]. References show that different failure strains correspond to different element sizes by comparing simulation curves with real experimental curves obtained by material tensile tests. Therefore, using the failure strain corresponding to the model mesh size can reduce the large deviations between simulation results and test data effectively. The BWH failure criterion proposed by Alsos [6] uses the necking of the element to determine its failure. Storheim et al. [25,26] improved the BWH failure criterion by considering the subsequent strength of the material after necking. Yang L [5] proposed the m-BWH failure criterion and validated its accuracy at high strain rates through various plane stress tests. Alsos and Amdahl [6] studied the mesh sensitivity of the BWH and RTCL failure criteria in the FEA of quasi-static penetration experiments on stiffened plates. Compared with the BWH failure criterion, the RTCL failure criterion is more sensitive to mesh size. Marinatos and Samuelides [27] obtained the same rule as Alsos [6] through finite element simulation of ship structures. In recent years, many scholars have also carried out research on new failure criteria, and these failure criteria are usually proposed by combining various classical failure criteria to bypass the inadequacy of a single failure criterion. Lu et al. [28,29] developed the MSSRT failure criterion and simulated the generation and extension of cracks in the structure in the test of a double-hulled hull. Costas [30] proposed the large-size shell unit regularization model for damage and validated it.
This paper investigates the structural response of the commonly found cruciform structure in typical double-hull ship structures under local quasi-static and impact loads. Tensile tests of materials were carried out to obtain the stress–strain relationship, and the corresponding finite element simulations were conducted to obtain the relationship between the mesh size and failure strain. The applicability of three failure criteria, EPS, BWH, and RTCL, was compared in the simulation of this type of compression structure, and the influence of mesh sizes on the deformation mode and structural resistance of the cruciform structure was studied. Additionally, the paper discusses the influence of friction coefficients and collision positions on the structural response.

2. Experiments of the Cruciform Structure

2.1. Specimen

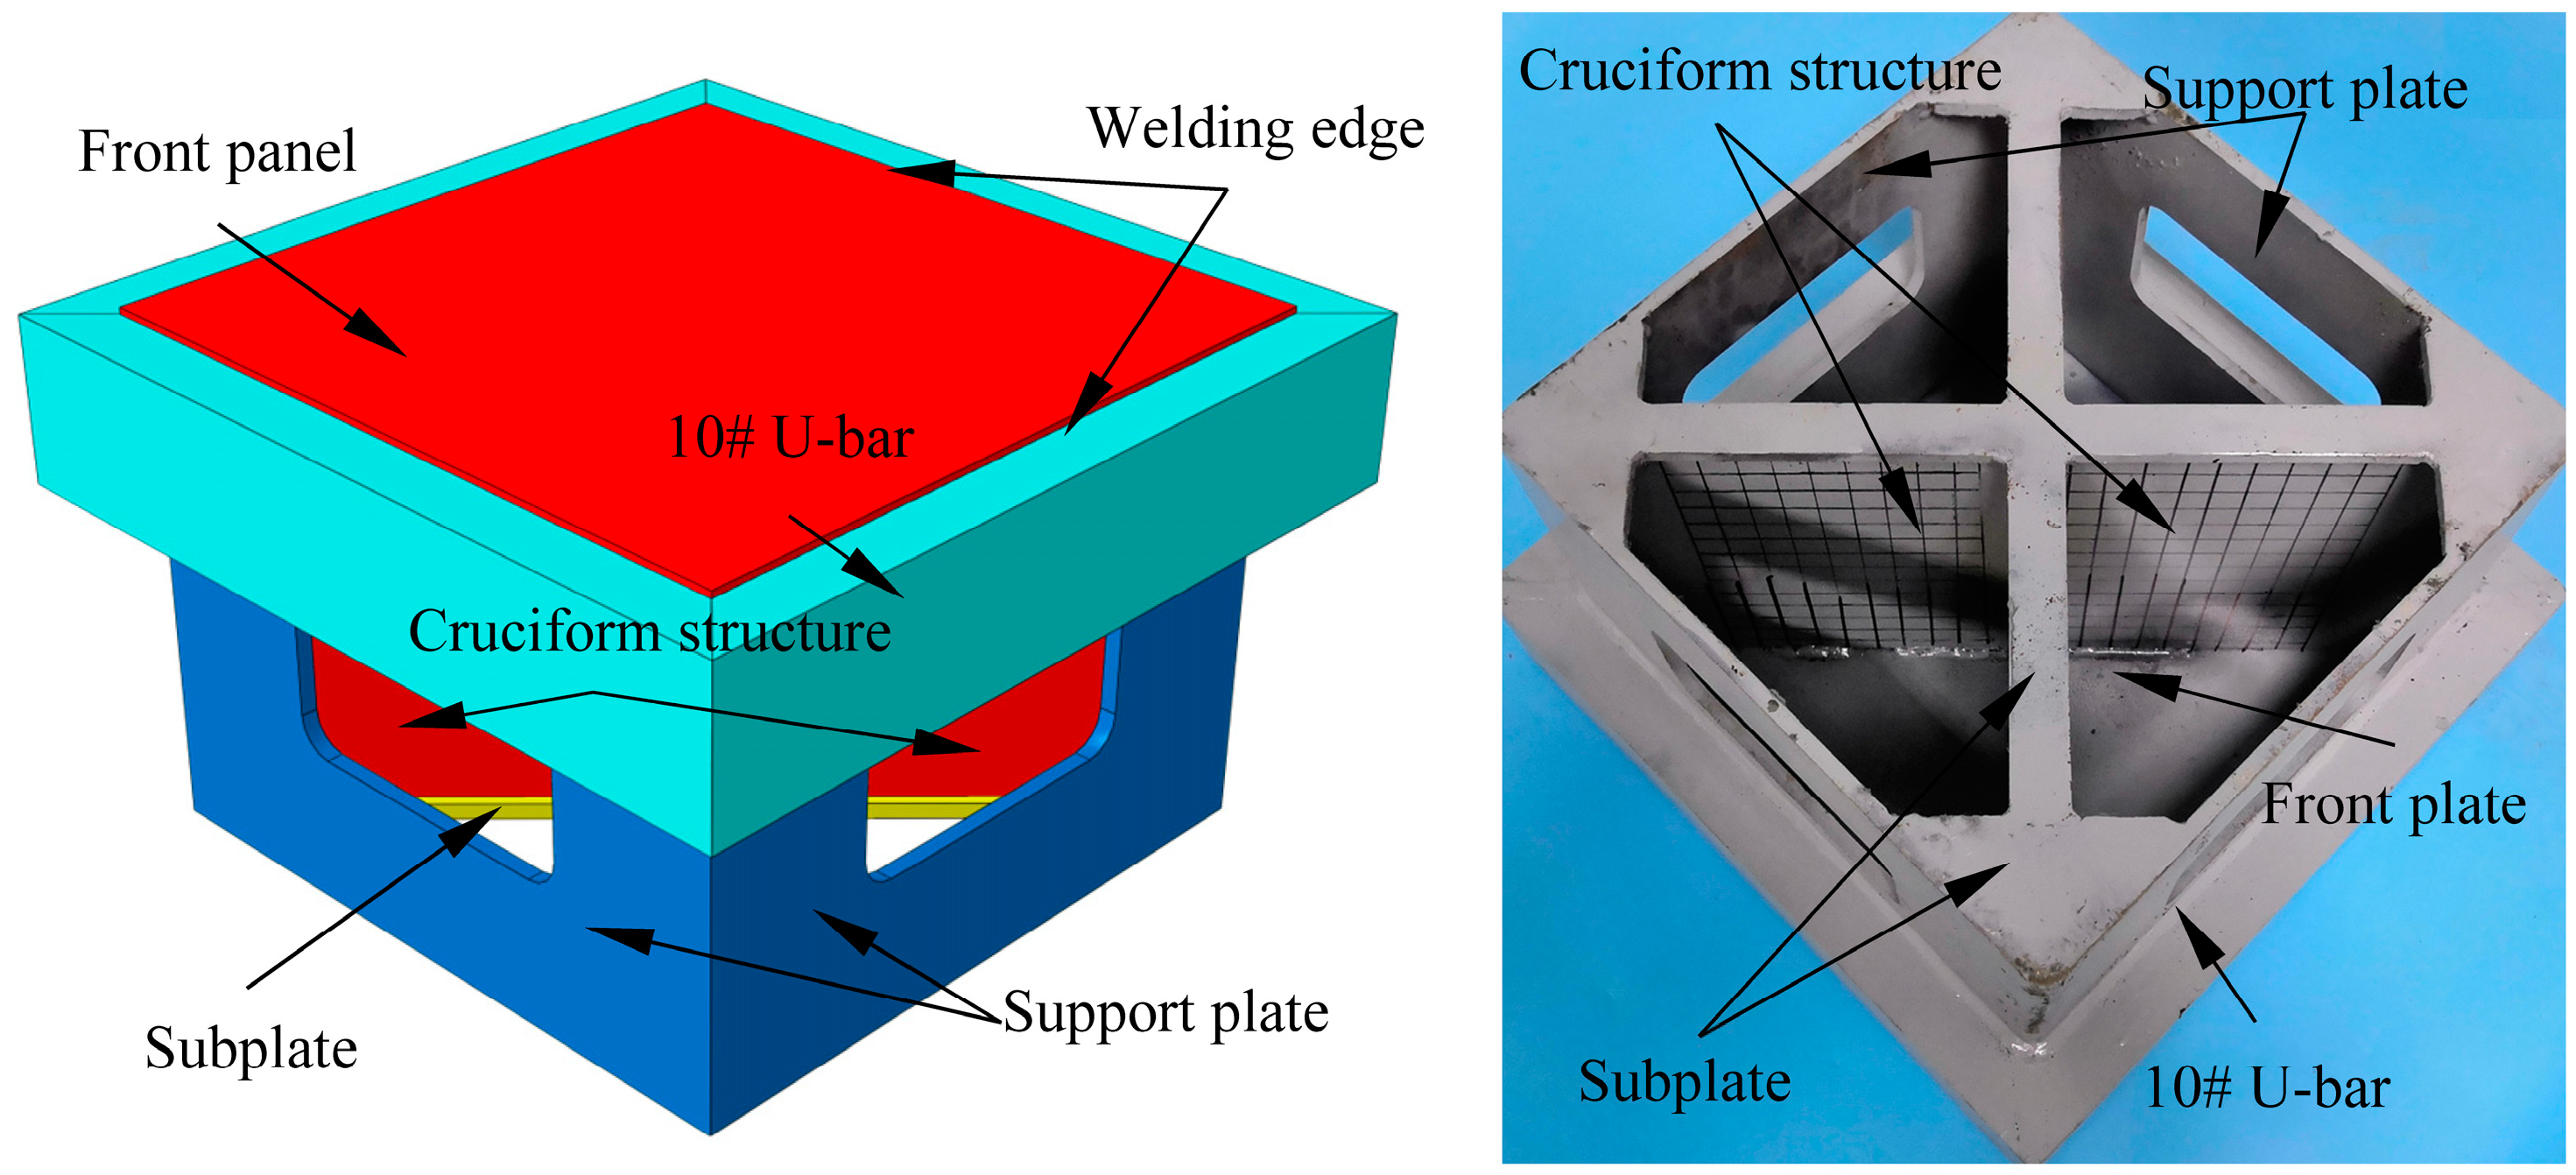
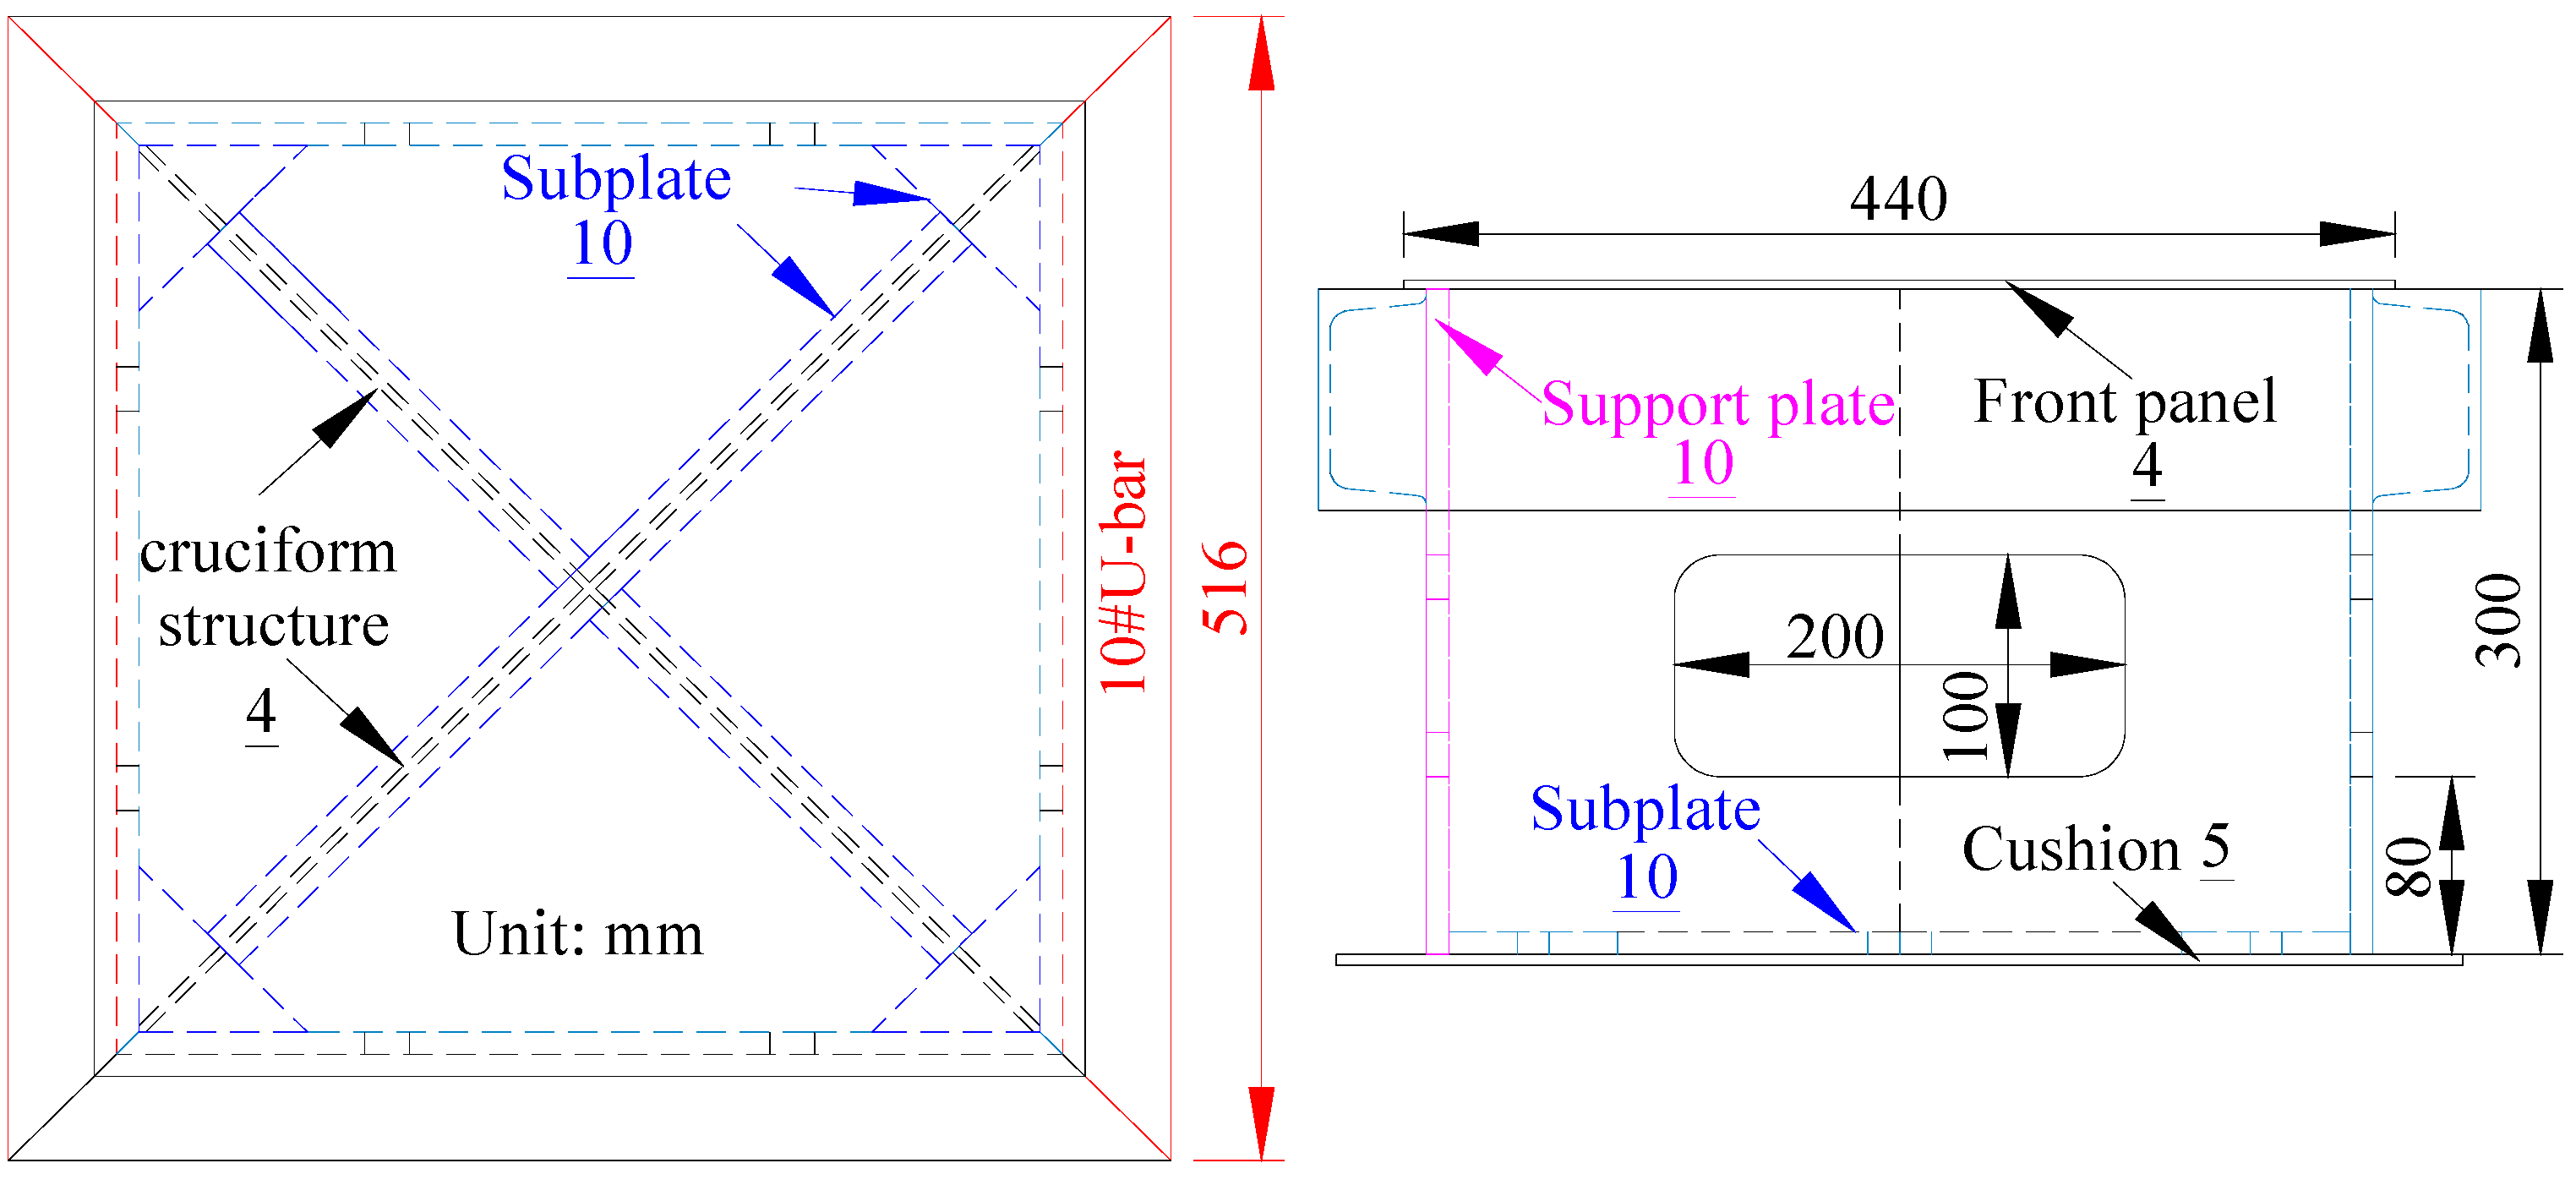
To investigate the dynamic and quasi-static responses of a cruciform structure subjected to in-plane loads, reduced-scale test specimens were designed and manufactured. This structure is a simplified version of the typical double-hull structure, as shown in Figure 2. The cruciform structure comprises four 4 mm thick steel plates welded together. A front panel is also welded onto the cruciform structure, similar to the hull shell. Additionally, four support plates with lightning holes are welded around the cruciform structure, forming a frame that is in contact with the front panel. To prevent the frame from collapsing when subjected to in-plane loads, four 10# U-bars are welded around the top of the frame, with the sides of the square front panel welded onto the sides of the U-bars. The plate thicknesses of the main portion of the specimen are shown in Figure 3. The entire specimen is constructed from mild steel, and silver-gray paint is sprayed on it. Finally, a grid with a length of 20 mm is drawn on both the cruciform structure and front panel to observe the extent of deformation and degree of damage.

2.2. Quasi-Static Indentation Test Set-Up

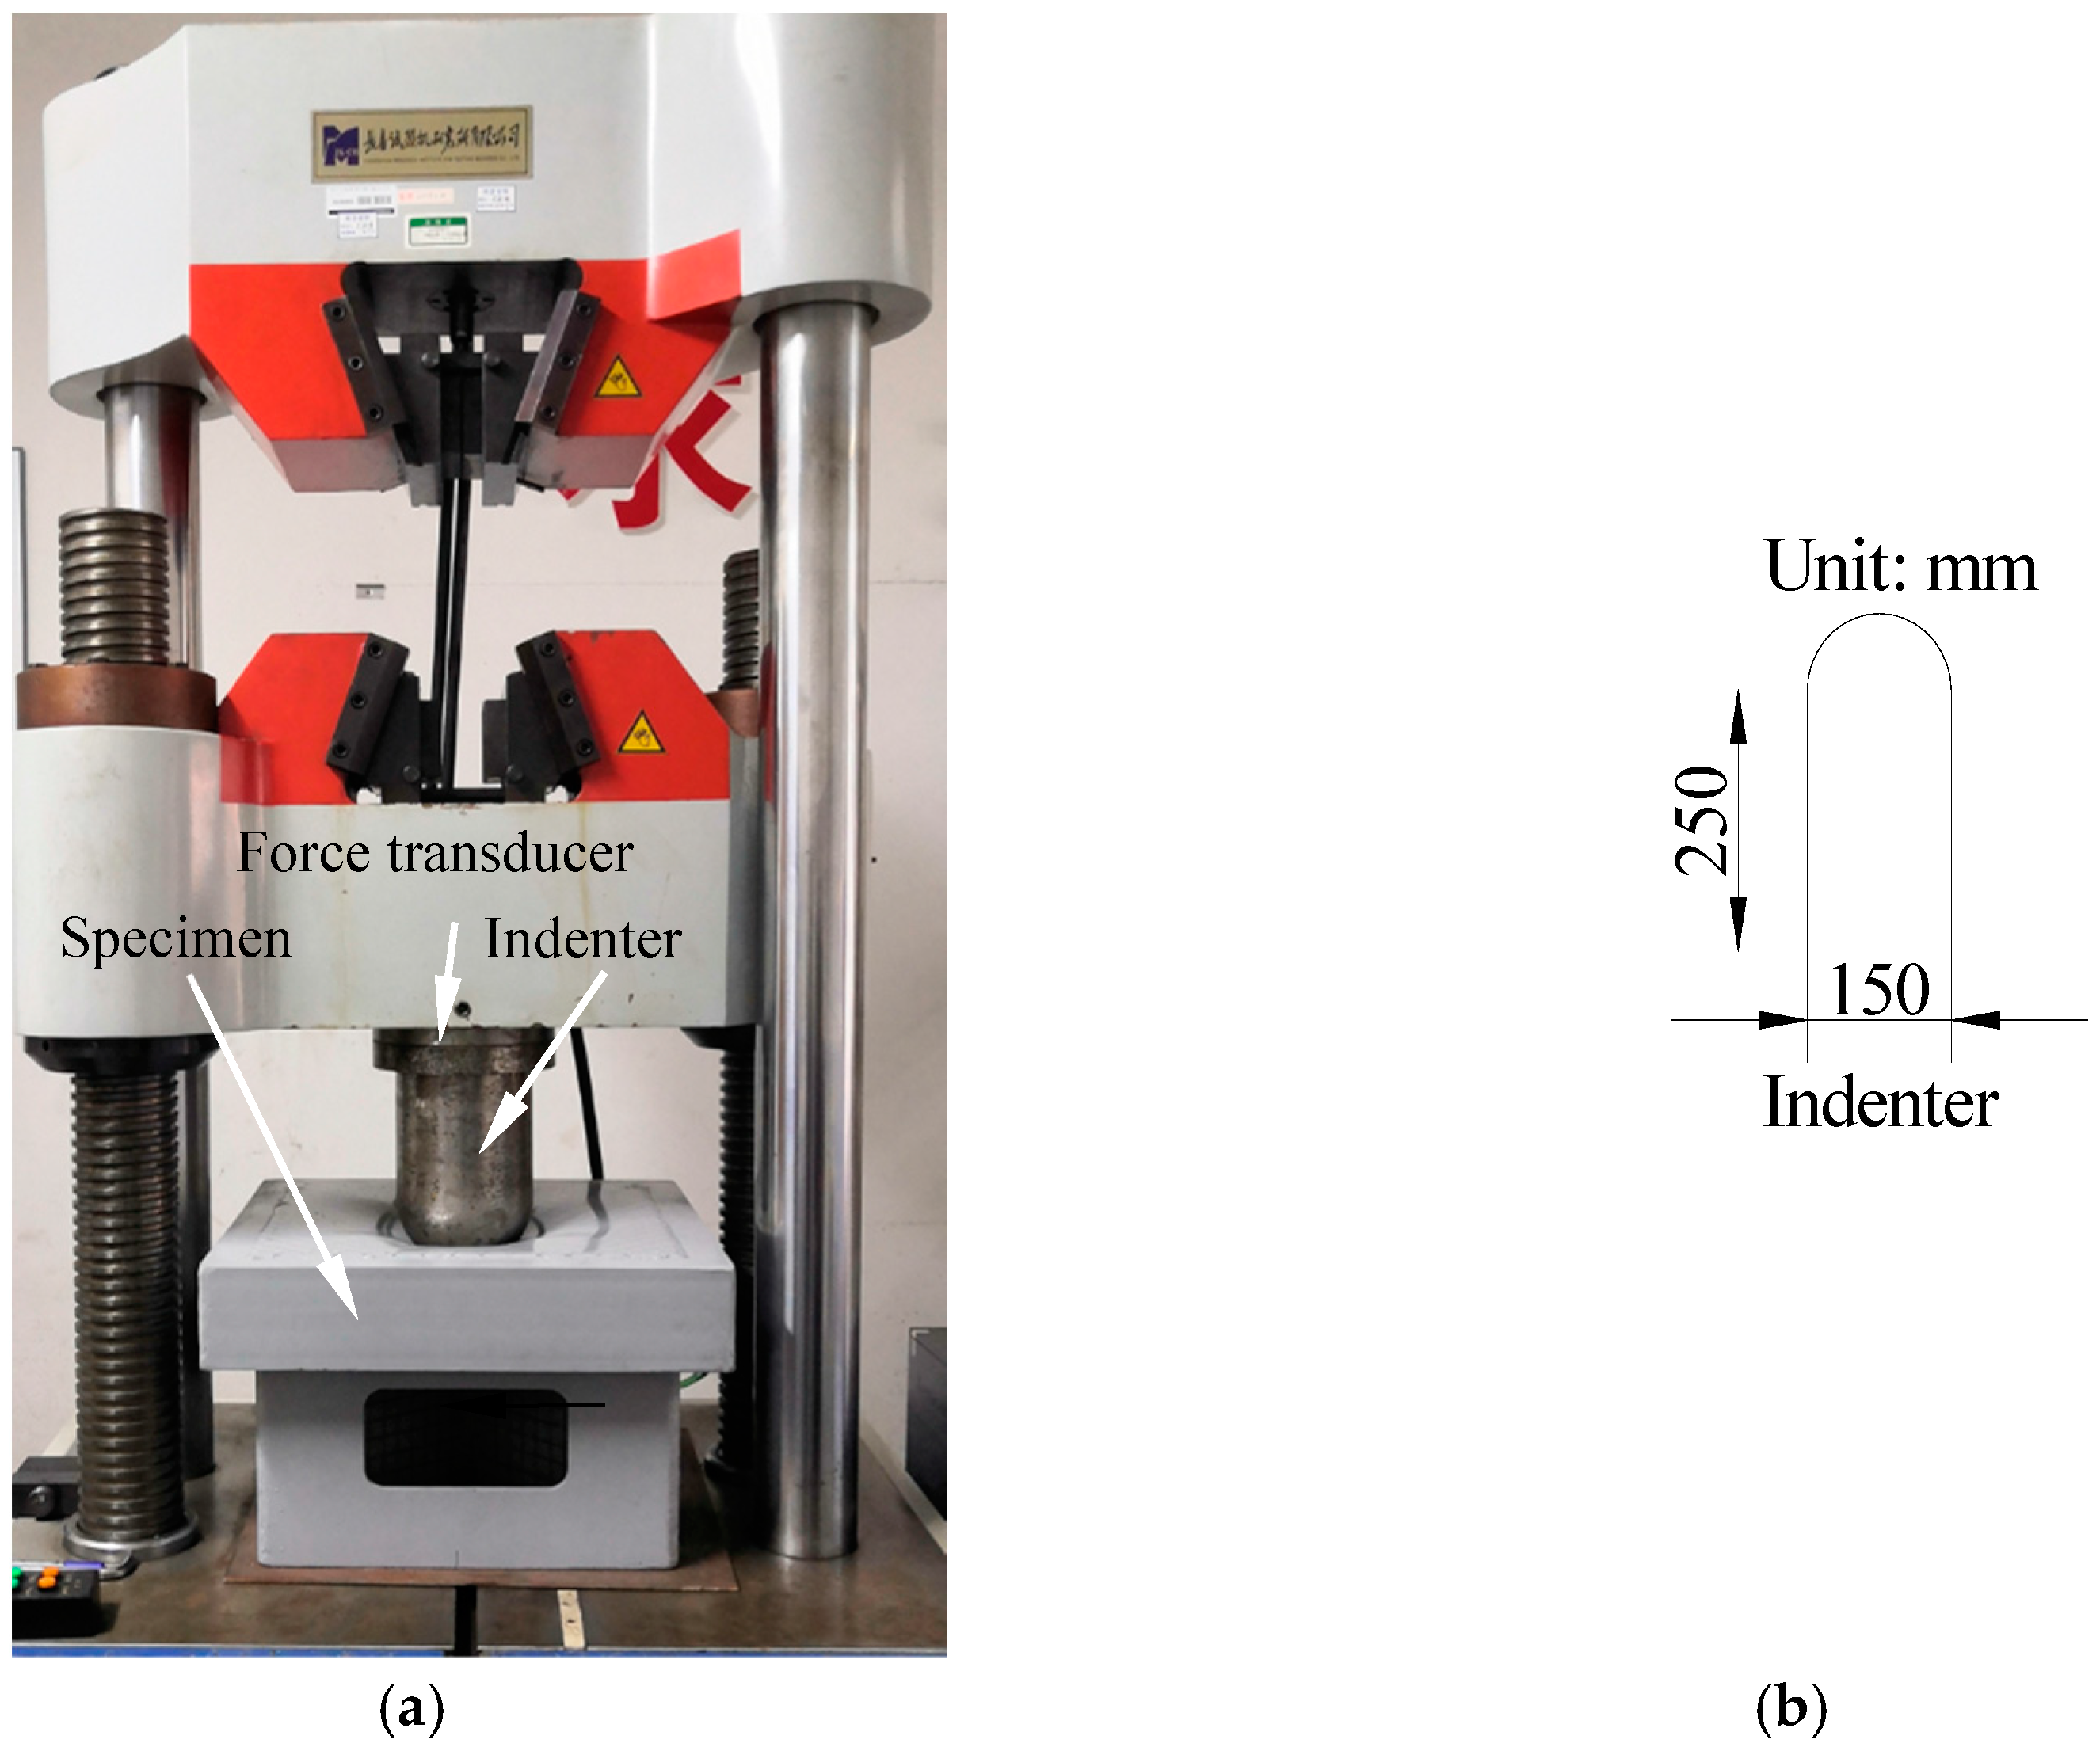
The tests were conducted at the Mechanics Lab at Jiangsu University of Science and Technology. The experiment utilized an electro-hydraulic servo universal testing machine (YNS1000), as depicted in Figure 4a, which is capable of imposing a 1000 kN load on the specimen being tested, with a maximum stroke of 100 mm of the indenter. A force transducer was installed at the end of the indenter to measure the applied force, while the dimensions of the indenter are displayed in Figure 4b. The indenter’s contact point with the specimen is hemispherical, and it is composed of GCr15 material, which has high hardness. The testing system connected to the machine can record the displacement of the indenter and the contact force.
To begin the test, the specimen is positioned on the test bed and the center of the grid on the front panel is aligned with the axis of the indenter. The indenter is lowered using the testing machine and the displacement and load data are set to zero once the indenter makes contact with the front panel. Then, the indenter is moved downward at a constant speed of 10 mm/min while acquiring displacement and force data at a frequency of 20 Hz. The load profile was monitored in real time during the test. Due to the height of the specimen, the effective downward distance of the indenter is 65 mm, and the test is stopped when the displacement of the hammer head reaches the lowest limit.

2.3. Falling Weight Impact Test

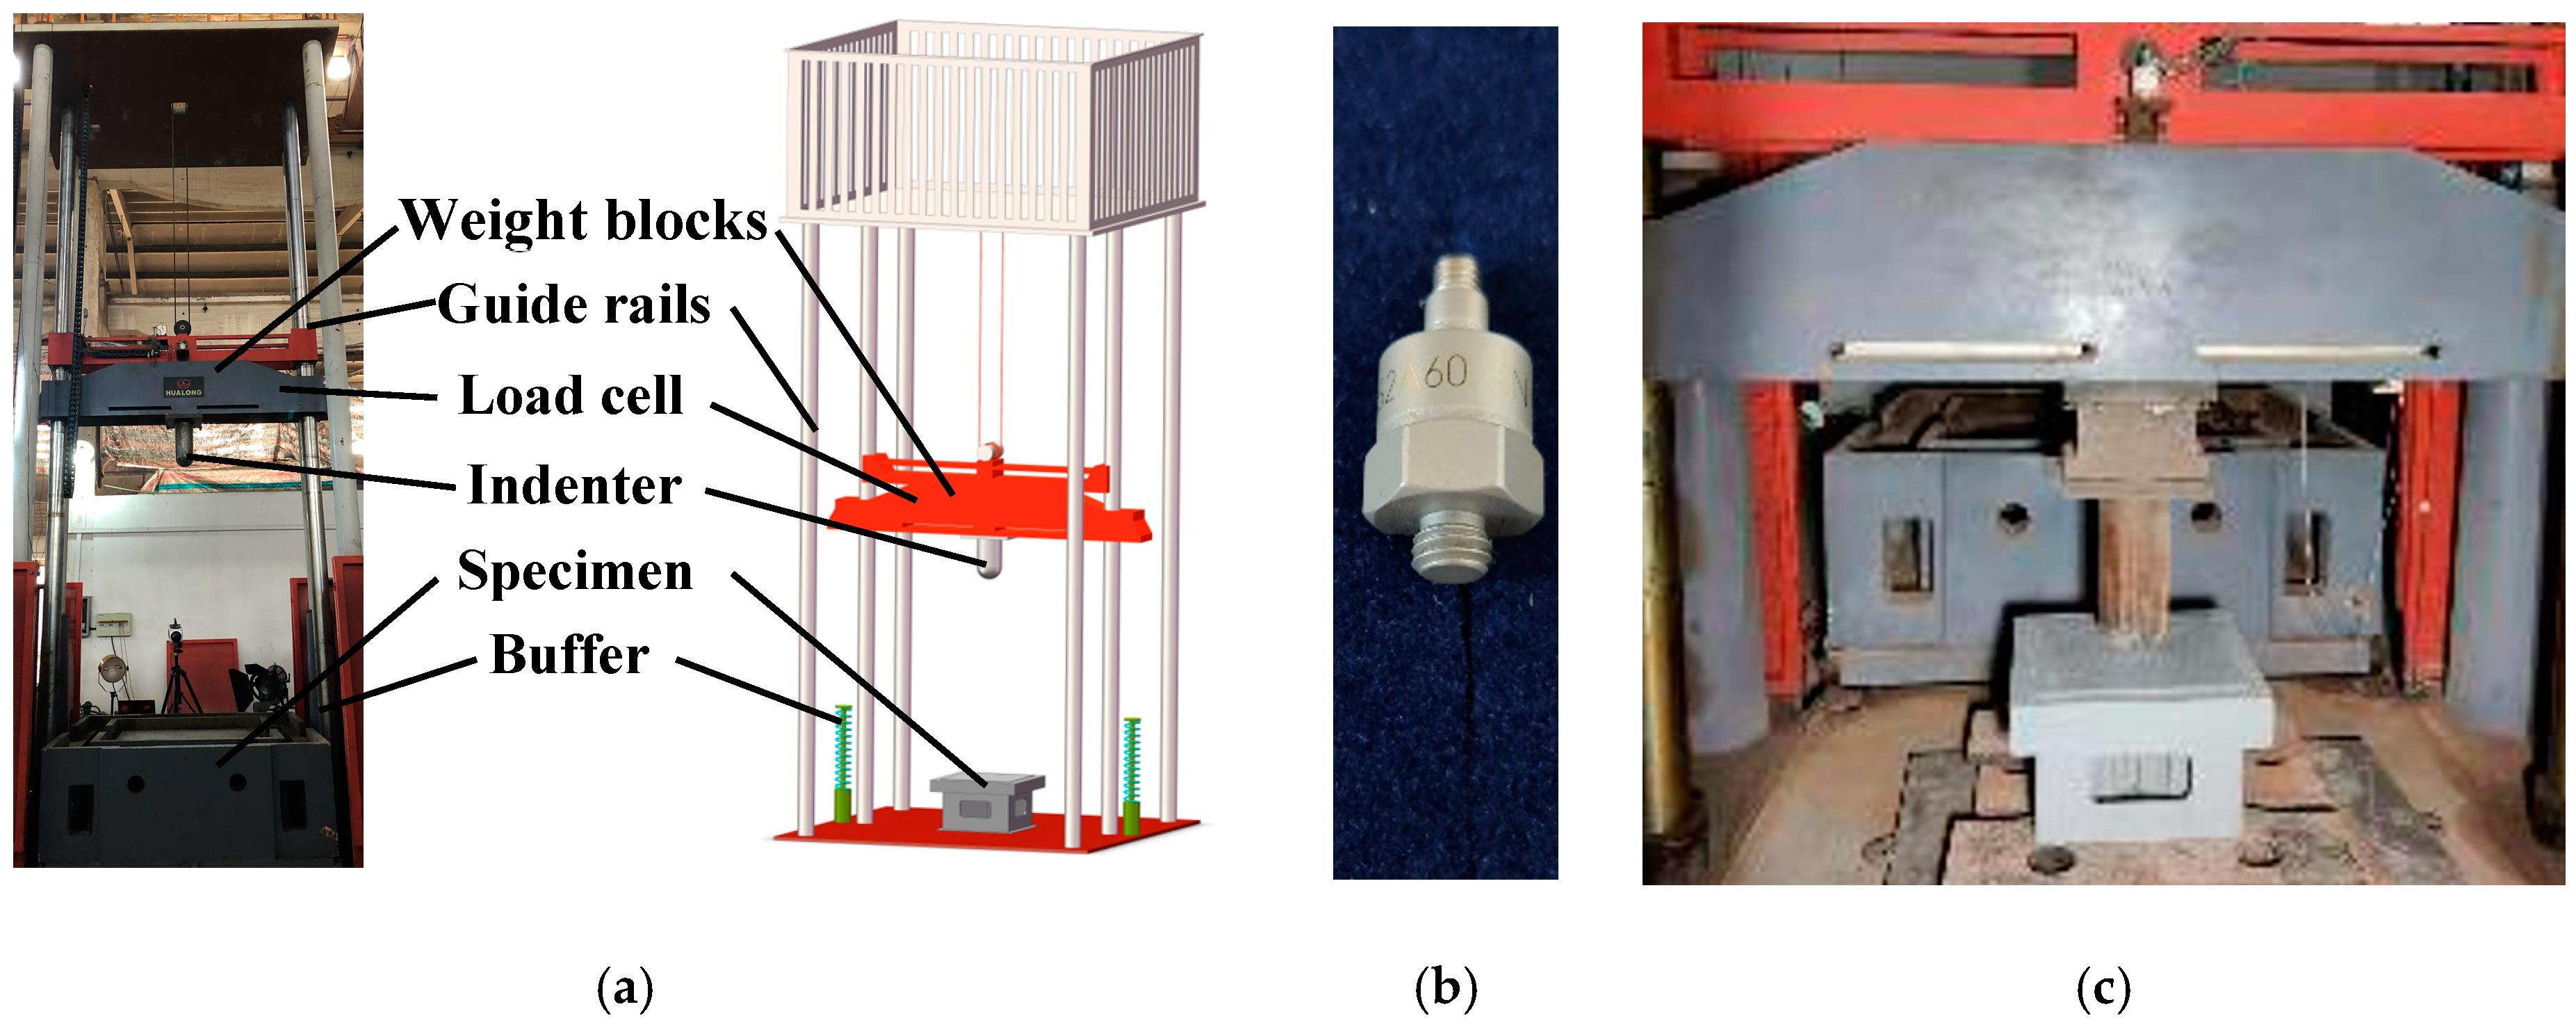
As shown in Figure 5a, the Falling Weight Impact Tester can be utilized to conduct impact tests and acquire the dynamic response and deformation characteristics of the cruciform structure. The indenter has a maximum lifting height of 3.7 m, enabling a maximum impact speed of 8.5 m/s, which can simulate most ship collision scenarios. The falling weight has a maximum mass of 1.35 tons and a designed maximum gravitational potential energy of 50 kilojoules. The acceleration sensor in Figure 5b is fixed on the main body of the falling weight to measure acceleration data, while a laser rangefinder is placed directly above the measuring point to record the displacement of the indenter during the experiment. A hemispherical indenter with the same size as used in the quasi-static test is utilized to compare the deformation of the cruciform structure under the two scenarios. The indenter is lifted to 0.5 m and 3 m, and the impact velocities are 3.13 m/s and 7.67 m/s, respectively. The mass of the falling weight is a maximum value of 1.35 tons. Both sensors in the test system start recording at the same time before the falling weight is released, with an acquisition frequency of 20 kHz.

2.4. Experimental Results and Comparison

2.4.1. Quasi-Static Test Results

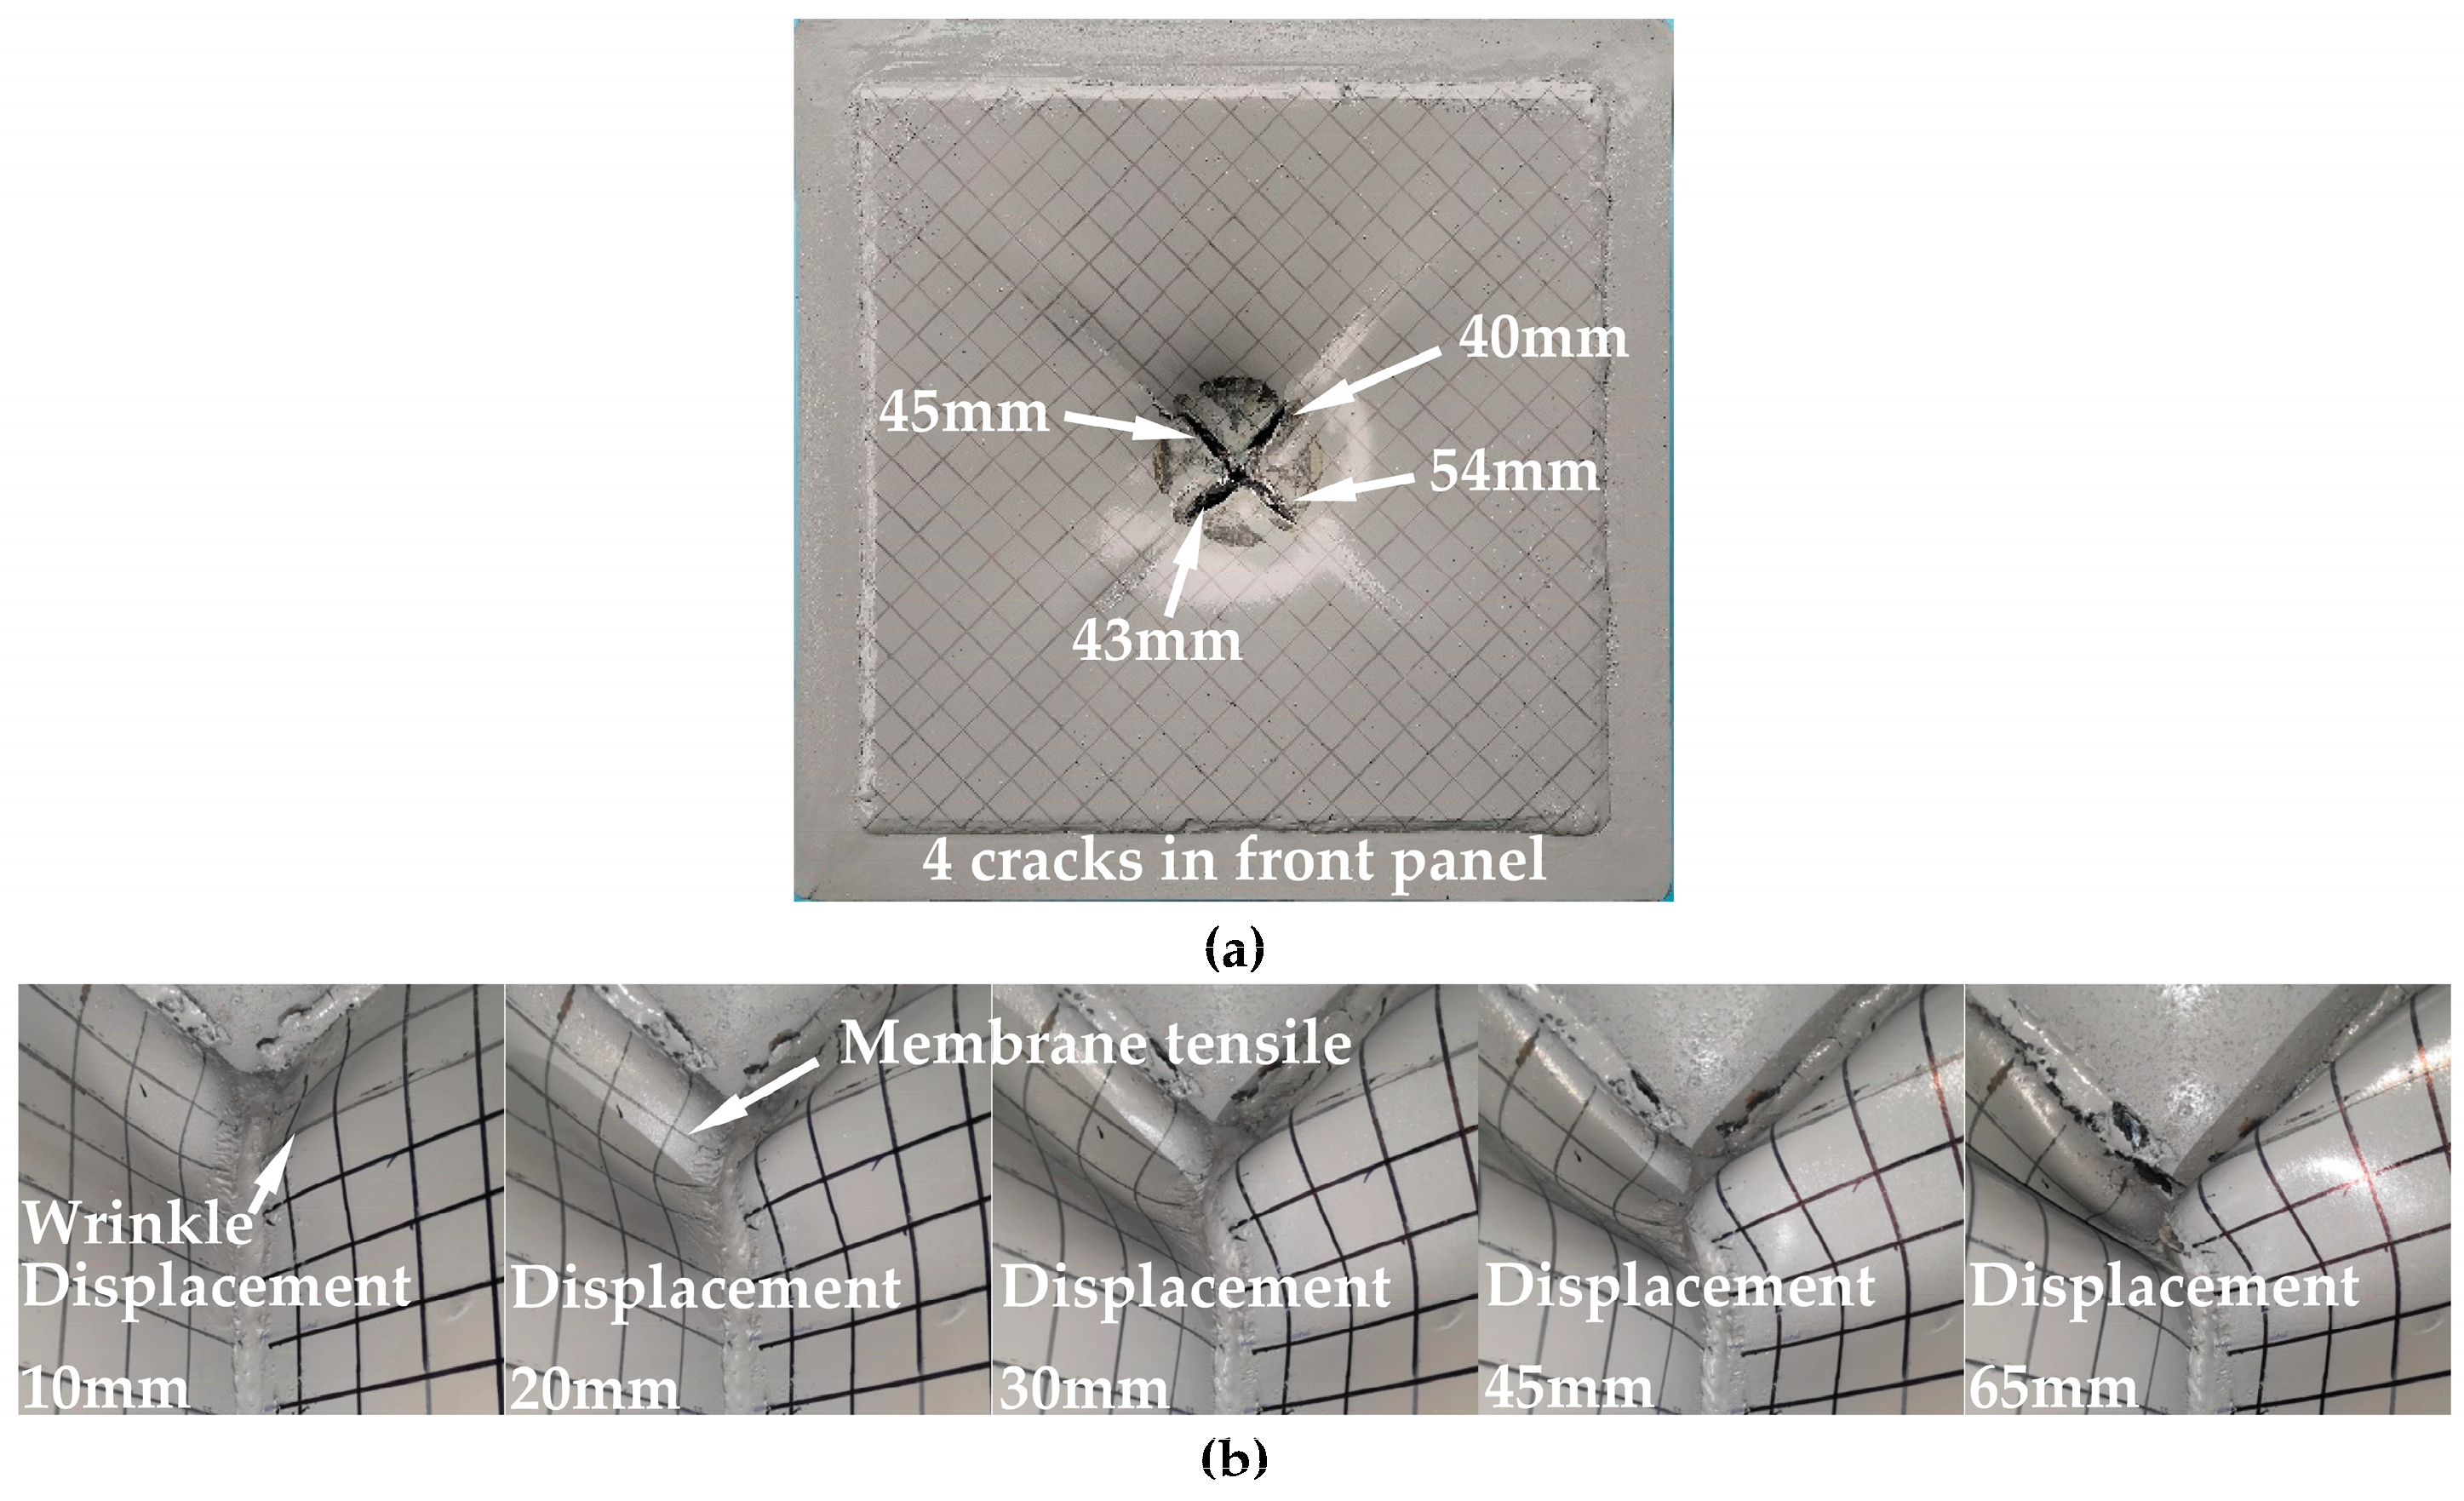
The deformation of the front panel and cruciform structure is displayed in Figure 6a. The peeled paint on the front panel reveals that the contact area between the indenter and the front panel forms a circle with a diameter of 10 cm. The significant deformation is concentrated in the circular area at the center of the indenter with a diameter of 20 cm. The front panel exhibits four cracks, with lengths of 40 mm, 45 mm, 43 mm, and 54 mm, all originating from the edge of the weld.
Figure 6b shows the deformation process of the cruciform structure in the quasi-static test with indenter displacements of 10 mm, 20 mm, 30 mm, 45 mm, and 65 mm. It can be observed that as the indenter gradually presses down, the cruciform structure starts to bend at the joint of the weld with the front panel. At a distance of about 5 cm from the front panel, the cruciform structure bulges perpendicular to the web girder, and part of this pleat will produce membrane tensile deformation. With the increase in the indenter displacement, the fold on the web girder gradually forms. When the first fold is formed, the length of the fold is about 18 cm, and a crack is produced at the middle connection of the cruciform structure. The deformation direction of the two web girders is the same.
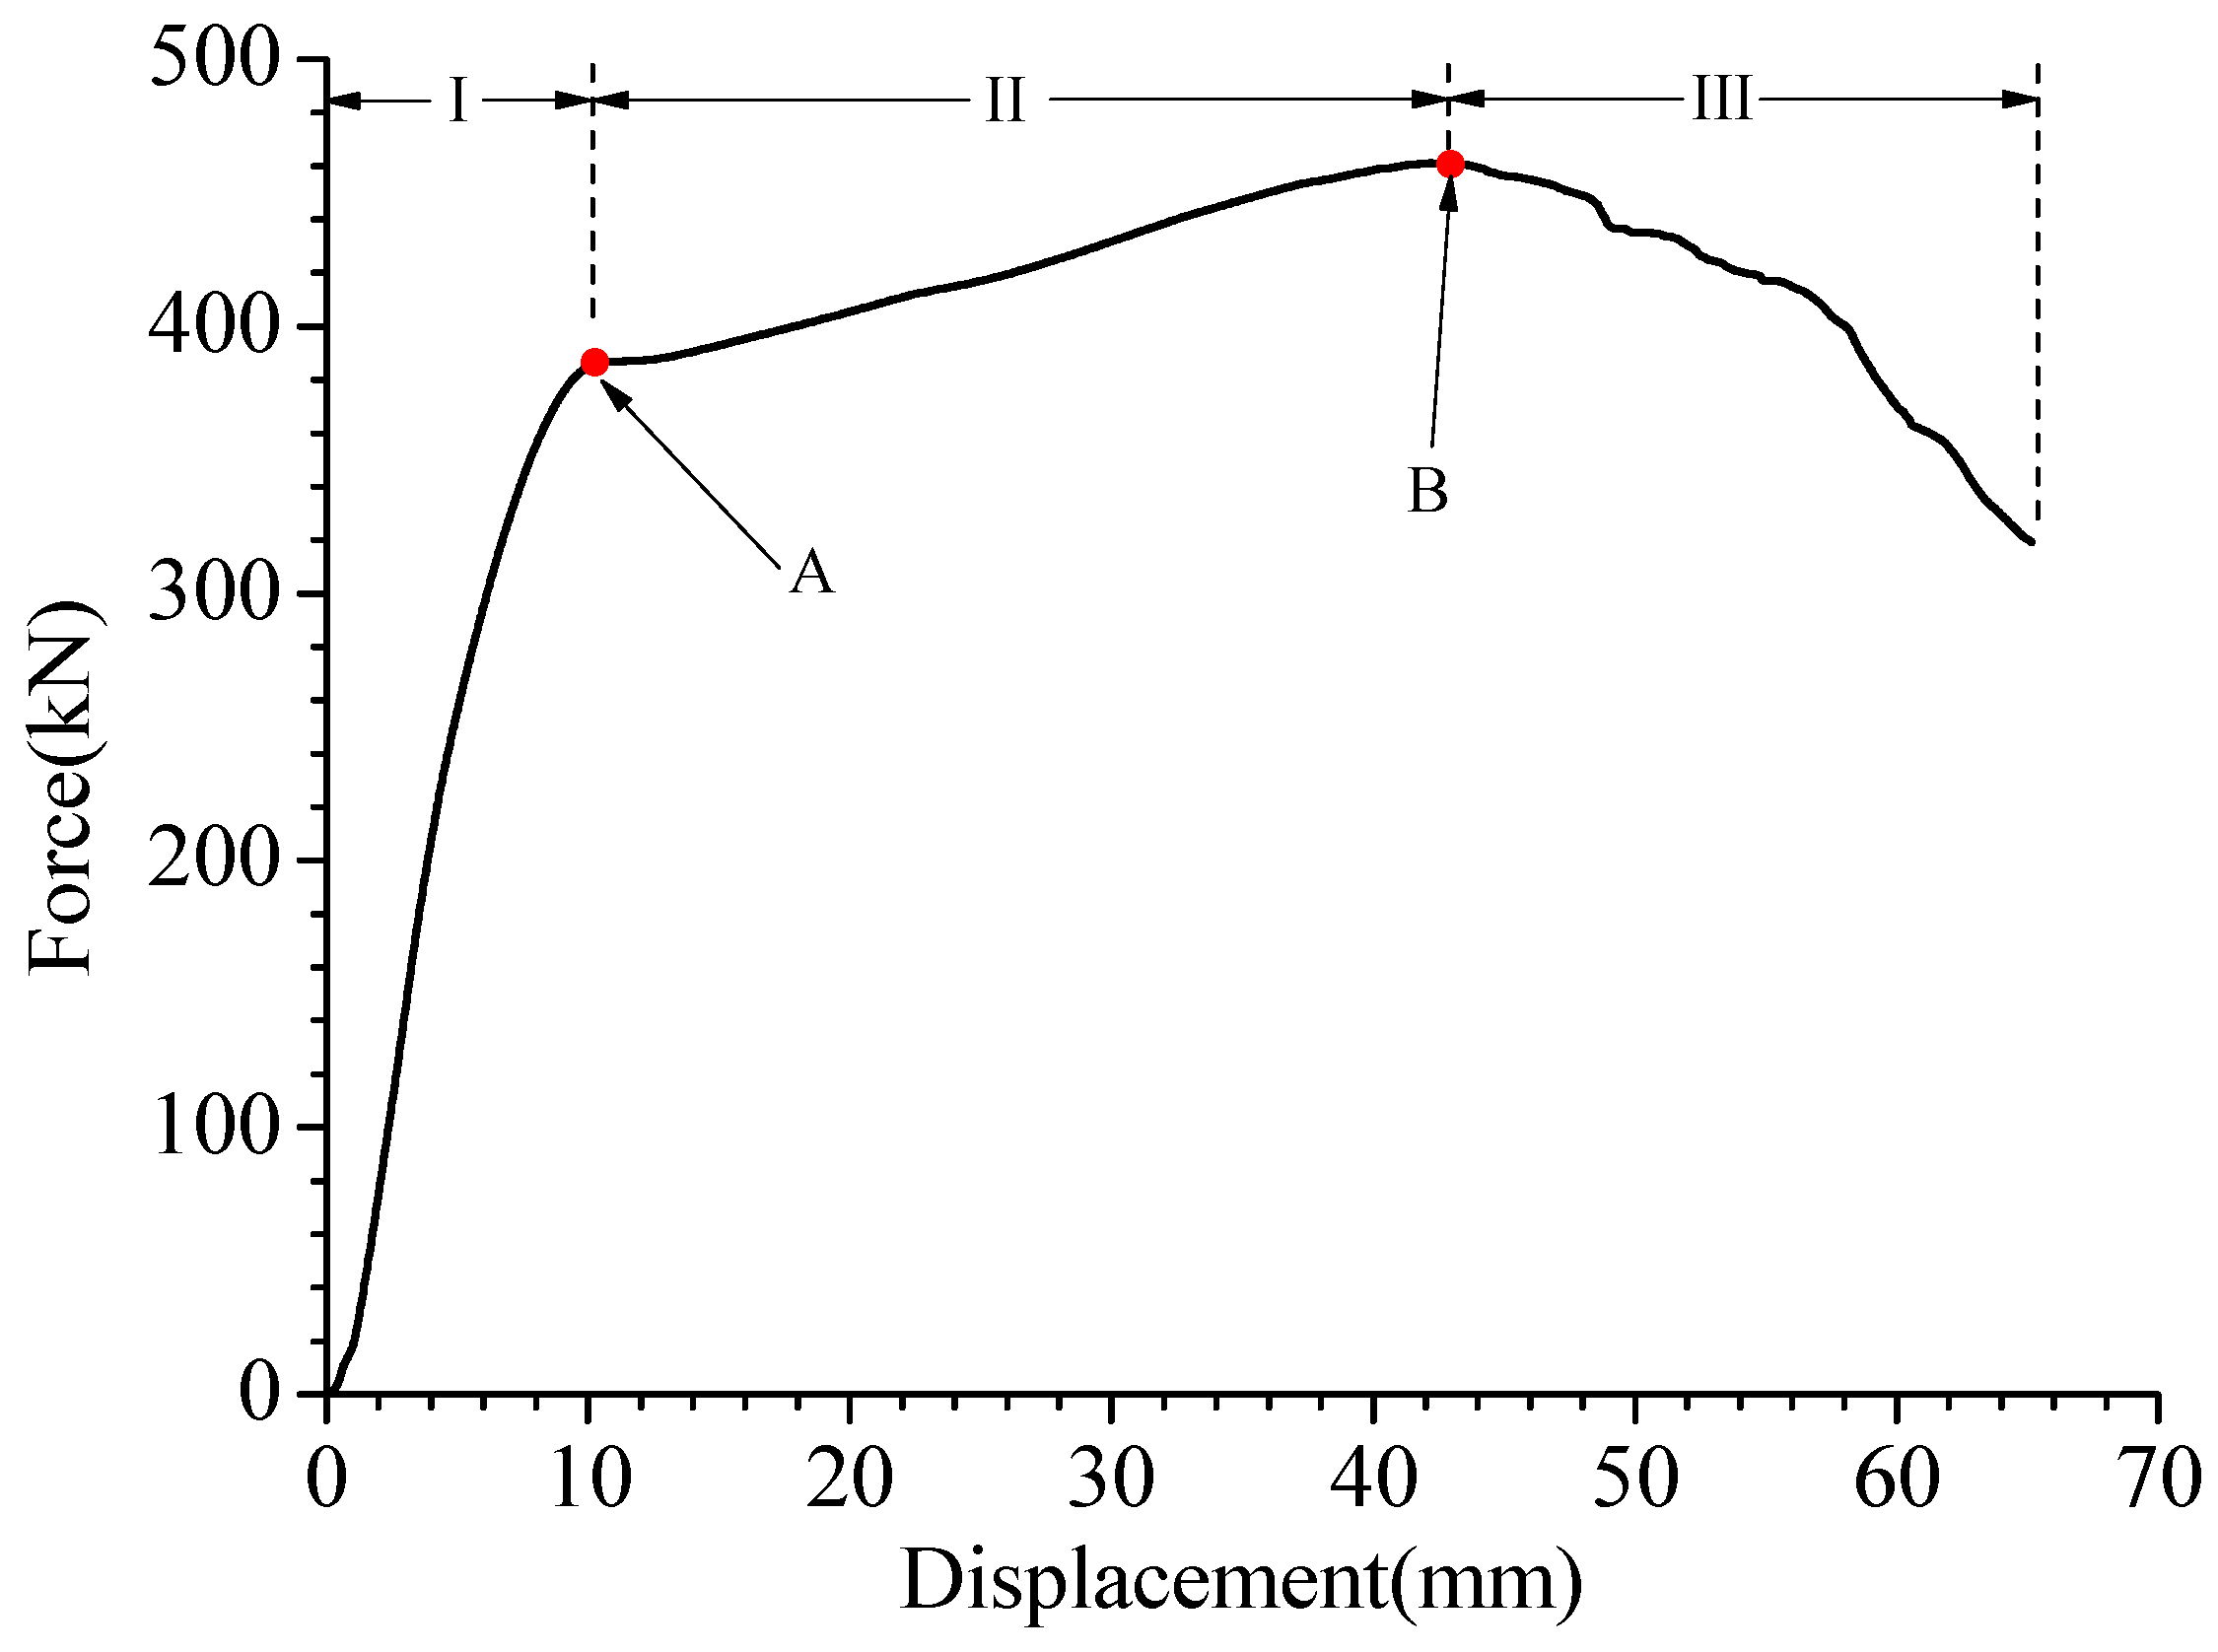
Figure 7 shows the force–indentation relationship in the test. The curve can be divided into three stages according to the sudden change in slope. The initial stage before point “A” is characterized by a rapid rise in reaction force, indicating an increase in the contact area and deformation degree. The sudden decrease in the curve slope at point A indicates the onset of buckling in the cruciform structure. There are two main reasons for the smooth increase in structural resistance in the “II” stage between points A and B in Figure 7. One of them is the increase in the contact area between the hammer head and the specimen and the increase in the deformed structure, which leads to the increase in the structural resistance, and on the other hand, it is due to the membrane tensile deformation of both the upper panel and the cross structure and the gradual increase in the component of the structural resistance along the direction of the load. At point B of the curve, the structural resistance begins to decrease because the front panel of the structure is torn, and the structural resistance gradually decreases with the increase in the crack. The “III” stage of the curve shows a wavy decrease, which is consistent with the characteristics of the gradual tearing of the plate structure.

2.4.2. Falling Weight Impact Test Results

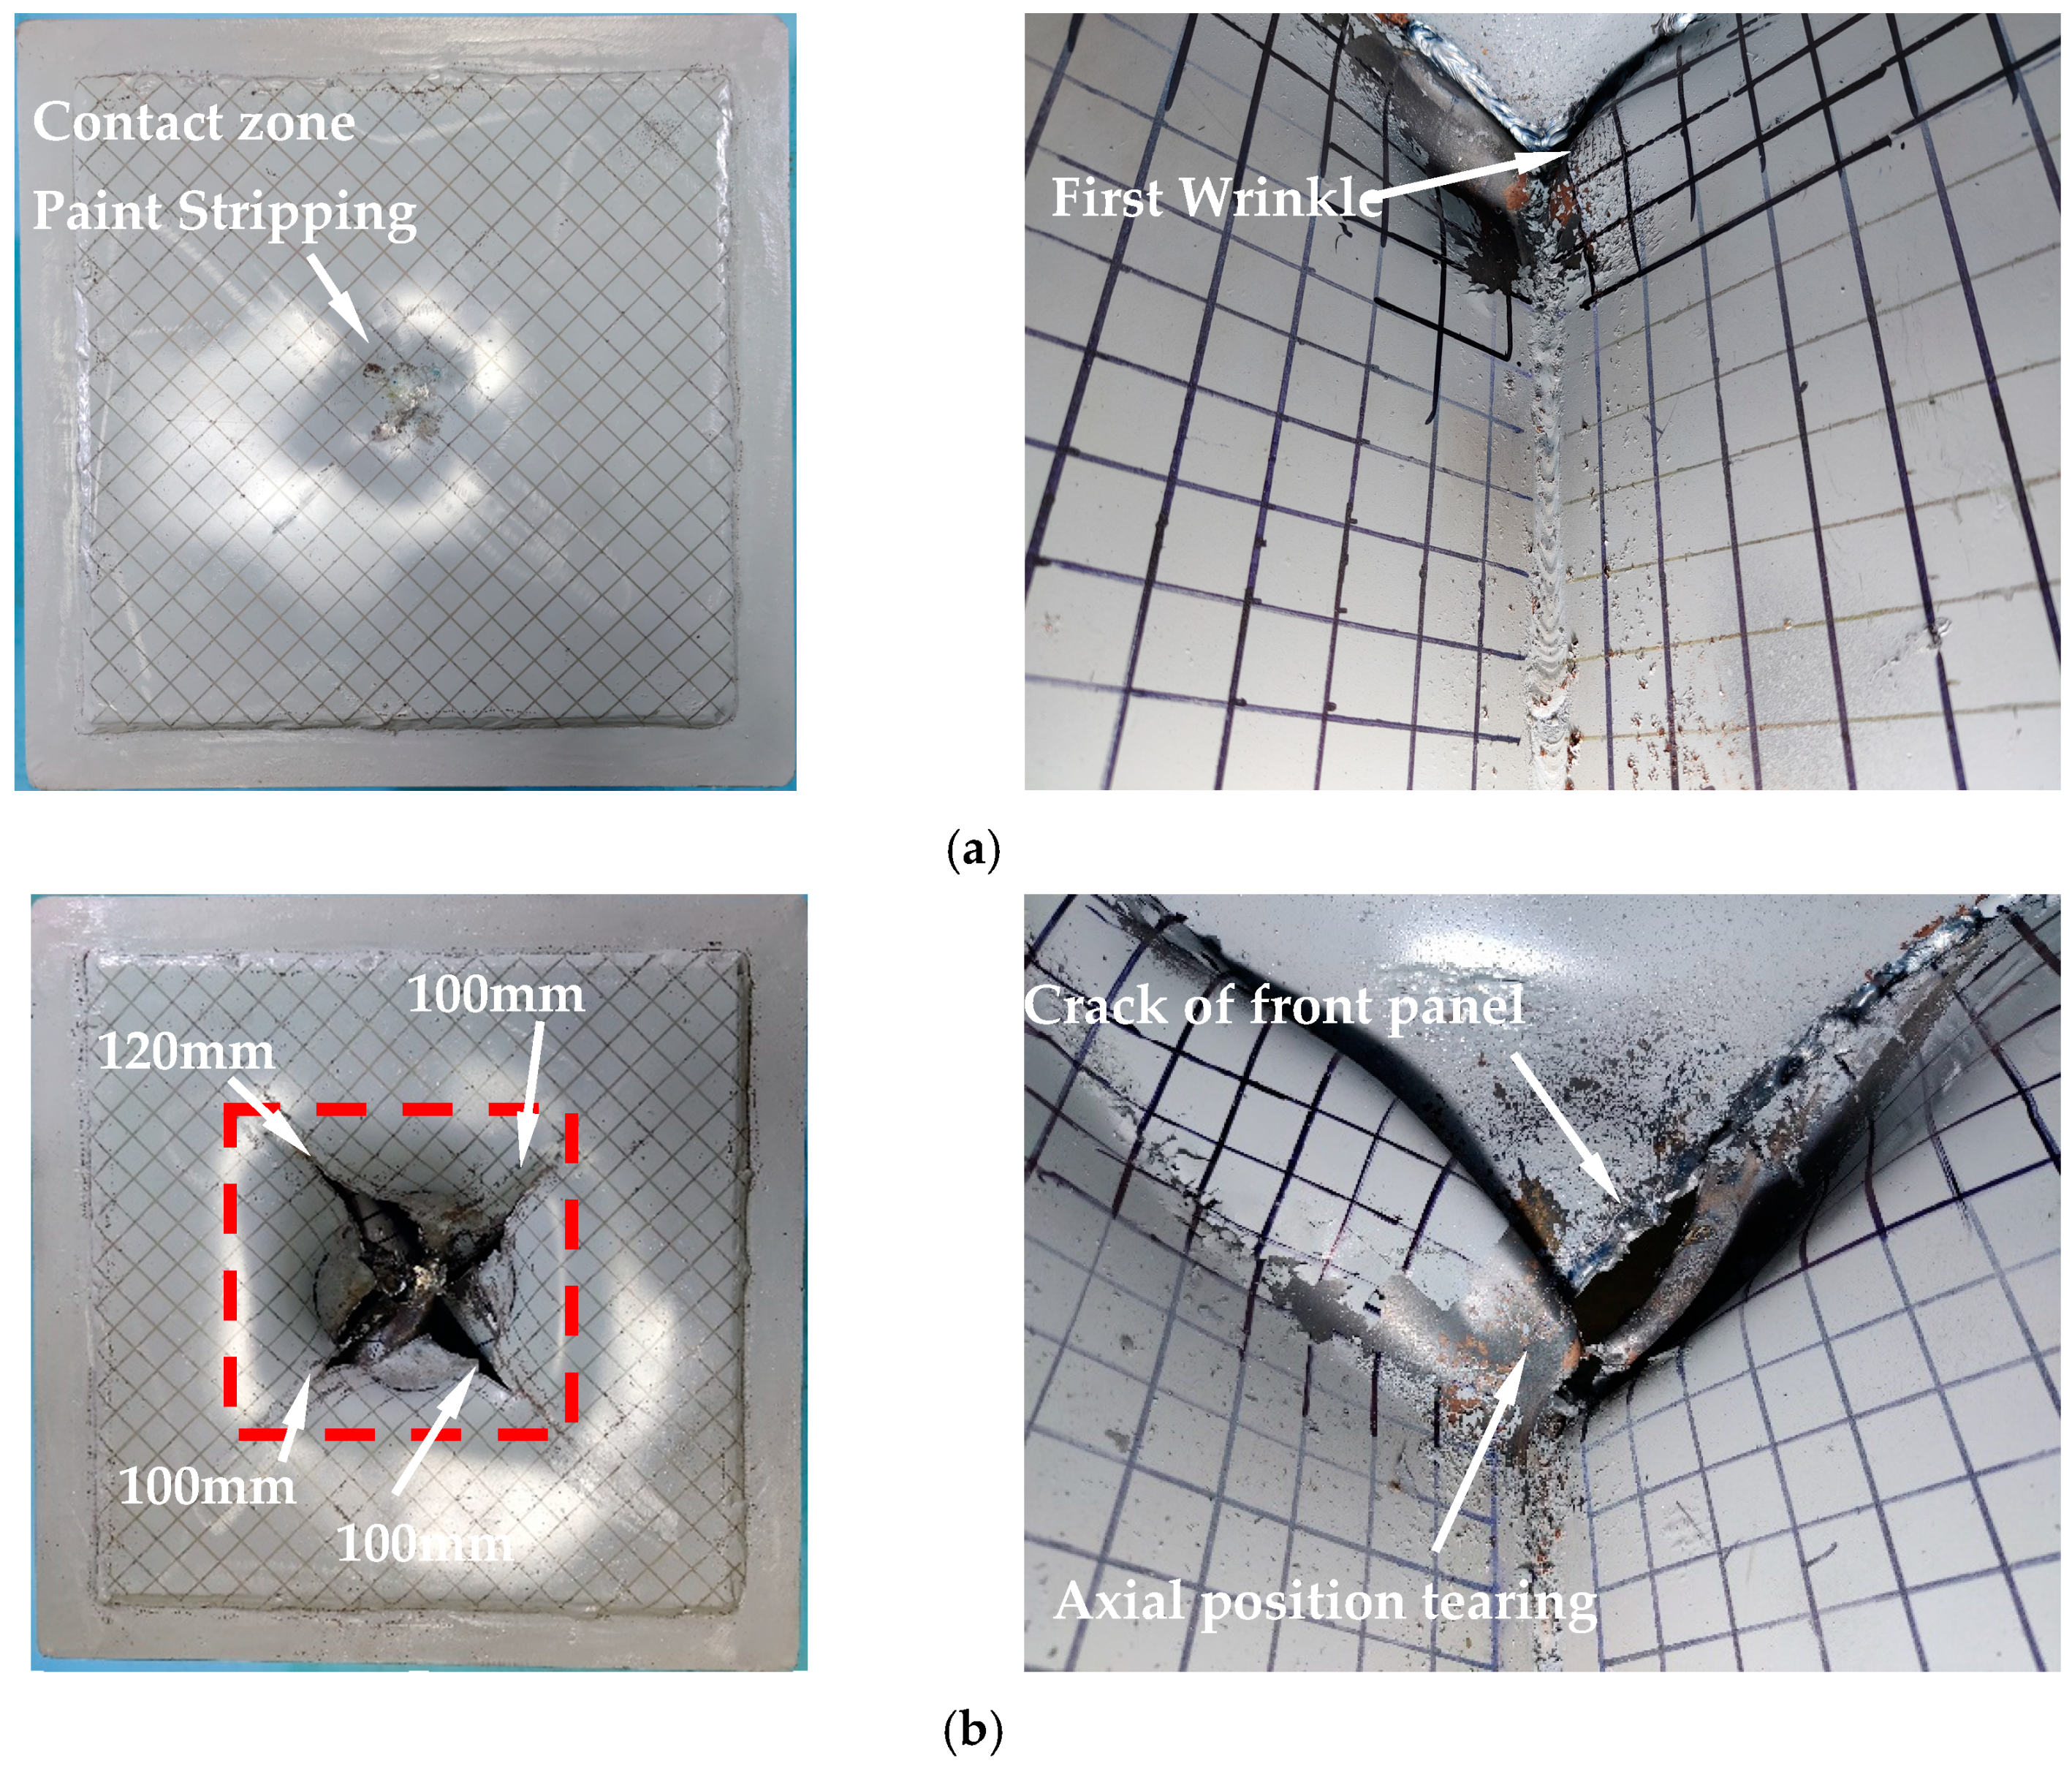
Figure 8 illustrates the deformation of the front panel and cruciform structure under two test conditions. It is evident from the figure that both test specimens experienced significant plastic deformation under the impact of the indenter, which caused severe paint peeling on the structure. In the 0.5 m drop test, the paint wear was concentrated in the contact area between the indenter and the specimen, and the cruciform structure showed obvious folding deformation. The length of the fold in the long side direction of the web girder was four grids, with a length of approximately 80 mm and a height of approximately 30 mm in the axial direction. The structure did not tear. In the 3.0 m drop test, a circular large deformation area was formed on the front panel because the entire indenter had fallen into it. Four cracks were produced along the direction of the web beam, and the length of a single crack was about 120 mm, as per the grid drawn on the front panel. The square front panel was divided into four right-angled triangle areas by the cruciform structure, and the deformation results showed that the triangle produced a fold parallel to the long side. This occurred because the web girder strongly supported the front panel in the axis direction, resulting in a straight fold in the triangle area. The four folds formed a concave deformation in a square area, as shown in the red box in Figure 8. From the damage and deformation of the cruciform structure, it was evident that the web girder forming the cruciform structure had a bulge in the normal direction, and the middle connecting part of the cruciform structure was also torn.
Figure 9 shows the force–indentation curve recorded in both test conditions. The load rose rapidly at the initial stage of the collision, primarily due to compression deformation along the central axis direction since the cruciform structure had not buckled yet. As the indenter moved downward, the cruciform structure buckled and produced fold deformation, causing the structural resistance fluctuation to rise until the rebound of the indenter. In both cases, the load at point A in the curve decreased significantly when the cruciform structure buckled, producing a large degree of fold deformation, and the contact force fluctuated. Since the structure did not tear when the indenter fell from a height of 0.5 m, the load fluctuation rose, and substantial unloading did not occur, decreasing to 0 after the indenter rebounded. However, when the indenter fell from a height of 3 m, the front panel of the specimen and the junction of the web girders had multiple tears, and the force–indentation curve exhibited more loading and unloading at the rear end.

2.4.3. Comparison of Quasi-Static Test and Dynamic Test

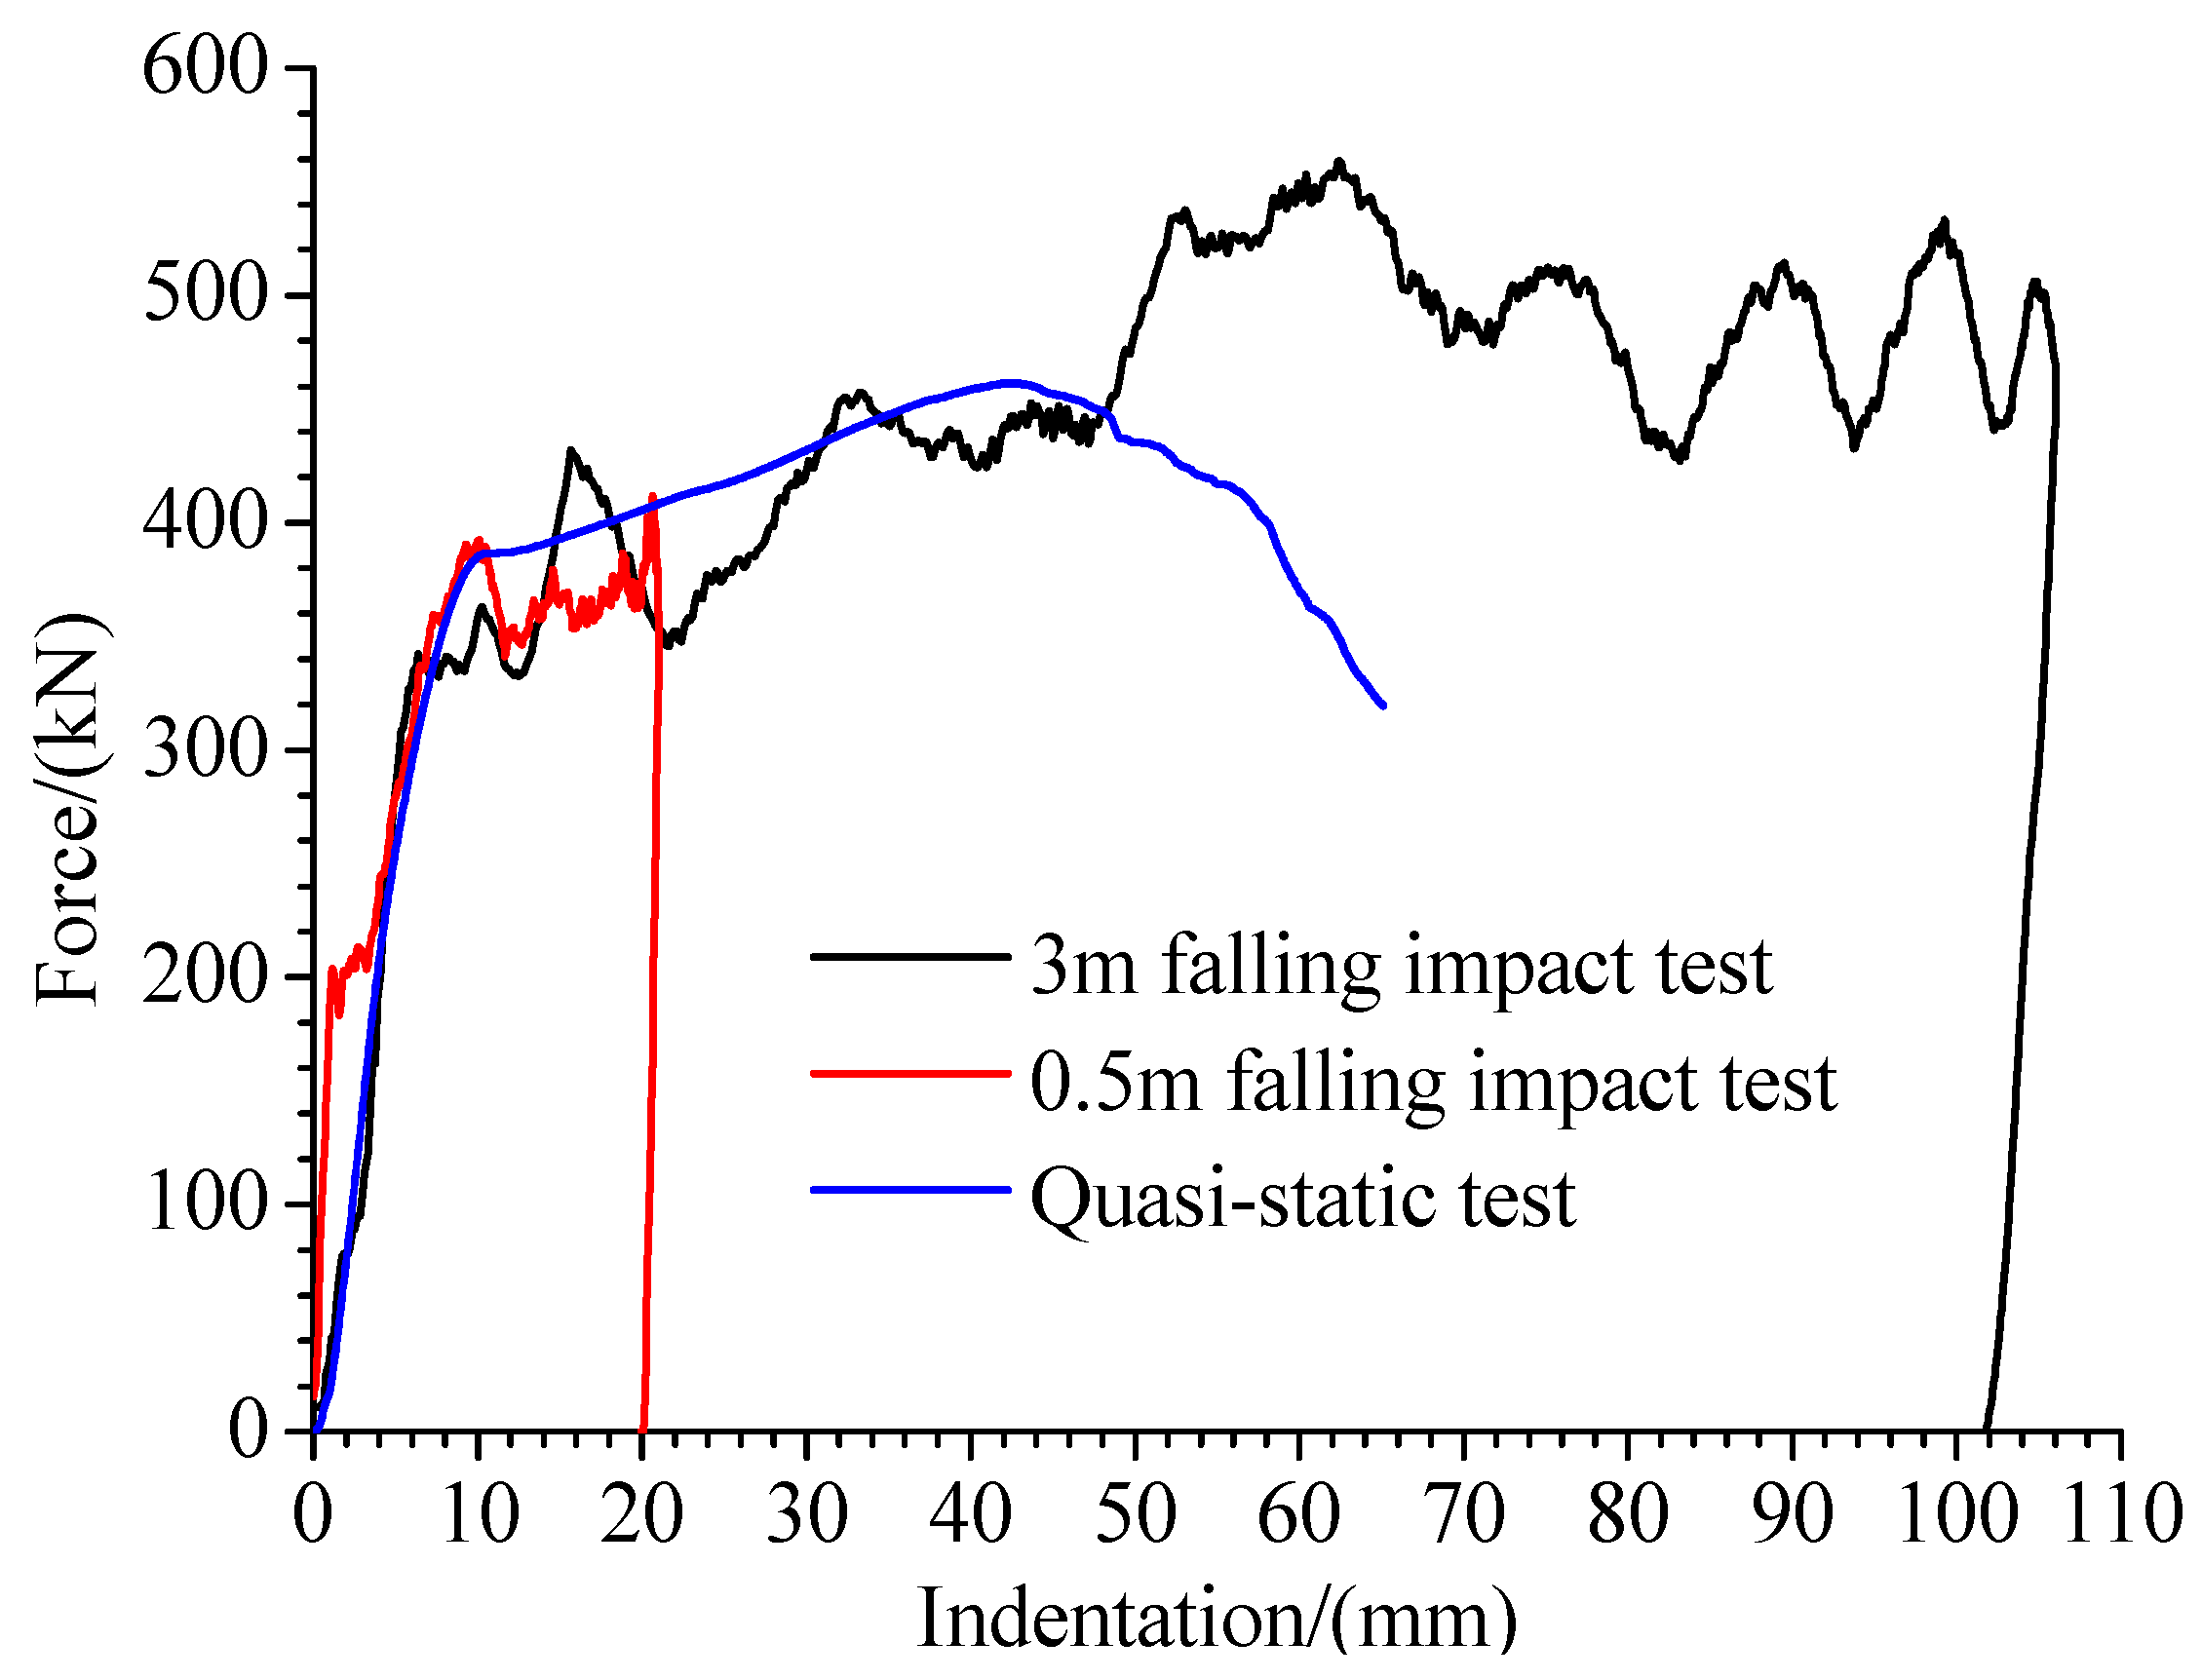
The comparison between Figure 6 and Figure 8 shows that the cruciform structure first undergoes axial compression deformation upon impact. As shown in Figure 10, all three test conditions show a rapid increase in load at this stage. Subsequently, the cruciform structure buckles, producing wrinkling deformation, and the rate of increase in the impact load curve is significantly reduced. The first collision peak value is relatively high in the 3 m falling condition, primarily due to the structural inertia, resulting in a delayed buckling of the cruciform structure. During the initial stage of collision, when the displacement of the indenter is small, the fold deformation range is also small. In dynamic collision scenarios, the length of the cruciform structure fold deformation area along the web girder’s direction is smaller than in quasi-static conditions. As the indenter descends, the degree of fold deformation increases, and the length along the direction of the web girder gradually increases as well. The height of the fold in the axial direction at the initial stage of collision is similar to that after the fold is flattened. Once the indenter moves to a certain extent, the front panel of the specimen tears, and the panel’s failure to support the cruciform structure results in tear deformation in the direction of the cruciform structure axis. In the falling weight impact test, the load curve exhibits clear dynamic fluctuation.

3. Failure Criteria

With the development of computer performance, the finite element method has become an important tool for assessing the safety of engineering structures. The failure criterion is a judgment method for assessing whether a unit produces damage in finite element calculations. For the damage to the structure during collision stranding, the selection of an appropriate failure criterion is a key factor to ensure that the numerical simulation results are reasonable and accurate. The following failure criteria are commonly used in this field:

3.1. EPS Criterion

The EPS failure criterion posits that material failure occurs when the critical value of equivalent plastic strain is reached. Due to its simple definition, this failure criterion was commonly adopted in numerical simulations for ship collision scenarios in the early stage [31].
ε f = ε ¯ c r

3.2. BWH Criterion

The BWH failure criterion was proposed by Alsos and Amdahl [6]. This failure criterion integrates the theoretical necking instability model of Hill [32] and the shear stress criteria of Bressan Williams [33] and transforms them into stress space. When a plate-like structure undergoes significant plastic deformation, local necking will occur at the location where failure is imminent before the plate is damaged. The BWH criterion can be represented as follows:
σ 1 = { 2 K 3 1 + 0.5 β β 2 + β + 1 ( 2 3 ε 1 1 + β β 2 + β + 1 ) n β 0 2 K 3 ( 2 ε 1 3 ) n 1 ( β 2 + β ) 2 β > 0
According to Hill’s criteria, the critical strain ε 1 may be equivalent to the power law coefficient n. The strain ratio β can be expressed as ε ˙ 2 / ε ˙ 1 = ε 2 / ε 1 during the calculation, where the parameters K and n are the hardening coefficient and hardening index, respectively, of the power-law material model σ = K ε n .

3.3. RTCL Criterion

The RTCL failure criterion is a failure criterion for ductile metals based on the equivalent plastic strain damage assessment, taking into account the complete stress triaxiality, proposed by Tornqvist [19], combining the Rice-Tracey criterion [34] and Cockcroft-Latham criterion [35]. It can be expressed as:
f ( T ) = { 0 T 1 / 3 2 1 + T 12 27 T 2 3 T + 12 27 T 2 1 / 3 T 1 / 3 1 1.65 exp ( 3 / 2 T ) T 1 / 3
D R T C L = 1 ε ¯ c r f ( T ) d ε
The parameter D R T C L represents the cumulative damage of the element, and when the cumulative damage reaches 1, the element reaches the failure condition and undergoes damage. The parameter ε ¯ c r represents the failure strain, which usually exhibits mesh sensitivity. The parameter T denotes the stress triaxiality, whose value is hydrostatic stress divided by the equivalent stress and is dimensionless.

4. Numerical Simulation Setup

4.1. True Stress–Strain Relationship

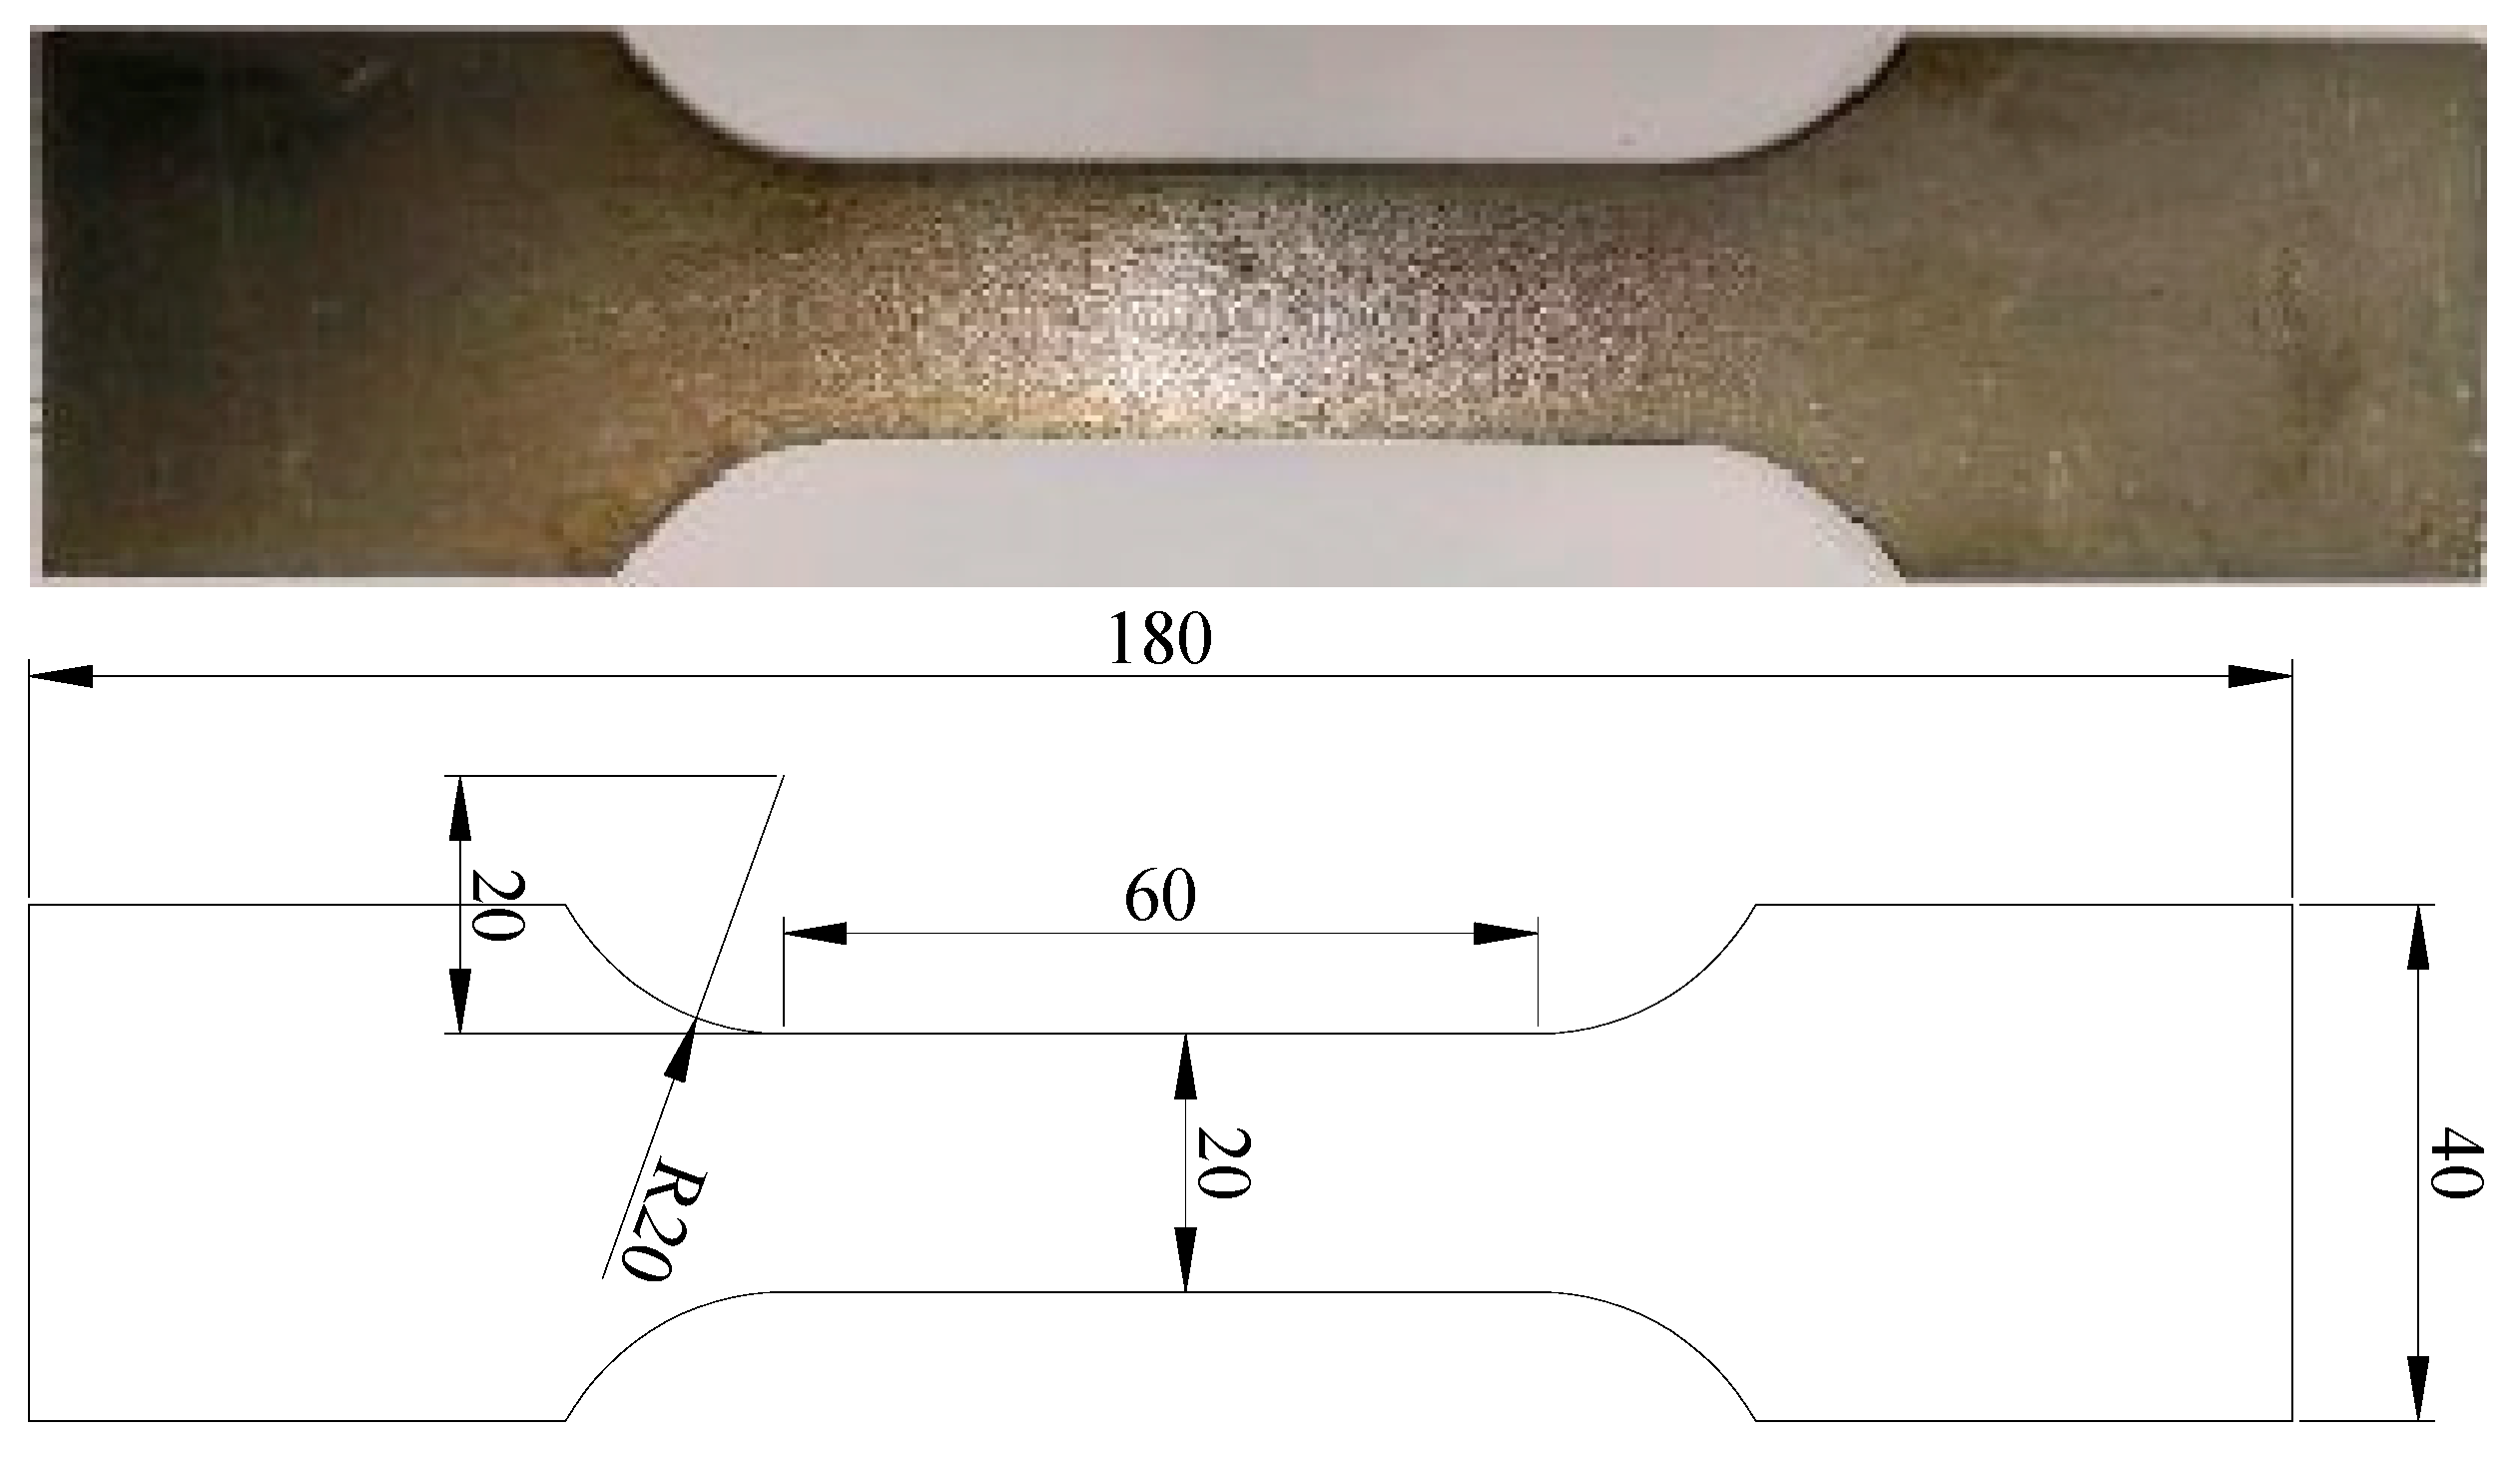
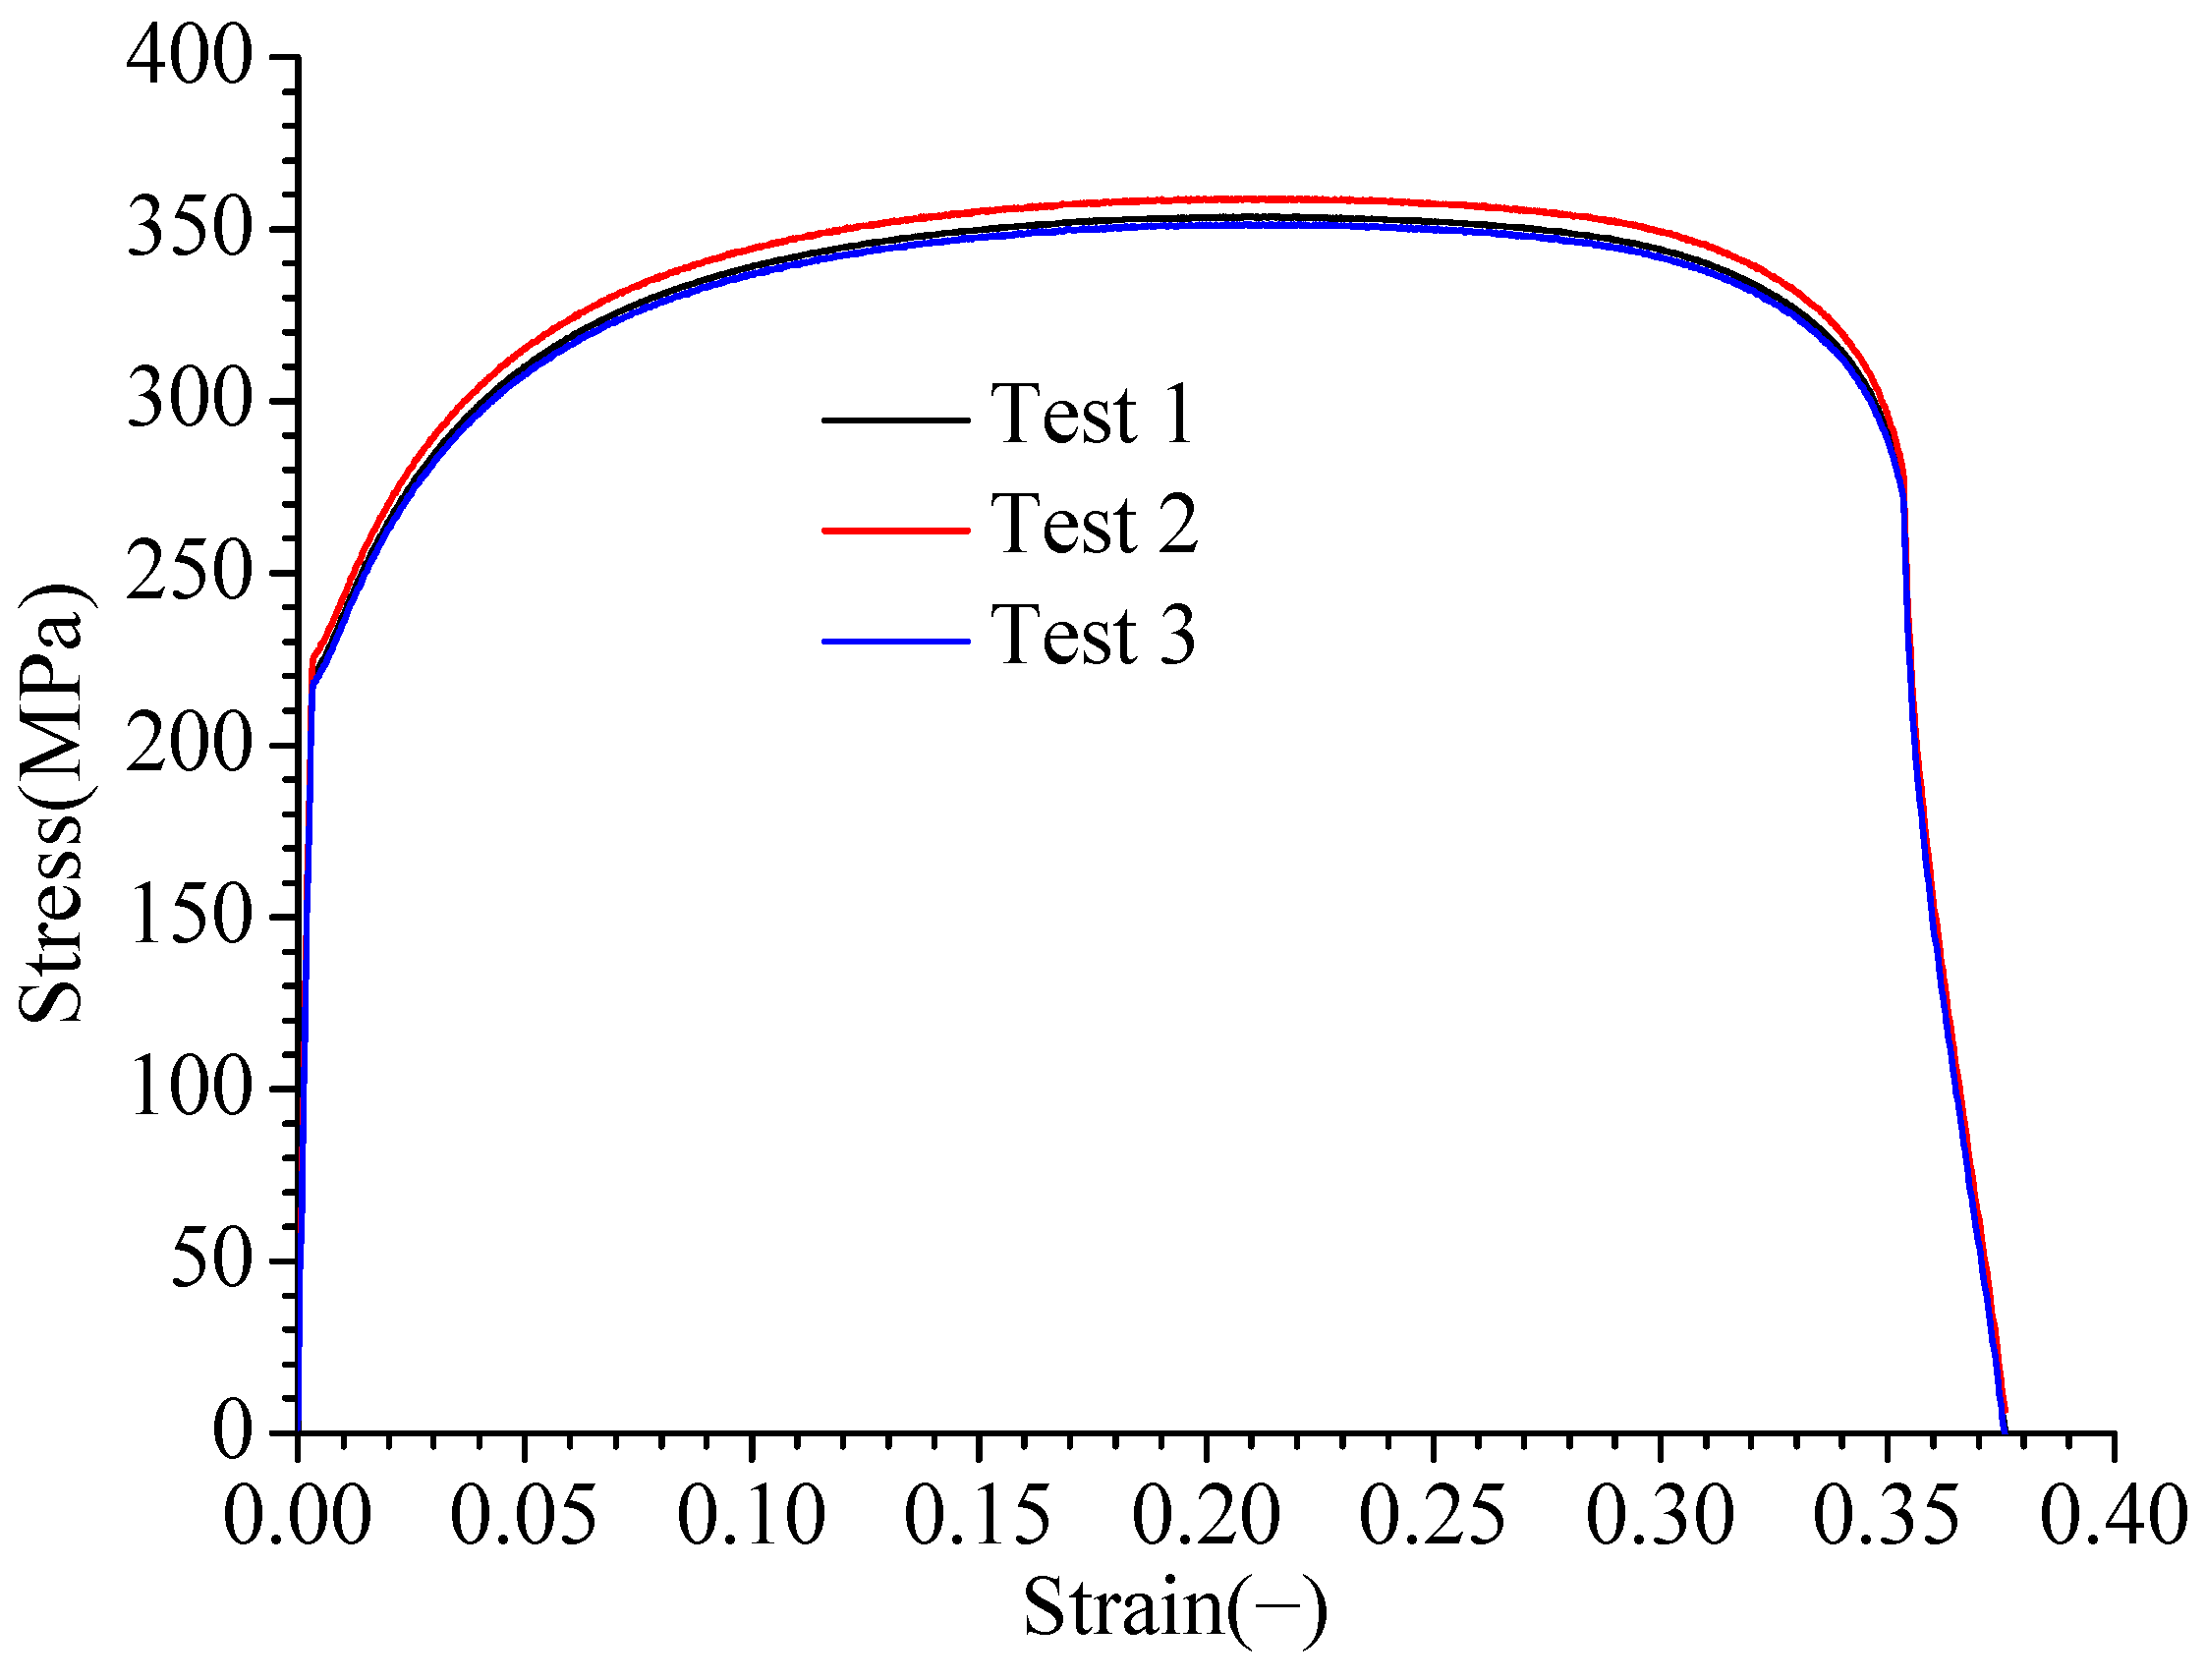
Before the experiment, the mechanical properties of the low-carbon steel material were obtained through quasi-static tensile tests. The uniaxial tensile test specimen was designed and manufactured following standards [36], and its dimensions are illustrated in Figure 11. The CMT5305 universal testing machine (MTS, Shanghai, China) was employed for the experiment. One end of the specimen was fixed while the other end was pulled at a constant speed of 1 mm/min until a fracture occurred. The data acquisition system integrated into the testing machine was used to measure the tensile force and displacement. An extensometer was attached to the parallel section to determine the elastic modulus and the engineering stress–strain curve of the material. To reduce experimental errors, the tests were carried out three times. The material’s relevant parameters are presented in Table 1.
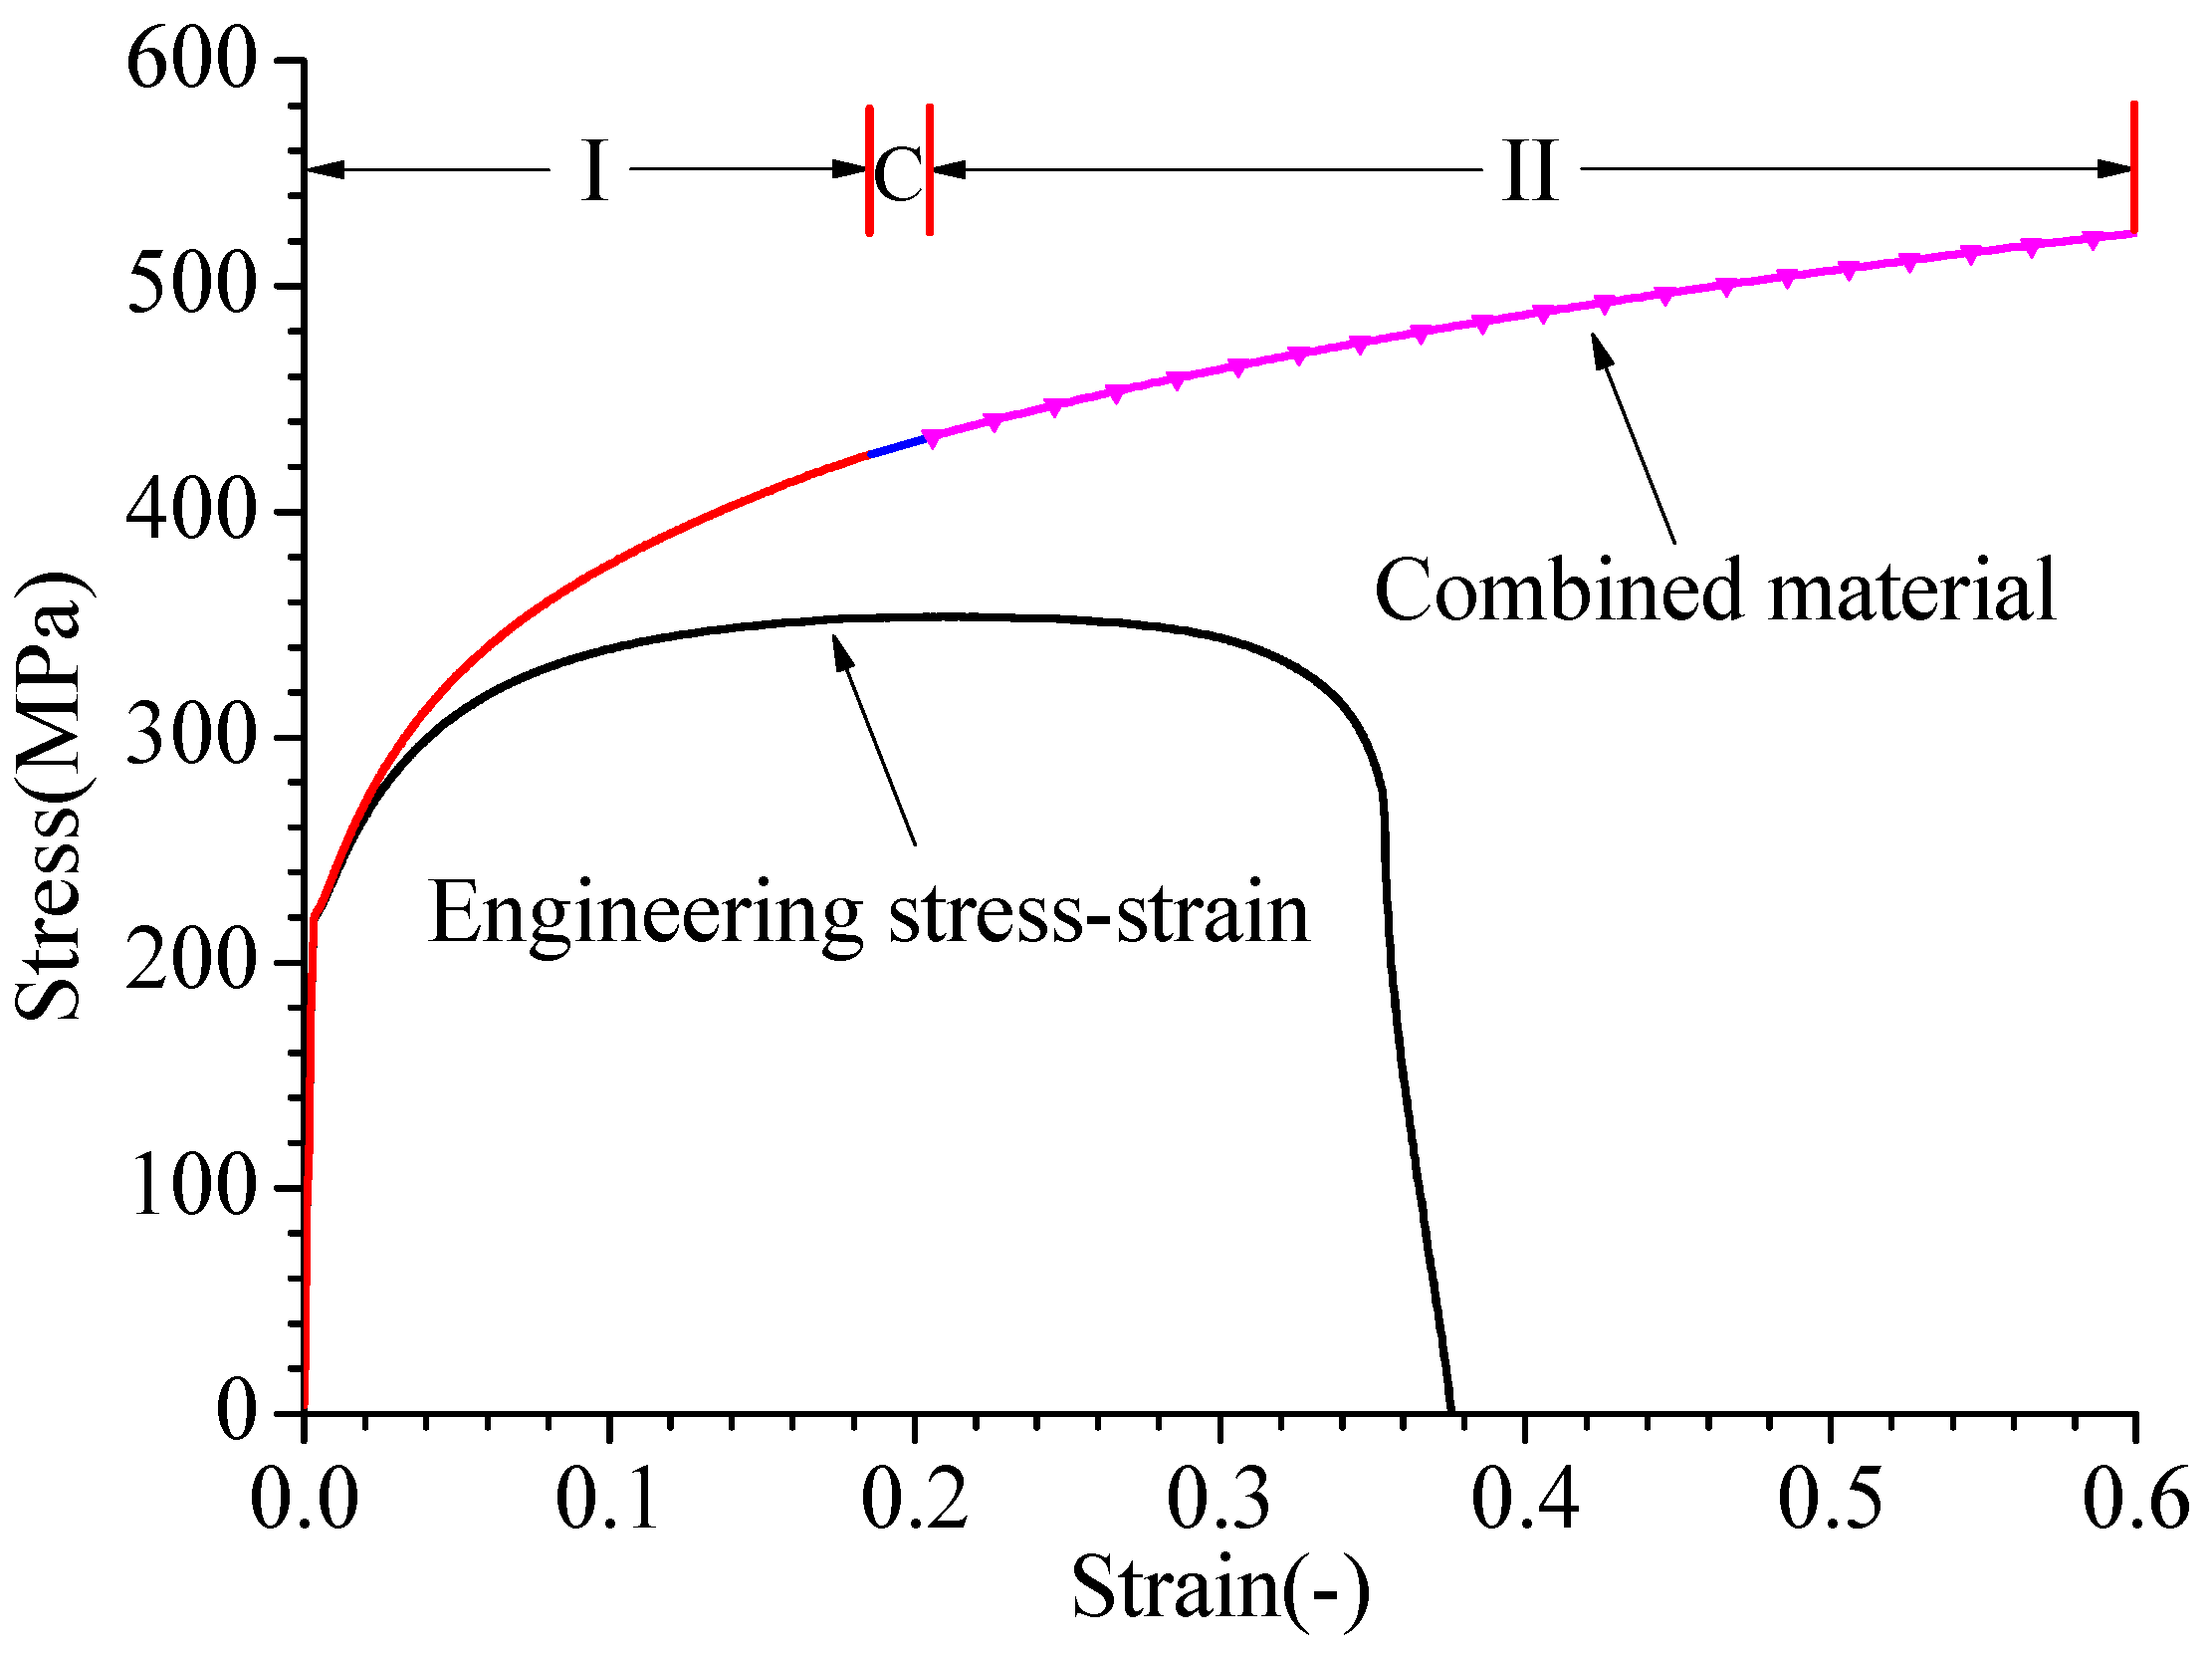
The mechanical properties of the steel used in the finite element model were determined through the quasi-static tensile test. Engineering and true stress–strain curves of the front panel and cruciform structure were obtained through uniaxial tensile tests, which are shown in Figure 12 and Figure 13. The true stress–strain curve was divided into two parts. Before the onset of necking, true stress σ t and true strain ε t are expressed by engineering stress σ e and engineering strain ε e .
σ t = σ e ( 1 + ε e )
ε t = ln ( 1 + ε e )
True stress–strain curves beyond necking can be represented by the following formula.
σ t = C ε t n
where
n = ln ( 1 + A g )
and
C = R m ( e / n ) n
R m is ultimate stress and e is the natural logarithmic constant. The proper A g can be approximately obtained by the following formula [37].
A g = 1 0.24 + 0.01395 R m
Part I and Part II in Figure 13 are simply connected by a straight line, i.e., part “C” of the figure. This “combined material” was first proposed by Villavicencio R and Soares C G [37] to predict the true stress–strain relation beyond the necking of the test piece. where I is the true stress−strain curve portion and segment II is the power function portion of Equation (7).

4.2. Element Size Sensitivity

Data from tensile testing and other material properties are found in Table 2. Due to the local necking of the material during uniaxial stretching, the failure strain measured by the extensometer is not accurate and cannot be directly defined in the finite element. Therefore, finite element simulation of the uniaxial tensile test was conducted, with one end of the specimen fixed and the other end stretched at a constant rate of 100 times the loading speed of the testing machine [3,11,38], that is, the loading rate was 100 mm/min. The parallel section of the specimen was divided into meshes of 4 mm, 6 mm, 8 mm, and 10 mm, and the obtained force–displacement curves were compared with the test results. By calculation, the failure strain corresponding to different mesh sizes was obtained when the force–indentation curve of the test and simulation corresponded to the same tensile displacement at fracture, as shown in Table 2.

4.3. Definition of Failure Criteria

To compare the applicability of EPS, BWH, and RTCL failure criteria in the corresponding finite element simulations of the structural test, simulations were conducted using three failure criteria. Assuming that the mesh size of each key position element is the same as the overall mesh size, the difference between the set mesh size and the defined failure strain values for each material is ignored. For example, when the mesh size is set to 4 mm, the defined failure strain value for the material is 0.382. The plastic behavior of the material is the combined material relationship curve in Figure 13.
For the EPS and RTCL failure criteria, the defined failure strain values correspond to their mesh sizes, as shown in Table 2. For the BWH failure criterion, the true stress–strain curve is fitted to a power function curve to obtain the BWH failure criterion parameters corresponding to the material. The parameters K and n in Formula (2) are 572 × 106 and 0.1845, respectively.

4.4. Parameter Settings of Finite Element Model

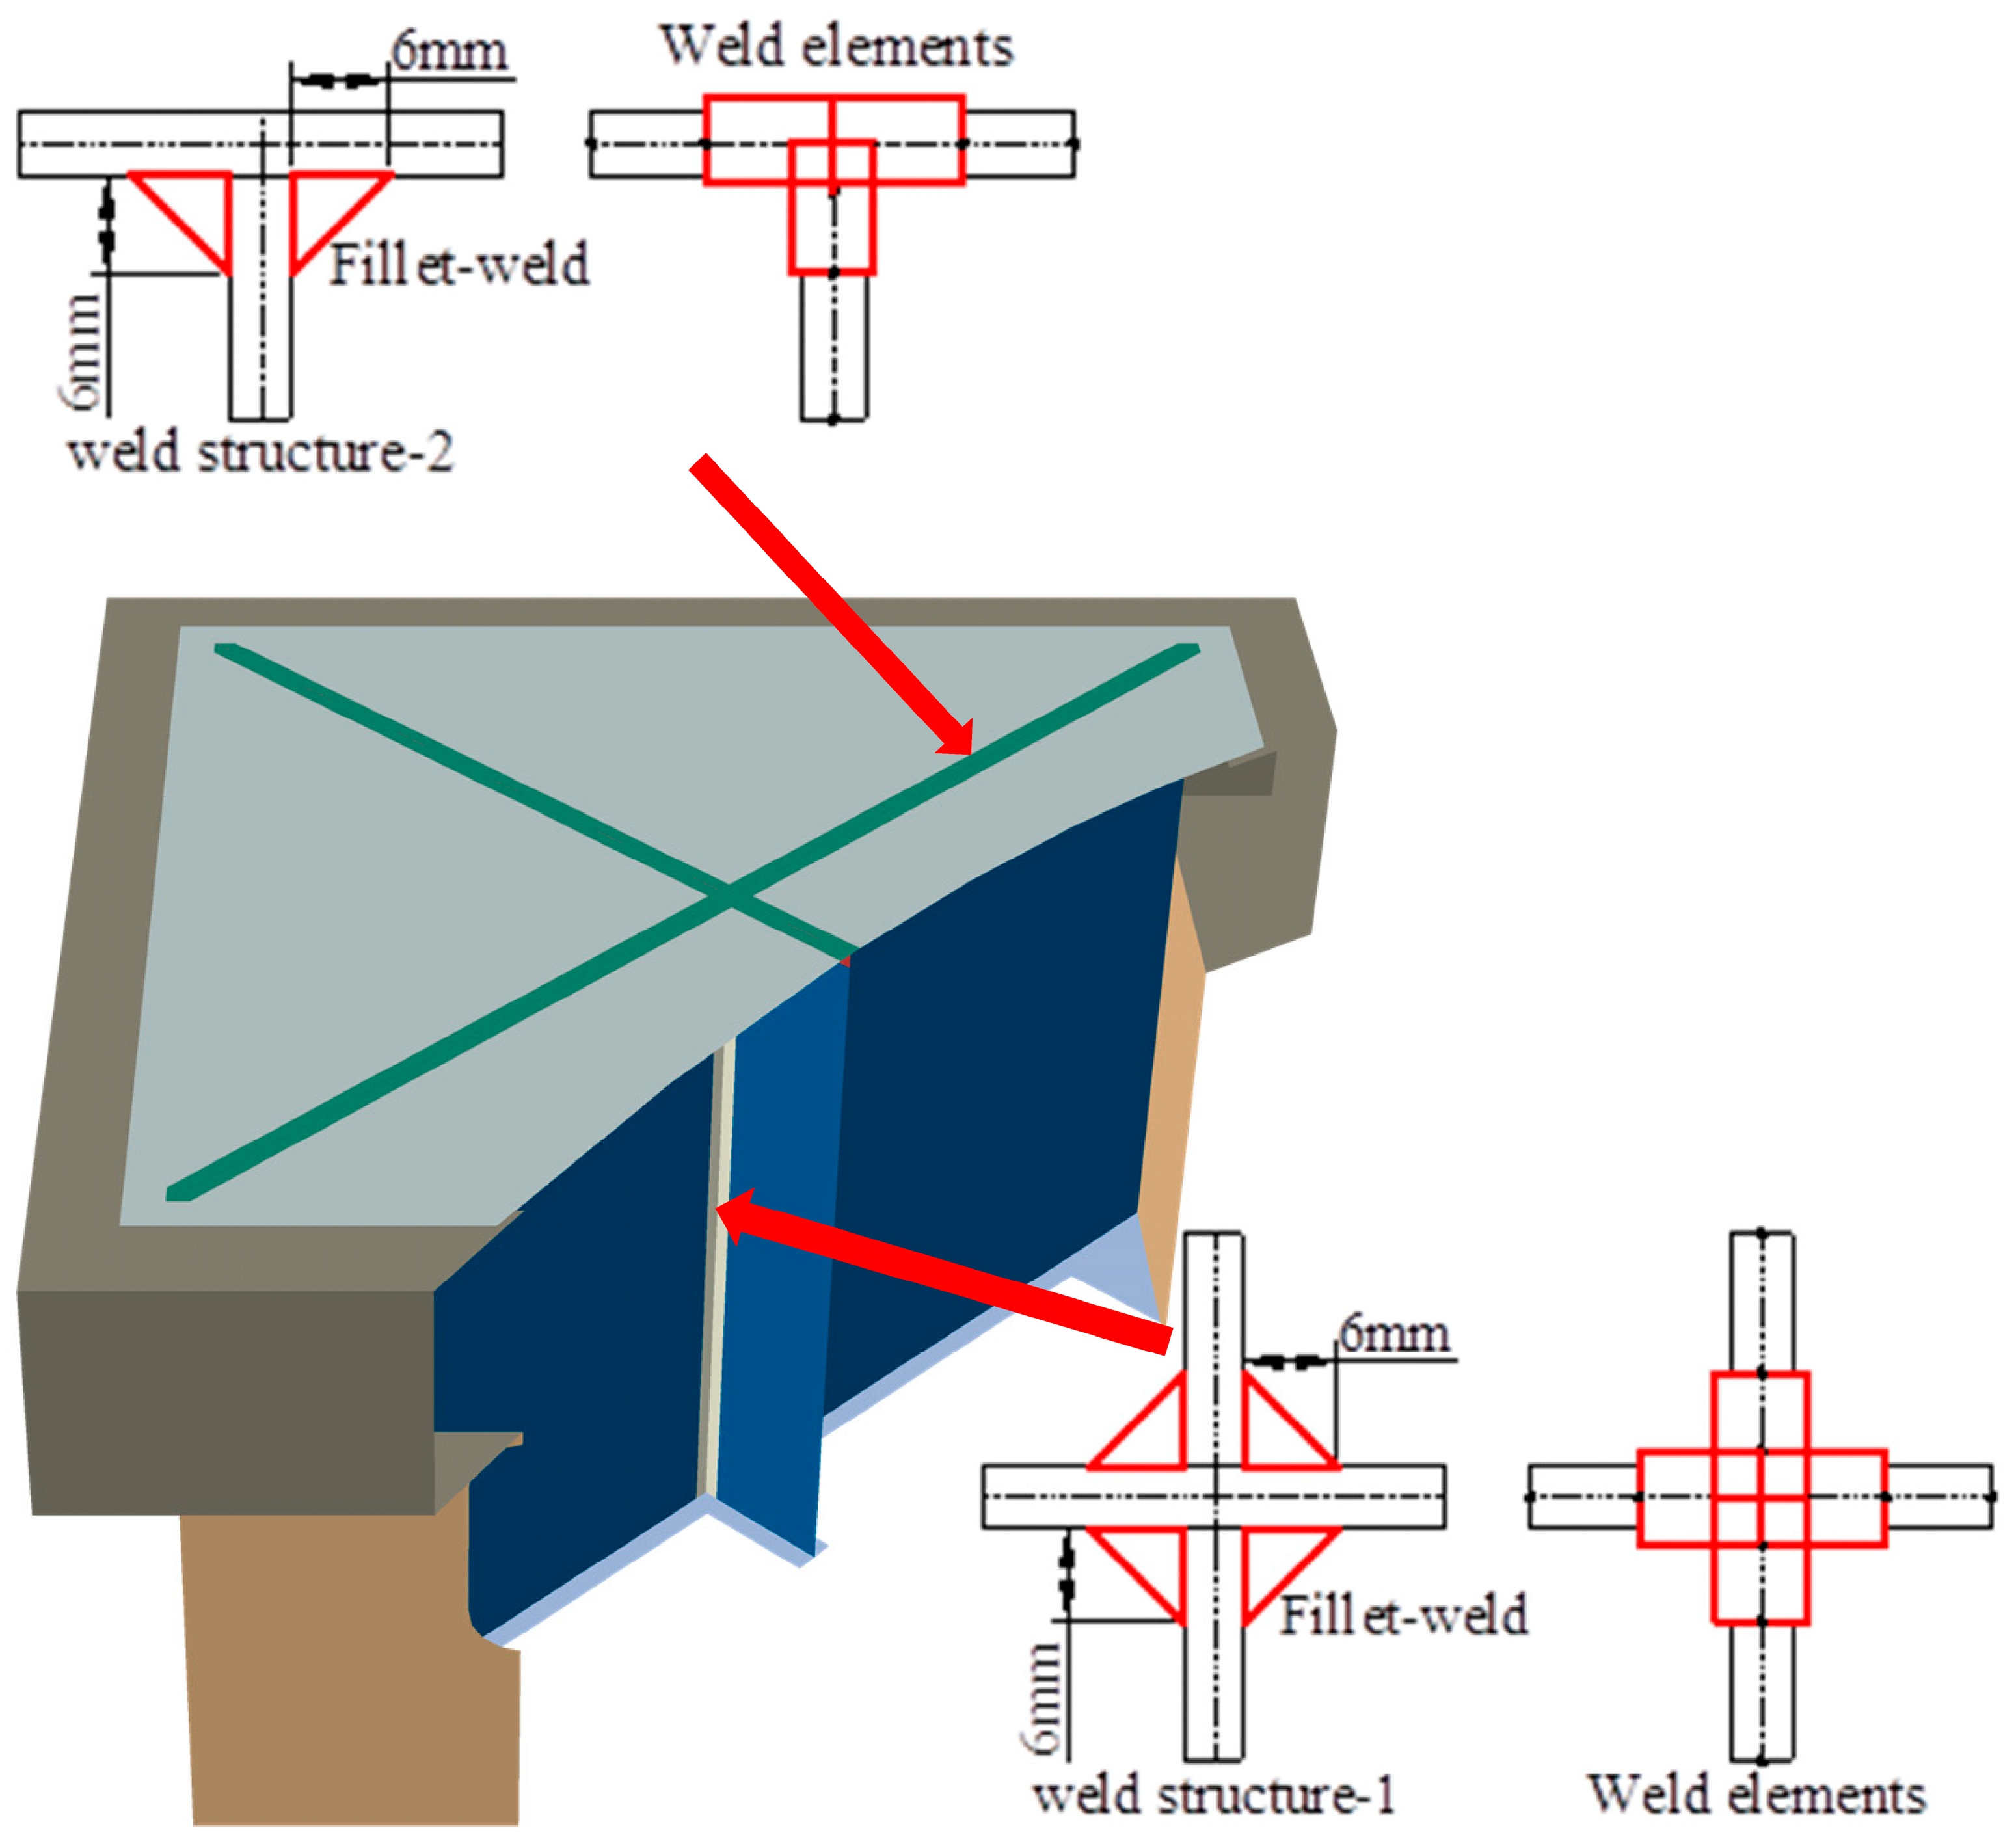
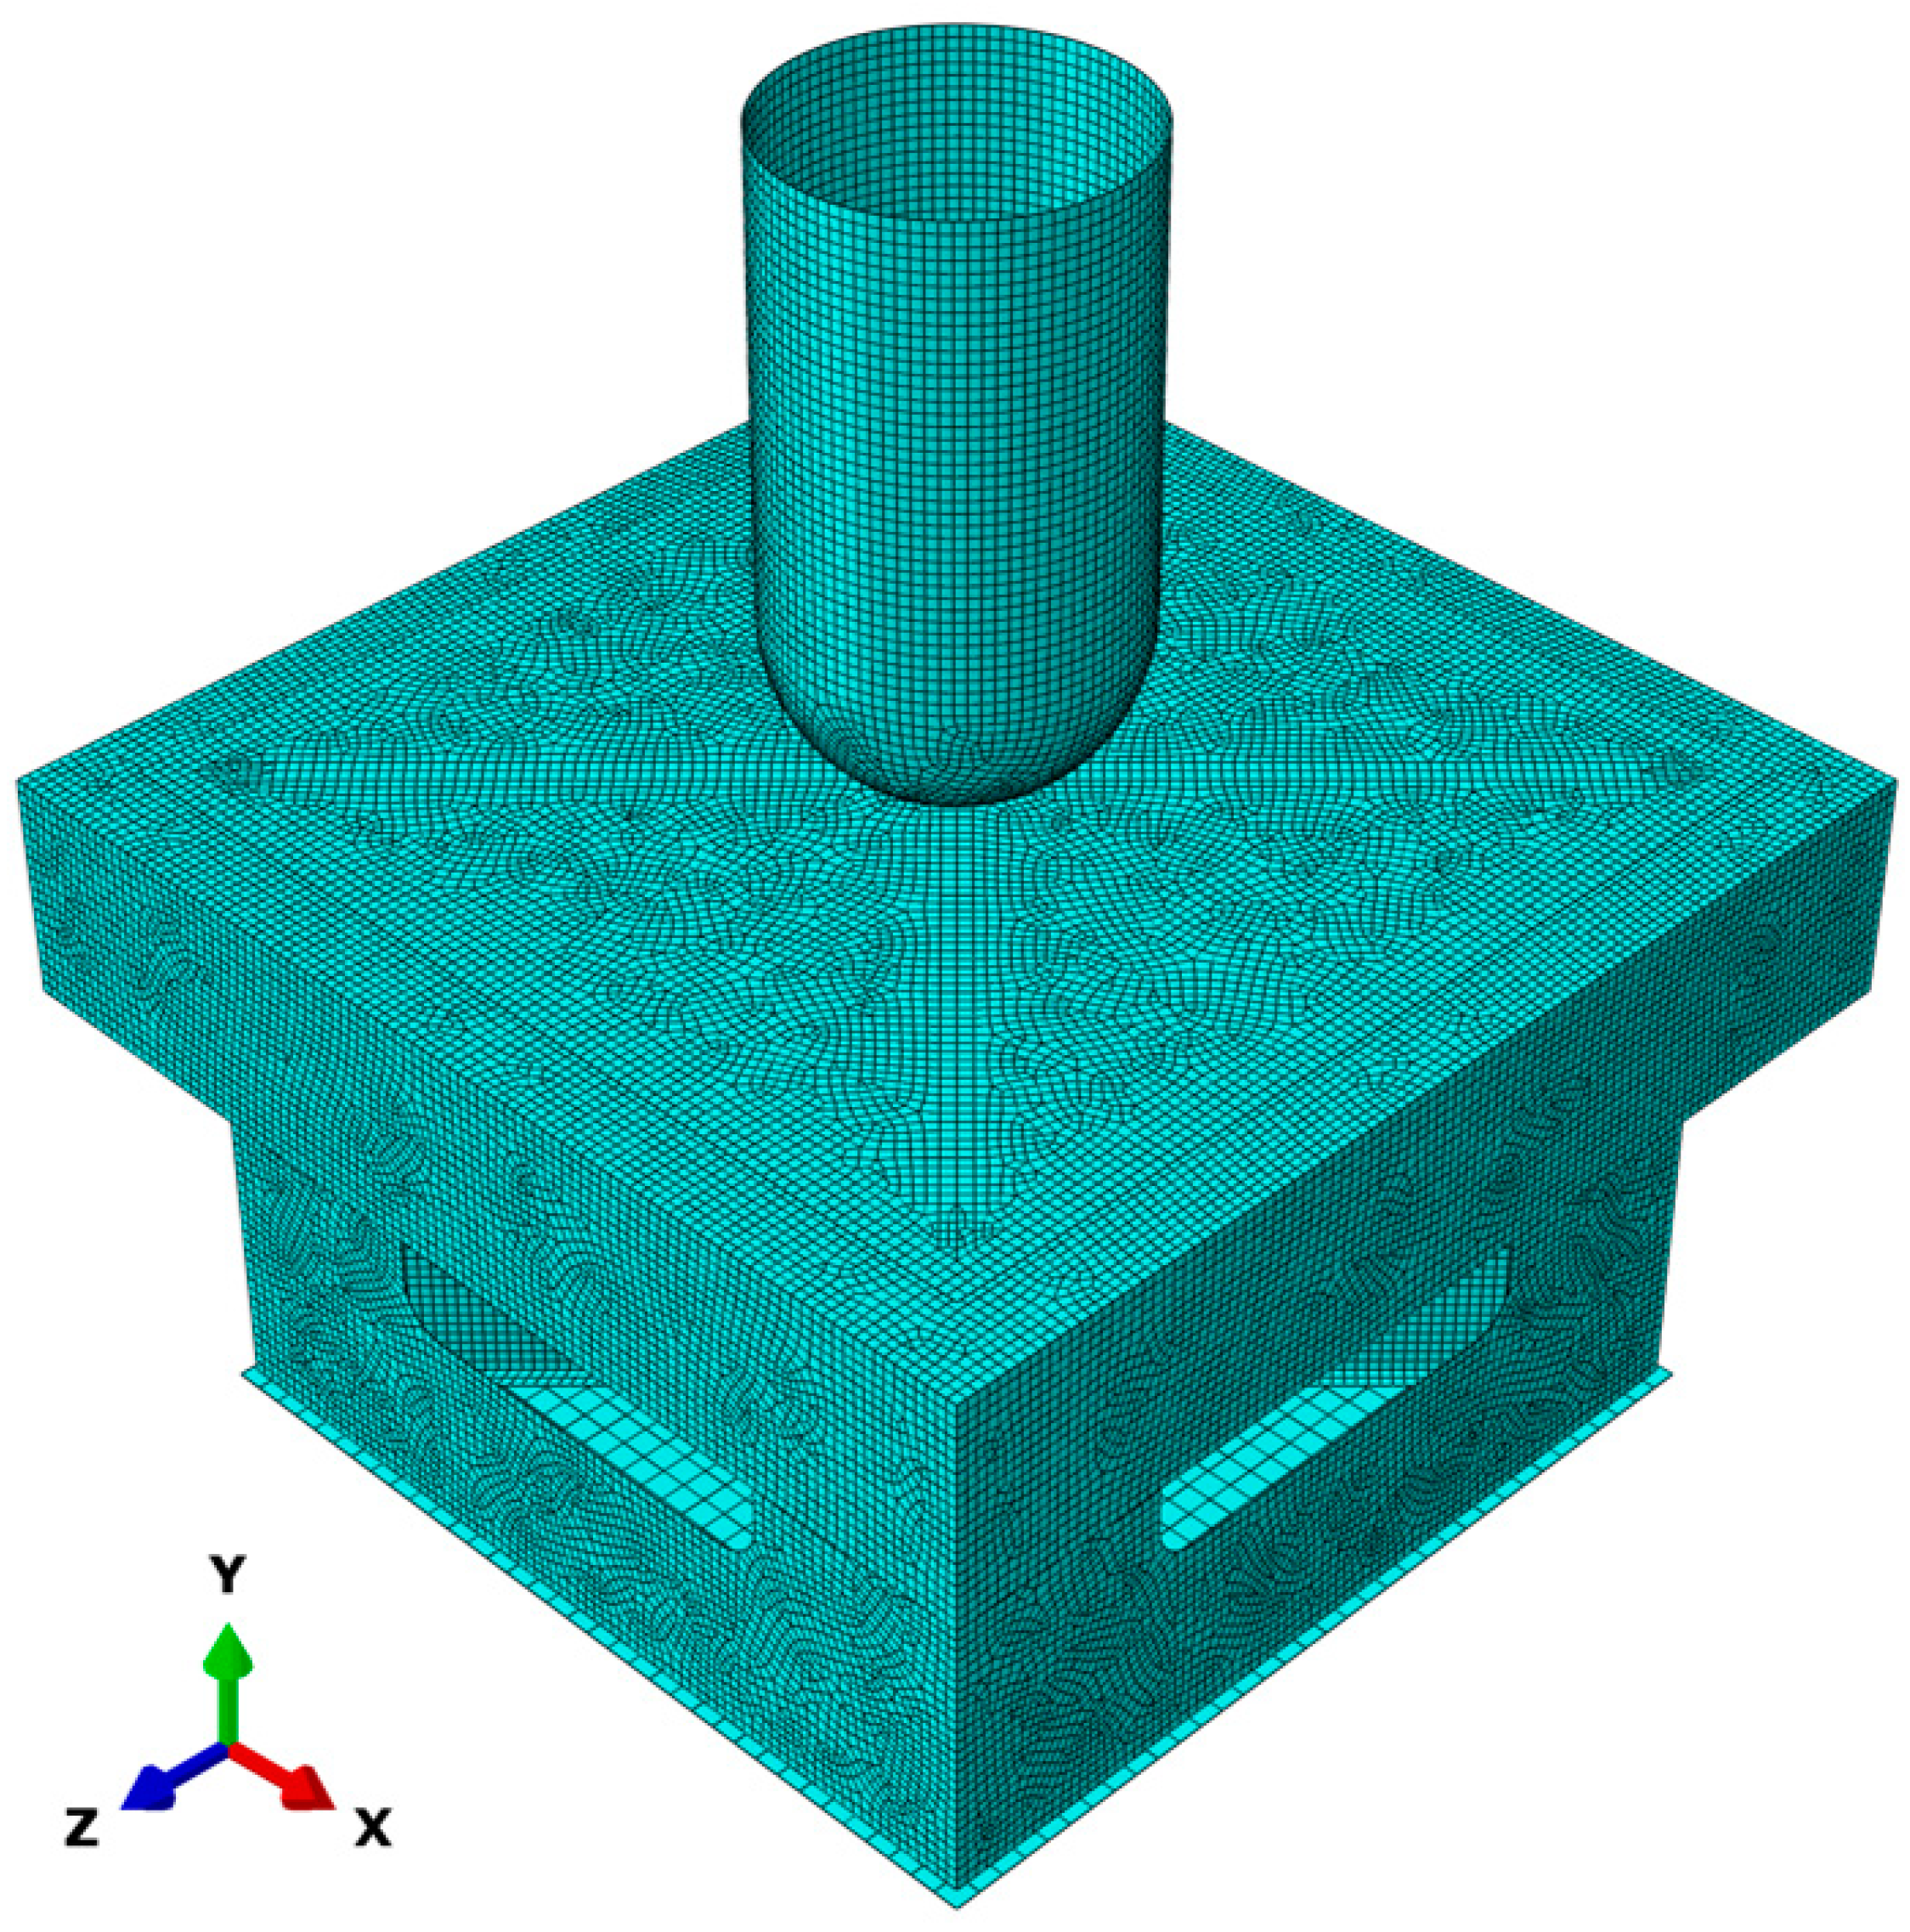
The computations were performed using the FEM software ABAQUS, which is suitable for nonlinear explicit dynamic simulations with large deformations. The geometry of the specimen, as shown in Figure 14, was established in ABAQUS, with the wings and waist of the channel steel being equivalent to 8.5 mm and 5.3 mm thick, respectively. The test pieces were modeled using quadrilateral shell elements with reduced integration and large-strain formulation. As the indenter was solid and had high hardness, it was set as a rigid body. When simulating small-scale structural elements, it was necessary to consider the weld joints. This was because weld joints not only increased the thickness of the plate but also smoothed the transverse transition between the web girder and the front panel, thereby increasing the strength of the structure. Studies by Nassiraei, H. [39,40] have shown that reinforcement at structural joints can increase the load-carrying capacity of the structure to a greater extent, and welds are also a form of reinforcement at structural joint locations. The presence of weld joints was accounted for in the simulations by increasing the thicknesses of the front panel and cruciform structure at their intersection, as described in references [11,37]. After measuring the width of the weld joint to be between 5 mm and 7 mm, a width of 6 mm was used in Figure 14, with the thickness of the welding foot being equivalent to the plate on both sides. After trial calculations, a weld joint was set to increase the thickness of the welding element on both sides by 1 mm, resulting in relatively ideal simulation results. As shown in Figure 14, the weld elements on the axis of the cruciform structure were increased by 2 mm, and the weld elements at the intersection of the cruciform structure and the front panel were increased by 1 mm. The mesh size of the indenter in the finite element model was 4 mm, and the mesh sizes of the test pieces were 4 mm, 6 mm, 8 mm, and 10 mm, respectively, for comparing the structural responses using three failure criteria. Figure 15 shows the finite element model with a mesh size of 4 mm. In the finite element model corresponding to the quasi-static test, the moving speed of the indenter was set to 80 mm/s to save simulation time, and the calculation time was set to 1 s to cover the displacement of the indenter in the test. In the simulation of dynamic impact testing, the degrees of freedom other than the Y-direction movement of the indenter were constrained according to the actual test conditions. The corresponding initial velocities of the indenter were 3.13 m/s and 7.67 m/s, and the dynamic response of the indenter from contact with the specimen to leaving it was calculated. The material parameters used in the quasi-static test and the falling weight impact test are shown in Table 1 and Figure 13. Due to the limitation of conditions, the related material strain rate sensitivity test was not carried out. Considering that the Cowper-Symonds parameter, which is commonly used in the material strain rate sensitivity constitutive model, will increase the post-yield stress of the material, the strain rate of 100 s−1 in the finite element simulation has a great influence on the Q235 material. In reality, the effect of strain rate on the post-yield stress is small [41], so the strain rate sensitivity of the material is not considered here.

5. FE Results and Discussion

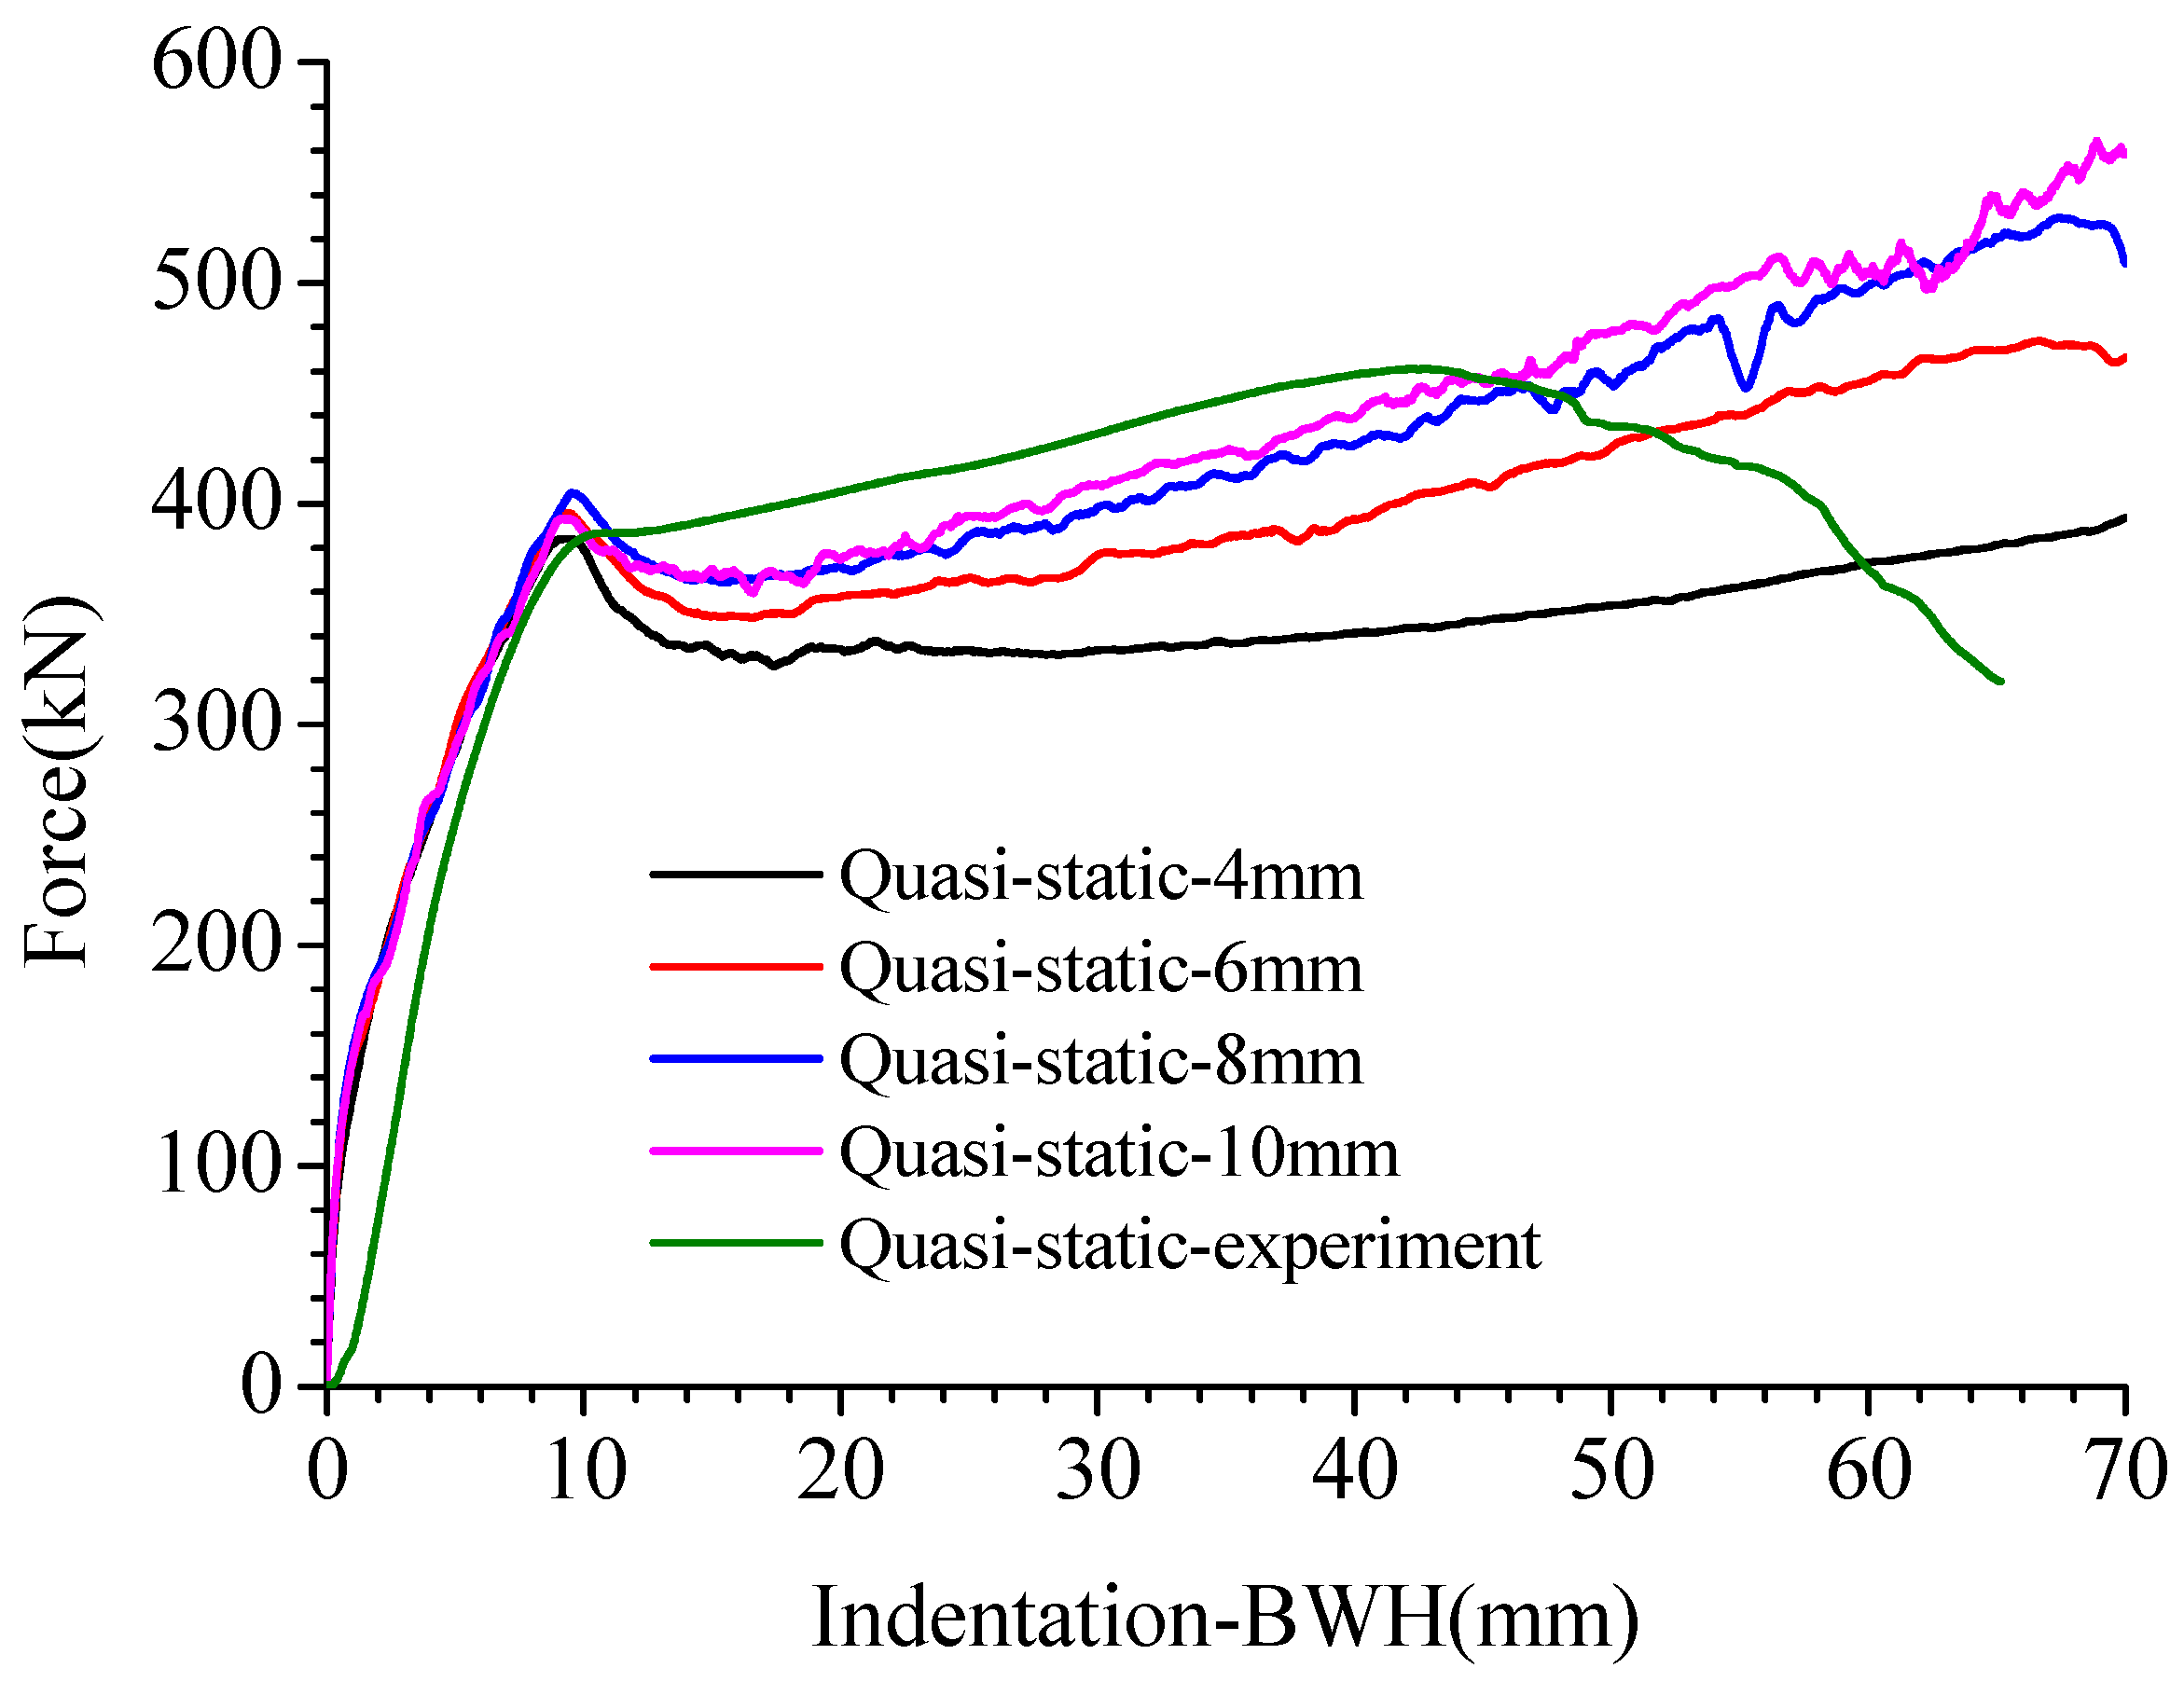
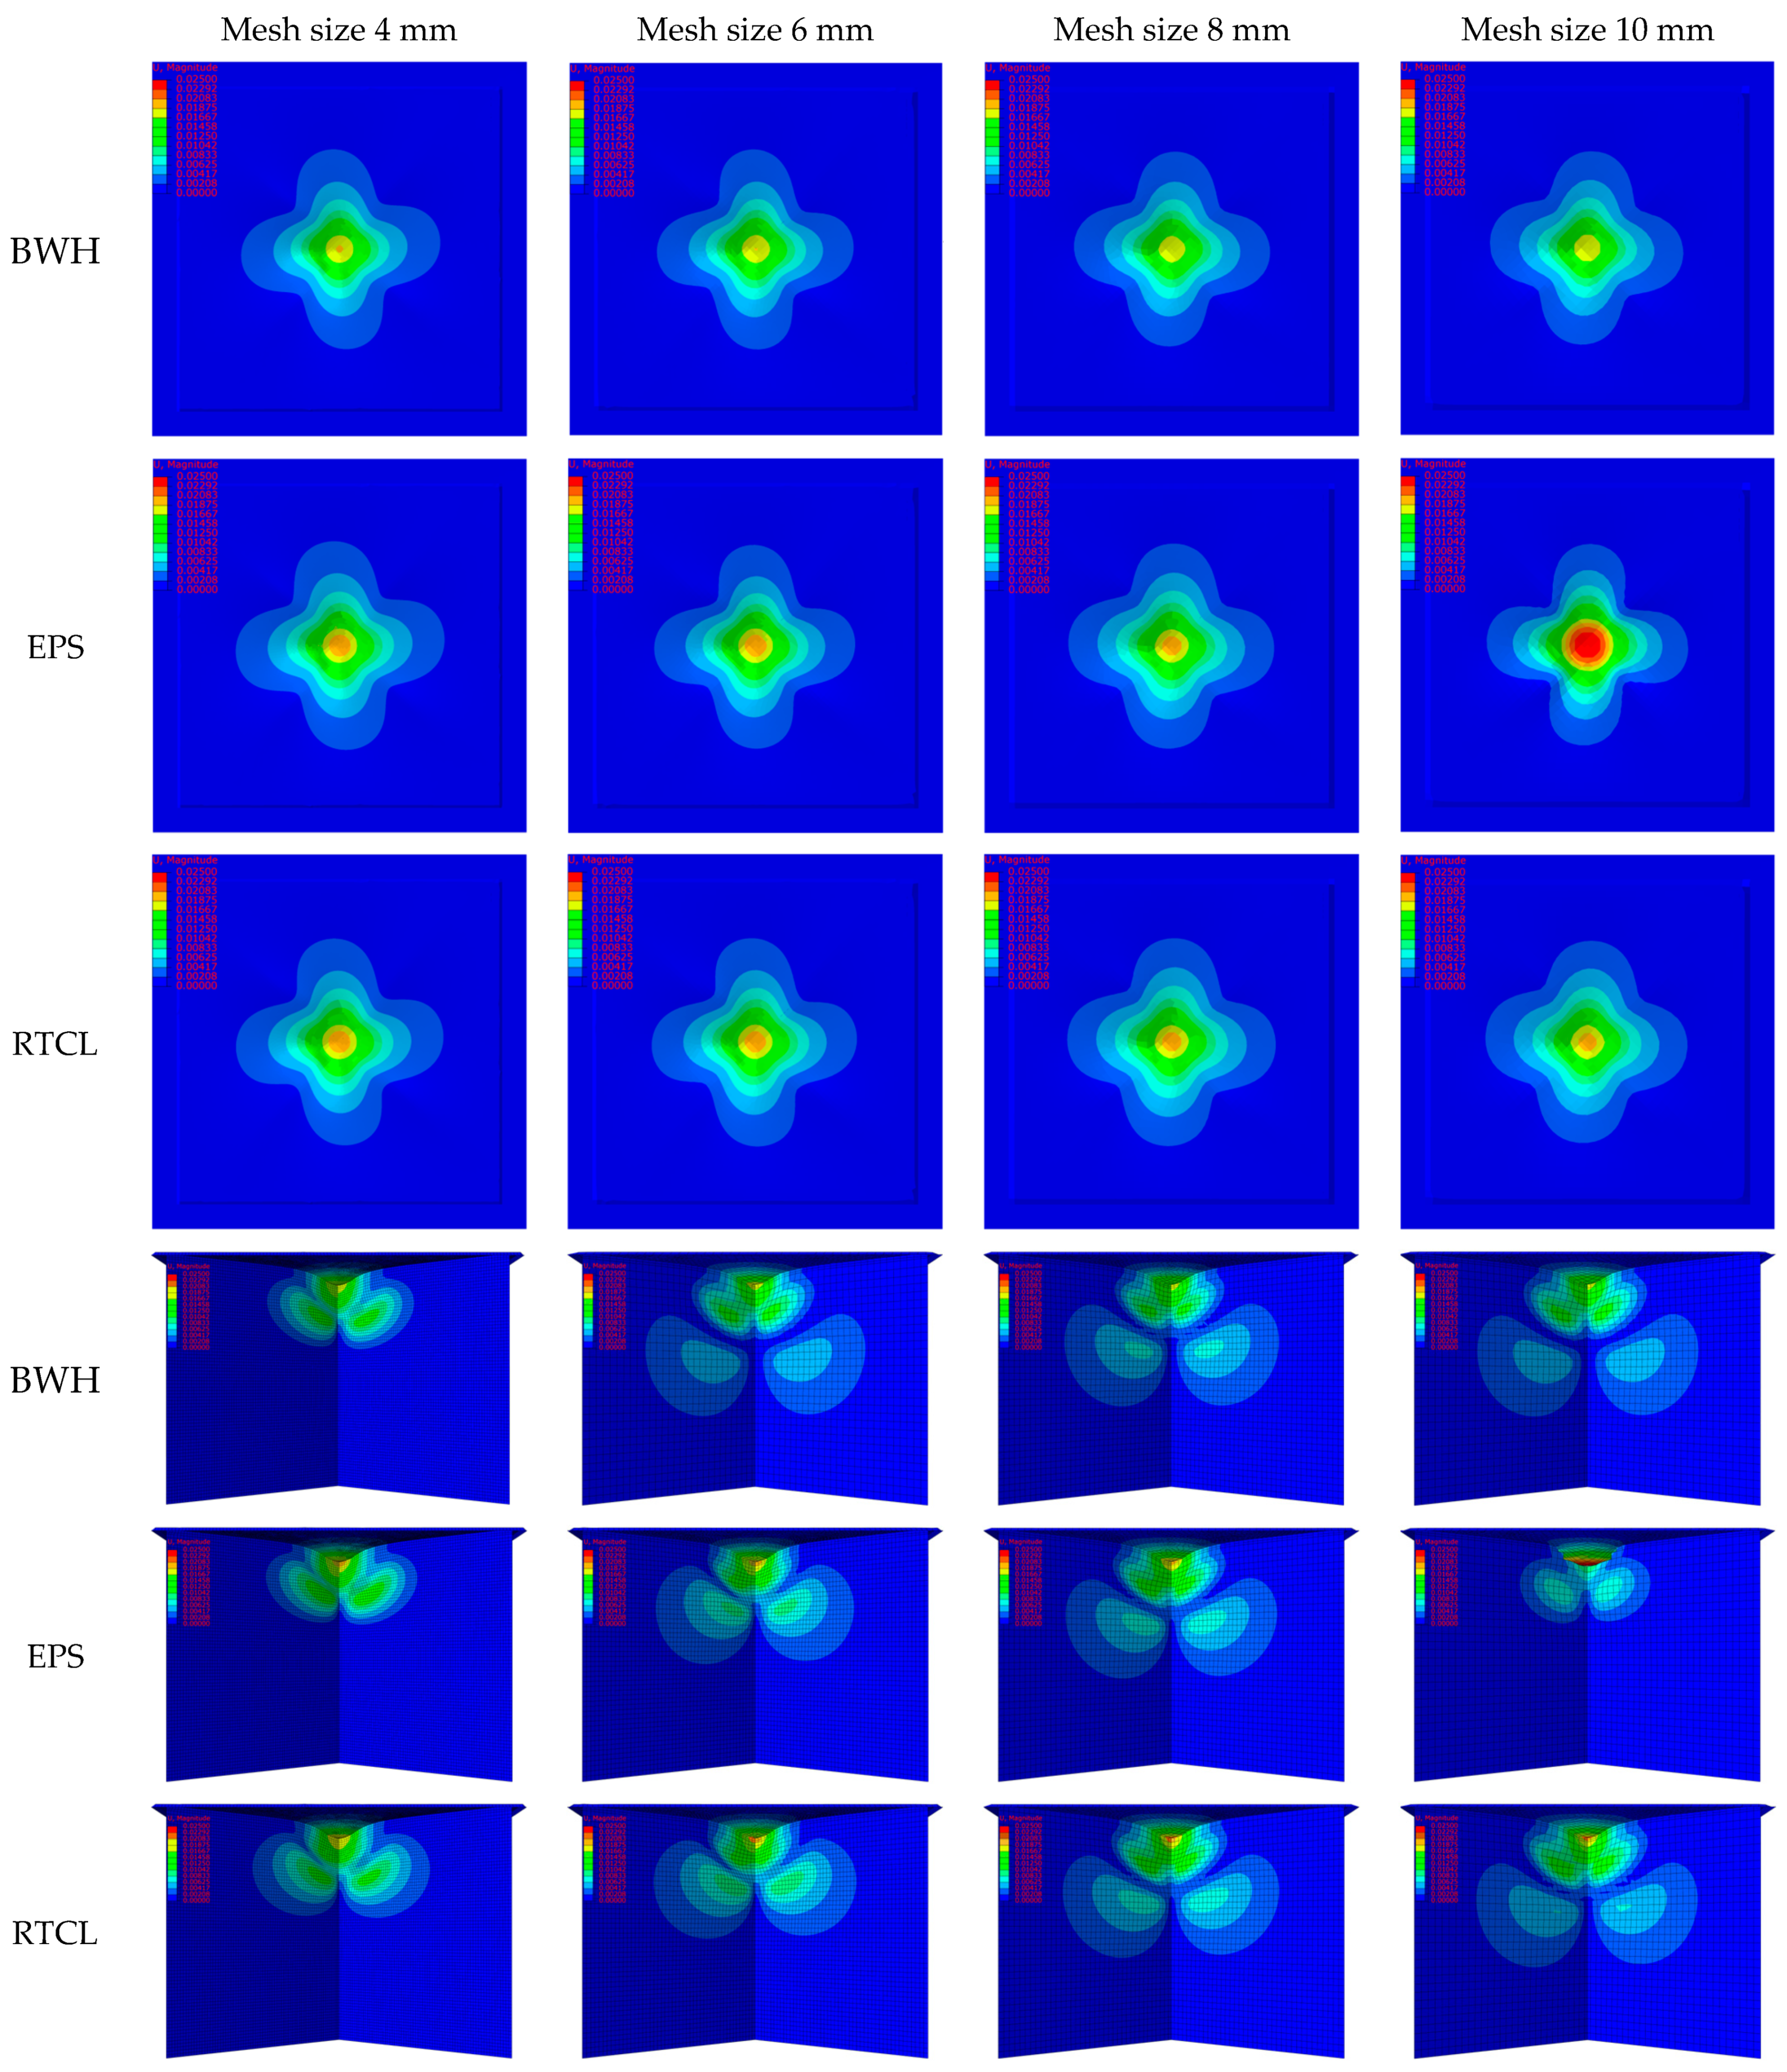
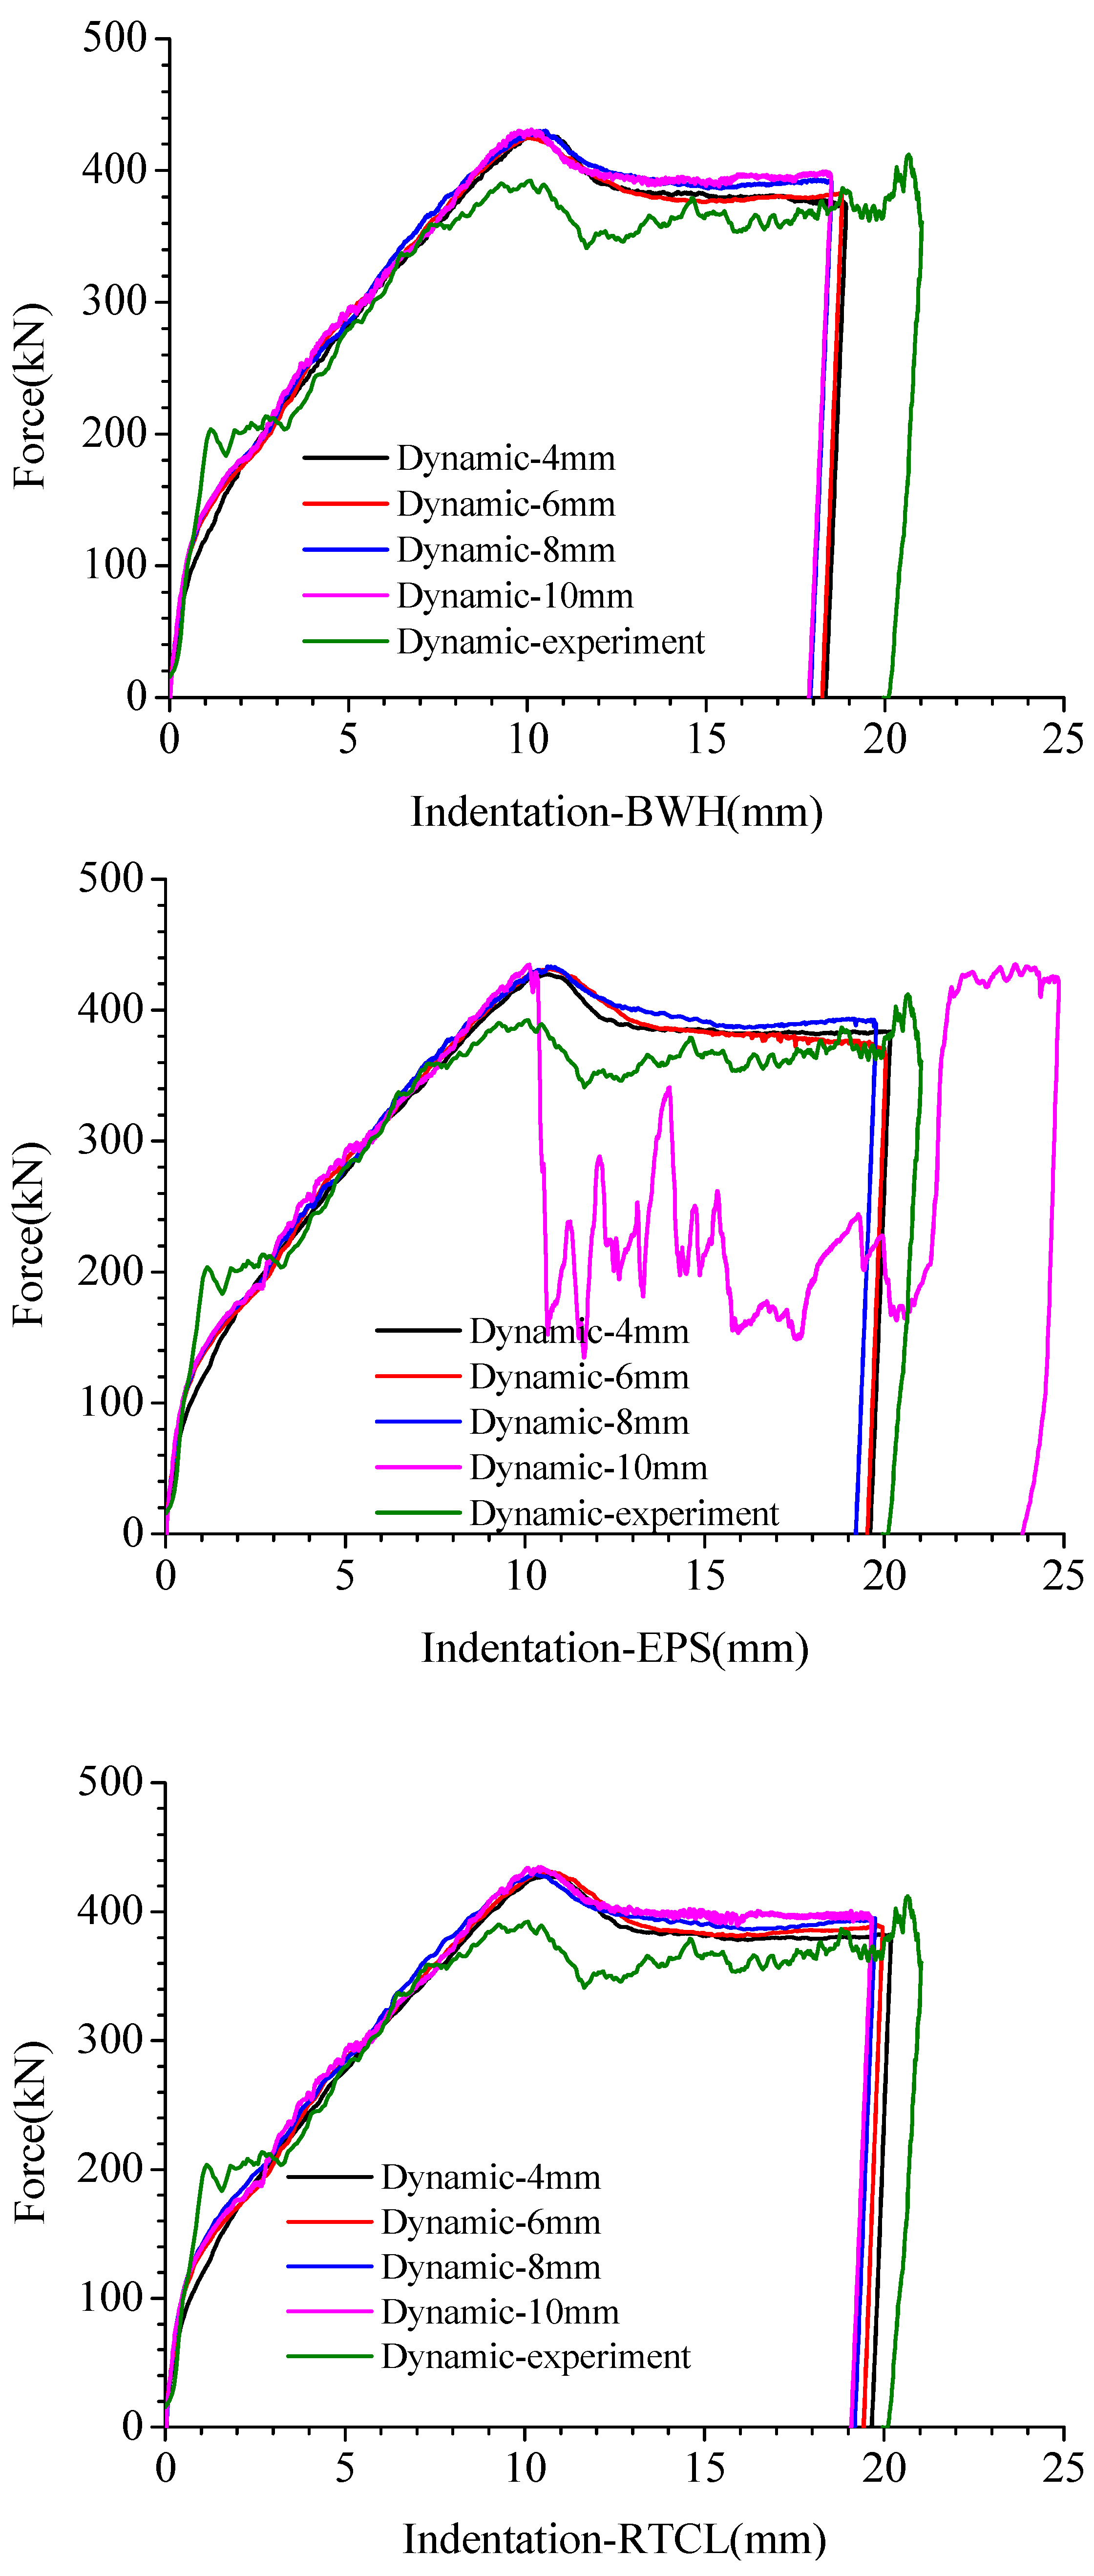
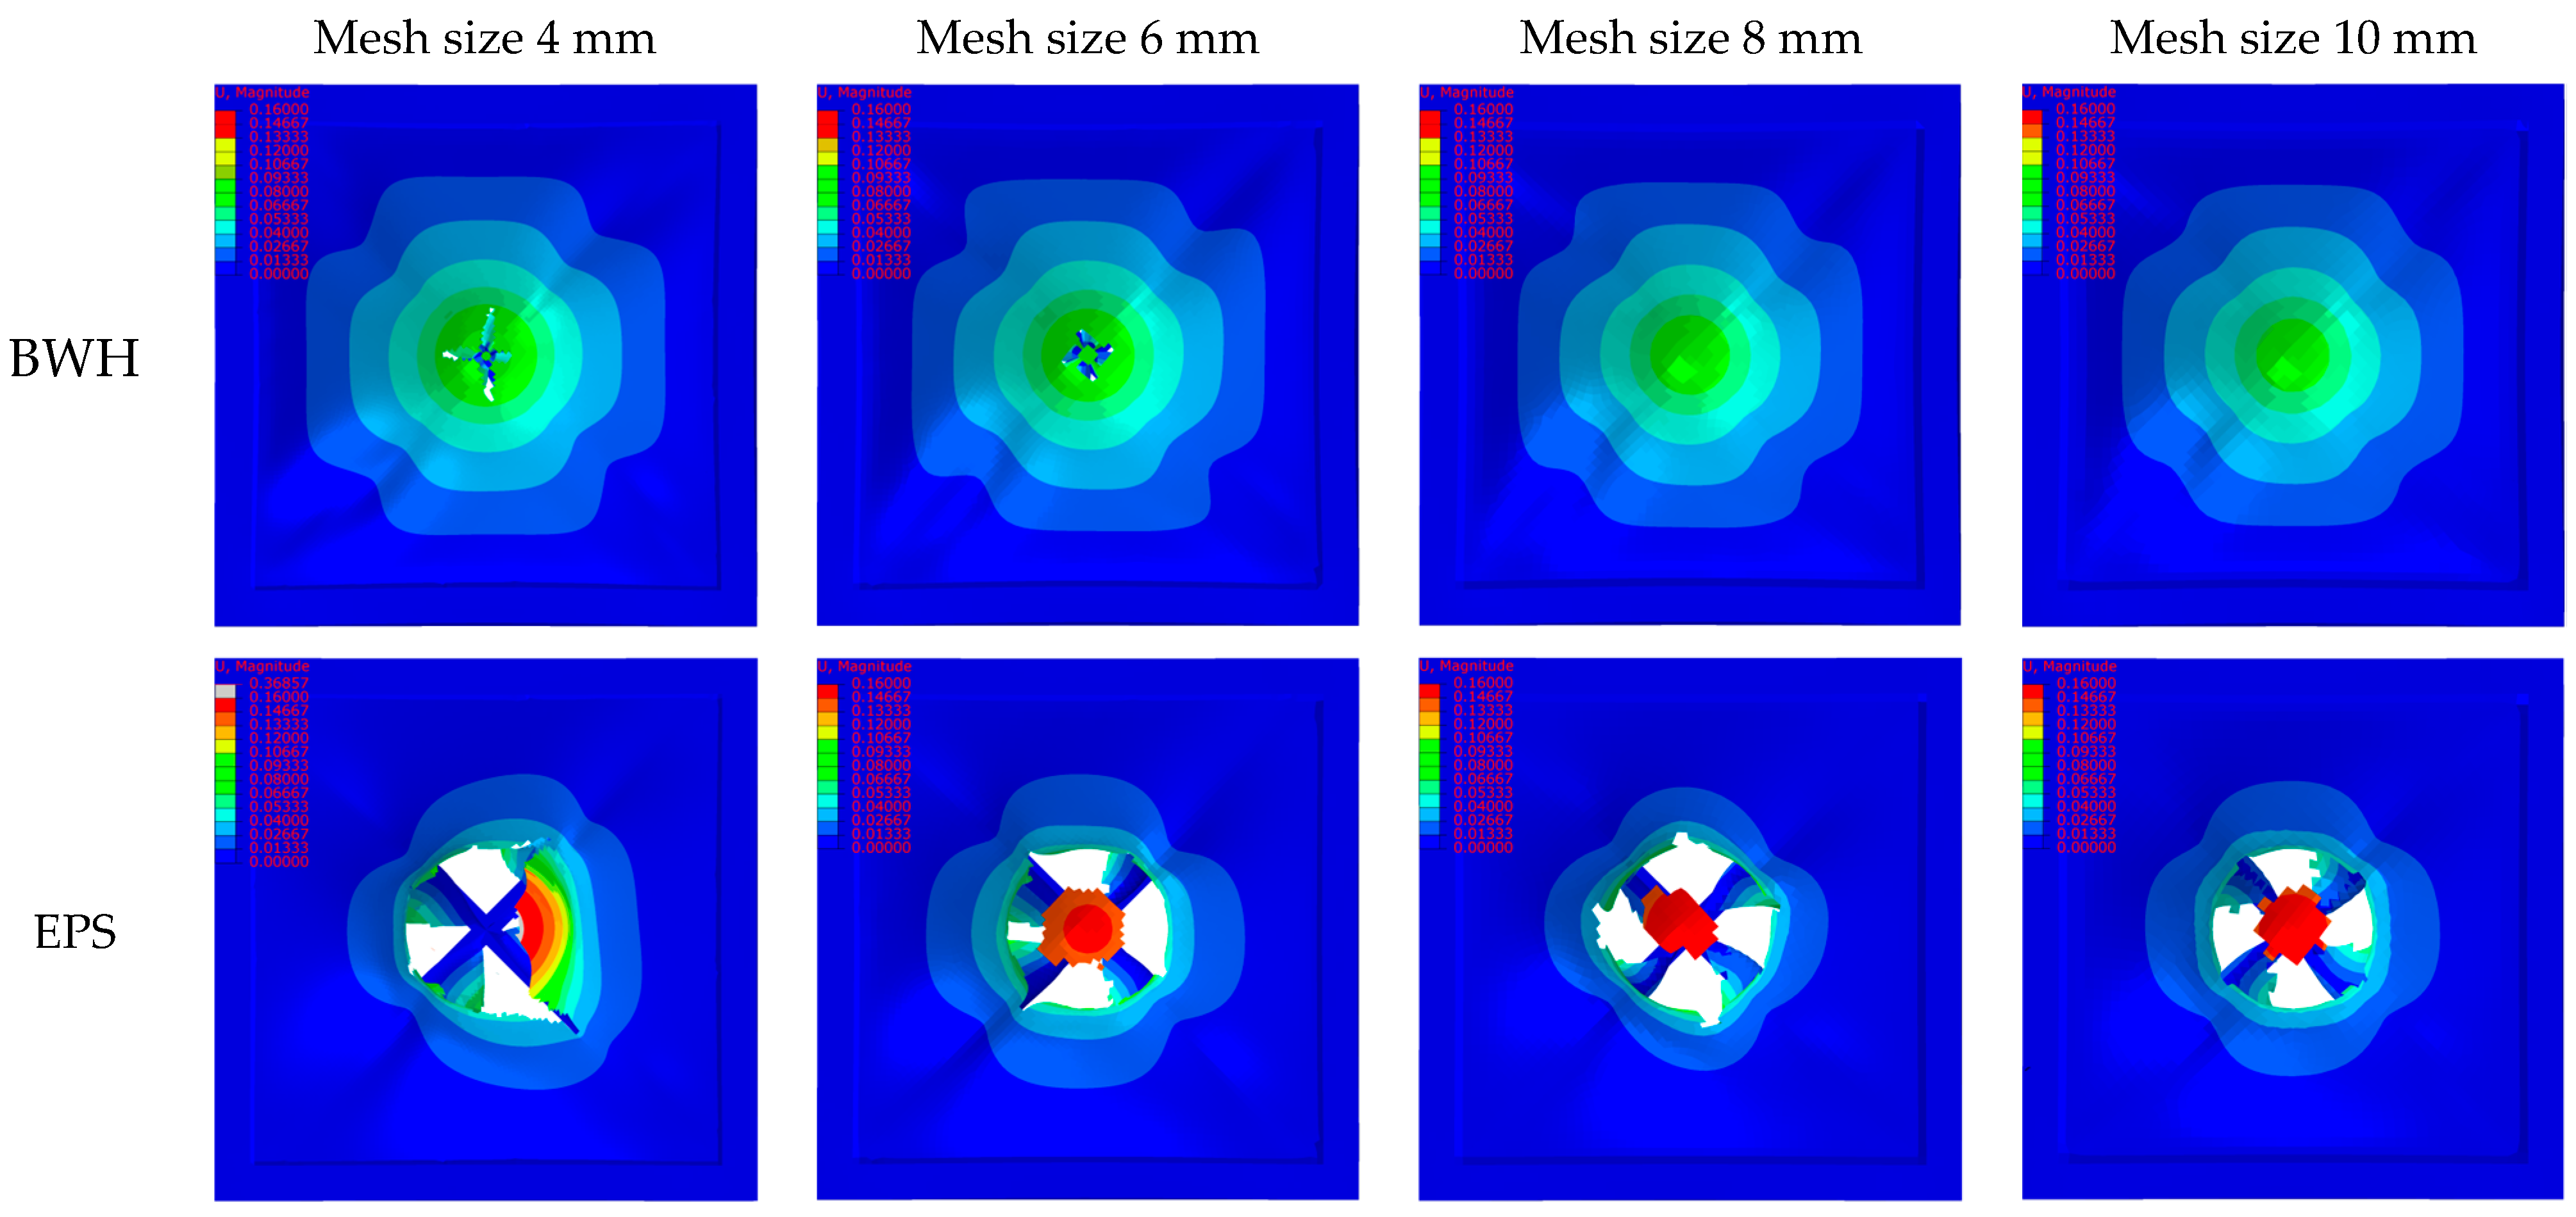
The displacement cloud maps of the front panel and the cruciform structure for the quasi-static test were generated using the BWH, EPS, and RTCL failure criteria, as well as four mesh sizes in finite element analysis, shown in Figure 16. The cloud maps used the same scale to compare the degree and range of structural deformation. The corresponding force–indentation curves are shown in Figure 17.
By combining the force–indentation curves in Figure 17 and the deformation cloud maps in Figure 16, it can be seen that when using the BWH failure criterion, the structure did not fail. For a mesh size of 4 mm, the concave range of the front panel was small. From the deformation of the cruciform structure, it can be seen that the height of the wrinkles in the axial direction of the cruciform structure was relatively small when using a small mesh size. In a smaller mesh size, the cruciform structure had one more group of wrinkle deformations compared to the larger mesh size. From the force–indentation curve in Figure 17, it can be seen that during the stable deformation of the wrinkles, the larger the height of the wrinkles, the greater the deformation range of the cruciform structure and the faster the force–indentation curve rises. Based on the initial peak value in the force–indentation curve and the structural deformation in Figure 16, it can be seen that the initial buckling load of the cruciform structure was approximately the same, and the initial height of the wrinkles was also similar.
As shown in Figure 17, when using the EPS and RTCL failure criteria, both the front panel and the cruciform structure failed. When using the EPS failure criterion, the cruciform structure below the hammer head buckled. As the displacement of the hammer head increased, the strain of the lower element gradually increased. When the failure strain was reached, the element was deleted, and the load quickly dropped. When the front panel made contact with the undamaged elements again, the load continued to rise. From the changes in the force–indentation curve in the later stage, it can be seen that using a smaller element size resulted in less curve fluctuation, the more frequent appearance of wave peaks, and relatively smaller wave peaks. Notably, when the element size was 10 mm, the deformation of the cruciform structure along the axial direction was mainly concentrated on the element directly below the hammer head, and the element was deleted rapidly, causing the load to drop quickly before the cruciform structure buckled. When using the RTCL failure criterion, the center of the cruciform structure mainly undergoes compression deformation, and at this position, the element does not accumulate damage and will not fail. However, the connection between the front panel and cruciform structure undergoes bi-directional tensile deformation due to the presence of a weld joint and section change, resulting in stress concentration and damage accumulation. As a result, when using the RTCL failure criterion, the simulation results show four tears that are consistent with the experiment. Compared with the BWH and EPS failure criteria, the RTCL failure criterion is more suitable for simulating the failure of this structure.
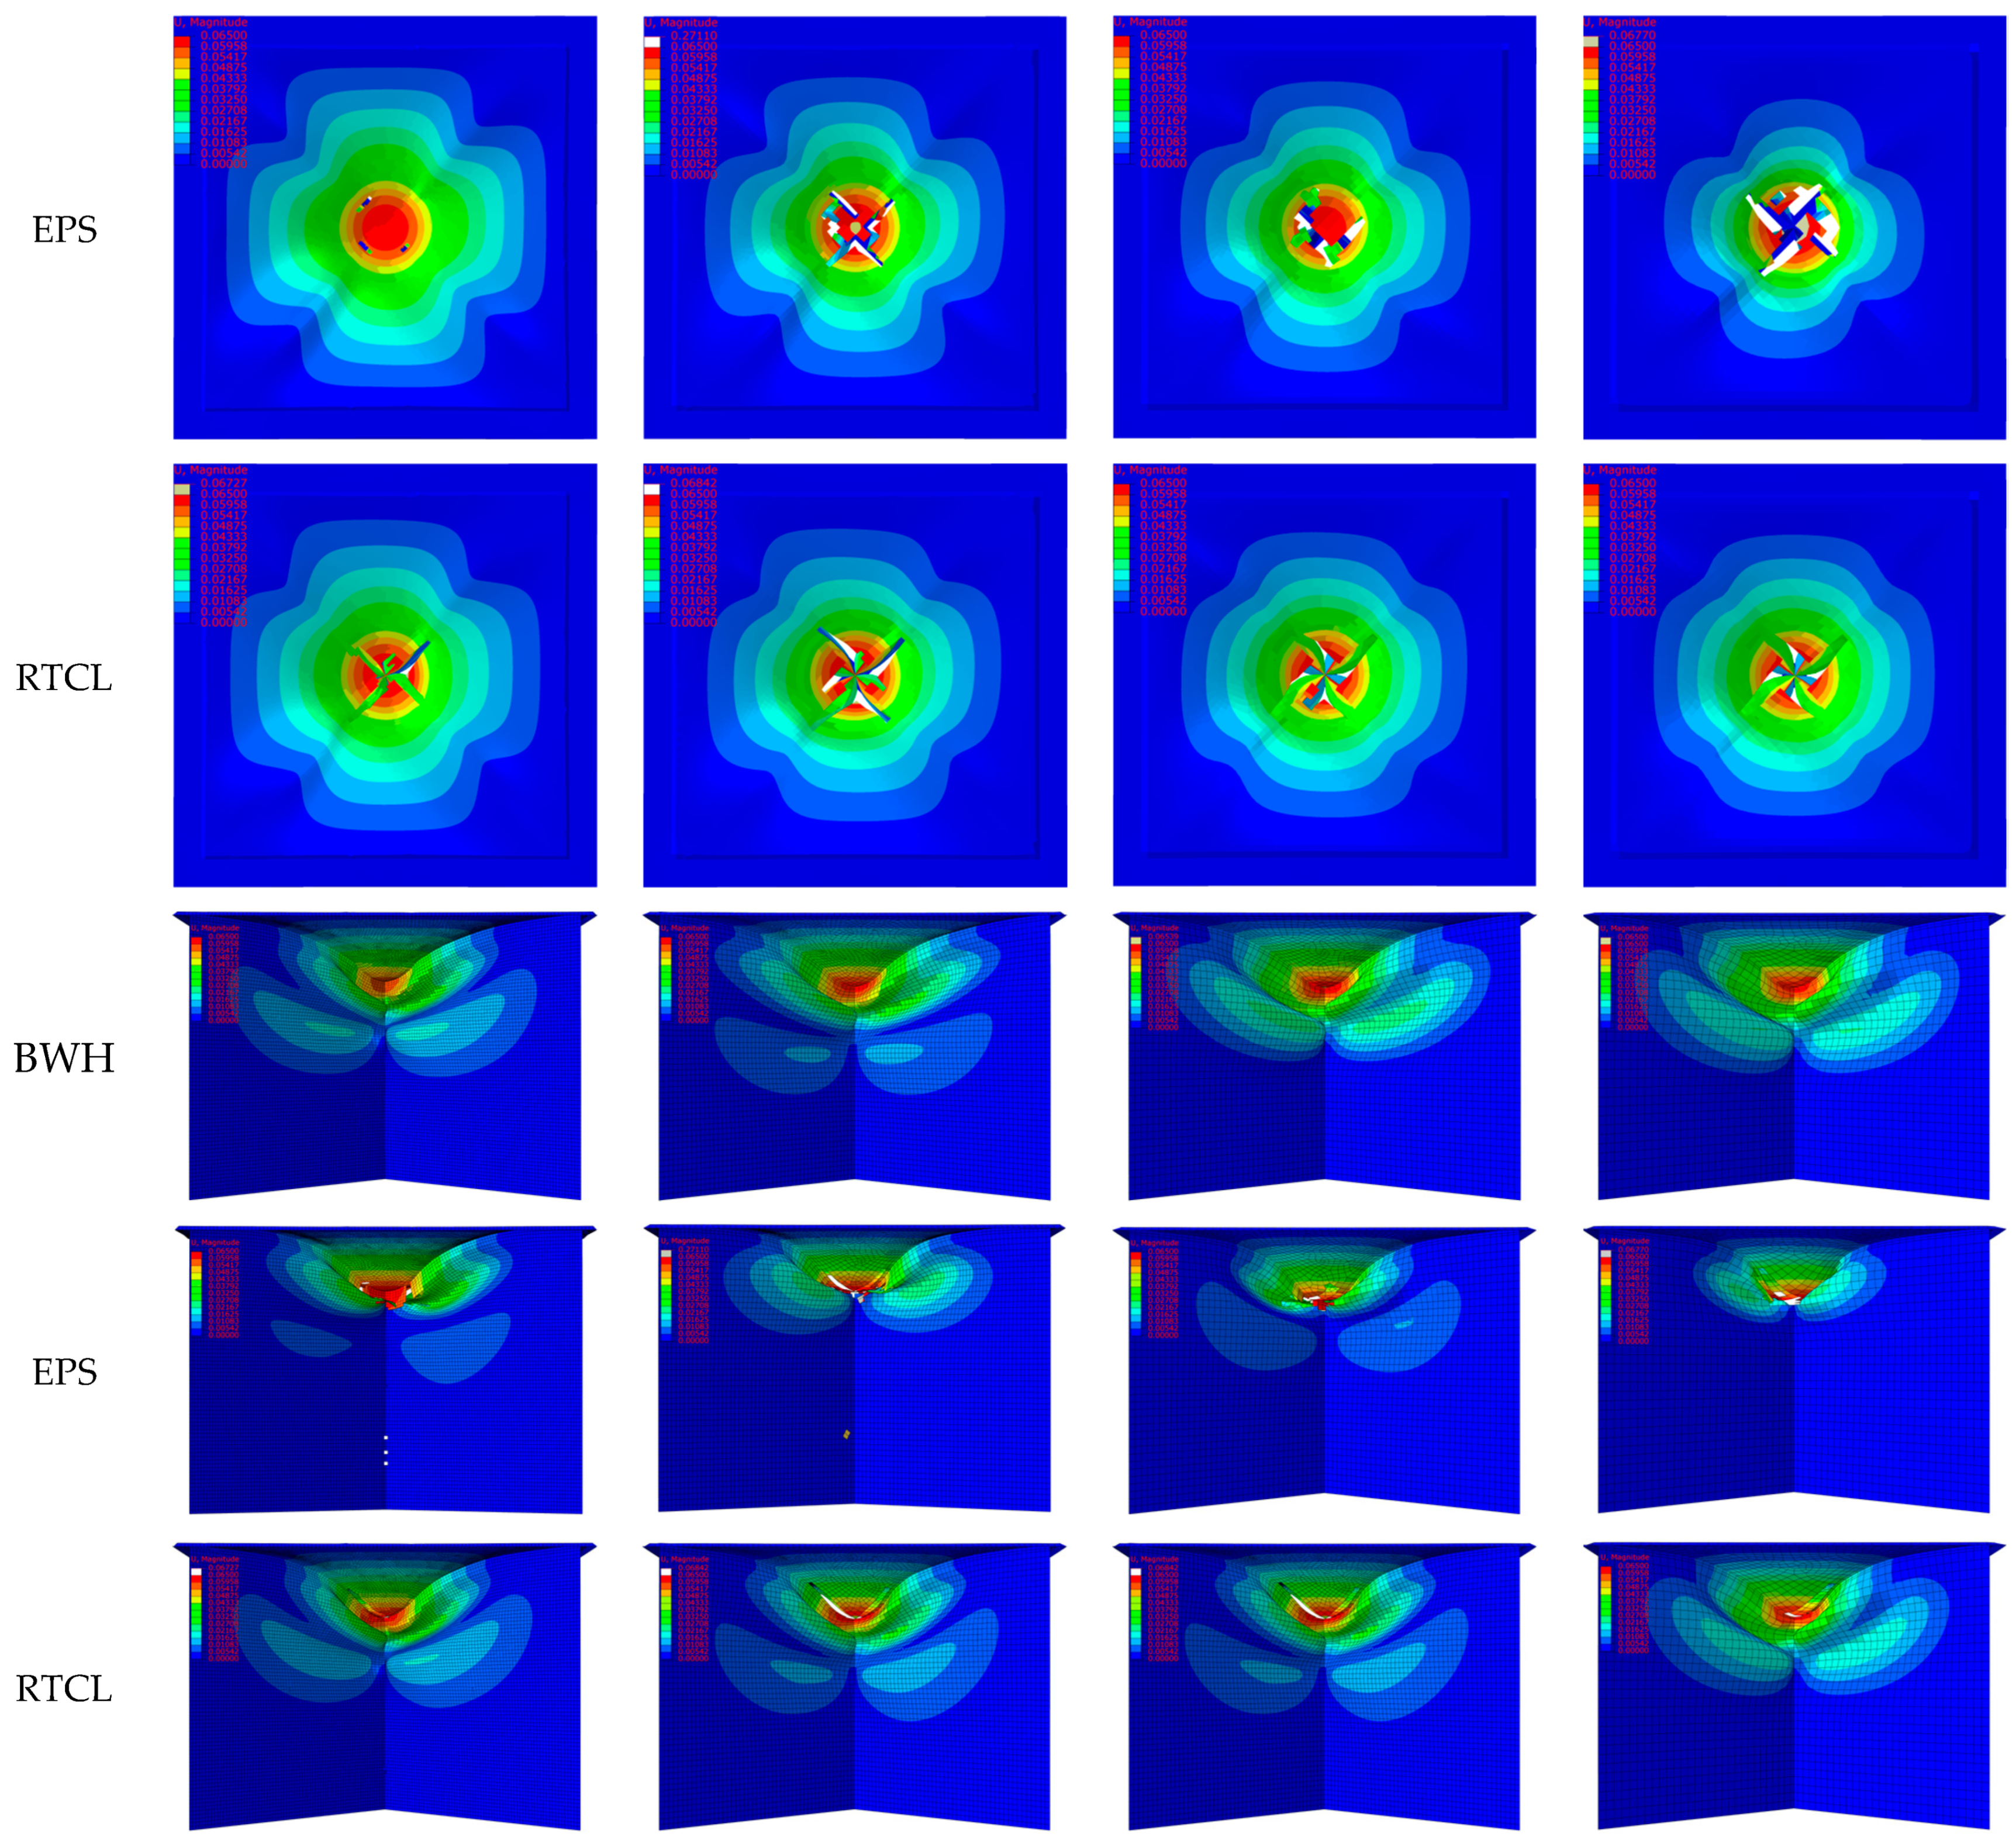
The deformation maps of the structure with three failure criteria and four mesh sizes are shown in Figure 18 when the height of the hammer drop was 0.5 m. From the deformation cloud maps of the front panel, it can be seen that when using the EPS failure criterion with a mesh size of 10 mm, the concave deformation of the panel is relatively large, and a layer of elements on the upper end of the corresponding cruciform structure fails and is deleted. From the force–indentation curves in Figure 19, it can be seen that when using the EPS failure criterion with a mesh size of 10 mm, the shell element directly below the welded element at the upper end of the cruciform structure fails before the cruciform structure buckles, resulting in a rapid decrease in the load curve. As the mesh size increases, the height of the wrinkles formed on the cruciform structure increases to a certain extent. The force–indentation curves for the other computational cases are similar and show the opposite pattern to that of the quasi-static tests, i.e., as the mesh size increases, the height of the wrinkles along the axial direction of the cruciform structure increases, the number of structures involved in deformation absorption increases, and the maximum displacement and residual deformation of the indenter are relatively small.
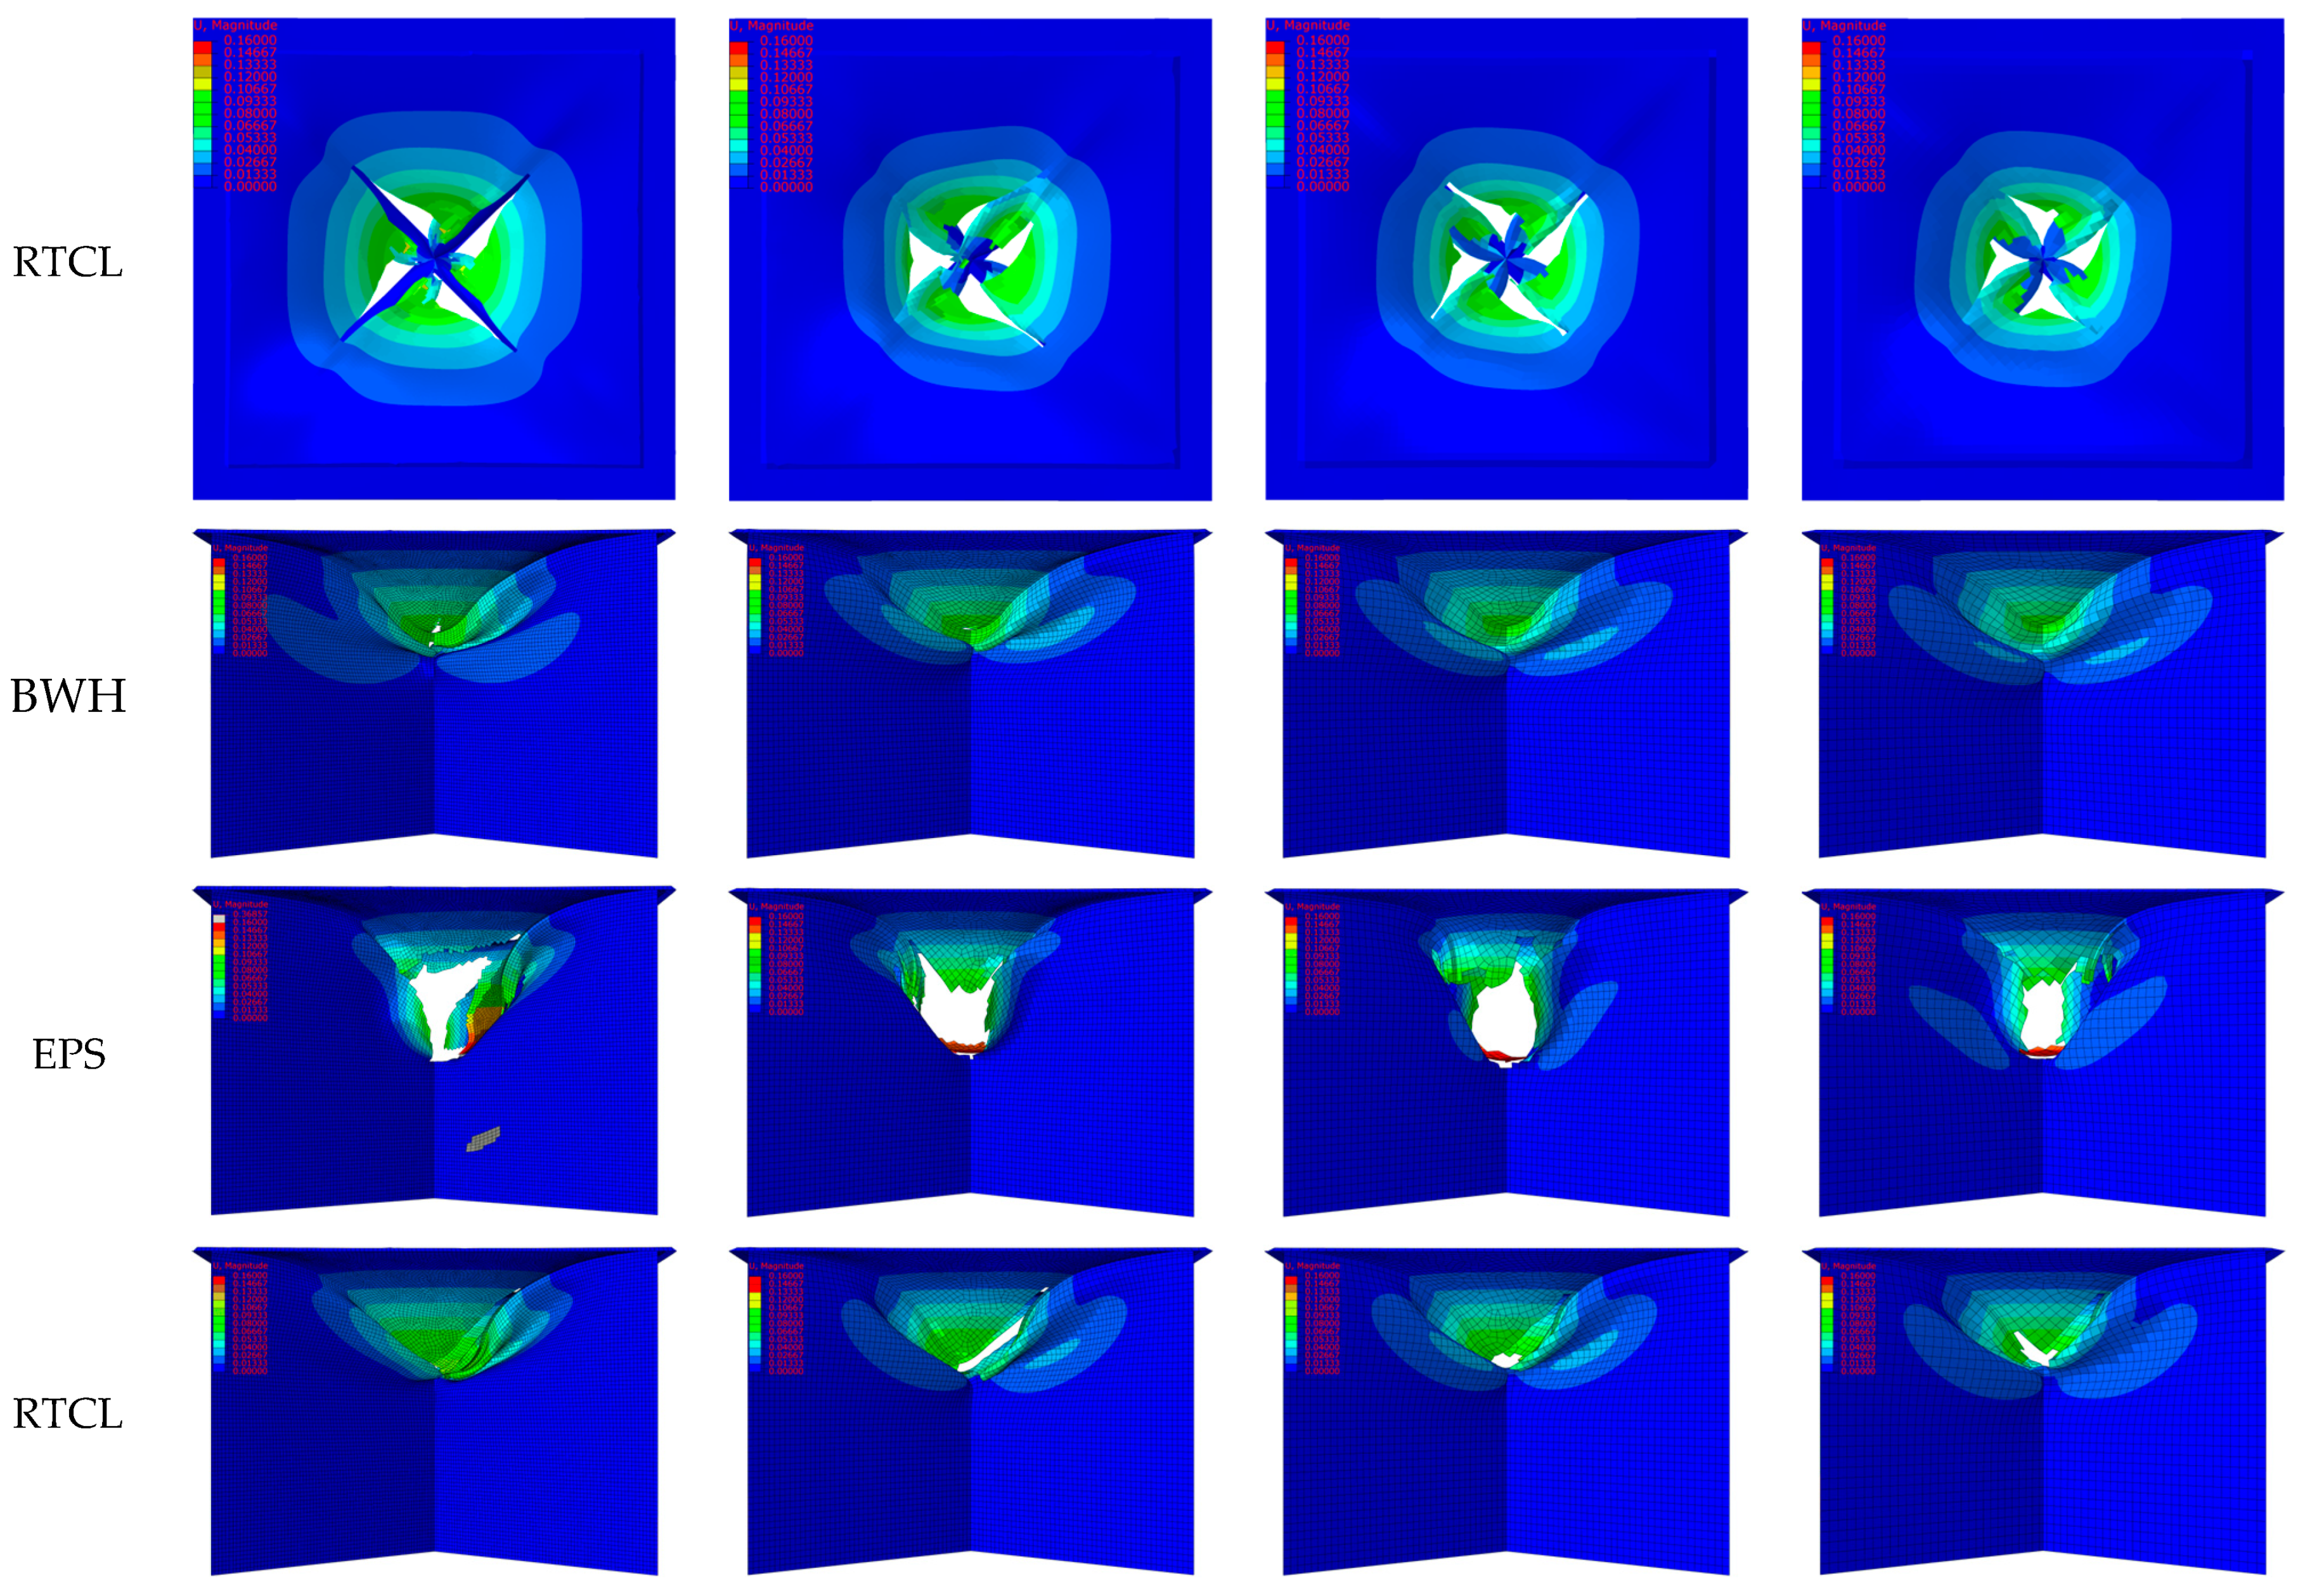
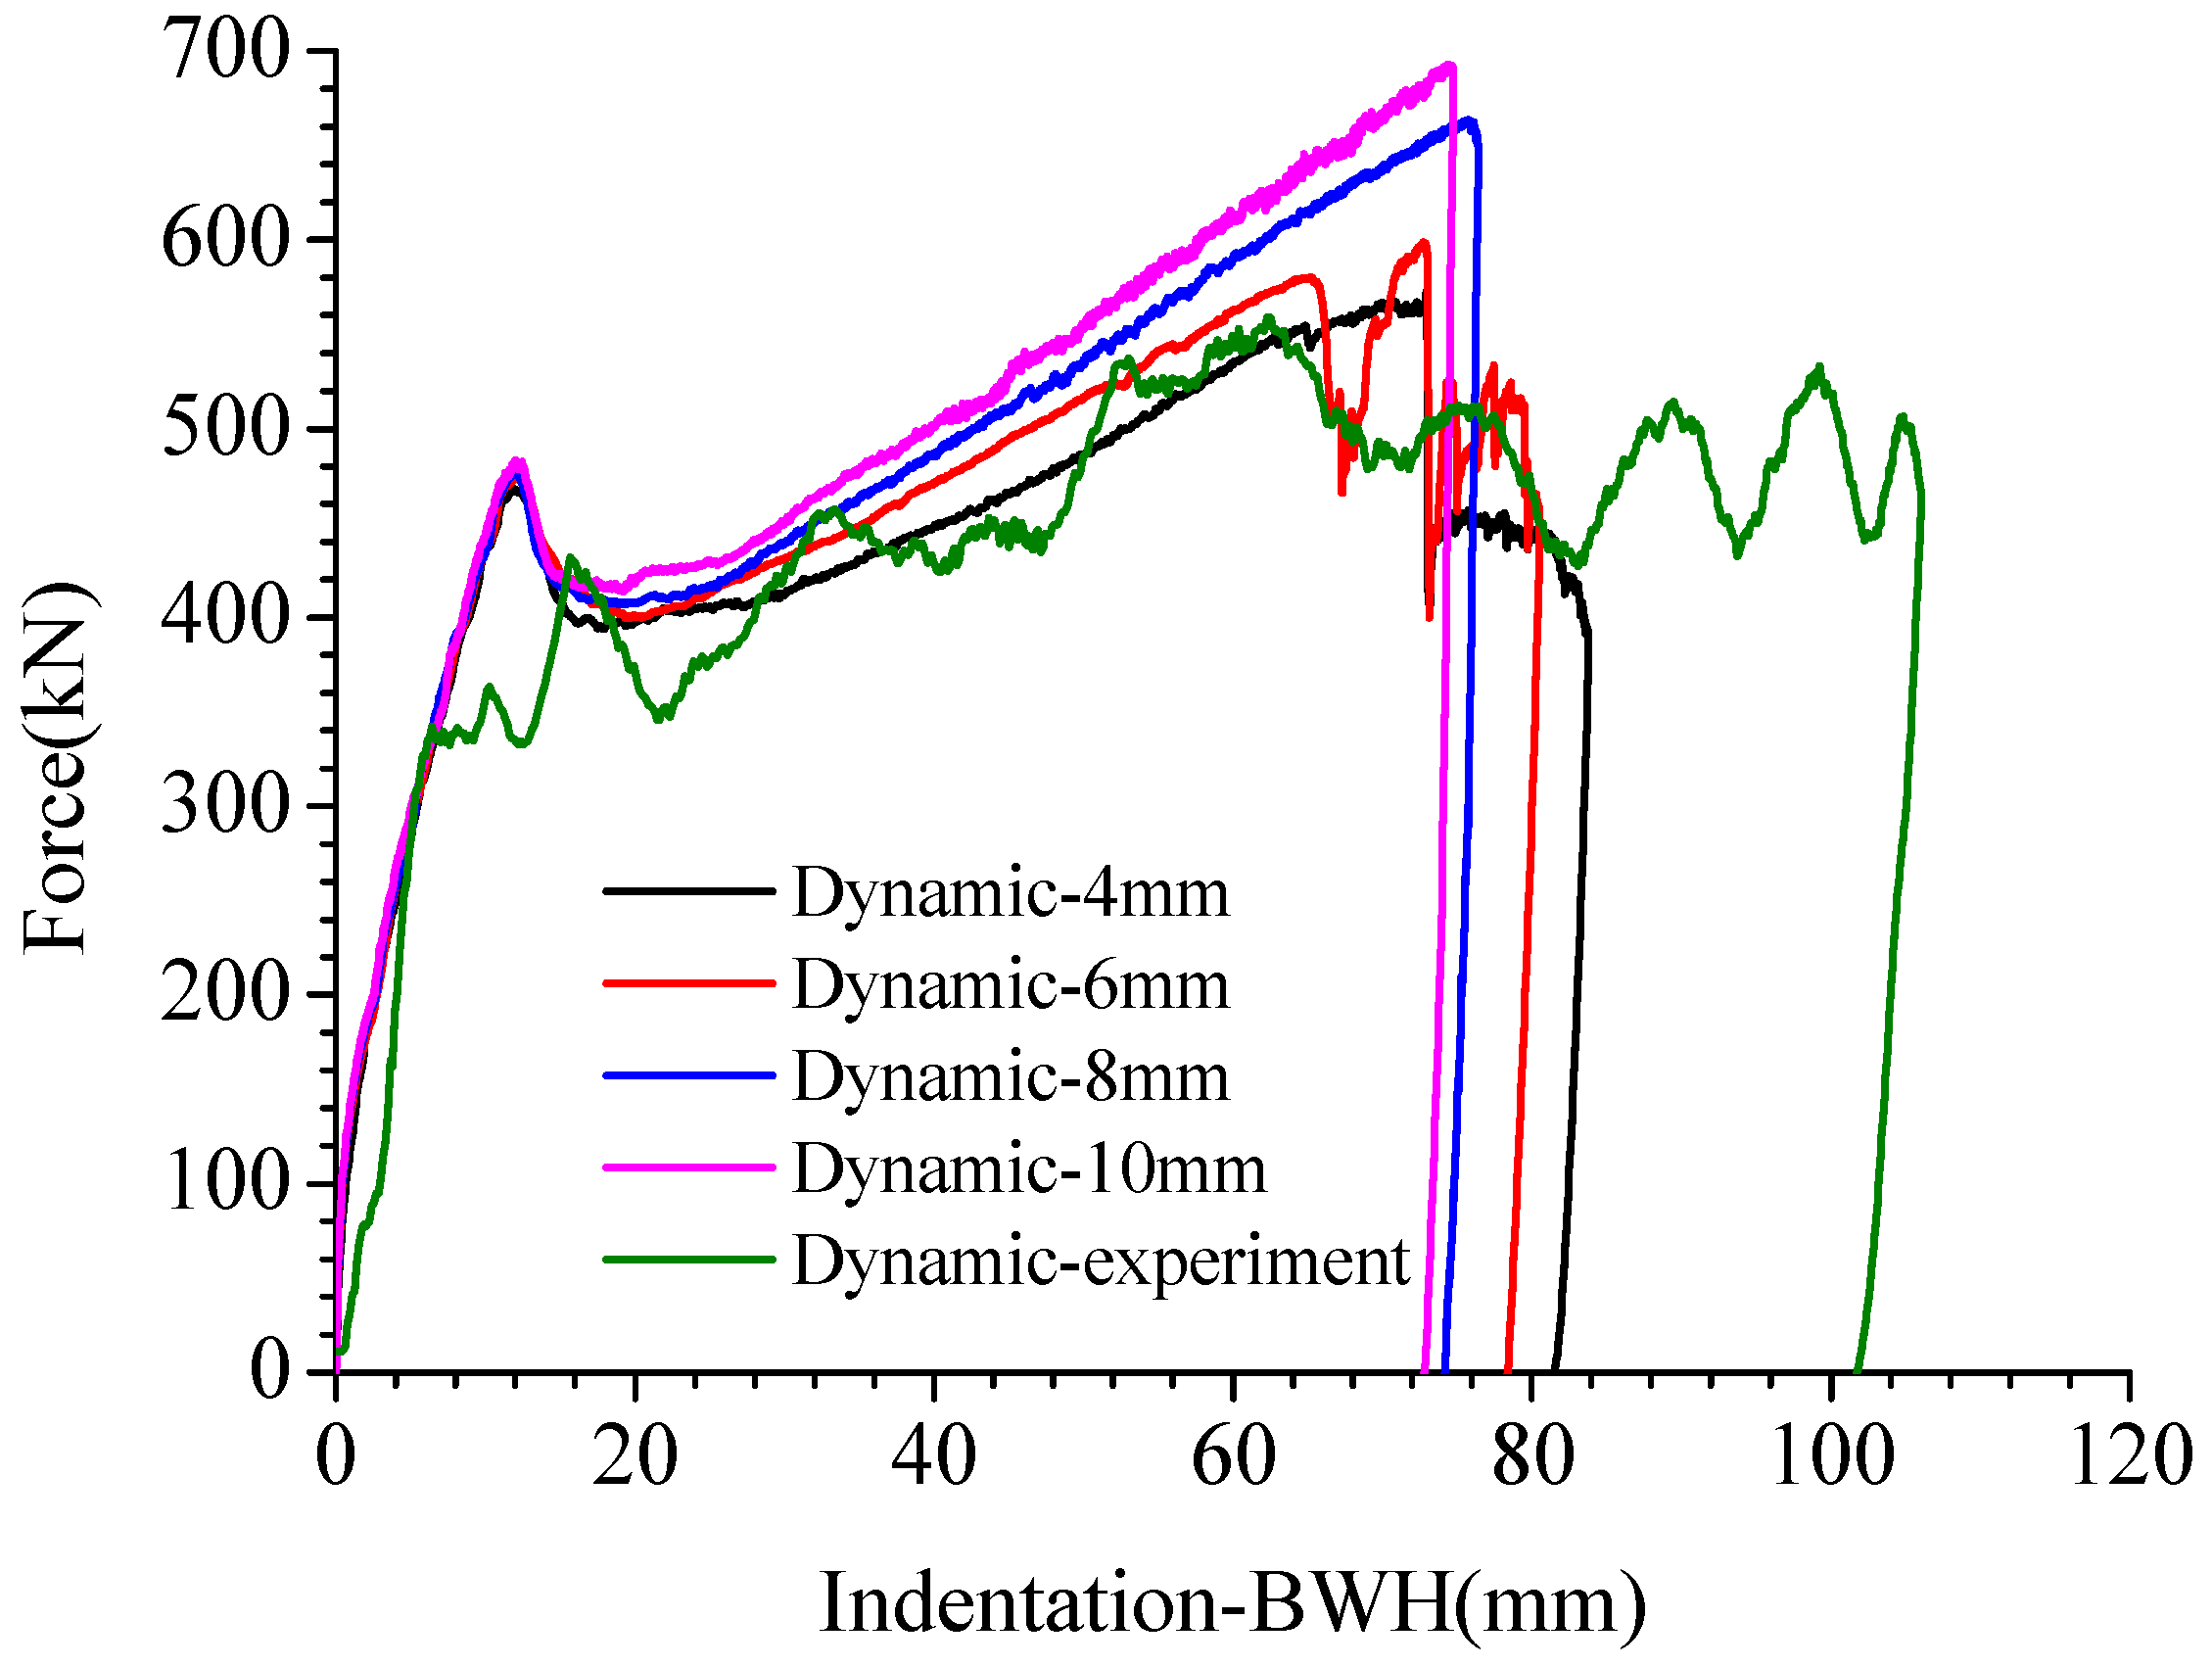
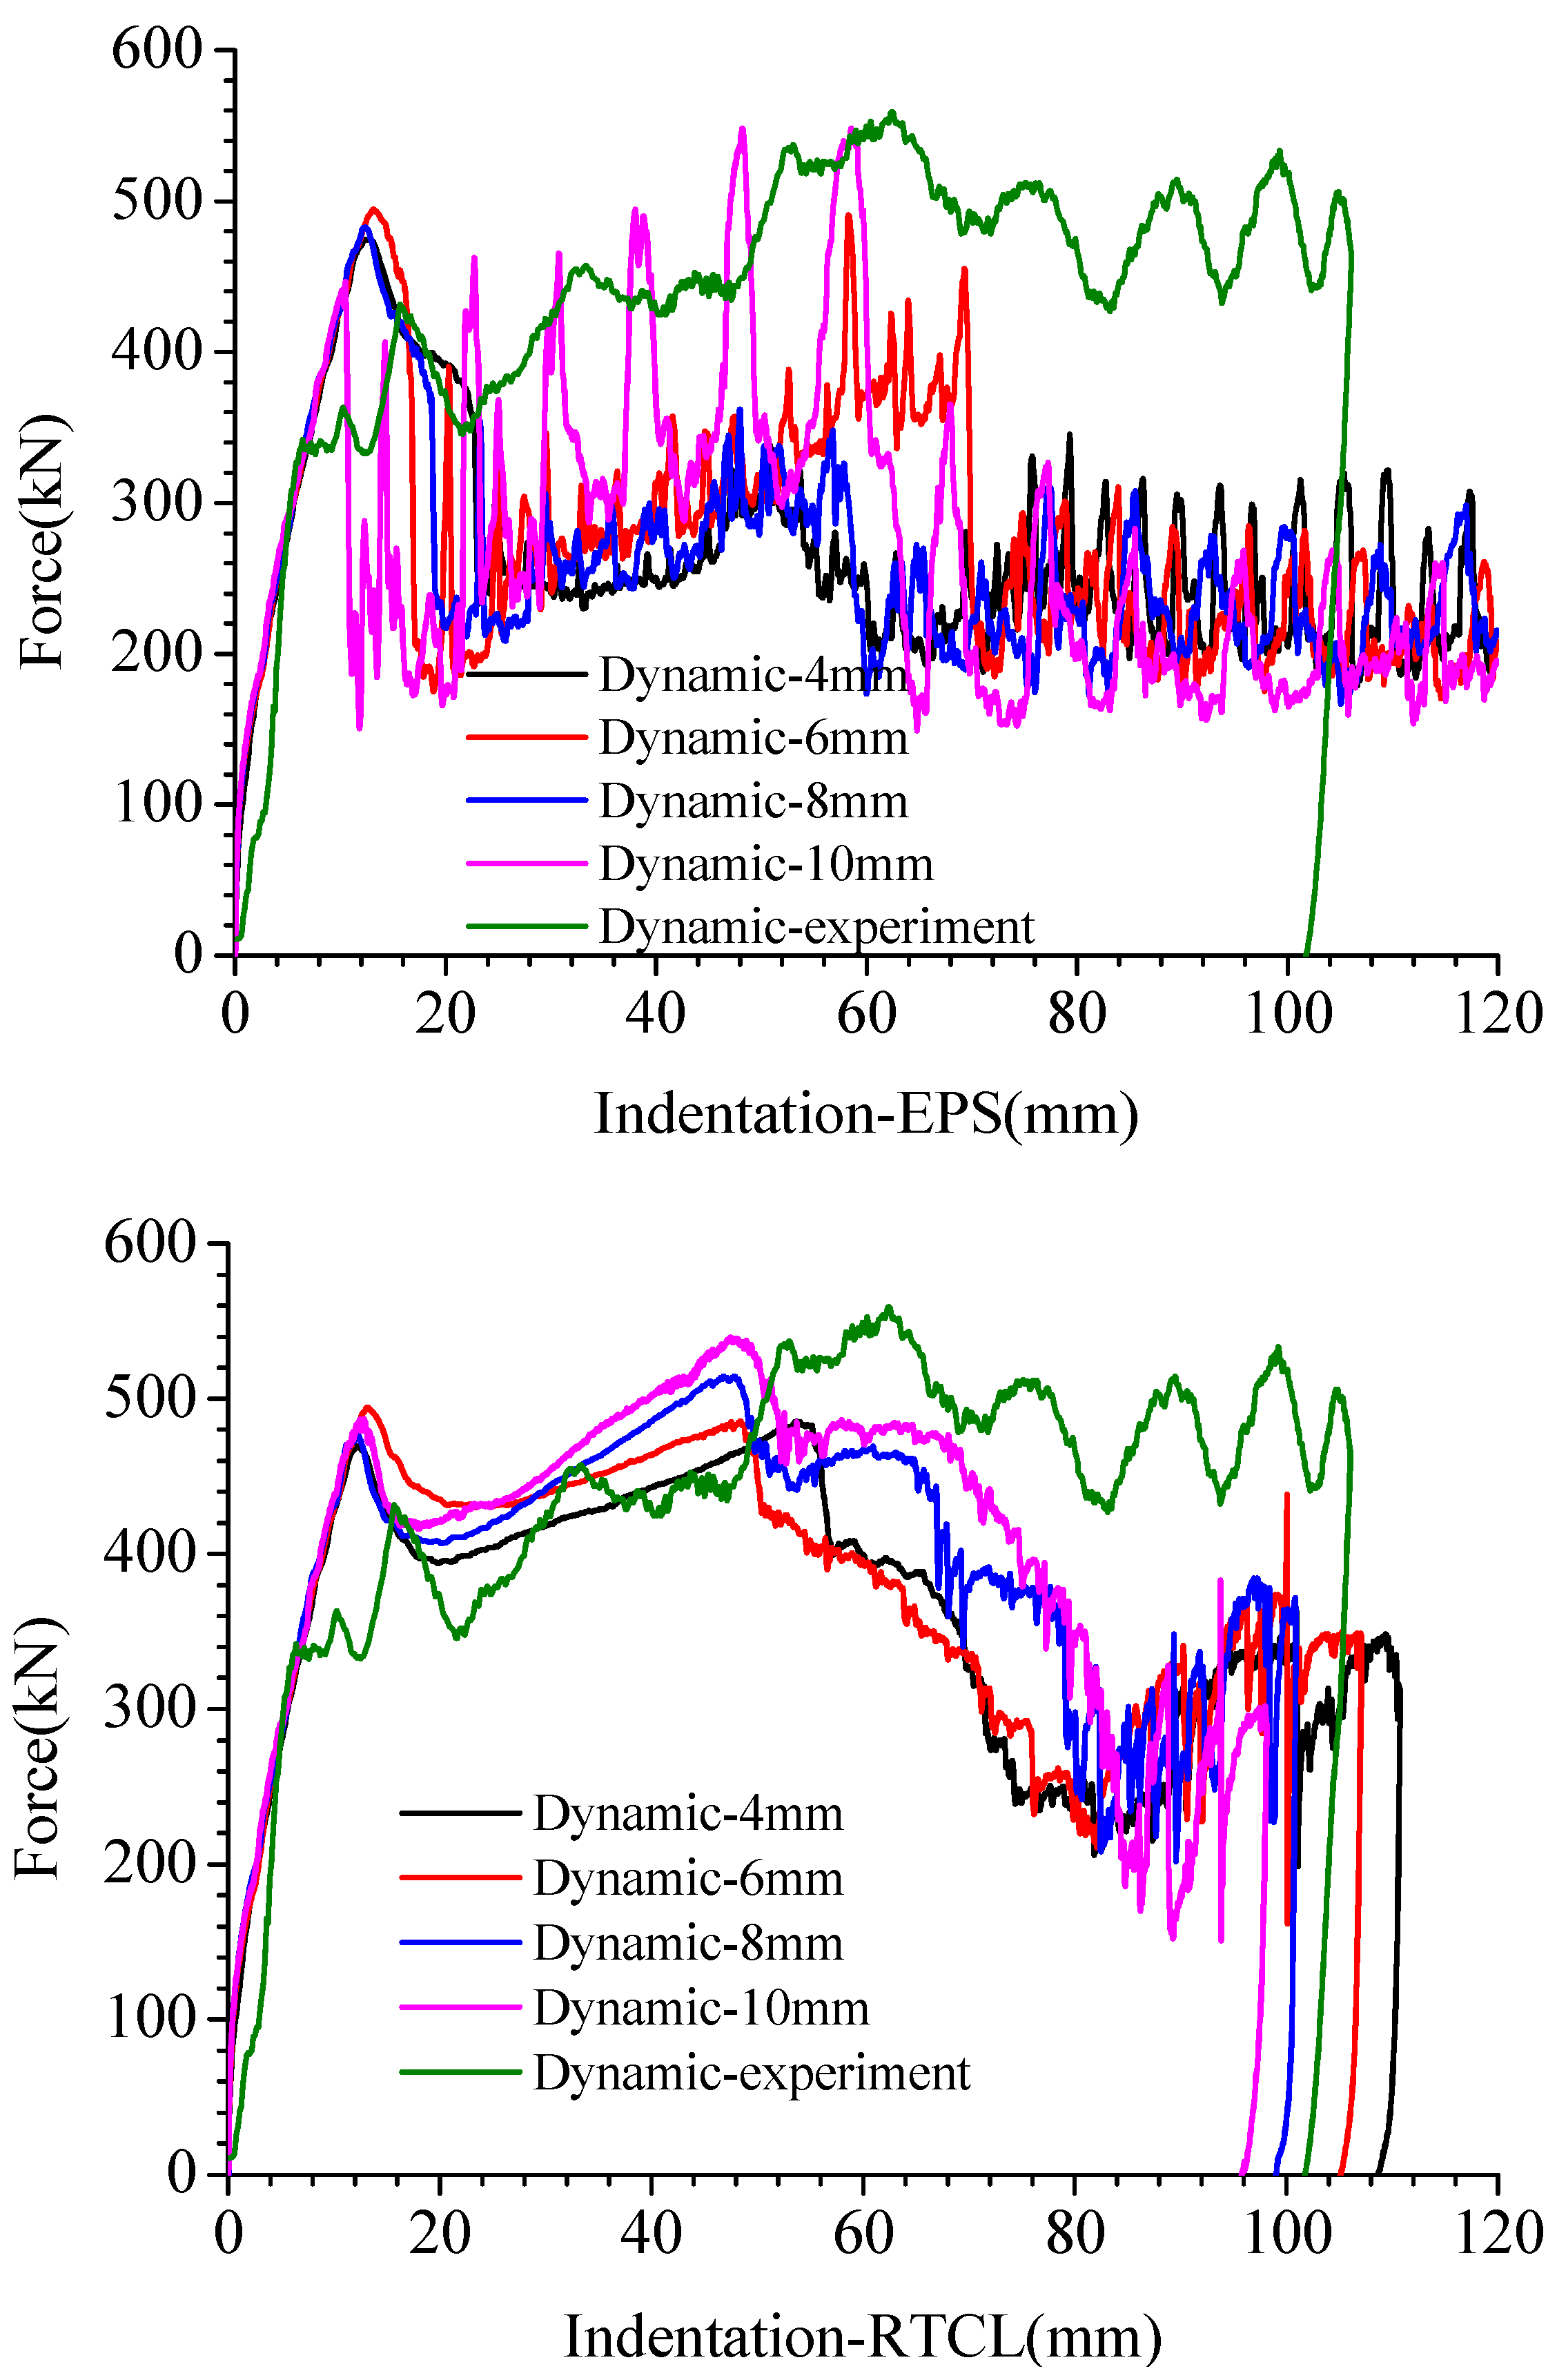
Figure 20 shows the structural deformation diagrams using three failure criteria and four grid sizes when the indenter falls from a height of 3 m. From the deformation cloud diagram of the front panel, it can be seen that when using the BWH failure criterion, there will be some damage to the panel at the 4 mm and 6 mm grid sizes, but there is no obvious damage to the cruciform structure. When using the EPS failure criterion, both the top panel and the cruciform structure suffered significant damage. The top panel showed tearing at the outer edge of the indenter, and since the indenter penetrated the top panel completely in this condition, the degree of deformation of the top panel was similar. The cruciform structure axis and the connection between the cruciform structure and the front panel both suffered obvious tearing damage. When using the RTCL failure criterion, the tearing form of the front panel was most similar to the test results, with four obvious cracks forming at the connection between the cruciform structure and the panel. The cruciform structure axis suffered obvious damage under all four grid sizes. Comparing the force–indentation curves using the three failure criteria, it can be seen that the BWH failure criterion caused relatively little damage to the structure, resulting in a smaller ultimate penetration depth than the test results. When using the EPS failure criterion, due to the deletion of many elements under the indenter and around the indenter, the structure that absorbed impact energy was reduced, resulting in an ultimate penetration depth far greater than the test results. The RTCL failure criterion accurately simulated the failure of the specimen, reproducing the characteristics of the top panel failure and the cruciform structure not failing under compression. The various curves in Figure 21 indicate that the use of the BWH failure criterion in this structure cannot effectively predict the failure of the structure, resulting in a smaller maximum penetration depth. The use of the EPS failure criterion incorrectly judged the compressive failure of the ductile metal, resulting in poor simulated impact resistance performance of the structure. The use of the RTCL failure criterion, due to the influence of grid size on the deformation characteristics of the structure, resulted in some differences in ultimate penetration depth and residual deformation, but the simulation results were closest to the test results compared to the other two failure criteria.

5.1. Effect of Failure Criteria on FE Results

The BWH failure criterion determines the failure of a unit using the necking of the material. It is more difficult to obtain the damage state of a structure accurately in calculation conditions where the structure is complex, the stress state varies greatly, and the stress gradient varies widely. In cases where the stress state is more homogeneous, such as when the structure has a large area in the bi-directional tensile state, the tearing of a ductile metal structure after necking can be predicted more accurately. The EPS failure criterion and the RTCL failure criterion determine the failure of a cell by the cumulative damage to the cell, where the EPS failure criterion defines that the cell fails when the equivalent plastic strain accumulates to the failure strain and the RTCL failure criterion introduces the stress triaxiality to consider the stress state of the cell. The stress state influences the cumulative damage value resulting from the plastic strain.
By comparing the structural deformation and displacement–load curves in Figure 16, Figure 17, Figure 18, Figure 19, Figure 20 and Figure 21, it is seen that the RTCL failure criterion can better predict the damage of this cross structure under in-plane ramming loads, and the simulation results are closer to the experimental results. Due to the complex and variable stress state of the structure, it is difficult for the BWH failure criterion to determine the failure of the unit by necking down, while the EPS failure criterion produces a large compressive deformation directly below the indenter when the cruciform structure is axially compressed, resulting in a large local strain. The EPS failure criterion determines the failure of the unit early, resulting in the premature removal of the cruciform structure unit directly below the indenter, which in turn affects the deformation of the overall structure and results in a lower impact resistance than is the case.

5.2. Effect of Mesh Size on FE Results

Using different mesh sizes in this structure will lead to different deformation modes of the cruciform structure, and the corresponding collision load will also vary. When the mesh size is larger, the height of the wrinkles generated in the cruciform structure will be relatively large. After the cruciform structure buckles, the range of stable membrane tension deformation of the cruciform structure is relatively large, leading to a faster rate of load increase. Comparing the force–indentation curves in the simulation results under different test conditions, the yield limit of the cruciform structure shows a slight increase with the increase in mesh size.

5.3. Comparison of the Dynamic and Static Response of the Structure

By comparing the load–displacement curves in Figure 17, Figure 19 and Figure 21, it can be observed that in quasi-static conditions, the initial peak load is around 400 kN, while in the 1.5 m drop condition, the initial peak load is around 440 kN, and in the 3 m drop condition, the initial peak load is around 490 kN. When the structure undergoes failure in the 3 m drop condition, the impact load is approximately 13% higher compared to the quasi-static condition. This indicates that in high-speed collision scenarios, both the ultimate buckling load and average impact force of the structure are higher than those in quasi-static collision scenarios.

6. Analysis of the Effect of Friction Coefficient and Indenter Offset

In actual ship accidents, there are many uncertainties in environmental factors such as boundary and load conditions, and it is impossible to include all scenarios in experiments. In this section, the influence of the friction coefficient and collision position between two structures on the structural response will be compared and discussed.

6.1. Effect of Coefficient of Friction

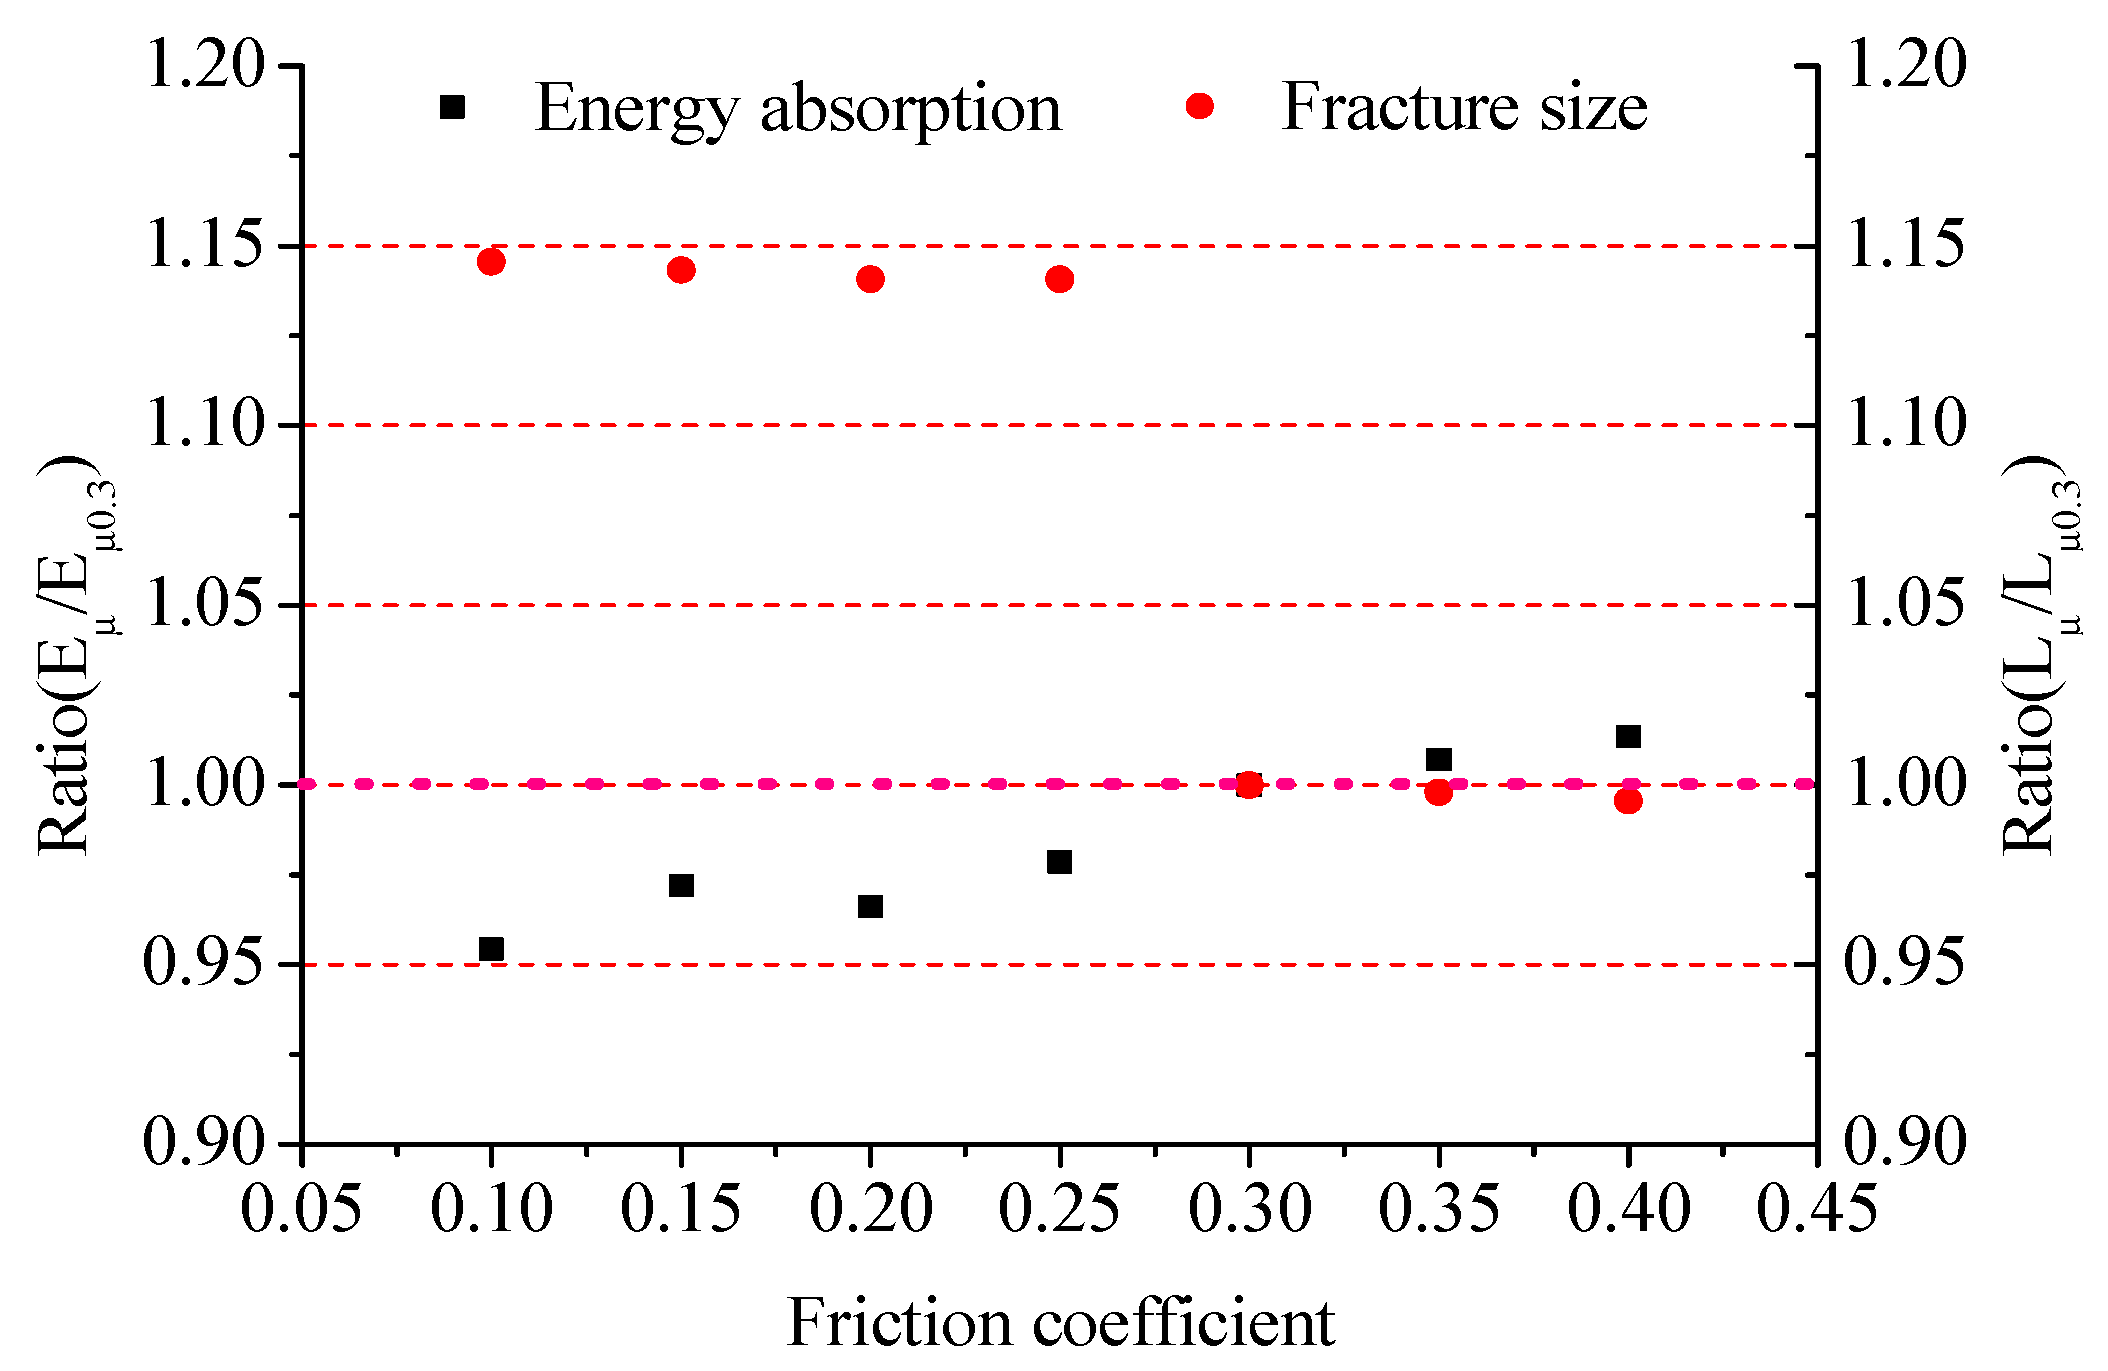
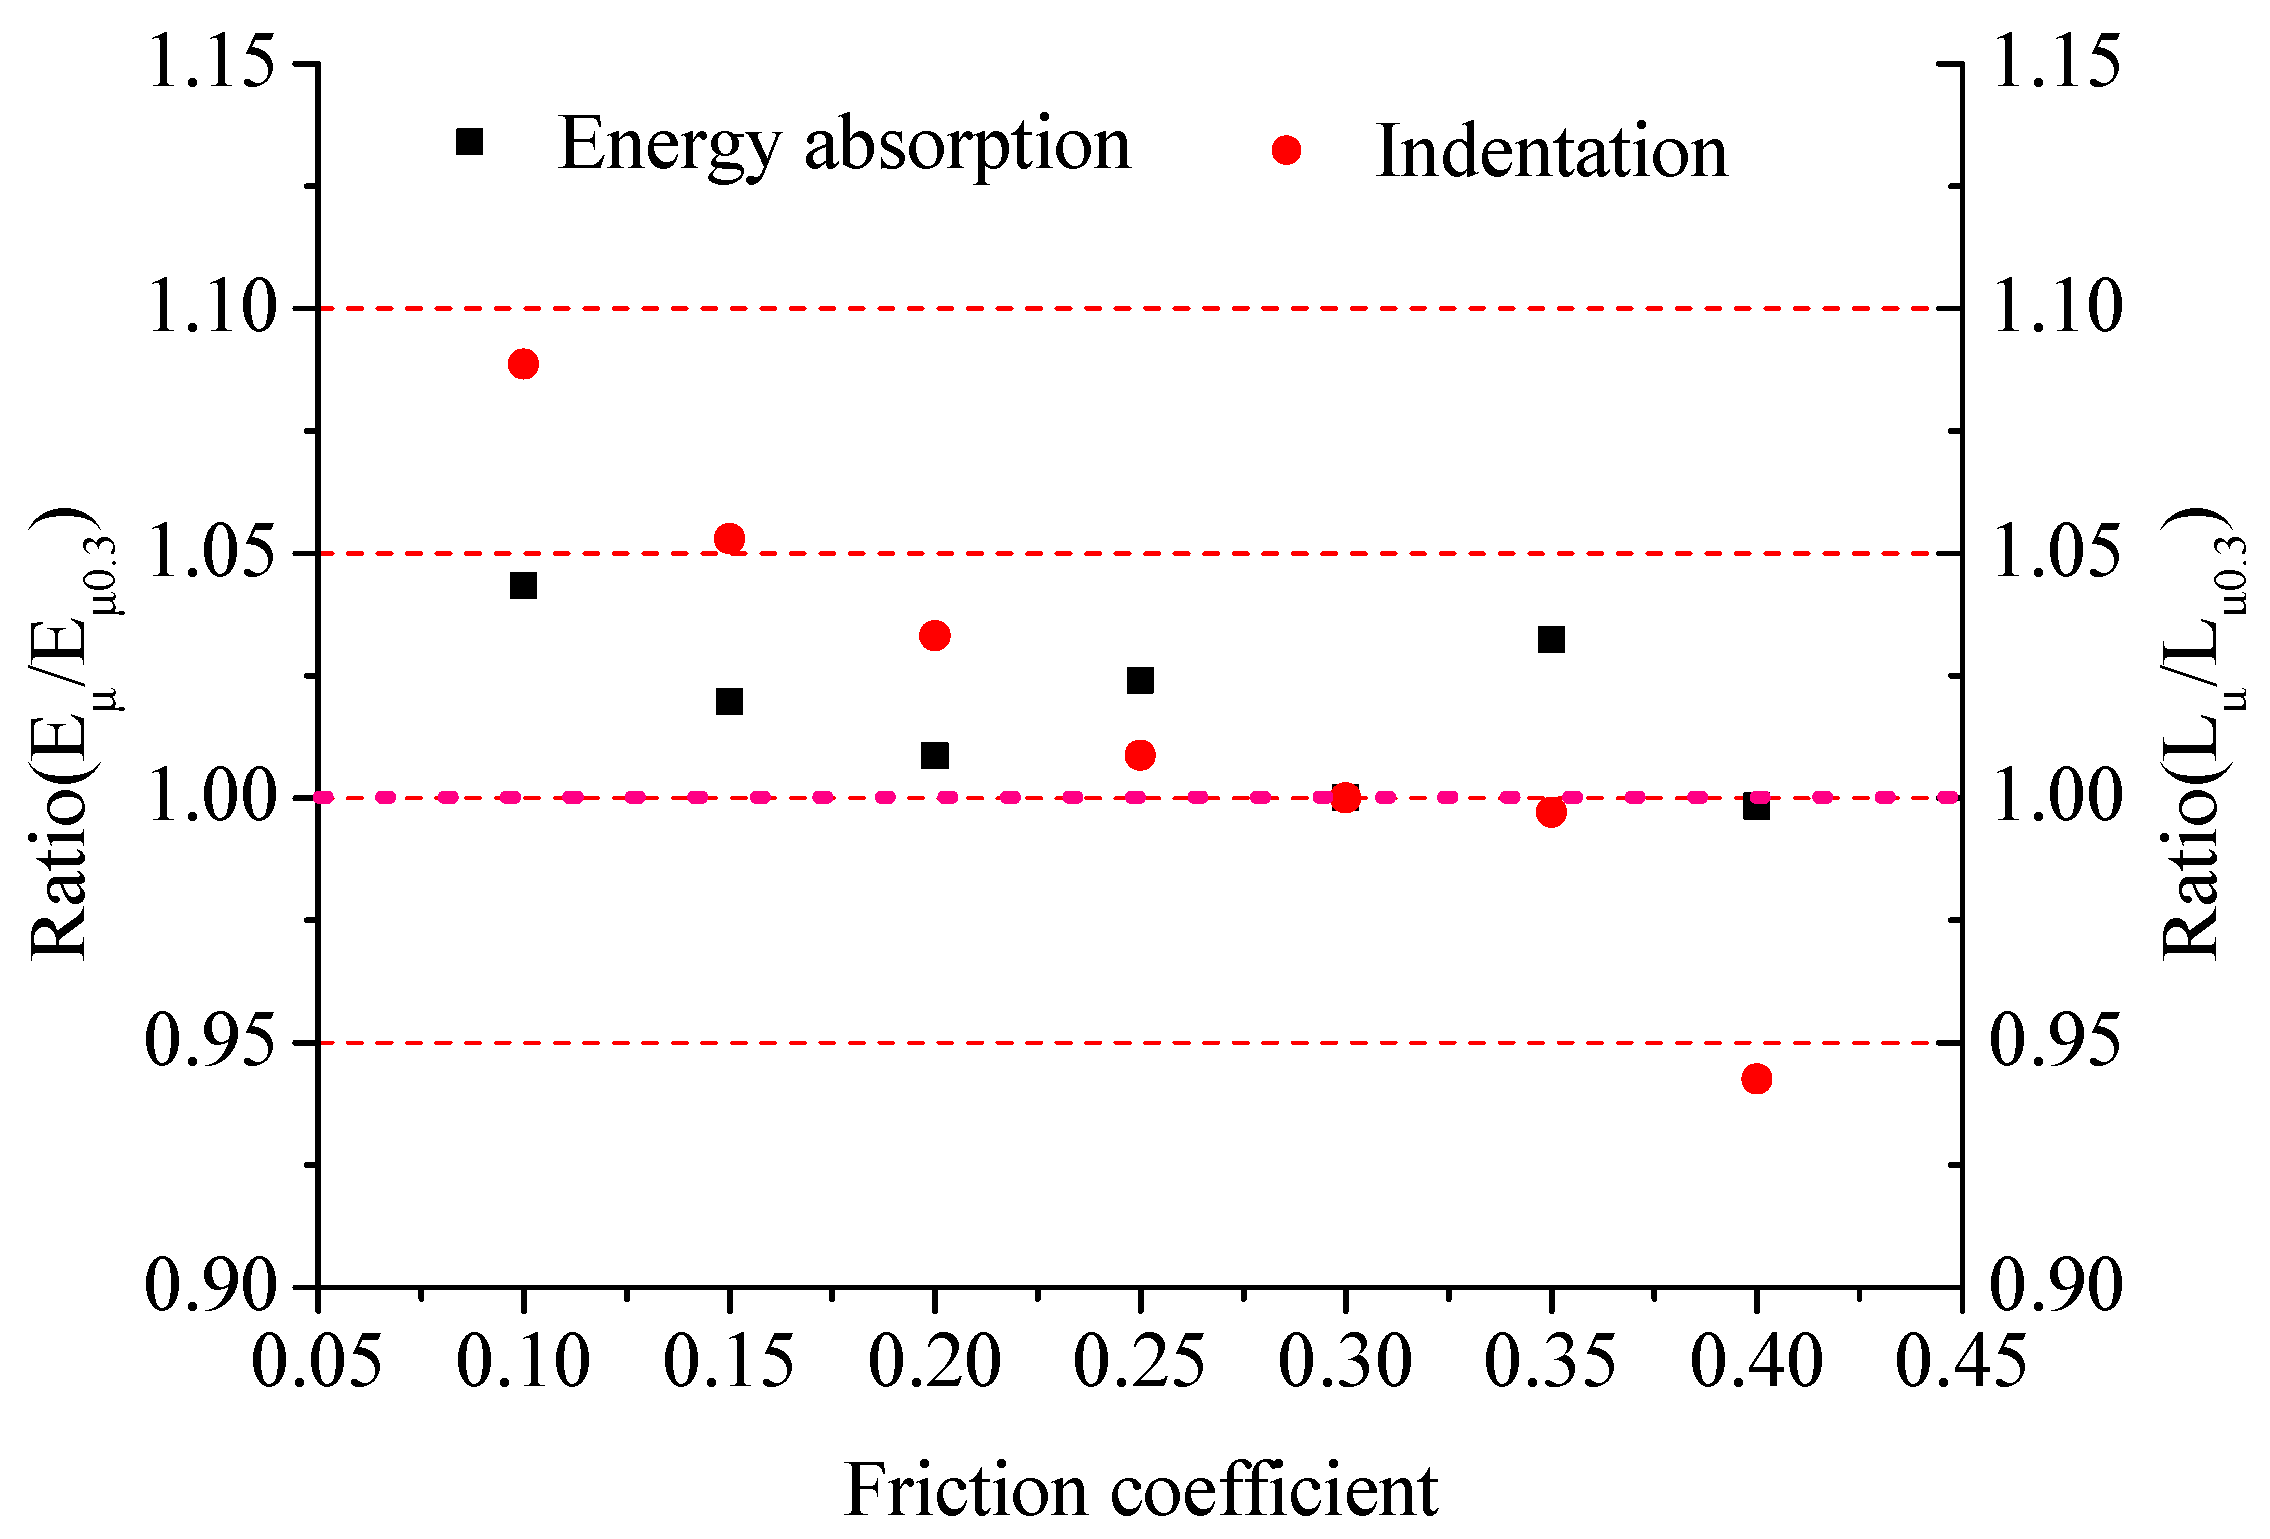
By changing the friction coefficient between the indenter and the specimen from 0.1 to 0.4, the influence of the friction coefficient parameter on the structural response is compared in the same quasi-static accident scenario with the same impact energy collision scenario. The corresponding quasi-static test and 3.0 m falling impact test were performed, the failure criterion used was the RTCL failure criterion, and the mesh size used was 10 mm to minimize the computation time.
As shown in Figure 22, when the friction coefficient is taken as 0.3 as the benchmark, the crack size of the structure increases significantly when the friction coefficient is small in the quasi-static scenario. This is particularly evident when the friction coefficient is 0.1, 0.15, 0.2, and 0.25, which is greater than other friction coefficient calculation conditions. This is because the finite element mesh has a certain size and cannot represent continuous cracks. Moreover, within the range of the friction coefficient variation, the change in structural energy dissipation is within 5% of the benchmark condition. Therefore, it is determined that under the same impact depth, the size of the structure crack decreases slightly with the increase in the friction coefficient. On the contrary, the overall energy dissipation of the structure shows a slight increase, as the presence of friction results in a stronger constraint on the deformation of the structure, resulting in more energy absorption. As shown in Figure 23. The difference in the maximum energy dissipated by the structure for the same impact energy is small, within 5% of the baseline value. However, the impact depth of the indenter shows a significant decrease with the increase in the friction coefficient, mainly because the decrease in the friction coefficient results in less constraint on the deformation of the structure, and the deformation area is relatively concentrated, resulting in greater damage to the structure.

6.2. Effect of Indenter Offset

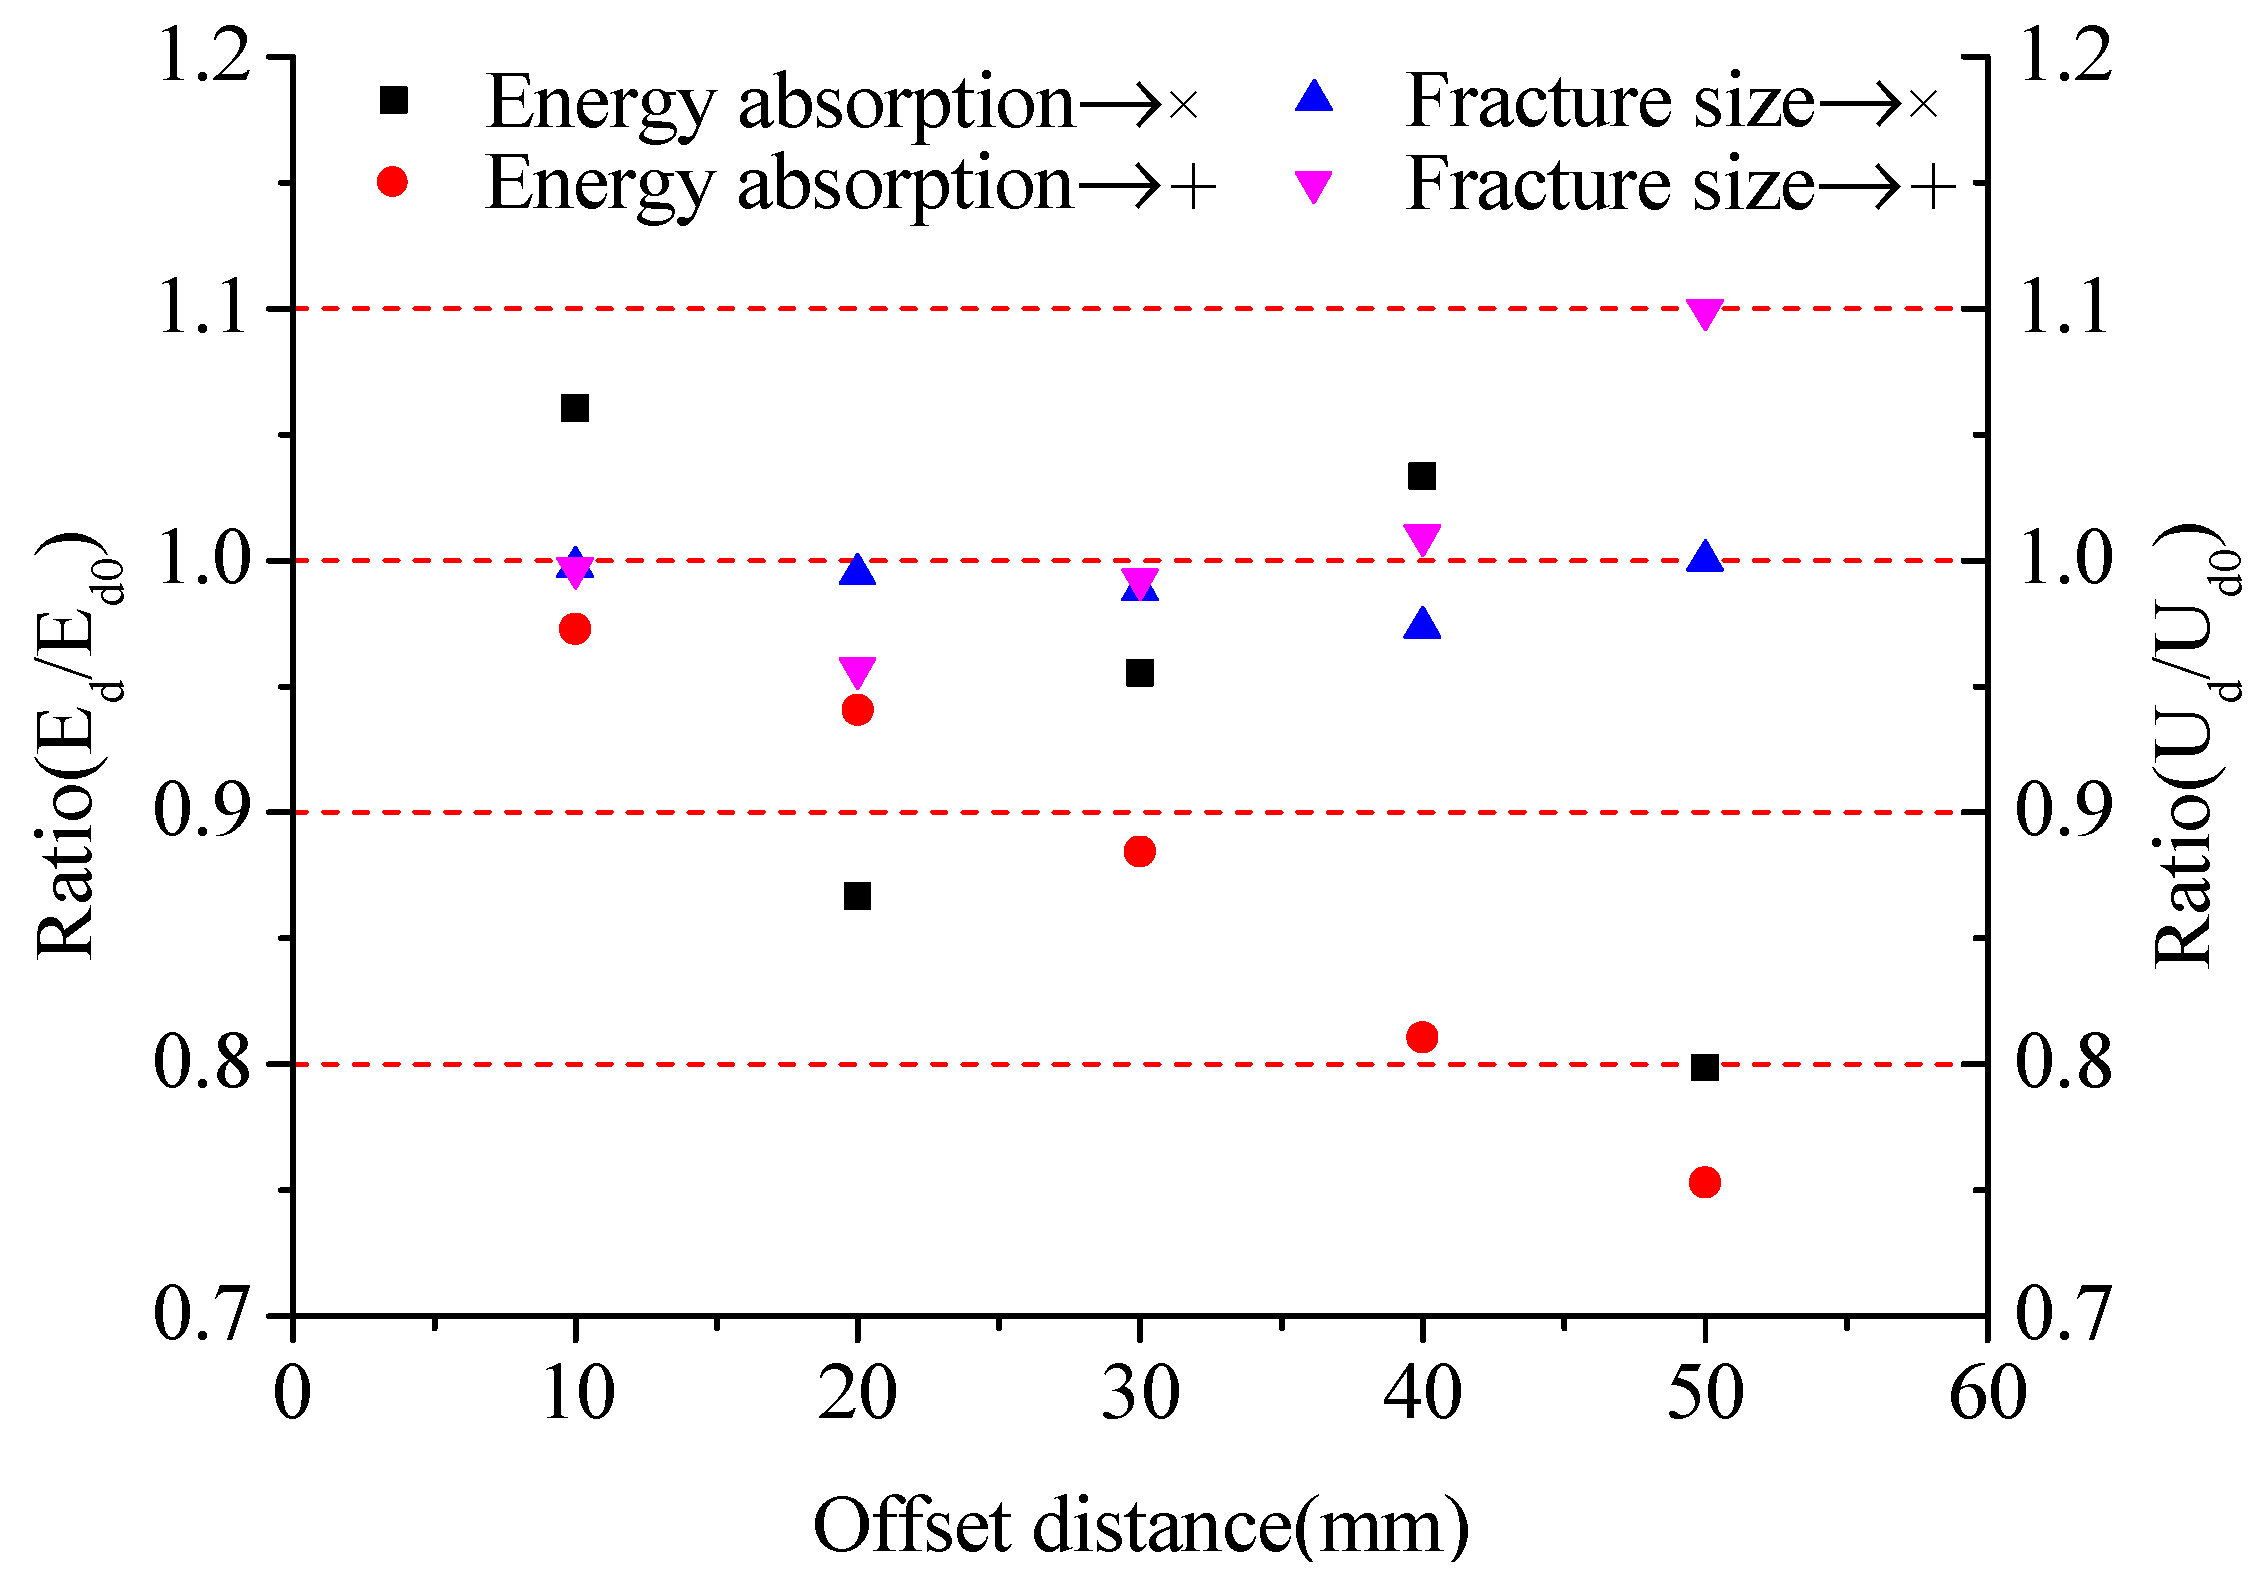
In addition, as it is well known, changing the collision center position has a significant impact on the structural response and energy absorption. As shown in Figure 24, the indenter is moved in the direction of the rib plate and at a 45-degree angle with the rib plate, with a movement distance from 10 mm to 50 mm. The calculation conditions are the corresponding quasi-static test and the 3.0 m falling impact test, using the RTCL failure criterion, a mesh size of 10 mm, and a friction coefficient of 0.3.
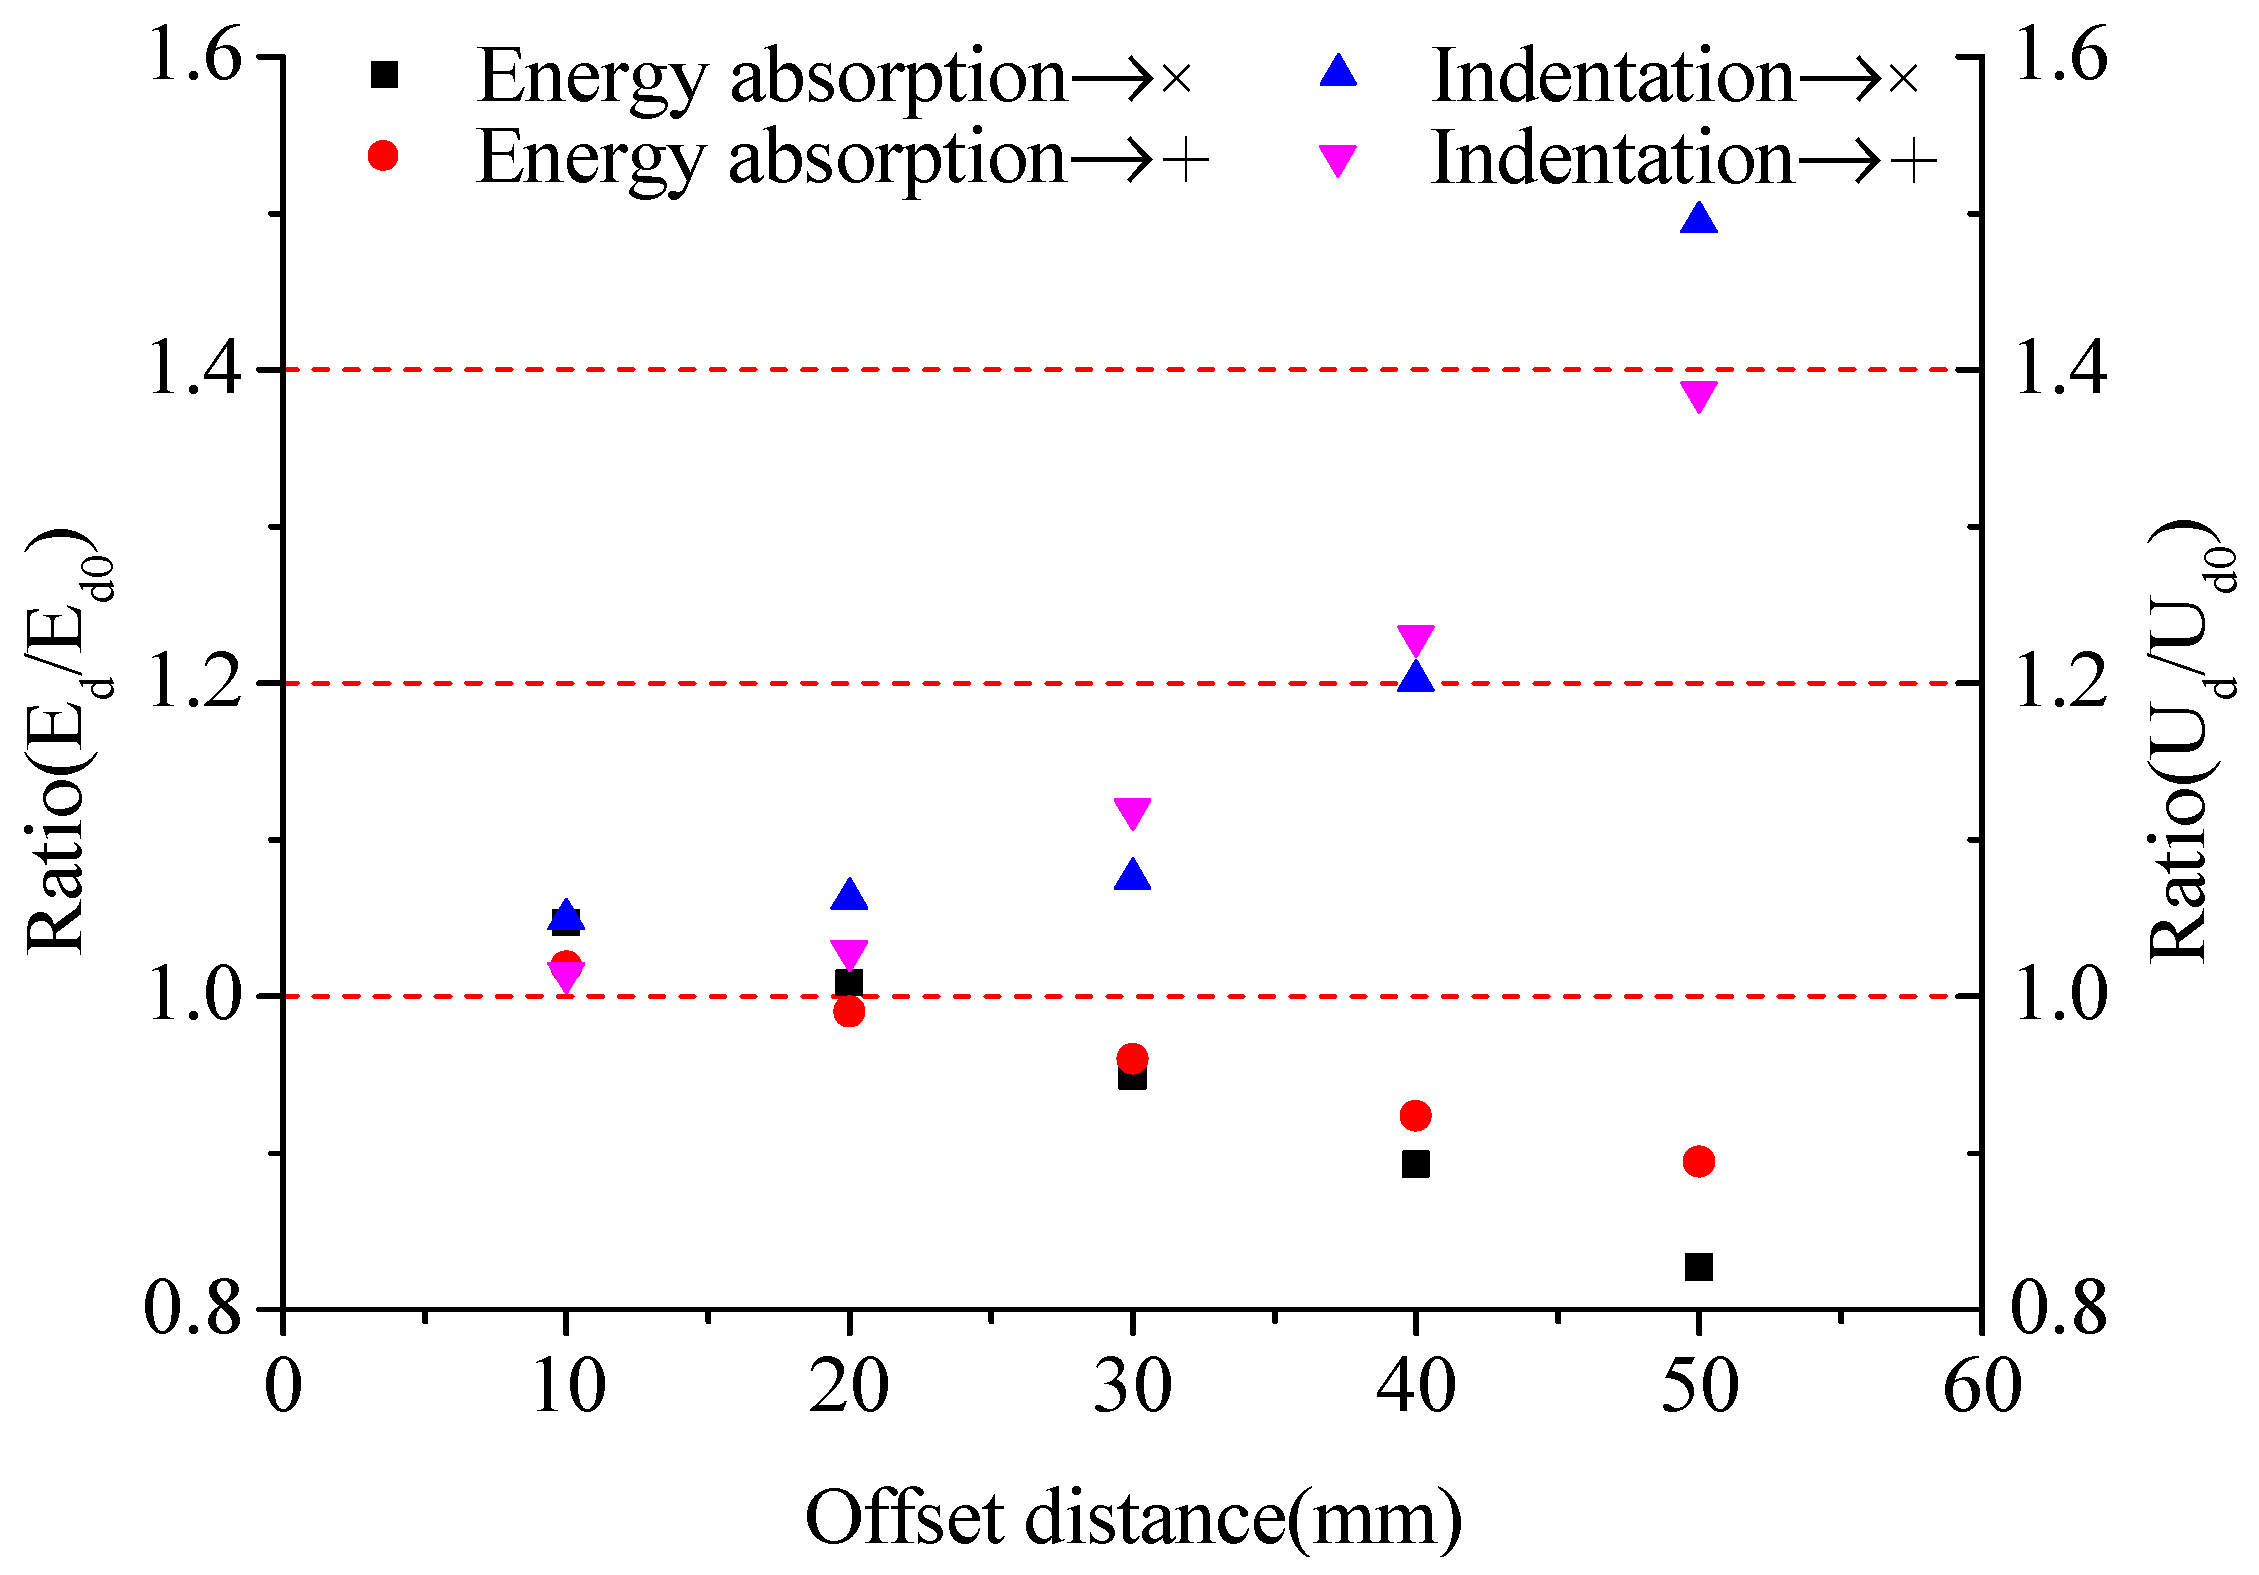
Figure 25 shows the structural response data under quasi-static and impact scenarios when the indenter impact position deviates. From the quasi-static scenario, it can be seen that under the same impact depth conditions, the higher the degree of deviation along the rib direction, the less energy absorbed by the structure. This is due to the reduction in the number of structures directly below the indenter, and the fracture size shows a significant increase when the indenter deviates the most from the axis of the cruciform structure. When the indenter deviates at a 45-degree angle with the rib, the energy absorbed by the structure shows significant random variations, and there is a significant decrease at the moment of the maximum deviation. However, the crack size does not change significantly in this deviation scenario. As shown in Figure 26, under the same conditions of impact energy calculation, the changes in the energy absorption capacity and impact depth of the structure are more obviously affected by the direction of deviation. As the deviation from the axis distance increases, the energy absorption capacity of the structure decreases, and the impact depth increases significantly.
From the above comparison, it can be seen that under small-size hammer quasi-static loads, the energy absorption characteristics of the cruciform structure change are slight. In the impact scenario, the reduction of the friction coefficient among the structures will lead to a decrease in the impact resistance performance of the structure and a reduction in the ability to absorb impact energy. With the deviation of the indenter relative to the axis of the cruciform structure, the energy absorption capacity of the structure significantly decreases due to the decrease in the structure directly below the indenter, and the impact depth significantly increases.

7. Conclusions

This study designed and conducted quasi-static and falling weight impact tests on a typical ship’s cruciform structure. Material property tests were carried out on the test specimen to obtain the true stress–strain relationship of the material. To determine the parameters for using the EPS and RTCL failure criteria, numerical simulations were conducted on uniaxial tensile tests using Ling’s method, and the failure strain corresponding to different mesh sizes was determined. The models of the three test conditions were divided into sizes of 4 mm, 6 mm, 8 mm, and 10 mm, and the EPS, BWH, and RTCL failure criteria were used respectively to compare the applicability of the three failure criteria in the structure’s collision condition, as well as the influence of mesh size on the structural response.
The following conclusions were drawn from this study:
  • When the cruciform structure in a typical hull structure is subjected to in-plane loading, the structural deformation mainly has the following processes: axial compression deformation of the structure, with a rapid increase in structural resistance; flexural deformation of the structure, with a slight decrease in structural resistance; crease deformation of the cruciform structure, with a smooth increase in structural resistance; and tearing of the front panel, with a decrease in structural load carrying capacity.
  • When subjected to the impact load of a rigid indenter, the structure’s deformation range is smaller than the quasi-static load, and the deformation is relatively concentrated at the collision location. In the 3 m drop impact condition, the initial peak impact load increases by nearly 20% compared to the quasi-static collision scenario, and the average impact force increases by approximately 13% before structural failure. This indicates that the structure has a higher energy absorption capacity in the 3 m drop impact condition compared to the quasi-static collision scenario.
  • The EPS failure criterion in the simulation in this scenario would prematurely determine the failure of the junction due to the localized compressive deformation produced by the unit. The BWH failure criterion struggles to determine the failure of the structure, and the crashworthiness of the structure evaluated by this criterion is higher than that of the actual scenario. The RTCL failure criterion is more suitable for this complex stress state crash scenario, and the tearing phenomenon of the upper panel is better simulated.
  • The height of the wrinkles produced by the cruciform structure is closely related to the mesh size. The height of the wrinkles produced by a large mesh model is relatively high, and the area where the subsequent membrane tensile deformation occurs in the belly beam that makes up the cruciform structure is relatively large. The structure’s resistance is also relatively small in the large mesh model. In contrast, a small mesh model produces smaller wrinkles, and subsequent wrinkle formation occurs earlier than in the large mesh model.

Author Contributions

Conceptualization, X.W.; Writing—original draft, X.W.; Writing—review and editing, K.L., M.X. and H.L.; Visualization, K.L. and M.X. All authors have read and agreed to the published version of the manuscript.

Funding

This research was funded by the National Natural Science Foundation of China (Grant No. 52171311; Grant No. 52271279).

Institutional Review Board Statement

Not applicable.

Informed Consent Statement

Not applicable.

Data Availability Statement

Not applicable.

Conflicts of Interest

The authors declare no conflict of interest.

References

  1. Oil Tanker Spill Statistics 2022. Available online: https://www.itopf.org/knowledge-resources/data-statistics/statistics/ (accessed on 23 May 2023).
  2. Cho, S.-R.; Lee, H.-S. Experimental and analytical investigations on the response of stiffened plates subjected to lateral collisions. Mar. Struct. 2009, 22, 84–95. [Google Scholar] [CrossRef]
  3. Liu, K.; Wang, Z.; Tang, W.; Zhang, Y.; Wang, G. Experimental and numerical analysis of laterally impacted stiffened plates considering the effect of strain rate. Ocean Eng. 2015, 99, 44–54. [Google Scholar] [CrossRef]
  4. Liu, B.; Soares, C.G. Effect of strain rate on dynamic responses of laterally impacted steel plates. Int. J. Mech. Sci. 2019, 160, 307–317. [Google Scholar] [CrossRef]
  5. Yang, L.; Wang, D.-Y. Experimental and numerical investigation on the response of stiffened panels subjected to lateral impact considering material failure criteria. Ocean Eng. 2019, 184, 193–205. [Google Scholar] [CrossRef]
  6. Alsos, H.S.; Amdahl, J. On the resistance to penetration of stiffened plates, Part I–Experiments. Int. J. Impact Eng. 2009, 36, 799–807. [Google Scholar] [CrossRef]
  7. Alsos, H.S.; Amdahl, J.; Hopperstad, O.S. On the resistance to penetration of stiffened plates, Part II: Numerical analysis. Int. J. Impact Eng. 2009, 36, 875–887. [Google Scholar] [CrossRef]
  8. Zhang, M.; Liao, X.; Li, S.; Song, S.; Liu, J.; Hu, Z. Experimental and numerical investigation of the damage characteristics of a ship side plate laterally punched by a scaled raked bow indenter. Ocean Eng. 2023, 280, 114808. [Google Scholar] [CrossRef]
  9. Wang, G.; Arita, K.; Liu, D. Behavior of a double hull in a variety of stranding or collision scenarios. Mar. Struct. 2000, 13, 147–187. [Google Scholar] [CrossRef]
  10. Zhang, M.; Liu, J.; Hu, Z.; Zhao, Y. Experimental and numerical investigation of the responses of scaled tanker side double-hull structures laterally punched by conical and knife edge indenters. Mar. Struct. 2018, 61, 62–84. [Google Scholar] [CrossRef] [Green Version]
  11. Villavicencio, R.; Kim, Y.-H.; Cho, S.-R.; Soares, C.G. Deformation process of web girders in small-scale tanker double hull structures subjected to lateral impact. Mar. Struct. 2013, 32, 84–112. [Google Scholar] [CrossRef]
  12. Chen, B.-Q.; Liu, B.; Guedes Soares, C. Experimental and numerical investigation on a double hull structure subject to collision. Ocean Eng. 2022, 256, 111437. [Google Scholar] [CrossRef]
  13. Urban, J. Crushing and Fracture of Lightweight Structures. Ph.D. Thesis, Technical University of Denmark, Kongens Lyngby, Denmark, 2003. [Google Scholar]
  14. Zhou, C.; Li, T.; Ming, S.; Song, Z.; Wang, B. Effects of welding on energy absorption of kirigami cruciform under axial crushing. Thin Wall Struct. 2019, 142, 297–310. [Google Scholar] [CrossRef]
  15. Haris, S.; Amdahl, J. Crushing resistance of a cruciform and its application to ship collision and grounding. Ships Offshore Struct. 2012, 7, 185–195. [Google Scholar] [CrossRef]
  16. Haris, S.; Amdahl, J. An analytical model to assess a ship side during a collision. Ships Offshore Struct. 2012, 7, 431–448. [Google Scholar] [CrossRef]
  17. Hayduk, R.J.; Wierzbicki, T. Extensional collapse modes of structural members. Comput. Struct. 1984, 18, 447–458. [Google Scholar] [CrossRef]
  18. Yang, P.; Caldwell, J. Collision energy absorption of ships’ bow structures. Int. J. Impact Eng. 1988, 7, 181–196. [Google Scholar] [CrossRef]
  19. Tørnqvist, R. Design of Crashworthy Ship Strucures; Technical University of Denmark: Kongens Lyngby, Denmark, 2003. [Google Scholar]
  20. Zhang, L.; Egge, E.-D.; Bruhns, H. Approval Procedure Concept for Alternative Arrangements; Germanischer Lloyd: Hamburg, Germany, 2004. [Google Scholar]
  21. Peschmann, J. Energy absorption computations of ship steel structures under collision and grounding (translated from German language). Schriftenreih e Schiffbau/TU Hambg.-Harbg. 2001, 613, 4269–4355. [Google Scholar]
  22. Lehmann, E.; Peschmann, J. Energy absorption by the steel structure of ships in the event of collisions. Mar. Struct. 2002, 15, 429–441. [Google Scholar] [CrossRef]
  23. Alsos, H.S. Ship grounding: Analysis of Ductile Fracture, Bottom Damage and Hull Girder Response. Ph.D. Thesis, Norwegian University of Science and Technology, Trondheim, Norway, 2008. [Google Scholar]
  24. Yagi, S.; Kumamoto, H.; Muragishi, O.; Takaoka, Y.; Shimoda, T. A study on collision buffer characteristic of sharp entrance angle bow structure. Mar. Struct. 2009, 22, 12–23. [Google Scholar] [CrossRef]
  25. Kõrgesaar, M.; Romanoff, J. Influence of softening on fracture propagation in large-scale shell structures. Int. J. Solids Struct. 2013, 50, 3911–3921. [Google Scholar] [CrossRef] [Green Version]
  26. Kõrgesaar, M.; Remes, H.; Romanoff, J. Size dependent response of large shell elements under in-plane tensile loading. Int. J. Solids Struct. 2014, 51, 3752–3761. [Google Scholar] [CrossRef] [Green Version]
  27. Marinatos, J.; Samuelides, M. Material characterization and implementation of the RTCL, BWH and SHEAR failure criteria to finite element codes for the simulation of impacts on ship structures. In Proceedings of the International Conference of Collision and Groundings of Ships (ICCGS-2013), Trondheim, Norway, 17–19 June 2013; pp. 57–67. [Google Scholar]
  28. Lu, Y.; Liu, K.; Wang, Z.; Tang, W. Modelling of ductile fracture in ship structures subjected to quasi-static impact loads. Int. J. Impact Eng. 2021, 156, 103941. [Google Scholar] [CrossRef]
  29. Lu, Y.; Liu, K.; Wang, Z.; Tang, W.; Amdahl, J. Development of ductile fracture modelling approach in ship impact simulations. Ocean Eng. 2022, 252, 111173. [Google Scholar] [CrossRef]
  30. Costas, M.; Morin, D.; Hopperstad, O.S.; Børvik, T.; Langseth, M. A through-thickness damage regularisation scheme for shell elements subjected to severe bending and membrane deformations. J. Mech. Phys. Solids 2019, 123, 190–206. [Google Scholar] [CrossRef]
  31. Calle, M.; Alves, M. A review-analysis on material failure modeling in ship collision. Ocean Eng. 2015, 106, 20–38. [Google Scholar] [CrossRef]
  32. Hill, R. On discontinuous plastic states, with special reference to localized necking in thin sheets. J. Mech. Phys. Solids 1952, 1, 19–30. [Google Scholar] [CrossRef]
  33. Bressan, J.; Williams, J. The use of a shear instability criterion to predict local necking in sheet metal deformation. Int. J. Mech. Sci. 1983, 25, 155–168. [Google Scholar] [CrossRef]
  34. Rice, J.R.; Tracey, D.M. On the ductile enlargement of voids in triaxial stress fields*. J. Mech. Phys. Solids 1969, 17, 201–217. [Google Scholar] [CrossRef] [Green Version]
  35. Cockcroft, M. Ductility and workability of metals. J. Metals 1968, 96, 2444. [Google Scholar]
  36. GB/T228. 1-2010; Metallic Materials-Tensile Testing-Part 1: Method of Test at Room Temperature. China Standard Press: Beijing, China, 2011.
  37. Villavicencio, R.; Soares, C.G. Numerical plastic response and failure of a pre-notched transversely impacted beam. Ships Offshore Struct. 2012, 7, 417–429. [Google Scholar] [CrossRef]
  38. Liu, B.; Villavicencio, R.; Guedes Soares, C. Plastic Response and Failure Prediction of Stiffened Plates Punched by a Wedge. In Proceedings of the ASME 2013 32nd International Conference on Ocean, Offshore and Arctic Engineering. Volume 2B: Structures, Safety and Reliability, Nantes, France, 9–14 June 2013; Volume 2. [Google Scholar]
  39. Nassiraei, H.; Lotfollahi-Yaghin, M.A.; Ahmadi, H. Structural behavior of tubular T/Y-joints with collar plate under static in-plane bending. J. Constr. Steel Res. 2016, 123, 121–134. [Google Scholar] [CrossRef]
  40. Nassiraei, H.; Lotfollahi-Yaghin, M.A.; Ahmadi, H.; Zhu, L. Static strength of doubler plate reinforced tubular T/Y-joints under in-plane bending load. J. Constr. Steel Res. 2017, 136, 49–64. [Google Scholar] [CrossRef]
  41. Liu, K.; Liu, B.; Villavicencio, R.; Wang, Z.; Guedes Soares, C. Assessment of material strain rate effects on square steel plates under lateral dynamic impact loads. Ships Offshore Struct. 2018, 13, 217–225. [Google Scholar] [CrossRef]
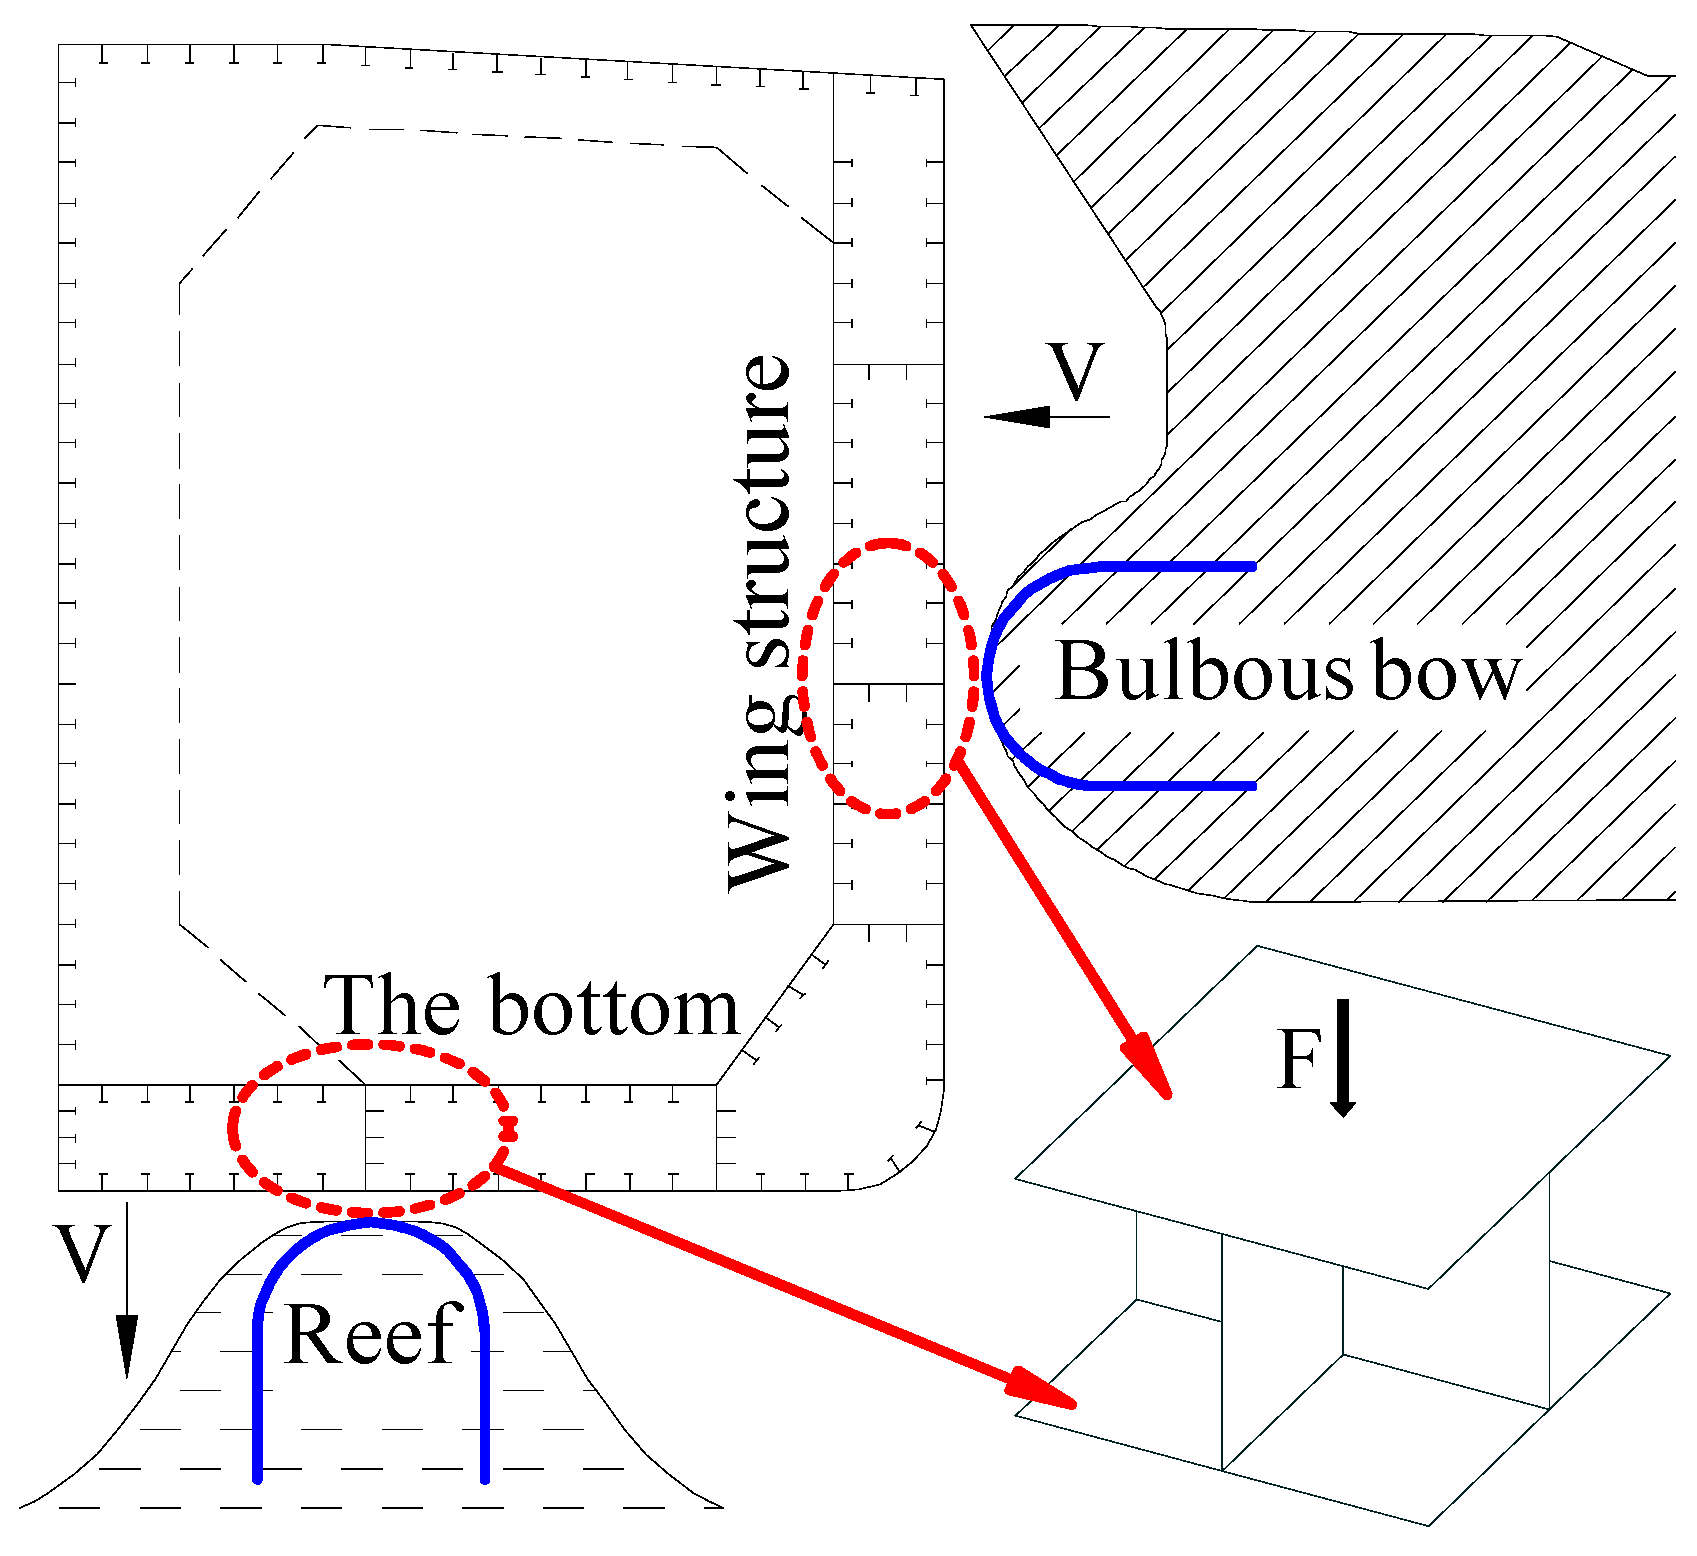
Figure 1. Collision and grounding scenario of the ship.
Jmse 11 01478 g001
Figure 2. Specimen and its components.
Jmse 11 01478 g002
Figure 3. Main dimensions of the specimen.
Jmse 11 01478 g003
Figure 4. (a) Electro-hydraulic servo universal testing machine, (b) dimensions of the indenter.
Jmse 11 01478 g004
Figure 5. (a) Schematic diagram of the Falling Weight Impact Tester and (b) accelerometer, (c) their use during the experiment.
Jmse 11 01478 g005
Figure 6. (a) Final deformation of the front panel, (b) deformation process of the cruciform structure.
Jmse 11 01478 g006
Figure 7. Force–indentation curve of the quasi-static test.
Jmse 11 01478 g007
Figure 8. Deformation and damage of the specimen after impact, (a) 0.5 m falling impact condition, (b) 3 m falling impact condition.
Jmse 11 01478 g008
Figure 9. Force–indentation curve of falling weight impact test, (a) 0.5 m falling impact condition, (b) 3 m falling impact condition.
Jmse 11 01478 g009
Figure 10. Comparison of load–indentation curves in quasi-static and falling weight impact tests.
Jmse 11 01478 g010
Figure 11. Tensile specimen and dimensional drawing.
Jmse 11 01478 g011
Figure 12. Engineering stress–strain curve.
Jmse 11 01478 g012
Figure 13. Combined material relationship.
Jmse 11 01478 g013
Figure 14. An equivalent method of welding elements.
Jmse 11 01478 g014
Figure 15. Finite element model (mesh size 4 mm).
Jmse 11 01478 g015
Figure 16. Simulation results for the front panel and cruciform structure in quasi-static test.
Jmse 11 01478 g016aJmse 11 01478 g016b
Figure 17. Comparison of force–indentation curves from experiment and simulation in the quasi-static test.
Jmse 11 01478 g017aJmse 11 01478 g017b
Figure 18. Simulation results for the front panel and cruciform structure in 0.5 m falling impact test.
Jmse 11 01478 g018
Figure 19. Comparison of force–indentation curves from experiment and simulation in 0.5 m falling impact test.
Jmse 11 01478 g019
Figure 20. Simulation results for the front panel and cruciform structure in 3 m falling impact test.
Jmse 11 01478 g020aJmse 11 01478 g020b
Figure 21. Comparison of force–indentation curves from experiment and simulation in 3.0 m falling impact test.
Jmse 11 01478 g021aJmse 11 01478 g021b
Figure 22. Structural response under the same indentation (quasi-static scenario, change friction coefficient).
Jmse 11 01478 g022
Figure 23. Structural response under the same impact energy (dynamic impact scenario, change friction coefficient).
Jmse 11 01478 g023
Figure 24. Schematic diagram of indenter deviation direction.
Jmse 11 01478 g024
Figure 25. Structural response under the same indentation (quasi-static scenario, change indenter position).
Jmse 11 01478 g025
Figure 26. Structural response under the same impact energy (dynamic impact scenario, change indenter position).
Jmse 11 01478 g026
Table 1. Mechanical properties of the steel.
ParameterUnitValue
Densitykg/m37850
Elastic modulusGPa213
Poisson’s ratio-0.3
Yield stressMPa221
Ultimate tensile stressMPa353
Fracture strain-0.35
Table 2. Finite element models of different mesh densities.
Mesh Size/mmFinite Element ModelFailure Criteria
Model 110 × 10Jmse 11 01478 i0010.293
Model 28 × 8Jmse 11 01478 i0020.306
Model 36 × 6Jmse 11 01478 i0030.33
Model 44 × 4Jmse 11 01478 i0040.382
Disclaimer/Publisher’s Note: The statements, opinions and data contained in all publications are solely those of the individual author(s) and contributor(s) and not of MDPI and/or the editor(s). MDPI and/or the editor(s) disclaim responsibility for any injury to people or property resulting from any ideas, methods, instructions or products referred to in the content.