1. Introduction
Plastics (synthetic organic polymers) are ubiquitous in the environment [
1], and they have demonstrated different routes of entry into various compartments of marine food webs [
2,
3,
4]. Mismanaged plastic waste can enter the natural environment, particularly in regions with high population densities [
5].
Several studies have reported the presence of small plastic fragments (PFs) with diameters <5 mm (microplastics, MPs) in oceans, including coastlines, coastal seas, marginal seas, open oceans [
3,
4,
5,
6,
7,
8,
9,
10,
11,
12,
13,
14], sea surfaces and floors [
15], deep-sea sediments [
16], and marine organisms [
17].
Pelagic PFs are majorly composed of polystyrene (PS) and polyethylene (PE) [
10,
14,
18,
19,
20]. They are lighter than seawater, making their behavior complex.
Few studies have elucidated the presence of MPs in freshwater regions and demonstrated that their contamination level is as severe as that in oceans [
21,
22,
23,
24,
25]. The PF entry routes into the aquatic systems include river runoff, stormwater, and wastewater treatment plant outlets [
26,
27,
28,
29,
30,
31].
River water typically flows continuously, unidirectionally, and carries plastic debris into the oceans [
3,
27,
32,
33,
34]. Nihei et al. [
34] noted the significance of marine debris transportation by the rivers along the Sagami Bay shore (Kanagawa, Japan) and revealed that the majority of floating PFs comprising PE, PS, and polypropylene (PP) originated from land and were carried through rivers; Moore [
35] quantified the number of plastic fragments (<5 mm diameter) sampled from 2 rivers in California and revealed that these rivers alone would release over 2 billion plastic particles into the marine environment over a 3-day period. Freshwater systems, including rivers, are vital pathways that enable PFs to enter oceans.
In this study, we focused on the unidirectional features of river water, which can eliminate the need for moving to catch PFs drifting in the water, facilitating removal device installations at a fixed river site. By capturing PFs in river water flows, the total PF discharge into coastal oceans can be reduced. Among the three categories of PF removal methods classified by Pandey et al. [
36], namely (i) filtration and segregation, (ii) surface adhesion and growth, and (iii) deterioration, the method proposed in this study falls within the category (i).
This study demonstrates the effectiveness of small PFs removal from unidirectionally flowing water. Our approach can be characterized by two aspects: first, the floating body design aimed at mitigating coastal zone pollution, and second, the installation of filtration in the floating body. Multiple filters with different mesh sizes were used to capture PFs from the water flow. The floating body was designed based on naval architecture, such that filters were placed at a targeted water depth, which collected polymers of different densities. Although the final location of the floating body was at the site of a river mouth, an indoor test setup was developed to determine its performance.
A field survey was conducted to understand the percentages of different polymer types in the debris sampled from small river flows on a beach. The data obtained from the survey were used to design a PF-removal device.
2. Materials and Methods
2.1. Field Survey
The plastic debris was collected at Kurihama Beach (
Figure 1: 35°13′35″–35°13′25″ N, 139°42′53″–139°42′47″ E, Yokosuka, Kanagawa, Japan) on 4 November 2020. The Hirasaku River flows into the ocean through the beach.
At the sampling site, the positions of the high tide lines were first determined and delineated as the sampling area of 0.16 m
2 (
Figure S1). The total sampling area was 0.32 m
2. Beached materials, including sands and stones within 3 cm of the coast surface, were gathered and then placed into two sieves with mesh sizes of 4.75 and 2.00 mm. Second, the collected beached materials were dried for one day. Contaminants, such as seashells and glass, were removed, and 379 pieces of PFs were collected in various shapes and colors. The sampled PFs (
Figure S2) were then placed under an electron microscope to measure their lengths, cracks, black spots, colors, shapes, and transparencies using CellSens Standard (Olympus, Tokyo, Japan). Fourier Transform Infrared (FTIR) spectroscopy with a spectrometer FT/IR-4600 (Jasco, Tokyo, Japan) and spectrum analysis software KnowItAll (Wiley Science Solutions, Philadelphia, PA, USA) was performed on each fragment to identify the sampled PFs (
Figures S3 and S4).
Of the collected PFs, 253 pieces were identified. Subsequently, the same types of PFs, including PE, PP, polyvinyl chloride (PVC), and PS, including expanded PS (EPS), polyurethane (PU), ethylene vinyl acetate (EVA), and PE terephthalate (PET), were placed in a container, and the weights of each type were measured in milligrams with an analytical balance. Although the majority of the collected PFs were identified as PE, PP, PS, EVA, and PU, only PE, PP, PS, and PU were used for the indoor experiment, considering their ease of acquisition from the market.
2.2. Experimental Setup
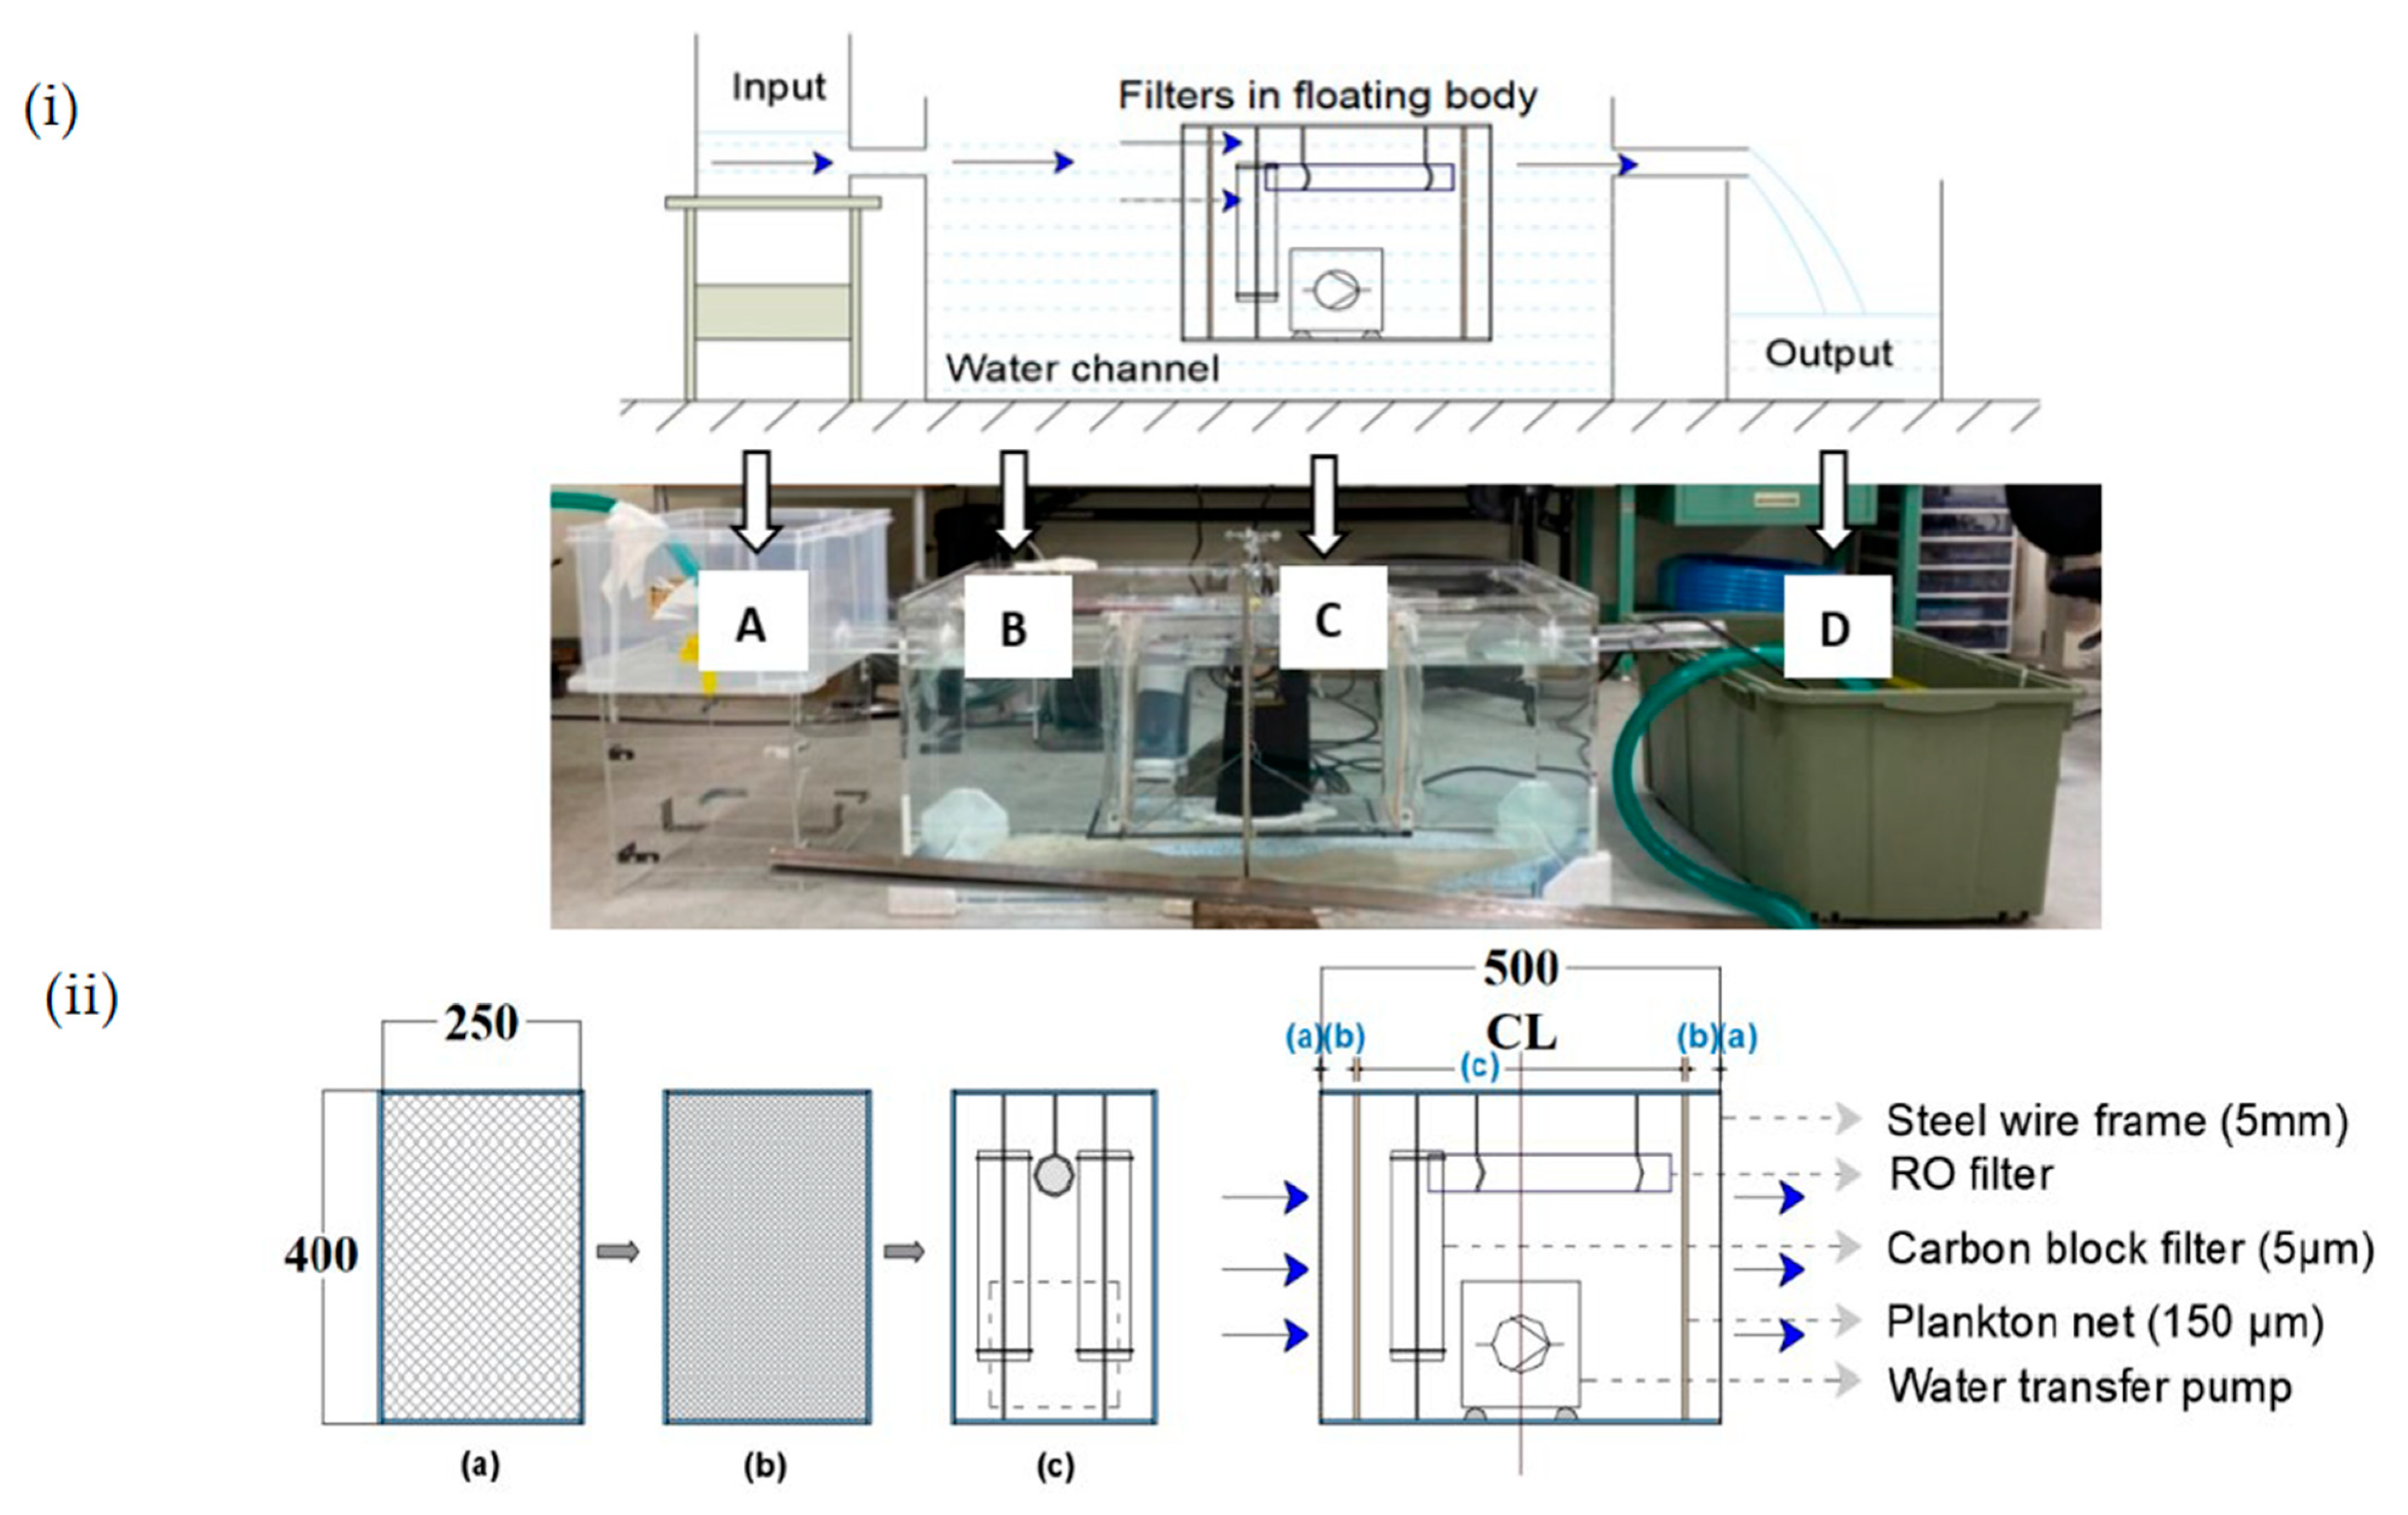
The experimental setup was designed to remove surface and submerged PFs from the river mouth. Therefore, multiple filters with different mesh sizes were combined to capture the PFs of different sizes. This setup comprised a water channel (for simulating river flow) and water input and output containers (
Figure 2(iia)). A small floating body containing filter C was moored in the middle of the water channel using two metal holders. The PF-contaminated water flowed from the input water container into the water channel. Some of the water passed through the filters, and the remaining water from the water channel was stored in water output container D.
Table 1 lists the setup details. The dimensions of the tank, buoy, and other components were specified to achieve simple maintenance with no impact on maritime transportation, and the use of a small floating body contributed to this.
Based on the beach fieldwork results, the PF concentrations in the water, water flow speed, and water height were specified. Flow speeds in the water channel were established to agree with that of the Hirasaku River speed. Thus, the water height in the input water container was determined using Torricelli’s theorem.
The filter arrangement was the same at the front and back to collect the PFs from both sides (
Figure 2(iib)). The filters consisted of 2 sets of meshed (5 mm) steel frames, 2 sets of plankton nets (150 µm), 2 carbon-block filters (5 µm), and 1 reverse osmosis (RO) filter (0.001 µm). The steel frames and plankton nets were rectangular, with a height of 400 mm and a width of 250 mm. The four types of filters were placed in a hollow acrylic frame. The RO and carbon-block filters were fixed to the water channel using clamps. A water transfer pump was used to produce divergent flows to improve the performances of the RO and carbon-block filters.
2.3. Measurement Methods and Experimental Conditions
Three flow speeds (average, high, and low) were determined by accounting for the actual flow speeds of the rivers flowing into Sagami Bay. They were maintained in the water channel by adjusting the three corresponding water surface heights in the water input container (
Table 1). The flow speed was measured using a flow meter. The water temperature was measured using a thermometer after the desired water flow speed was achieved.
The flow speed was regulated, and then the water transfer pump was turned on. Next, PFs were added upstream of the filters for 3 min. This process was continued until the water level in the output water container reached its maximum value, after which the water transfer pump was turned off. The time required to fill the output container was recorded (6.36 min on average). Subsequently, the captured PFs were collected from the filter sections and stored in Petri dishes.
To quantify the number of captured PFs, two measurement methods, namely the particle counting (PC) method and weight measurement (WM) method, were adopted for each experimental condition. The number of each polymer type was counted using the PC method, and the weight of each polymer type was measured using the WM method. The PC method is more accurate and time-consuming, whereas the WM method involves more uncertainties.
The influence of water density on the captured PFs was measured using both freshwater (FW) and salted water (SW). Two concentrations of PFs (low and high) in the water were tested (
Table 2). The percentages of different polymer types in the contaminated water were determined based on the field survey results. The “low” PF concentration was approximately the same as that of the field survey, and the “high” one was set to be twice that of the “low” one.
In total, 16 conditions were tested, with 8 cases using the PC method and the other 8 using the WM method (
Table 2). Each condition was tested thrice to address the uncertainty involved in the experimental phenomenon.
Fragments of PE, PP, PS, and PU were produced by scraping the plastic materials. The scraping strengths were regulated to maximize the size distribution at 4–5 mm, which was the maximum size distribution of PFs sampled in the field study.
Different colors were used to visually distinguish these polymer types, which were blended in approximately similar proportions as those determined from PFs sampling at the beach. The amounts of blended fragments were specified for the PC and WM methods (
Table 3) for the purpose that the water contaminated with these PFs could approximate the water flowing in the actual river.
After each experimental run, the PFs captured by the filter sections (
Figure 2) were collected. The PFs captured on the steel wire mesh and plankton net were picked individually using tweezers. The collection of PFs from the RO and carbon-block filter sections was difficult because the captured PFs were generally invisible. Therefore, the numbers and weights of the PFs in this section were not included in the subsequent analysis. The fraction of captured PFs in this section was expected to be small, considering that most of the artificially produced PFs were visible. The efficiency of the PF capture process was calculated from the ratios of numbers and weights of the PFs captured in the first two sections to those in the initial contaminated water (
Table 3).
3. Results
3.1. Sampling Data of PFs
The results of the field surveys are summarized in
Table 4. The PE and PP samples accounted for 30.4% and 52.6% of the total sampled PFs mass, respectively. In comparison, the percentage of PS was small. Cellulose acetate, EVA, PU, polyamide/nylon, and resin and glass fibers were also detected, and their masses accounted for 15.8% of the total mass.
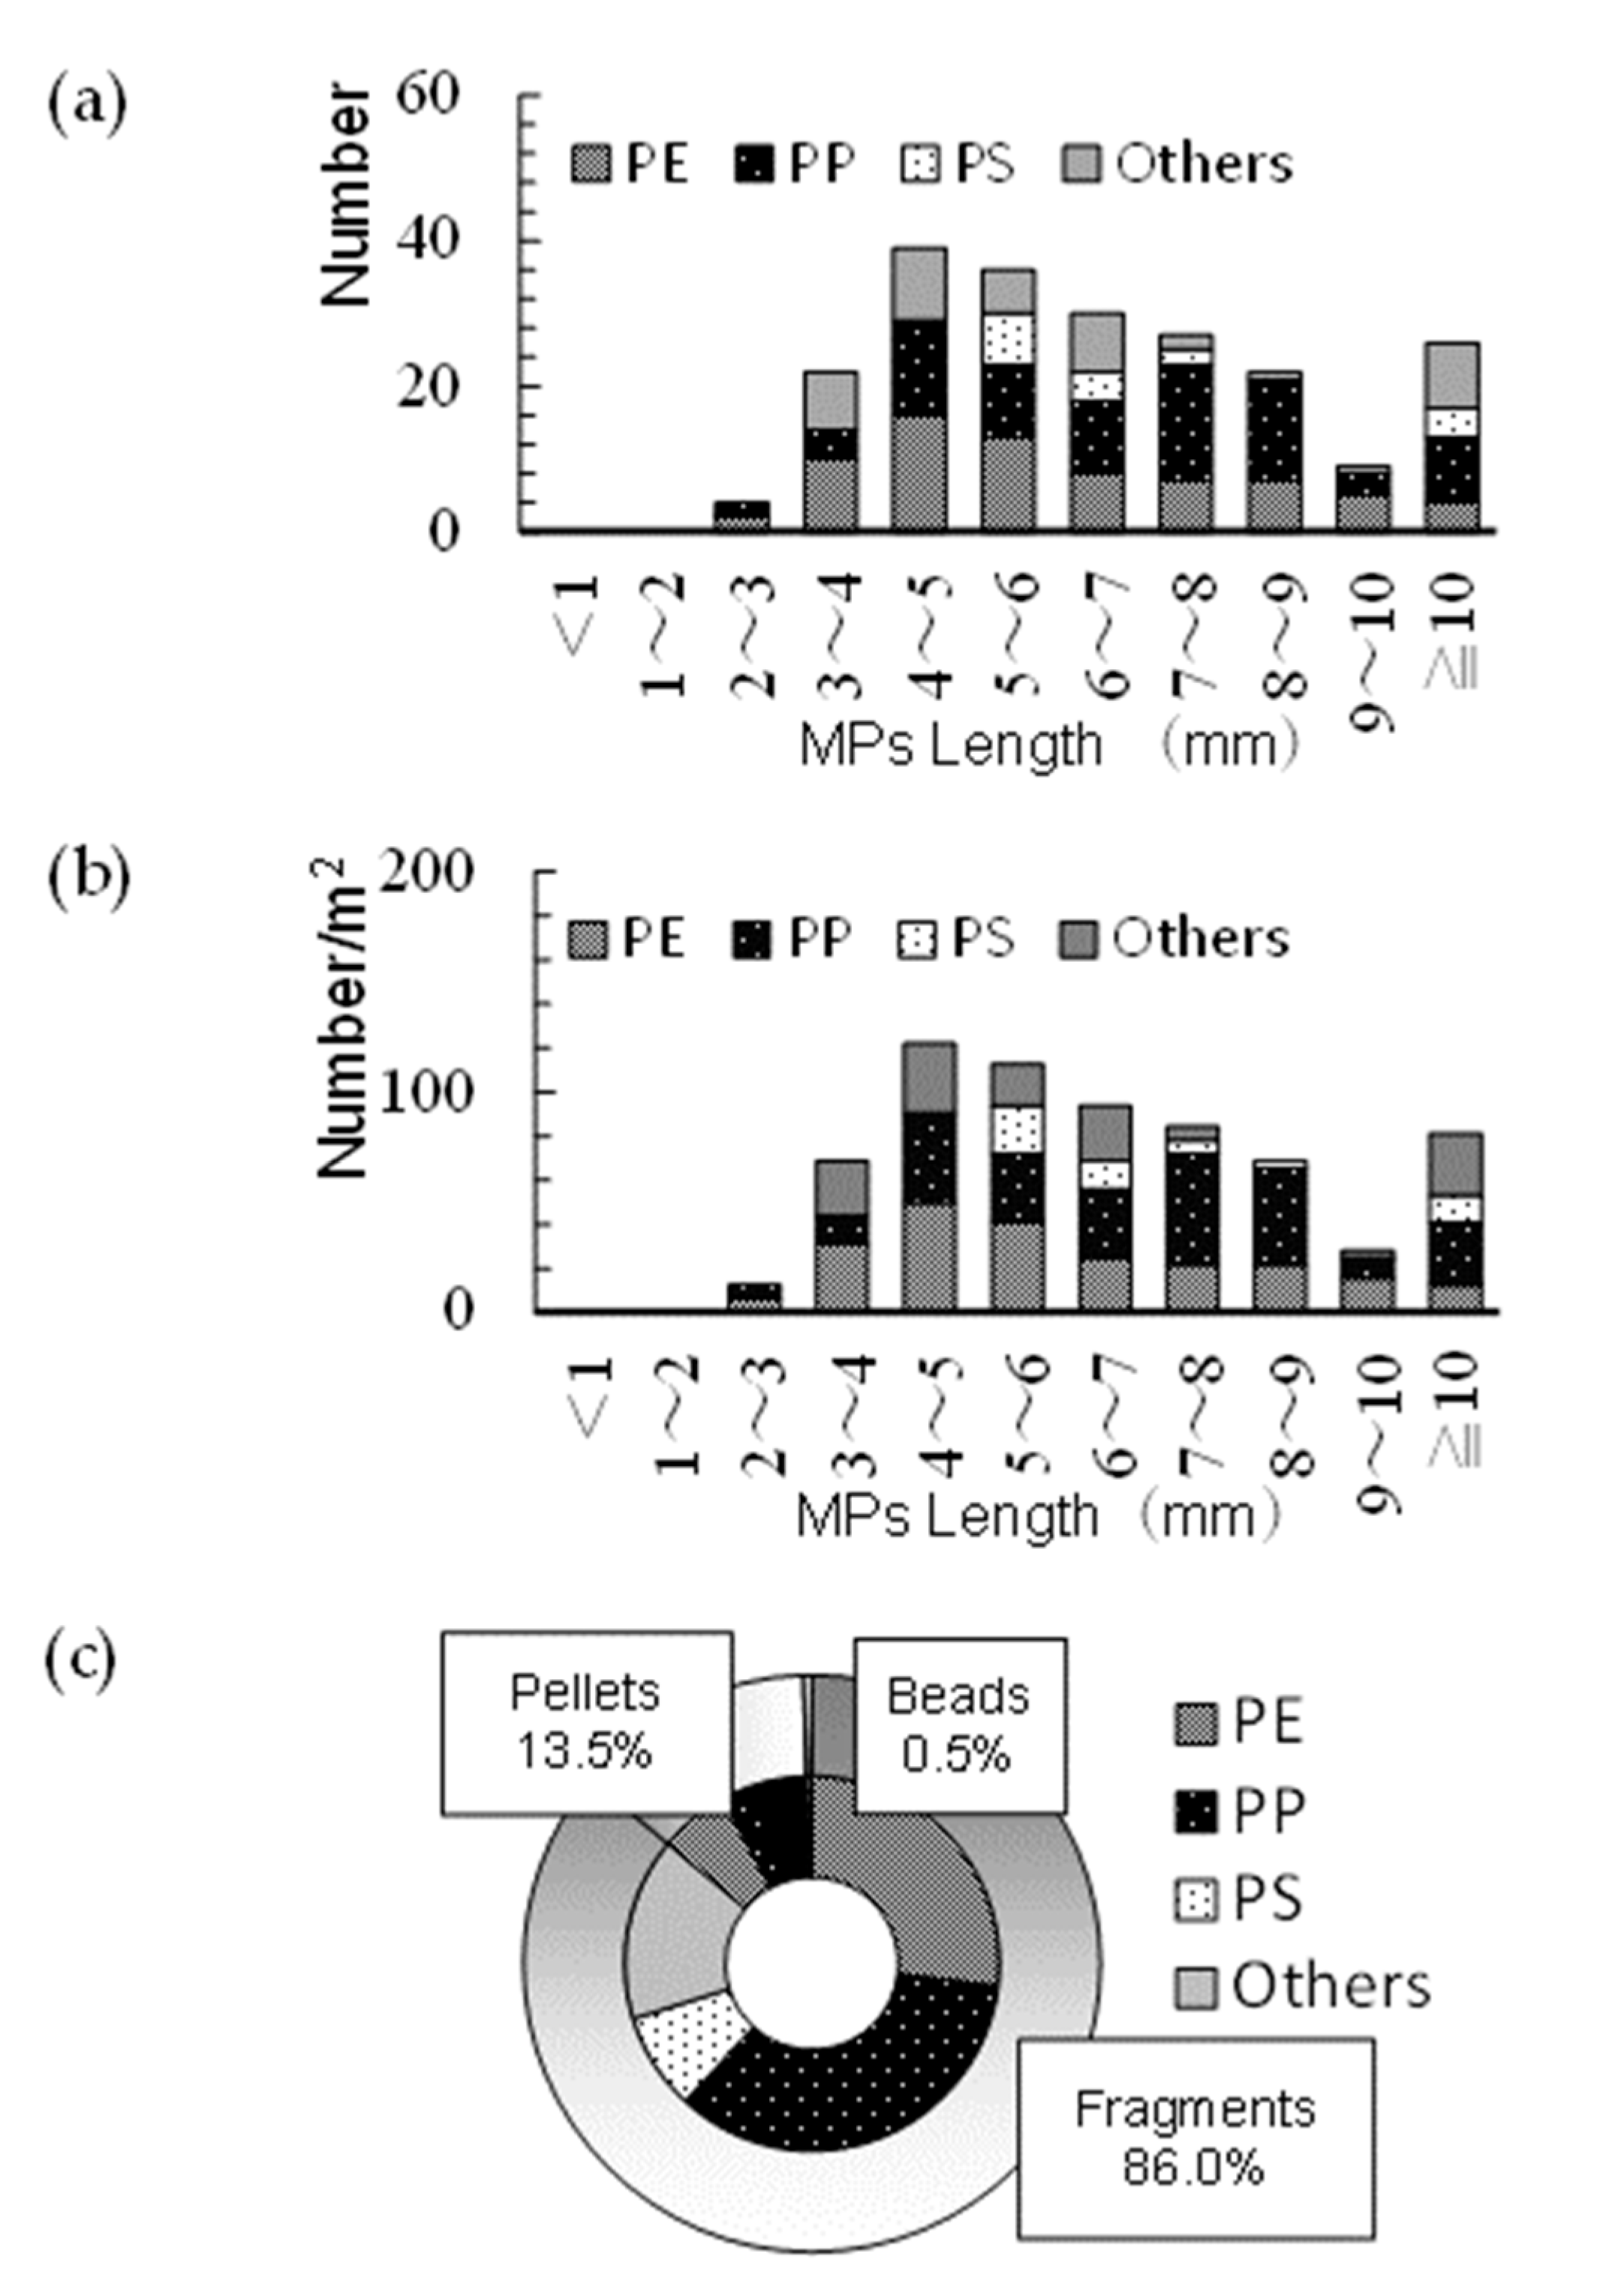
The largest number of sampled PFs had sizes of 4–5 mm (
Figure 3a), and no PS particles were observed within this size range. The largest number of PS particles was found within sizes of 5–6 mm. The number of PP was maximal at 7–8 mm. The maximum number of sampled PFs per unit area was also found to be 4–5 mm (
Figure 3b).
The fragment shape accounted for 86% of the total PFs whose shapes were determined (
Figure 3c). A total of 185 shapeless PFs were detected, including 58 PEs, 75 PPs, 18 PSs, and 34 others. In addition, 29 pellet-shaped PFs (13 PEs, 6 PPs, and 10 other PFs) were detected, with only 1 bead-shaped PF (PE).
3.2. Quantification of Captured PFs Using WM and PC Methods
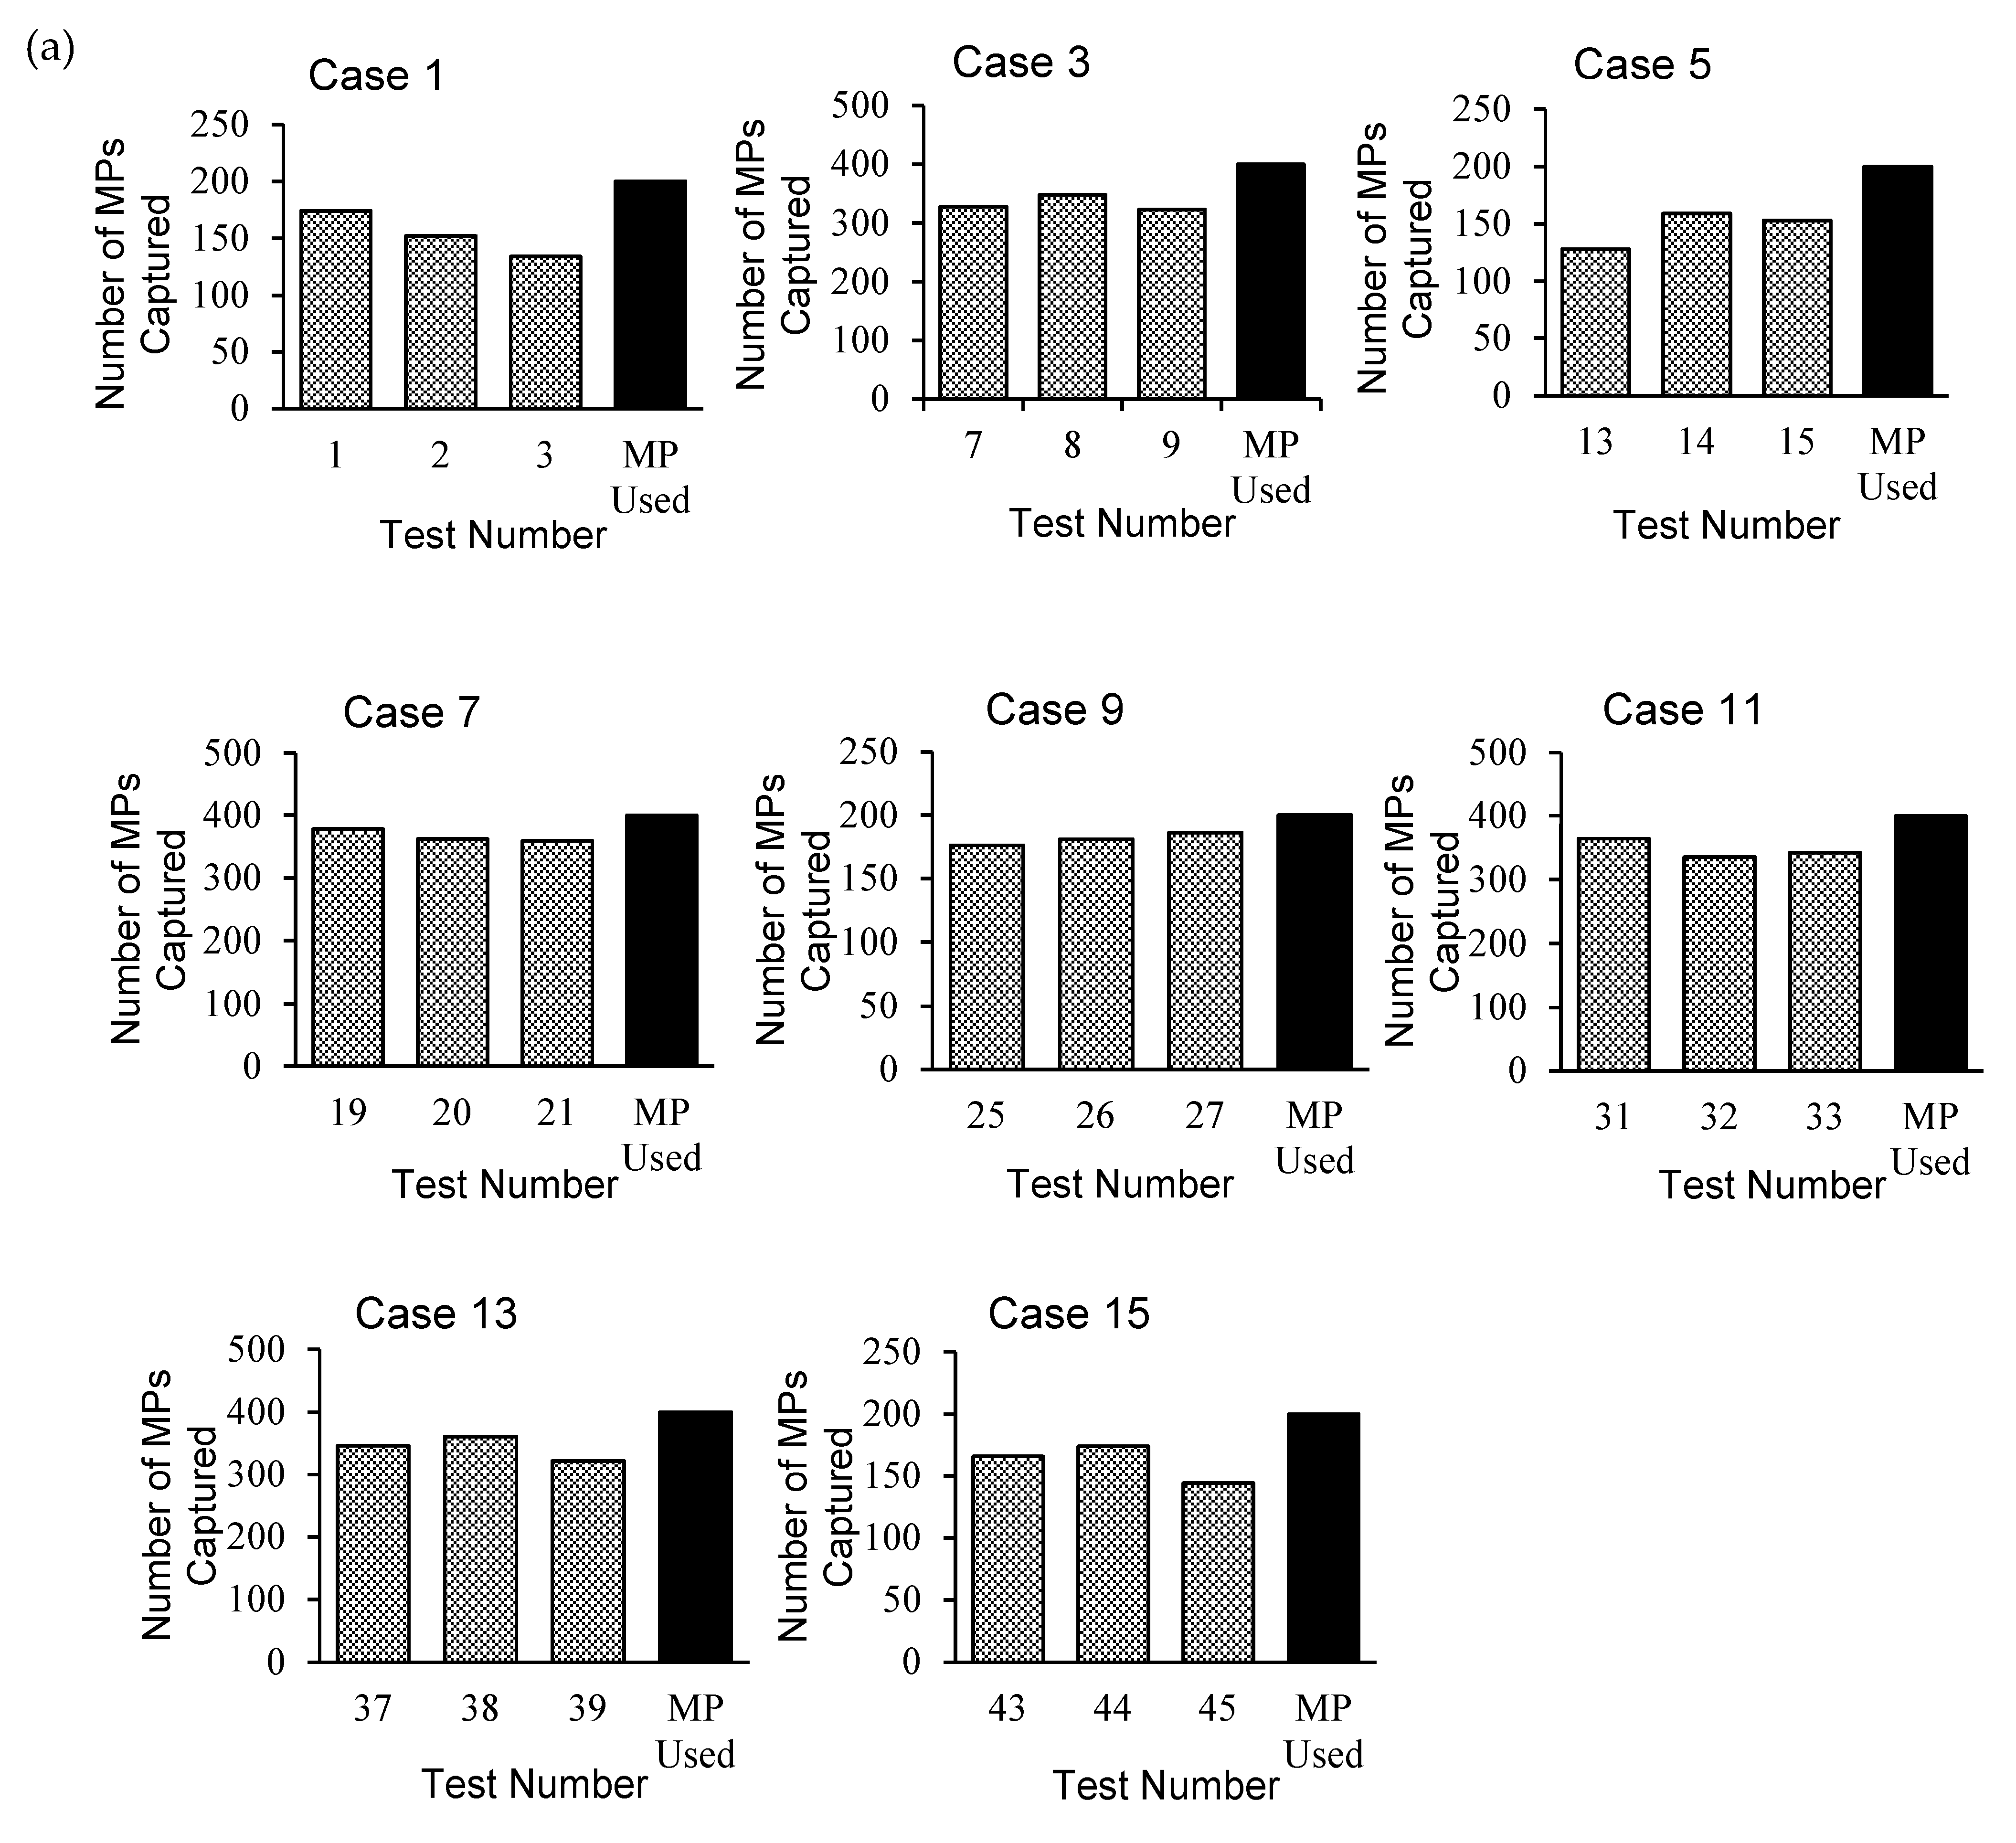
The PC method was adopted for 8 cases (24 tests), and the maximum number of captured PFs was observed in Cases 7 and 9 (
Figure 4a). The WM method adopted for the remaining 8 cases (24 tests) yielded the highest capture rates for Cases 10 and 16 (
Figure 4b).
3.3. PF Capturing Efficiency
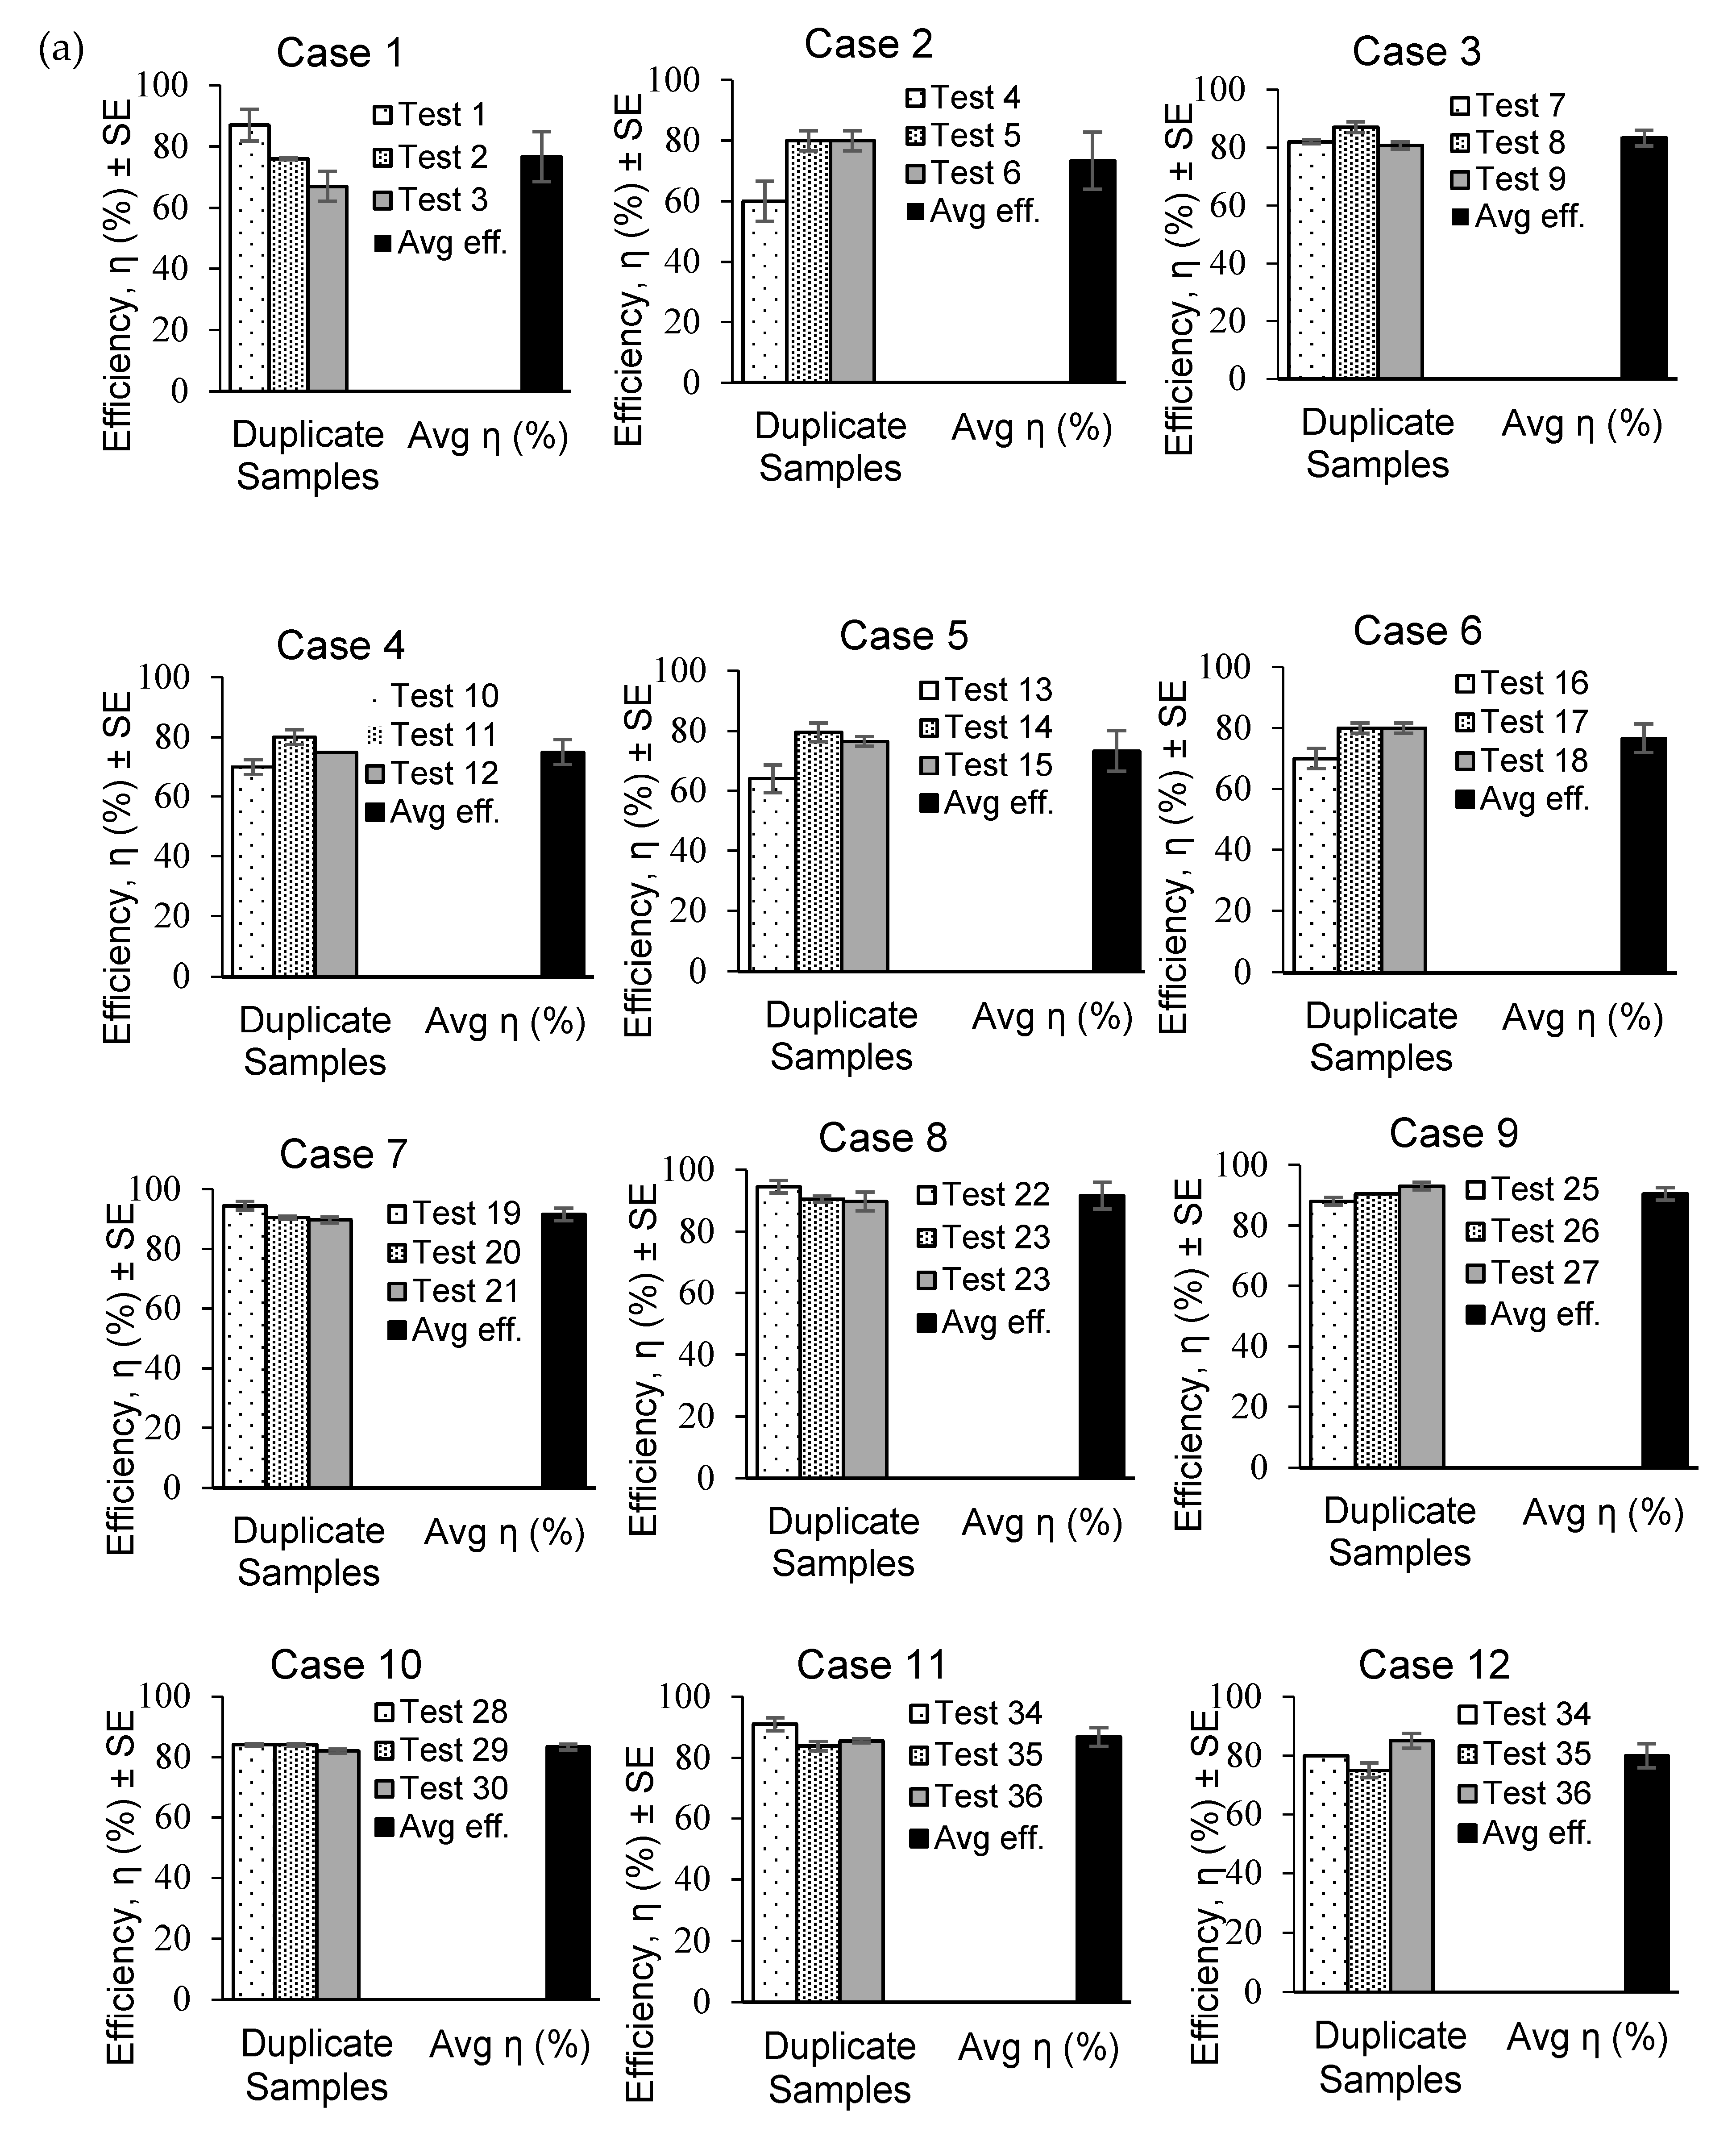
The capturing efficiencies determined using the PC and WM methods are plotted in
Figure 5 for (a) freshwater (FW) and (b) salted water (SW) cases. The PC method provided the highest efficiency (94.5%) in Test 19 for Case 7. The WM method yielded the lowest efficiency (60%) in Test 4 for Case 2.
The highest average efficiency (91.58%) was obtained from the PC method in Case 7 (
Figure 5c). The lowest average efficiency was obtained from the WM method for Case 2 (73.33%), whereas for the PC method, the lowest average efficiency was 81.53% in Case 5. The standard errors of the capturing efficiencies were within ±5% for both the PC and WM methods.
4. Discussion
The size distribution of the sampled PFs that peaked at 4–5 mm (
Figure 3a,b) differed from those with a peak around 1.5 mm [
30], which were obtained from devices with nets of mesh sizes of 100 or 300 µm. The PF numbers per area (
Figure 3b) were similar to those measured at other Sagami Bay beaches [
37].
The capturing efficiencies in Cases 1–6 (75–84%) were lower than those in the other Cases (>85%) (
Figure 5). Cases 5 and 6 exhibited particularly low efficiencies. The measurements in Cases 1–4 were performed by applying an average flow speed (
Table 2). The low efficiencies in these four cases suggest that the flow speeds were affected more effectively than the PF concentrations, which were low in Cases 1 and 2 and high in Cases 3 and 4. Thus, the higher and lower flow speeds employed in the present experiment tended to yield better efficiencies, yet this observation was not always true because the conditions with high flow speed and low PF concentration (Cases 5 and 6) resulted in low capturing efficiencies. The combination of high flow speed and high PF concentration (Cases 7 and 8) and low flow speed and low PF concentration (Cases 9 and 10) yielded the largest capturing efficiencies. Greater amounts of PFs were forced to move rapidly towards the positions of the filters due to the stronger water flows (Cases 9 and 10); however, despite the smaller amounts of PFs, the plastic particles fed into the water channel remained near the filters because of the lower flow speeds and were consequently captured by the filters.
The water densities (FW and SW Cases) produced few differences in the capturing efficiencies between Cases 1–12 and Cases 13–16, indicating that the vertical positions of the filters were appropriately set to capture the PFs moving in the surface layers of FW and SW.
The measurement time for each test was restricted by the capacity of the output container. Over the course of the experiment, the amount of water stored in the container increased. Although the measurements were ceased in some tests to prevent spillage of water from the container, these treatments scarcely affected the performance of the PC and WM methods, as few plastic particles were found after stopping the water flow. The shortest and longest measurement times were 4 min and 19 s and 9 min and 30 s, respectively.
Considering the uncertainty of the investigated phenomena stemming from the randomness of the PF motion in the fluid flows, the measurements were performed in duplicate for each experimental condition to obtain statistical analysis results. The maximum standard error of the PF capturing efficiency was 5%, which was sufficiently small compared with the average capturing efficiencies of 81% (PC method) and 83% (WM method) (
Figure 5), confirming the reproducibility of the experiments.
The obtained PF capturing efficiencies were sufficient, which demonstrates that the anchored-buoy-type filter system developed in this study offers high-efficiency capture of PFs from water flow. However, further investigations are required because the usefulness of the results from the present laboratory experiment for assessing capturing performance in practice is not guaranteed solely by this study.
Three limitations of the indoor experiment were present. First, some of the PFs in the water channel passed through the steel mesh and drifted away from the filter. These motions, which were unsuccessfully captured, arose primarily from the vortex flow patterns around part C in the setup (
Figure 2(iia)). They were induced by the interaction of the fluid flows with the RO and carbon-block filters and by the driving of the water transfer pump. The PF motion trajectories were highly dependent on the flow patterns; therefore, devices should be attached for a smooth flow pattern in the filter vicinity. Water flow rectification may be more distinct in actual river mouths than in indoor experiments because the flow patterns in the river mouth are generally highly complex due to winds and tides.
Second, in the experiment, no marine organisms, such as phytoplankton or detritus, were present in the water. The presence of these marine organisms clogs the filters and decreases the PF capturing efficiency. To overcome this issue, the filters must be regularly cleaned. Designing a new device that allows surfacing of the filters, cleaning of the filters, and removal of PFs from the filters may be useful in future investigations. For filter maintenance, the use of a floating body and an anchored buoy is advantageous because they can provide stable positioning of the filters in the water flow and enable retrieval of the device from the installation site.
Third, because the water channel was spatially limited, the internal flow pattern was affected by the sidewalls of the tanks. Additionally, some portions of the plastic particles stuck to the walls due to the surface tension. The PFs also sank in the water channel because of their greater specific gravities than that of water. They did not reach the positions of the filters designed to capture surface and submerged PFs, and some remained in the input water tank.
5. Conclusions
A field survey was conducted at Kurihama Beach to collect PF samples to assess the number of PFs and percentages of different polymer types. The sampled PFs were mainly composed of PE fragments with a size range of 4–5 mm and PP fragments with a size range of 7–8 mm. Subsequently, a small-scale experimental model was developed to eliminate PFs from water, and its PF-capturing performance was examined by conducting an indoor experiment. In the model, multiple filters (wireframe, plankton net, RO filter, and carbon-block filters) were placed in a floating body and subjected to water flow. This model was designed such that it could be used at a river mouth site to decrease the number of PFs entering the ocean. The model included a water channel to simulate the river flow. Using the results of the beach survey, four polymer types (PE, PP, PS, and PU) were used to artificially create PFs for the experiment.
The experimental results indicated that the filters performed moderately well. The highest average PF capturing efficiency achieved was 91.58%. The limitations of the present experiment include the lack of complex flow patterns, the absence of marine organisms, and the side-wall effect. The first two limitations can be resolved by improving the filter maintenance methods, and the third can be addressed by conducting an in-situ experiment.
Supplementary Materials
The following supporting information can be downloaded at:
https://www.mdpi.com/article/10.3390/jmse11050991/s1, Figure S1: sampling area setting on the beach; Figure S2: sampled and marked plastic fragments; Figure S3: microscope used to find characteristics of the sampled plastic fragments; Figure S4: characterizing plastic fragments using FTIR.
Author Contributions
Conceptualization, R.I.; methodology, R.I.; analysis, R.I.; investigation, R.I.; data curation, R.I. and Y.N.; writing—original draft preparation, R.I.; writing—review and editing, Y.N.; project administration, Y.N.; funding acquisition, Y.N. All authors have read and agreed to the published version of the manuscript.
Funding
This work was financially supported by a Japan Society for the Promotion of Science Grant-in-Aid for Scientific Research (B) JP21H01543.
Institutional Review Board Statement
Not applicable.
Informed Consent Statement
Not applicable.
Data Availability Statement
The data presented in this study are available upon request from the corresponding author.
Acknowledgments
The fieldwork and microscopic and spectroscopic analyses in this study were performed during a research and development internship by one of the authors, R.I., at the Kanagawa Environmental Research Center (KERC, Hiratsuka, Kanagawa, Japan). The authors are grateful to H. Sakamoto and S. Mishima for their meaningful assistance with the data analysis.
Conflicts of Interest
The authors declare no conflict of interest.
References
- Derraik, J.G.B. The pollution of the marine environment by plastic debris: A review. Mar. Pollut. Bull. 2002, 44, 842–852. [Google Scholar] [CrossRef]
- Wright, S.L.; Thompson, R.C.; Galloway, T.S. The physical impacts of microplastics on marine organisms: A review. Environ. Pollut. 2013, 178, 483–492. [Google Scholar] [CrossRef]
- Barnes, D.K.A.; Galgani, F.; Thompson, R.C.; Barlaz, M. Accumulation and fragmentation of plastic debris in global environments. Philos. Trans. R. Soc. Lond. B Biol. Sci. 2009, 364, 1985–1998. [Google Scholar] [CrossRef]
- Shi, H.; Li, J.; Yang, D.; Li, L.; Jabeen, K. Microplastics in commercial bivalves from China. Environ. Pollut. 2015, 207, 190–195. [Google Scholar]
- Jambeck, J.R.; Geyer, R.; Wilcox, C.; Siegler, T.R.; Perryman, M.; Andrady, A.; Narayan, R.; Law, K.L. Plastic waste inputs from land into the ocean. Science 2015, 347, 768–771. [Google Scholar] [CrossRef]
- Thompson, R.C.; Olsen, Y.; Mitchell, R.P.; Davis, A.; Rowland, S.J.; John, A.W.; McGonigle, D.; Russell, A.E. Lost at sea: Where is all the plastic? Science 2004, 304, 838. [Google Scholar] [CrossRef]
- Goldstein, M.C.; Rosenberg, M.; Cheng, L. Increased oceanic microplastic debris enhances oviposition in an endemic pelagic insect. Biol. Lett. 2012, 8, 817–820. [Google Scholar] [CrossRef]
- Cózar, A.; Echevarría, F.; González-Gordillo, J.I.; Irigoien, X.; Úbeda, B.; Hernández-León, S.; Palma, A.T.; Navarro, S.; García-de-Lomas, J.; Ruiz, A.; et al. Plastic debris in the open ocean. Proc. Natl. Acad. Sci. USA 2014, 111, 10239–10244. [Google Scholar] [CrossRef]
- Eriksen, M.; Lebreton, L.C.M.; Carson, H.S.; Thiel, M.; Moore, C.J.; Borerro, J.C.; Galgani, F.; Ryan, P.G.; Reisser, J. Plastic pollution in the world’s oceans: More than 5 trillion plastic pieces weighing over 250,000 tons afloat at sea. PLoS ONE 2014, 9, e111913. [Google Scholar] [CrossRef]
- Reisser, J.; Slat, B.; Noble, K.; du Plessis, K.; Epp, M.; Proietti, M.; de Sonneville, J.; Becker, T.; Pattiaratchi, C. The vertical distribution of buoyant plastics at sea: An observational study in the North Atlantic Gyre. Bio Geosci. 2015, 12, 1249–1256. [Google Scholar] [CrossRef]
- Lusher, A.L.; Tirell, V.; O’Connor, I.; Officer, R. Microplastics in Arctic polar waters: The first reported values of particles in surface and sub-surface samples. Sci. Rep. 2015, 5, 14947. [Google Scholar] [CrossRef]
- de Lucia, G.A.; Caliani, I.; Marra, S.; Camedda, A.; Coppa, S.; Alcaro, L.; Campani, T.; Giannetti, M.; Coppola, D.; Cicero, A.M.; et al. Amount and distribution of neustonic micro-plastic off the western Sandian coast (central-western Mediterranean Sea). Mar. Environ. Res. 2014, 100, 10–16. [Google Scholar] [CrossRef]
- Isobe, A.; Uchida, K.; Tokai, T.; Iwasaki, S. East Asian seas: A hot spot of pelagic microplastics. Mar. Pollut. Bull. 2015, 101, 618–623. [Google Scholar] [CrossRef]
- Isobe, A.; Kubo, K.; Tamura, Y.; Kako, S.; Nakashima, E.; Fujii, N. Selective transport of microplastics and mesoplastics by drifting in coastal waters. Mar. Pollut. Bull. 2014, 89, 324–330. [Google Scholar] [CrossRef]
- Schlining, K.; von Thun, S.; Kuhnz, L.; Schlining, B.; Lundsten, L.; Stout, N.J.; Chaney, L.; Connor, J. Debris in the deep: Using a 22-year video annotation database to survey marine litter in Monterey Canyon, central California, USA. Deep-Sea Res. 2013, 79, 96–105. [Google Scholar] [CrossRef]
- Van Cauwenberghe, L.; Vanreusel, A.; Mees, J.; Janssen, C.R. Microplastic pollution in deep-sea sediments. Environ. Pollut. 2013, 182, 495–499. [Google Scholar] [CrossRef]
- Gall, S.C.; Thompson, R.C. The impact of debris on marine life. Mar. Pollut. Bull. 2015, 92, 170–179. [Google Scholar] [CrossRef]
- Kukulka, T.; Proskurowski, G.; Morét-Ferguson, S.; Meyer, D.W.; Law, K.L. The effect of wind mixing on the vertical distribution of buoyant plastic debris. Geophys. Res. Lett. 2012, 39, L07601. [Google Scholar] [CrossRef]
- Reisser, J.; Shaw, J.; Wilcox, C.; Hardesty, B.D.; Proietti, M.; Thums, M.; Pattiaratchi, C. Marine plastic pollution in waters around Australia: Characteristics, concentrations, and pathways. PLoS ONE 2013, 8, e80466. [Google Scholar] [CrossRef]
- Ogunola, O.S.; Palanisami, T. Microplastics in the marine environment: Current status, assessment methodologies, impacts and solutions. J. Pollut. Eff. Control 2016, 4, 1000161. [Google Scholar]
- Moore, C.J.; Lattin, G.I.; Zellers, A.F. Quantity and type of plastic debris flowing from two urban rivers to coastal waters and beaches of Southern California. J. Integr. Coast. Zool. Manag. 2011, 11, 65–73. [Google Scholar] [CrossRef]
- Eriksen, M.; Mason, S.; Wilson, S.; Box, C.; Zellers, A.; Edwards, W.; Farley, H.; Amato, S. Microplastic pollution in the surface waters of the Laurentian Great Lakes. Mar. Pollut. Bull. 2013, 77, 177–182. [Google Scholar] [CrossRef]
- Dris, R.; Imhof, H.; Sanchez, W.; Gasperi, J.; Galgani, F.; Tassin, B.; Laforsch, C. Beyond the ocean: Contamination of freshwater ecosystems with (micro-)plastic particles. Environ. Chem. 2015, 12, 539–550. [Google Scholar] [CrossRef]
- Eerkes-Medrano, D.; Thompson, R.C.; Aldridge, D.C. Microplastics in freshwater systems: A review of the emerging threats, identification of knowledge gaps and prioritisation of research needs. Water Res. 2015, 75, 63–82. [Google Scholar] [CrossRef]
- Nel, H.A.; Dalu, T.; Wasserman, R.J. Sinks and sources: Assessing microplastic abundance in river sediment and deposit feeders in an austral temperate urban river system. Sci. Total Environ. 2018, 612, 950–956. [Google Scholar] [CrossRef]
- Gregory, M.R. Plastic ‘scrubbers’ in hand cleansers: A further (and minor) source for marine pollution identified. Mar. Pollut. Bull. 1996, 32, 867–871. [Google Scholar] [CrossRef]
- Browne, M.A.; Galloway, T.S.; Thompson, R.C. Spatial patterns of plastic debris along estuarine shorelines. Environ. Sci. Technol. 2010, 44, 3404–3409. [Google Scholar] [CrossRef]
- Sadri, S.S.; Thompson, R.C. On the quantity and composition of floating plastic debris entering and leaving the Tamar Estuary, Southwest England. Mar. Pollut. Bull. 2014, 81, 55–60. [Google Scholar] [CrossRef]
- Zhao, S.; Zhu, L.; Wang, T.; Li, D. Suspended microplastics in the surface water of the Yangtze Estuary System, China: First observations on occurrence, distribution. Mar. Pollut. Bull. 2014, 86, 562–568. [Google Scholar] [CrossRef]
- Abeynayaka, A.; Kojima, F.; Miwa, Y.; Ito, N.; Nihei, Y.; Fukunaga, Y.; Yashima, Y.; Itsubo, N. Rapid sampling of suspended and floating microplastics in challenging riverine and coastal water environments in Japan. Water 2020, 12, 1903. [Google Scholar] [CrossRef]
- Kataoka, T.; Nihei, Y.; Kudou, K.; Hinata, H. Assessment of the sources and inflow processes of microplastics in the river environments of Japan. Environ. Pollut. 2019, 244, 958–965. [Google Scholar] [CrossRef]
- Moore, C.J.; Moore, S.L.; Weisberg, S.B.; Lattin, G.L.; Zellers, A.F. A comparison of neustonic plastic and zooplankton abundance in southern California’s coastal waters. Mar. Pollut. Bull. 2002, 44, 1035–1038. [Google Scholar] [CrossRef]
- Thompson, R.; Moore, C.; Andrady, A.; Gregory, M.; Takada, H.; Weisberg, S. New directions in plastic debris. Science 2005, 310, 1117. [Google Scholar] [CrossRef]
- Nihei, Y.; Yoshida, T.; Kataoka, T.; Ogata, R. High-resolution mapping of Japanese microplastic and macroplastic emissions from the land into the sea. Water 2020, 12, 951. [Google Scholar] [CrossRef]
- Moore, C.J. Synthetic polymers in the marine environment: A rapidly increasing, long-term threat. Environ. Res. 2008, 108, 131–139. [Google Scholar] [CrossRef]
- Pandey, B.; Pathak, J.; Pingh, P.; Kumar, R.; Kumar, A.; Kaushik, S.; Thakur, T.K. Microplastics in the ecosystem: An overview on detection, removal, toxicity assessment, and control release. Water 2023, 15, 51. [Google Scholar] [CrossRef]
- Ikegai, T.; Mishima, S.; Kikuchi, H.; Namba, A.; Kobayashi, Y. The characteristics of drifting ashore about microplastics in the coastal area of Sagami Bay. Kanagawa Pref. Environ. Sci. Center Res. Rep. 2018, 41, 1–10. (In Japanese) [Google Scholar]
| Disclaimer/Publisher’s Note: The statements, opinions and data contained in all publications are solely those of the individual author(s) and contributor(s) and not of MDPI and/or the editor(s). MDPI and/or the editor(s) disclaim responsibility for any injury to people or property resulting from any ideas, methods, instructions or products referred to in the content. |
© 2023 by the authors. Licensee MDPI, Basel, Switzerland. This article is an open access article distributed under the terms and conditions of the Creative Commons Attribution (CC BY) license (https://creativecommons.org/licenses/by/4.0/).


