1. Introduction
Coastal zones play an important role as areas for various services and uses, such as fisheries, wildlife ecosystem services, and human recreation [
1]. A study estimating the value of beachfronts concerning the hotel room rate in Thailand found that the highest average annual benefit per area is
$415.78/m
2 in Phuket province [
2]. The Ministry of Tourism and Sports of Thailand published a report on the economic competitiveness of sea–sun–sand (3 S) tourism, which revealed that the beaches of Phuket Island won the second-place award for the best beaches by US News Travel [
3].
Several factors, such as beach slope, sediment grain size, and wave climate, can contribute to shoreline changes in terms of erosion and accretion. Moreover, the future beach loss due to sea level rise needs to be understood for management planning in the engineering, sociology, economics, and environmental fields. Determining the location of the shoreline is essential for establishing boundaries in coastal management and for studying the dynamics and past behavior of the coastline [
4].
Many studies attempted to use remote sensing and geographic information systems as useful tools for monitoring coastline changes in terms of erosion and accretion, especially in the absence of field data [
5,
6,
7,
8]. CoastSat is an open-access Python toolkit that utilizes the Google Earth Engine API to improve Thailand’s unavailable data problem [
4,
9]. Shoreline definition is significant to the result of shoreline changes [
10]. The water line is usually used to define the shoreline position, but it changes throughout the day, so tidal correction is necessary to remove the effect of the tide on flatter beaches [
11,
12,
13,
14]. It is a convenient tool for the automatic detection of the shoreline on a large scale.
Bruun is widely used to determine shoreline recession from sea level rise [
15]. It is a simple equation with interactions between the beach profile and sea-level changes, which have been adjusted in some research [
16]. A study has estimated shoreline recession from sea level in Thailand with CMIP5 sea-level-rise data from the Intergovernmental Panel on Climate Change (IPCC) [
17]. The national beach loss rates were projected to be 45.8% for RCP2.6 and 71.8% for RCP8.5 [
18]. In 2021, the IPCC published a report on CMIP6 model sea level projections in the 21st century [
19].
The report on the status of the coastal zone in Thailand by the Department of Marine and Coastal Resources of Thailand (DMCR) shows that 794 km of Thailand’s coastline (3151 km) faced erosion problems in 2019. Factors contributing to erosion include the urbanization of coastal areas, tourism, marine transportation, and fishing piers. Moreover, coastal processes, the development of coastal zones, and improper adaptations to erosion, such as seawalls, breakwaters, and groins (engineering structures), can lead to coastal erosion problems. This report found that 65.2 km of coastline was created for countermeasure projects by the government and private sectors. Conversely, 67.6 km of the coastline has experienced increased erosion issues, exacerbated by the implemented adaptation measures [
20]. Therefore, selecting appropriate adaptation measures is crucial in responding to shoreline changes.
This study aims to evaluate shoreline changes on Phuket Island, Thailand, using the CoastSat toolkit with public-access satellite data and estimate future shoreline recession using the Bruun rule with CMIP6 sea-level-rise and field observation data. Moreover, the present coastal management strategies will be discussed with the results of shoreline changes to propose appropriate future adaptation management strategies.
2. Study Areas and Data
The data used in this study include the details of the study areas, satellite images, and tide data, wave data, and sea-level-rise data.
2.1. Phuket Island
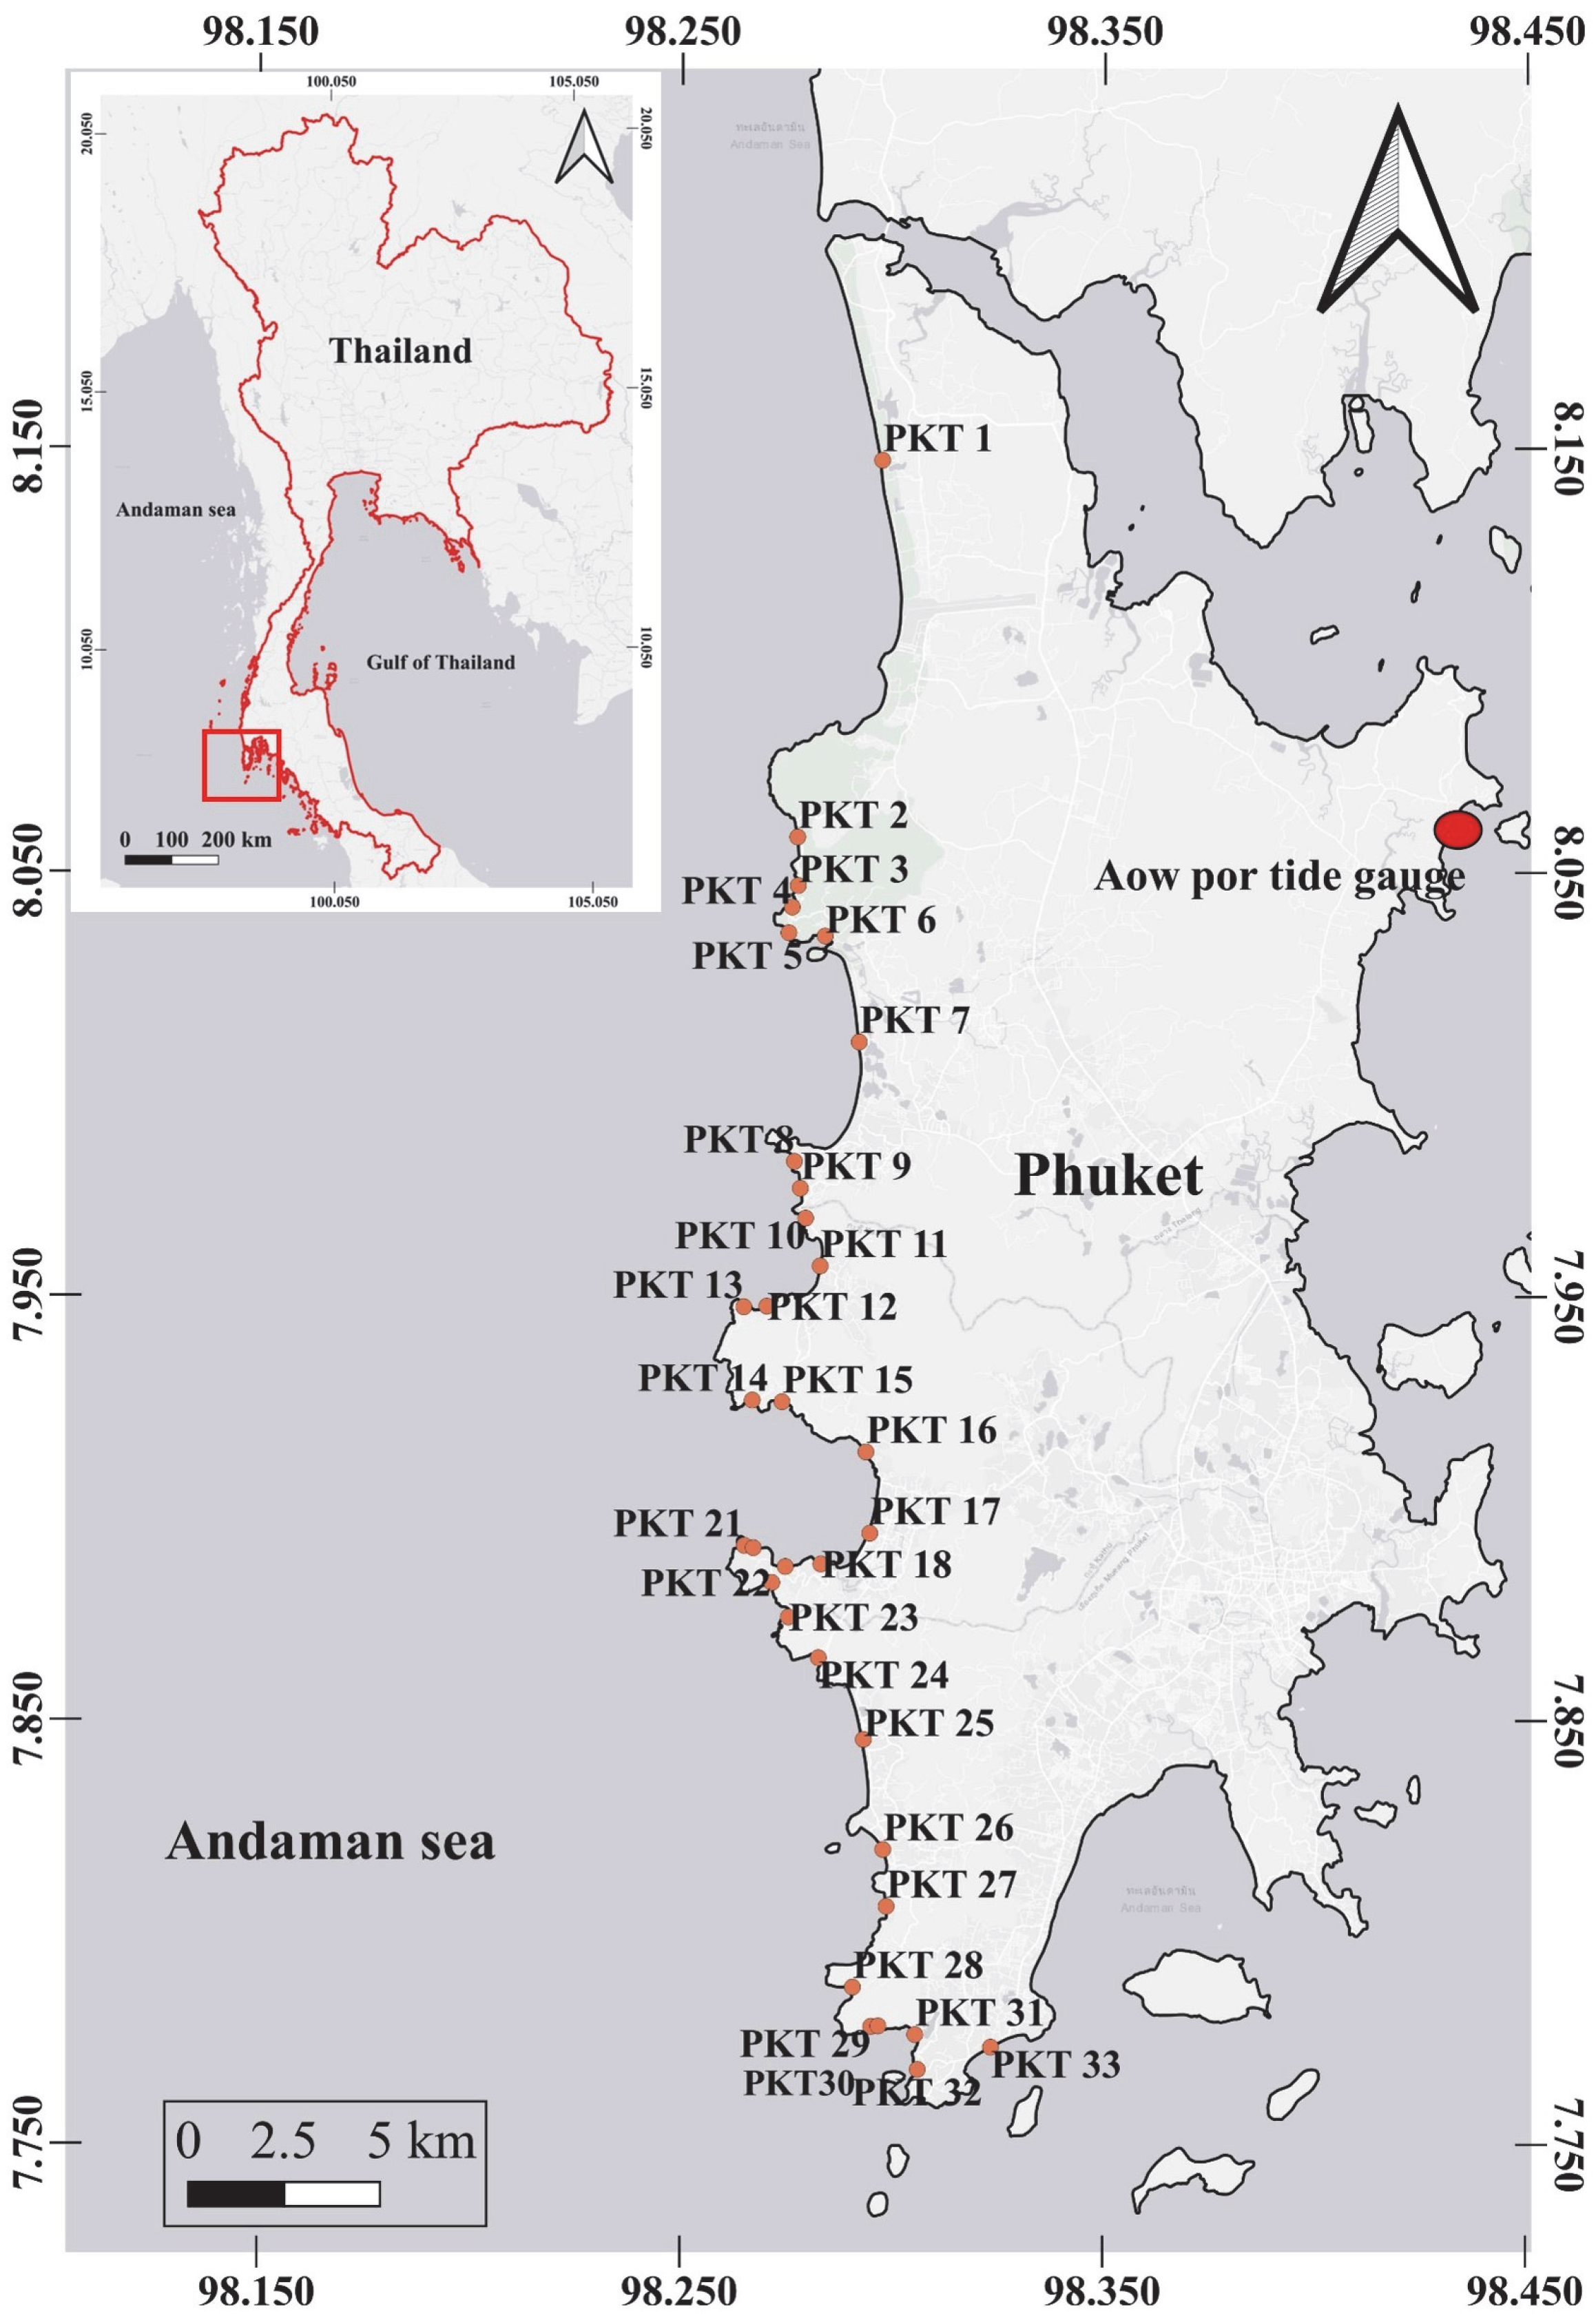
Phuket Island is located in the southern part of Thailand in the Andaman Sea (
Figure 1). The sandy beaches (
Table 1) on the western part of the island are 37.06 km long. Phuket island possesses a variety of tourist beaches, such as city beaches (Karon Beach, Patong Beach, Surin Beach, etc.) and natural beaches (Banana Beach, Freedom Beach, Laemshing Beach, etc.)
2.2. Satellite Images and Tide Data
Satellite images from Landsat 8 (Landsat-8 images courtesy of the U.S. Geological Survey) were used to digitize the shoreline positions in this research. The analysis period was between 2013 and 2021 due to the quality of the satellite imagery associated with the available hourly tidal data of the Aow-Por tide gauge station (
Figure 1) from the Marine Department of Thailand.
2.3. Wave Data
The 3 h significant wave data and significant wave height that exceeded 12 h re-analyzed data (1 degree latitude–longitude resolution) offered by The European Centre for Medium-Range Weather Forecasts (ECMWF) [
21] were used in this study, averaged over 30 years (1980–2010). The significant wave height was 0.87 m and the significant wave period was 7.15 s.
2.4. Sea Level Rise Data
This study used the ensemble mean regional sea-level-rise data (1 degree latitude–longitude resolution) from 21CMIP6 models for the SSP1 2.6, SSP2 4.5, SSP3 7.0, and SSP5 8.5 scenarios that relate to 1995–2014 [
19]. The ensemble mean sea level rise ranges were 0.50–0.81 m for 2081–2100.
3. Methodology
3.1. Field Observation
The characteristics of the beaches, such as the beach slope, 1.5 kg sand sampling collection, beach width, and coastal protection structures, were observed during field observations between 20 and 26 April 2022. The beach width was measured considering the mean sea level. The beach slope was measured using a digital electronic angle gauge to measure the foreshore’s slope. This study used standard sieve analysis (ASTM D422-63 (2007)) to determine the sediment grain size diameter (d50) from sand sampling.
3.2. Shoreline Changes Analysis with Coastsat
CoastSat [
9] is an open-source Python toolkit using publicly available satellite images, namely Landsat 8, from the Google Earth Engine (GEE) to identify a shoreline’s position from a determined time series. It can define the shoreline on any sandy coast worldwide.
In the first step, the user needs to define the region of interest (ROI), the dates for the time series, and the satellite mission. Then, the algorithm will correct the images from GEE. CoastSat provides panchromatic image sharpening, and down-sampling from 30 m bands to 15 m bands by bilinear interpolation was used to improve the accuracy of shoreline digitization [
9,
22]. The precision of shoreline detection is manually improved by the reference shoreline drawing from the user. The cloud cover threshold can be adjusted to avoid images that exceed a certain percentage of cloud cover estimated from the number of cloudy pixels inside the region of interest and a user-defined cloud cover threshold.
The toolkit detects the position of a shoreline using the boundary between sand and water by combining supervised image classification and sub-pixel resolution (10–15 m) appropriated to border segmentation with an accuracy of ~10 m [
9,
23]. The algorithms of CoastSat shoreline detection include image classification and sub-pixel resolution border segmentation steps. In the image classification step, each image pixel is classified into four classes (sand, water, white water, and other land features, such as vegetation). The performance was proven to have 99% accuracy in pixel identification [
24]. During sub-pixel resolution border segmentation, the modified normalized-difference water index (MNDWI) [
25] extracts the boundary between sand and water. The digitized shoreline is visualized with 3 different backgrounds (RGB satellite image, output of the image classification with 4 classes of ‘sand’, ’white water’, ’water’, and ‘others’, and a grayscale image of the MNDVI pixel values) to help the user to validate and verify the shoreline position analysis. If the study area has a flatter beach profile or the site has large tide ranges, applying tidal correction using the measured tide levels and foreshore beach slope is recommended. Each shoreline is adjusted to the reference line. The toolkit detects the position of the coastline using the boundary between sand and water by combining the supervised image classification and the sub-pixel resolution (10–15 m) appropriated to the border segmentation with an accuracy of ~10 m [
9,
23]
Calculating the distance between the reference line and the shoreline position each year can determine the beach width. This approach provides a reliable method for measuring changes in beach width over time. Net shoreline movement was chosen to identify and evaluate the rate of shoreline change [
26]. This study conducted correlation analysis and calculated the statistical measure (
p-value) to determine the significance of the relationship between time and beach width. The
p-value indicates the strength and significance of the linear relationship associated with the trend of shoreline change.
3.3. Bruun Equation for Shoreline Recession from Sea Level Rise
The Bruun rule (Equation (1)) [
15] has been widely used to calculate future shoreline recession as a function of sea level change based on the equilibrium profile theory [
16,
27,
28].
where Δ
y is shoreline recession,
S is sea level rise,
is the berm height, and
is the distance from the horizontal to the depth of closure when
is the depth of closure [
29], which is calculated by the significant wave height and significant wave period, as follows:
where
is the significant wave height that exceeded 12 h per
t years,
g is the gravitational acceleration, and
is the significant wave period exceeding 12 h-per-
t-year.
To calculate the distance to the depth of the closure point,
, which depends on the sediment grain size [
30] and the depth of closure, we used the following:
where A is the scaling parameter based on the sediment size (d
50) and
is the depth of the closure from Equation (3).
To determine the berm height (
) with Equation (4) [
31] and Equation (5) [
32], the significant wave data and wave period were required:
where
is the berm height,
is the breaking wave height, and
is the mean significant wave period, and:
where
is the mean significant wave height, tan
α is the beach slope, and
is the significant wavelength. The shoreline retreat can be evaluated by considering all parameters in Equation (1).
4. Results
The results consist of two parts: the field observation results and shoreline change results. The field observation results include the beach slope, sediment grain size, beach width, and coastal protection structure. The shoreline change results include the historical shoreline changes from CoastSat and future shoreline recession due to sea level rise.
4.1. Results from Field Observations
4.1.1. Beach Slope, Sediment Grain Size, and Beach Width
Beach slope data, beach width data, and sediment samples were collected as the beach characteristics through field observations (
Table 2). The average beach slope, sediment grain size, and beach width were 6.00 degrees, 0.42 mm, and 23.16 m, respectively.
4.1.2. Coastal Protection Structures
Coastal protection structure data were collected during the field observation. Coastal protection structure types were categorized based on the definitions of the structures reported by the Department of Marine and Coastal Resources of Thailand (DMCR) [
20].
From the field observation, there were 10 coastal structure types in the study area, which were wooden beach fences, gabians, revetment seawalls, vertical seawalls, step seawalls, and geotextiles. Their locations and example photos are shown in
Table 3.
4.2. Historical Shoreline Changes and Future Shoreline Recession
4.2.1. Historical Shoreline Changes from CoastSat
The results (
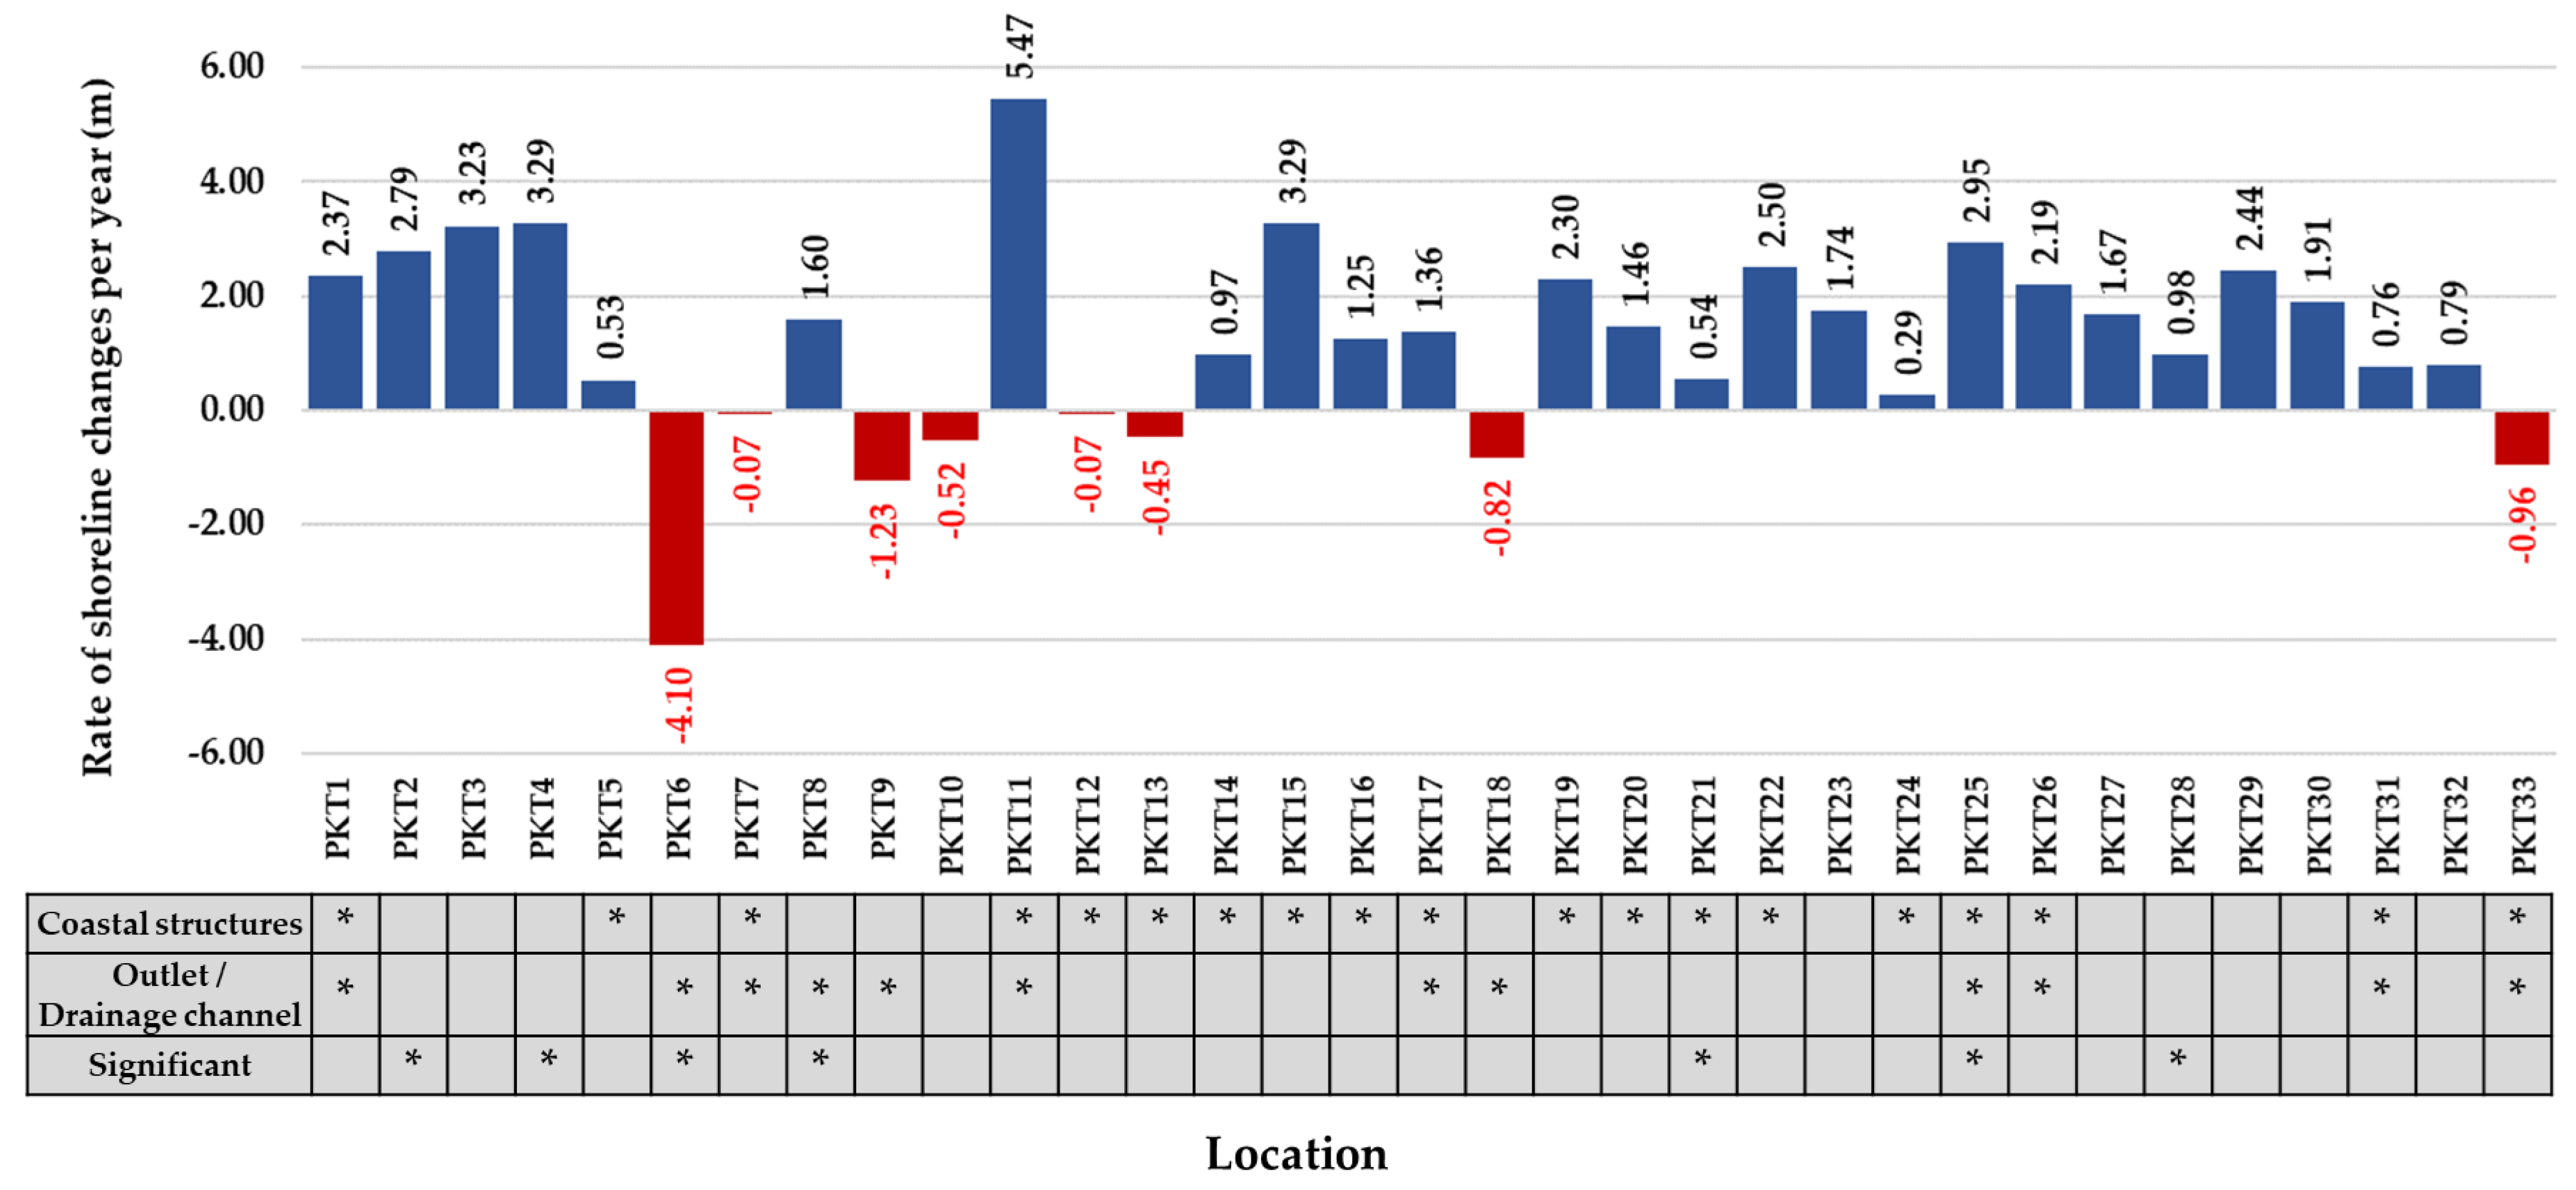
Figure 2) show that 8 out of 33 locations faced erosion problems. Following the criteria of DMCR [
33], 6 beaches (PKT7, PKT10, PKT12, PKT13, PKT18, and PKT33) had mild erosion rates (erosion rate < 1 m/year) and 2 beaches (PKT6 and PKT9) had moderate erosion rates (erosion rate between 1 and 5 m/year). The accretion rate of 25 locations varied between 0.29 and 5.47 m/year.
Figure 2 presents the coastal structures and outlets that may have impacted shoreline changes. However, it cannot be concluded from these findings separately that they were the cause of the observed increase in beach width. Additional analyses and data are needed to establish a causal relationship between these factors and changes in shoreline position. The results of the correlation analysis demonstrate a significant relationship between time and shoreline change.
4.2.2. Future Shoreline Recession Due to Sea Level Rise
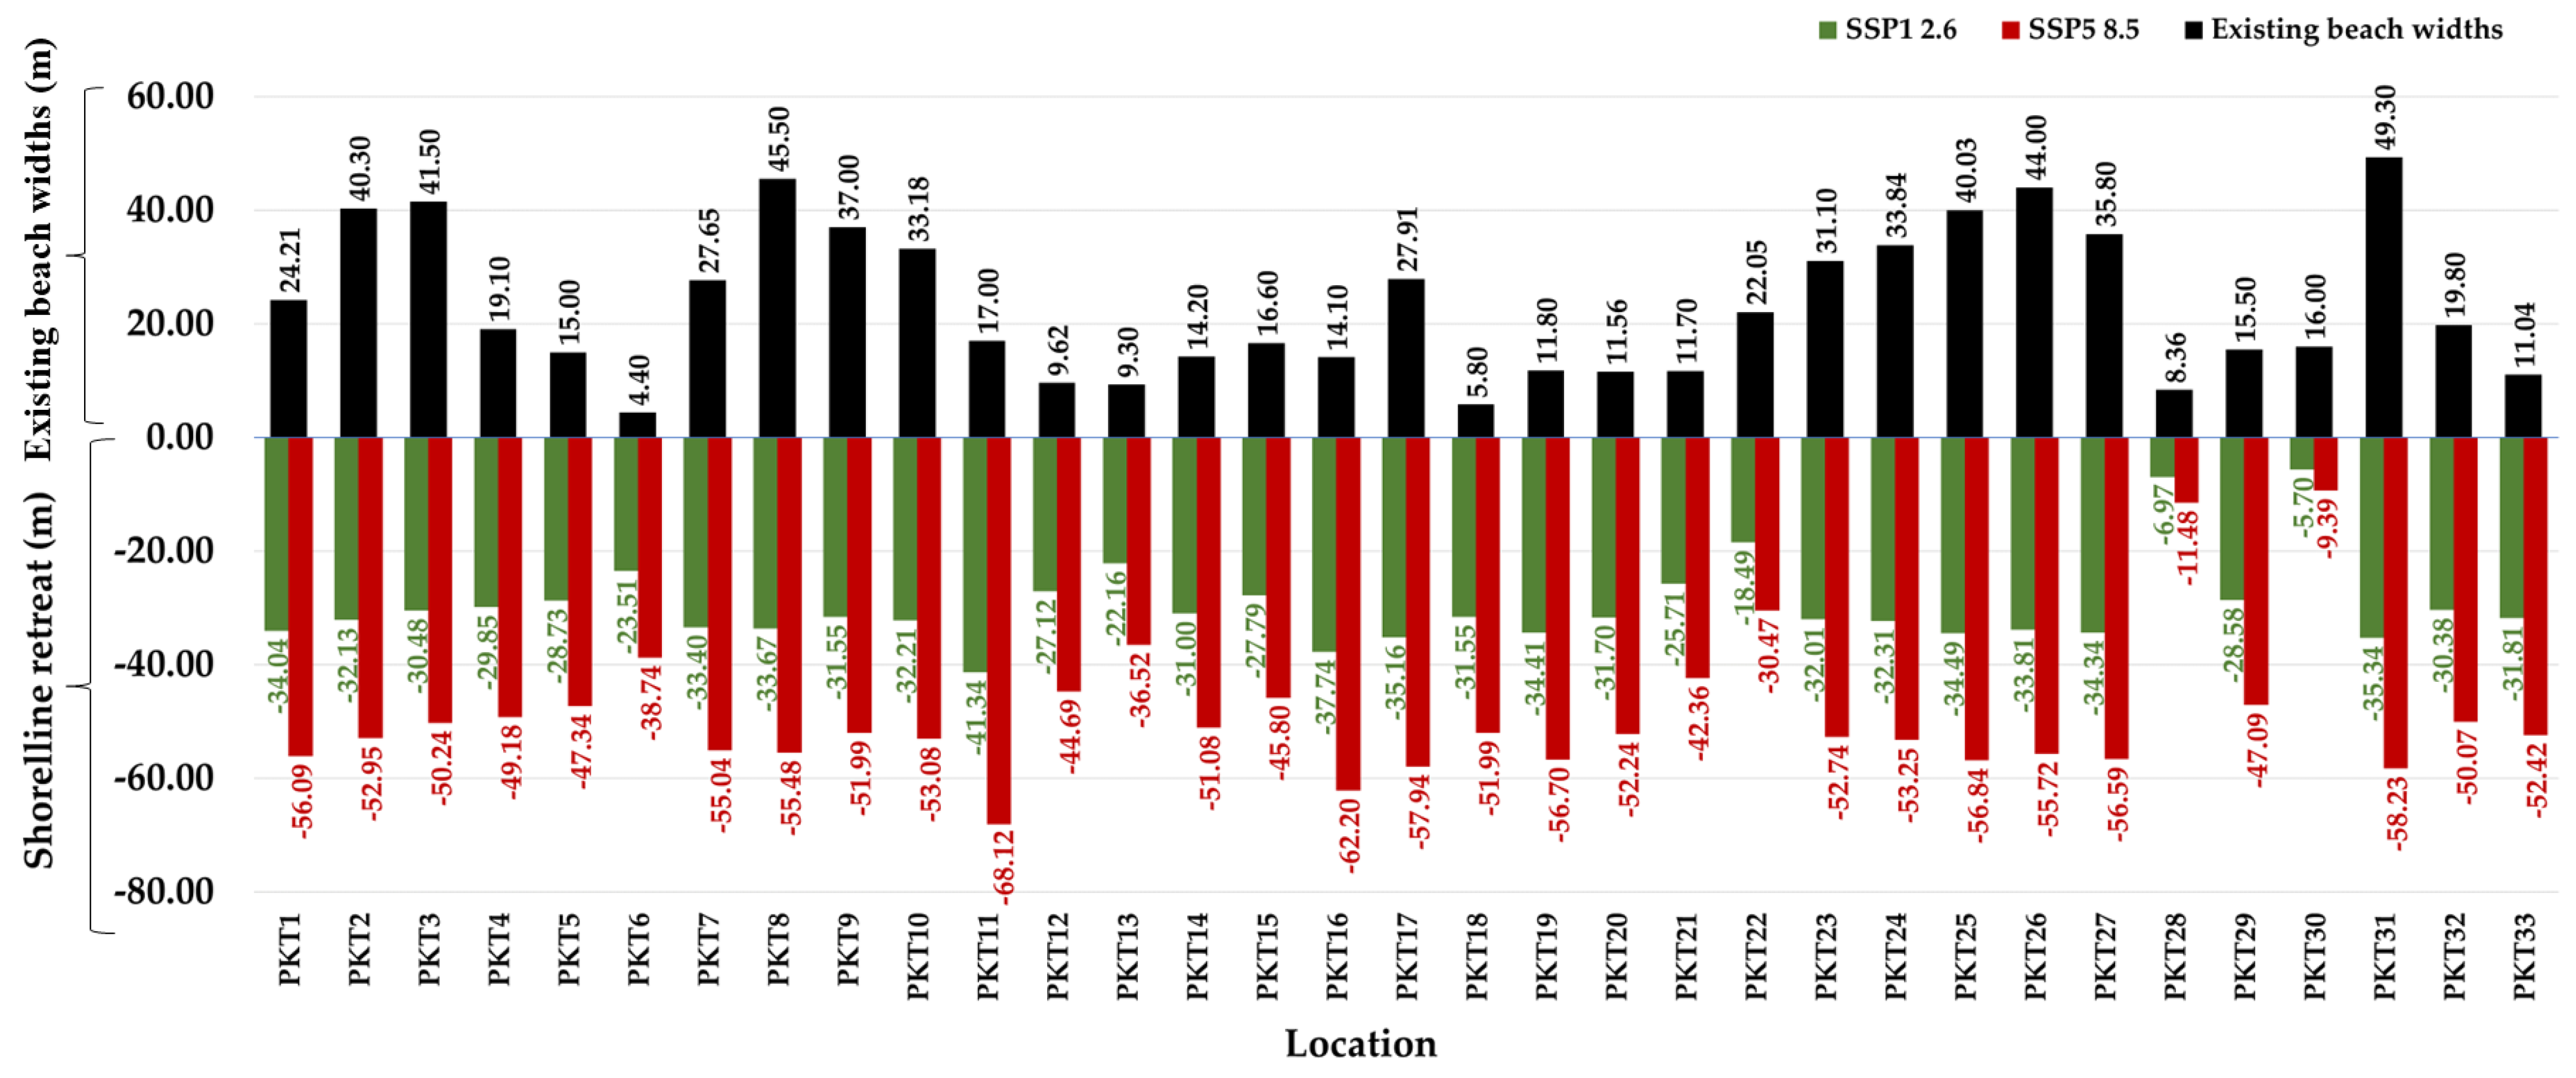
The results of shoreline recession due to future sea level rise for the best-case scenario (SSP1 2.6) and worst-case scenario (SSP5 8.5) are shown in
Figure 3. The maximum shoreline recession was −41 m (SSP1 2.6) to −48 m (SSP5 8.5) at Kamala Beach (PKT11). The minimum shoreline recession was −5 m (SSP1 2.6) to −9 m (SSP5 8.5) at Aow Sean Beach (PKT11). Considering the shoreline recession with the existing beach width from field observation (
Table 2), 20 beaches and 32 beaches will be completely lost in the best-case and worst-case scenarios, respectively.
5. Discussion
CoastSat effectively solved the unavailable data problem in Thailand by providing a convenient tool for automatically detecting shorelines on a large scale. This tool provides an effective solution for enhancing shoreline mapping and monitoring efforts in the region. Nearly 75% of beaches exhibit an increasing trend in shoreline changes based on historical shoreline changes according to data obtained from satellite images between 2013 and 2021. However, statistical analysis found that most of the observed increasing trends were insignificant (p-value < 0.05). This finding supports the notion that changes in shoreline position can be attributed to time and may have important implications for understanding coastal processes and their potential impacts.
Based on the results, beaches with steeper slopes, such as PKT5, PKT14, and PKT32, had larger sediment grain sizes than those with gentler slopes. However, PKT22 had the largest sediment grain size, despite having a slope that was not the steepest, while PKT33 had the steepest slope, but did not have the largest sediment grain size. A relationship exists between sediment grain size and beach slope, whereby coarser sediments generally result in steeper foreshore slopes than finer sediments [
34].
Some of the results obtained from the study show a deviation from the theoretical expectations, possibly attributed to the influence of the existing coastal structures in the study area. For example, PKT6 experienced the highest erosion rates, regardless of its gentle slope, which may be attributed to an outlet channel in the area. Furthermore, despite having outlets, PKT1, PKT8, PKT11, PKT17, PKT25, PKT26, and PKT31 exhibited shoreline accretion, rather than erosion.
Consequently, human activities can change beach morphology, mainly through coastal development, pollution, and recreational activities. Coastal urbanization, such as hotels and roads being built along beaches, can result in drainage channels leading directly to the sea, as well as other coastal structures developed by humans to protect the areas behind the beaches. Eight locations in this research were found to experience erosion, with half of these locations having coastal structures constructed along their shores. Thus, it is essential to consider the environmental and ecological consequences of human activities in coastal areas.
The result of the shoreline recession showed that 20 beaches (SSP1 2.6) and 32 beaches (SSP5 8.5) will be lost due to the rising sea level in the future (2081–2100).
This study found that most beaches with erosion problems from historical shoreline changes will be lost due to sea level rise. PKT9 (Surin 2 beach) and PKT10 (Laem Shing beach) will still have beach areas after sea level rise because of the wide existing beach. Thus, the factors affecting shoreline recession are the beach slope, sediment grain size, and the current beach width. Thus, sustaining and nourishing beach areas is essential for protecting against potential sea level rise in the future. Therefore, it is important to consider the implementation of beach nourishment as a measure to mitigate the impacts of coastal erosion and sea level rise for sandy tourist beaches. Following beach nourishment, the increased beach width assists tourism activities. Furthermore, beach nourishment has not been implemented on Phuket Island. This finding can be utilized to develop adaptation strategies or beach management planning, particularly when integrated with shoreline change analysis.
This study discusses the beaches that have faced erosion problems and suggests potentially useful coastal management strategies. The erosion problem was identified from historical shoreline changes obtained from CoastSat, whereas the identification of the coastal protection structures was based on field observations. While maintaining beach areas is an appropriate measure for accretion beaches, it is particularly important for tourism purposes. The discussion concludes with the following.
- (1)
Anantara Layan beach (PKT6) has an outlet into the sea located at the southern part of the beach, which caused the erosion problem because of sediment transport from one side of the outlet to the other. This area has no coastal protection structure, so an adaptation with sand bypassing may be appropriate for this area [
35].
- (2)
Bang Tao beach (PKT7) has many coastal protection structures that are disorganized, which may cause coastal erosion. The stakeholders and organizations in this area must determine the efficiency and organize all structures together.
- (3)
Surin2 beach (PKT9) lacks any coastal protection structure, but this beach is still wide (37 m width according to field observation) under the present situation. Therefore, beach nourishment may be a suitable adaptation for this location.
- (4)
Laem Shing beach (PKT10) faces mild erosion with no coastal protection structures. From the observation data, this location is a natural beach with a healthy dune and beach forest behind the beach. The beach can be recovered based on the deposited sand dune. Therefore, appropriate adaptation measures would be to conserve the existing conditions.
- (5)
Regency beach (PKT12) is narrow. The southern section of this beach features a seawall. Hyatt Regency Phuket Resort (5-star hotel) is a very famous hotel located behind the beach after the road. Adaptation with beach nourishment may be suitable for this beach due to the recreational use of the beach area for tourists staying at hotels near the beach.
- (6)
Hua beach (PKT13) has a sea wall along the coast, which may cause erosion problems. This location has a public-access park near the beach, but it does not have good scenery because of the improper design of the seawall. Hence, seawall renovation and landscape design are essential for this location to be used for recreational purposes.
- (7)
Amari Patong beach (PKT18) is a private beach of a hotel. There are large rocks present along the beach. Due to the narrow width of the beach, the beach area disappears during high tide. Beach nourishment can provide a larger beach area, but it is necessary to perform cost–benefit analysis.
- (8)
Rawaii Beach (PKT33) has various uses and several coastal protection structures that may cause erosion. Furthermore, the traditional fishing community that relies on this beach should be conserved. It is essential to implement an integrated approach to coastal structures in order to enhance efficiency and minimize the impact of engineering structures on sandy beaches. Consequently, beach zoning is crucial in reducing conflicts between various uses, such as restaurants, recreational activities, and fishing communities, and ensuring their integration.
A comprehensive analysis of shoreline changes, including a detailed assessment of costs and benefits associated with potential adaptations, should be undertaken before undertaking any management decisions or adaptation plans.
6. Conclusions
Beach tourism performs an essential role in the economy of Phuket, Thailand. This study aimed to evaluate the annual shoreline changes with CoastSat and estimate the future shoreline recession using the Bruun rule and updated CMIP6 sea-level-rise data. The results found that 8 locations out of 33 sites are facing erosion problems. The shoreline changes varied between −4.10 m/year and 5.47 m/year. The analysis of future shoreline recession due to sea level rise found that 20 beaches and 32 beaches would be lost entirely under the best-case and worst-case scenarios, respectively. The future shoreline recession varied between −5 m (SSP1 2.6) to −48 m (SSP5 8.5). The discussion of current coastal management and erosion issues revealed that, despite the presence of coastal protection structures, beaches in Phuket continue to experience erosion problems. CoastSat is a convenient tool for detecting shorelines on a large scale, although it may have limitations in small study areas due to the resolution of the satellite images. However, based on the findings of this study, appropriate preliminary adaptation management strategies are suggested.
Author Contributions
Conceptualization, S.R. and K.K.; Formal analysis, P.N.; Funding acquisition, S.R. and T.O.; Investigation, T.O.; Methodology, P.N.; Project administration, S.R. and T.O.; Supervision, S.R., K.K. and T.O.; Validation, K.K.; Writing—original draft, P.N.; Writing—review & editing, S.R. All authors have read and agreed to the published version of the manuscript.
Funding
This research received no external funding.
Institutional Review Board Statement
Not applicable.
Informed Consent Statement
Not applicable.
Data Availability Statement
Not applicable.
Acknowledgments
This work was financially supported by the Office of the Ministry of Higher Education, Science, Research and Innovation; and the Thailand Science Research and Innovation through the Kasetsart University Reinventing University Program 2021. I most gratefully acknowledge Keiko Udo and Takenori Shimozono for all their support.
Conflicts of Interest
The authors declare no conflict of interest.
References
- Magalhães Filho, L.; Roebeling, P.; Villasante, S.; Bastos, M.I. Ecosystem services values and changes across the Atlantic coastal zone: Considerations and implications. Mar. Policy 2022, 145, 105265. [Google Scholar] [CrossRef]
- Somphong, C.; Udo, K.; Ritphring, S.; Shirakawa, H. An estimate of the value of the beachfront with respect to the hotel room rates in Thailand. Ocean Coast. Manag. 2022, 226, 106272. [Google Scholar] [CrossRef]
- Ministry of Tourism and Sports of Thailand. Sea Sun Sand Tourism Economics Competitiveness; Ministry of Tourism and Sports of Thailand: Bangkok, Thailand, 2018. (In Thai)
- Splinter, K.D.; Harley, M.D.; Turner, I.L. Remote Sensing Is Changing Our View of the Coast: Insights from 40 Years of Monitoring at Narrabeen-Collaroy, Australia. Remote Sens. 2018, 10, 1744. [Google Scholar] [CrossRef]
- Hui, S.; Mengliang, G.; Yuliang, G.; Mingming, X.; Shanwei, L.; Yasir, M.; Jianyong, C.; Jianhua, W. Coastline extraction based on multi-scale segmentation and multi-level inheritance classification. Front. Mar. Sci. 2022, 9. [Google Scholar] [CrossRef]
- Hossen, M.F.; Sultana, N. Shoreline change detection using DSAS technique: Case of Saint Martin Island, Bangladesh. Remote Sens. Appl. Soc. Environ. 2023, 30, 100943. [Google Scholar] [CrossRef]
- Yasir, M.; Sheng, H.; Fan, H.; Nazir, S.; Niang, A.J.; Salauddin, M.; Khan, S. Automatic coastline extraction and changes analysis using remote sensing and GIS technology. IEEE Access 2020, 8, 180156–180170. [Google Scholar] [CrossRef]
- Yasir, M.; Hui, S.; Hongxia, Z.; Hossain, M.S.; Fan, H.; Zhang, L.; Jixiang, Z. A spatiotemporal change detection analysis of coastline data in qingdao, east china. Sci. Program. 2021, 2021, 1–10. [Google Scholar] [CrossRef]
- Vos, K.; Splinter, K.D.; Harley, M.D.; Simmons, J.A.; Turner, I.L. CoastSat: A Google Earth Engine-enabled Python toolkit to extract shorelines from publicly available satellite imagery. Environ. Model. Softw. 2019, 122, 104528. [Google Scholar] [CrossRef]
- Boak, E.H.; Turner, I.L. Shoreline definition and detection: A review. J. Coast. Res. 2005, 21, 688–703. [Google Scholar] [CrossRef]
- Curoy, J.; Ward, R.D.; Barlow, J.; Moses, C.; Nakhapakorn, K. Coastal dynamism in Southern Thailand: An application of the CoastSat toolkit. PLoS ONE 2022, 17, e0272977. [Google Scholar] [CrossRef]
- Hoang, V.C.; Tanaka, H.; Mitobe, Y. A method for correcting tidal effect on shoreline position extracted from an image with unknown capture time. Geosciences 2017, 7, 62. [Google Scholar] [CrossRef]
- Liu, Y.; Huang, H.; Qiu, Z.; Fan, J. Detecting coastline change from satellite images based on beach slope estimation in a tidal flat. Int. J. Appl. Earth Obs. Geoinf. 2013, 23, 165–176. [Google Scholar] [CrossRef]
- Nidhinarangkoon, P.; Ritphring, S.; Tanaka, H. Shoreline Changes by Using Google Earth Images with Tidal Correction: A Case Study of Samui Island, Thailand. In Proceedings of the International Conference on Fluid Mechanics, Sendai, Japan, 25–28 September 2018. [Google Scholar]
- Bruun, P. Sea-level rise as a cause of shore erosion. J. Waterw. Harb. Div. 1962, 88, 117–130. [Google Scholar] [CrossRef]
- Dean, R.G.; Houston, J.R. Determining shoreline response to sea level rise. Coast. Eng. 2016, 114, 1–8. [Google Scholar] [CrossRef]
- Intergovernmental Panel on Climate Change (IPCC). Contribution of working group I to the fifth assessment report of the intergovernmental panel on climate change. Phys. Sci. Basis 2013, 1535, 2013. [Google Scholar]
- Ritphring, S.; Somphong, C.; Udo, K.; Kazama, S. Projections of future beach loss due to sea level rise for sandy beaches along Thailand’s coastlines. J. Coast. Res. 2018, 85, 541–545. [Google Scholar] [CrossRef]
- Garner, G.G.; Hermans, T.; Kopp, R.E.; Slangen, A.B.A.; Edwards, T.L.; Levermann, A.; Nowicki, S.; Palmer, M.D.; Smith, C.; Fox-Kemper, B. IPCC AR6 WGI Sea Level Projections. 2022. Available online: https://www.wdc-climate.de/ui/entry?acronym=IPCC-DDC_AR6_Sup_SLPr (accessed on 29 March 2023).
- Department of Marine and Coastal Resources. The Status of Coastal Zone in Thailand Report; Ministry of Natural Resources and Environment: Bangkok, Thailand, 2020. (In Thai)
- Dee, D.P.; Uppala, S.M.; Simmons, A.J.; Berrisford, P.; Poli, P.; Kobayashi, S.; Andrae, U.; Balmaseda, M.; Balsamo, G.; Bauer, D.P. The ERA-Interim reanalysis: Configuration and performance of the data assimilation system. Q. J. R. Meteorol. Soc. 2011, 137, 553–597. [Google Scholar] [CrossRef]
- Tu, T.-M.; Su, S.-C.; Shyu, H.-C.; Huang, P.S. A new look at IHS-like image fusion methods. Inf. Fusion 2001, 2, 177–186. [Google Scholar] [CrossRef]
- Liu, Q.; Trinder, J.; Turner, I.L. Automatic super-resolution shoreline change monitoring using Landsat archival data: A case study at Narrabeen–Collaroy Beach, Australia. J. Appl. Remote Sens. 2017, 11, 016036. [Google Scholar] [CrossRef]
- Vos, K.; Splinter, K.D.; Harley, M.D.; Simmons, J.A.; Turner, I.L. Time-Series of shoreline change from publicly available satellite imagery. In Proceedings of the Coastal Sediments 2019: Proceedings of the 9th International Conference, Tampa/St. Petersburg, FL, USA, 27–31 May 2019; pp. 2649–2656. [Google Scholar]
- Xu, H. Modification of normalized difference water index (NDWI) to enhance open water features in remotely sensed imagery. Int. J. Remote Sens. 2006, 27, 3025–3033. [Google Scholar] [CrossRef]
- Thieler, E.R.; Himmelstoss, E.A.; Zichichi, J.L.; Ergul, A. The Digital Shoreline Analysis System (DSAS) Version 4.0—An ArcGIS Extension for Calculating Shoreline Change; US Geological Survey: Sunrise Valley Drive Reston, VA, USA, 2009; pp. 1258–2331.
- Mimura, N.; Inoue, K.; Kiyohashi, M.; Izumiya, T.; Nobuoka, H. Assessment of Sea-Level Rise Impact on Sandy Beaches (2)—Verification of Predictive Model and National Assessment. In Proceedings of the Coastal Engineering, Kobe, Japan, 23–28 October 1994; JSCE: Tokyo, Japan, 1994; pp. 1161–1165. [Google Scholar]
- Nidhinarangkoon, P.; Ritphring, S.; Udo, K. Impact of sea level rise on tourism carrying capacity in Thailand. J. Mar. Sci. Eng. 2020, 8, 104. [Google Scholar] [CrossRef]
- Nicholls, R.J.; Birkemeier, W.A.; Hallermeier, R.J. Application of the depth of closure concept. In Proceedings of the 25th International Conference on Coastal Engineering, Orlando, FL, USA, 2–6 September 1996; pp. 3874–3887. [Google Scholar]
- Dean, R.G. Equilibrium beach profiles: Characteristics and applications. J. Coast. Res. 1991, 53–84. [Google Scholar]
- Takeda, I.; Sunamura, T. Formation and spacing of beach cusps. Coast. Eng. Jpn. 1983, 26, 121–135. [Google Scholar] [CrossRef]
- Sunamura, T. Determination of breaker height and depth in the field. Ann. Rep. Inst. Geosci. Univ. Tsukuba 1983, 8, 53–54. [Google Scholar]
- Department of Marine and Coastal Resources. Coastal Erosion Management in Thailand; Ministry of Natural Resources and Environment: Bangkok, Thailand, 2011. (In Thai)
- Sorensen, R.M. Basic Coastal Engineering; Springer: Berlin/Heidelberg, Germany, 1997. [Google Scholar]
- Nienhuis, J.H.; Ashton, A.D.; Nardin, W.; Fagherazzi, S.; Giosan, L. Alongshore sediment bypassing as a control on river mouth morphodynamics. J. Geophys. Res. Earth Surf. 2016, 121, 664–683. [Google Scholar] [CrossRef]
| Disclaimer/Publisher’s Note: The statements, opinions and data contained in all publications are solely those of the individual author(s) and contributor(s) and not of MDPI and/or the editor(s). MDPI and/or the editor(s) disclaim responsibility for any injury to people or property resulting from any ideas, methods, instructions or products referred to in the content. |
© 2023 by the authors. Licensee MDPI, Basel, Switzerland. This article is an open access article distributed under the terms and conditions of the Creative Commons Attribution (CC BY) license (https://creativecommons.org/licenses/by/4.0/).


