
Mechanical Characteristics of Fiber-Reinforced Flexible Pipe Subjected to Axial Tensile Load

 ,
,
Abstract
:1. Introduction
2. Methods and Models
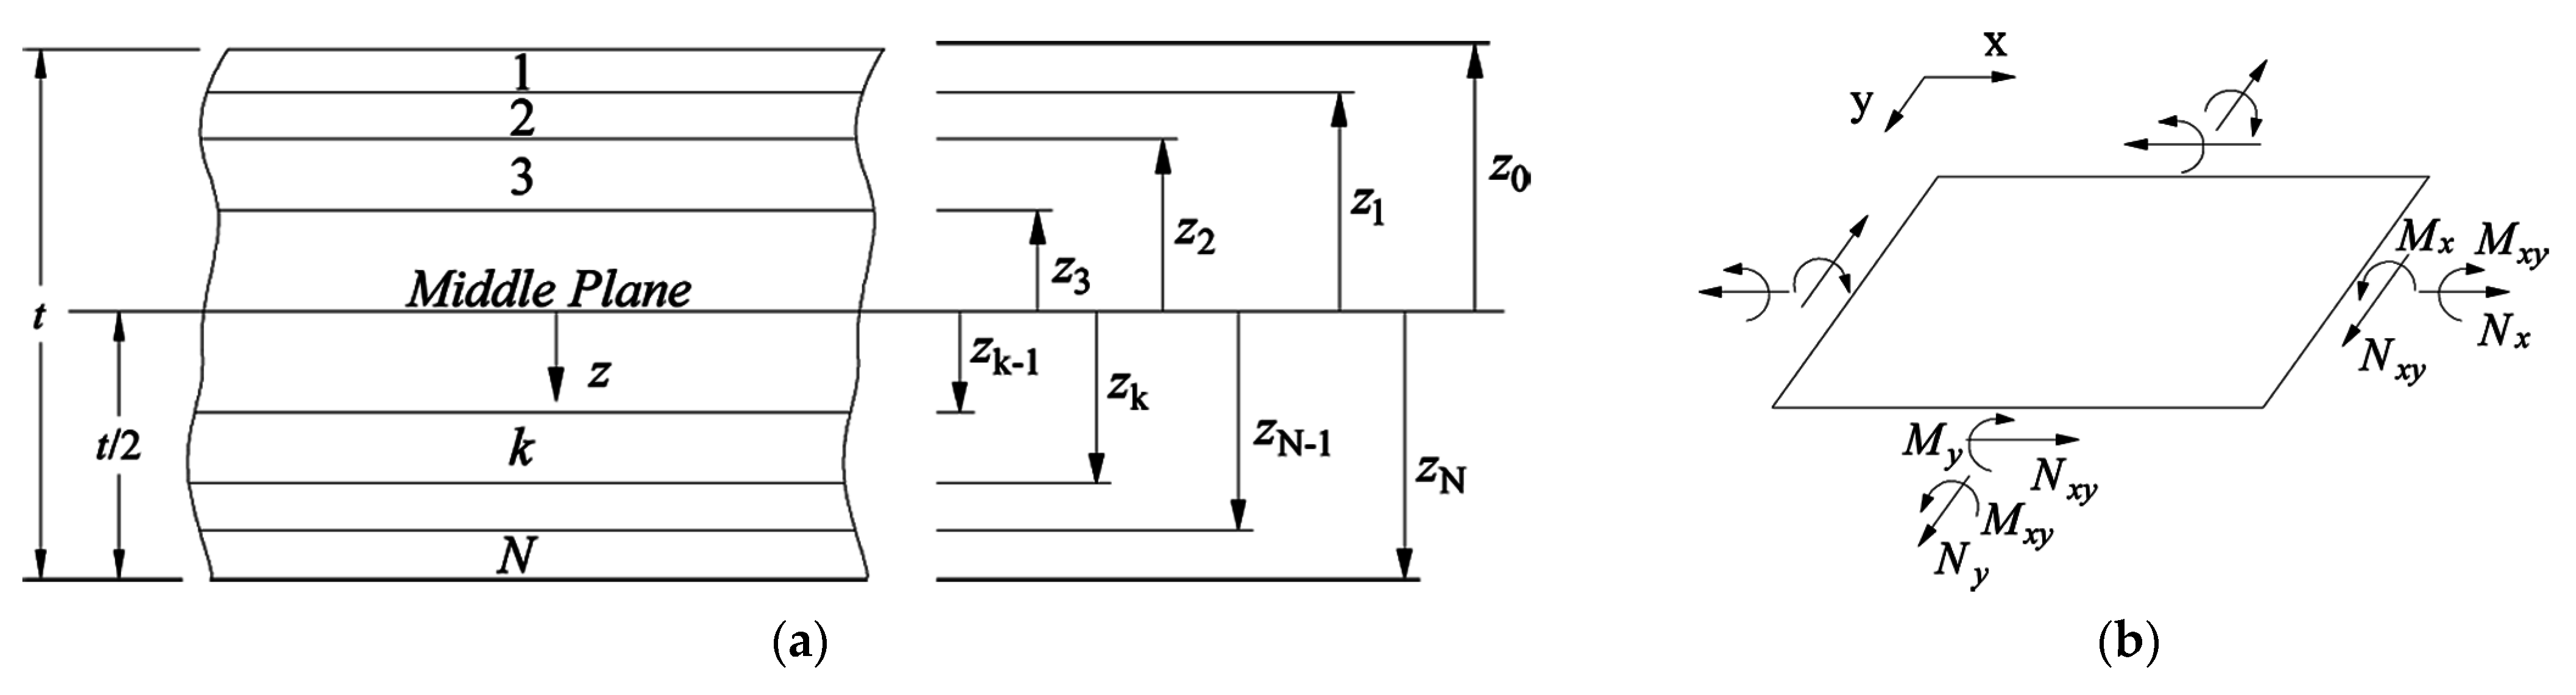
2.1. Analytical Method
- All pipe layers are in small displacement and strain state.
- All layers follow the plane section assumption.
- All materials are in the linear elastic range.
- The thickness of each layer remains constant along the axial direction of the pipe, and the spiral belts distribute uniformly along the circumferential direction.
- All layers are subject to the same end restraints; thus, they have the same axial elongation.
- The relative sliding between adjacent layers is not considered; thus, the effect of friction is ignored.
- The radial separation of adjacent layers is not considered.
2.1.1. Cylindrical Layers
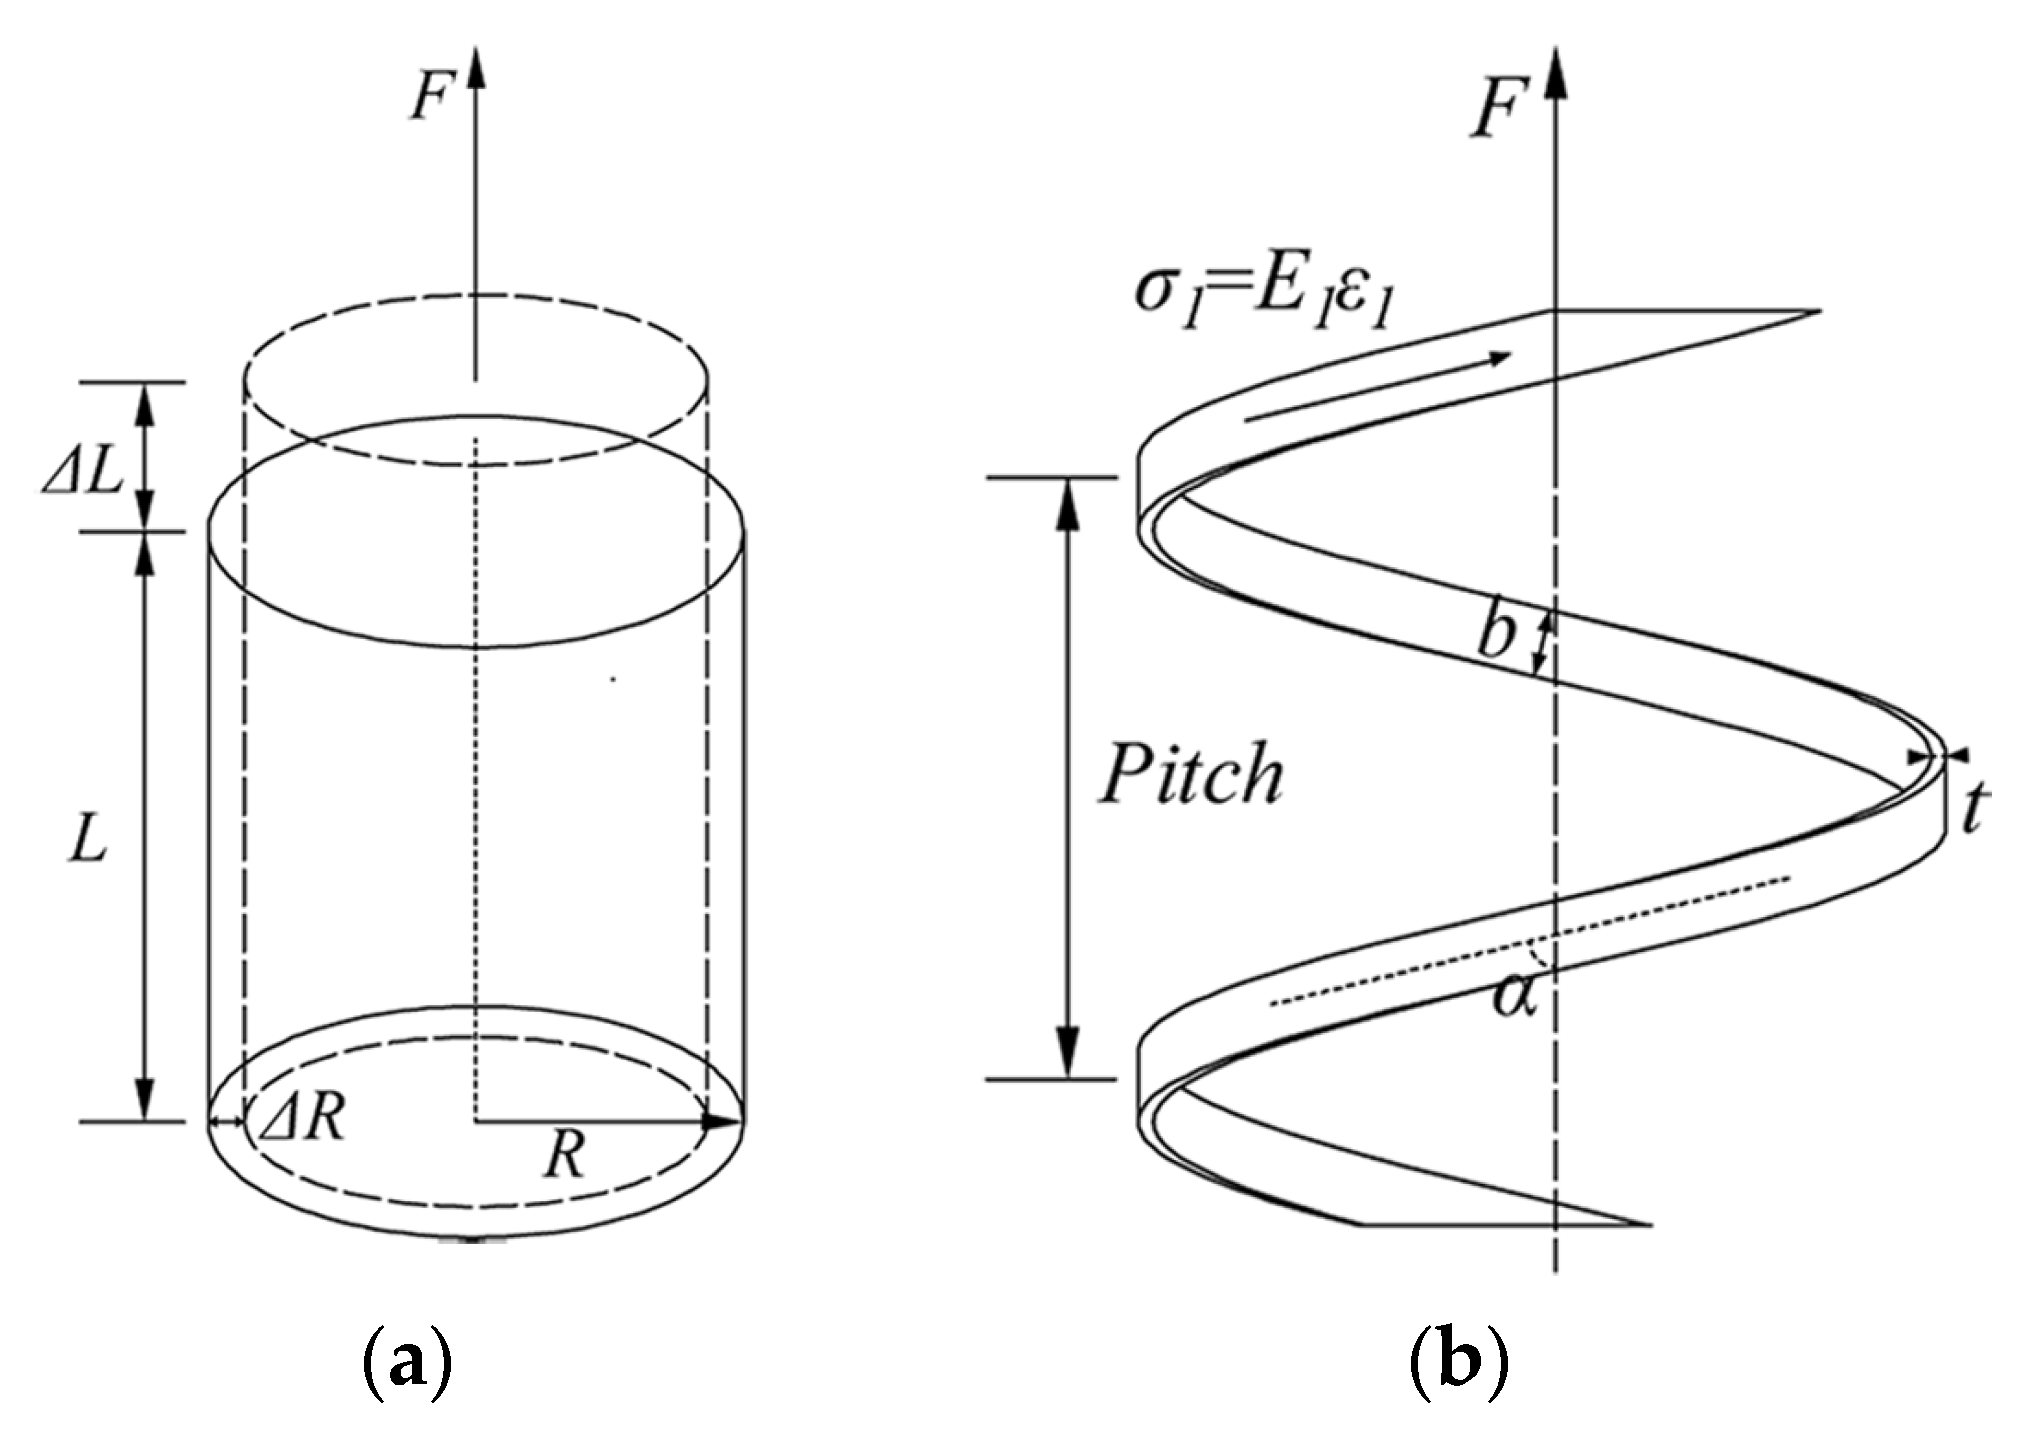
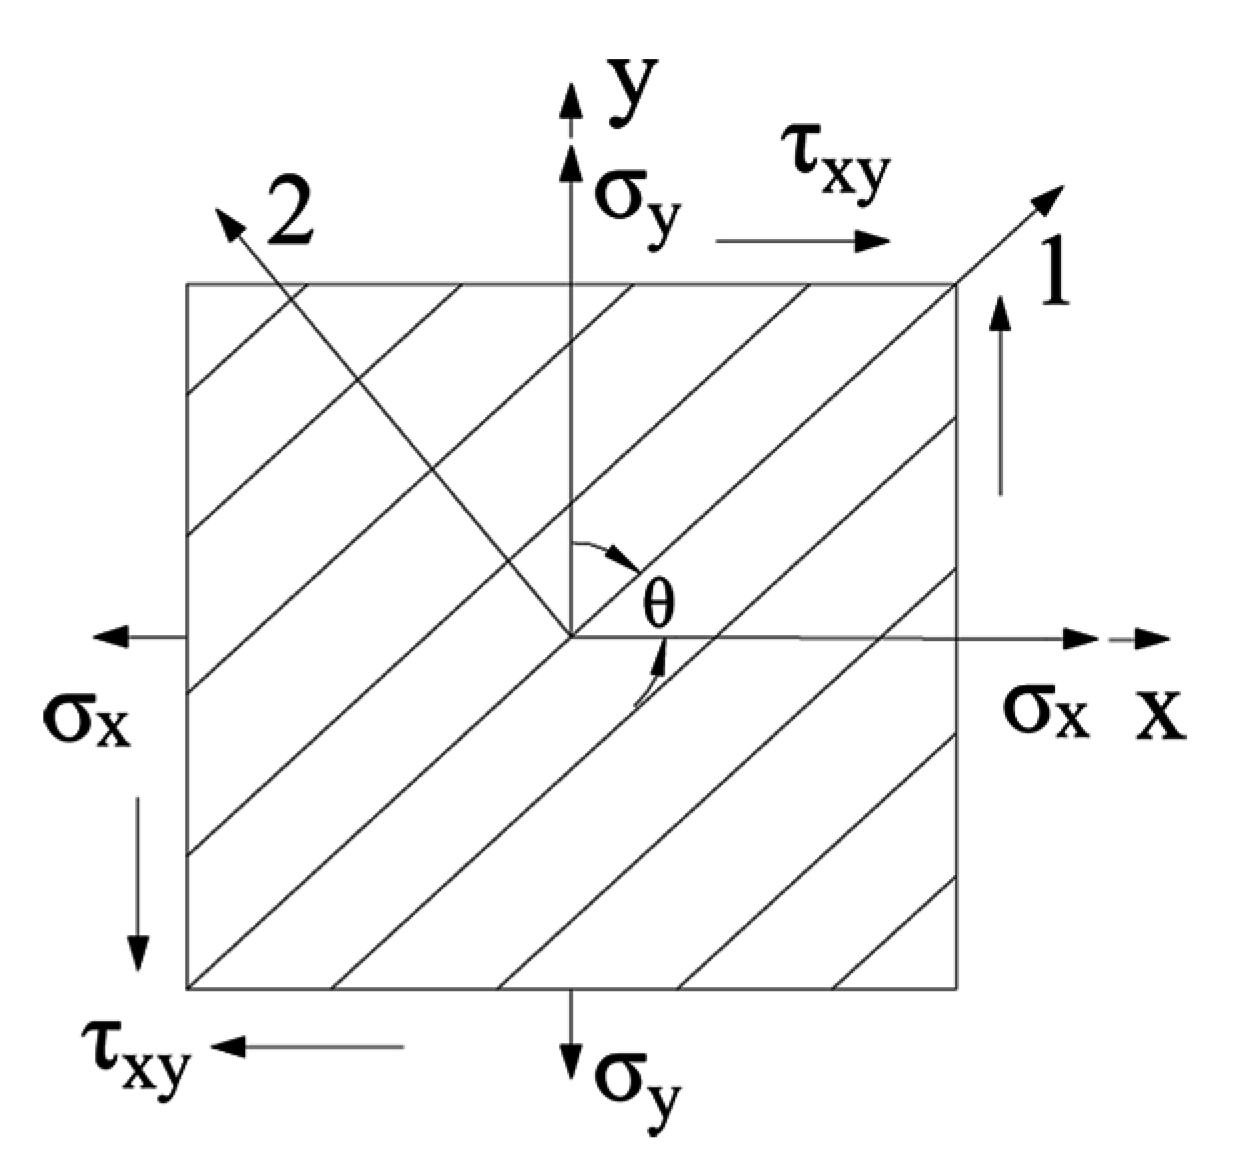
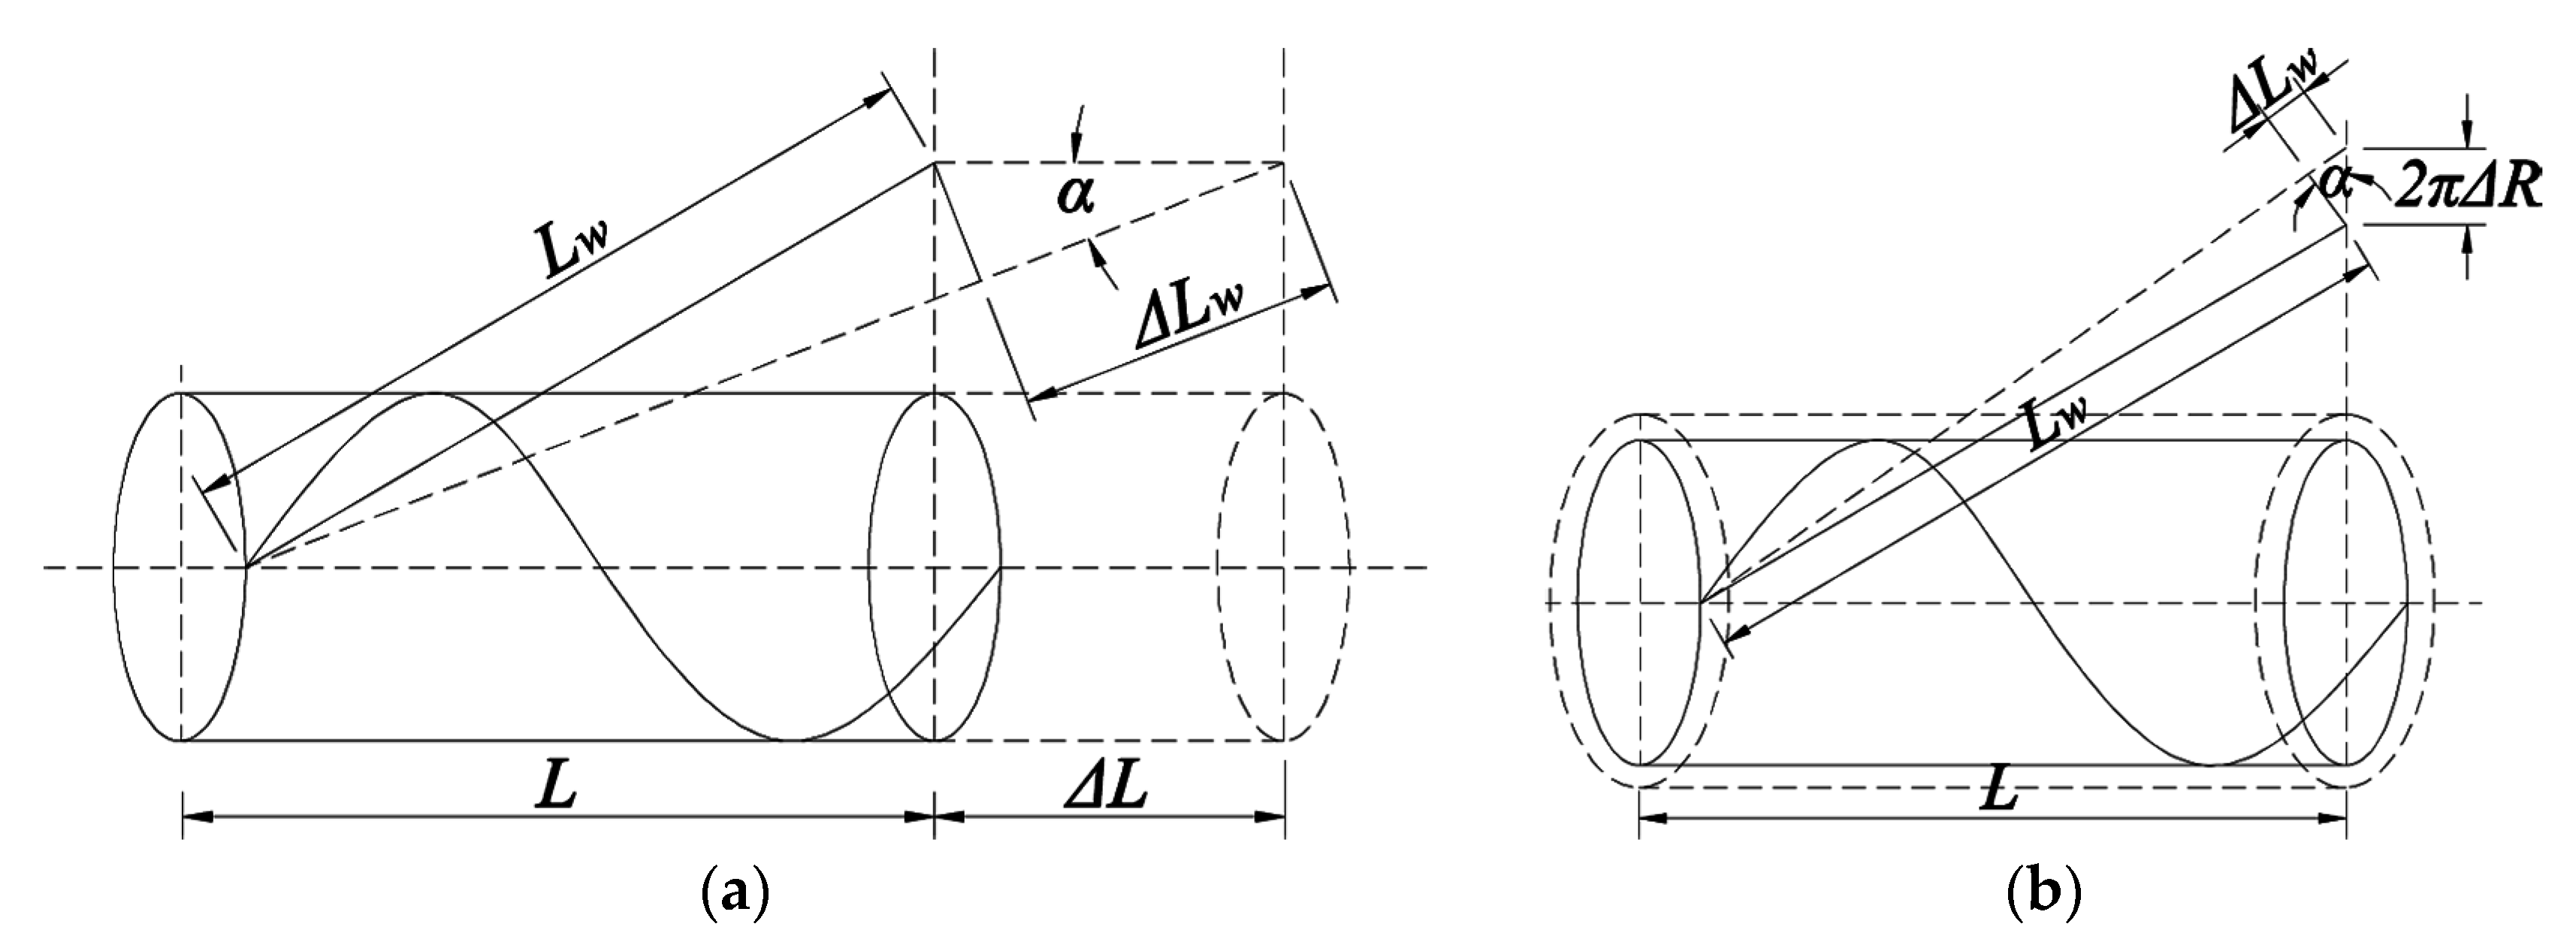
2.1.2. Helical Layers
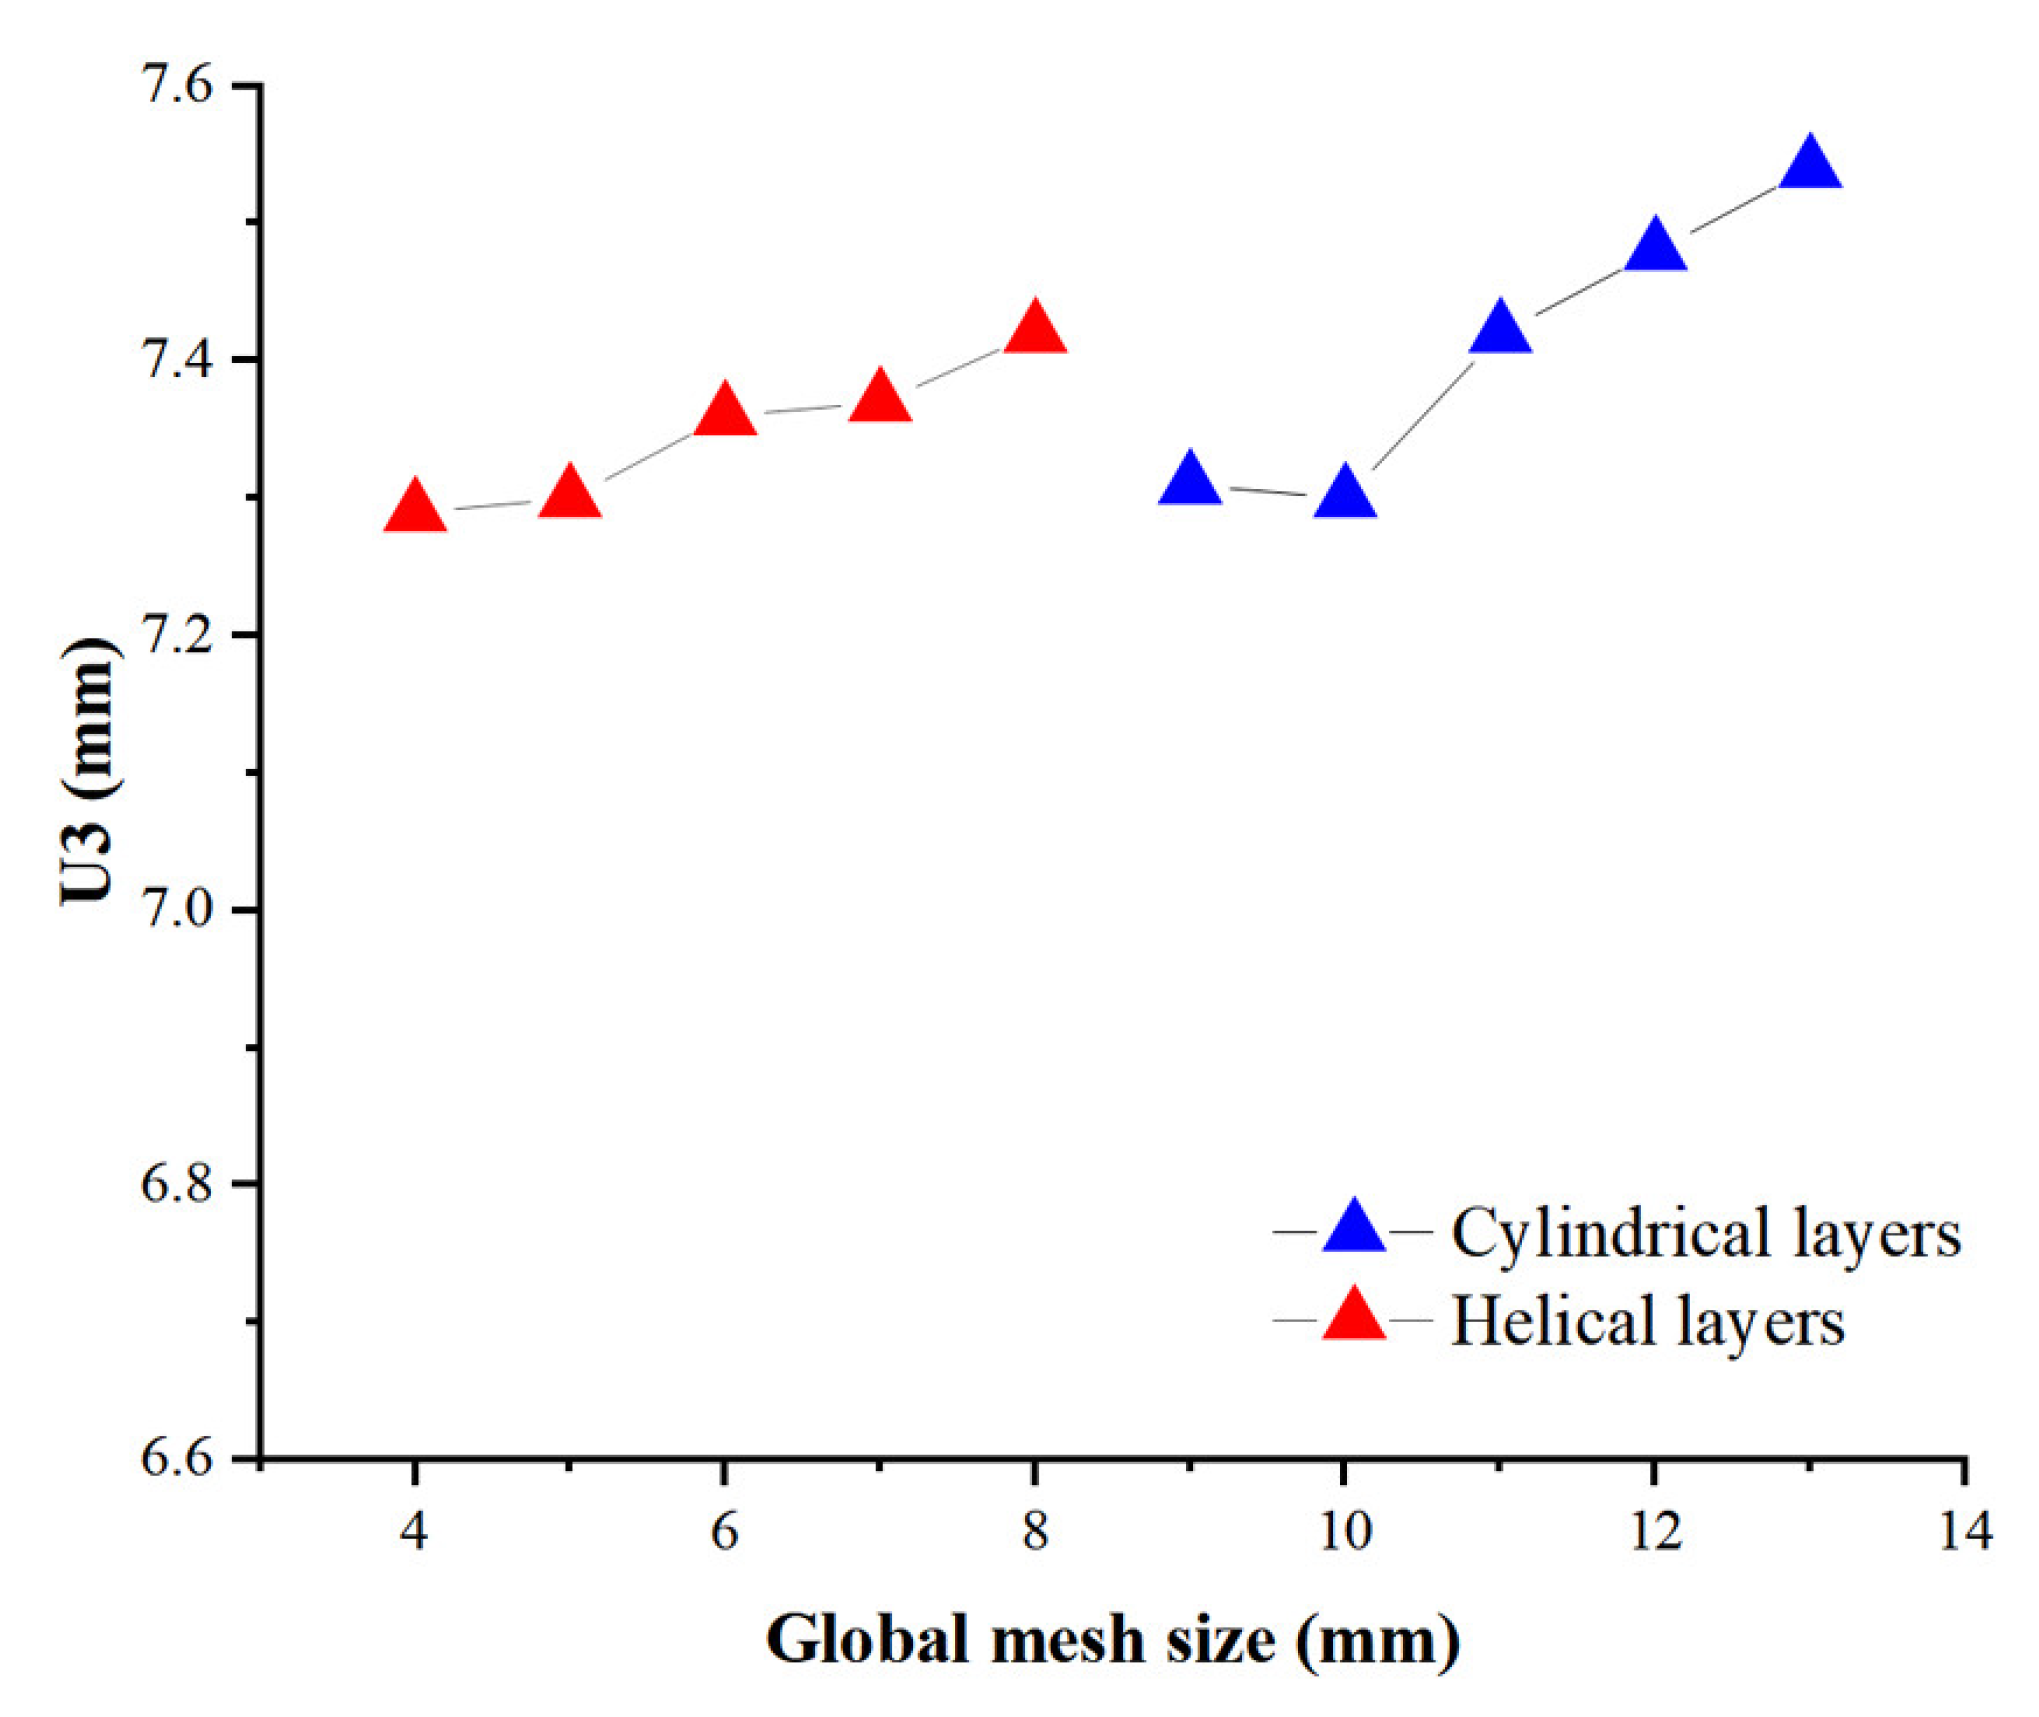
2.2. Numerical Model
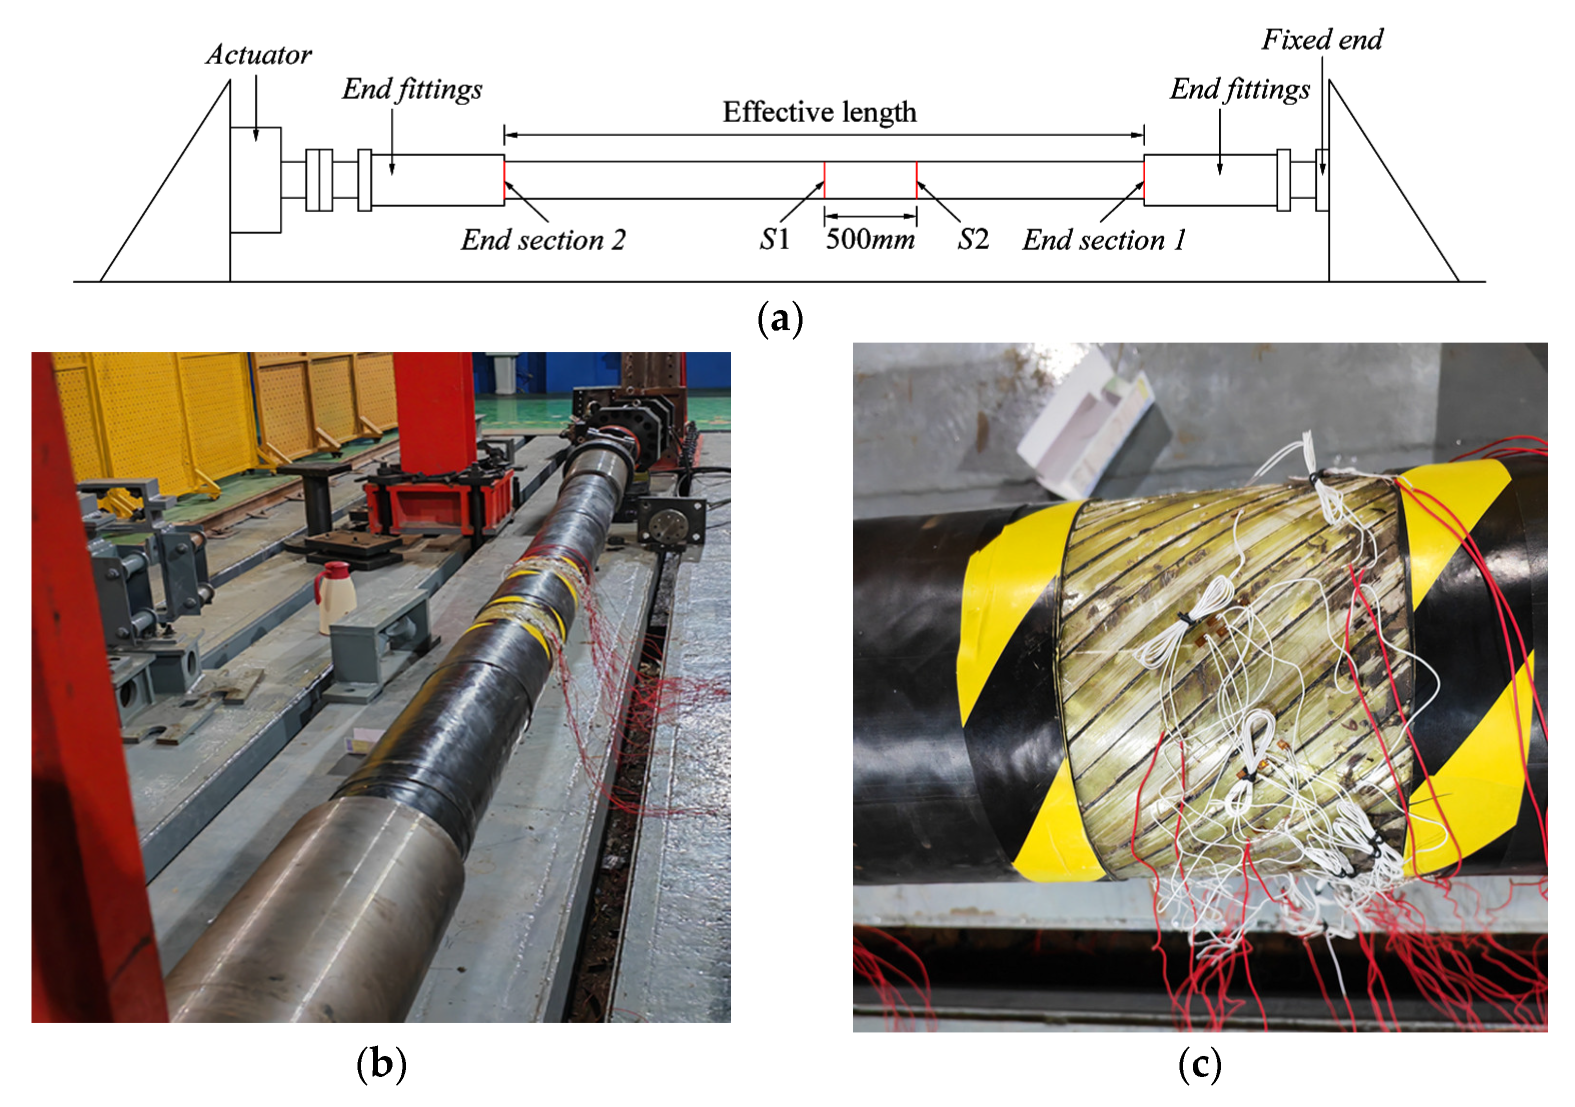
2.3. Prototype Test
3. Results and Discussions
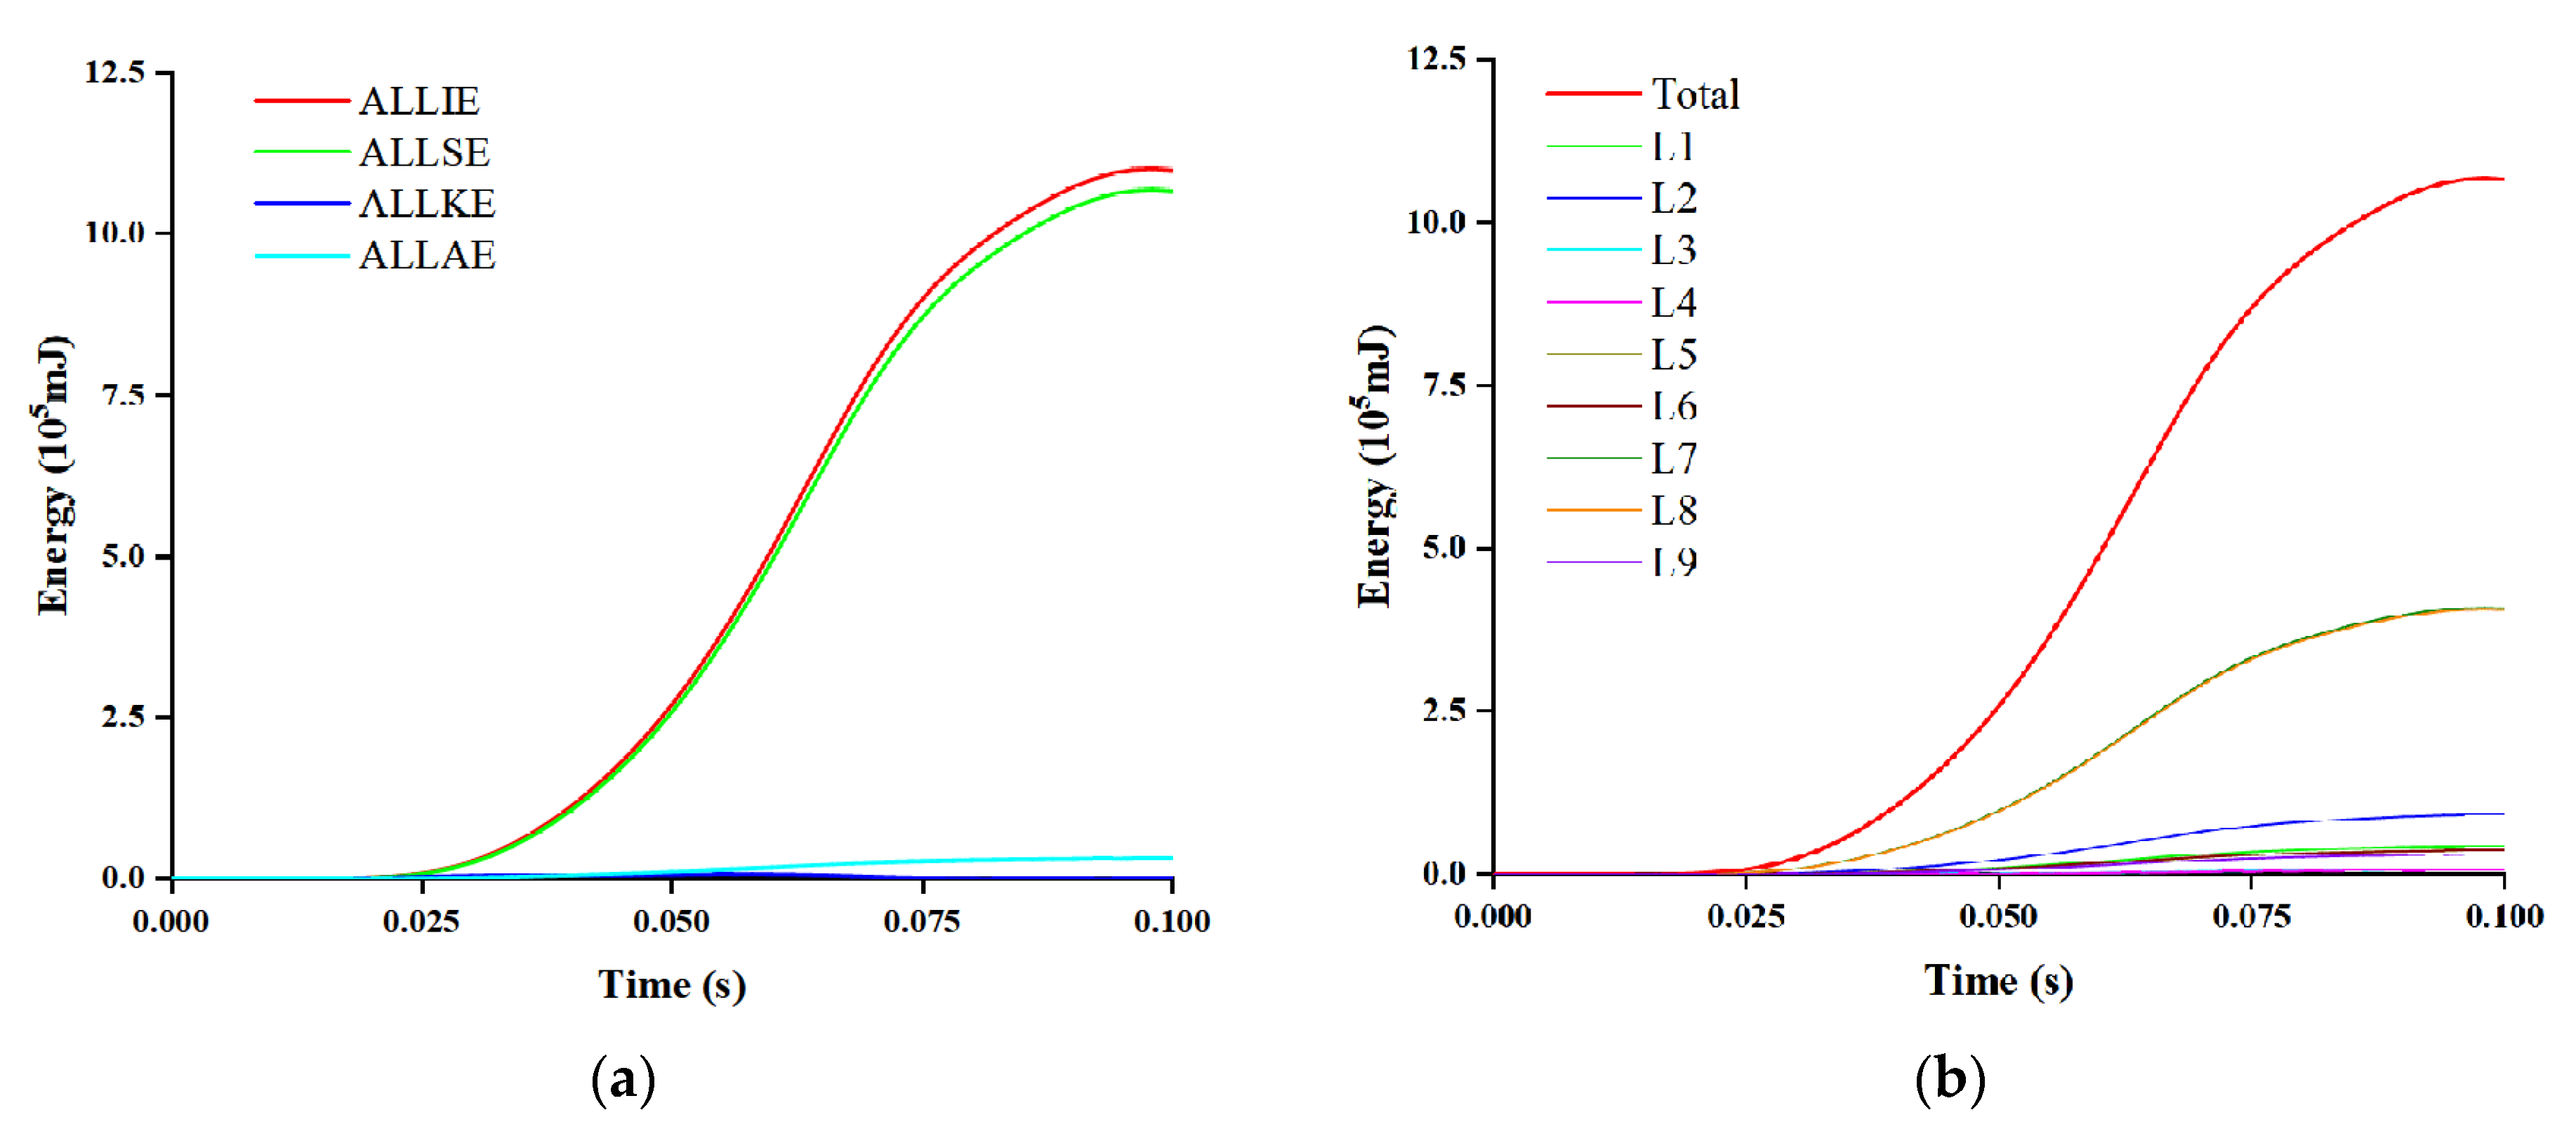
3.1. Energy Time History Curves
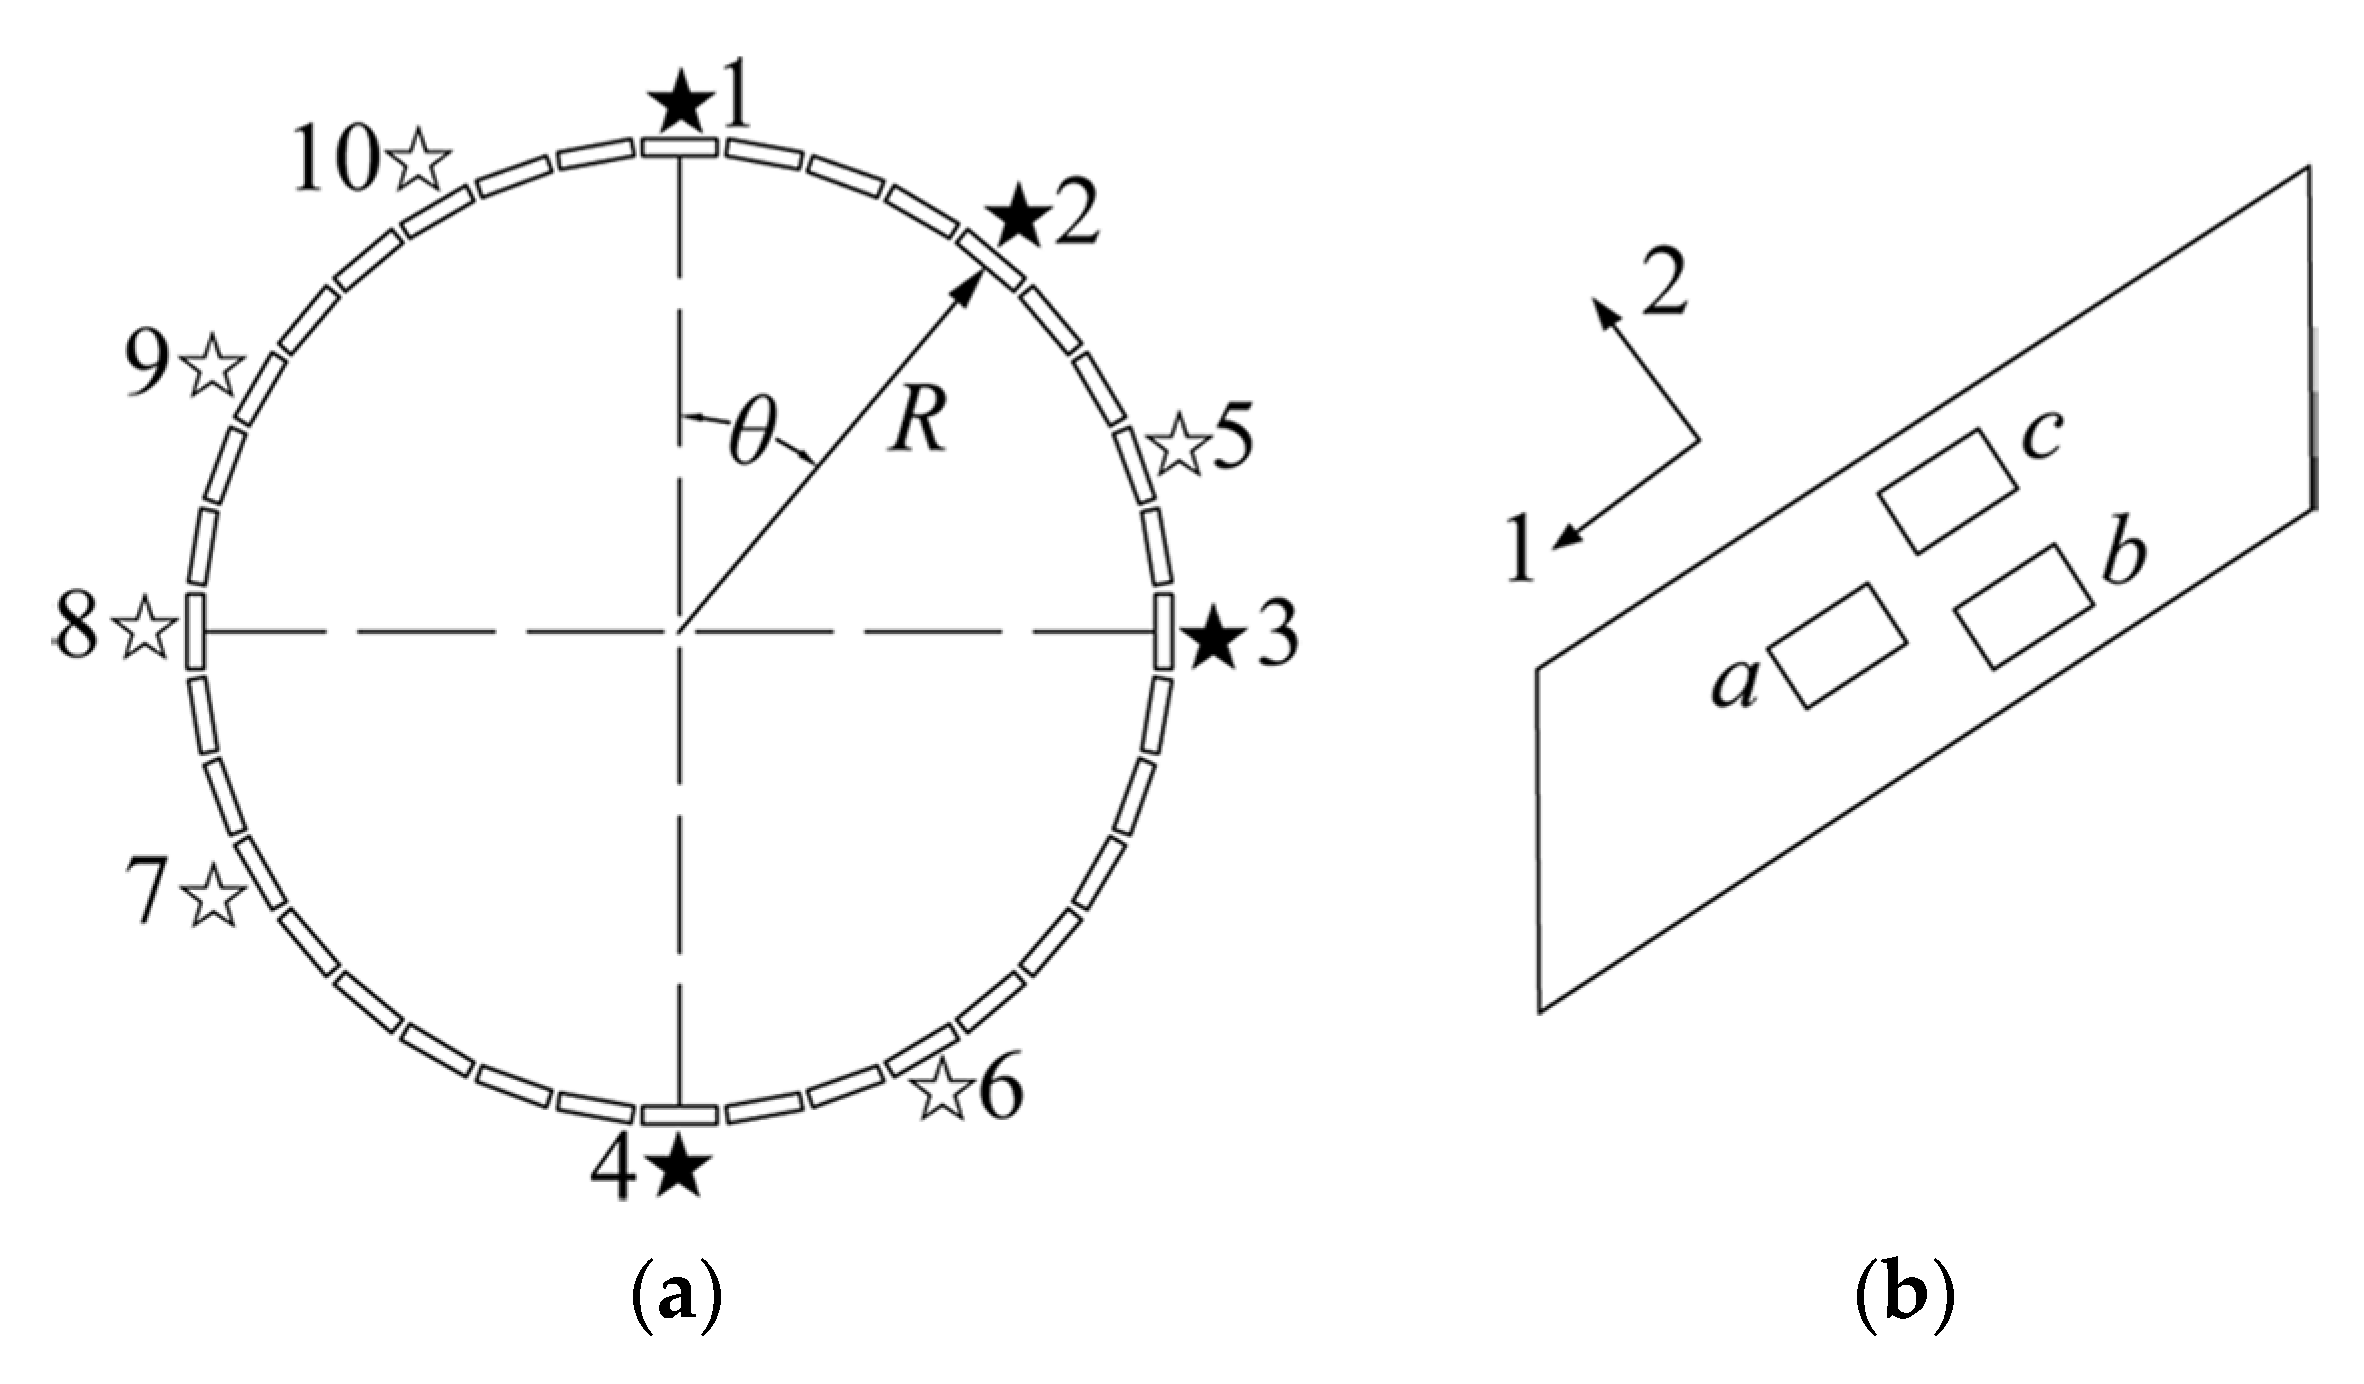
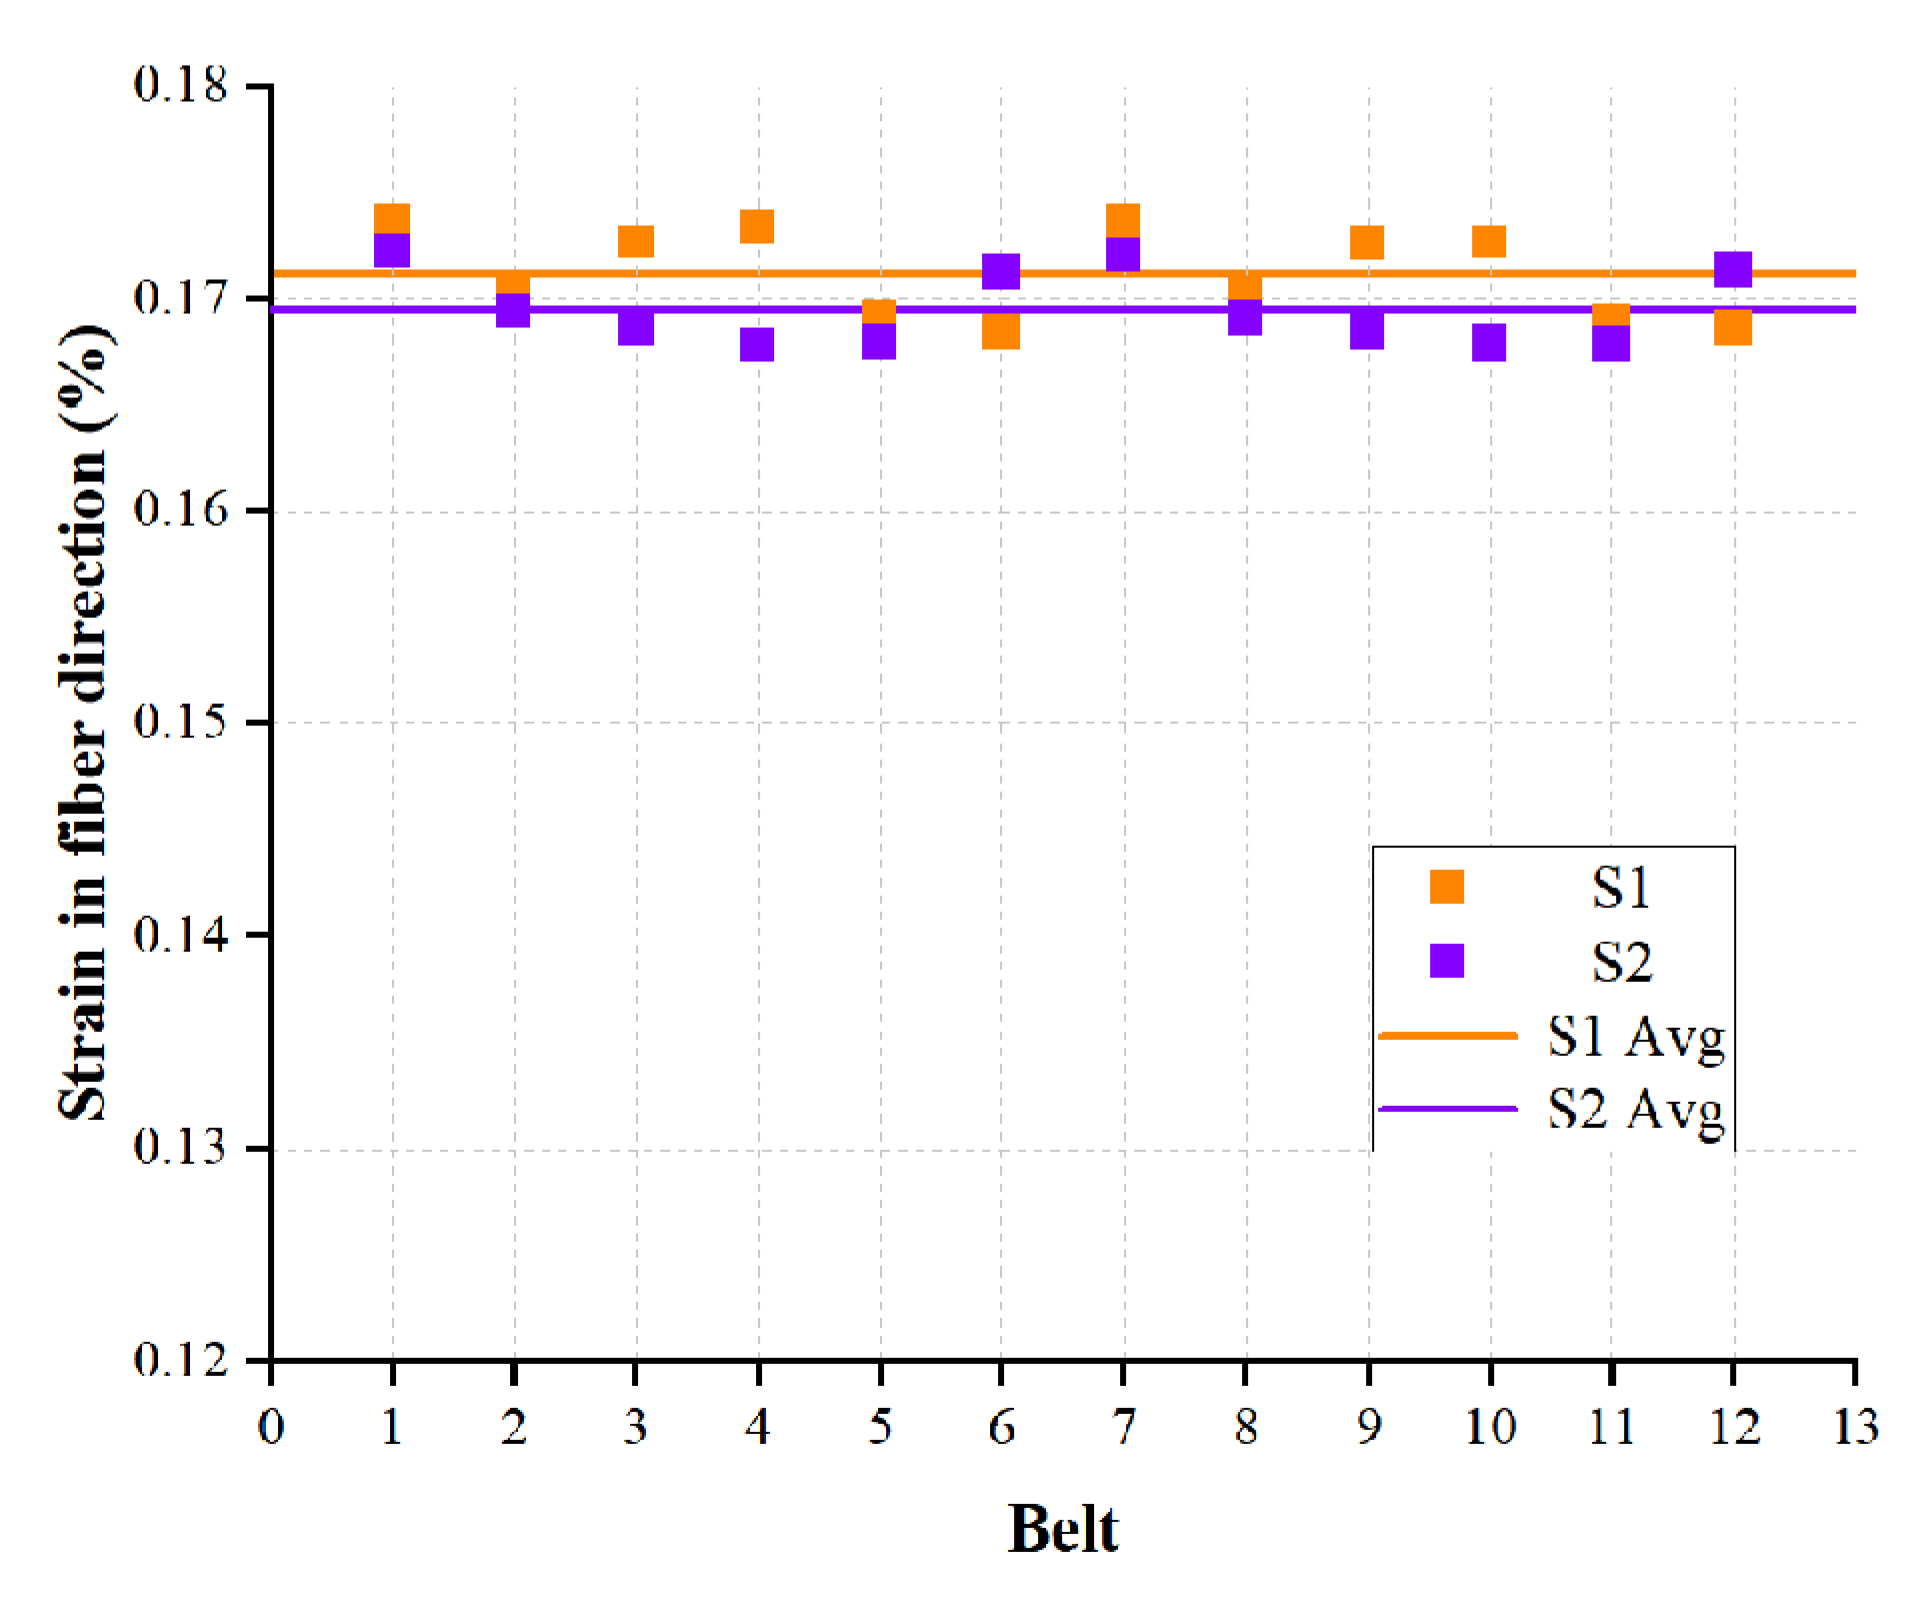
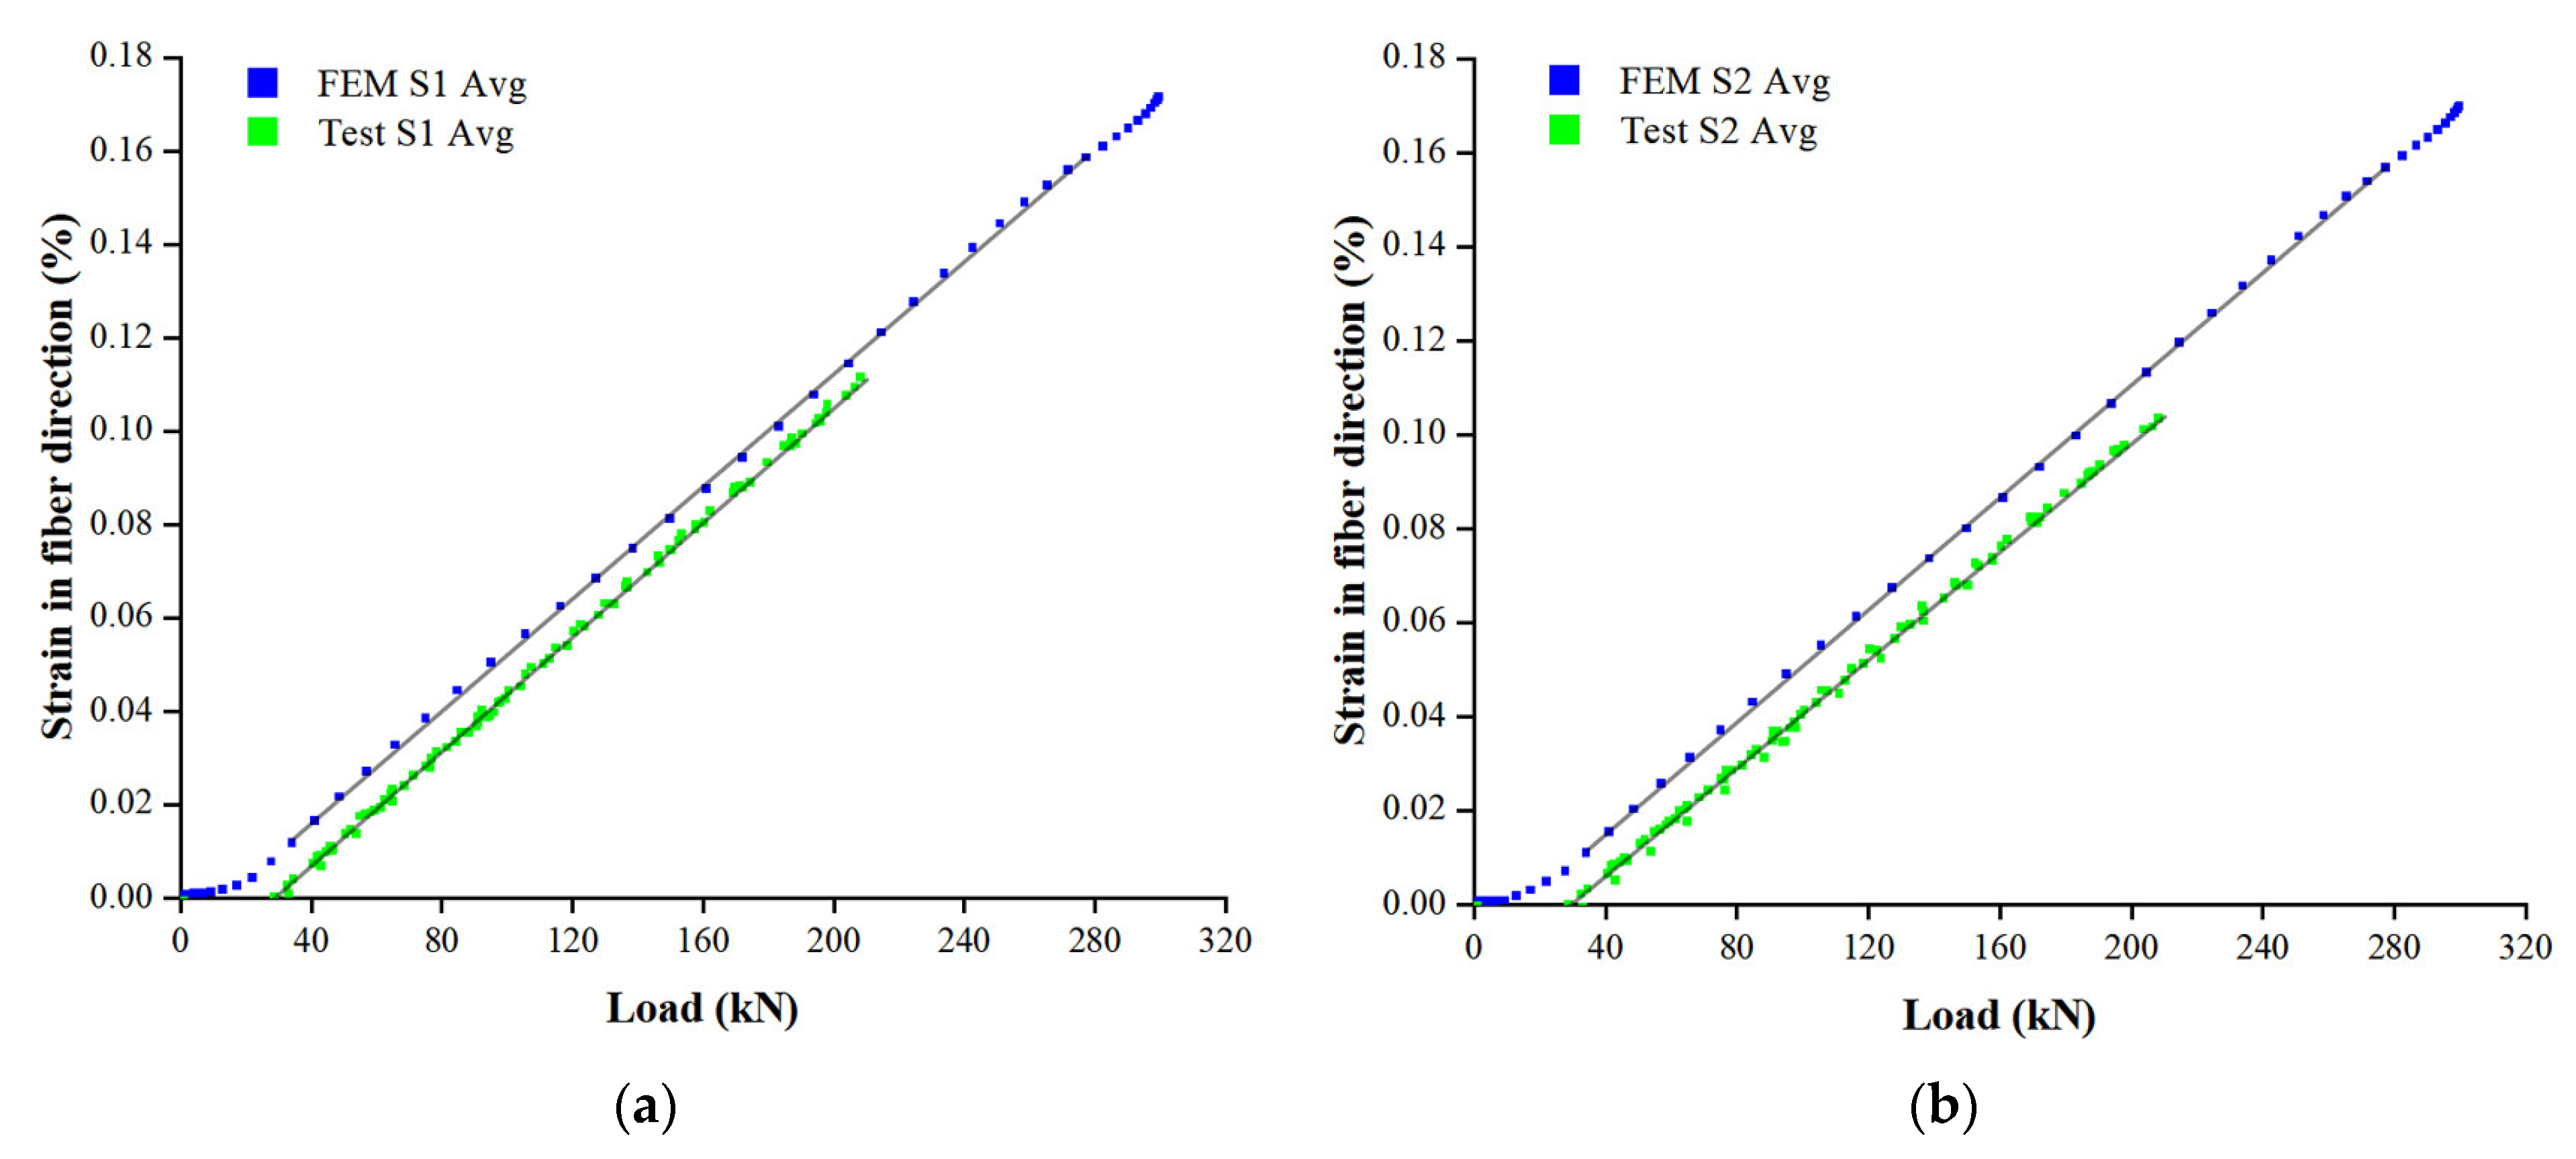
3.2. Strain Distribution of Outer Tensile Reinforcement Layer
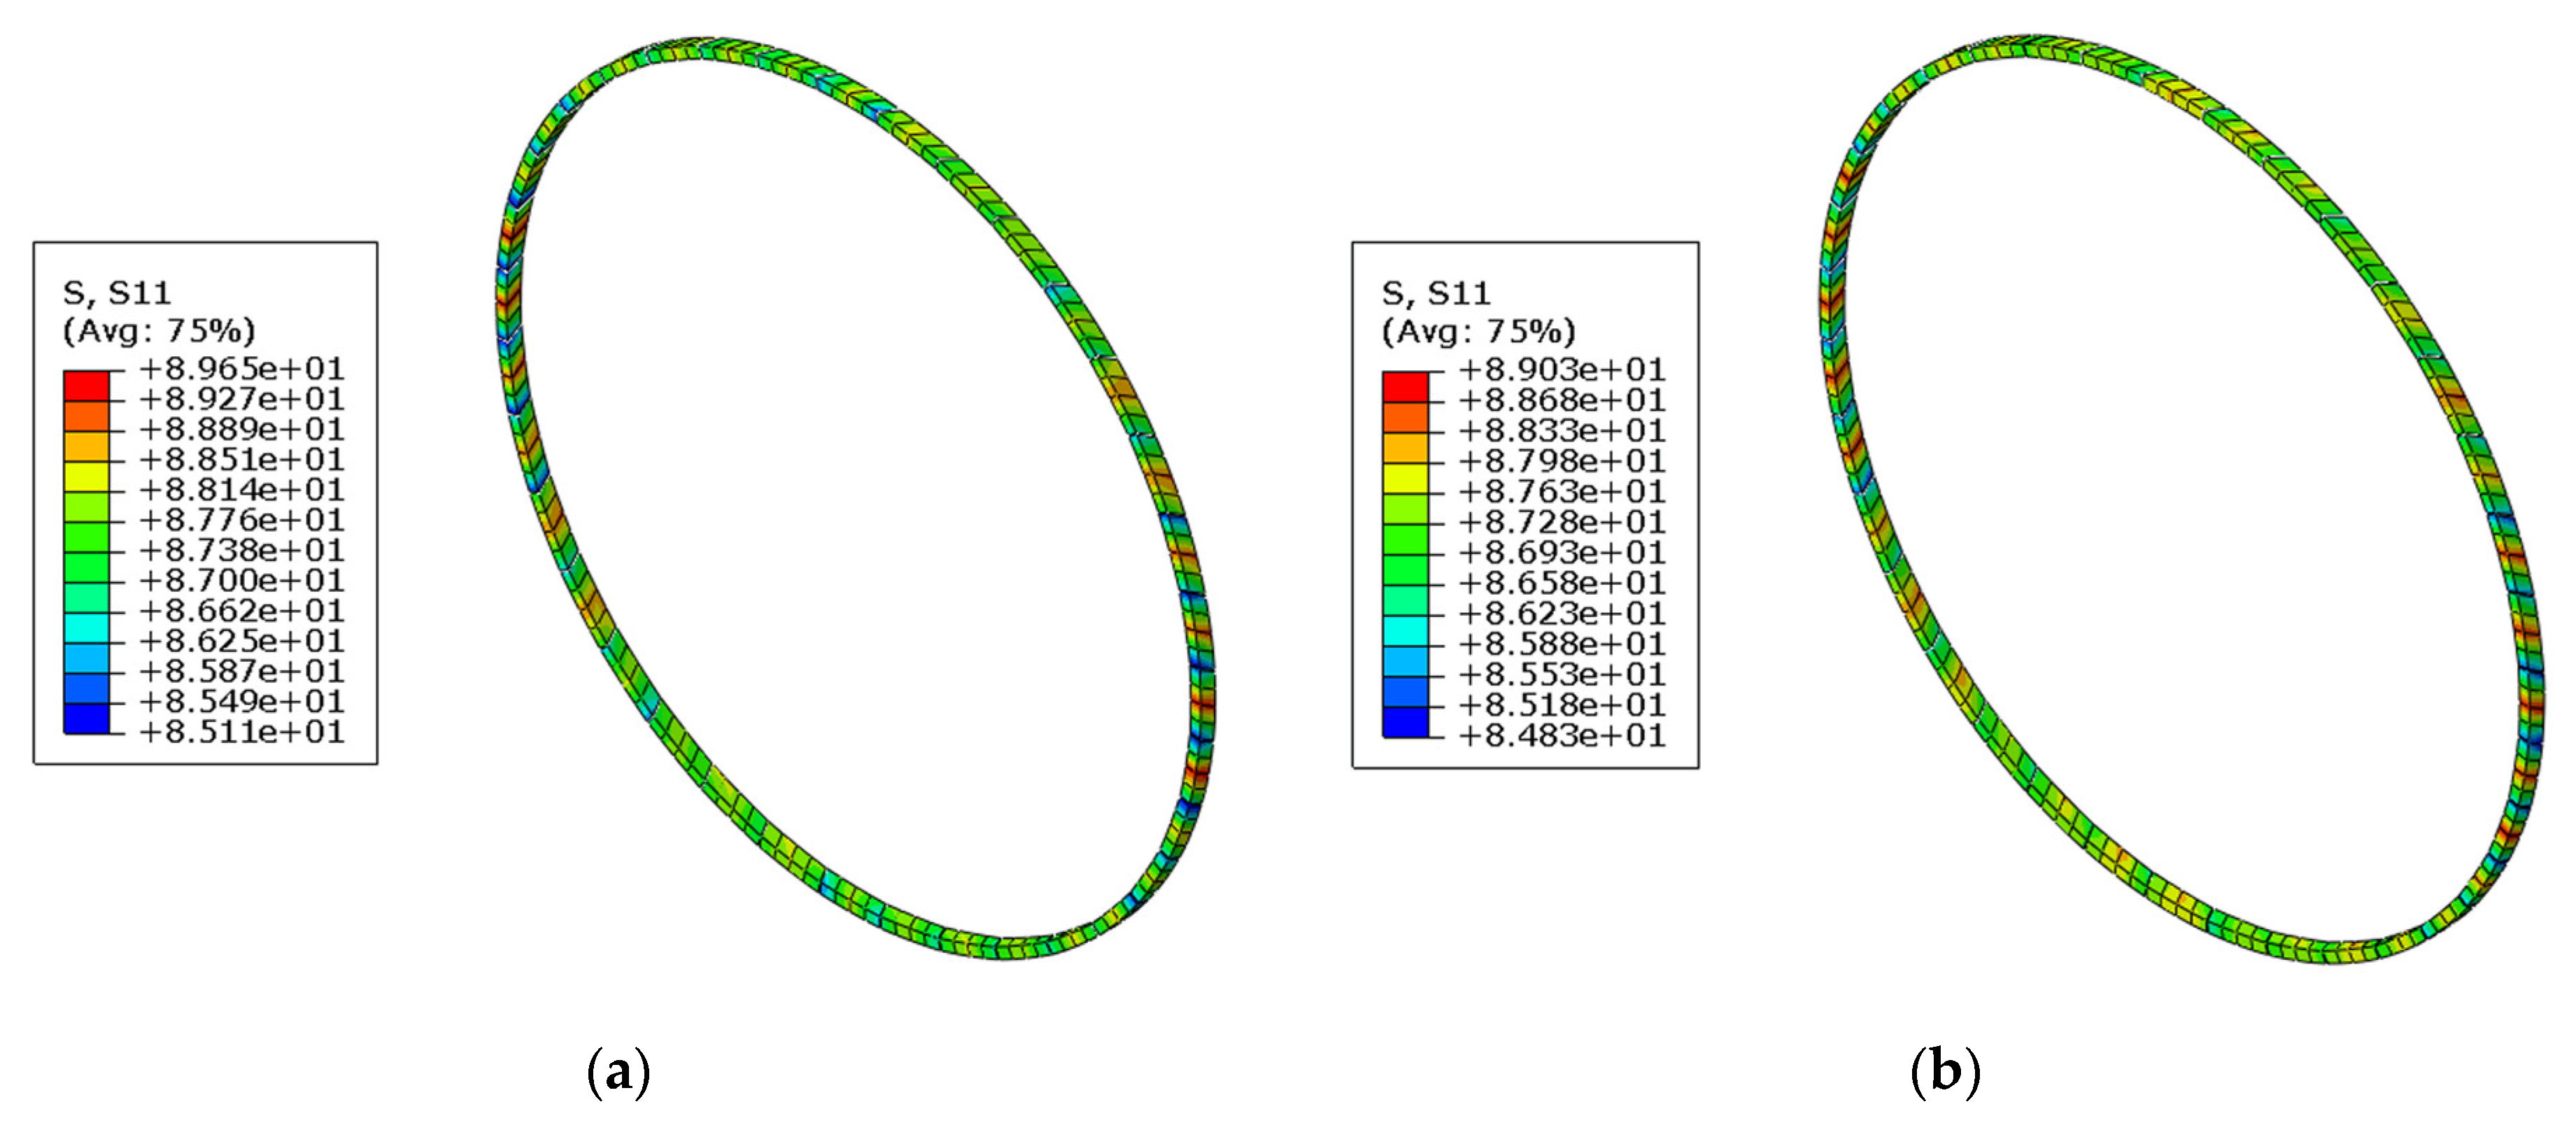
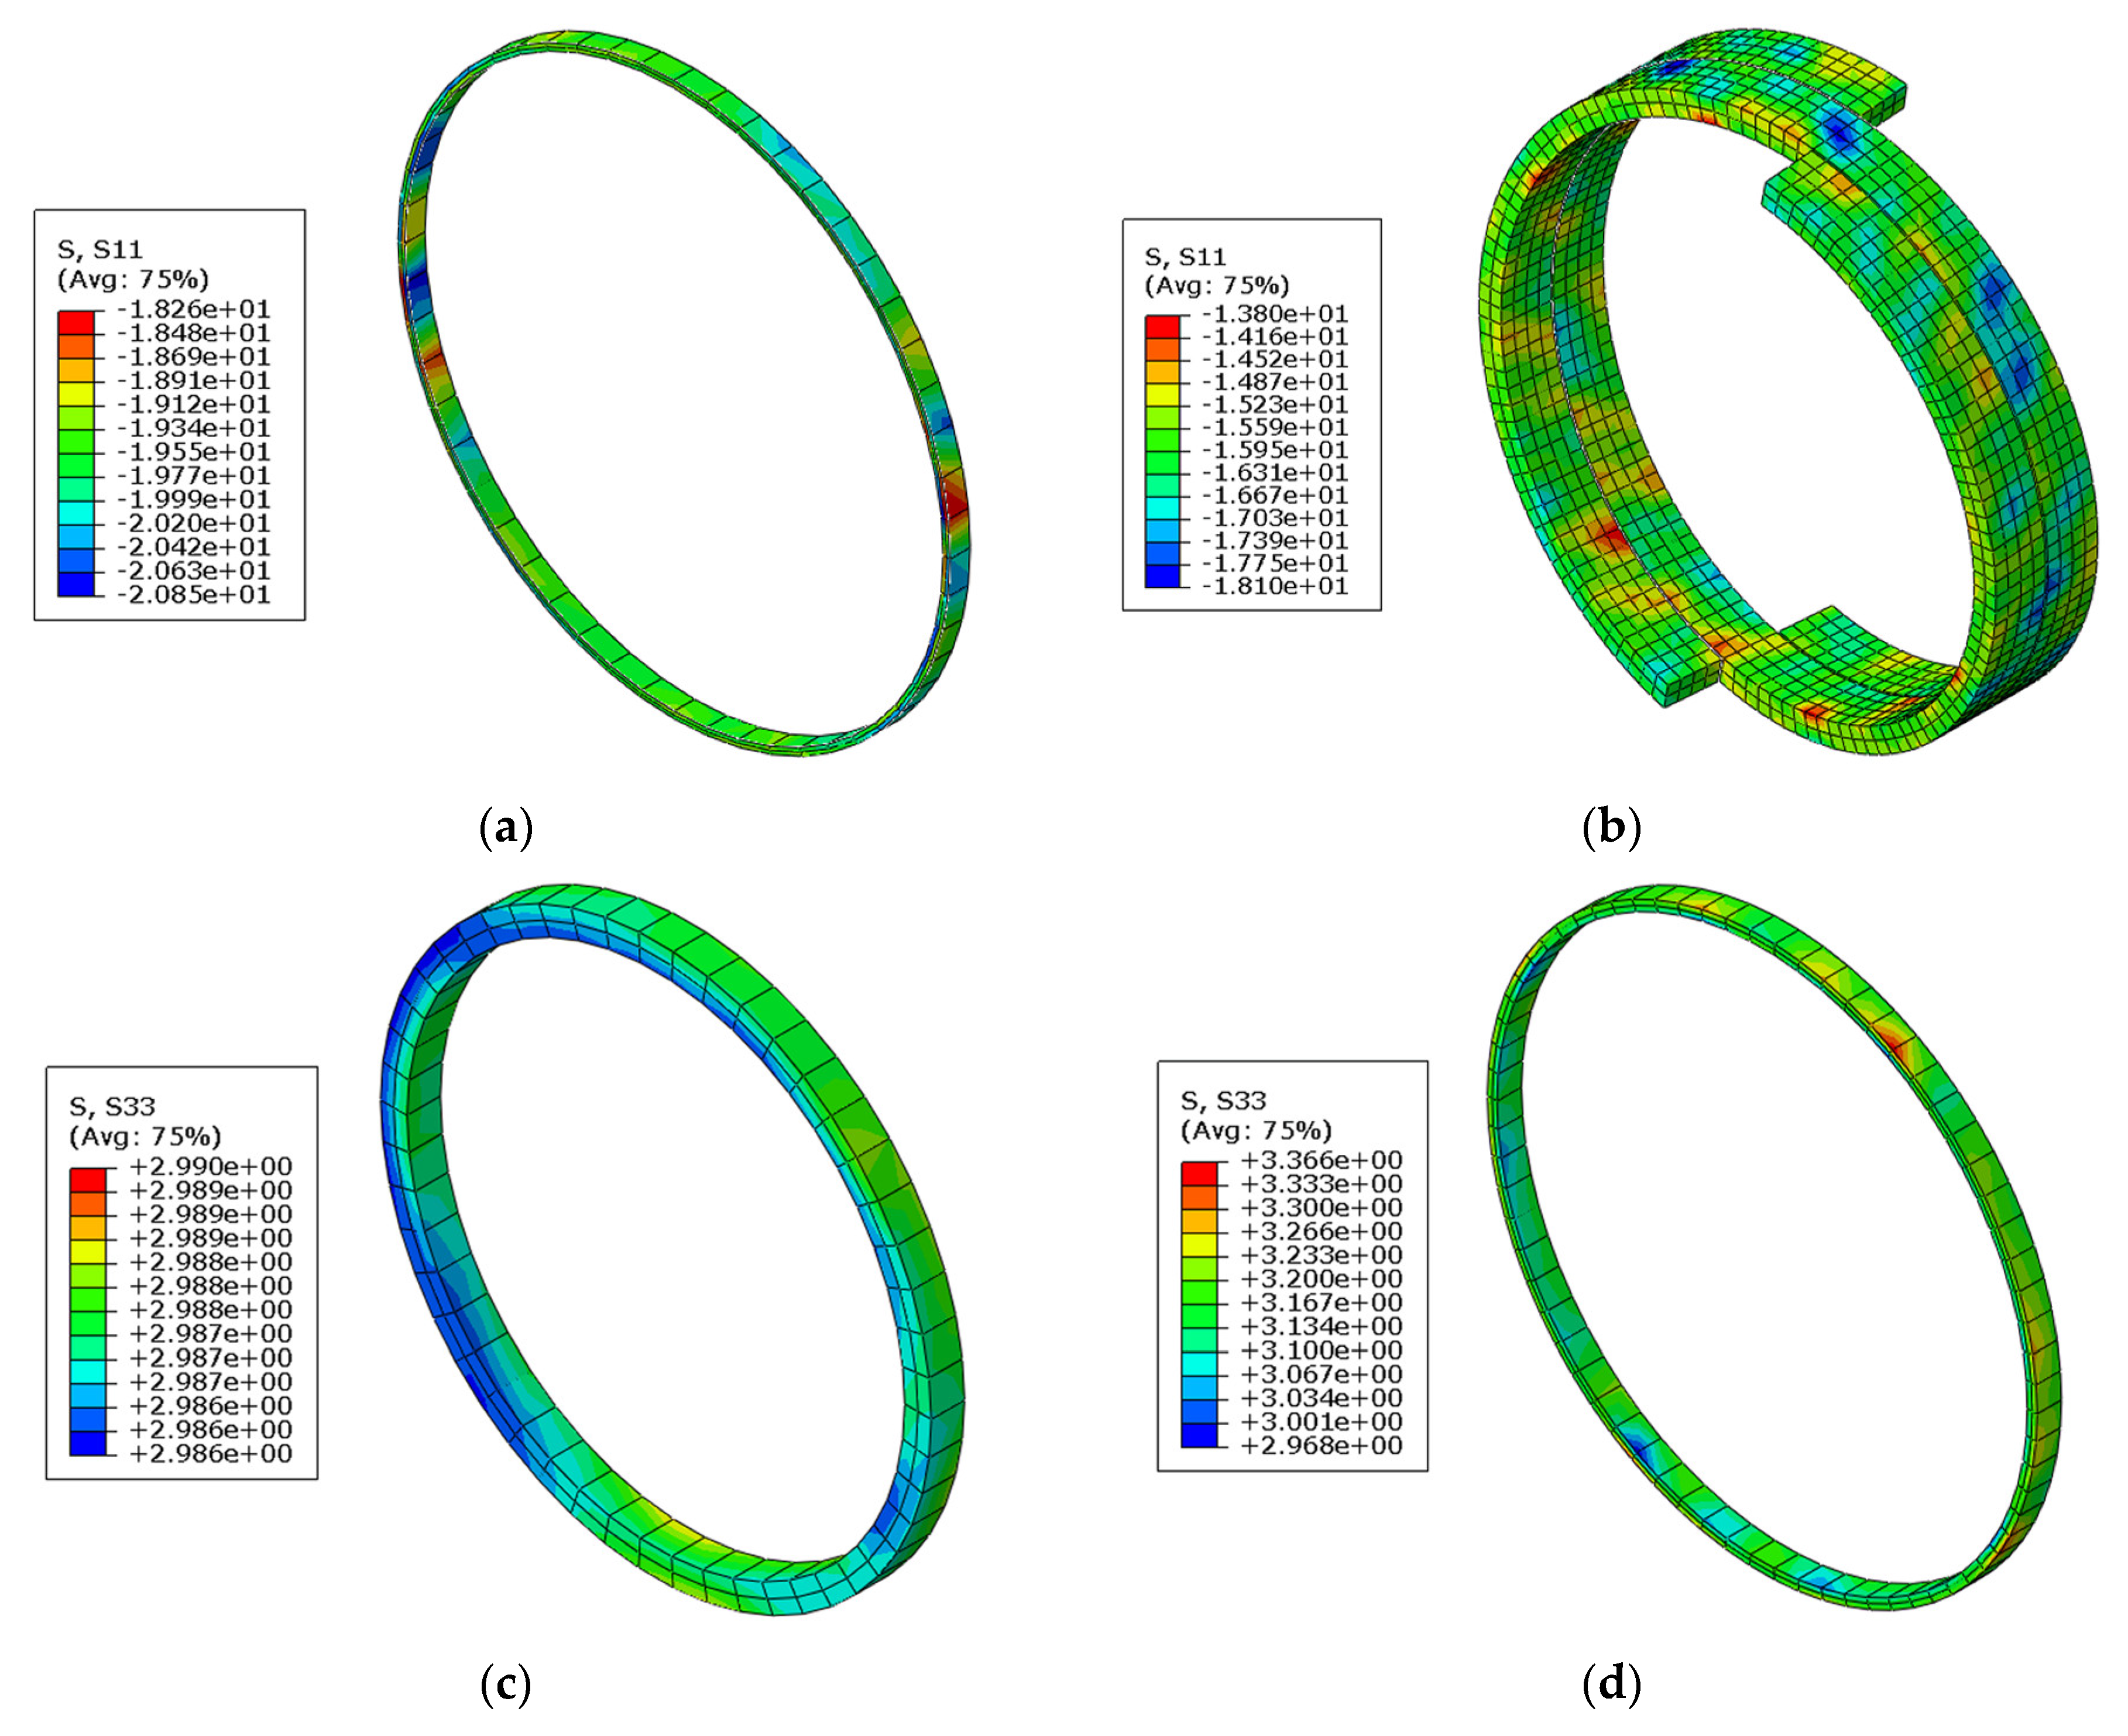
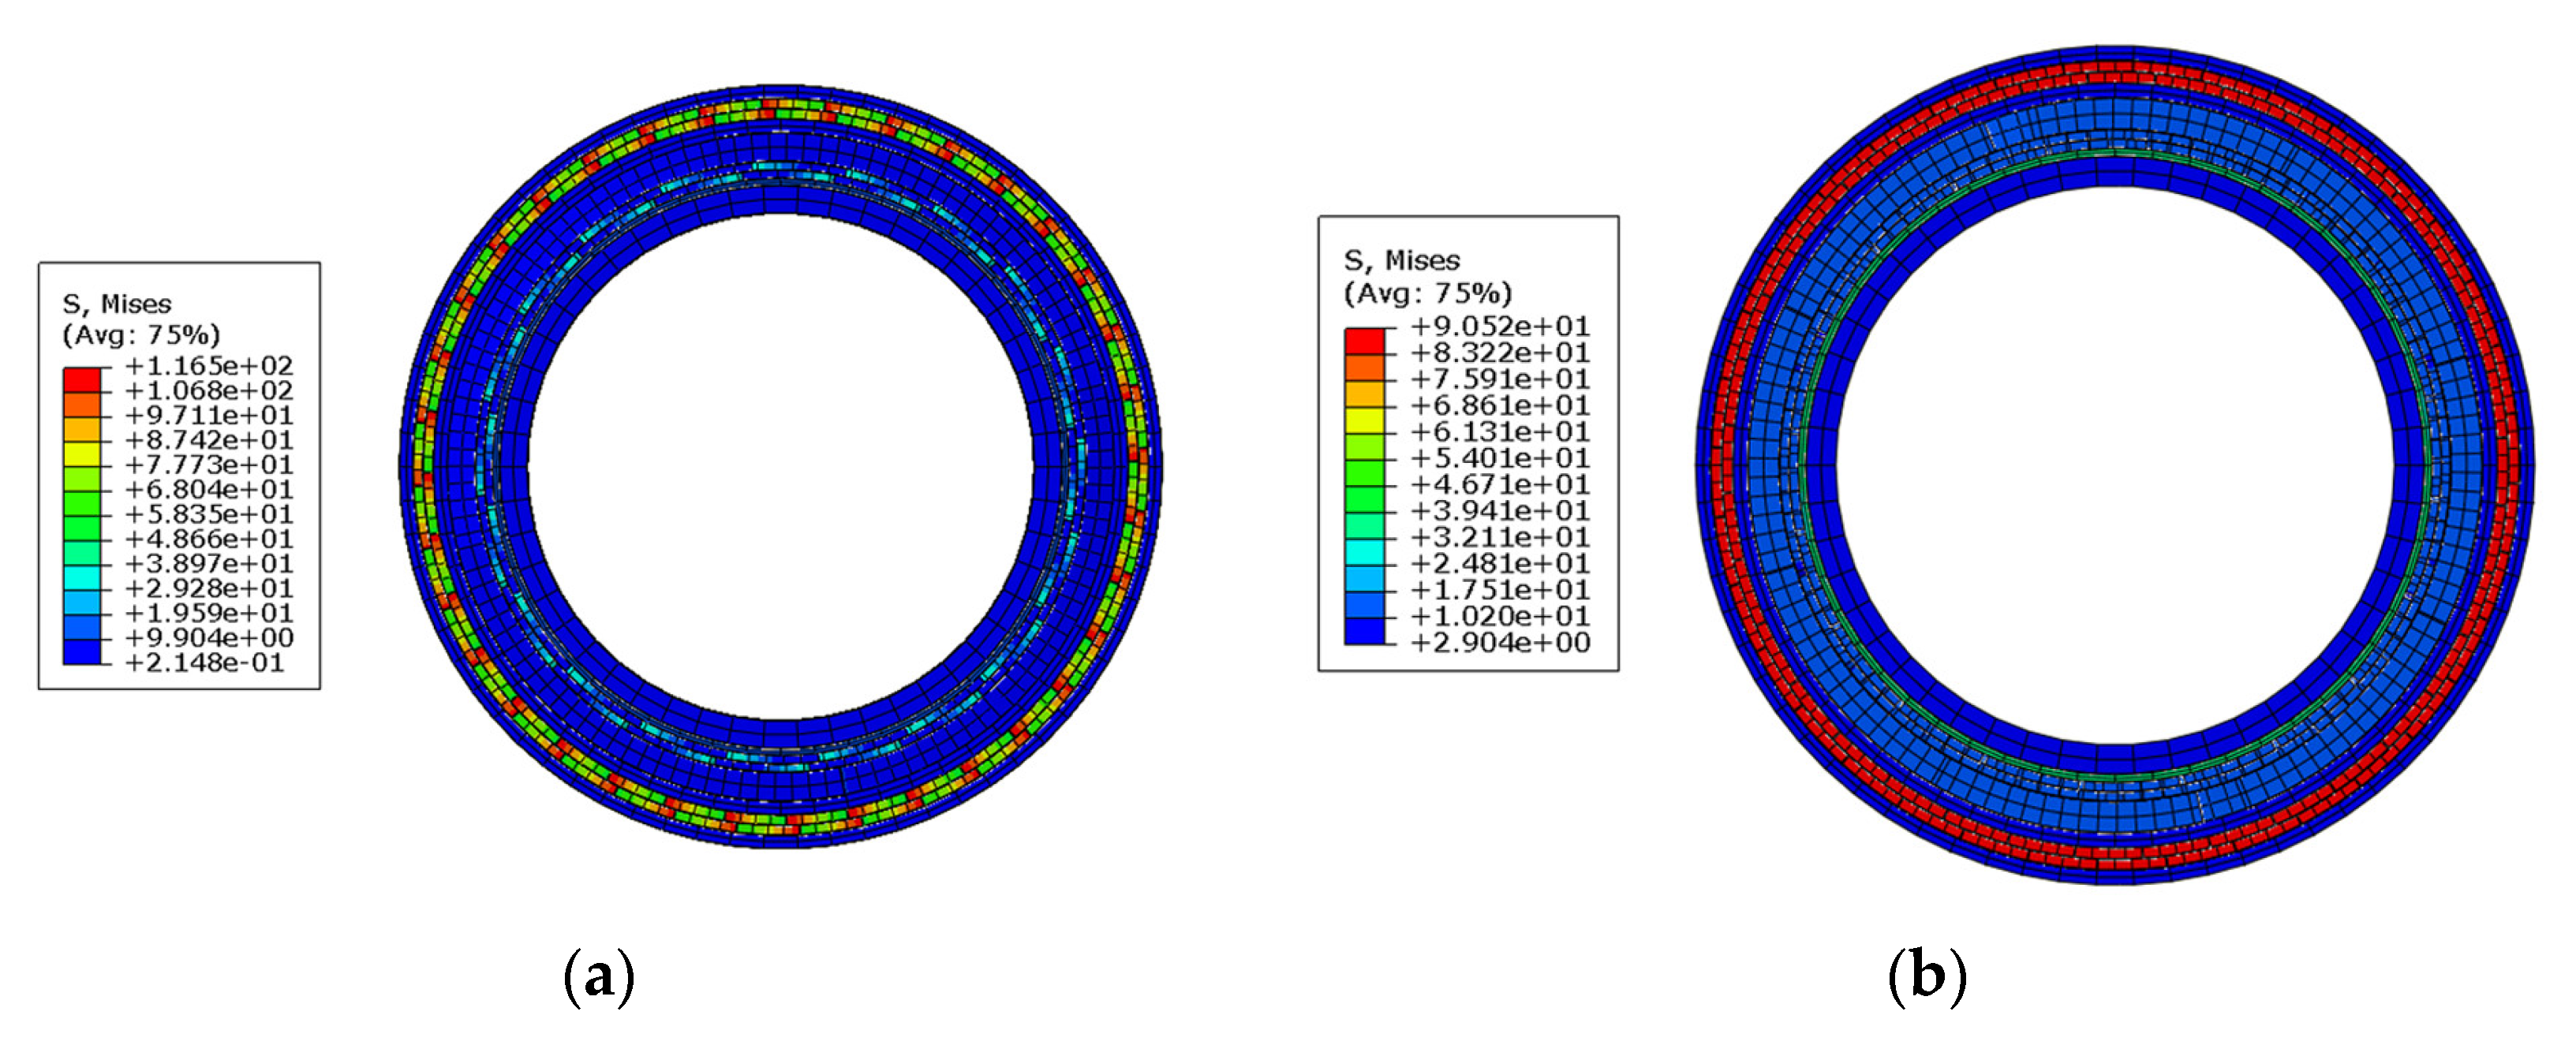
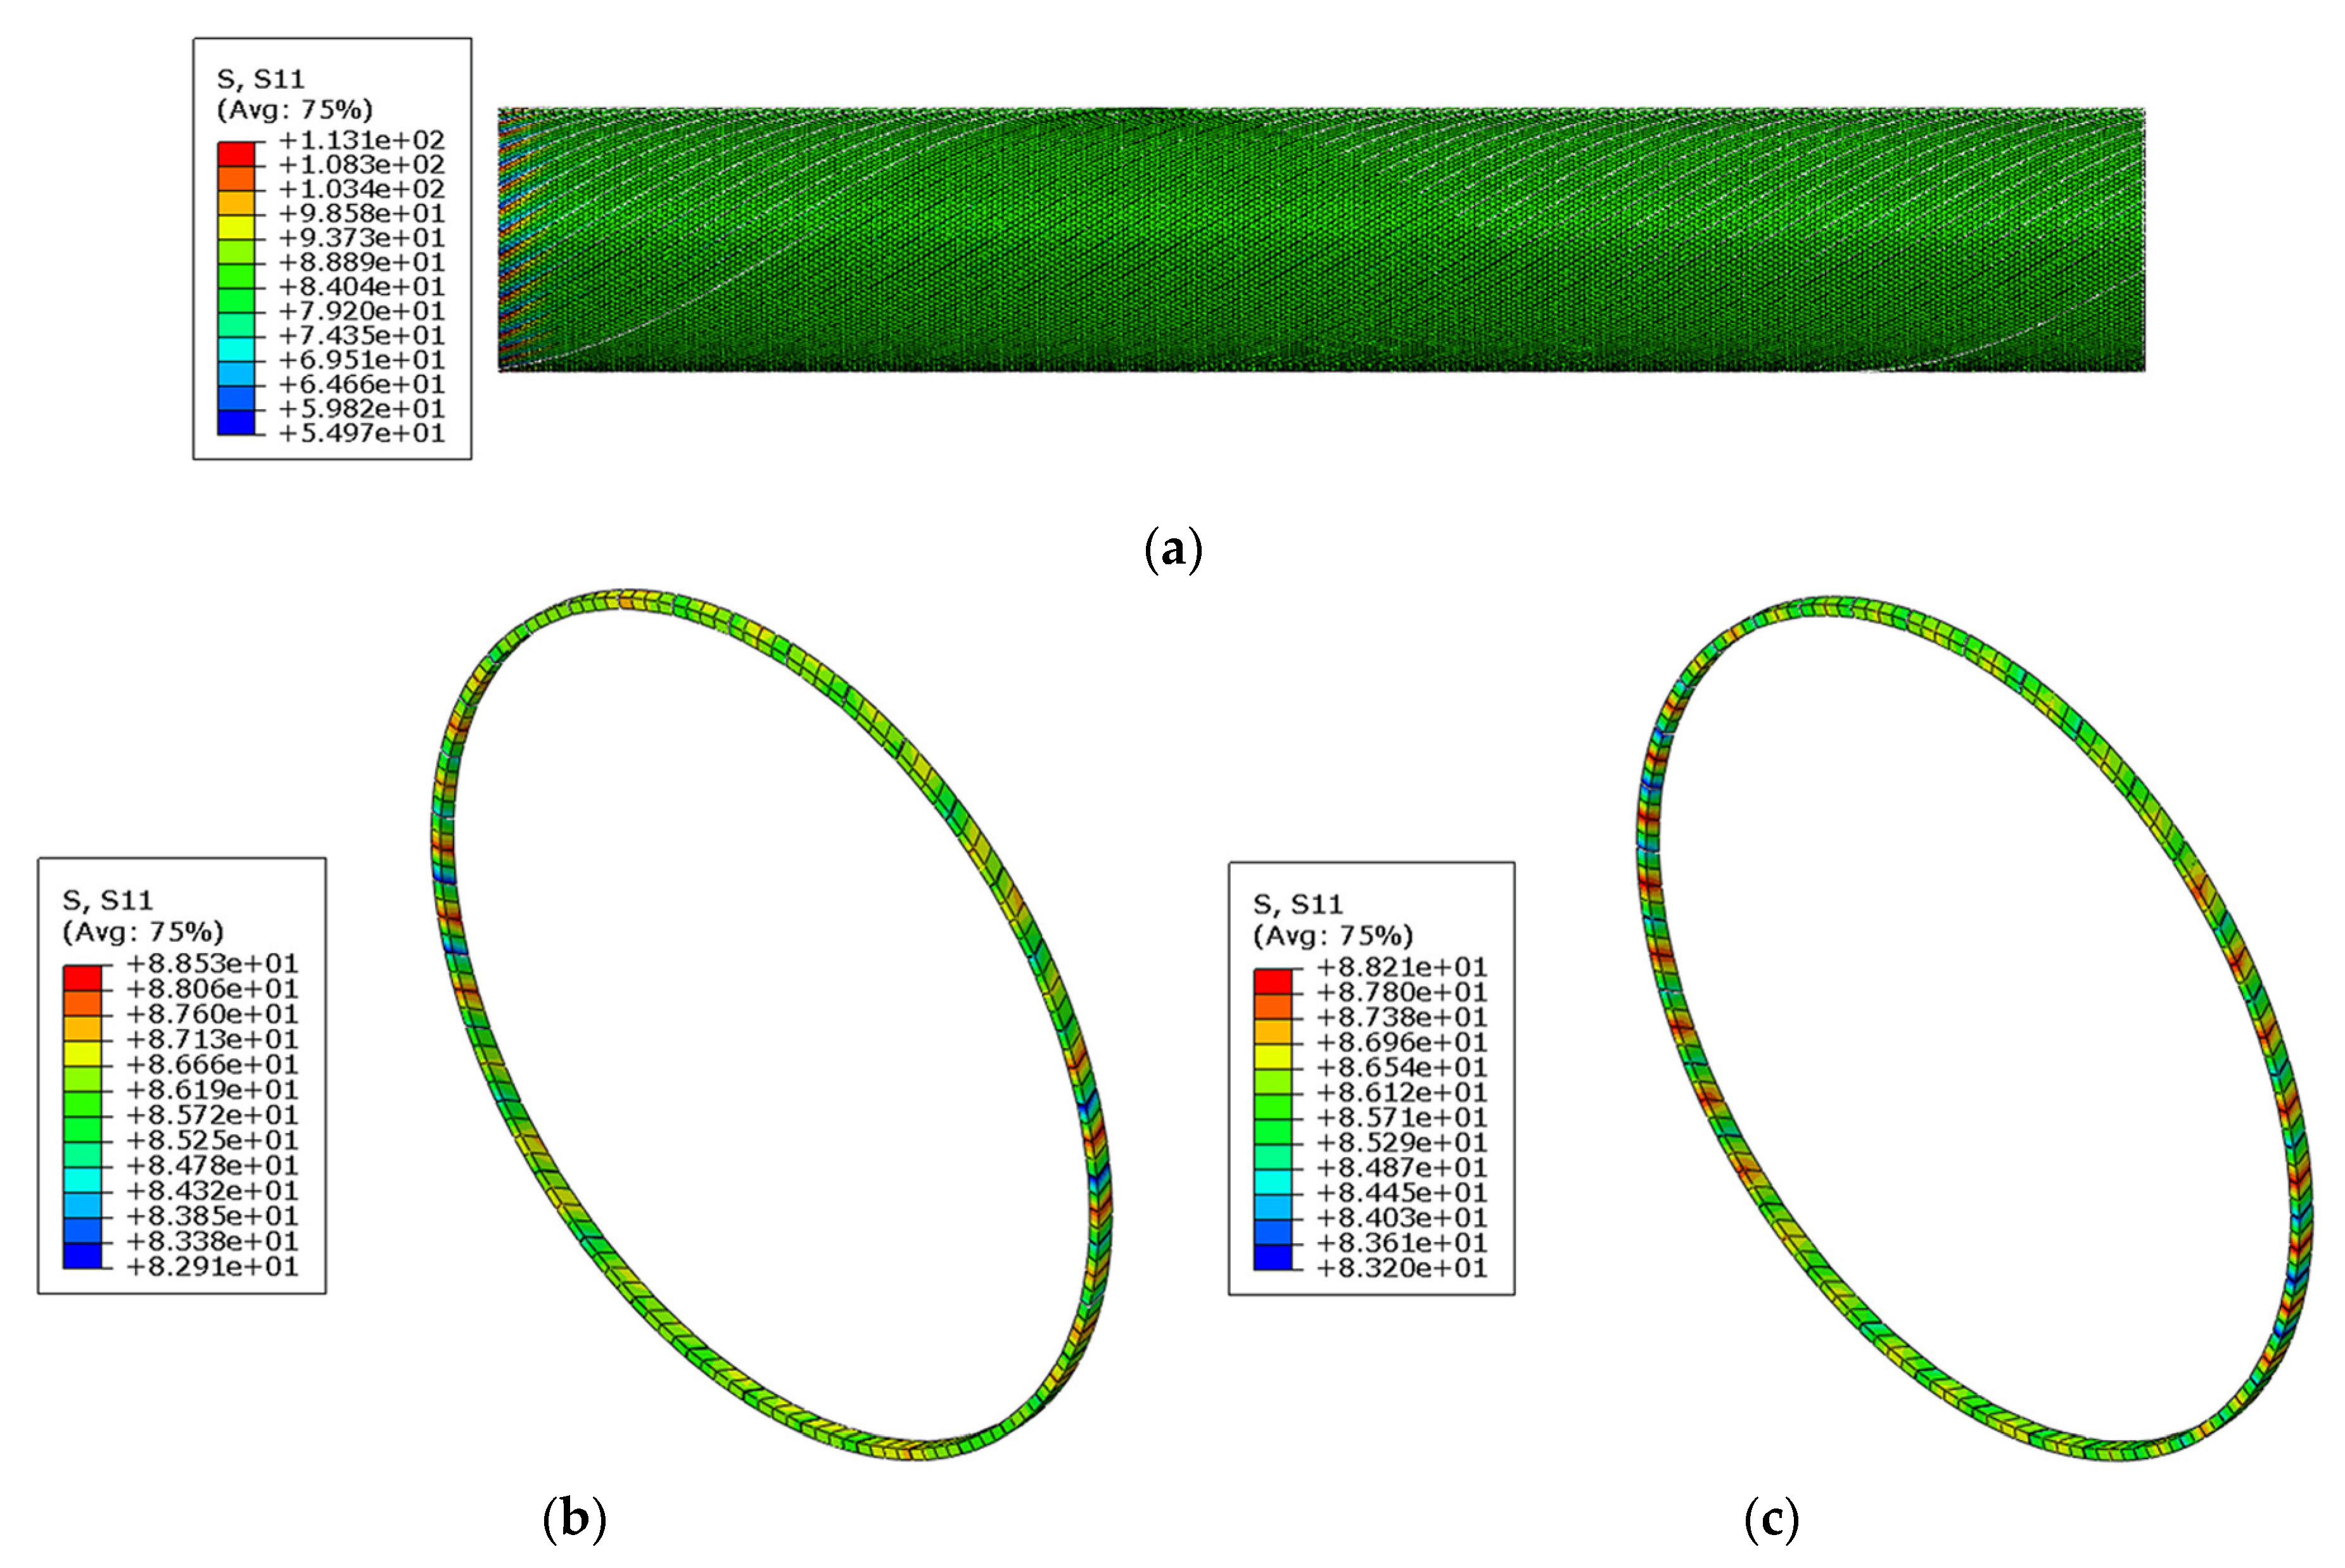
3.3. Distribution of Stress in Different Layers
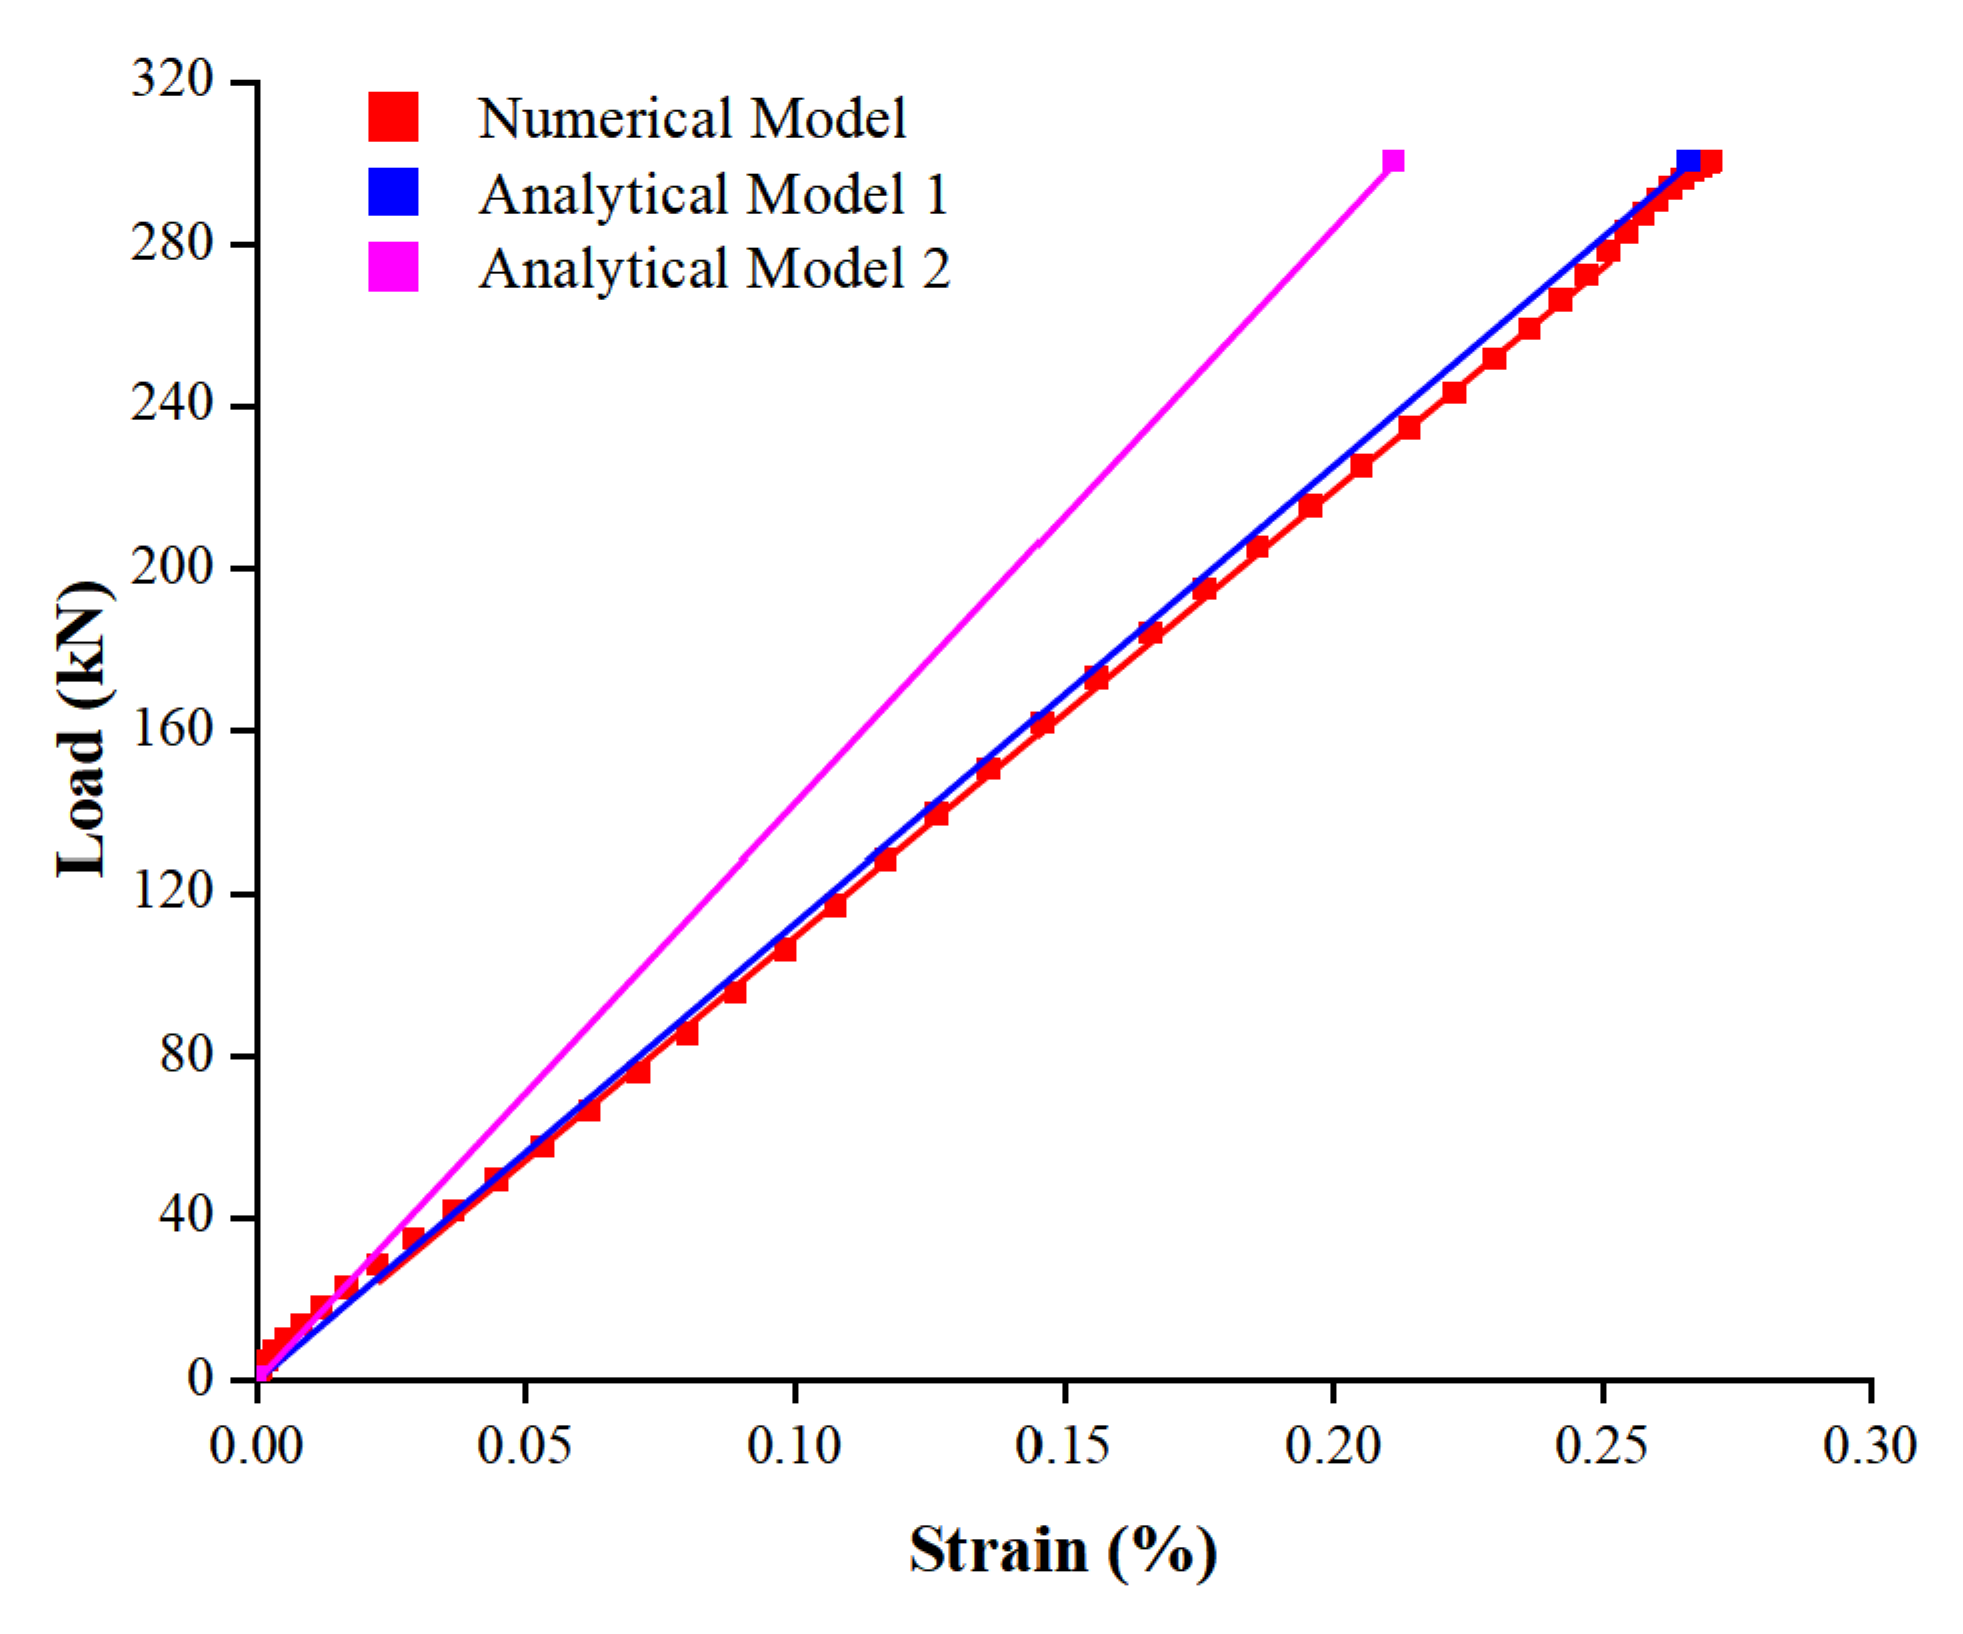
3.4. Axial Tensile Stiffness of the Pipe
4. Conclusions
- The winding angle significantly affected the axial load capacity of the spiral belts in the tensile reinforcement layers because the stiffness of GFRP is mainly provided by fibers. A smaller winding angle is more conducive to the axial load capacity.
- The errors between the results of the average fiber-direction strains of the outer tensile reinforcement layer in Sections S1 and S2 by the numerical model and test are insignificant, which indicates the high accuracy of the finite element model.
- The distribution of the fiber-direction stress in Layer L8 is relatively uniform along the axial and circumferential directions of the pipe, except for the regions near the end sections. The inner hoop and hoop reinforcement layers are subjected to compressive stress in the fiber direction, which indicates the radial compression effect of the pipe under an axial tensile load.
- The result of axial tensile stiffness calculated by the analytical model considering radial compression is very close to that obtained by the numerical model; thus, the accuracy of analytical model is proved.
Author Contributions
Funding
Institutional Review Board Statement
Informed Consent Statement
Data Availability Statement
Conflicts of Interest
References
- Do, A.T.; Lambert, A. Qualification of Unbonded Dynamic Flexible Riser with Carbon Fibre Composite Armours. In Proceedings of the Offshore Technology Conference, Houston, TX, USA, 30 April–3 May 2012. [Google Scholar]
- Bryant, M.; Bhat, S.; Chen, B. Nonmetallic Unbonded Flexible Pipes for Deep Water. In Proceedings of the 2007 International Oil Conference and Exhibition, Veracruz, Mexico, 27–30 June 2007. [Google Scholar]
- API. API SPEC 17J; Specification for Unbonded Flexible Pipe. API Publishing Services: Washington, DC, USA, 2014.
- API. API RP 17B; Recommend Practice for Flexible Pipe. API Publishing Services: Washington, DC, USA, 2014.
- De Oliveira, J.G.; Goto, Y.; Okamoto, T. Theoretical and Methodological Approaches to Flexible Pipe Design and Application. In Proceedings of the Offshore Technology Conference, Houston, TX, USA, 6–9 May 1985. [Google Scholar]
- Lu, Q.; Yue, Q.; Tang, M.; Zheng, J.; Yan, J. Reinforced Design of an Unbonded Flexible Flowline for Shallow Water. In Proceedings of the ASME 2010 29th International Conference on Ocean, Offshore and Arctic Engineering, Shanghai, China, 6–11 June 2010. [Google Scholar]
- Yue, Q.; Lu, Q.; Yan, J.; Zheng, J.; Palmer, A. Tension Behavior Prediction of Flexible Pipelines in Shallow Water. Ocean Eng. 2013, 58, 201–207. [Google Scholar] [CrossRef]
- Tang, M.; Yan, J.; Wang, Y.; Yue, Q. Tensile Stiffness Analysis on Ocean Dynamic Power Umbilical. Chin. Ocean Eng. 2014, 28, 259–270. [Google Scholar] [CrossRef]
- Wang, H.; Yang, Z.; Yan, J.; Wang, G.; Shi, D.; Zhou, B.; Li, Y. Prediction Method and Validation Study of Tensile Performance of Reinforced Armor Layer in Marine Flexible Pipe/Cables. J. Mar. Sci. Eng. 2022, 10, 642. [Google Scholar] [CrossRef]
- Bahtui, A.; Bahai, H.; Alfano, G. A Finite Element Analysis for Unbonded Flexible Risers under Axial Tension. In Proceedings of the ASME 27th International Conference on Offshore Mechanics and Arctic Engineering, Estoril, Portugal, 15–20 June 2008. [Google Scholar]
- Merino, H.E.M.; de Sousa, J.R.M.; Magluta, C.; Roitman, N. On the Coupled Extensional-Torsional Response of Flexible Pipes. In Proceedings of the ASME 2009 28th International Conference on Ocean, Offshore and Arctic Engineering, Honolulu, HA, USA, 31 May–5 June 2009. [Google Scholar]
- Ren, S.; Tang, W.; Guo, J. Behavior of Unbonded Flexible Risers Subject to Axial Tension. Chin. Ocean Eng. 2013, 28, 249–258. [Google Scholar] [CrossRef]
- Ramos, R.J.; Martins, C.A.; Pesce, C.P.; Roveri, F.E. A Case Study on the Axial-Torsional Behavior of Flexible Risers. In Proceedings of the ASME 27th International Conference on Offshore Mechanics and Arctic Engineering, Estoril, Portugal, 15–20 June 2008. [Google Scholar]
- Lopes, D.; Souza, I.; Falcao, G.; Clevelario, J.; Sheldrake, T. Analysis of Stress Levels and Indication of Ruptures of Flexible Pipes Tensile Armor Wires during a Fatigue Dynamic Tension to Tension Test. In Proceedings of the ASME 2012 31st International Conference on Ocean, Offshore and Arctic Engineering, Rio de Janeiro, Brazil, 1–6 July 2012. [Google Scholar]
- Bai, Y.; Liu, T.; Ruan, W.; Chen, W. Mechanical Behavior of Metallic Strip Flexible Pipe Subjected to Tension. Comp. Struct 2017, 170, 1–10. [Google Scholar] [CrossRef]
- Chen, W.; Xiong, H.; Bai, Y. Failure Behavior Analysis of Steel Strip—Reinforced Flexible Pipe under Combined Tension and Internal Pressure. J. Therm. Comp. Mat. 2020, 33, 727–753. [Google Scholar] [CrossRef]
- Liu, J.; Vaz, M.; Chen, R.; Duan, M.; Hernandez, I. Axial Mechanical Experiments of Unbonded Flexible Pipes. Petr. Sci. 2020, 17, 1400–1410. [Google Scholar] [CrossRef]
- Dong, L.; Zhang, Q.; Huang, Y.; Liu, G.; Li, Z. End Fitting Effect on Stress Evaluation of Tensile Armor Tendons in Unbonded Flexible Pipes Under Axial Tension. J. Offsh Mech. Arct. Eng. 2018, 140, 051701. [Google Scholar] [CrossRef]
- Dong, L.; Huang, Y.; Dong, G.; Zhang, Q.; Liu, G. The Tensile Armour Behaviour of Unbonded Flexible Pipes Close to End Fittings under Axial Tension. Ship Offsh Struc. 2016, 11, 445–460. [Google Scholar] [CrossRef]
- Nassiraei, H.; Rezadoost, P. Stress Concentration Factors in Tubular T/Y-Joints Strengthened with FRP Subjected to Compressive Load in Offshore Structures. Int. J. Fat. 2020, 140, 105719. [Google Scholar] [CrossRef]
- Zhu, X.; Lei, Q.; Meng, Y.; Cui, X. Analysis of Tensile Response of Flexible Pipe with Ovalization under Hydrostatic Pressure. Appl. Ocean Res. 2021, 108, 102451. [Google Scholar] [CrossRef]
- De Sousa, J.R.M.; Campello, G.C.; Kwietniewski, C.E.F.; Ellwanger, G.B.; Strohaecker, T.R. Structural Response of a Flexible Pipe with Damaged Tensile Armor Wires under Pure Tension. Mar. Struct. 2014, 39, 1–38. [Google Scholar] [CrossRef]
- Zhu, X.; Lei, Q.; Meng, Y.; Cui, X. Tensile Response of a Flexible Pipe with an Incomplete Tensile Armor Layer. J. Offsh Mech. Arct. Eng. 2021, 143, 051702. [Google Scholar] [CrossRef]
- Goto, Y.; Okamoto, T.; Araki, M.; Fuku, T. Analytical Study of the Mechanical Strength of Flexible Pipes. J. Offsh Mech. Arct. Eng. 1987, 109, 249–253. [Google Scholar] [CrossRef]
- Yim, K.-H.; Jang, B.-S. A Comparative Study for the Prediction of Ultimate Tensile Strength in Flexible Pipes. In Proceedings of the Offshore Technology Conference Asia, Kuala Lumpur, Malaysia, 22–25 March 2016. [Google Scholar]
- Cornacchia, F.; Liu, T.; Bai, Y.; Fantuzzi, N. Tensile Strength of the Unbonded Flexible Pipes. Comps. Struct. 2019, 218, 142–151. [Google Scholar] [CrossRef]
- Xu, Y.; Bai, Y.; Fang, P.; Yuan, S.; Liu, C. Structural Analysis of Fibreglass Reinforced Bonded Flexible Pipe Subjected to Tension. Ships Offshore Struct. 2019, 14, 777–787. [Google Scholar] [CrossRef]
- Fang, P.; Xu, Y.; Gao, Y.; Ali, L.; Bai, Y. Mechanical Responses of a Fiberglass Flexible Pipe Subject to Tension & Internal Pressure. Thin-Walled Struct. 2022, 181, 110107. [Google Scholar]
- Zhou, C.; Huang, Z.; Kang, Y.; Zhang, D.; Ye, N.; Sævik, S. The Study of a New Concept of Flexible Pipe with Carbon Fiber/Epoxy Reinforced Inner Sheath. In Proceedings of the ASME 2017 36th International Conference on Ocean, Offshore and Arctic Engineering, Trondheim, Norway, 25–30 June 2017. [Google Scholar]
- Liu, Q.; Xue, H.; Tang, W.; Yuan, Y. Theoretical and Numerical Methods to Predict the Behaviour of Unbonded Flexible Riser with Composite Armour Layers Subjected to Axial Tension. Ocean Eng. 2020, 199, 107038. [Google Scholar] [CrossRef]
- Smith, C.B. Some New Types of Orthotropic Plates Laminated of Orthotropic Material. J. Appl. Mech. 1953, 20, 286–288. [Google Scholar] [CrossRef]
- Sun, Z.; Huang, W.; Lu, H.; Yan, J.; Yin, Y.; Bu, Y. Study on the Mechanical Characteristics of a Fibre Reinforced Flexible Pipe under Radial Compression Loads. Front. Mater. 2023, 10, 1118046. [Google Scholar] [CrossRef]


| Notation | Description |
|---|---|
| 3D | three-dimensional |
| GFRP | glass fiber-reinforced plastic |
| PE | polyethylene |
| C3D8R | eight-node brick element with reduced integration |
| ALLIE | internal energy |
| ALLSE | elastic strain energy |
| ALLAE | artificial strain energy |
| ALLKE | kinetic energy |
| longitudinal tensile modulus | |
| transverse tensile modulus | |
| in-plane shear modulus | |
| main Poisson ratio | |
| density |
| Layer | Thickness (mm) | Winding Angle (°) | Number of Belts | Materials |
|---|---|---|---|---|
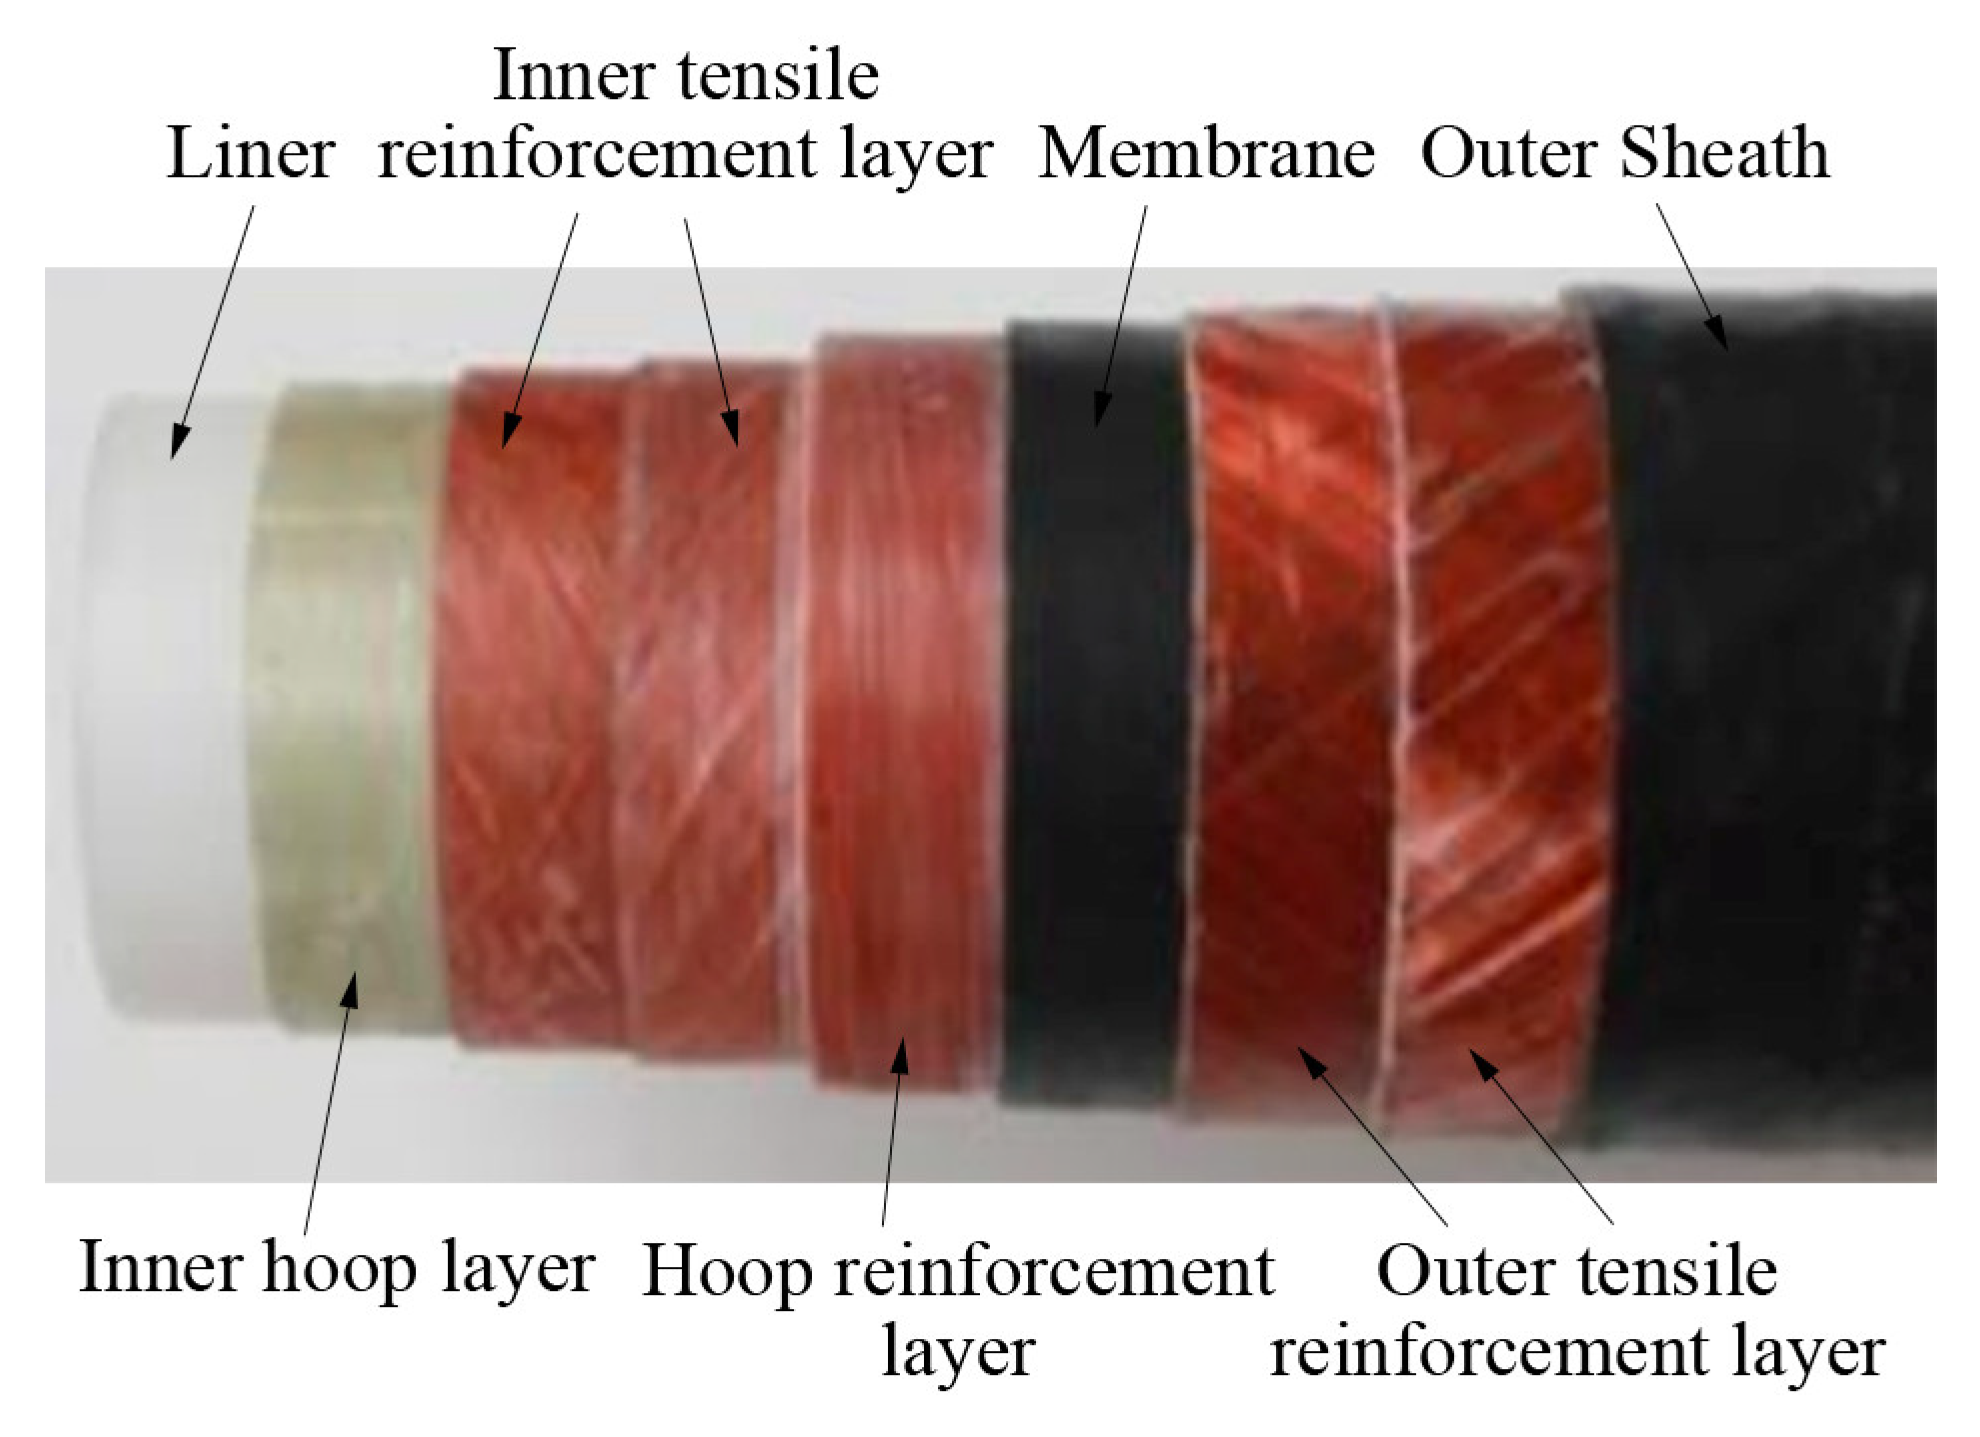
| Liner (L1) | 8 | -- | -- | PE |
| Inner hoop layer (L2) | 2 | ±80 | -- | GFRP1 |
| Inner tensile reinforcement layer 1 (L3) | 2.5 | 54 | 20 | GFRP2 |
| Inner tensile reinforcement layer 2 (L4) | 2.5 | −54 | 20 | GFRP2 |
| Hoop reinforcement layer (L5) | 8.5 | 86 | 2 | GFRP2 |
| Membrane (L6) | 4 | -- | -- | PE |
| Outer tensile reinforcement layer 1 (L7) | 3 | 30 | 36 | GFRP2 |
| Outer tensile reinforcement layer 2 (L8) | 3 | −30 | 36 | GFRP2 |
| Outer sheath (L9) | 4 | -- | -- | PE |
| Parameters | GFRP1 | GFRP2 | PE |
|---|---|---|---|
| (GPa) | 33.70 | 49.6 | 1.1 |
| (GPa) | 7.35 | 1.46 | -- |
| (GPa) | 2.50 | 2.7 | -- |
| 0.3 | 0.27 | 0.45 | |
| (g/cm3) | 2.1 | 2.1 | 0.95 |
| Layer | L1 | L2 | L3 | L4 | L5 | L6 | L7 | L8 | L9 | Total |
|---|---|---|---|---|---|---|---|---|---|---|
| Strain energy (105 mJ) | 0.43 | 0.91 | 0.07 | 0.06 | 0.37 | 0.37 | 4.09 | 4.06 | 0.31 | 10.67 |
| Contribution ratio (%) | 4.03 | 8.51 | 0.64 | 0.55 | 3.50 | 3.45 | 38.34 | 38.08 | 2.87 | 100 |
| Sections | Errors (%) | ||
|---|---|---|---|
| S1 | 6.0157 | 6.1233 | 1.8 |
| S2 | 5.9798 | 5.7496 | 4.0 |
| Models | Errors (%) | |
|---|---|---|
| Numerical | 1.0985 | -- |
| Analytical 1 | 1.1262 | 2.5 |
| Analytical 2 | 1.4192 | 29.2 |
Disclaimer/Publisher’s Note: The statements, opinions and data contained in all publications are solely those of the individual author(s) and contributor(s) and not of MDPI and/or the editor(s). MDPI and/or the editor(s) disclaim responsibility for any injury to people or property resulting from any ideas, methods, instructions or products referred to in the content. |
© 2023 by the authors. Licensee MDPI, Basel, Switzerland. This article is an open access article distributed under the terms and conditions of the Creative Commons Attribution (CC BY) license (https://creativecommons.org/licenses/by/4.0/).
Share and Cite
Sun, Z.; Huang, W.; Lu, H.; Bu, Y.; Yin, Y.; Wang, S.; Fan, Y. Mechanical Characteristics of Fiber-Reinforced Flexible Pipe Subjected to Axial Tensile Load. J. Mar. Sci. Eng. 2023, 11, 586. https://doi.org/10.3390/jmse11030586
Sun Z, Huang W, Lu H, Bu Y, Yin Y, Wang S, Fan Y. Mechanical Characteristics of Fiber-Reinforced Flexible Pipe Subjected to Axial Tensile Load. Journal of Marine Science and Engineering. 2023; 11(3):586. https://doi.org/10.3390/jmse11030586
Chicago/Turabian StyleSun, Zhenwen, Weiping Huang, Hailong Lu, Yufeng Bu, Yuanchao Yin, Shichao Wang, and Yimeng Fan. 2023. "Mechanical Characteristics of Fiber-Reinforced Flexible Pipe Subjected to Axial Tensile Load" Journal of Marine Science and Engineering 11, no. 3: 586. https://doi.org/10.3390/jmse11030586
APA StyleSun, Z., Huang, W., Lu, H., Bu, Y., Yin, Y., Wang, S., & Fan, Y. (2023). Mechanical Characteristics of Fiber-Reinforced Flexible Pipe Subjected to Axial Tensile Load. Journal of Marine Science and Engineering, 11(3), 586. https://doi.org/10.3390/jmse11030586