
Numerical Study on Flexible Pipe End Fitting Progressive Failure Behavior Based on Cohesive Zone Model


Abstract
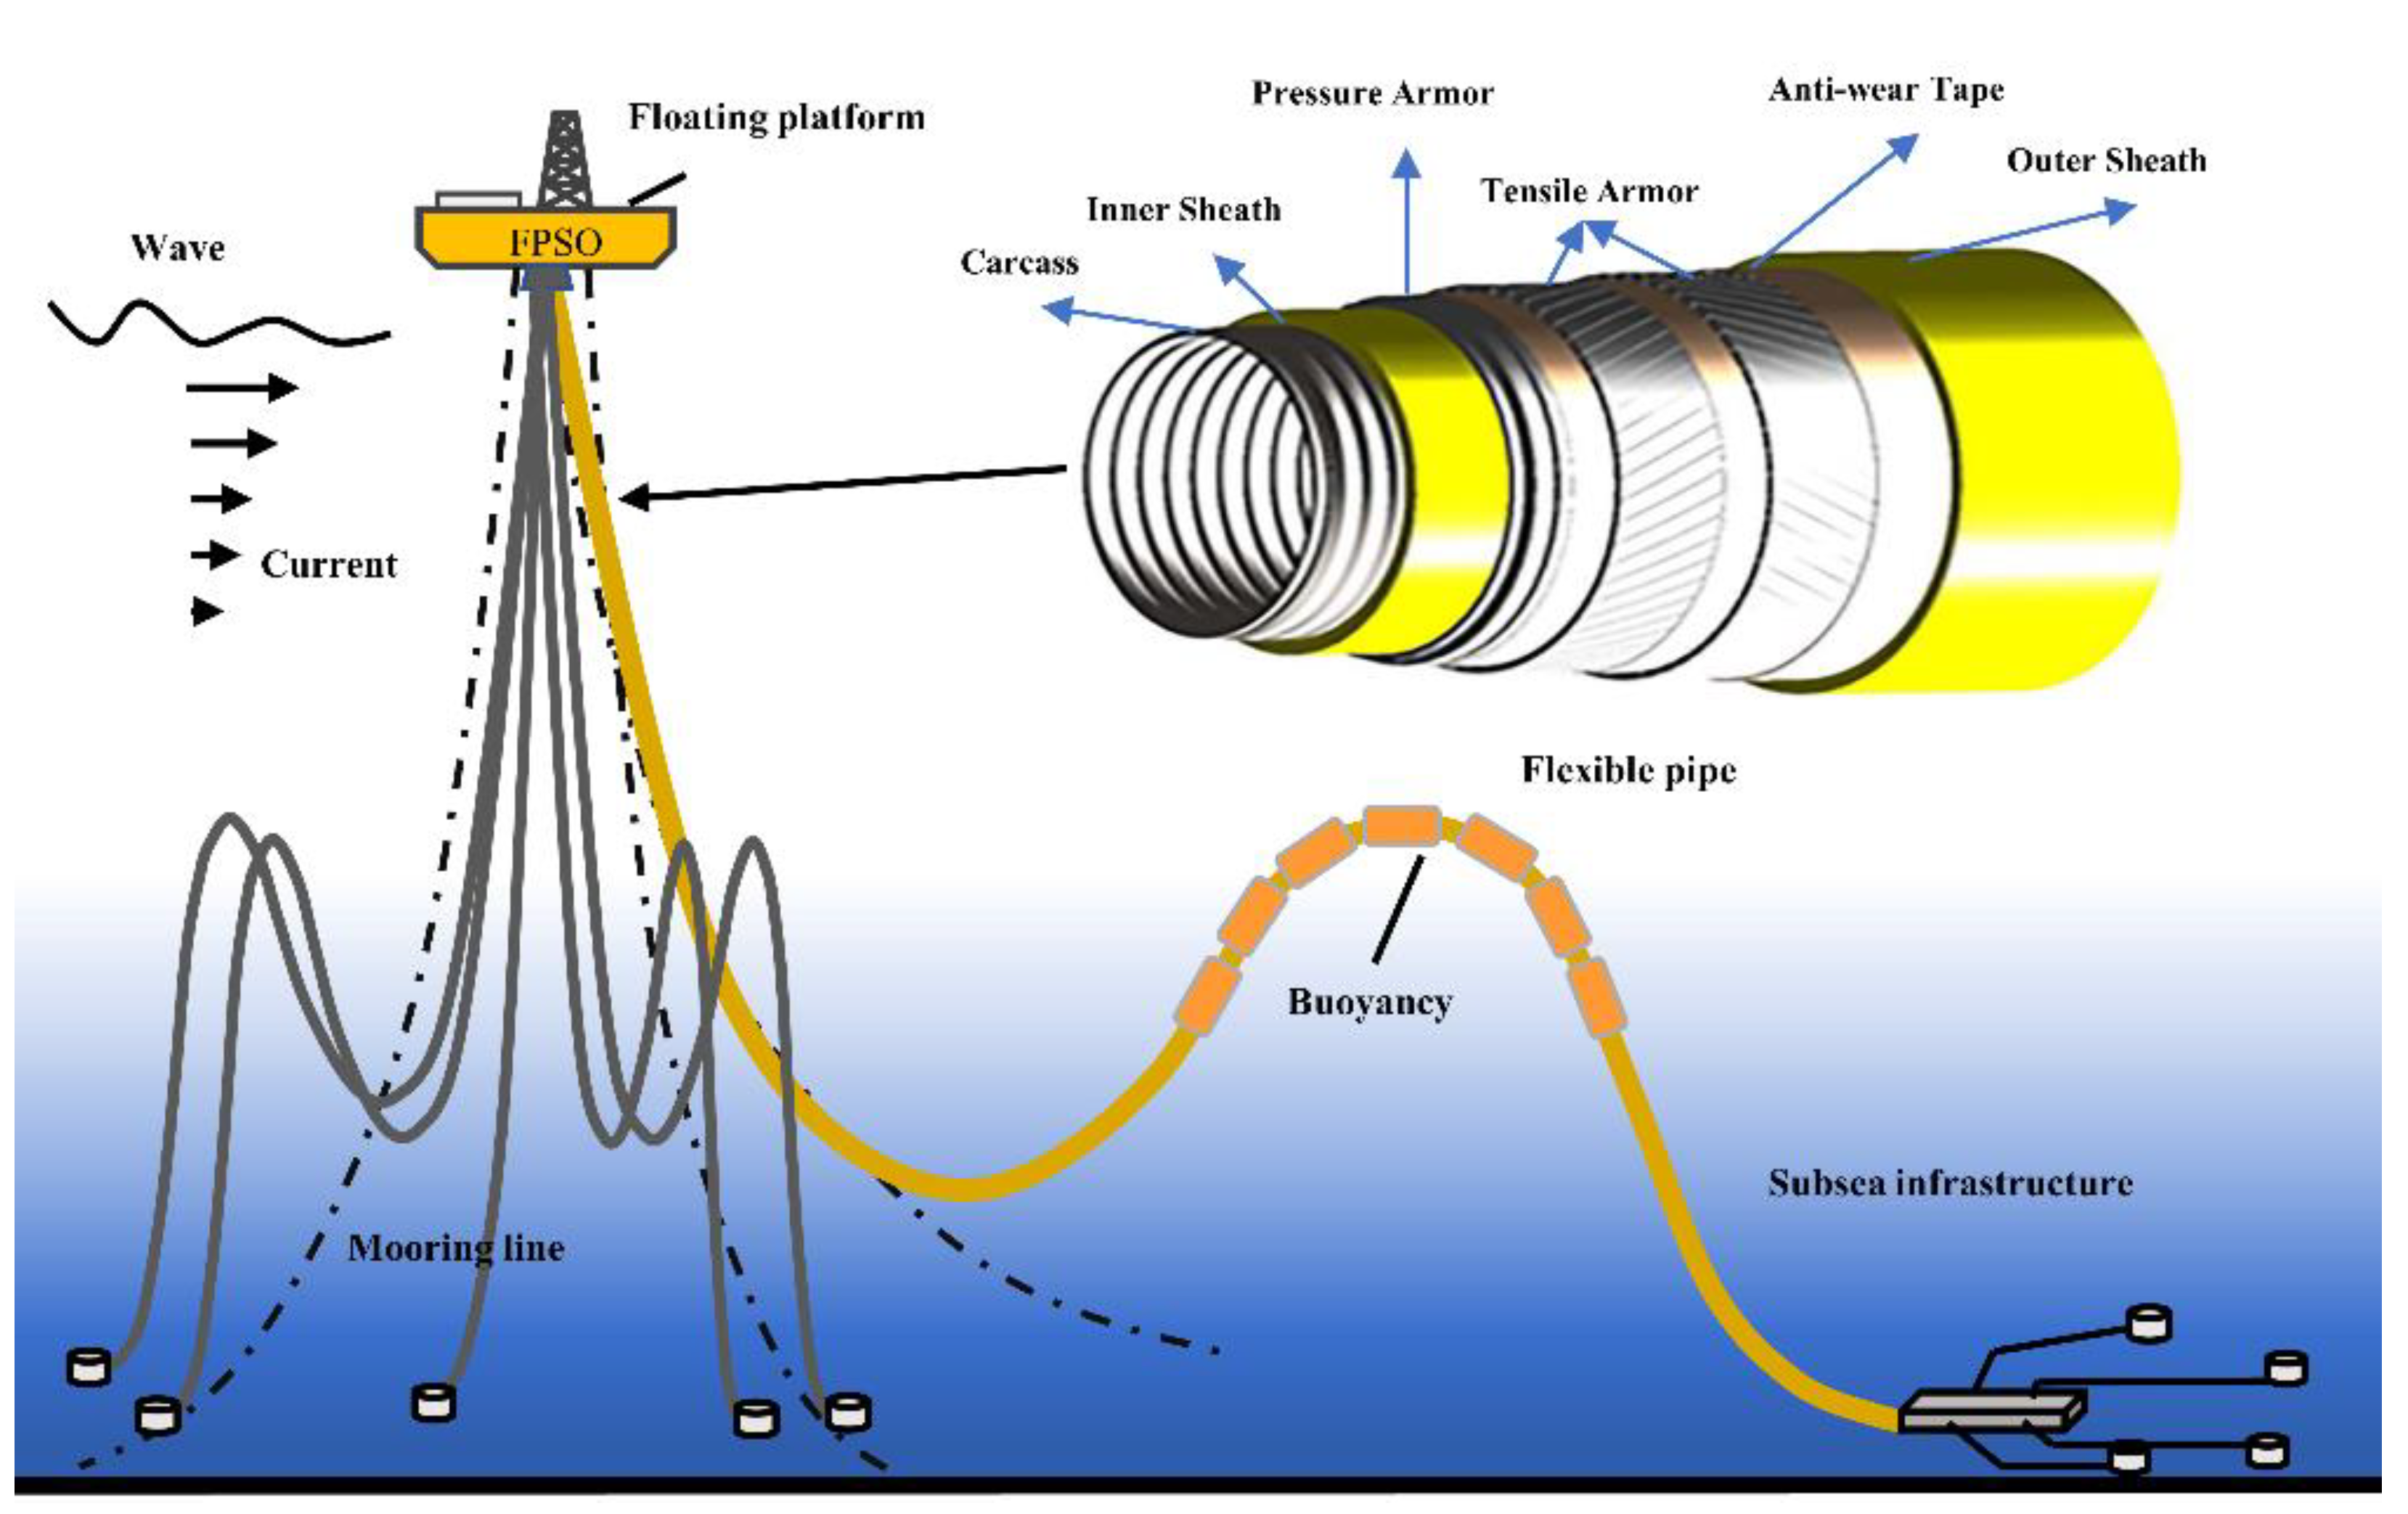
:1. Introduction
2. Materials and Methods
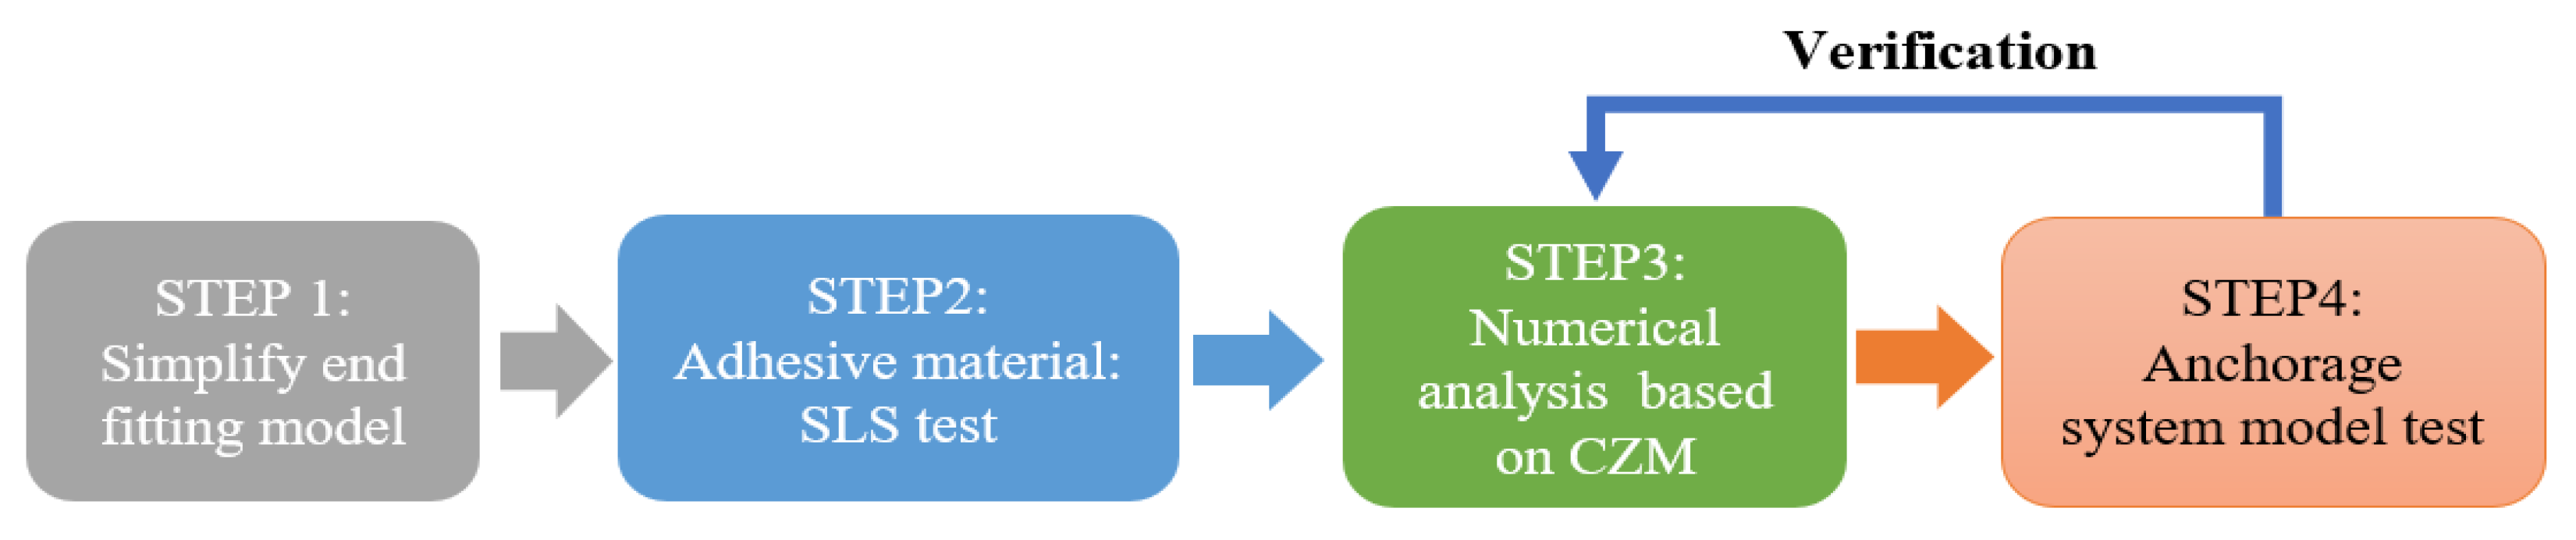
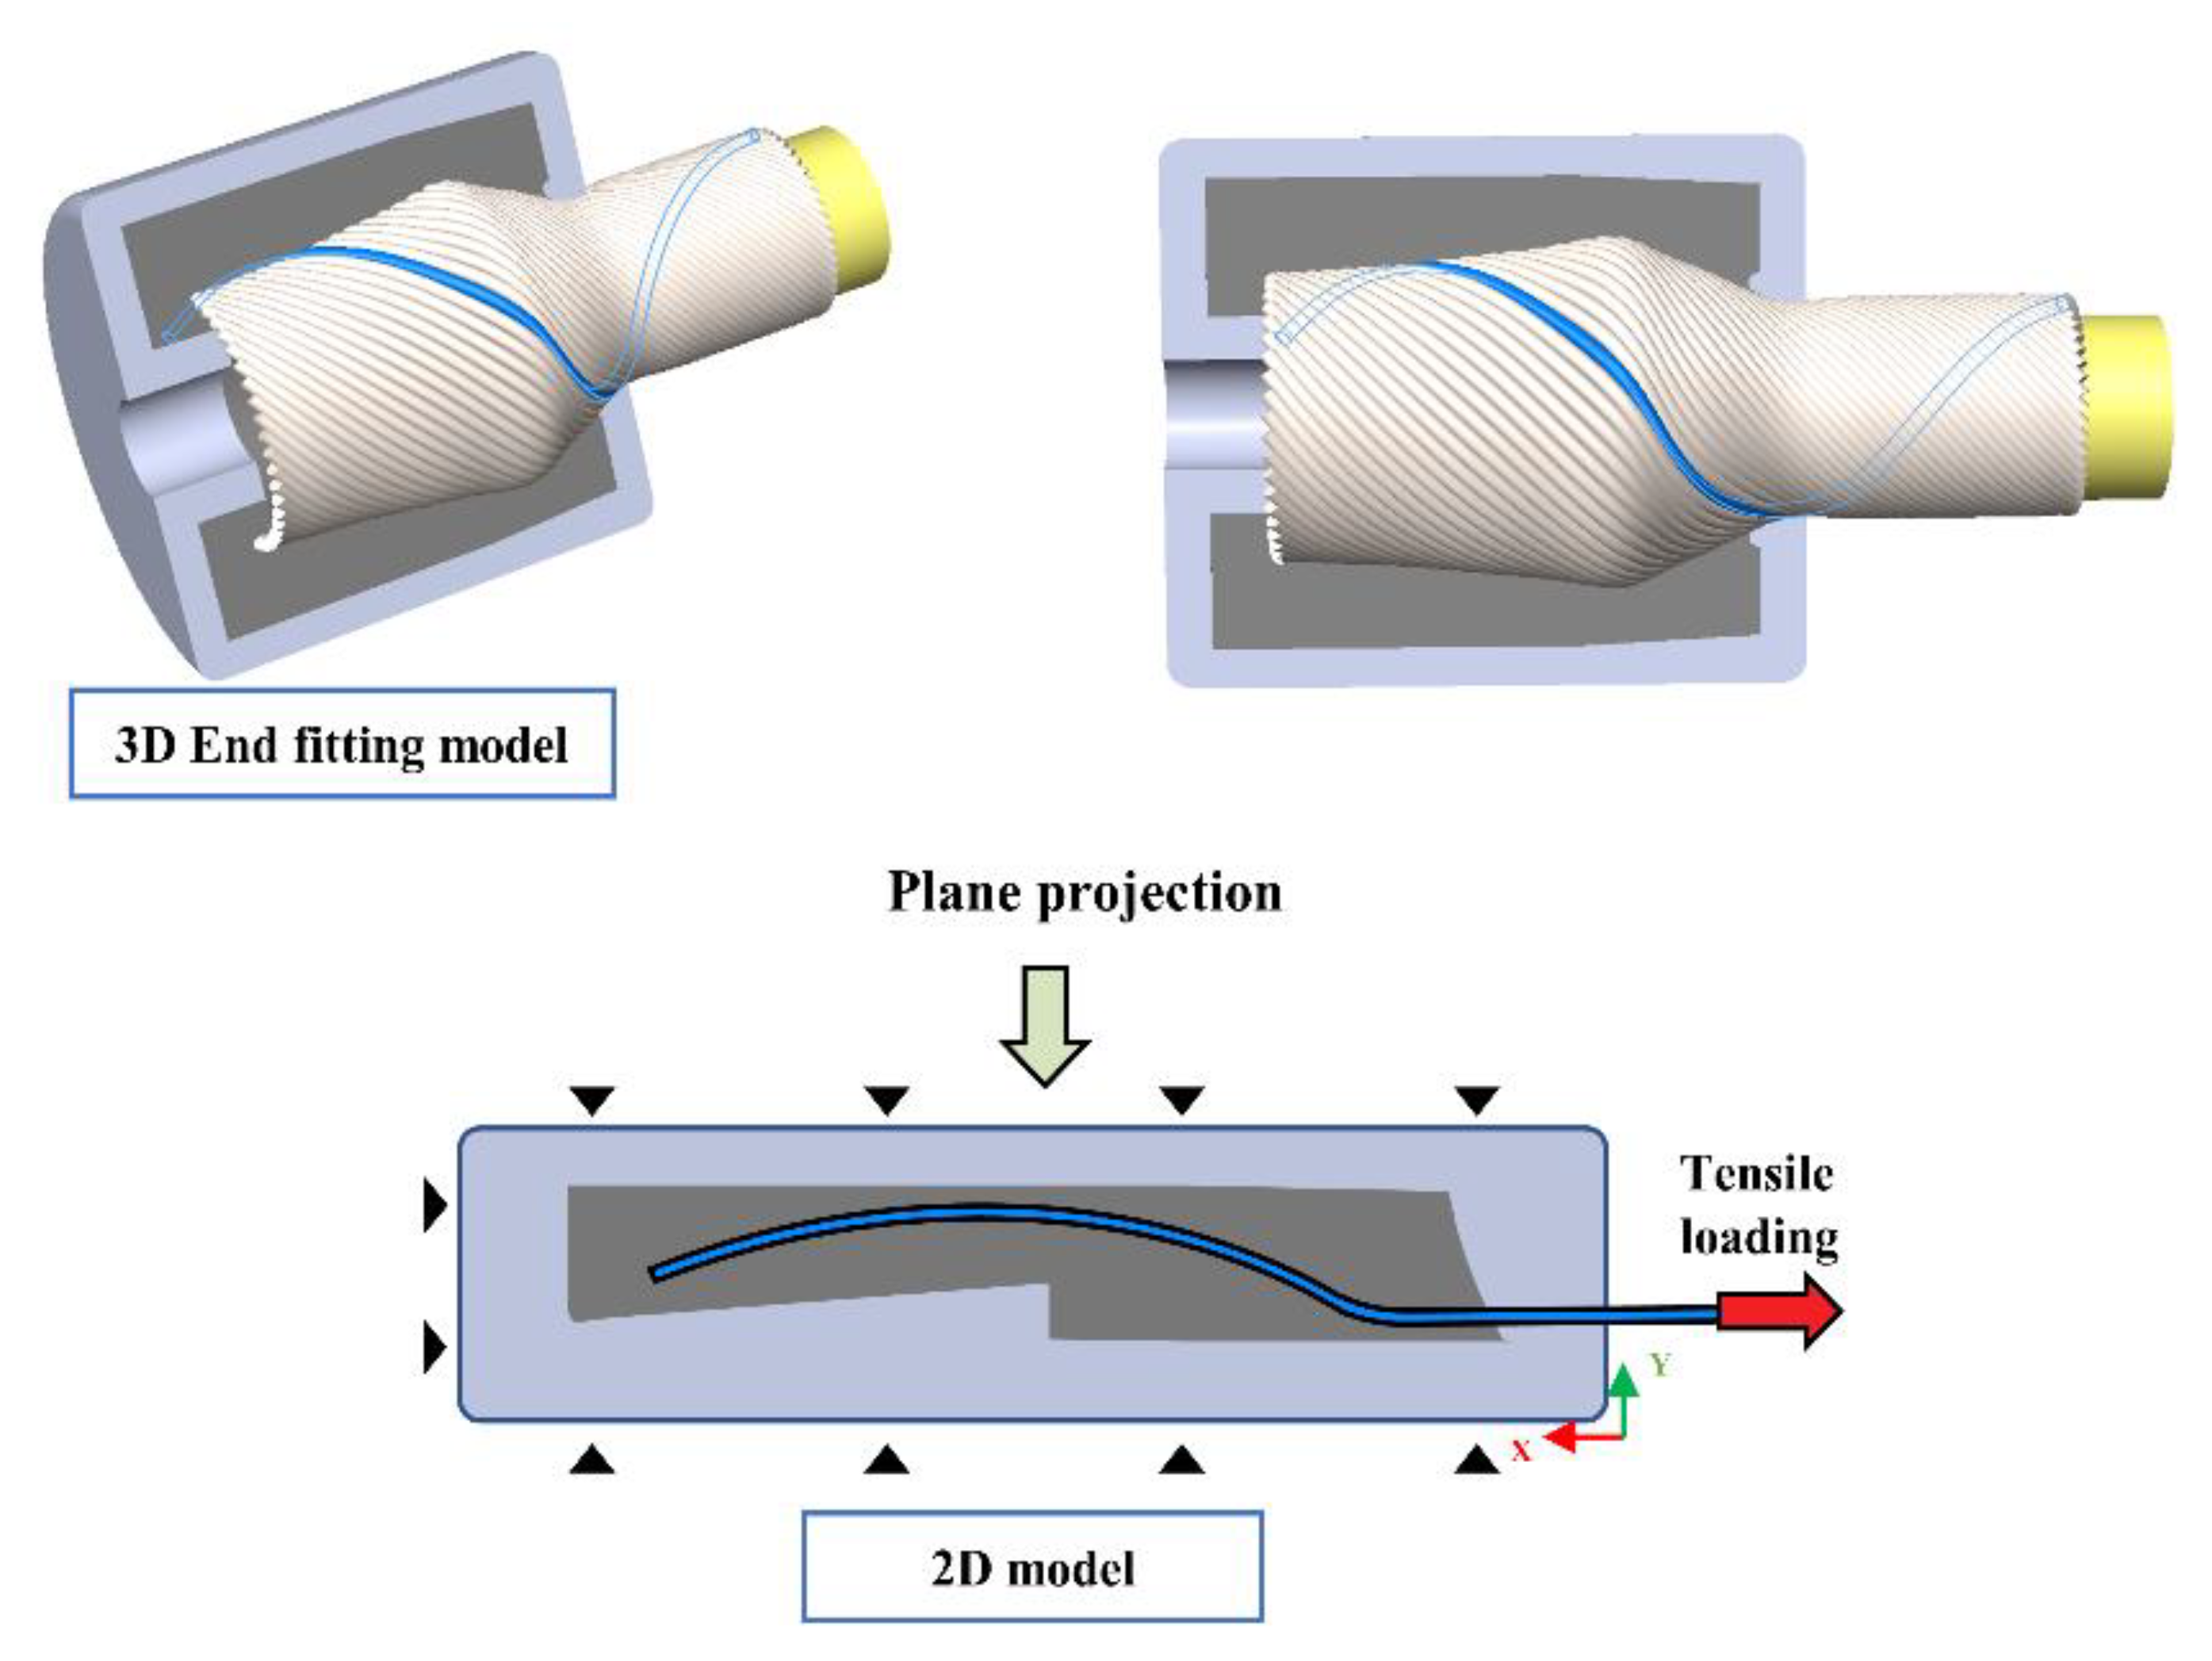
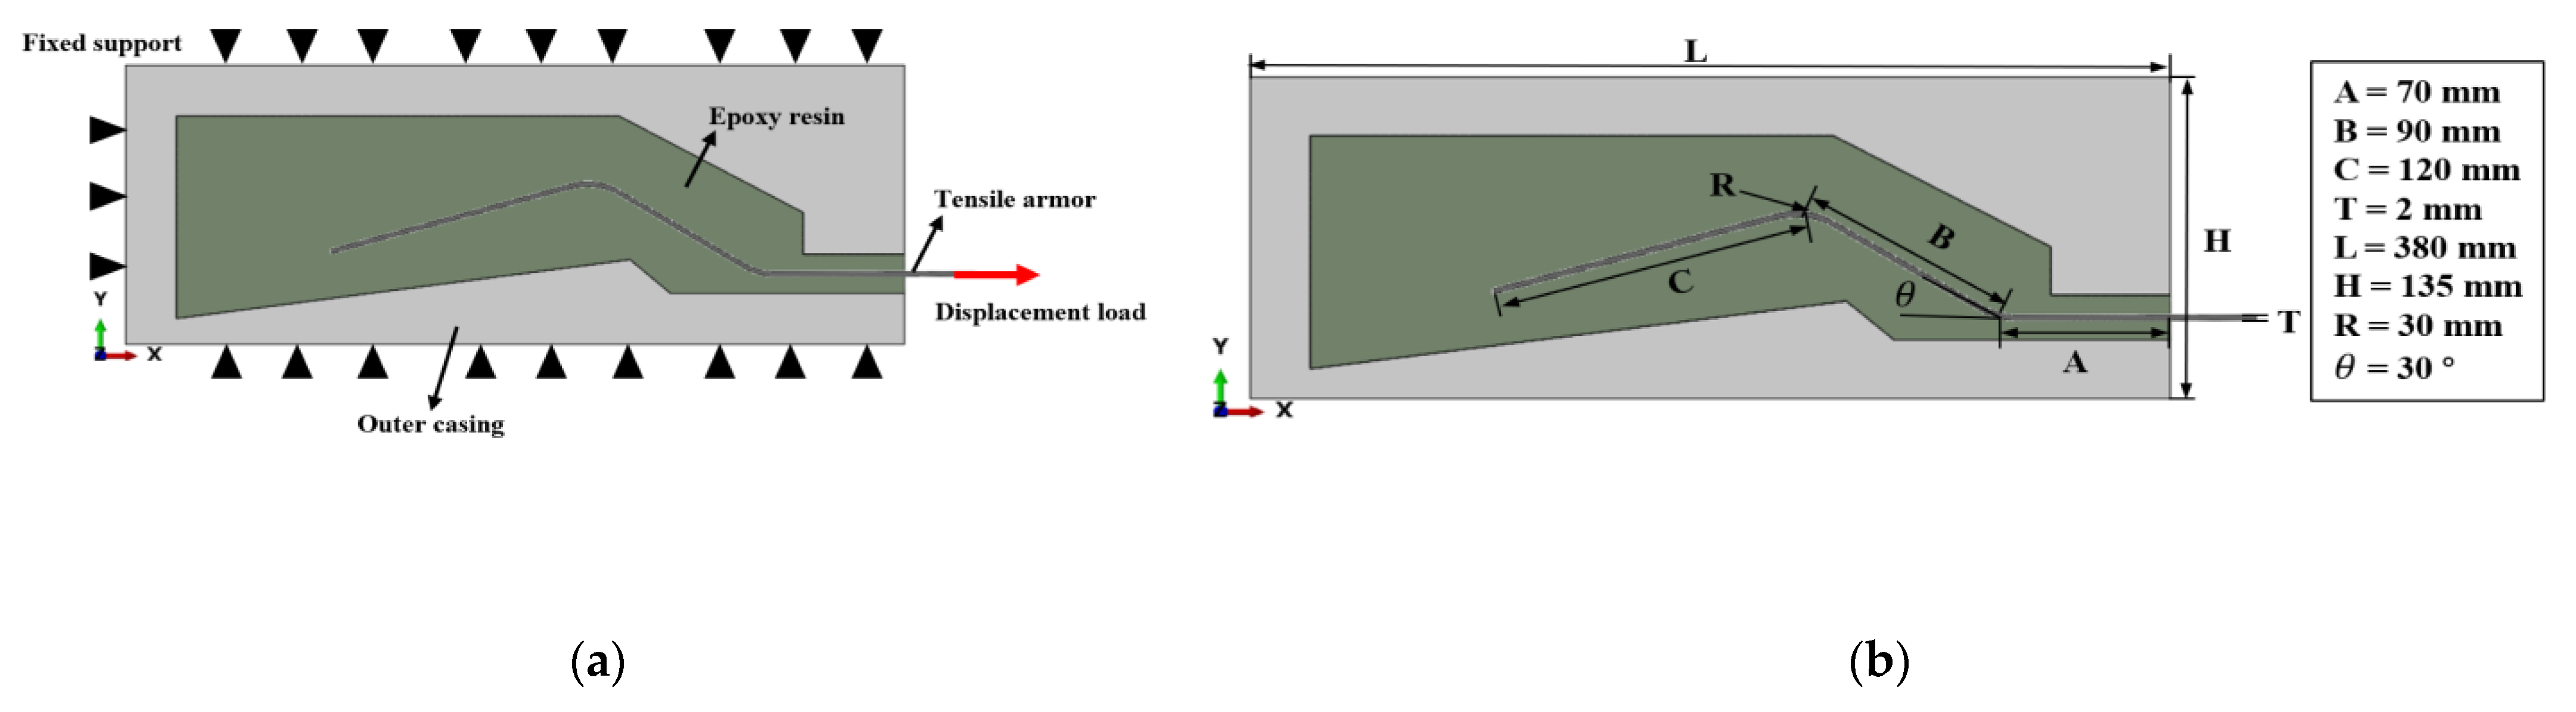
- Consider the geometry and loading direction of the end fittings to simplify the three-dimensional helical arrangements.
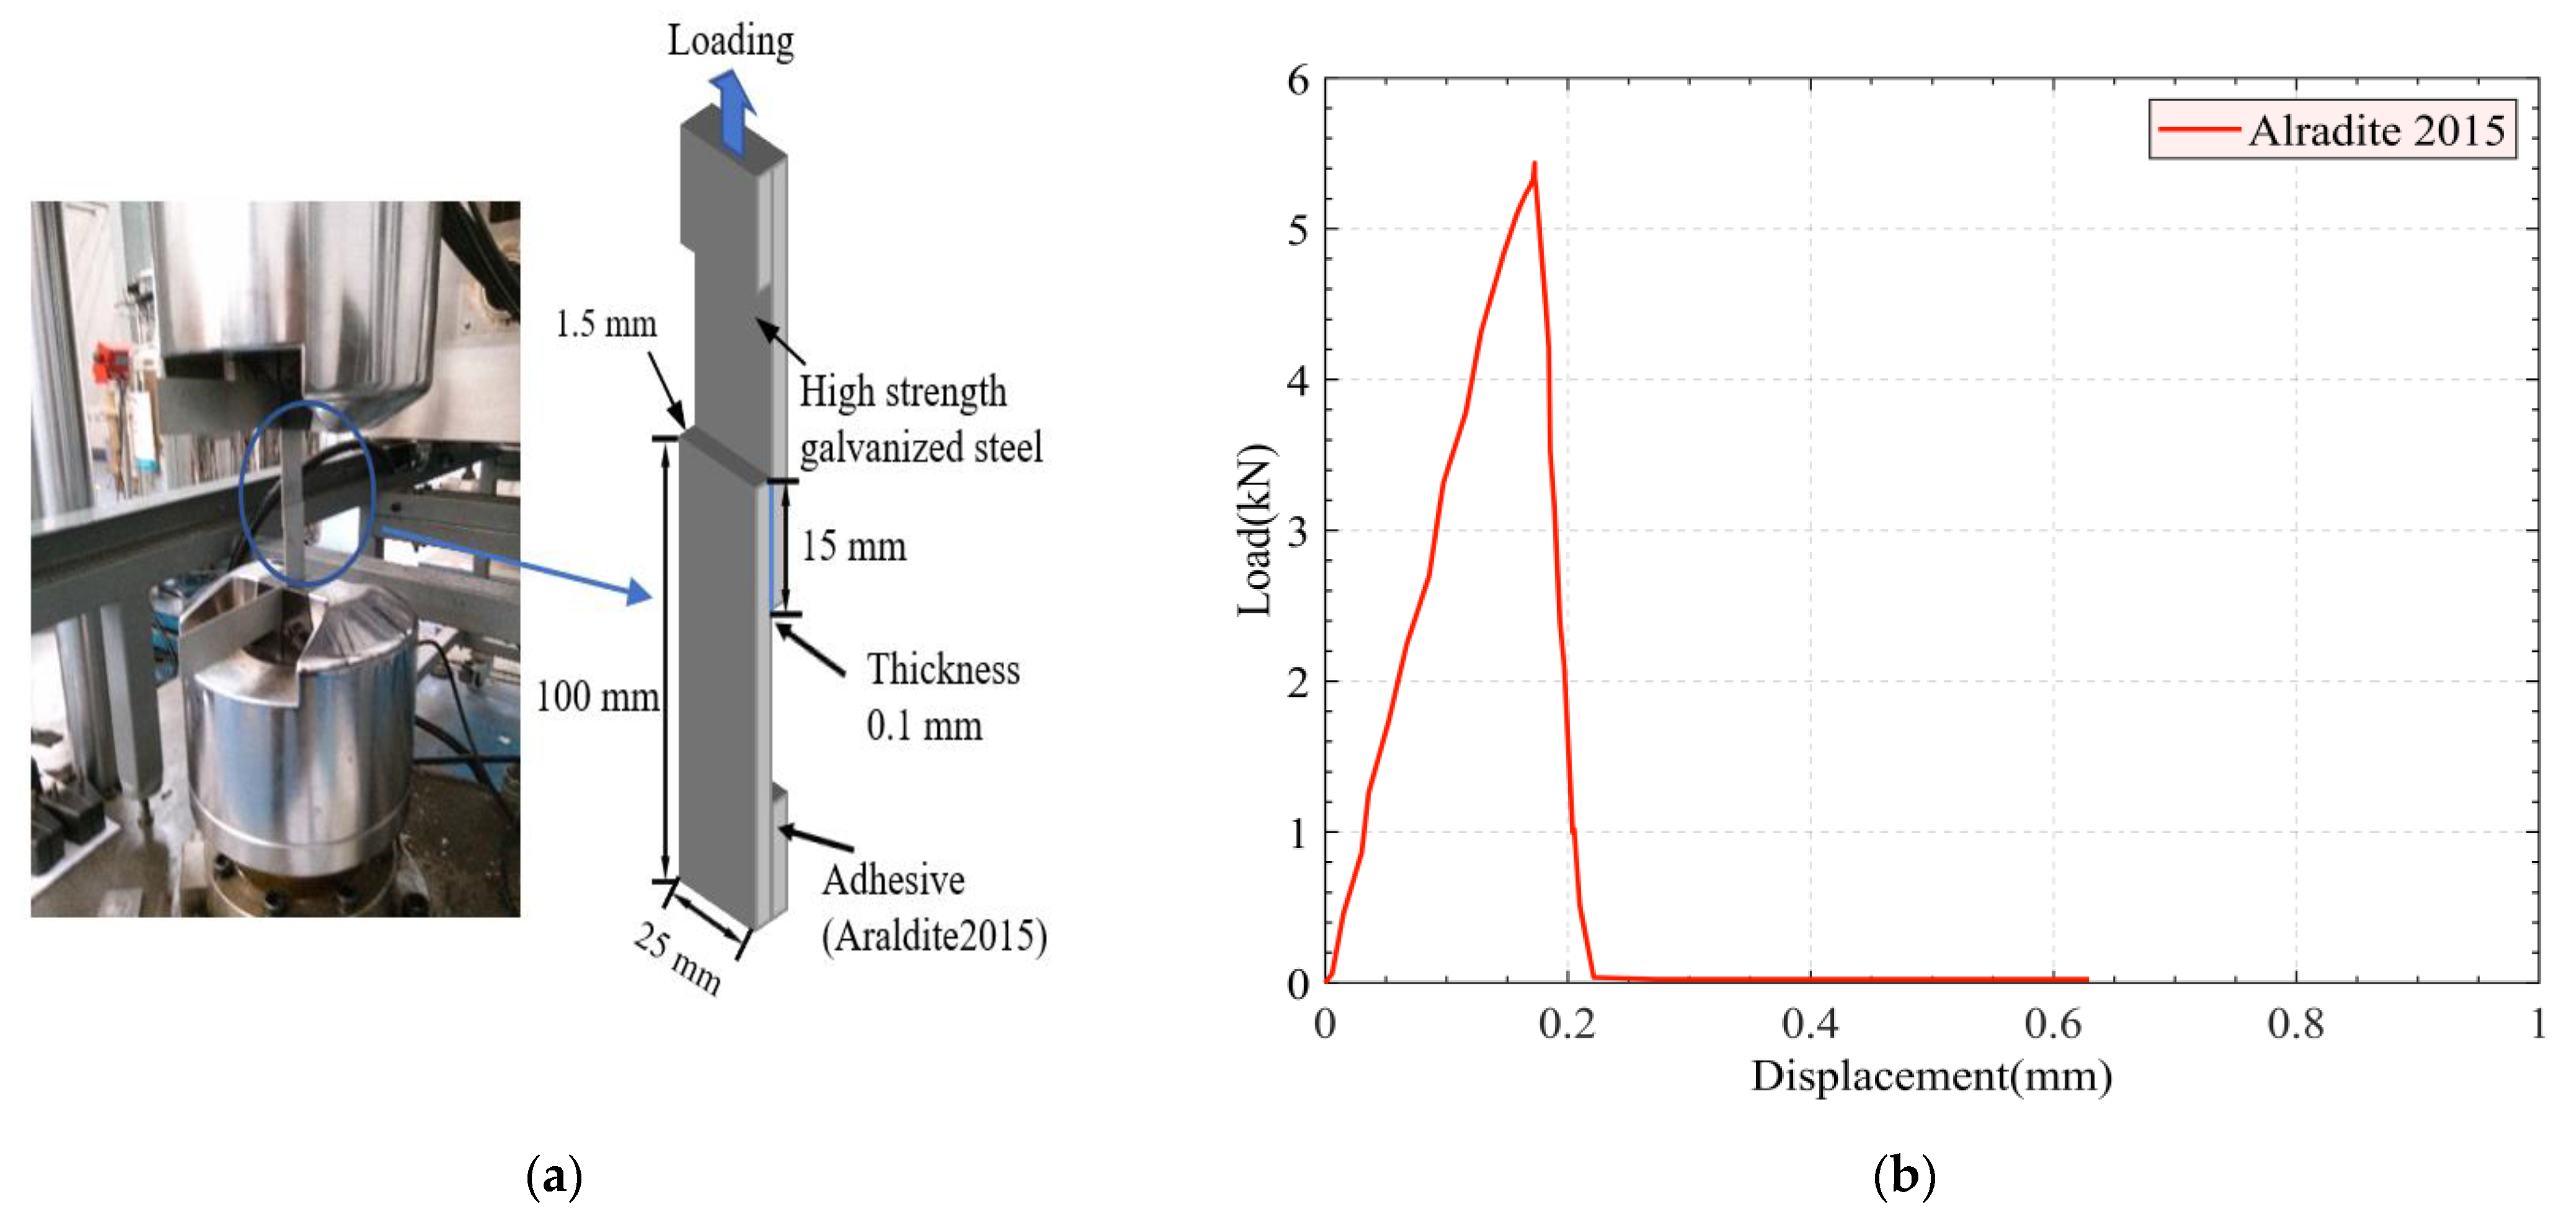
- Conduct a single-lap shear (SLS) test to determine the material properties of the epoxy resin inside the end fitting.
- On the basis of the properties of the materials gathered in step 2, use a CZM-based numerical model to investigate the progressive failure behavior of the anchorage system under an axial tension load. The failure process is described in terms of the time-dependent evolution of damage parameters and stress along the steel wire.
- Perform model tests and compare the acquired load–displacement curves to the numerical results in order to determine the validity of the numerical model developed in this research.
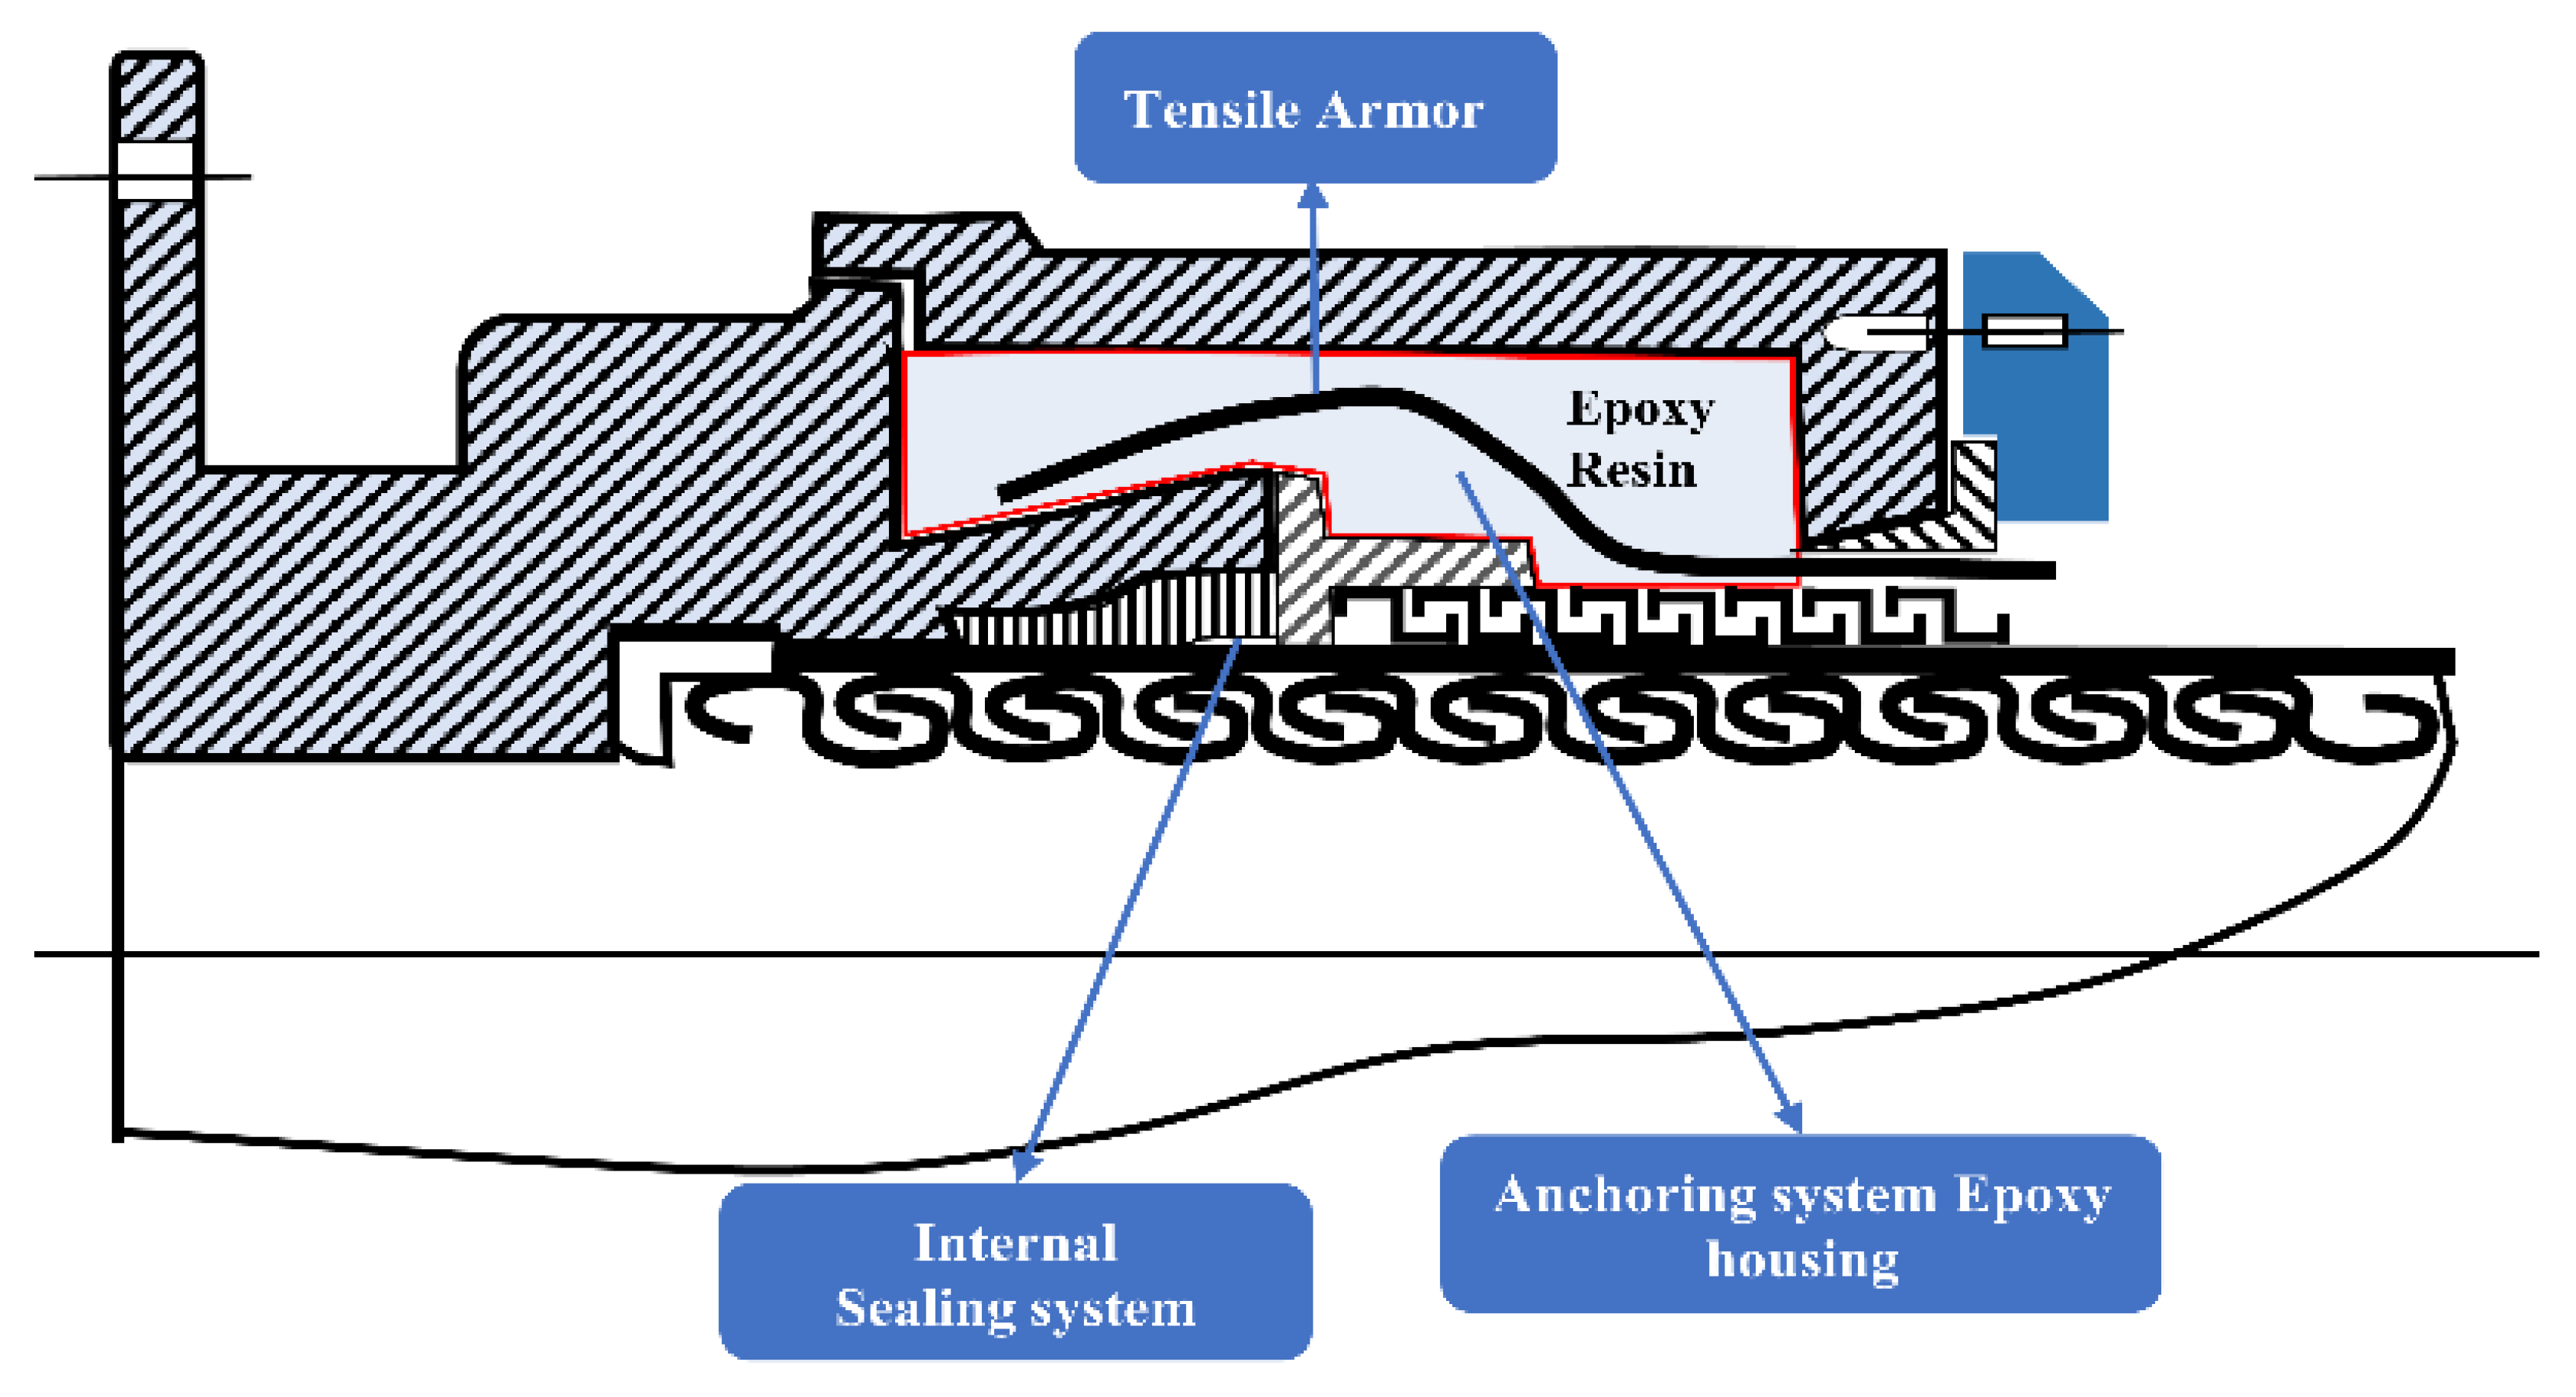
2.1. End Fitting Structure and Model Simplification
2.2. Single Lap Shear Test for Adhesive Material Properties
2.3. Finite Element Analysis Based on Cohesive Zone Model(CZM)
2.3.1. Cohesive Zone Model for Bonding Structure
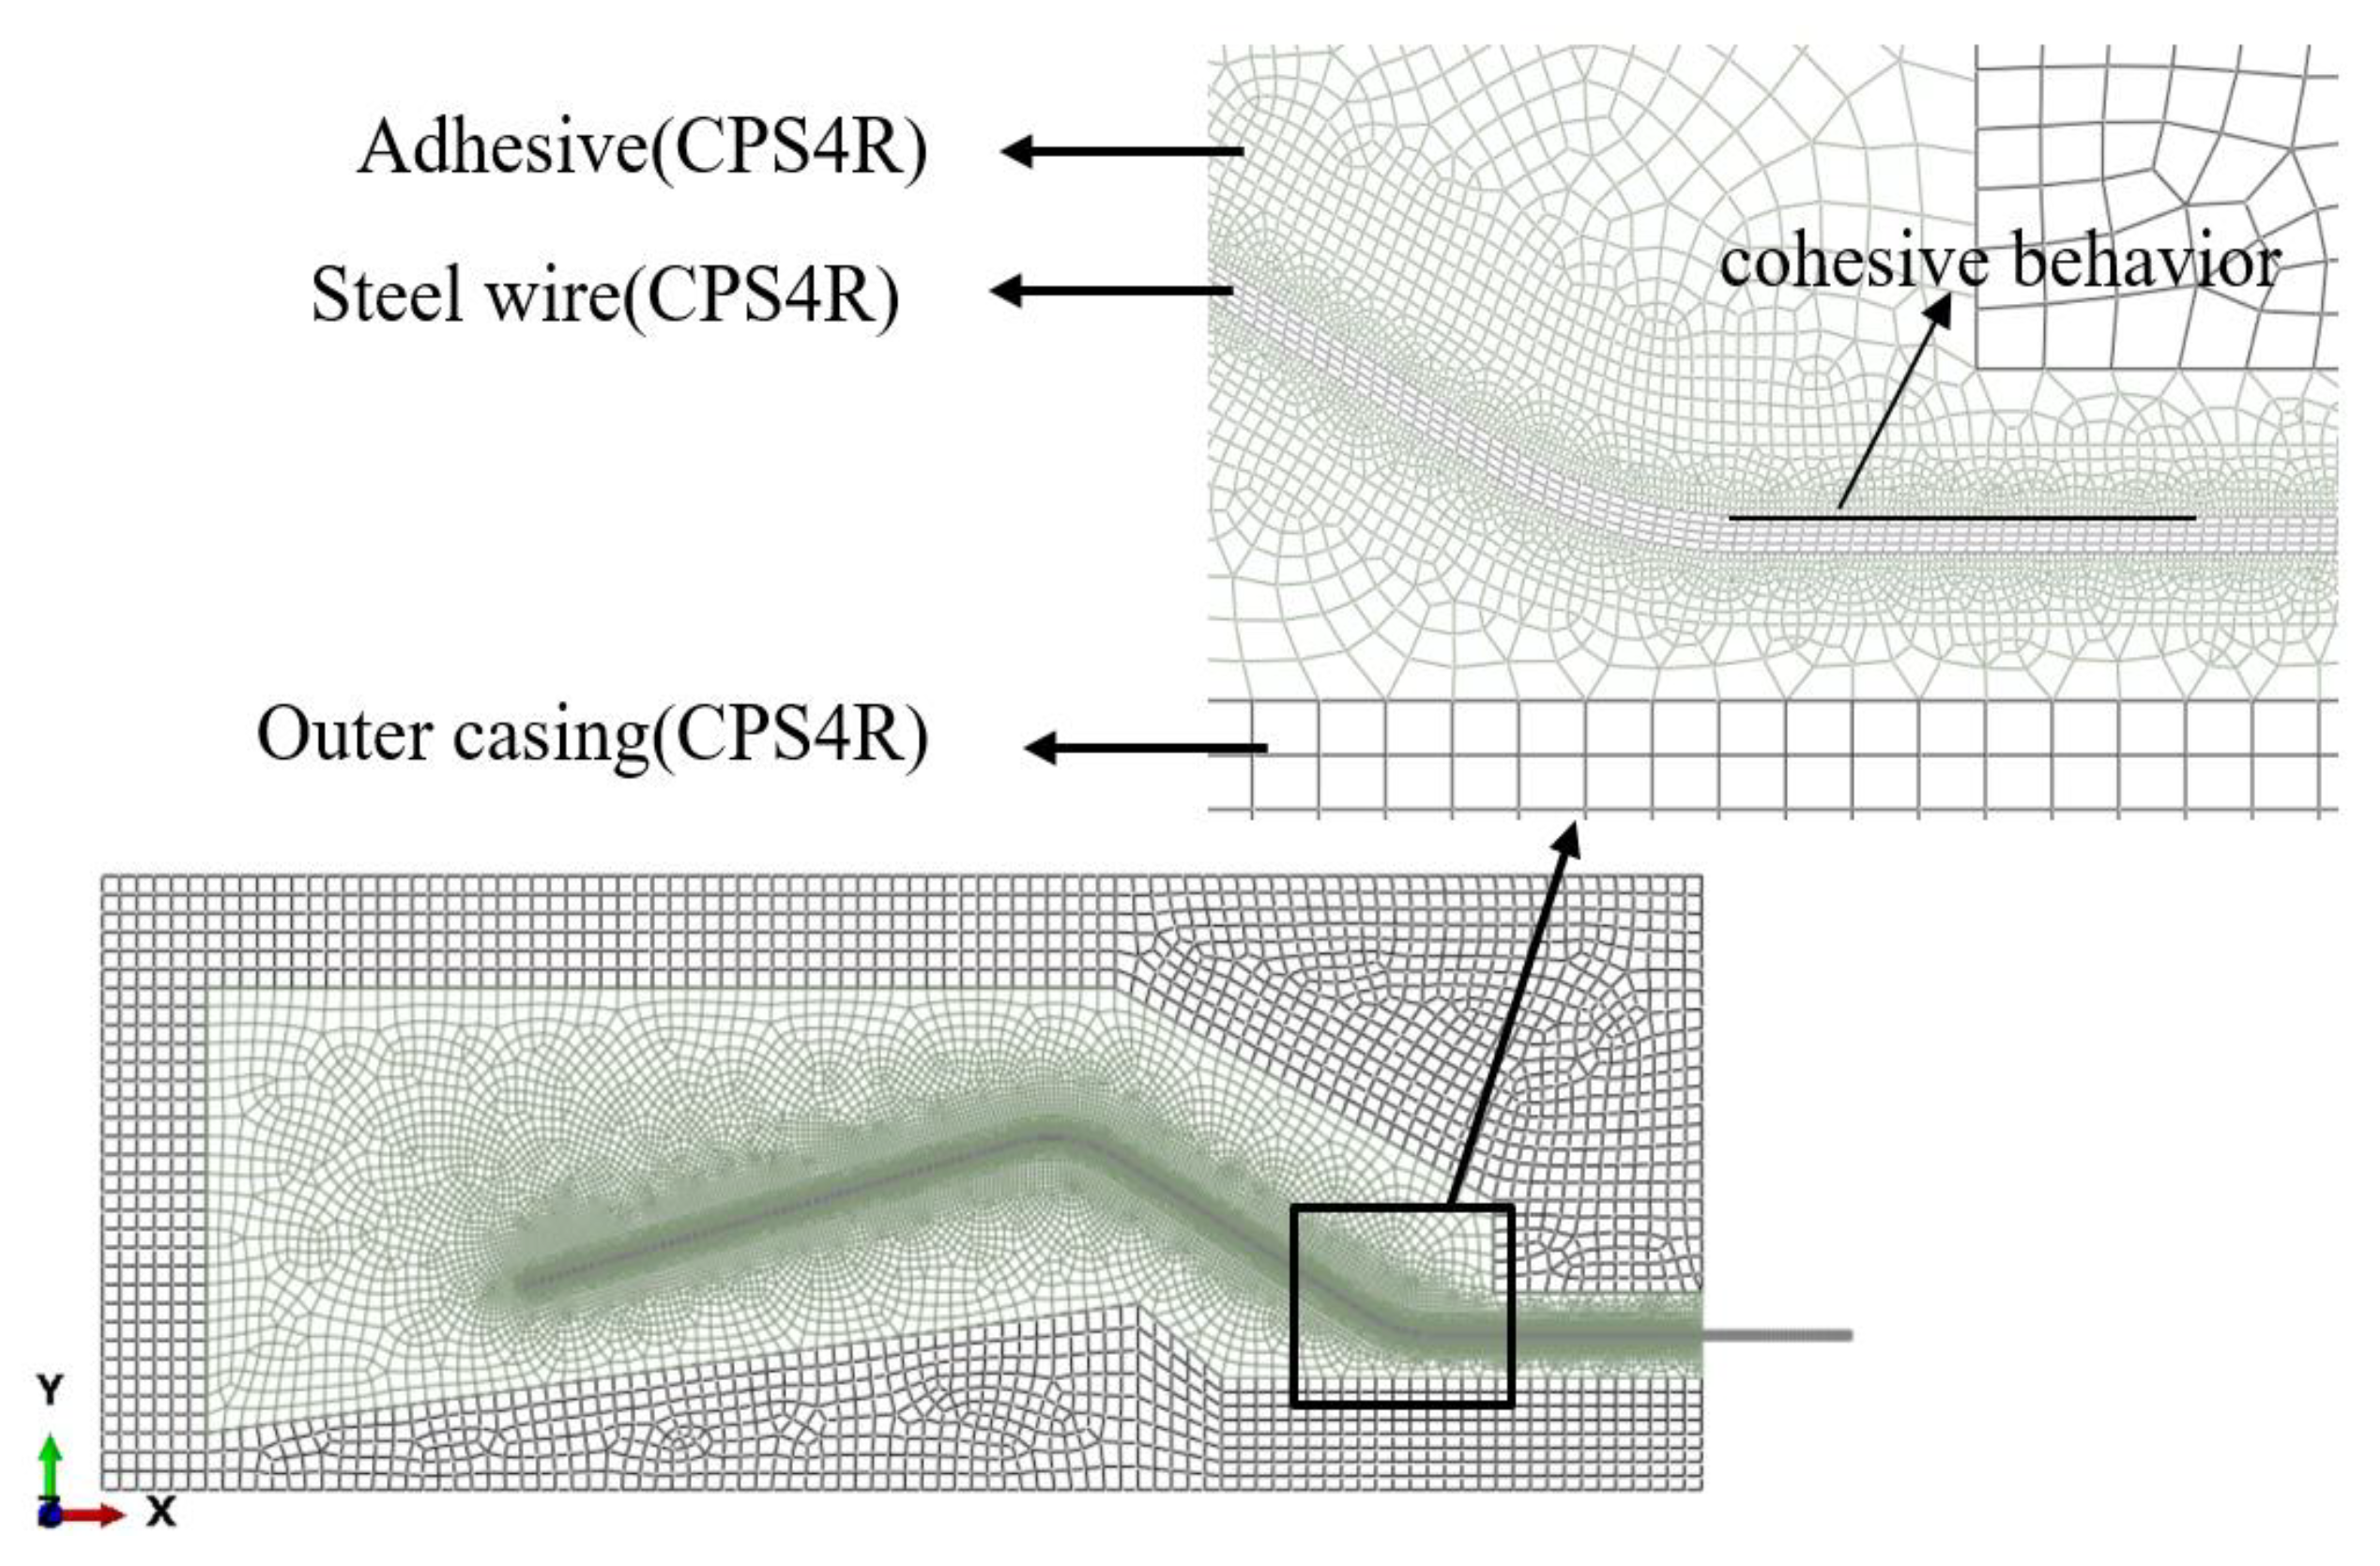
2.3.2. Finite Element Model Setup
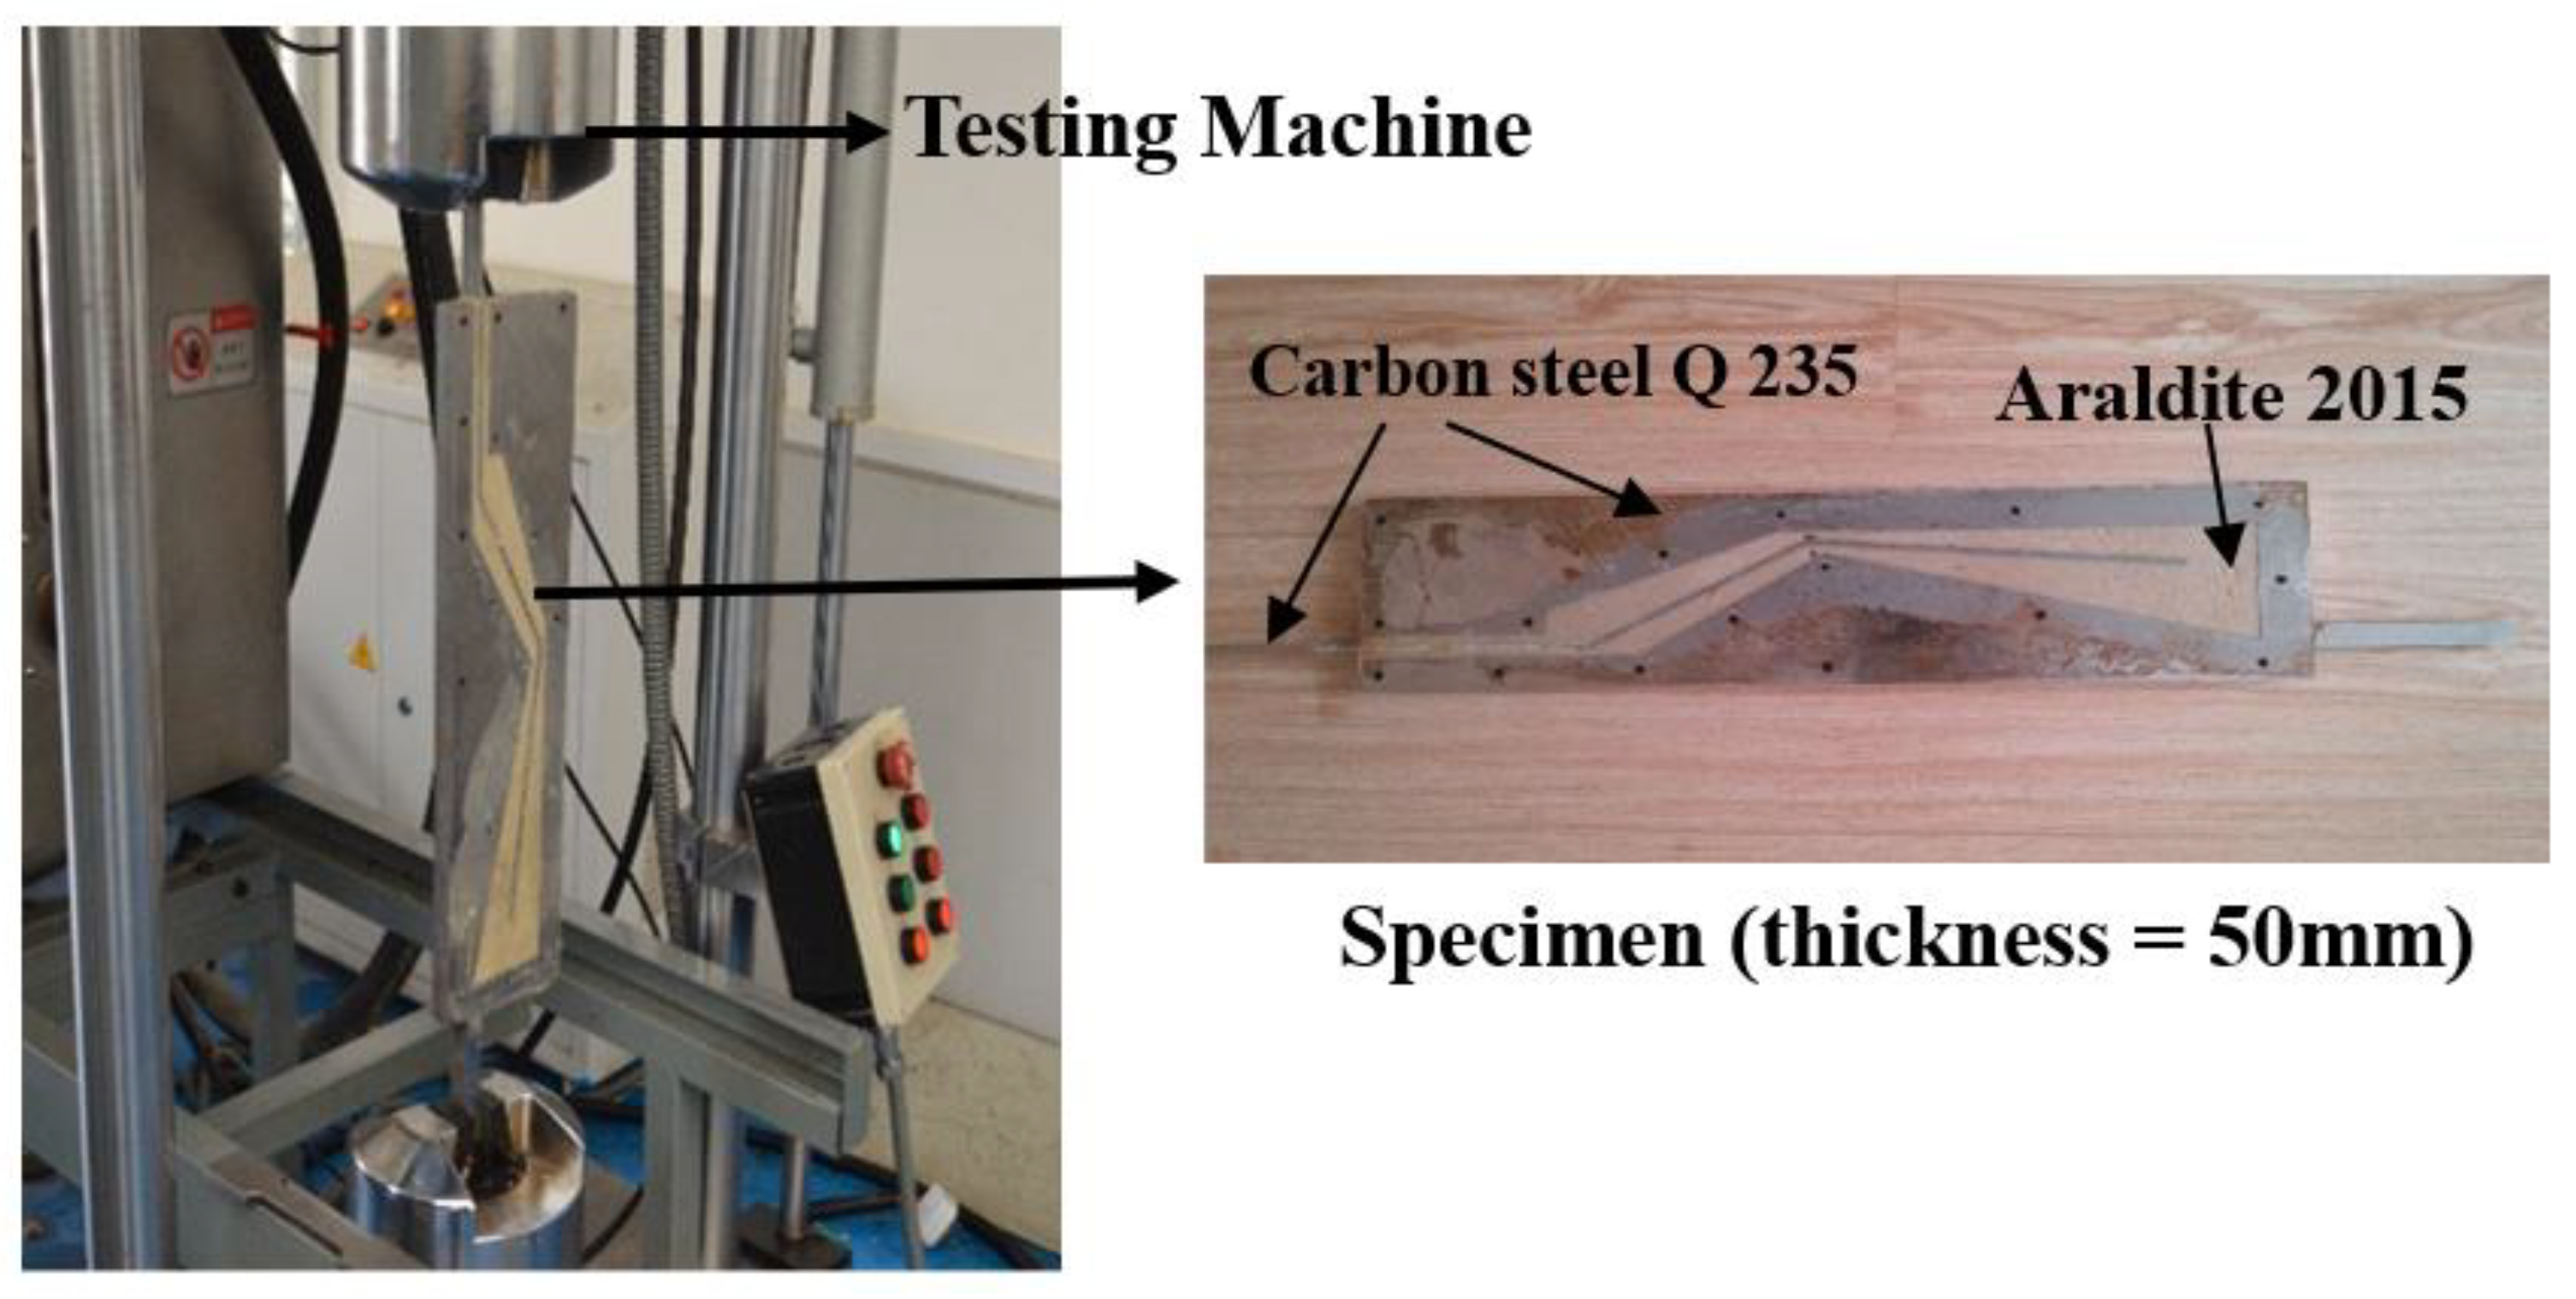
2.4. Model Test of Anchorage System
3. Numerical and Experimental Results
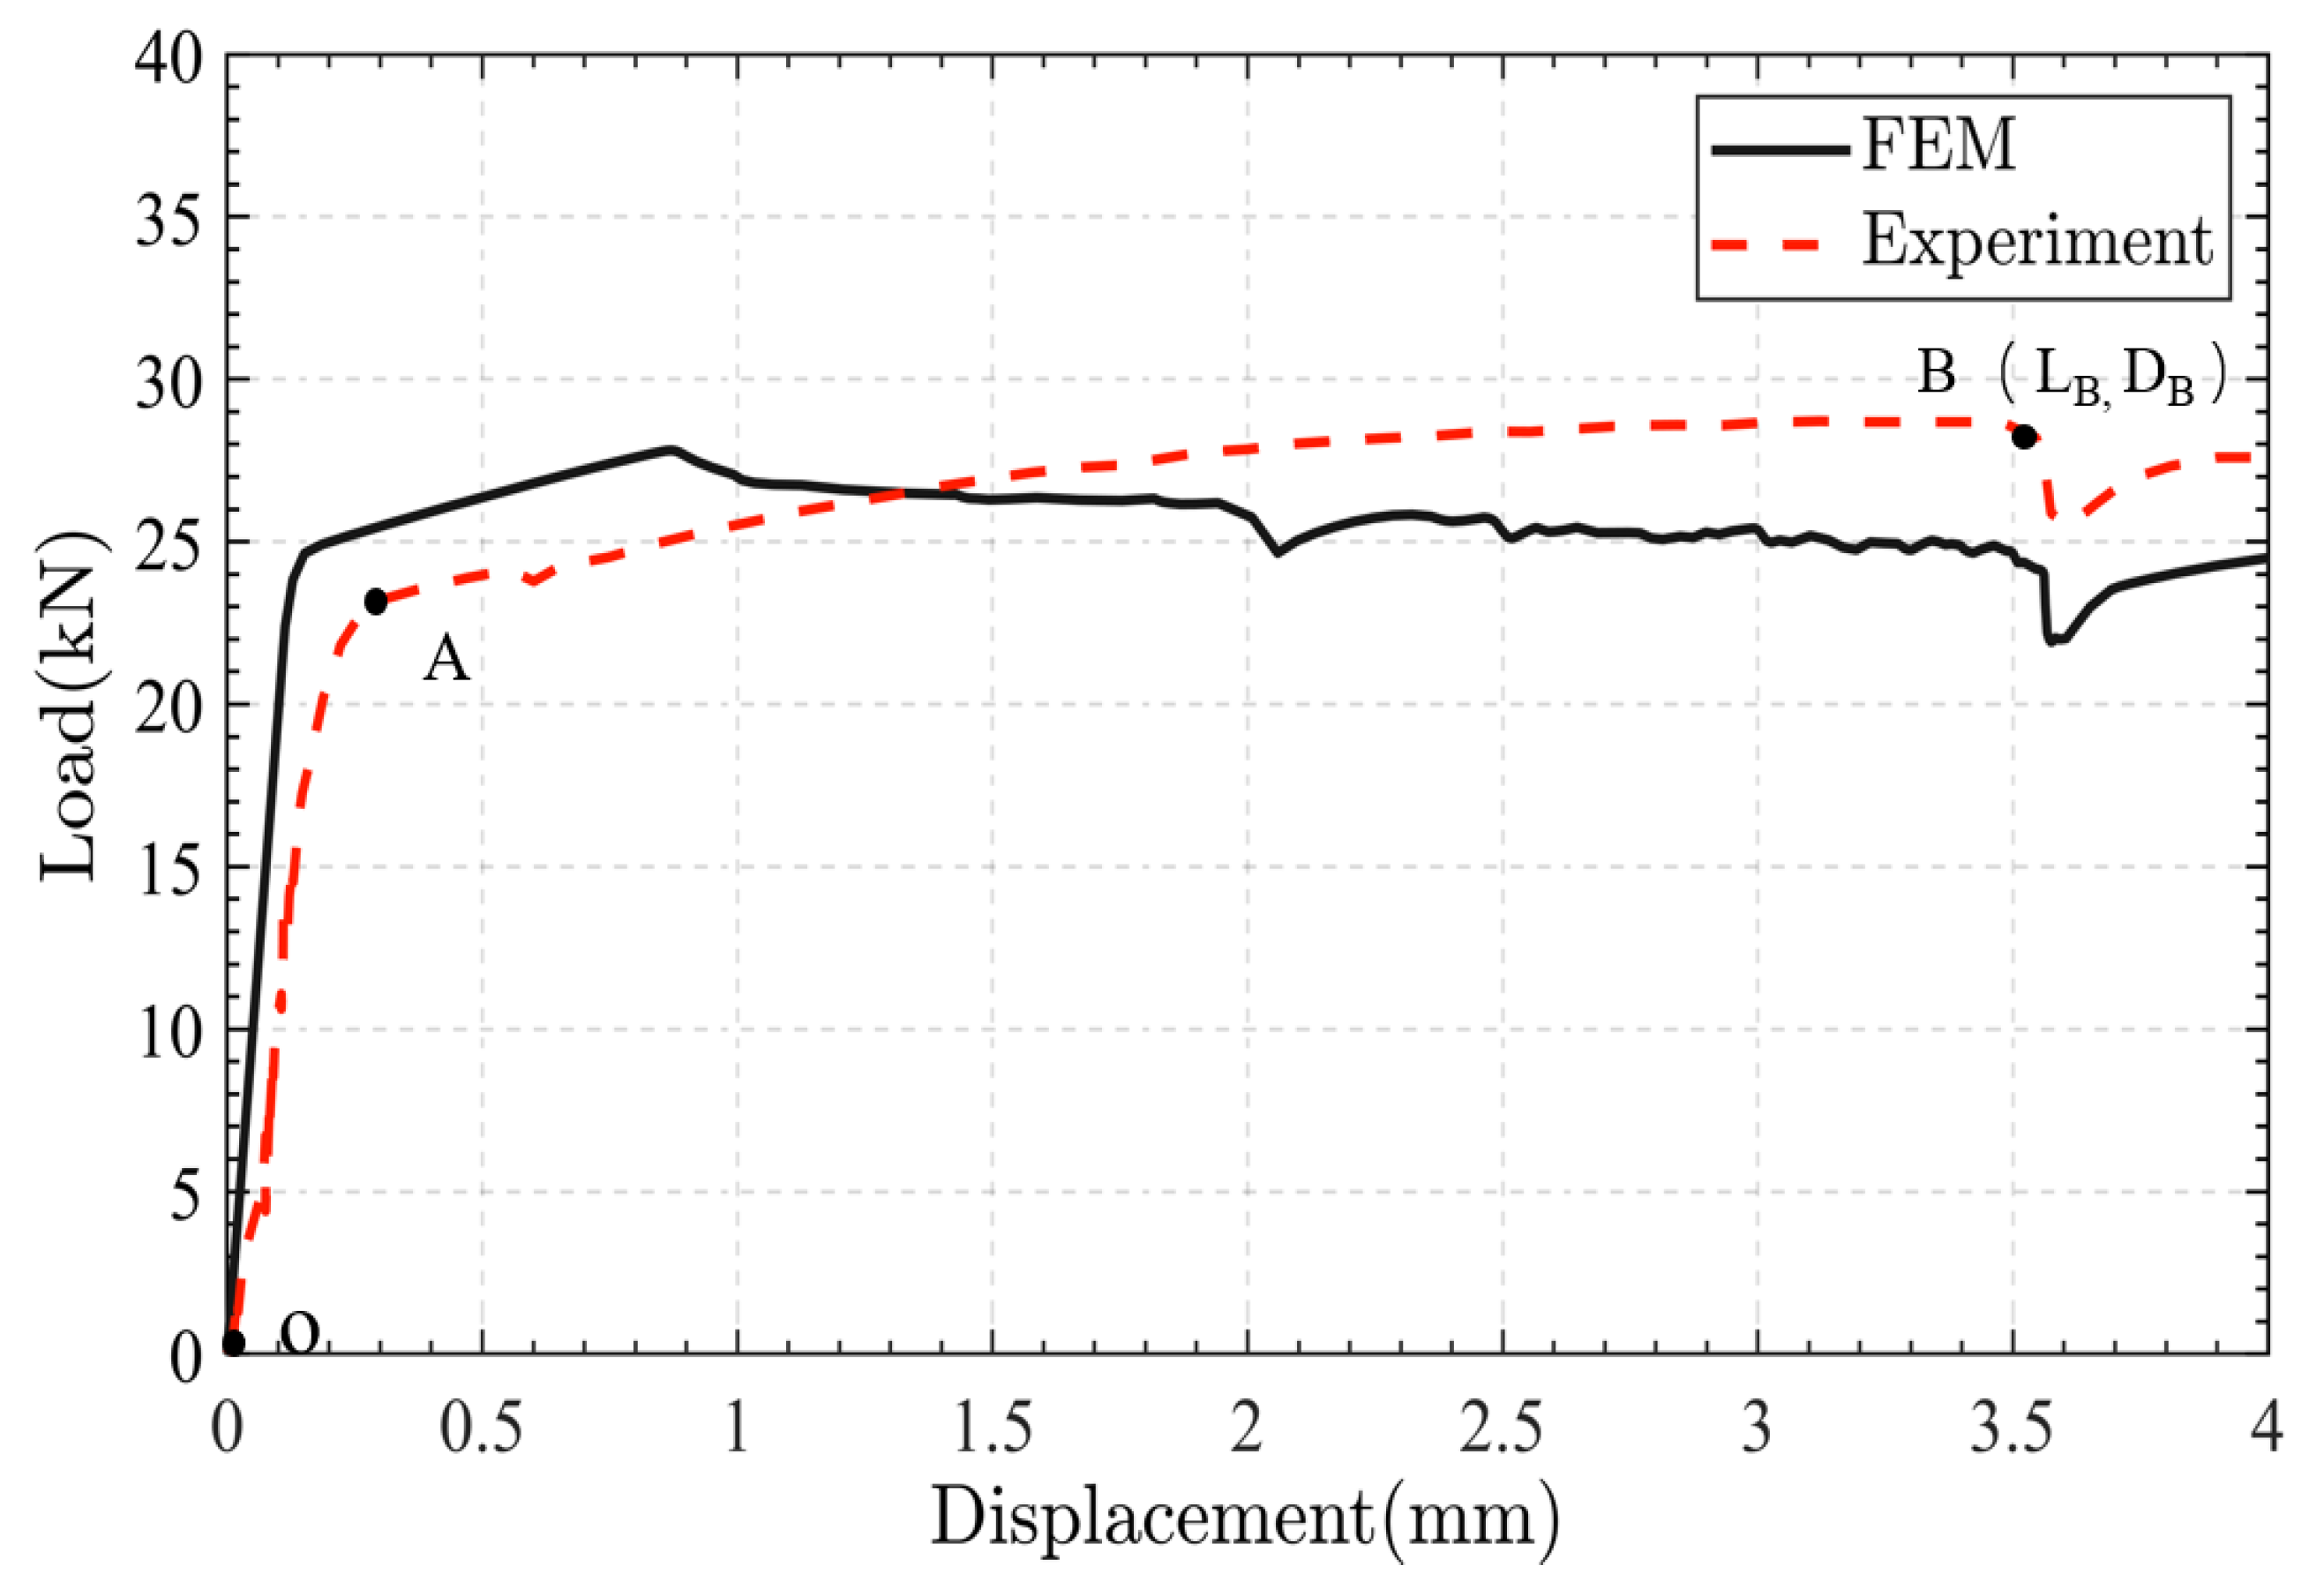
3.1. Load–Displacement Curve from FEM and Experiment
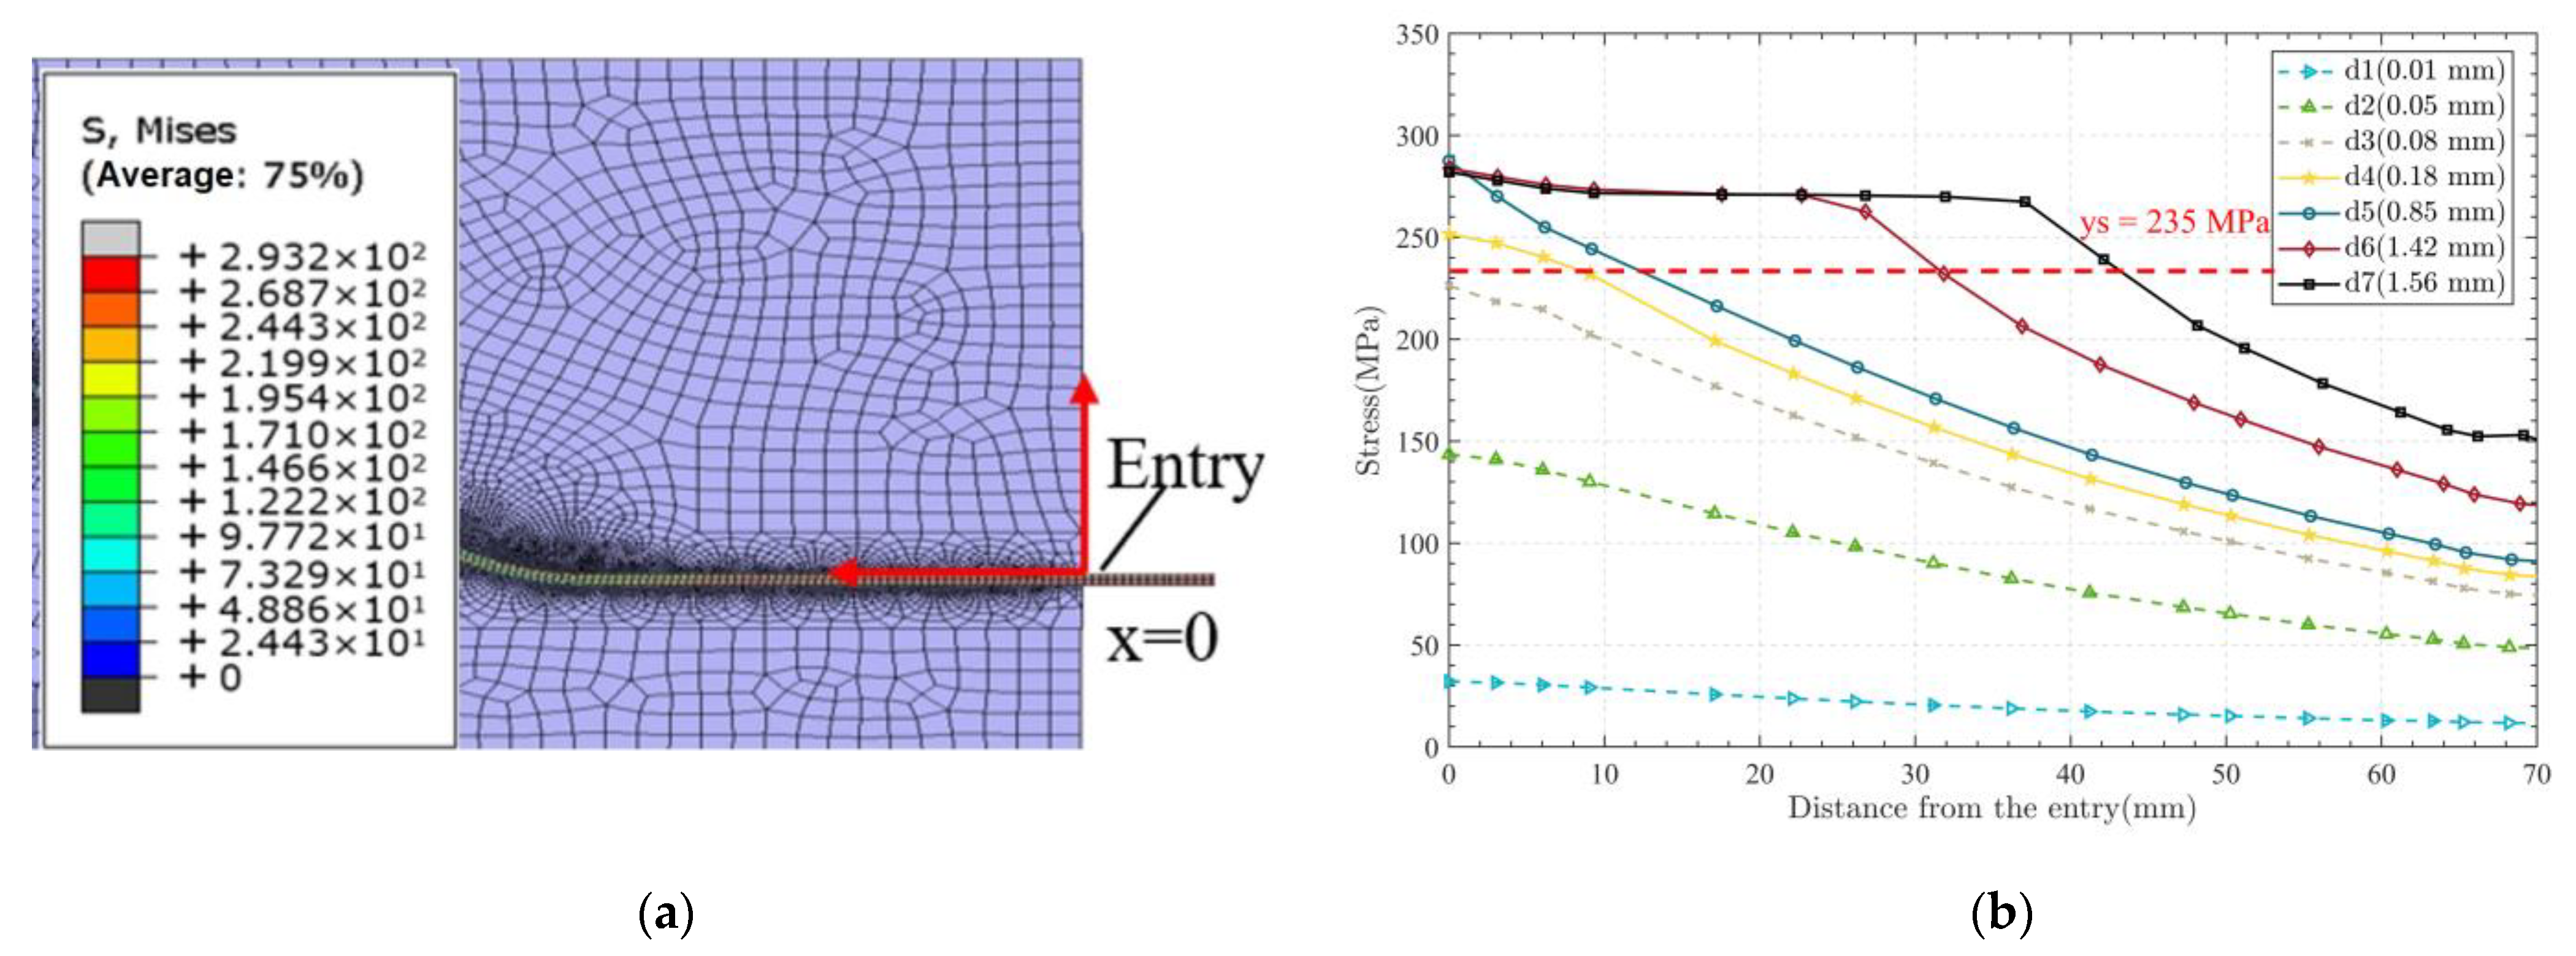
3.2. Stress Evolution of Steel Wire
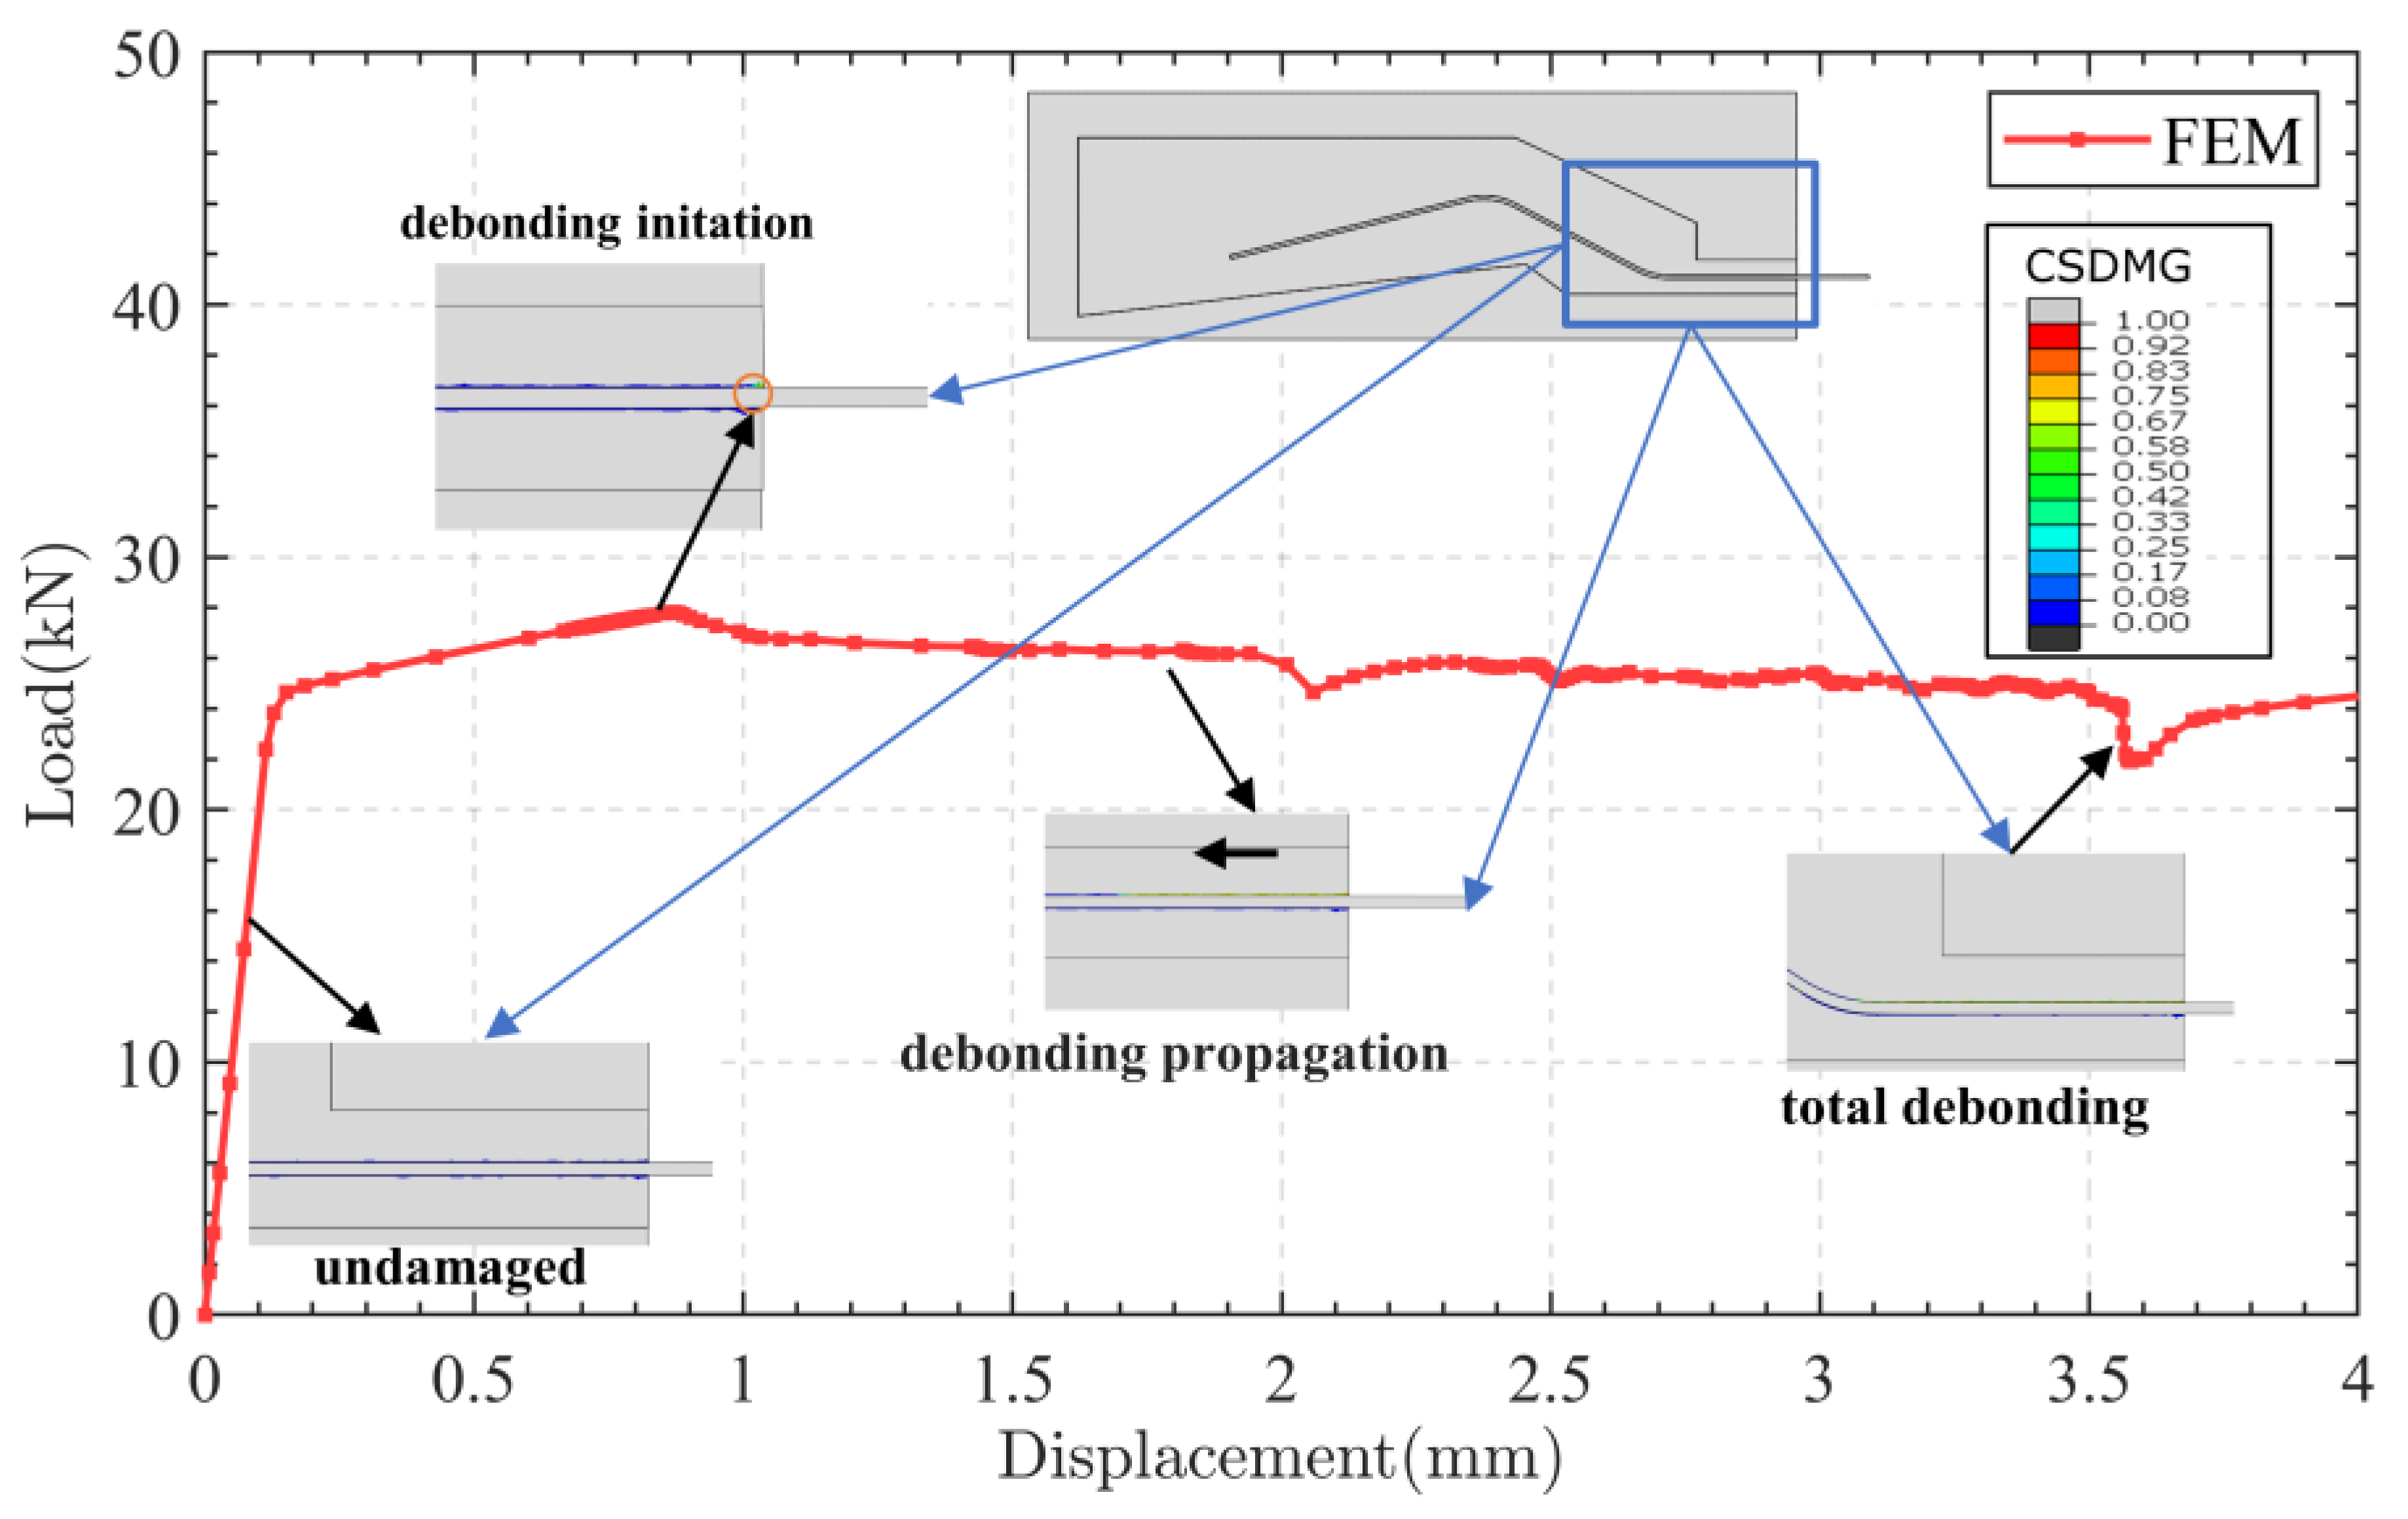
3.3. Failure Process of Anchorages System
3.4. Influencing Parameter Analysis
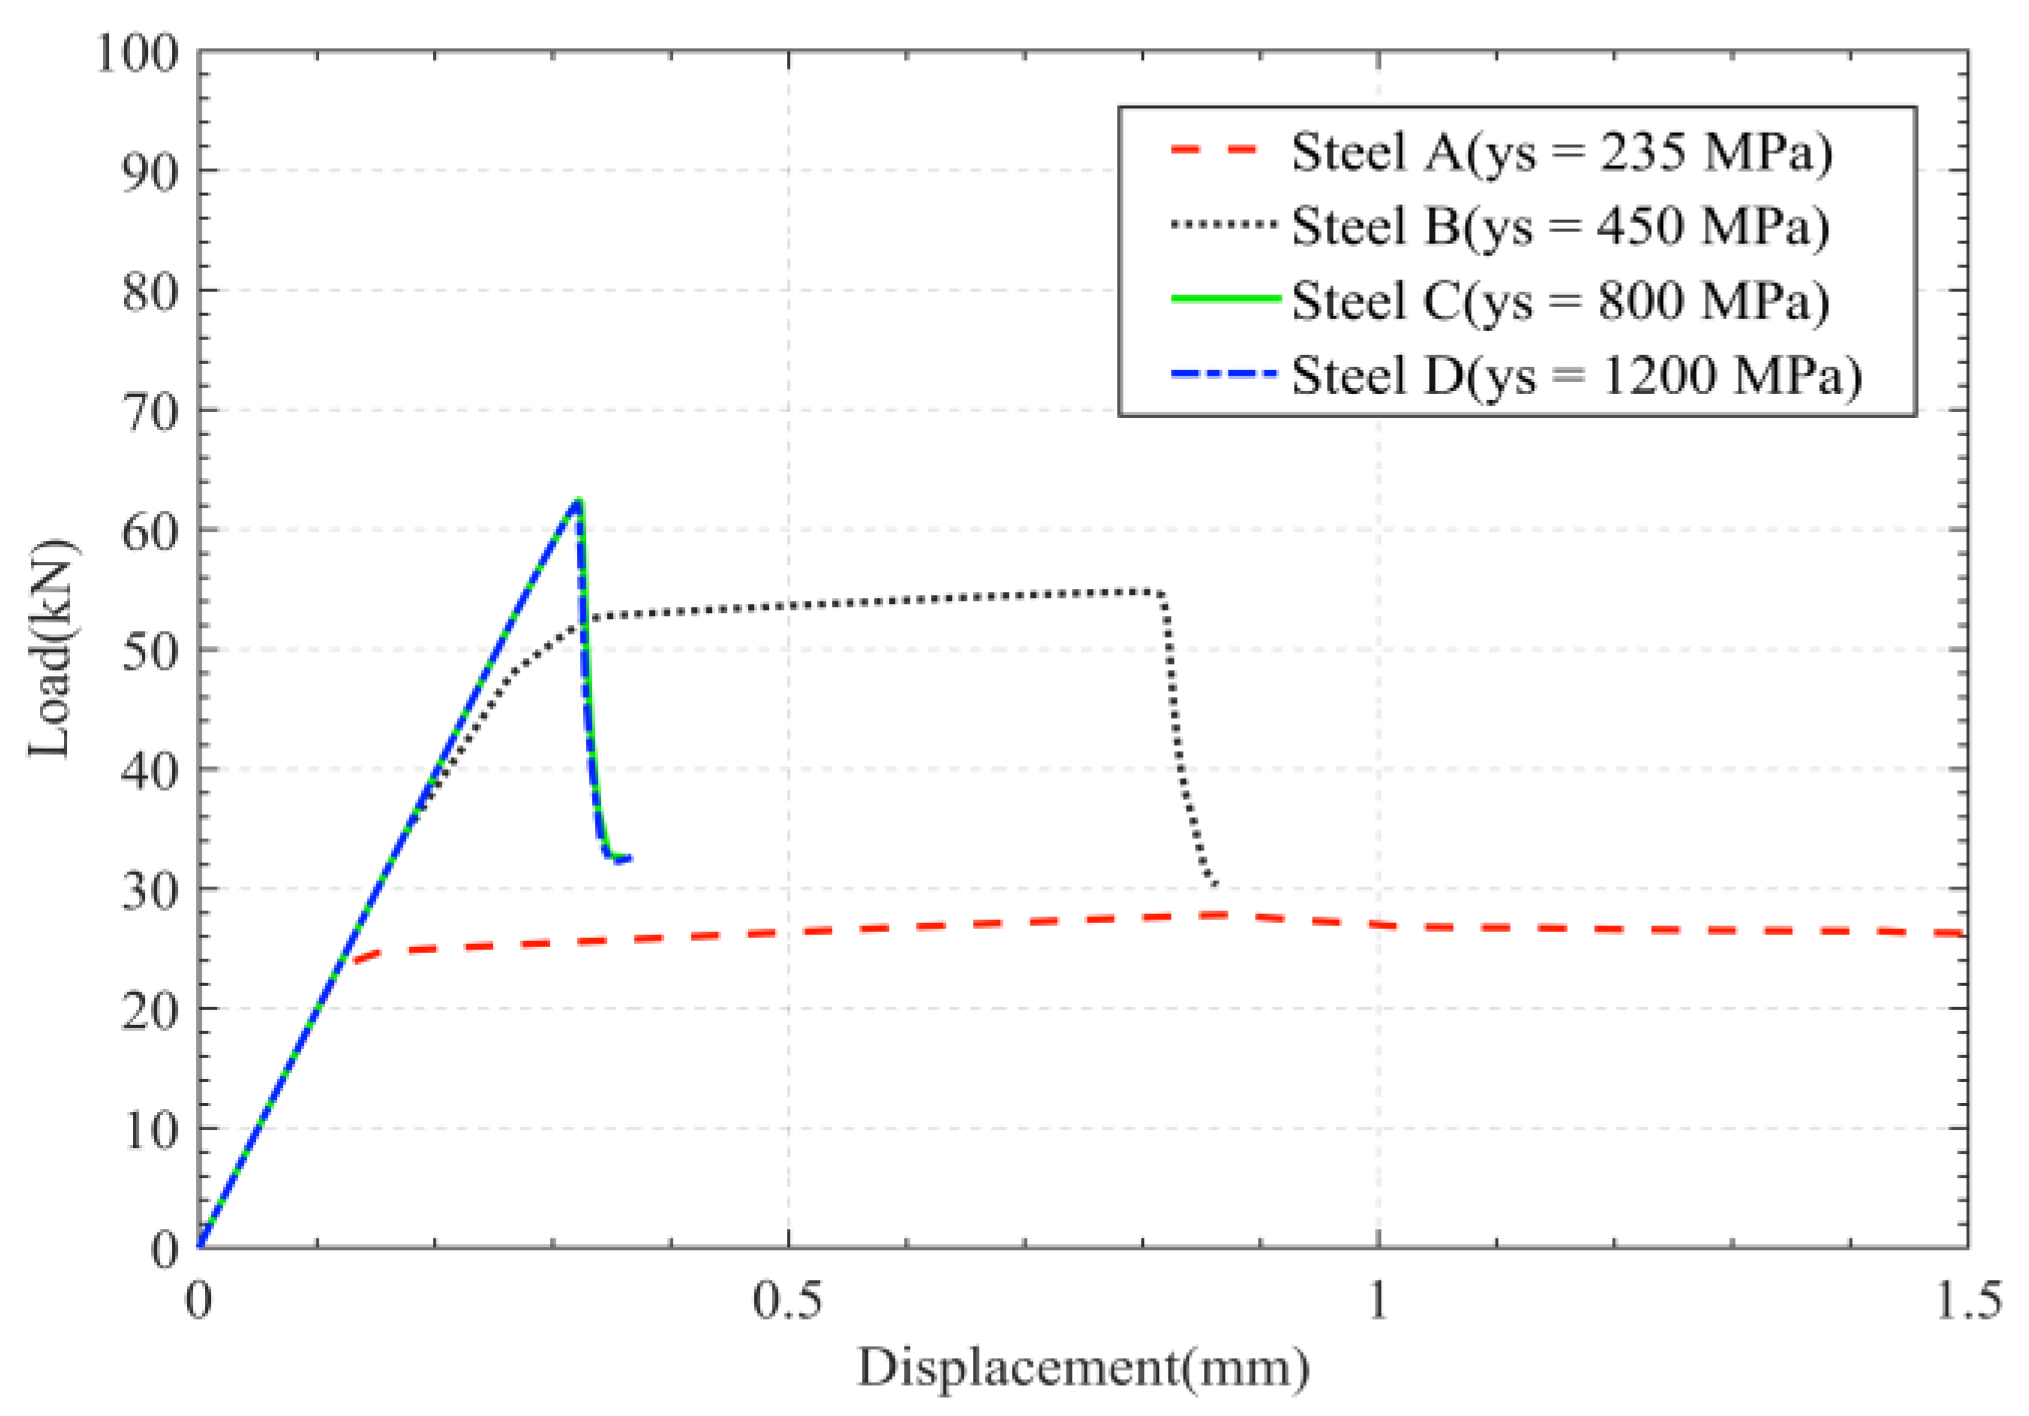
3.4.1. Different Steel Wire Yield Strength
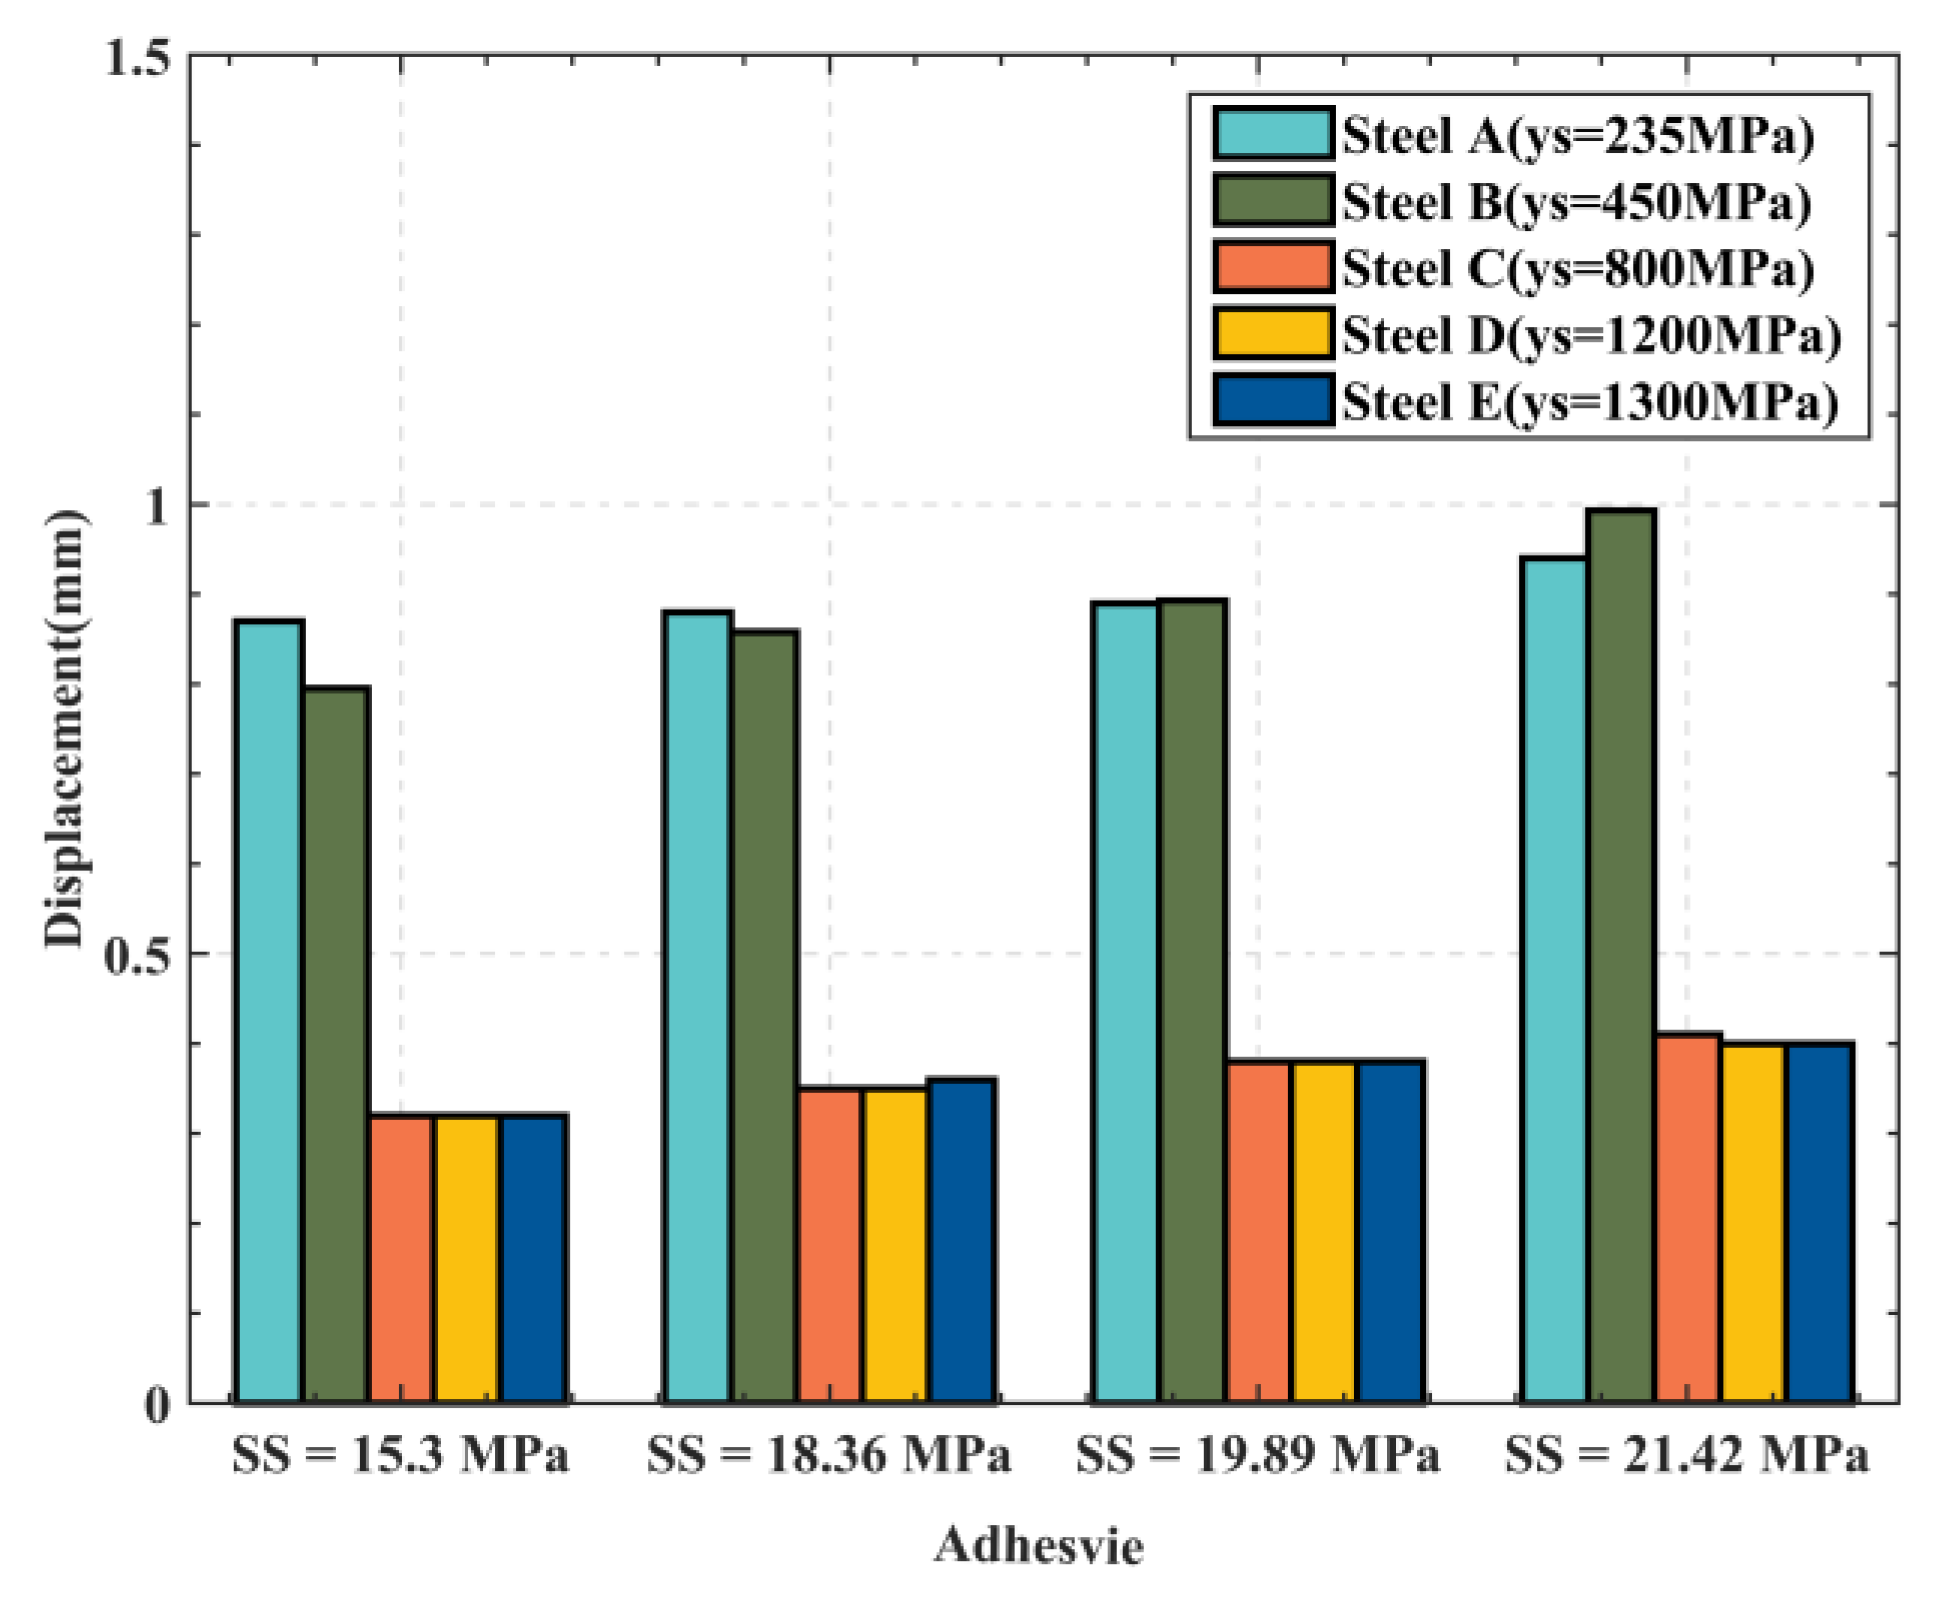
3.4.2. Different Adhesive Shear Strength
4. Discussion
4.1. Progressive Failure Behavior
4.2. Influence Parameter on Load-Bearing Capacity
5. Conclusions
- The finite element method based on the cohesive zone model can effectively simulate the mechanical behavior of the anchorage system under axial loading. The load–displacement curve obtained from the numerical simulation has similar growth trends compared with the experimental result.
- Further investigation of the load–displacement curve of the anchorage system under axial load leads to the conclusion that the failure behavior of flexible pipe end fittings significantly depends on the material selection of the anchorage system, with two and three stages.
- Two-stage failure behavior is common in end fittings consisting of high-strength tensile armor steel wire, which is characterized by no plastic deformation in the steel wire, only a linear bonding, and debonding stage, in the load–displacement curve. Interfacial debonding is the predominant failure mode; hence, increasing the interfacial shear strength of the epoxy resin adhesive can significantly enhance the load-bearing capacity of the structure.
- Three-stage failure behavior is common in end fittings consisting of low-strength tensile armor wire, which is characterized by the obvious plastic deformation of the wire and three stages of the load–displacement curve: elastic bonding stage, debonding stage, and the final failure stage. Steel wire failure is the dominant failure mode rather than interface debonding. Improving the yield strength of the wire can effectively increase the structural load-bearing capacity; however, increasing the interface shear strength of the epoxy resin adhesive has little or no effect on the failure load but can increase the failure displacement.
Author Contributions
Funding
Institutional Review Board Statement
Informed Consent Statement
Data Availability Statement
Acknowledgments
Conflicts of Interest
References
- Bruschi, R.; Vitali, L.; Marchionni, L.; Parrella, A.; Mancini, A. Pipe technology and installation equipment for frontier deep water projects. Ocean Eng. 2015, 108, 369–392. [Google Scholar] [CrossRef]
- API. Recommended Practice for Flexible Pipe, 5th ed.; American Petroleum Institute: Washington, DC, USA, 2014. [Google Scholar]
- Xiong, H.; Bai, Y.; Fang, Q.; Tang, G. Analysis on the ultimate bearing capacity of plastic pipe reinforced by cross-helically winding steel wires under internal pressure. Ships Offshore Struc. 2018, 13, 264–272. [Google Scholar] [CrossRef]
- Campello, G.C.; de Sousa, J.R.M.; Vardaro, E. An Analytical Approach to Predict the Fatigue Life of Flexible Pipes Inside End Fittings. In Proceedings of the Offshore Technology Conference, Houston, TX, USA, 2–5 May 2016. [Google Scholar]
- Troels, V.L.; Egil, G.; Steen, K.; Kristian, G.; Anders, L.; Christian, B. Tension-bending analysis of flexible pipe by a repeated unit cell finite element model. Mar. Struct. 2019, 64, 401–420. [Google Scholar]
- Lu, H.; Murilo, A.V.; Marcelo, C. Alternative analytical and finite element models for unbonded flexible pipes under axisymmetric loads. Ocean Eng. 2021, 225, 108766. [Google Scholar] [CrossRef]
- Yue, Q.; Lu, Q.; Yan, J.; Zheng, J.; Palmer, A. Tension behavior prediction of flexible pipelines in shallow water. Ocean Eng. 2013, 58, 201–207. [Google Scholar] [CrossRef]
- Dong, L.; Zhang, Q.; Huang, Y.; Liu, G. Slip and stress of tensile armors in unbonded flexible pipes close to end fitting considering an exponentially decaying curvature distribution. Mar. Struct. 2017, 51, 110–133. [Google Scholar] [CrossRef]
- Dong, L.; Zhang, Q.; Huang, Y.; Liu, G.; Li, Z. End Fitting Effect on Stress Evaluation of Tensile Armor Tendons in Unbonded Flexible Pipes Under Axial Tension. J. Offshore Mech. Arct. 2018, 140, 51701. [Google Scholar] [CrossRef]
- Shen, Y.; Ma, F.; Tan, Z.; Sheldrake, T. Development of the End Fitting Tensile Wires Fatigue Analysis Model: Sample Tests and Validation in an Unbonded Flexible Pipe. In Proceedings of the Offshore Technology Conference, Houston, TX, USA, 5–8 May 2008. [Google Scholar]
- Xavier, F. Avaliação da Vida em Fadiga de um Novo Modelo de Terminal Conector para Dutos Flexíveis. Ph.D. Thesis, Universidade Federal do Rio Grande do Sul, Porto Alegre, Brazil, 2009. (In Brazilian Portuguese). [Google Scholar]
- Daflon, M.B. Estudo de Aderência de Arames de Armadura de Tração em Conectores de Dutos Flexíveis. Master’s Thesis, Universidade do Estado do Rio de Janeiro, Rio de Janeiro, Brazil, 2010. (In Brazilian Portuguese). [Google Scholar]
- Bueno, A.F.B. De Tração de Riser Fleixível Durante Ensaios Axiais de Tração E Fadiga, Avaliação Das Armaduras. Master’s Thesis, Universidade Federal do Rio Grande do Sul, Porto Alegre, Brazil, 2010. (In Brazilian Portuguese). [Google Scholar]
- de Sousa, J.R.M.; Campello, G.C.; Bertoni, F.; Ellwanger, G.B. A FE Model to Predict the Stress Concentration Factors in the Tensile Armor Wires of Flexible Pipes Inside End Fittings. In Proceedings of the ASME 2013 32nd International Conference on Ocean, Offshore and Arctic Engineering, Nantes, France, 9–14 June 2013. [Google Scholar]
- Campello, G.; Bertoni, F.; de Sousa, J.R.M.; Carpigiani, M.; Vardaro, E.; Mudry, G. A Novel Concept of Flexible Pipe End Fitting: Tensile Armor Foldless Assembly. In Proceedings of the ASME 2012 31st International Conference on Ocean, Offshore and Arctic Engineering, Rio de Janeiro, Rio de Janeiro, Brazil, 1–6 July 2012. [Google Scholar]
- CAMPELLO, G.C. Metodologia de Projeto para o Sistema de Ancoragem de Conectores de Dutos Flexíveis e Proposição de Nova Tecnologia. Ph.D. Thesis, Universidade Federal do Rio de Janeiro, Rio de Janeiro, Brazil, 2014. (In Brazilian Portuguese). [Google Scholar]
- Anastasiadis, P.S.; Theotokoglou, E.E.; Michailides, C. Numerical analysis of stress concentration factors on tensile armour wires inside the end-fitting of an axially tensed unbonded flexible pipe. J. Struct. Integr. Maint. 2020, 5, 72–86. [Google Scholar] [CrossRef]
- Miyazaki, M.N.R. Stress Analysis of a Flexible Pipe Tensile Armor Wire during and after the End-Fitting Mounting. Ph.D. Thesis, Universidade Federal do Rio de Janeiro, Rio de Janeiro, Brazil, 2015. [Google Scholar]
- Miyazaki, M.N.R.; de Sousa, J.R.M.; Ellwanger, G.B.; Da Silva, V.R. A Three-Dimensional FE Approach for the Fatigue Analysis of Flexible Pipes Tensile Armors Inside End Fittings. In Proceedings of the ASME 2020 39th International Conference on Ocean, Offshore and Arctic Engineering, Online, 3–7 August 2020. [Google Scholar]
- Torres, R.N.; Tanaka, R.L.; Morini, R.G.; Otte Filho, O.O.; Vilela, T. Flexible Pipe Anchoring System: Resin Ratio Effects on Mechanical Properties. In Proceedings of the ASME 2015 34th International Conference on Ocean, Offshore and Arctic Engineering, St. John’s, NL, Canada, 31 May–5 June 2015. [Google Scholar]
- Mattedi, R.P. A Toughened Composite for Improving the Anchoring of Composite Tensile Armors of Flexible Risers. Ph.D. Thesis, Universidade Federal do Rio de Janeiro, Rio de Janeiro, Brazil, 2019. [Google Scholar]
- D4896-2001(2016); Standard Guide for Use of Adhesive-Bonded Single Lap-Joint Specimen Test Results. American Society for Testing and Materials: West Conshohocken, PA, USA, 2016.
- Campilho, R.D.S.G.; Banea, M.D.; Neto, J.A.B.P.; da Silva, L.F.M. Modelling of Single-Lap Joints Using Cohesive Zone Models: Effect of the Cohesive Parameters on the Output of the Simulations. J. Adhes. 2012, 88, 513–533. [Google Scholar] [CrossRef]
- Liu, X.; Jiang, J.; Wang, G.; Wang, J.; Xu, R. Debonding analysis of curved RC beams externally bonded with FRP plates using CZM. Eng Struct. 2020, 205, 110103. [Google Scholar] [CrossRef]
- Senthil, K.; Arockiarajan, A.; Palaninathan, R. Numerical study on the onset of initiation of debond growth in adhesively bonded composite joints. Int. J. Adhes. Adhes. 2018, 84, 202–219. [Google Scholar] [CrossRef]
- ABAQUS. ABAQUS User’s Manual; Dssault Systems; ABAQUS: Paris, France, 2020. [Google Scholar]
- Shang, D. Investigation on Adhesion of Unbonded Flexible Pipe End Fitting. Master’s Thesis, Dalian University of Technology, Dalian, China, 2015. (In Chinese). [Google Scholar]


| Stiffness (MPa) | Strength (MPa) | Separation Energy (N/mm) | |||
|---|---|---|---|---|---|
| Elastic | Shear | normal | Tangential | I-crack | II-crack |
| 1850 | 560 | 18.36 | 15.3 | 0.5041 | 0.7915 |
| Material | Young’s Modulus (GPa) | Yield Strength (MPa) | Ultimate Strength (MPa) |
|---|---|---|---|
| Steel A | 210 | 235 | 400 |
| Steel B | 210 | 450 | 560 |
| Steel C | 210 | 800 | 950 |
| Steel D | 210 | 1200 | 1350 |
| Material | Interface Shear Strength (MPa) |
|---|---|
| Adhesive A | 15.3 |
| Adhesive B | 18.36 |
| Adhesive C | 19.89 |
| Adhesive D | 21.42 |
Disclaimer/Publisher’s Note: The statements, opinions and data contained in all publications are solely those of the individual author(s) and contributor(s) and not of MDPI and/or the editor(s). MDPI and/or the editor(s) disclaim responsibility for any injury to people or property resulting from any ideas, methods, instructions or products referred to in the content. |
© 2023 by the authors. Licensee MDPI, Basel, Switzerland. This article is an open access article distributed under the terms and conditions of the Creative Commons Attribution (CC BY) license (https://creativecommons.org/licenses/by/4.0/).
Share and Cite
Zhang, T.; Lu, Q.; Yan, J.; Wang, S.; Yue, Q.; Wu, S.; Lu, H.; Chen, J. Numerical Study on Flexible Pipe End Fitting Progressive Failure Behavior Based on Cohesive Zone Model. J. Mar. Sci. Eng. 2023, 11, 116. https://doi.org/10.3390/jmse11010116
Zhang T, Lu Q, Yan J, Wang S, Yue Q, Wu S, Lu H, Chen J. Numerical Study on Flexible Pipe End Fitting Progressive Failure Behavior Based on Cohesive Zone Model. Journal of Marine Science and Engineering. 2023; 11(1):116. https://doi.org/10.3390/jmse11010116
Chicago/Turabian StyleZhang, Tao, Qingzhen Lu, Jun Yan, Shichao Wang, Qianjin Yue, Shanghua Wu, Hailong Lu, and Jinlong Chen. 2023. "Numerical Study on Flexible Pipe End Fitting Progressive Failure Behavior Based on Cohesive Zone Model" Journal of Marine Science and Engineering 11, no. 1: 116. https://doi.org/10.3390/jmse11010116
APA StyleZhang, T., Lu, Q., Yan, J., Wang, S., Yue, Q., Wu, S., Lu, H., & Chen, J. (2023). Numerical Study on Flexible Pipe End Fitting Progressive Failure Behavior Based on Cohesive Zone Model. Journal of Marine Science and Engineering, 11(1), 116. https://doi.org/10.3390/jmse11010116